Embed Size (px)
Citation preview

United States Department of Agriculture
Forest Service
Pacific Northwest Research Station
Research Paper PNW-RP-428 September 1990
t
EDITORS FILE COPY I
Lumber Recovery From Dead Ponderosa Pine in the Colorado Front Range Susan Willits, Richard O. Woodfin, Jr., and Thomas A. Snellgrove
. . . . . . : . . . . . . .
, . . . . • . . ' . ' . : ,
- . . . .
4 4 ~ . . . .

Authors SUSAN WILLITS is a research forest products technologist, Pacific Northwest Research Station, Forestry Sciences Laboratory, P.O. Box 3890, Portland, Oregon, 97208-3890. RICHARD O. WOODFIN, JR., is the assistant station director for research planning and applications, Pacific Northwest Research Station, P.O. Box 3890, Portland, Oregon, 97208-3890. THOMAS A. SNELLGROVE is a biological scientist, Resources Program and Assessment Staff, P.O. Box 96090, Washington, DC 20090-6090. Woodfin and Snellgrove were research forest products technologists when the research was done.

Abstract Willits, Susan; Woodfin, Richard O., Jr.; Snellgrove, Thomas A. 1990. Lumber recovery from dead ponderosa pine in the Colorado Front Range. Res. Pap. PNW- RP-428. Portland, OR: U.S. Department of Agriculture, Forest Service, Pacific Northwest Research Station. 14 p.
Lumber recovery information from live and beetle-killed ponderosa pine (Pinus pon- derosa Dougl. ex Laws) in the Colorado Front Range is presented. No significant difference in lumber volume was found among the samples. Significant differences were found in lumber value among the live, 1-year-dead, and 3- to 5-year-dead samples. About 10 percent of the value was lost in the first year after death, primarily because of blue stain. Checks and splits, wood borers, and rot caused additional loss in subsequent years.
Keywords: Lumber recovery, ponderosa pine, Pinus ponderosa, Colorado Front Range, beetle-killed pine, blue stain.
Summary Standing dead timber in the Colorado Front Range was left by an epidemic of the mountain pine beetle in the mid-1970s. Trees were sampled to evaluate the losses in lumber volume and value recovery as time since death increased. A live control and four classes of dead ponderosa pine trees were sampled. The timber was sawn into lumber, primarily 1-inch boards (93 percent). No statistically significant differences were found in volume recovery among the live and four classes of dead. Lumber volume recovery in cubic feet and board feet is presented.
Significant differences in lumber value were found and ultimately the logs were reclas- sified into three classes based on these differences. The final classes were live, dead less than 2 years, and dead 3 to 5 years. The value loss was about 10 percent in the first 2 years and 17 percent for trees dead 3 to 5 years. Value loss was caused pri- marily by blue stain, which lowered the lumber grade to 3 Common or 4 Common. Average board width also decreased because of increased checking as time since death increased.
Early detection of beetle epidemics and immediate use of the timber resource before the trees start to show signs of mortality will result in little or no value loss. After the first year, the sapwood had blue stain and the lumber grade had declined. Trees dead more than 2 years produced no high-quality lumber and were affected by blue stain, checking, rbt, and wood borers.

Contents 1
1
2
2
3
3
4
5
5
6
6
6
6
7
10
13
13
Introduction
Objectives
Methods
Timber Sample
Harvesting and Log Identification
Scaling
Mill Equipment and Processing
Analysis
Mortality Classes
Volume Recovery
Lumber Grade Recovery
Results and Discussion
Mortality Classes
Volume Recovery
Lumber Value Recovery
Use
Literature Citations

Introduction
Objectives
Ponderosa pine (Pinus ponderosa Dougl. ex Laws.) represents about 17 percent of the commercial sawtimber in the Rocky Mountain area (USDA Forest Service 1982). In the mid-1970s, the mountain pine beetle (Dendroctonusponderosa Hopkins) deci- mated stands of ponderosa pine in the Front Range of the Colorado Rocky Moun- tains. The epidemic is estimated to have killed over 30 million board feet of timber in Colorado in areas considered accessible. 1 An estimated 1.5 million ponderosa pine trees were killed each year by the beetle in the mid-1970s. 2 There were large losses in esthetic value as well as in timber value from the beetle attack.
Current timber sale practices encourage rapid use of dead timber. Information on the volume and value losses of timber that has been dead for 1 or 2 years is a crucial part of determining which timber is to be salvaged and how it can be used economically.
Research was proposed to determine the potential for producing lumber products to encourage use of the dead material and to improve the appearance of timber stands. Information in this report is from a product recovery study conducted in 1977 at Fort Collins, Colorado, in cooperation with the Rocky Mountain Region of the USDA Forest Service.
The objectives of this paper are to (1) estimate lumber volume and value recovery for live and four classes of dead logs, (2) compare the estimates to determine which if any classes could be combined, (3) report lumber recovery by lumber grade for the combined classes, and (4) determine the loss in product value associated with stain and insect borer damage.
I U.S. Department of Agriculture, Forest Service. 1976. Increasing your lumber recovery through sawmill improve- ment. Western Forest Insects Issue Study Surnmaries-- unpublished. On file with: Timber Quality Research Project, Forestry Sciences Laboratory, Pacific Northwest Research Station, P.O. Box 3890, Portland, OR 97208-3890.
2 Worth, H.E. 1976. Suitability of beetie-killed pine in Colorado's Front Range for wood and fiber products. Fort Collins, CO: U.S. Department of Agriculture, Forest Service, Rocky Mountain Forest and Range Experiment Station. Study plan 4251-14. On file with: Timber Quality Research Project, Fores W Sciences Laboratory, Pacific Northwest Research Station, P.O. Box 3890, Portland, OR 97208-3890.
Methods
Timber Sample
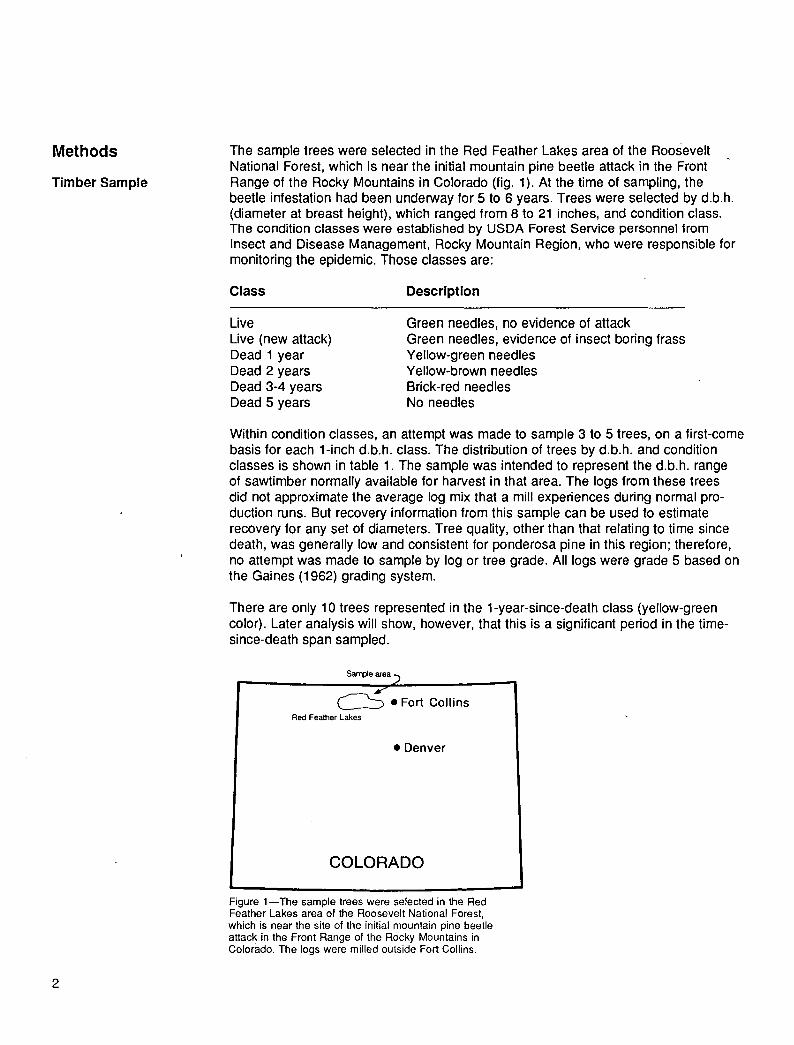
The sample trees were selected in the Red Feather Lakes area of the Roosevelt National Forest, which is near the initial mountain pine beetle attack in the Front Range of the Rocky Mountains in Colorado (fig. 1). At the time of sampling, the beetle infestation had been underway for 5 to 6 years. Trees were selected by d.b.h. (diameter at breast height), which ranged from 8 to 21 inches, and condition class. The condition classes were established by USDA Forest Service personnel from Insect and Disease Management, Rocky Mountain Region, who were responsible for monitoring the epidemic. Those classes are:
Class Description
Live Live (new attack) Dead 1 year Dead 2 years Dead 3-4 years Dead 5 years
Green needles, no evidence of attack Green needles, evidence of insect boring frass Yellow-green needles Yellow-brown needles Brick-red needles No needles
Within condition classes, an attempt was made to sample 3 to 5 trees, on a first-come basis for each 1-inch d.b.h, class. The distribution of trees by d.b.h, and condition classes is shown in table 1. The sample was intended to represent the d.b.h, range of sawtimber normally available for harvest in that area. The logs from these trees did not approximate the average log mix that a mill experiences during normal pro- duction runs. But recovery information from this sample can be used to estimate recovery for any set of diameters. Tree quality, other than that relating to time since death, was generally low and consistent for ponderosa pine in this region; therefore, no attempt was made to sample by log or tree grade. All logs were grade 5 based on the Gaines (1962) grading system.
There are only 10 trees represented in the 1-year-since-death class (yellow-green color). Later analysis will show, however, that this is a significant period in the time- since-death span sampled.
Sample area=t ~
( ~ ' • Fort Collins Red Feather Lakes
• D e n v e r
C O L O R A D O
Figure 1--The sample trees were selected in the Red Feather Lakes area of the Roosevelt National Forest, which is near the site of the initial mountain pine beetle attack in the Front Range of the Rocky Mountains in Colorado. The logs were milled outside Fort Collins.

Harvesting and Log Identification
Scaling
Table 1--Sample distribution by d.b.h, and condition class
Dead L i v e
D.b.h. a Live (new attack) 1 year 2 years 3-4 years 5 years
I n c h e s . . . . . . . . . . . . . . . . . . N u m b e r o f t r e e s . . . . . . . . . . . . . . . . . . . .
8 2 0 0 3 1 0 9 8 2 0 6 7 6 10 9 1 0 9 7 2 11 9 2 1 9 3 5 12 5 2 0 7 7 8 13 5 1 1 8 7 7 14 8 3 0 7 4 5 15 11 3 1 8 7 4 16 12 1 1 7 3 6 17 8 1 3 6 6 5 18 12 0 0 1 4 2 19 8 1 1 1 2 1 20 8 0 1 0 1 3 21 4 0 0 4 1 0
Total 109 17 9 76 60 54
a 8-inch class includes trees 8.0 to 8.9 inches.
The following information was recorded for each sample tree during the selection process: tree d.b.h, and height, foliage color, and estimated percentage of needles retained, bark retention as a percentage of bole length, presence or absence of stain or wood borers, and width and straightness of seasoning checks.
Trees were felled and bucked according to normal industry practice. Most trees pro- duced only one woods-length log, and these logs typically ranged from 24 to 44 feet long. When two segments were bucked from the same tree, the butt log was gener- ally 33 feet. Each log was identified by tree number and position of the log within the tree; diameters and lengths of logs and breaks were recorded.
Woods-length logs were rolled out in the mill yard and scaled by USDA Forest Serv- ice check scalers using Scribner Decimal C segment scale rules with a 20-foot maxi- mum length (USDA Forest Service 1973). After the logs were bucked into sawmill lengths, they were rescaled according to Scribner rules. The average log scale defect for live timber was 12 percent based on woods-length logs, and the most common defects were rot and sweep. There were 98 cull logs in the study that are not in- cluded in this paper; most were culled because of rot and check, and they were distributed across all classes.
3

Mill Equipment and Processing
Because of the inaccuracy of the Scribner scaling rules when applied to logs from dead trees (Snellgrove and Cahil11980), cubic log volumes also were estimated. Because most trees produced only one woods-length log, these logs usually ex- tended from the stump into the-top portion of the live crown. They can have the con- cave shape of the butt, the convex shape of the midstem, and the conic shape of the top within a single log. Plank and Cahill (1984) discuss problems associated with estimating cubic volume from this type of log. To avoid problems in volume computa- tion, recovery was based on the gross cubic volume of mill-length logs. The Bruce formula (Bruce 1970) was used for butt logs and the Smalian formula was used for all other logs.
The mill had two processing centers that received logs of different sizes. Logs less than 8 inches in diameter were bucked to 8 feet in length and were sawn in the circu- lar saw scragg mill. Products sawn were 2 by 4 studs and 1 by 4 boards. Other logs were sawn in the band mill where equipment after the debarker included a double-cut band headsaw, gang edger, edger, and a gang trim saw. Production from the band mill was primarily 1-inch lumber.
Average kerf widths were estimated to be 0.190 inch for saws in the band mill and 0.340 inch for saws in the scragg mill. Average rough-green lumber sizes are shown in the following tabulation:
Nominal size Average rough green size
Inches
Thickness: 1 inch 30/32 2 inches 1-26/32
Width: 4 inches 4-1/8 6 inches 6-3/16 8 inches 8-1/8 10 inches 10-1/16 12 inches 12-3/16
A system of paint colors and numbers was used in the mill to relate each board to the appropriate log and tree. Each log was sawn to recover the maximum value consistent with the products the mill normally produced. The lumber was air dried and then graded under the supervision of a Western Wood Products Association (WWPA) inspector according to WWPA grading rules (Western Wood Products Association 1977).
Although lumber items were separated into 12 grades during the study, for this paper we combined these grades into five groups (table 2). Lumber prices are expressed as dollars per thousand board feet of surfaced dry lumber ($/MBF) and were provided by the cooperating mill. Because of the limited production of Moulding and Selects at this mill, all the higher grades of lumber were sold as 2 and Better Common. All widths of lumber within a grade were priced the same.
4

Table 2--Lumber grade groups, lumber grades, lumber volume for live sample, and prices used in this report
Lumber volume Grade group Lumber grade (live sample) Price
Percent $/MBF
Moulding and Better
2 and Better Common
C and Better Select 0.8 320 D select 1.5 320 Moulding 2.8 320
1 and 2 Common 8.8 320
3 Common 3 Common 38.3 170 Standard and Better 3.3 210 Stud 1.2 175
4 Common
5 Common
4 Common 34.8 120 Utility .5 210
5 Common 5.5 90 Economy .1 210 Economy stud 2.5 75
Analysis
Mortality Classes
The analysis was designed to (1) determine a suitable model for predicting lumber volume and value recovery, and (2) compare the recovery to determine which, if any, classes could be combined. These classes would then be used for presentation of the recovery data. The analysis was based on mill-length logs because it was the best estimate of log volume.
Two dependent variables were used to analyze mortality classes; cubic recovery percent (CR%) and dollars per thousand board feet of lumber tally ($/MLT). Cubic recovery percent, which is the ratio of cubic feet (CF) of lumber produced per CF of gross log volume, was used for estimating volume recovery; $/MLT, which is the average Value of the lumber produced from a given log, was used for analyzing the quality of the lumber.
Experience indicates that small-end log diameter (D) and transformations of D pro- vide simple and reliable estimates for lumber volume and value recovery (Darr and Fahey 1973, Snellgrove and Cahill 1980). Models tested included:
y = bo + b i D , y = bo + biD + b2-1/D, y bo + biD + b21/D + b31/D 2 , y = bo + b11/D, and y bo+b11/D 2.
Volume Recovery
Lumber Grade Recovery
Results a n d Discussion
Mortality Classes
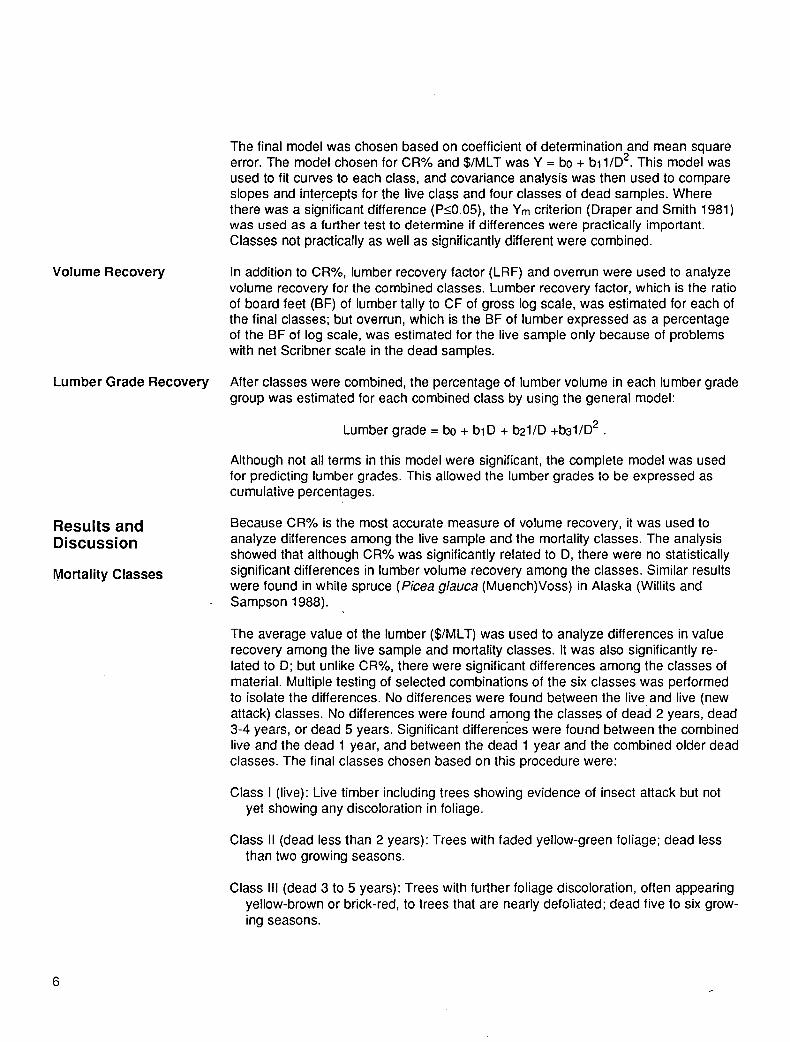
The final model was chosen based on coefficient of determination and mean square error. The model chosen for CR% and $/MLT was Y = bo + b11/D 2. This model was used to fit curves to each class, and covariance analysis was then used to compare slopes and intercepts for the live class and four classes of dead samples. Where there was a significant difference (P<0.05), the Ym criterion (Draper and Smith 1981) was used as a further test to determine if differences were practically important. Classes not practically as well as significantly different were combined.
In addition to CR%, lumber recovery factor (LRF) and overrun were used to analyze volume recovery for the combined classes. Lumber recovery factor, which is the ratio of board feet (BF) of lumber tally to CF of gross log scale, was estimated for each of the final classes; but overrun, which is the BF of lumber expressed as a percentage of the BF of log scale, was estimated for the live sample only because of problems with net Scribner scale in the dead samples.
After classes were combined, the percentage of lumber volume in each lumber grade group was estimated for each combined class by using the general model:
Lumber grade = bo + biD + b21/D +b31/D 2 .
Although not all terms in this model were significant, the complete model was used for predicting lumber grades. This allowed the lumber grades to be expressed as cumulative percentages.
Because CR% is the most accurate measure of volume recovery, it was used to analyze differences among the live sample and the mortality classes. The analysis showed that although CR% was significantly related to D, there were no statistically significant differences in lumber volume recovery among the classes. Similar results were found in white spruce (Picea glauca (Muench)Voss) in Alaska (Willits and Sampson 1988).
The average value of the lumber ($/MLT) was used to analyze differences in value recovery among the live sample and mortality classes. It was also significantly re- lated to D; but unlike CR%, there were significant differences among the classes of material. Multiple testing of selected combinations of the six classes was performed to isolate the differences. No differences were found between the live and live (new attack) classes. No differences were found among the classes of dead 2 years, dead 3-4 years, or dead 5 years. Significant differences were found between the combined live and the dead 1 year, and between the dead 1 year and the combined older dead classes. The final classes chosen based on this procedure were:
Class I (live): Live timber including trees showing evidence of insect attack but not yet showing any discoloration in foliage.
Class II (dead less than 2 years): Trees with faded yellow-green foliage; dead less than two growing seasons.
Class III (dead 3 to 5 years): Trees with further foliage discoloration, often appearing yellow-brown or brick-red, to trees that are nearly defoliated; dead five to six grow- ing seasons.
6

Volume Recovery
Studies on dead white pine (Pinus monticola Dougl. ex D. Don) in Idaho (Snellgrove and Cahill 1980) and on tussock moth-killed grand fir (Abies grandis (Dougl. ex D. Don) Lindl.) in Oregon (Snellgrove and Fahey 1977) show similar results with regard to classes.
Cubic recovery percentqThe CR% of mill-length logs for surfaced-dry lumber, rough-green lumber, sawdust, and chips for the combined classes sums to 100 per- cent (fig. 2). The difference between surfaced-dry lumber and rough-green lumber is shrinkage and planer shavings. Chippable percentage is 100 minus rough-green lum- ber and sawdust. The CR% curve shows the expected pattern of low recovery for small logs, which increases sharply for intermediate size logs and levels off for larger logs. Mills are generally less efficient at converting small logs to lumber; therefore, a higher percentage of the log volume ends up as chips or hog fuel.
Although there was no difference in the CR% among the classes, there was an in- crease in the percentage of narrow boards. The percentage of boards 6 inches and narrower was 46 percent for class I logs and 58 percent for class III logs. This in- crease can probably be attributed to drying checks in trees, which cause splits in lumber. These splits can result in narrower or lower graded boards. Similar results were shown for dead western white pine (Snellgrove and Cahill 1980).
100
90
.~ 80 ¢-
70 OJ
60
> 50 0 0
0 "~ 3o
20
10
Chippable
~ ner shavings
0 4 8 12 16 20 24
Diameter (inches) Figure 2--Relation of cubic volume recovery to small-end diameter for all logs combined. Cubic recovery percent of surfaced-dry lumber increases as log size increases, while shrinkage and planer shavings and sawdust remain constant over diameter. Equations and statistics are given in table 3.

Table 3--Equations and statistics for regression estimates
Dependent Standard variable Equation r 2 error
Cubic recovery percent: Surfaced-dry lumber Rough-green lumber Rough-green lumber and sawdust
Lumber recovery factor
Overrun
$/MLTi Live Class II Class III
Percent volume by grade (cumulative): Live--
Moulding a 2 Common b 3 Common c 4 Common d 5 Common e
Class I I - - Moulding 2 Common 3 Common 4 Common
Class lll-- Moulding 2 Common 3 Common 4 Common
39.45 - 543.43 (1/D2) 0.28 8.4 55.31 729.55 (1/D ~) .26 11.9 67.32 804.05 (1/D 2) .22 14.7
12.39 - 0.20 (D) - 44.04 (1/D) .32 1.6
-273.55 + 9.32 (D) + 4912.7 (1/D) -15837.9 (1/D 2) .08 63.0
184 .4 - 2296.38 (1/D 2) 168.4 1516.54 (1/D,~) 155.7 1328.41 (1/D =)
.26 37.7
.26 30.4
.24 22.6
-94.7 - 1755.6 (1/D 2) + 4.14 (D) + 716.5 (1/D) .25 6.1 -89.9 2547.3 (1/D2o) + 4.05 (D) + 851.7 (1/D) .09 15.4 -33.7 + 5142.0 (1/1~ =) + 2.45 (D) + 1158.7 (1/D) .19 27.3 237.8 + 747.9 (1/D ~) - 5.20 (D) - 1020.0 (1/D) .32 23.5
None 172.0 + 3754.4 (1/02) - 5.64 (D) - 1465.4 (1/0) .09 13.8 -75.7 - 8354.3 (1/06)2+ 2.30 (D) + 1997.2 (1/0) .40 24.2 -117.8 - 8805.6 (1 /D) + 5.77 (D) + 2434.4 (1/D) .42 18.6
None None 10.2 - 3982 .0 (1/D2)o - 0.67 (D) + 880.2 (1/D) 375.0 + 3972.8 (1/D =) - 10.4 (D) - 2165.2 (1/D)
.07 27.9
.27 24.8
a Moulding and Better. b 2 Common and Moulding and Better. c 3 Common, 2 Common, and Moulding and Better. d4 Common, 3 Common, 2 Common, and Moulding and Better. e 100 percent - (4 Common + 3 Common + 2 Common + Moulding and Better).
Lumber recovery fac tor - -Lumber recovery factor is the ratio of BF of lumber tally to CF of gross log volume. It follows a pattern similar to CR%, by increasing sharply for the small-diameter logs and leveling off for the larger logs (fig. 3). Rough-green lum- ber sizes, saw kerf, and product mix all influence LRF. Increased recovery (higher LRF) from a given log mix can be realized through improved log bucking accuracy, reduced saw kerf, reduced rough-green lumber target size, and sawing larger logs (Fahey and Martin 1974, Woodfin 1978).

10
>
0 5 tO
4
E 3 , -J
2
+
+
+ + + +
+ + ~ t + . '
~ ~ ± + + ~ * +
i + +
i I - - i i i i ' - - i i r ~ r lr . . . . [ _ _ _ _
8 12 16 2 0 2 4
D i a m e t e r ( i n c h e s )
Figure 3--Estimated lumber recovery factor based on gross cubic volume, along with the data scatter, is shown for all logs combined. The relation of lumber recovery factor to log diameter is very similar to the relation of CR% of surfaced-dry lumber to log diameter. Equations and statistics are given in table 3.
4 0 0
c " QJ
P Q .
t -
Q~ >
C)
35o
3 O 0
2 5 O
2 0 O
150
I O 0
5O
0
+
+ +
+
+
+ +
+ +
+ + +
÷ + +
+
÷
+
+ + + +
t
+ +
+ +
+
+
t
z D z I z I l j6 I I 4 8 12 2 0
D i a m e t e r ( i n c h e s ) Figure 4 iOverrun, based on net Scribner scale, is shown for live logs only. Unlike CR% and LRF, overrun peaks for 7-inch logs because of logs scale and taper and then decreases as log diameter increases. The variation in the data is greatest in the small-diameter logs because of variation in taper rates and manufacturing. Equations and statistics are given in table 3.
i 2 4
OverruniOverrun is the common term used to describe the amount of lumber recov- ered that is in excess of the net log scale; it is expressed as a percentage of the net log scale. Unlike CR% and LRF, overrun peaks for 7-inch logs and then declines (fig. 4). This relation is typical of overrun and is caused by Scribner scale step func- tions and inaccuracies in estimating small-log volumes. Overrun is not shown for the dead classes of timber; the inaccuracy of the Scribner scaling rules when applied to logs from dead trees renders the net scale volume, and hence the overrun, meaning- less. Snellgrove and Cahill (1980) discuss the problem in detail.
9

Lumber Value Recovery
2O0
180
E 140
lo 12o t -
(/) 100
O ..C: 8O
~ 4O I
0
. _~ie._.m~..ie _ _ i_._m,.- i - - I L ive
~ _ ~ ~ D e a d 3 to S years
0 4 8 16 20 24
Diameter ( inches)
Figure 5--Dollars per thousand lumber tally ($/MLT) was used to determine the final mortality classes. Although no practical differences were found in logs less than 8 inches in diameter, significant differences were found among the larger logs. Because the lumber was not priced by width, the differences in $/MLT shown here are underestimating the real difference by 4 to 5 percent. Equa- tions and statistics are given in table 3.
Dollars per thousand lumber tally--Estimates of $/MLT were developed for the final three classes (fig. 5). Because of the variation in the data, no practical differ- ences in value were found in logs less than 8 inches in diameter. Logs larger than 8 inches in diameter have about the same difference (roughly 6 percent) in value between class I and class II, and between class II and class II1.
Because the lumber was priced by grade and not width, an additional source of value loss is not accounted for in figure 5. As discussed earlier, the checking in the dead timber resulted in a higher proportion of the lumber being manufactured into narrow boards. The price differential between a 1 by 4 and a 1 by 12 varies by lumber grade, but is estimated to be an increase of one-third to one-half in price. With a 12-percent increase in narrow boards for the class III sample, the decrease in value would be roughly 4 to 5 percent more than that shown in figure 5. The total loss in lumber value is therefore estimated to be 10 percent for class II and 17 percent for class III.
Lumber grade recovery--Recovery of lumber in each lumber grade can be used to help explain differences in $/MLT among mortality classes. The relation between grade recovery and diameter is similar for all classes (fig 6). The percentage of 5 Common decreases with increasing diameter, and the percentage of 3 Common and 4 Common increases as diameter increases to about 8 inches and then remains fairly constant. The large percentage of 4 Common produced in this study was indica- tive of the type of trees sawn--small-diameter, limby, low-grade trees--and the manu- facturing practices--air drying and poor stickering.
10

LIVE
t-- 02 P 02 0 .
02 10
t.. Cn
>,,
02
E "-'t
100
90
80
70
60
50
40
30
20
10
0
B.
~ g
2 Common
5 Common ~ ~ 4 Common
4 8 1 2 1 6 2 0 2 4
Diameter ( inches)
16O
DEAD 2 YEARS
9O
A 80
E 02
o 7o
6O 02 "I0
50
4O
02 E 3o
10
3 Common
Common
4 Common
i i i i i i i i i
8 1 2 16 2 0 2 4
Diameter ( inches)
12 16
C. 100
DEAD 3 TO 5 YEARS
90
02
03 7 0 Q.
02 6O
. a 4o
02
E "1 3O
10
0
4 C~nmon
3 Common
5Common "% )~
8
A.
r i
4 2 0 2 4
Diameter ( inches) Figure 6--Cumulative percent volume by lumber grade for each of the final classes are shown. A. Moulding and Better lumber was produced only from the live sample. Because only a small portion of the mill's production was Moulding and Better, it was sold, as 2 and Better Common. B. The percentage of 3 Common increased over the live sample because of blue stain. C. Because of heavy blue stain and checking, no 2 and Better Common was produced and there was a noticeable increase in 4 Common. Equations and statistics are given in table 3.

Lumber grade recovery was related not only to diameter but also to time since death. The highest grade of lumber, Moulding and Better, was produced only from the live sample. Class II logs produced less than 10 percent 2 and Better Common, and class Ill logs produced nothing better than 3 Common.
The change in grade recovery among mortality classes may be caused by several factors: blue stain, checking, borers, and rot. The first loss in potential product value that takes place with beetle infestations is from blue stain fungi. Harvey (1979) dis- cusses the rate of spread of blue stain fungi (mostly Ceratocystis spp.) in beetle- killed Iodgepole pine (Pinus contorta Dougl. ex Loud.). He notes that discoloration appears during the first month of attack and the wood volume affected is low. By the time tree mortality is clearly evident, nearly 100 percent of the sapwood is stained. Blue stain in lumber does not automatically mean the lumber will be degraded. Heavy stain eliminates lumber from 2 Common and better grades, but has no effect on lower grades of Common lumber. It also has no effect on the lumber grade of dimension or studs (Western Wood Products Association 1977).
The loss in lumber grade because of blue stain was determined in this study by having the lumber inspector dual-grade stained boards. This involved grading each board as it lay with stain a defect and then regrading with stain considered as no defect.
Figure 7 shows the average percentage volume by grade for boards graded with stain and ignoring stain for the final classes. Almost all the boards that were 2 and Better Common or Moulding and Better when stain was ignored were downgraded to 3 Common when stain was considered. There was also a slight increase in the per- centage of 4 Common, but no change in the percentage of 5 Common. This shows that even in small-diameter low-grade ponderosa pine, stain caused a significant loss in lumber value and that most of the degrade occurred in the first year after death.
Wood borers and rot had a minor impact on the lumber value and grade recovery of the class III timber. The biggest impact of these defects is on the higher lumber grades; 2 Common allows only scattered pin holes, but 3 Common allows up to 30 holes per square foot of lumber.
12

Use
Literature Citations
100
90
80
70
60
50
40
30
20
10
0
Live
E m 0 >
E o
Q.
Stain No stain
Dead < 2 years
l Stain No stain
Dead 3 to 5 years
L u m b e r g r a d e
Moulding
L;£2~ 2 Common
3 Common
[ ~ 4 Common
5 C o ~ and dimension
MORTALITY CLASS Figure 7 - -To evaluate the effects of blue stain on lumber grade, all the lumber was dual graded: once when stain was al lowed in the boards and once when no stain was al lowed on the board. There were no stained boards in the live sample; it is included for comparison only. The blue-stained boards from trees dead for 2 years dropped from 2 Common and Moulding and Better into 3 Common. The blue- stained boards from the trees dead from 3 to 5 years dropped into both 3 Com- mon and 4 Common.
Understanding potential volume and value losses associated with dead timber is a necessary part of effective use of our timber resource. Other publications show average value losses in 1-year-dead material ranging from 16 percent in white pine (Snellgrove and Cahill 1980) to 28 percent in ponderosa pine (Fahey 1980). Log size and grade are important factors to consider when a degrade percentage is selected. The logs in this study were small-diameter grade 5 logs and had a 10-percent loss in value in the first year after death. This shows that even in low-grade stands, early detection and salvage of beetle-killed timber is essential to maintaining the value of lumber products.
&
Bruce, David. 1970. Estimating volume of Douglas-fir butt logs. Res. Note PNW-117. Portland, OR: U.S. Department of Agriculture, Forest Service, Pacific Northwest Forest and Range Experiment Station. 5 p.
Darr, David R.; Fahey, Thomas D. 1973. Value for small diameter stumpage affected by product prices, processing equipment, and volume measurements. Res. Pap. PNW-158. Portland, OR: U.S. Department of Agriculture, Forest Service, Pacific Northwest Forest and Range Experiment Station. 16 p.
Draper, Norman R.; Smith, Harry. 1981. Applied regression analysis. 2d ed. New York: John Wiley and Sons. 709 p.
Fahey, Thomas D. 1980. Beetle-killed pine can be salvaged, but for how long? Forest Industries. 107(5): 60-61.
13

Fahey, Thomas D.; Martin, D.C. 1974. Lumber recovery from second-growth Douglas-fir. Res. Pap. PNW-177. Portland, OR: U.S. Department of Agriculture, Forest Service, Pacific Northwest Forest and Range Experiment Station. 20 p.
Gaines, Edward M. 1962. Improved system for grading ponderosa pine and sugar pine saw logs in trees. Tech. Pap. 75. Berkeley, CA: U.S Department of Agricul- ture, Forest Service, Pacific Southwest Forest and Range Experiment Station. 21 p.
Harvey, Robert D., Jr. 1979. Rate of spread of blue stain fungi in mountain pine beetle-killed Iodgepole pine in northeastern Oregon U.S.A. Canadian Journal of Forest Research. 9(3): 323-326.
Plank, Marlin E.; Cahill, James M. 1984. Estimating cubic volume of small diam- eter tree-length logs from ponderosa and Iodgepole pine. Res. Note PNW-417. Portland, OR: U.S. Department of Agriculture, Forest Service, Pacific Northwest Forest and Range Experiment Station. 7 p.
Snellgrove, Thomas A.; Fahey, Thomas D. 1977. Market values and problems associated with utilization of dead timber. Forest Products Journal. 27(10): 74-79.
Snellgrove, Thomas A.; Cahill, James M. 1980. Dead western white pine charac- teristics, product recovery and problems associated with utilization. Res. Pap. PNW-270. Portland, OR: U:S. Department of Agriculture, Forest Service, Pacific Northwest Forest and Range Experiment Station. 63 p.
U.S. Department of Agriculture, Forest Service. 1973. National Forest log scaling handbook. FSH 2409.11. Washington, DC. 184 p.
U.S. Department of Agriculture, Forest Service. 1982. An analysis of the timber situation in the United States 1952-2030. Forest Service Report No. 23. [Washing- ton, D.C.] 499 p.
Western Wood Products Association. 1977. Standard grading rules for western lumber. Portland, OR. 202 p.
Willits, Susan; Sampson, George. 1988. Effects of a forest fire on lumber recovery from white spruce in interior Alaska. Forest Products Journal. 38(11/12): 80-84.
Woodfin, Richard O., Jr. 1978. Ponderosa pine lumber recovery--young growth in northern California. Res. Pap. PNW-237. Portland, OR: U.S. Department of Agricul- ture, Forest Service, Pacific Northwest Forest and Range Experiment Station. 13 p.
14 GP0 791-171/20050

Willlts, Susan; Woodfln, Richard O., Jr.; Snellgrove, Thomas A. 1990. Lumber recovery from dead ponderosa pine in the Colorado Front Range. Res. Pap. PNW- RP-428. Portland, OR: U.S. Department of Agriculture, Forest Service, Pacific North- west Research Station. 14 p.
Lumber recovery information from live and beetle-killed ponderosa pine (Pinus ponderosa Dougl. ex Laws) in the Colorado Front Range is presented. No significant difference in lumber volume was found among the samples. Significant differences were found in lum- ber value among the live, 1-year-dead, and 3- to 5-year-dead samples. About 10 percent of the value was lost in the first year after death, primarily because of blue stain. Checks and splits, wood borers, and rot caused additional loss in subsequent years.
Keywords: Lumber recovery, ponderosa pine, Pinus ponderosa, Colorado Front Range, beetle-killed pine, blue stain.
The Forest Service of the U.S. Department of Agriculture is dedicated to the principle of multiple use management of the Nation's forest resources for sustained yields of wood, water, forage, wildlife, and recreation. Through forestry research, cooperation with the States and private forest owners, and management of the National Forests and National Grasslands, it strives - - as directed by Congress - - to provide increasingly greater service to a growing Nation.
The U.S. Department of Agriculture is an Equal Opportunity Employer. Applicants for all Department programs will be given equal consideration without regard to age, race, color, sex, religion, or national origin.
Pacific Northwest Research Station 319 S.W. Pine St. P.O. Box 3890 Portland, Oregon 97208-3890

. , , , .
U.S. Department of Agriculture Pacific Northwest Research Station 319 S.W. Pine Street P.O. Box 3890 Portland, Oregon 97208
BULK RATE POSTAGE + FEES PAID USDA-FS
PERMIT NO. G-40
Official Business Penalty for Private Use, $300
do NOT detach label