Embed Size (px)
Citation preview

Luis Conceição1
Ivar Rønnestad2
Texto livreA DYNAMIC MODEL FOR DIETARY
AMINO ACIDS UTILISATION IN FISH LARVAE
1 CCMAR
IN FISH LARVAE
CCMARCentro de Ciências do Mar, Campus de Gambelas, 8005-139 Faro, Portugal
2 UiB2 UiBUniversity of Bergen,
Department of Biology,
N-5020 Bergen, Norway

Background
Improvement of growth performance in fish larviculturep g p
Determination of dietary AA requirements
understanding AA metabolism

Background
Tracer studies :
=> Better understanding of amino acid metabolismg
but interpretation limited to the comparison of a number of body compartments in a few time points, and relative (not absolute) numbersabsolute) numbers
100,0
40,0
60,0
80,0
,
% tr
acer
inta
keCO2
Body
Gut
0,0
20,0
1 h 3 h 6 h 24 h
Time after meal
Water

Background
Modelling
• holistic approach to integrate knowledge on growth and metabolism
• identify most important processes and gaps in knowledge• identify most important processes and gaps in knowledge
Dynamic model => simulate metabolism and/or growth in timeDynamic model > simulate metabolism and/or growth in time
Mechanistic model => processes are defined based on the underlying p y gbiochemistry & model parameters have (as much as possible) a biological meaning

Objectives
Develop a dynamic mechanistic model that simulates AA t b li f fi h lmetabolism of fish larvae.
Assist in the interpretation of results obtained using tracer studiesAssist in the interpretation of results obtained using tracer studies.
Improve the understanding of larval digestion and absorption of dietary AA, and the postprandial AA metabolism and growth.

Data set to model
Senegalese sole fed one meal of 14C-labelled Artemia
1 3 6 24h i b ti1, 3, 6 or 24h incubation
0 70,80,91H+ (Retention in
tissues)
12 DAH
00,10,20,30,40,50,60,7
14CO2(C t b li )
14C-AA
Air
0.5 M KOHIncubation water
Drawing: Sigurd Tonheim & Ivar Rønnestad
(Evacuation)
(Catabolism)
(20-30 min.)
Morais et al. (2004)
Drawing: Sigurd Tonheim & Ivar Rønnestad

Data set to model
Senegalese sole fed one meal of 14C-labelled Artemia
100
60
80
ntak
e
CO2
Body
40
60
% tr
acer
in Body
Gut
0
20
1 h 3 h 6 h 24 h
Water
Morais et al. (2004)
Time after meal

Model Description

Model Description
40 ng/h
1.22 ug38 ug
g
Example of equations:Gut wall protein synthesis = KsGut * Excess FAA in gut + Basal KsGut wall protein synthesis = KsGut Excess FAA in gut + Basal KsGut wall AA catabolism = KcatGut * Excess FAA in gut + Basal AA cat
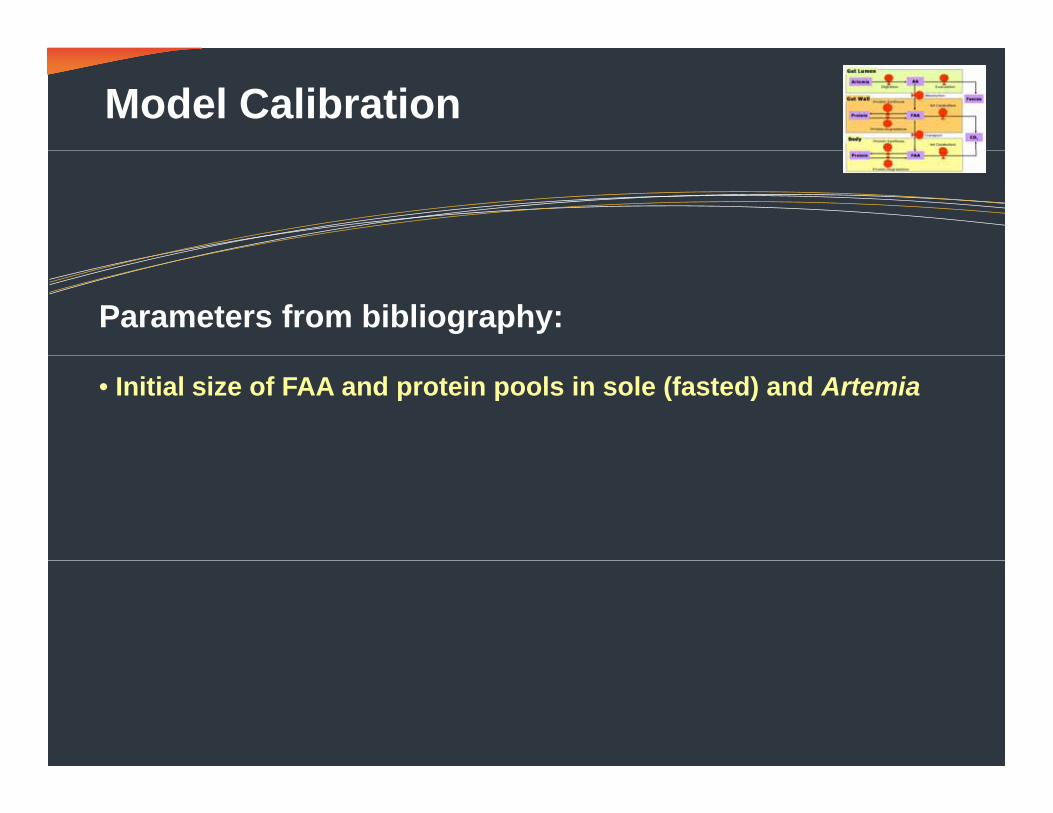
Model Calibration
Parameters from bibliography:
• Initial size of FAA and protein pools in sole (fasted) and Artemia

Model Calibration
Data from Morais et al (2004):
80
100
e
CO2
40
60
acer
inta
k
Body
20
40
% tr
a
Gut
Water0
1 h 3 h 6 h 24 h
Time after meal

Model Calibration
Parameters to be calibrated with model:
Parameter UnitBasal AA Catabolism rate ng/hD l t f Di ti iDelay onset of Digestion minRate of Digestion & absorption min-1
Gut AA catabolism rate min-1Gut AA catabolism rate minGut Protein Synthesis rate min-1
No of Artemia fed nProtein degradation rate ng/h

Model Calibration Using Powersim Studio 7
Lines are simulated values
Points (and shaded area) are mean values (and 95% (confidence intervals) from Morais et al. (2004)

Model Calibration Using Powersim Studio 7
Lines are simulated values
Points (and shaded area) are mean values (and 95% (confidence intervals) from Morais et al. (2004)

Model Calibration Using Powersim Studio 7

Model Calibration
Parameters calibrated with model:P t U it M CV(%)Parameter Unit Mean CV(%)Basal AA Catabolism rate ng/h 502.6 18.6Delay onset of Digestion min 0 032 3 3Delay onset of Digestion min 0.032 3.3Rate of Digestion & absorption min-1 0.539 3.9Gut AA catabolism rate min-1 0.010 8.1Gut Protein Synthesis rate min-1 0.161 2.0No of Artemia fed n 15.0 1.1P t i d d ti t /h 25 5 0 7
Using Powersim Studio 7After about 9 million iterationsProtein degradation rate ng/h 25.5 0.7

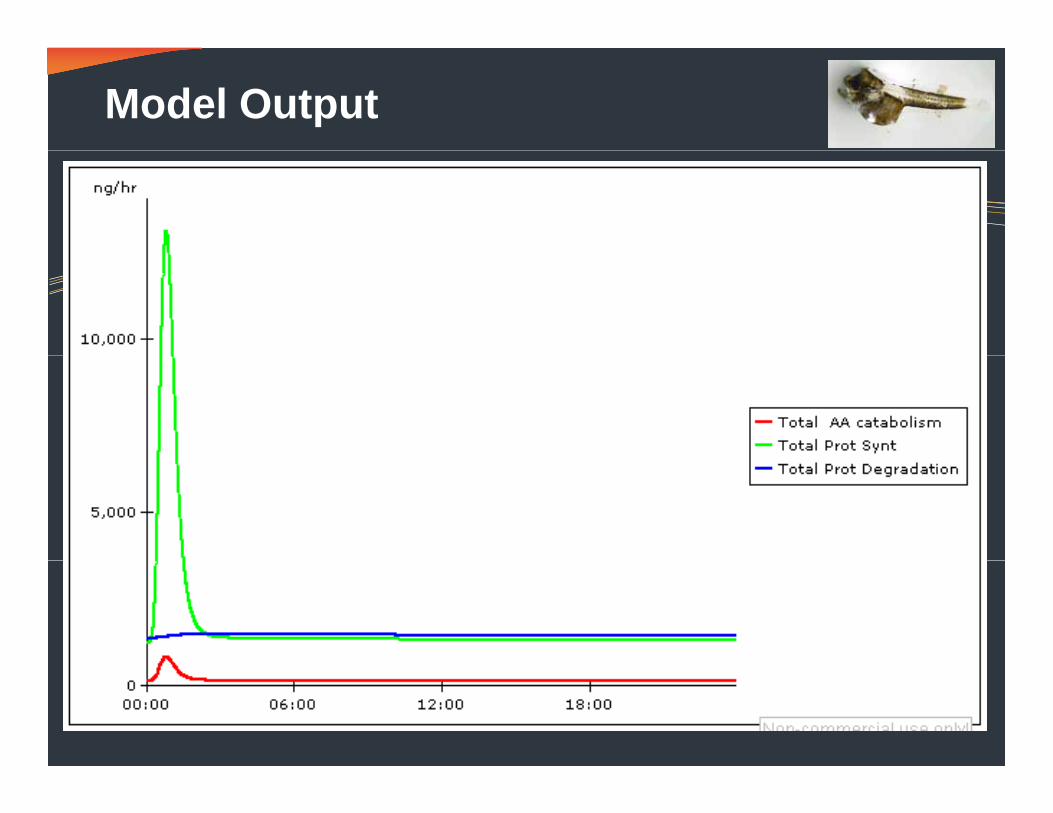
Model Output

Model Output

Conclusions
Food has a major contribution to the FAA pool composition - Rates of protein synthesis and AA Catabolism show a major increase after p y jthe meal
Peak for this postprandial metabolism occurs only 1 hour after the meal and the rates returning to “basal” values 3 hours after themeal, and the rates returning to basal values 3 hours after the meal.
This suggests a rapid handling of Artemia protein by larvae, and t th d f f di l l t hi h f (supports the need for feeding sole larvae at a high frequency (every
3-4 hours) in order to fully use its growth potential.
Model Mechanistic nature => can be used with different AA tracers, ,and also for other fish species.

Future work
Model several meals / days of feeding
M d l ff t f f l ti f diModel effects of few meals vs. continous feeding
Test (validate) with different experiments / ages / species
Simulate metabolism of individual AA
=> estimation of requirements> b tt d t di f AA=> better understanding of AA
Integrate AA metabolism with energetics and growth=> better understanding of growth process=> better understanding of growth process=> defining feeding strategies=> growth predictions

Thank you!!

Model Output
Model Output