Embed Size (px)
Citation preview

LTRNMS 3002 Network Compliance and Network and Application Monitoring with Prime Infrastructure 3.0
LTRNMS-3002 Network Compliance and
Network and Application Monitoring with Prime Infrastructure 3.0
Getting Started with the lab .................................................................................. 2 Lab Topology ...................................................................................................................................................... 2 Connection to the lab ...................................................................................................................................... 3 Create your environment .............................................................................................................................. 3 Populating device Inventory ........................................................................................................................ 4 Using a VCenter as discovery Source....................................................................................................... 6 Creating Device group .................................................................................................................................... 9 Endpoint Subnet association .................................................................................................................... 10 Prepare a new Overview dashboard ..................................................................................................... 11
Part 1 : Compliance ............................................................................................. 12 Exercise 1: Enabling Compliance ............................................................................................................ 12 Exercise 2: EOX/PSIRT Report: ............................................................................................................... 13 Exercise 3: Using predefined Compliance Policies .......................................................................... 15 Exercise 4: Creation of a simple user defined policy ...................................................................... 20 Exercise 5: Creation of a user defined policy with configuration block and simple regex ............................................................................................................................................................................... 31 Exercise 6: Creation of a user defined policy using “command output” scope .................... 39 Exercise 7: Creation of a user defined policy testing multiple instances of a command . 47
Part 2 : Device Monitoring .................................................................................. 59 Exercise 1: Out of the box Devices monitoring .................................................................................. 59 Exercise 2: Customizing device monitoring ....................................................................................... 65 Exercise 3: Monitoring UCS servers ....................................................................................................... 70
Part 3: Application Monitoring ............................................................................ 71 Exercise 1: Using NAM as a datasource. ............................................................................................... 71 Exercise 2: AVC Readiness Assessment on router ........................................................................... 73 Exercise 3: AVC profiles .............................................................................................................................. 73 Exercise 4: Interface configuration ........................................................................................................ 76
Deploy a QoS profile .......................................................................................................................................... 77 Deploy an AVC profile ...................................................................................................................................... 78
Exercise 5: Device Data Sources ............................................................................................................. 81 Exercise 6: QoS and AVC monitoring on interfaces ......................................................................... 82 Exercise 7: Monitoring application with Service Assurance and Application Performance Dashboard......................................................................................................................................................... 85 Exercise 7: Customize your Dashboard ................................................................................................ 88

LTRNMS 3002 Network Compliance and Network and Application Monitoring with Prime Infrastructure 3.0
Getting started with the lab
Lab Topology
The lab infrastructure deployment is shown below.
2 student groups see the same POD devices. However students in East group will modify only the East devices (SW-PODx-E, RTR-PODx-E) and Students in West group will modify only the West devices (SW-PODx-W, RTR-PODx-W . Some devices (readonly) are shared. Each student group has its own Prime Infrastructure 3.0 and its own NAM 6.2. Below are the addresses of important elements of the pods
POD East Device type Name IP address Credentials Switch SW-PODx-E 10.14.20x.1 Router RTR-PODx-E 10.14.20x.3 Prime Infrastructure PI-PODx-E 192.168.40.5x root/Public123
LTRNMS 3002 Network Compliance and Network and Application Monitoring with Prime Infrastructure 3.0
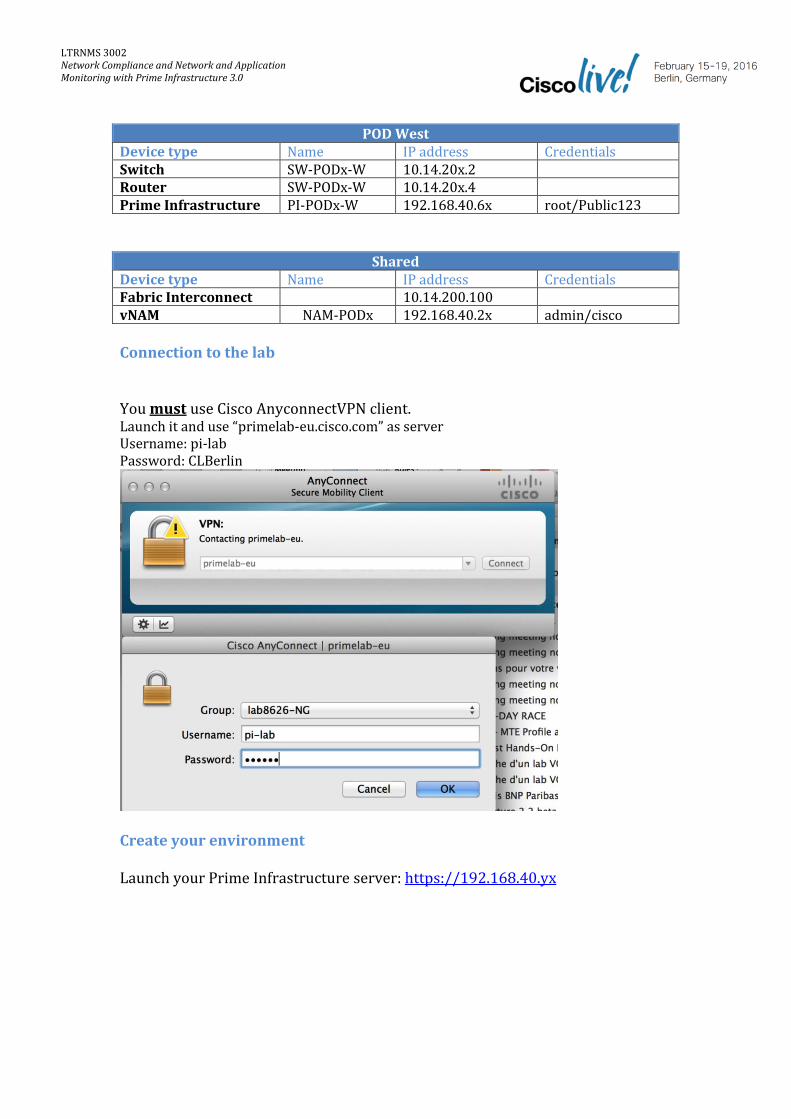
POD West Device type Name IP address Credentials Switch SW-PODx-W 10.14.20x.2 Router SW-PODx-W 10.14.20x.4 Prime Infrastructure PI-PODx-W 192.168.40.6x root/Public123
Shared Device type Name IP address Credentials Fabric Interconnect 10.14.200.100 vNAM NAM-PODx 192.168.40.2x admin/cisco
Connection to the lab
You must use Cisco AnyconnectVPN client. Launch it and use “primelab-eu.cisco.com” as server Username: pi-lab Password: CLBerlin
Create your environment
Launch your Prime Infrastructure server: https://192.168.40.yx

LTRNMS 3002 Network Compliance and Network and Application Monitoring with Prime Infrastructure 3.0
Connect using Username: root Password: Public123 Select Dashboard/Network Summary/Overview
Populating device Inventory
There are 3 ways to populate the inventory:
adding a single device doing a bulk import configuring an automatic device discovery
In this section you will do a bulk import

LTRNMS 3002 Network Compliance and Network and Application Monitoring with Prime Infrastructure 3.0
Go to Inventory/Device Management/Network Devices Select Bulk Import
Select the file called podx.csv where x is your pod number (East and West will use the same file).
Click Import. You can check the status of the job in Administration/Dashboards/ Job Dashboard
After a couple of minutes, due to synchronization, you should see your devices managed in Inventory/Device Management/Network Devices

LTRNMS 3002 Network Compliance and Network and Application Monitoring with Prime Infrastructure 3.0
Using a vCenter as discovery source
From Inventory/Device Management/Compute Devices, Select Cisco UCS Server and click on the Fabric Interconnect
Click Schematic and expand as much as you can. You should be able to see the Chassis and the Blades

LTRNMS 3002 Network Compliance and Network and Application Monitoring with Prime Infrastructure 3.0
To have more information on the ESX DataCenter environment, you will add now the ESX vCenter. This will give you the visibility on the datacenters, clusters, hosts and VMs. Select Inventory/Compute Devices
Select Discovery Sources
Add device
Add the vCenter:

LTRNMS 3002 Network Compliance and Network and Application Monitoring with Prime Infrastructure 3.0
IP: 192.168.40.40 Port: 443 Username: cl16 Password: LTRNMS3002
After a few seconds, the discovery source becomes synchronized
You can see the DataCenters, cluster, hosts and VMs. Explore .

LTRNMS 3002 Network Compliance and Network and Application Monitoring with Prime Infrastructure 3.0
To monitor resources on servers and VMs, select Datacenter and click Start Monitoring.
(Note: it is possible to be more specific, and to monitor only specific hosts or specific VMs.)
Creating Device group
You will create 2 device groups (location groups) called East and West, respectively for East devices and for West Devices. You will use them later. Select Inventory/Group Management/Network Device Groups

LTRNMS 3002 Network Compliance and Network and Application Monitoring with Prime Infrastructure 3.0
Click + , to add a group
Create a location group called East, using the “location” attribute and the condition “contains East”
Do the same for West location group
Endpoint association
In your network, most of the endpoints from East use IP addresses 10.21.*.* and most of the endpoints from West use IP addresses 10.22.*.*

LTRNMS 3002 Network Compliance and Network and Application Monitoring with Prime Infrastructure 3.0
For monitoring purpose, it’s important to associate these endpoints subnets to the appropriate locations. Select Services/Application Visibility & Control/Endpoint Association (Note for the remaining of the guide we will use AV&C for Application Visibility and Control) Select +
Associate the 10.21.*.* subnets to East
Save Associate the 10.22.*.* subnets to West
Prepare a new Overview dashboard
You will create below, an empty dashboard that you will use later in the lab Select Dashboard/Overview/General On upper right corner, click settings, then “Add New Dashboards”.

LTRNMS 3002 Network Compliance and Network and Application Monitoring with Prime Infrastructure 3.0
Give a name: CL16-PODx-East (or West).
Click on the Dashboard Tab. You have an Empty Overview Dashboard
Select the configure icon in upper right corner, and click “Set Current Page As Home”
Now each time you will click on , you will jump to this dashboard
Part 1: Compliance
Exercise 1: Enabling Compliance

LTRNMS 3002 Network Compliance and Network and Application Monitoring with Prime Infrastructure 3.0
Objective: Learn how to enable the compliance feature By default Compliance is disabled, but it should have been previously enabled on your system. In the exercise you will just verify that it’s the case, (and enable it if needed). Verify that you have the Compliance entries, under Configuration/Compliance
If not, select Administration/Settings/System Settings/General/Server Select Compliance Service / Enable. Click Save and do a login/logout
Exercise 2: EOX/PSIRT Report:
Objective: Know how to activate EOX and PSIRT analysis Before visualizing a PSIRT of EOX report, you must first activate it. Select Reports/PSIRT and EOX

LTRNMS 3002 Network Compliance and Network and Application Monitoring with Prime Infrastructure 3.0
As you can see, there is no data available
Click Schedule Job You can click also View Job Details to see the status of the Job
Don’t wait … it takes time. You will see the result later … Do Exercise 3 and come back here after. If you select Hardware EOX, you should see 2 devices with EOX announcements

LTRNMS 3002 Network Compliance and Network and Application Monitoring with Prime Infrastructure 3.0
Click on to see the EOL announcement. (Internet Access is needed)
Exercise 3: Auditing using predefined Compliance Policies
Objective: In this exercise you will use an existing compliance policy to verify the compliance of the passwords with security rules. The policy will test the encryption, the encryption level and the password length. You will learn:
- How to create a Compliance Profile using Predefined Compliance Policies - How to create an audit job to execute this Compliance Profile - How to visualize the Audit Report generated by the execution of the
previous job Select Configuration/Compliance/Profiles

LTRNMS 3002 Network Compliance and Network and Application Monitoring with Prime Infrastructure 3.0
Select + to add a new profile
Give a name to this Profile
Click + Add, to Add Compliance Policies
In “Audit and Management” folder, select User Passwords

LTRNMS 3002 Network Compliance and Network and Application Monitoring with Prime Infrastructure 3.0
Keep only the first 5 rules (it will be enough to have violations!!)
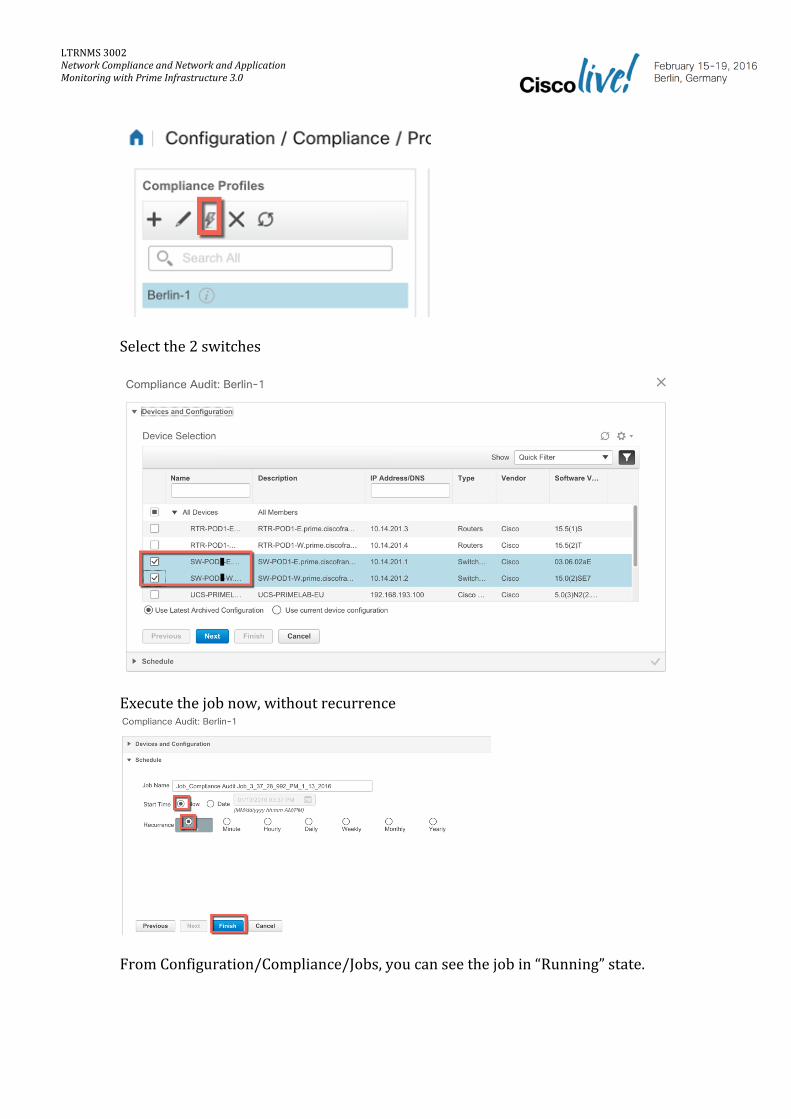
Click Save You have created the profile. Click the execute icon (see below)
LTRNMS 3002 Network Compliance and Network and Application Monitoring with Prime Infrastructure 3.0
Select the 2 switches
Execute the job now, without recurrence
From Configuration/Compliance/Jobs, you can see the job in “Running” state.
LTRNMS 3002 Network Compliance and Network and Application Monitoring with Prime Infrastructure 3.0
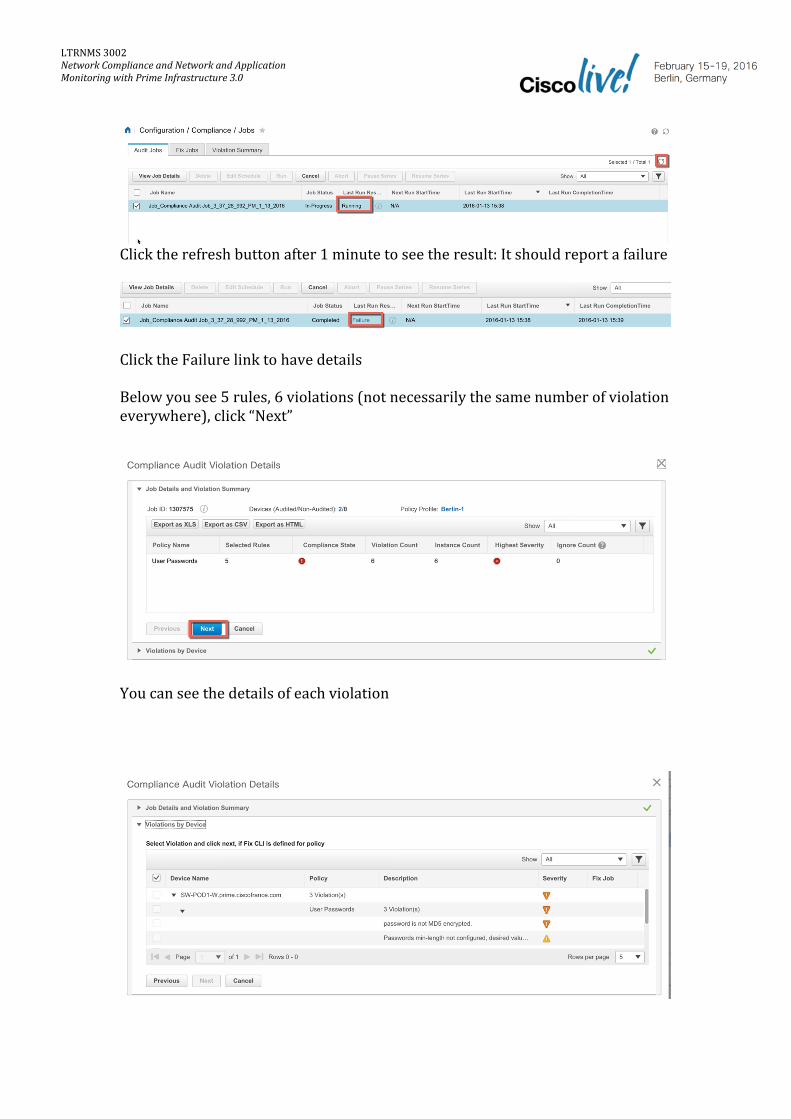
Click the refresh button after 1 minute to see the result: It should report a failure
Click the Failure link to have details Below you see 5 rules, 6 violations (not necessarily the same number of violation everywhere), click “Next”
You can see the details of each violation

LTRNMS 3002 Network Compliance and Network and Application Monitoring with Prime Infrastructure 3.0
Click previous and select “Export as HTML”
Visualize the report
Exercise 4: Creation of a simple user defined policy
Objective: In this exercise, you will create a simple policy to verify that the system clock has been configured with both timezone and summer-timezone. You will verify that timestamps have been also properly configured on syslog and debug messages. The compliance will test the existence of the commands:
o clock timezone <timezone> … o clock summer-time <summer-timezone> recurring … o service timestamps debug datetime localtime show-timezone o service timestamps log datetime localtime show-timezone
<timezone> and <summer-timezone> will be passed as parameters (Rule Inputs).
LTRNMS 3002 Network Compliance and Network and Application Monitoring with Prime Infrastructure 3.0
You will learn:
- How to create a policy - How to add rules in a policy - How to add rule inputs to rules - How to define condition and actions in a rule
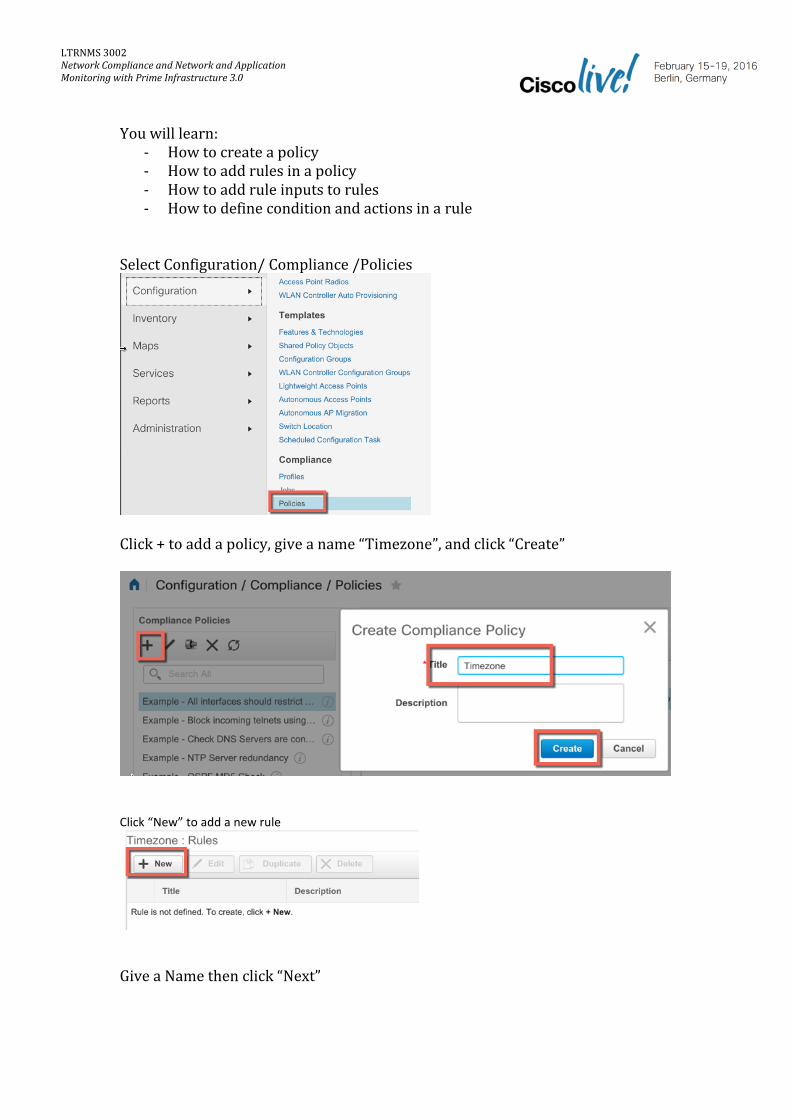
Select Configuration/ Compliance /Policies
Click + to add a policy, give a name “Timezone”, and click “Create”
Click “New” to add a new rule
Give a Name then click “Next”

LTRNMS 3002 Network Compliance and Network and Application Monitoring with Prime Infrastructure 3.0
Select IOS and IOS-XE then click “Next”
Click “New” , to create the first parameter (Rule Input) Provide:
- the name of the parameter: timezone - click generate to generate the Identifier of the parameter (you will use the
parameter by its Identifier ) - Select the Scope: Execution. This means that the parameter is for auditing,
the other possible scope is fix, when the parameter is only used to fix the CLI
- Select: Input Required - Give a Default value: CET, stands for Central Europe Time

LTRNMS 3002 Network Compliance and Network and Application Monitoring with Prime Infrastructure 3.0
Create a second “rule input” called Summer-timezone
Remark: when you generate a parameter – are converted to _ , _ is also added to the beginning of the parameter. Default value is CEST for Central Europe Summer Time You have now two parameters, click Next

LTRNMS 3002 Network Compliance and Network and Application Monitoring with Prime Infrastructure 3.0
You will add now the condition and actions The condition will check if the configuration contains the string:
o clock timezone <_timezone>
Where _timezone is the identifier of the rule input
Define the scope: Configuration
Define the “Condition Match Criteria”

LTRNMS 3002 Network Compliance and Network and Application Monitoring with Prime Infrastructure 3.0
Define now the actions you want to take in case of match/no match If the condition matches, “Continue”, means test the next condition
If condition doesn’t match, “Raise a Violation and Continue” (to the next condition) Customize the severity and the violation message.

LTRNMS 3002 Network Compliance and Network and Application Monitoring with Prime Infrastructure 3.0
Click ok: the condition is created. Click new to add the second condition to test the summer-timezone.
Condition: (See below the input rule syntax <_summer_time>)

LTRNMS 3002 Network Compliance and Network and Application Monitoring with Prime Infrastructure 3.0
Actions:
Matches: continue Does not Match: Raise a Violation and Continue
Click OK to save and add a new condition to verify the “debug” timestamp configuration
With the actions
- Matches: Continue - Does not Match : Raise a violation and Continue
LTRNMS 3002 Network Compliance and Network and Application Monitoring with Prime Infrastructure 3.0
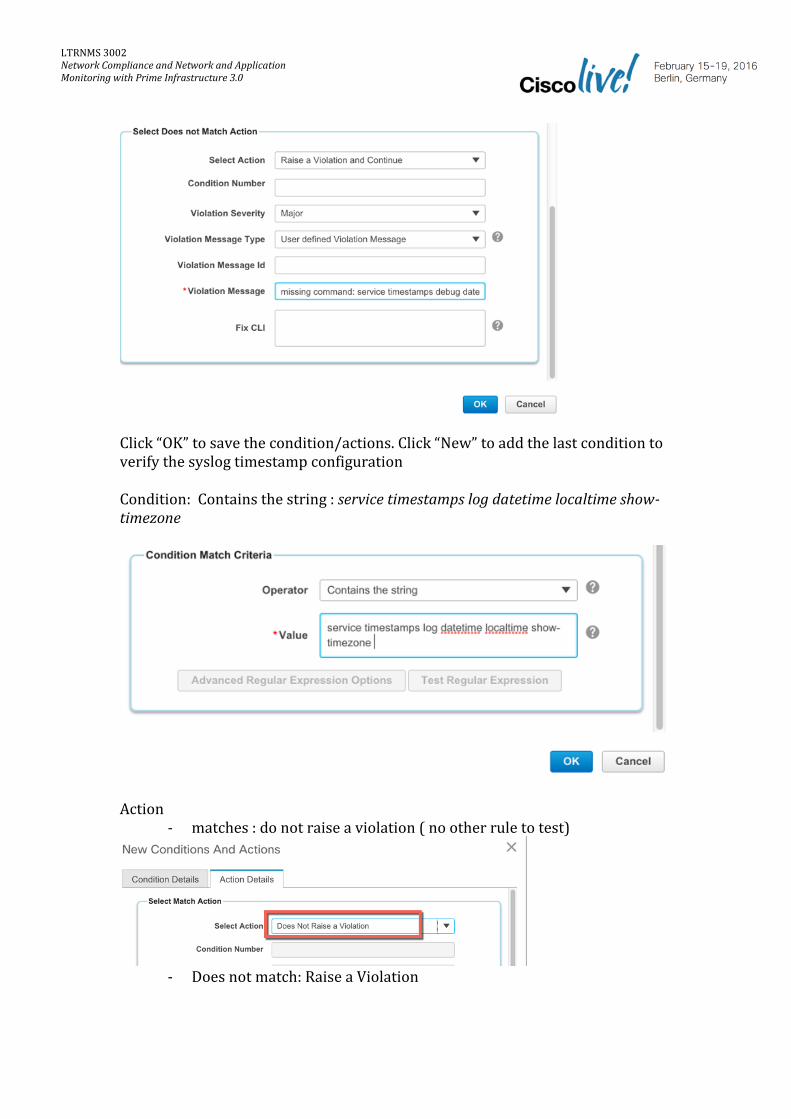
Click “OK” to save the condition/actions. Click “New” to add the last condition to verify the syslog timestamp configuration Condition: Contains the string : service timestamps log datetime localtime show-timezone
Action
- matches : do not raise a violation ( no other rule to test)
- Does not match: Raise a Violation

LTRNMS 3002 Network Compliance and Network and Application Monitoring with Prime Infrastructure 3.0
Click ok to save the condition You have 4 conditions/Actions in the rule. Click Create to save the Rule
The rule is created, as well as the policy
Now you will create a Profile (as you did in previous exercise) to use this policy.

LTRNMS 3002 Network Compliance and Network and Application Monitoring with Prime Infrastructure 3.0
Select Configuration/Compliance/Profile, + and give a name
Click “Add”, to add a policy and check your policy in the user defined policies folder
Keep the default value for the Rule Inputs: CET for the timezone and CEST for the summer-timezone
Execute the profile
LTRNMS 3002 Network Compliance and Network and Application Monitoring with Prime Infrastructure 3.0
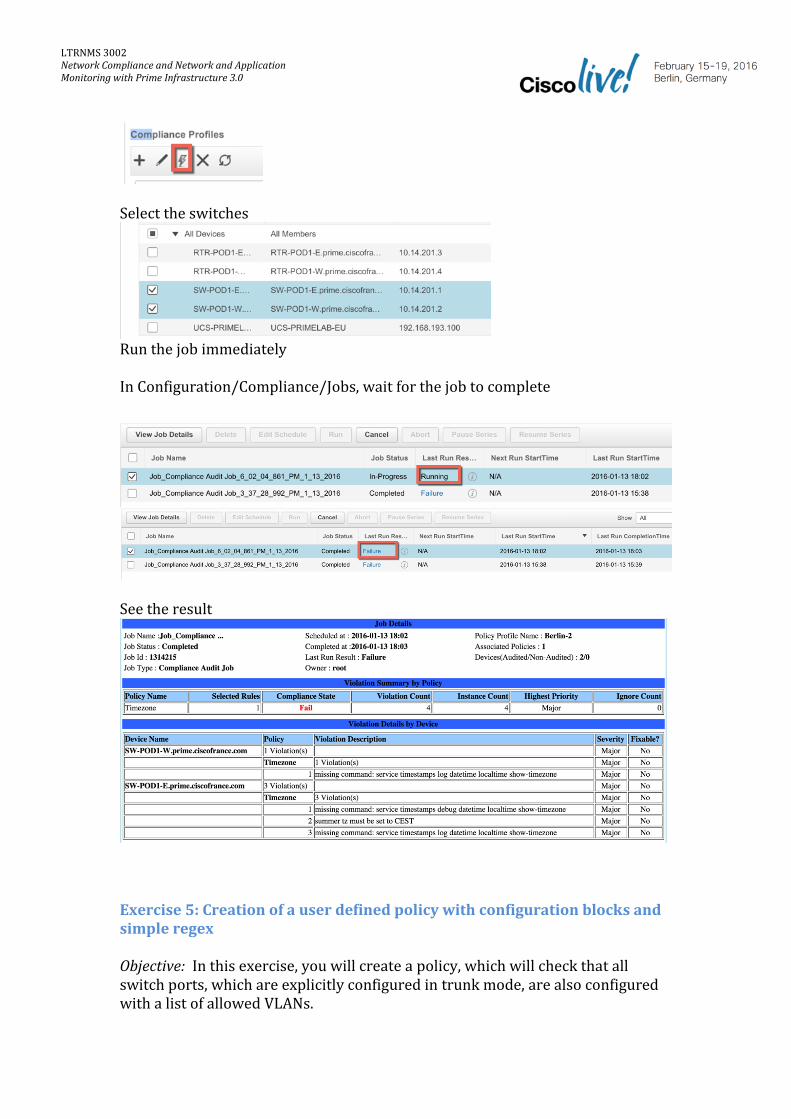
Select the switches
Run the job immediately In Configuration/Compliance/Jobs, wait for the job to complete
See the result
Exercise 5: Creation of a user defined policy with configuration blocks and simple regex
Objective: In this exercise, you will create a policy, which will check that all switch ports, which are explicitly configured in trunk mode, are also configured with a list of allowed VLANs.

LTRNMS 3002 Network Compliance and Network and Application Monitoring with Prime Infrastructure 3.0
You will learn:
- how to parse a configuration per blocks, as you need to test for each interface .
- how to use regex (very basic here) and how to capture a matching group
The rule will contain 3 conditions Condition/Action 1: Find “Interface block”
Scope: Configuration Parse as blocks: Yes. Define block start : ^interface.* , ^=> start with, .=> any character * => any number of times Condition: match the regex: interface (.*) => the parenthesis will allow to capture the interface name . The id will be <1.1>, 1: Condition 1, 1: first captured parameter Match Action: Continue Doesn’t match Action: Do not Raise a violation
Condition/Action 2: Is it a trunk ? Scope: Previously matched block. We want to stay in the block interface Condition: match the string: “switchport mode trunk” Match Action: Continue Doesn’t match Action: Do not Raise a violation
Condition/Action 3: are allowed vlan configured?
Scope: Previously matched block. We want to stay in the block interface Condition: match the string: “switchport trunk allowed vlan ” Match Action: Do not raise a violation Doesn’t match Action: Raise a violation: message “misconfigured trunk on <1.1> …”. <1.1> refers to the interface name captured on condition1!
Select Configuration/ Compliance /Policies

LTRNMS 3002 Network Compliance and Network and Application Monitoring with Prime Infrastructure 3.0
Click + to add a policy, give a name “trunk”, and click “Create”
Click “New “to add a new rule
Give a Name then click “Next”
Select IOS and IOS-XE then click “Next”

LTRNMS 3002 Network Compliance and Network and Application Monitoring with Prime Infrastructure 3.0
Skip the rule input In condition and actions, click “+New” to add the first condition
Condition/Action 1: Find “Interface block”
Scope: Configuration
Parse as blocks: Yes. Define block start: ^interface.*, ^=> starts with, .=> any character * => any number of times

LTRNMS 3002 Network Compliance and Network and Application Monitoring with Prime Infrastructure 3.0
Condition: match the regex: interface (.*) => the parenthesis will allow to capture the interface name. The id will be <1.1>, 1: Condition 1, 1: first captured parameter
Match Action: Continue
Doesn’t match action: Do not Raise a violation
Click OK and add a second condition Condition/Action 2: Is it a trunk ?
Scope: Previously matched block . We want to stay in the block interface
Condition: match the string: “switchport mode trunk”
Match Action: Continue

LTRNMS 3002 Network Compliance and Network and Application Monitoring with Prime Infrastructure 3.0
Doesn’t match Action: Do not Raise a violation
Click OK and add the last condition Condition/Action 3: are allowed vlan configured?
Scope: Previously matched block . We want to stay in the block interface
Condition: match the string: “switchport trunk allowed vlan ”
Match Action: Do not raise a violation
Doesn’t match Action: Raise a violation: message “misconfigured trunk on <1.1> …”. <1.1> refers to the interface name captured by condition1!

LTRNMS 3002 Network Compliance and Network and Application Monitoring with Prime Infrastructure 3.0
Click “Create”
Now you will create again a Profile Select Configuration/Compliance/Profile , + and give a name
Click “Add”, to add a policy and check your policy in the user defined policies folder

LTRNMS 3002 Network Compliance and Network and Application Monitoring with Prime Infrastructure 3.0
Execute the profile
Select the switches
and run the job immediately In Configuration/Compliance/Jobs, wait for the job to complete

LTRNMS 3002 Network Compliance and Network and Application Monitoring with Prime Infrastructure 3.0
See the result
You can check in the configuration archive
Exercise 6: Creation of a user defined policy using “command output” scope
Objective: In this exercise, you will create a policy, which will check that your switches are configured either in VTP client or in VTP server mode in a VTP domain that you passed as parameter (Rule Input) Unfortunately, it’s not possible to test the configuration, as the VTP information is not always visible in the configuration see below: In VTP transparent mode, VTP information is visible in the configuration

LTRNMS 3002 Network Compliance and Network and Application Monitoring with Prime Infrastructure 3.0
However, in VTP client or VTP server mode, the VTP information is not in the configuration, but is visible through a command “show vtp status”
This is the same behaviour with VTP server mode. You need to test the output of a “show vtp status”
The rule will contain 2 conditions Condition/Action 1: Check the vtp domain
Scope: show command: show vtp status Condition: Match the expression VTP Domain Name\s*:\s<_vtp_domain>

LTRNMS 3002 Network Compliance and Network and Application Monitoring with Prime Infrastructure 3.0
Match Action: Continue Doesn’t match Action: Raise a Violation
Condition/Action 2: check the vtp mode Scope: show command: show vtp status Condition: Matches the expression VTP Operating\s*:\s(Server|Client) Match Action: Do not Raise a violation Doesn’t match Action: Raise a violation
Select Configuration/ Compliance /Policies
Click + to add a policy, give a name “VTP”, and click “Create”
Click “New” to add a new rule
Give a Name then click “Next”

LTRNMS 3002 Network Compliance and Network and Application Monitoring with Prime Infrastructure 3.0
Select IOS and IOS-XE then Next
Add the VTP domain as rule input. Put your pod name as default value, for example POD1 if you are either POD1W or POD1E.

LTRNMS 3002 Network Compliance and Network and Application Monitoring with Prime Infrastructure 3.0
In condition and actions, click +New to add the first condition
Condition/Action 1: Check the vtp domain
Scope: show command: show vtp status
Condition: Match the expression VTP Domain Name\s*:\s<_vtp_domain>

LTRNMS 3002 Network Compliance and Network and Application Monitoring with Prime Infrastructure 3.0
Match Action: Continue Doesn’t match Action: Raise a Violation
Condition/Action 2: check the VTP mode
Scope: show command: show vtp status
Condition: Matches the expression: VTP Operating Mode\s*:\s(Server|Client)

LTRNMS 3002 Network Compliance and Network and Application Monitoring with Prime Infrastructure 3.0
Match Action: Do not Raise a Violation Doesn’t match Action: Raise a Violation
Click Save
Create now the profile Select Configuration/Compliance/Profile , + and give a name

LTRNMS 3002 Network Compliance and Network and Application Monitoring with Prime Infrastructure 3.0
Select Add, to add a policy and check your policy in the user defined policies folder
The Rule Input “vtp domain” should be your POD
Execute the profile
Select the switches
And run the job immediately In Configuration/Compliance/Jobs, wait for the job to complete

LTRNMS 3002 Network Compliance and Network and Application Monitoring with Prime Infrastructure 3.0
Visualize the result
Exercise 7: Creation of a user defined policy testing multiple instances of a command
Objective: In IOS, some commands can have multiple instances. For example, you can have multiple “snmp-server community “, multiple “logging” destinations, multiple “ntp server” . It’s easy to check that a specific instance of a command exists. For example: “snmp-server community pilab-ro RO” must exist. But how can you test that another instance with a different community name does not exist? In this exercise, you will learn a method to solve this issue.

LTRNMS 3002 Network Compliance and Network and Application Monitoring with Prime Infrastructure 3.0
Imagine that the rule is to have 2 readonly communities (passed as parameters), and one rw community (passed as parameter). How can you write the policy? The rule has 3 inputs for the communities <_com_ro1>, <_com_ro2>, <_com_rw> . The rule has 5 conditions/actions: Condition/Action 1: Check the first read-only community
Scope: Configuration Condition: contains the string “ snmp-server community <_com_ro1> RO Match Action: Continue Doesn’t match Action: Raise a Violation and Continue
Condition/Action 2: Check the second readonly community Scope: Configuration Condition: contains the string “ snmp-server community <_com_ro2> RO Match Action: Continue Doesn’t match Action: Raise a Violation and Continue
Condition/Action 3: Check the readwrite community Scope: Configuration Condition: contains the string “ snmp-server community <_com_rw> RW Match Action : Continue Doesn’t match Action : Raise a violation and continue
If we stop here, and have no violation, we are sure that the mandatory communities exist but we don’t know if an “unwanted” community exist as well. One possible trick, is to consider now, each “snmp-server community xxx RO” as a configuration block of 1 line !
Condition/Action 4: Check if unwanted RO community exists
Scope: Configuration Parse as blocks: Yes. Define block start:
^snmp-server community \S* RO -
Condition: match the expression: snmp-server community (?:<_com_ro1>|<_com_ro2>) RO.*
- Where (?:<_com_ro1>|<_com_ro2>) means either <_com_ro1> or <_com_ro2> but without capturing as parameter ( .?: means non capturing group).
- RO.* => because we accept to have an access-list! Match Action: Continue Doesn’t match Action: Raise a Violation and Continue
LTRNMS 3002 Network Compliance and Network and Application Monitoring with Prime Infrastructure 3.0
Condition/Action 5: Check if unwanted RW community exists
Scope: Configuration Parse as blocks: Yes. Define block start :
^snmp-server community \S* RW Condition: match the expression: snmp-server community <_com_rw> RW.* Match Action: No violation Doesn’t match Action: Raise a violation
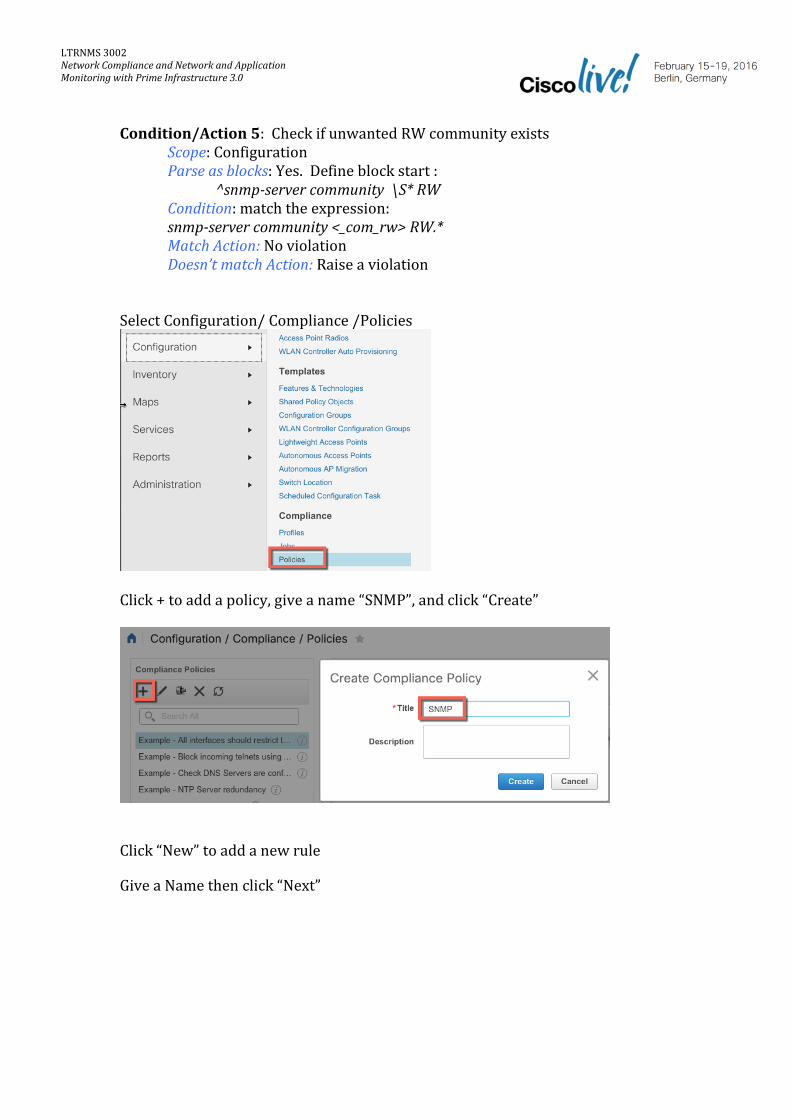
Select Configuration/ Compliance /Policies
Click + to add a policy, give a name “SNMP”, and click “Create”
Click “New” to add a new rule
Give a Name then click “Next”

LTRNMS 3002 Network Compliance and Network and Application Monitoring with Prime Infrastructure 3.0
Select IOS and IOS-XE then Next
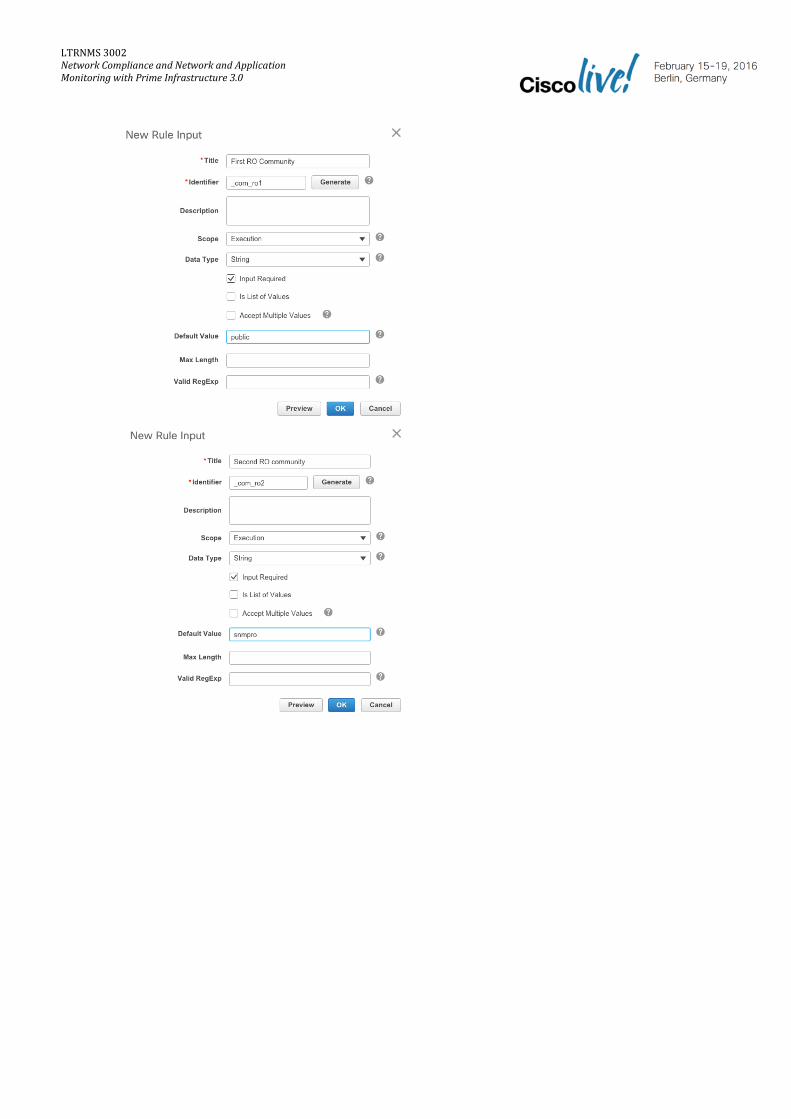
Add the 3 rule inputs, for the snmp communities (2 RO, 1 RW) . As default values for RO community, use public and snmpro and use private for the RW community.
LTRNMS 3002 Network Compliance and Network and Application Monitoring with Prime Infrastructure 3.0

LTRNMS 3002 Network Compliance and Network and Application Monitoring with Prime Infrastructure 3.0
In condition and actions, click +New to add the first condition
Condition/Action 1: Check the first readonly community Scope: Configuration Condition: contains the string “ snmp-server community <_com_ro1> RO

LTRNMS 3002 Network Compliance and Network and Application Monitoring with Prime Infrastructure 3.0
Match Action: Continue Doesn’t match Action: Raise a Violation and Continue
Condition/Action 2: Check the second readonly community Scope: Configuration Condition: contains the string “ snmp-server community <_com_ro2> RO
Match Action: Continue Doesn’t match Action: Raise a Violation and Continue

LTRNMS 3002 Network Compliance and Network and Application Monitoring with Prime Infrastructure 3.0
Condition/Action 3: Check the readwrite community Scope: Configuration Condition: contains the string “ snmp-server community <_com_rw> RW
Match Action: Continue Doesn’t match Action: Raise a Violation and Continue
Condition/Action 4: Check if unwanted RO community exists Scope: Configuration Parse as blocks: Yes. Define block start :
^snmp-server community \S* RO Condition: match the expression: snmp-server community (?:<_com_ro1>|<_com_ro2>) RO.*

LTRNMS 3002 Network Compliance and Network and Application Monitoring with Prime Infrastructure 3.0
Match Action: Continue Doesn’t match Action: Raise a Violation and Continue
Condition/Action 5: Check if unwanted RW community exists Scope: Configuration Parse as blocks: Yes. Define block start:
^snmp-server community \S* RW Condition: match the expression: snmp-server community <_com_rw> RW.*

LTRNMS 3002 Network Compliance and Network and Application Monitoring with Prime Infrastructure 3.0
Match Action: Does Not Raise a Violation Doesn’t match Action : Raise a Violation

LTRNMS 3002 Network Compliance and Network and Application Monitoring with Prime Infrastructure 3.0
Click save/create to create the policy
Create now the profile Select Configuration/Compliance/Profile, + and give a name
Click “Add”, to add a policy and check your policy in the user defined policies folder
Keep the rule inputs values as below
Execute the profile
Select the switches

LTRNMS 3002 Network Compliance and Network and Application Monitoring with Prime Infrastructure 3.0
and run the job immediately In Configuration/Compliance/Jobs, wait for the job to complete
Visualize the result
You can confirm with the configuration archive . Do you know how to do it? (There is a trick) Here are POD1W, snmp communities
LTRNMS 3002 Network Compliance and Network and Application Monitoring with Prime Infrastructure 3.0
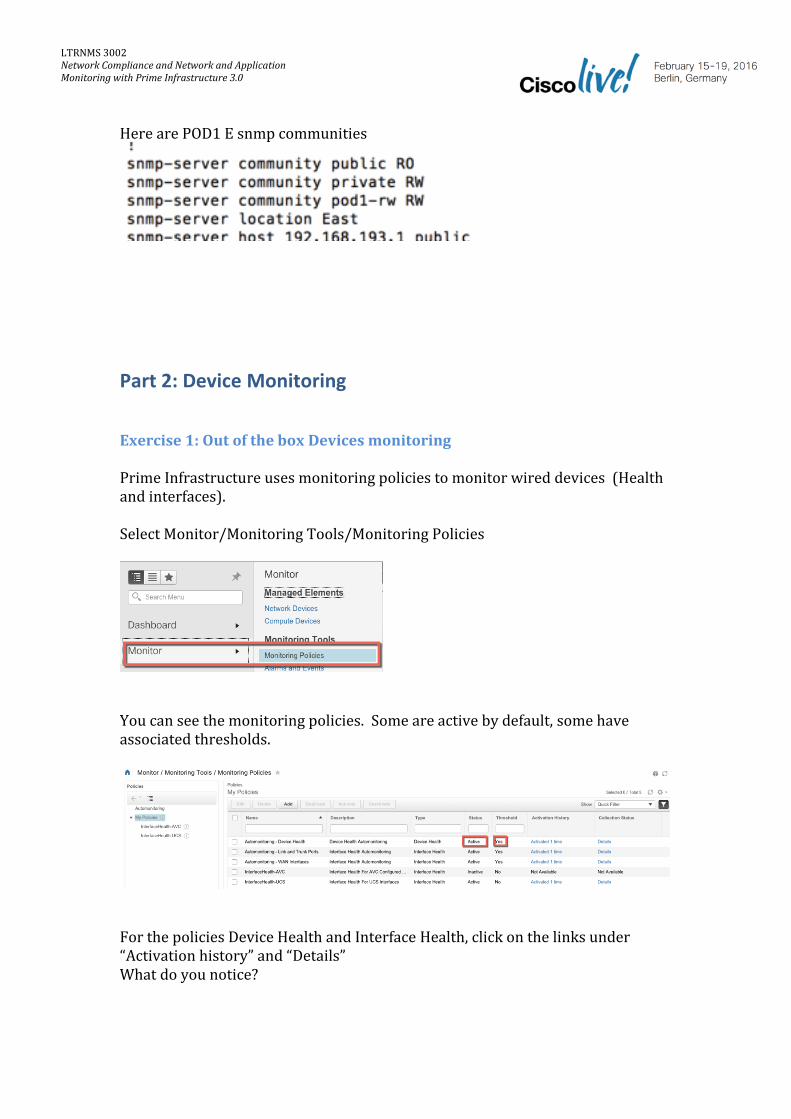
Here are POD1 E snmp communities
Part 2: Device Monitoring
Exercise 1: Out of the box Devices monitoring
Prime Infrastructure uses monitoring policies to monitor wired devices (Health and interfaces). Select Monitor/Monitoring Tools/Monitoring Policies
You can see the monitoring policies. Some are active by default, some have associated thresholds.
For the policies Device Health and Interface Health, click on the links under “Activation history” and “Details” What do you notice?

LTRNMS 3002 Network Compliance and Network and Application Monitoring with Prime Infrastructure 3.0
Click now on Auto monitoring
Examine which parameters are polled for devices and Interfaces (Link and Trunk Ports)

LTRNMS 3002 Network Compliance and Network and Application Monitoring with Prime Infrastructure 3.0
Wireless devices are not monitored using monitoring policies but monitoring jobs. You can see the jobs used for wireless from: Administration/Dashboards/Job Dashboard
Examine now the Overview dashboards for devices Dashboards/Overview/Network Devices

LTRNMS 3002 Network Compliance and Network and Application Monitoring with Prime Infrastructure 3.0
(You can change the layout)
Click the icon on one of your devices to launch the device 360

LTRNMS 3002 Network Compliance and Network and Application Monitoring with Prime Infrastructure 3.0
Click a device IP address to launch the “Performance Dashboard “ for the device
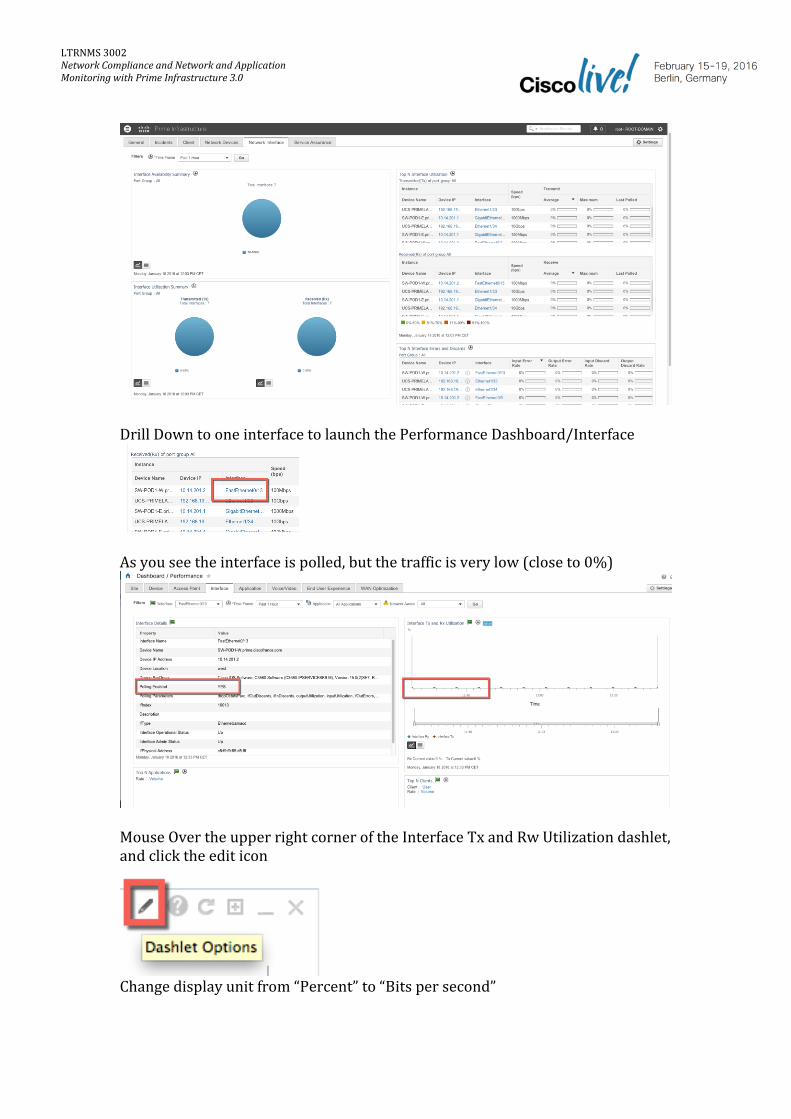
Examine now the Overview Dashboard for Interfaces Select Dashboard/Overview/Network Interfaces
LTRNMS 3002 Network Compliance and Network and Application Monitoring with Prime Infrastructure 3.0
Drill Down to one interface to launch the Performance Dashboard/Interface
As you see the interface is polled, but the traffic is very low (close to 0%)
Mouse Over the upper right corner of the Interface Tx and Rw Utilization dashlet, and click the edit icon
Change display unit from “Percent” to “Bits per second”

LTRNMS 3002 Network Compliance and Network and Application Monitoring with Prime Infrastructure 3.0
Save and close and see the result
Exercise 2: Customizing device monitoring
In this exercise, you will customize the device monitoring. You will use the 2 device groups (location groups) called East and West created at the beginning of the lab. You will create a new monitoring policy to monitor only the device from your location group (either East or West). Select Monitor/ Monitoring Tools/ Monitoring Policies and click “Add”

LTRNMS 3002 Network Compliance and Network and Application Monitoring with Prime Infrastructure 3.0
Select the Device Health Policy Type
Expand Device Selection
Select the location group East or West Give a name to the policy, keep the default polling intervals and click “save and activate”

LTRNMS 3002 Network Compliance and Network and Application Monitoring with Prime Infrastructure 3.0
Confirm that the policy is created
Confirm the policy is active on appropriate devices
Go to your personal dashboard by clicking on You have an Empty Overview Dashboard called CL16 PODx, (created early in the lab).

LTRNMS 3002 Network Compliance and Network and Application Monitoring with Prime Infrastructure 3.0
From the setting icon (upper right corner), Select “Add Dashlets”
Add the following Dashlets
Network Topology Top N CPU Utilization Top N Interface Utilization
Add a Filter : Site
You can see the Dashboard

LTRNMS 3002 Network Compliance and Network and Application Monitoring with Prime Infrastructure 3.0
Edit The Network Topology Dashlet (mouse over upper right corner)
Select the group East or West, depending of your pod, and “save and close”
Edit the Top N Interfaces Dashlet Select “Link Ports” as Port Group and Change the Title
In the Site filter, Select East or West, depending on your pod and click Go

LTRNMS 3002 Network Compliance and Network and Application Monitoring with Prime Infrastructure 3.0
Now you have changed the behaviour of your dashboard. This Dashboard:
displays your location topology, displays the monitored metrics of the devices (CPU) of your location, displays the monitored metrics of the link ports of your location.
In addition, the devices from your location have a specific monitoring policy (with a different interval in this case)
Exercise 3: Monitoring UCS servers
Explore the Datacenter Dashboards. On Dashboard/Data Center /Compute, select the Data Center (PI-LAB) and click “Go”
You can drill down to a Host to enter Dashboard / Data Center /Host Go also to Monitor / Compute Device.

LTRNMS 3002 Network Compliance and Network and Application Monitoring with Prime Infrastructure 3.0
Find YOUR VM, it is called PI30-CL16-PODxy (x is the pod number, y is W for West or E for East) and display its performance metrics. Display also the performance metrics of the host where your VM runs. Below, from Virtual Machines, use Quick Filter to search you VM
Click on it: You can have details on your VM and go to the host and the cluster
Part 3: Application Monitoring In this part you will learn:
How to configure a NAM as a data source for application monitoring How to configure QOS and Application Visibility on routers How to monitor applications
Exercise 1: Using NAM as a data source.
A NAM is part of your inventory. At this time you can only use it as a network device. To use it as a data source for application monitoring, you must enable it. Select Services/ AV&C/ Data Sources

LTRNMS 3002 Network Compliance and Network and Application Monitoring with Prime Infrastructure 3.0
At the bottom, you should see the NAM in disabled state
Select it and click Enable
You should see it in “enabled state”. If you expand it, you should see the “DATA PORT”. This is the NAM port which collects traffic and that you will use as a data source.

LTRNMS 3002 Network Compliance and Network and Application Monitoring with Prime Infrastructure 3.0
Exercise 2: AVC Readiness Assessment on router
Prime Infrastructure provides an assessment tool for AVC and QoS. This tools gives you the status of your routers regarding AVC capability and configuration. Select Services/Application Visibility and Control/Readiness Assessment
In the example below, both routers are AVC capable, one as already AVC configured. One is running protocol pack 11, the other protocol pack 13.
Protocol packs contains the information used by NBAR2 to classify protocols. Protocol packs are periodically distributed to recognize new applications or to provide bug fixes. Prime Infrastructure provides a repository for the protocol packs. Protocol packs can be downloaded from CCO and uploaded to Prime Infrastructure, and then they can be loaded to the routers.
Exercise 3: AVC profiles

LTRNMS 3002 Network Compliance and Network and Application Monitoring with Prime Infrastructure 3.0
AVC profiles are configuration templates that can be deployed on interfaces. There are 3 categories
QoS Classification Profiles define how application traffic can be
identified (based on NBAR2) and marked. 3 default profiles are provided
out of the box according to Cisco best practices: 5 classes, 8 classes and 12
classes profiles. New profiles can be added
QoS Action Profiles define the egress actions, which will occur on egress
traffic: (Queuing, Priority Queuing, BW reservation, shaping…). 3 default
profiles are provided (5,8,12 classes) out of the box. They can be modified
and new profiles can be added.
Application visibility Profiles define the monitoring actions (URL
monitoring, traffic volume, Application Response Time, Voice/Video
metrics).
Objectives: The goal of this lab is to create a new QoS classification profile that will include the traffic to/from your management platform in the class “TRANSACTIONAL DATA” Step 1: Adding a new QoS Classification Profile Select Services/AV&C/AVC Profiles
Select + to add a new profile

LTRNMS 3002 Network Compliance and Network and Application Monitoring with Prime Infrastructure 3.0
Choose Create Classification Profile
Give a name (PILAB-QOS), and choose 5-class profile
Step 2: Adding a new classification rule to classify the traffic to/from your Prime Infrastructure Server Click Add to add your classification rule (see image above) A new entry appears at the bottom
Click Change the type from NBAR to L3/L4 (you will classify using your own PI IP address ) Select Apply IP/Port symmetrically Put YOUR PI IP address (192.168.40.xy)
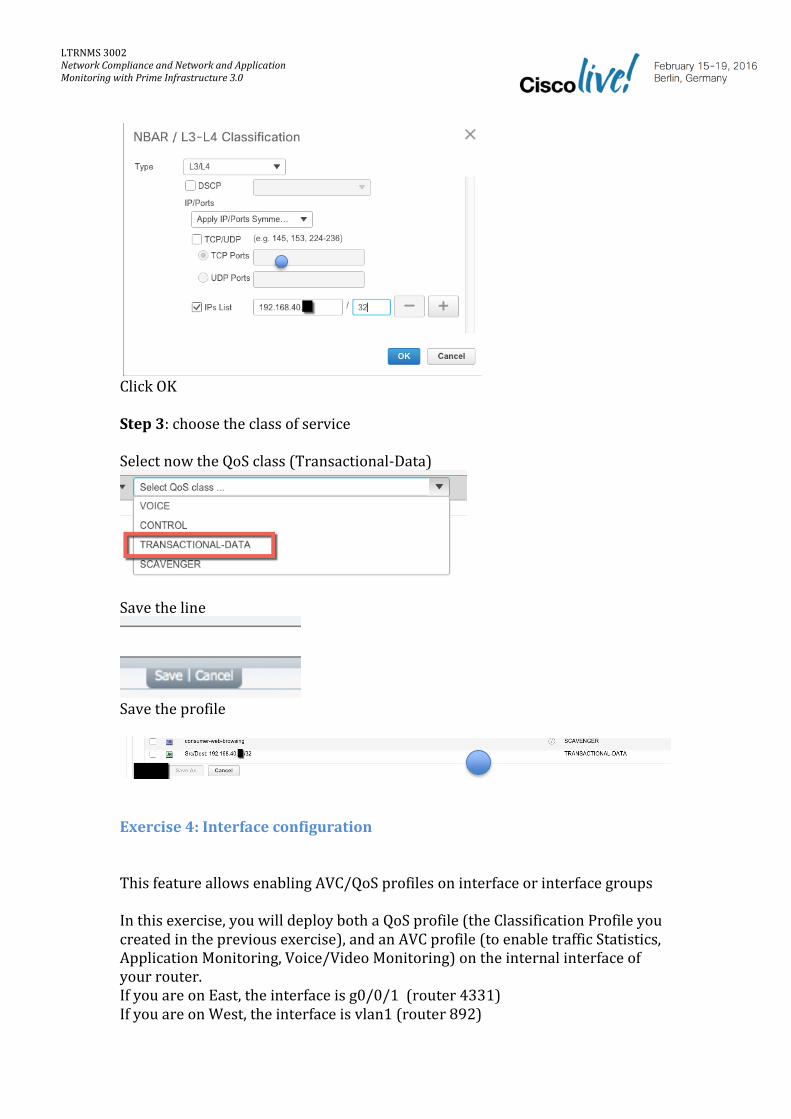
LTRNMS 3002 Network Compliance and Network and Application Monitoring with Prime Infrastructure 3.0
Click OK Step 3: choose the class of service Select now the QoS class (Transactional-Data)
Save the line
Save the profile
Exercise 4: Interface configuration
This feature allows enabling AVC/QoS profiles on interface or interface groups In this exercise, you will deploy both a QoS profile (the Classification Profile you created in the previous exercise), and an AVC profile (to enable traffic Statistics, Application Monitoring, Voice/Video Monitoring) on the internal interface of your router. If you are on East, the interface is g0/0/1 (router 4331) If you are on West, the interface is vlan1 (router 892)

LTRNMS 3002 Network Compliance and Network and Application Monitoring with Prime Infrastructure 3.0
Deploy a QoS profile Select Services/ AV&C/ Interface Configuration
Select the appropriate interface on your router (You can use the quick filter )
Click “Enable QoS” Then select your profile (PILAB-QOS)
You can preview the CLI. You should see the ACL for your PI server.

LTRNMS 3002 Network Compliance and Network and Application Monitoring with Prime Infrastructure 3.0
Then deploy Check the status of the job in Administration/Job Dashboard
Deploy an AVC profile Select Services/ AVC/ Interface Configuration
Select the internal interface of your router as previously. Notice that you see it with QoS enabled

LTRNMS 3002 Network Compliance and Network and Application Monitoring with Prime Infrastructure 3.0
Select “Enable App Visibility” Choose “App Visibility & Performance (IPv4 and IPv6)”
You can see the CLI. If you are familiar with AVC CLI, you can see that Prime Infrastructure uses the ezPM framework (Easy Performance Monitor) if the router can support it.
Click “Deploy” and wait the job completes.
If you go back to interface configuration, you can see that “App Visibility Policy” is deployed

LTRNMS 3002 Network Compliance and Network and Application Monitoring with Prime Infrastructure 3.0
Select now Inventory/Group Management/Port groups
Expand Port Groups/System Defined and select “AVC Configured Interfaces”. You should see your router port. AVC Configured interfaces is automatically populated with the ports where QoS or AVC is configured
Select Monitor/Monitoring Tools/ Monitoring Policies
A Policy exists by default called Interface-AVC. This policy monitors interfaces from the port group “AVC configured interfaces”. It is not activated by default. Activate it!
The policy becomes active. You can click “details” to see on which interfaces

LTRNMS 3002 Network Compliance and Network and Application Monitoring with Prime Infrastructure 3.0
Exercise 5: Device Data Sources
You have deployed AVC profiles. The effect is to configure metering agents on your router. Metering agents are able to provide statistics for Application traffic, Application Response Time and Voice and Video parameters (jitter and loss). These metrics are exported using Netflow V9 or IPFIX. These exports create data sources in Prime Infrastructure. To view the data sources: Select Services/AV&C/Data Sources
Select your data source (RTR-PODx-y) and see the netflow templates. You will have probably several templates, depending of what you have enabled and depending on the traffic patterns on the network.

LTRNMS 3002 Network Compliance and Network and Application Monitoring with Prime Infrastructure 3.0
If you want details on the contents of the export, you can drill down to a template by clicking on it. You will see the fields of the netflow records and the exporting devices (your router)
(Note: you can also go to this same page from Services/AV&C/Netflow Templates)
Exercise 6: QoS and AVC monitoring on interfaces
Previously, you enabled monitoring on the port group “AVC configured interfaces”. This port group contains the interfaces where you enabled AVC or QOS
LTRNMS 3002 Network Compliance and Network and Application Monitoring with Prime Infrastructure 3.0
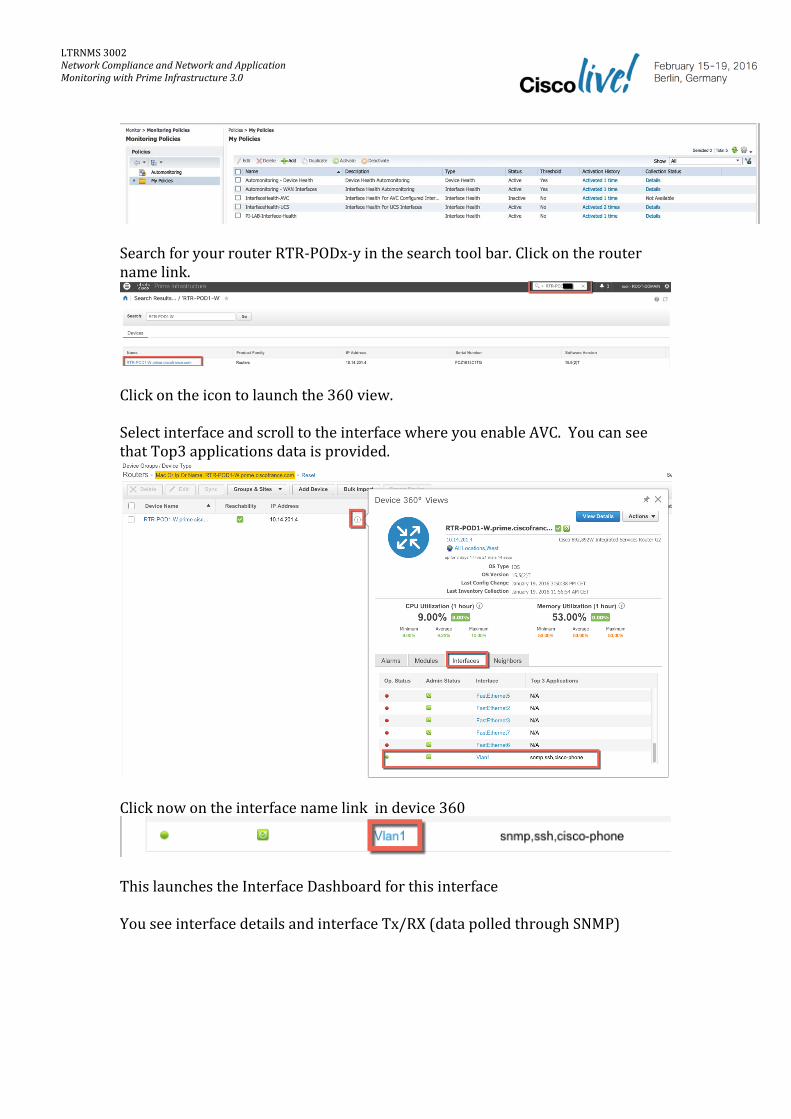
Search for your router RTR-PODx-y in the search tool bar. Click on the router name link.
Click on the icon to launch the 360 view. Select interface and scroll to the interface where you enable AVC. You can see that Top3 applications data is provided.
Click now on the interface name link in device 360
This launches the Interface Dashboard for this interface You see interface details and interface Tx/RX (data polled through SNMP)

LTRNMS 3002 Network Compliance and Network and Application Monitoring with Prime Infrastructure 3.0
Then you see data collected through AVC (Application volume, Top N client, Number of clients and DSCP information)
You see also data from Class Based QoS monitoring. To visualize data on the “Top QoS Class Map Statistics Trend” dashlet, you need to select “In” traffic and either Pre or Post policy rate (probably there is no drop)

LTRNMS 3002 Network Compliance and Network and Application Monitoring with Prime Infrastructure 3.0
Exercise 7: Monitoring application with Service Assurance and Application Performance Dashboard
Service Assurance Dashboard is the main Overview Dashboard to display Application metrics Go to Dashboard/ Overview/ Service Assurance
Explore the dashboard Focuse on the Top N “Applications” Dashlet

LTRNMS 3002 Network Compliance and Network and Application Monitoring with Prime Infrastructure 3.0
Click on the edit icon
Expand the data sources
By default all data sources are aggregated Change to data source RTR-PODx-y (netflow) then vnam-podx (NAM ) to see the difference. Click the bar of the RTP Application to drill down to a performance dashboard for Application

LTRNMS 3002 Network Compliance and Network and Application Monitoring with Prime Infrastructure 3.0
From in the upper right corner, Add the Dashlet “Application ART Analysis”
You should see “No data”. Why?
Change to another Application, tcp based, for example ssh

LTRNMS 3002 Network Compliance and Network and Application Monitoring with Prime Infrastructure 3.0
Look the Application ART Analysis dashlet. You should have data. Do you understand this graph?
Exercise 7: Customize your Dashboard
Click to launch your dashboard, and click setting (upper right corner) to add dashlets.
Add the dashlets:
Top N applications Worst Site by transaction time Top N Clients Top N servers

LTRNMS 3002 Network Compliance and Network and Application Monitoring with Prime Infrastructure 3.0
End of LAB