Embed Size (px)
Citation preview

LTAR Common Observatory
Meteorology Data
Concept of Operations
Version 2.0
September 29, 2015
Developed by Jeffrey Campbell, Dave Goodrich, Phil Heilman, and John Sadler
Version 2.0 i September 29, 2015
Table of Contents Revision Control ....................................................................................................................................................................... ii
Executive Summary ................................................................................................................................................................ 1
1 Introduction ........................................................................................................................................................................... 1
1.1 Objectives ....................................................................................................................................................................... 1
2 Workflow ................................................................................................................................................................................. 3
2.1 Overview ......................................................................................................................................................................... 3
2.2 Workflow Details ......................................................................................................................................................... 4
2.2.1 Data Logger to Office ......................................................................................................................................... 4
2.2.2 Data to CSV ............................................................................................................................................................ 5
2.2.3 CSV to FTP .............................................................................................................................................................. 5
2.2.4 CORe Retrieves from FTP ................................................................................................................................ 5
2.2.5 CORe Ingest – Validation .................................................................................................................................. 6
2.2.6 CORe Ingest – Database update .................................................................................................................... 6
2.2.7 CORe Access and Output .................................................................................................................................. 6
2.2.8 QA/QC Review ...................................................................................................................................................... 6
3 PhenoCam ............................................................................................................................................................................... 8
Appendix A Meteorology Metadata ................................................................................................................................ 10
Appendix B Data Submission Files ................................................................................................................................. 13
Appendix C Meteorological Observation Data ........................................................................................................... 15
C.1 Discussion..................................................................................................................................................................... 15
C.2 Meteorology Data Fields and Format ................................................................................................................ 17
Appendix D CORe Data Receipt Details ........................................................................................................................ 19
Appendix E Meteorology Data Format Examples .................................................................................................... 22
Normal Observations ...................................................................................................................................................... 22
Abnormal Observations ................................................................................................................................................. 24
Processing Times .............................................................................................................................................................. 24
Tables Table 1 WMO Metadata Categories .......................................................................................................... 11
Table 2 Meteorological Common Observatory data ............................................................................... 15
Table 3 LTAR meteorology data submission format .............................................................................. 18
Table 4 Parameters controlling data transfer from site FTP to CORe................................................... 20

Version 2.0 ii September 29, 2015
Figures Figure 1: Near real-time data flow from meteorology instruments to the CORe and available via
page pages and web service APIs. Number in blue circles correspond to workflow description and
document subsections. USDA components are shaded green. ................................................................ 4
Figure 2: Graphical representation of temporal elements referenced in WIGOS Metadata categories.
.................................................................................................................................................................... 12
Revision Control
Version 1.1, June 29, 2015, Jeffrey Campbell
Section 2.2.6 CORe Ingest – Database Update: Almost complete change in CORe ingest
processing to eliminate prior assumption that data will be in chronological order.
Section 2.2.8 QA/QC Review: All references to MATLAB and the Georgia Coastal
Ecosystem Data Toolkit have been removed.
Appendix B Data Submission Files: Significant clarifications were added
o Legacy and common values may be in the same or different files. A character is
added to the naming convention to indicate the file contents as legacy, common or
both.
o Logistics for switching to a new file at the end of the month are detailed
o The month in the file name is the month in which the data was added to the file, not
necessarily the month in which it was observed. This solves many issues with non-
chronological data and eliminates the risk of added data to an old file.
Appendix C Meteorological Observation Data:
o Missing Values: Edited to make it clear that missing values are represented in the
csv file with nothing (or just a space) between the commas separating that value
from the next.
o Table 2 LTAR Meteorology Data Submission Format:
Removed erroneous T between the time and UTC offset
Added parameters for phase 2 for BatteryVoltage and LoggerTemperature
to support future QC processing.
QC Processing using the Georgia Coastal Ecosystem Data Toolbox Appendix: deleted
Appendix E Meteorological Data Format Examples: new appendix
Version 1.1, June 29, 2015, Jeffrey Campbell
Multiple editorial corrections.Table3: Corrected omission of WindDirection.

Version 2.0 1 September 29, 2015
Executive Summary The proposed architecture for near real-time collection and dissemination of LTAR-wide
meteorological data is described. The architecture is also intended to support future Common
Observatory data.
The technical approach is for LTAR sites to transfer meteorological data hourly in easily formatted
csv (comma separated variables) files to an FTP server they can securely access. The National
Agricultural Library will host the new Common Observatory Repository (CORe). The CORe will
retrieve the data files from each FTP server, perform simple file data integrity tests, and load the
data into a database. The data will be marked as “Provisional and subject to revision following
review” and made available to ARS and the public via web service application program interfaces
(APIs).
Metadata will be developed in a machine readable format with content meeting the weather station
metadata standard currently nearing completion by the World Metrological Organization (WMO).
The plan addresses variability between LTAR sites. The goal for implementing LTAR-wide
meteorology in near real-time by the end of FY15 will be met by maintaining consistency with
historical data while collecting the new long-term Common Observatory data using consistent
methods and processes across the LTAR network.
1 Introduction This document describes the key concepts and architecture for collecting LTAR “common
observation” data from the LTAR sites in a centralized repository for public access. The name for
this repository is the Common Observatory Repository (CORe). While the initial focus is on
meteorological data, the approach was designed as a foundation for future processing other types
of near real-time data.
1.1 Objectives To make the first near real-time common observations from LTAR available to the public
from an NAL repository by the end of FY15.
To provide data from all sites to users in a common format with the same data definitions1.
To ensure comparability of common observatory data across the network. To the extent
scientifically feasible and appropriate, instruments of equivalent quality (precision,
accuracy) will be used with common methods.
To accommodate varying levels of IT capabilities and build skills at the LTAR sites. For
example, developing a clearinghouse for code and operating procedures to share with all
sites.
To maintain continuity for observations that extend historical records.
1 This includes details of the observation processing (for example the frequency and duration of measurements), IT details such as the data type (integer, floating point, number of decimal places) and name, and QA/QC flag definitions.

Version 2.0 2 September 29, 2015
To develop a foundation for subsequent common observatory data (hydrology, eddy flux…)
In a perfect world, all 18 LTAR sites would be providing near real-time observations using the same
observation methods and data definitions by the end of FY2015. However, there are wide variations
between LTAR sites (and between specific locations within LTAR sites) that are acknowledged in
the list of objectives. Factors that prevent a uniform LTAR-wide solution include:
Some locations already obtain data from sensors in near real-time, while others store their
sensor data in remote data loggers that are retrieved at periodic intervals (e.g., seasonally).
The availability, reliability, and expense of data communication and electrical power
options vary.
Both internet access speed and the ability to transmit research data across the network vary
by location.
Differences in information technology capability suggest that some sites will be easily able
implement changes (e.g., modifying data logger programming, transforming data between
formats, or automating FTP processing) while others will require substantial assistance.
Over time, the LTAR community will work to resolve these issues to the maximum extent possible.
Data continuity is a critical aspect of long-term data records. The World Meteorological
Organization recommends at least a year and preferably two years of parallel observations when
changing the location of long-term weather stations for climatological purposes2. Looking forward,
common observatory data collected across LTAR sites need to be consistent and comparable.
Recognizing that sites may have existing historical data sets that have been collected using different
methods than those proposed for the common observatory, the intent is to move towards common
and comparable data sets across all LTAR sites within a reasonable time-frame, following WMO
recommendations as outlined above to maintain data continuity.
For the near term, sites will continue to collect data using existing “legacy” methods, while also
beginning to collect the new “common” data, with both being submitted to the CORe. As stated
above, over the course of time, LTAR sites will move towards common and comparable data sets
across sites. The time-frames for making these transitions will: 1) be reasonable; 2) follow WMO
recommendations; 3) certainly vary by both site and type of data involved. Given the potential
complexities involved, further discussion of this transition is beyond the scope of this document.
Near real-time data disseminated by the CORe will indicate that all data are provisional and subject
to review and revision. The metadata that support user searches will explain the difference
between the legacy and common data. The standards-compliant, machine-readable metadata that
2 Plummer, Neil, Allsopp, Terry, Lopez, Jose Antonio, Guidelines on Climate Observation Networks and Systems, World Meteorological Organization, WMO Technical Document No. 1185, 2003. https://www.wmo.int/pages/prog/gcos/documents/gruanmanuals/WCP_WCDMP/WCDMP-52_000.pdf, Section 6.10.

Version 2.0 3 September 29, 2015
are provided with the data will include the details for both the site-specific legacy and common
methods, instruments, and processing.3 More details on the metadata are provided in Appendix A.
In summary, to distribute Common Observatory meteorological data in near real-time by the
end of FY15, we will take into consideration variations in site capabilities. For the near term,
data will be collected using both legacy methods for historical consistency AND new common
methods for building the Long-Term Agroecosystem Research network Common
Observatory. A realistic, yet aspirational, goal is for every site to significantly improve their
timely supply of common observatory data to NAL by the end of the fiscal year.
2 Workflow
2.1 Overview Since all LTAR sites are already collecting meteorological data and those data are relatively simple
and standard, meteorological observations were selected as the first common observatory data to
be made public in near real-time. This will allow the project to focus on data communications and
management implementation instead of novel sensor installation for eddy flux. The LTAR
Meteorology Committee is identifying the parameters to observe, methods, and observation
frequencies and duration. This document refers to some of those current recommendations, but
their document is the definitive source.
The approach to data transfer from the LTAR sites to the Common Observation Repository (CORe)
at NAL is to transmit simply formatted comma separated variable (csv) files to secure FTP servers
controlled by each LTAR site. IT security is enhanced because everyone writes only to their own
FTP server, and no write permission is needed by NAL (and conversely NAL does not have to
provide write permission to people and/or sites submitting data).
The workflow is designed as follows and illustrated in Figure 1.
1. Data are transferred from the data logger to the LTAR site office.
2. Data are added to a csv text file.
3. The file is uploaded using secure FTP to a server determined by the LTAR site.
4. Periodically (five minutes after the hour) the Common Observation Repository (CORe) will
retrieve the csv file from each of the LTAR FTP servers.
5. The CORe ingest system will perform simple validation to confirm the integrity of the csv
file (for example, the correct number of data fields and expected number of new
observations since the most recent successful data transfer).
3 An example of the metadata that would show the differences between methods and processing for hourly air temperature in Celsius is given here. One approach could be to report the “instantaneous” value of the air temperature at the beginning of each hour. Another approach could be to report the average (mean) temperature during the preceding 59 minutes. To add further complexity, that average could be computed as: (MinimumTemp + MaximumTemp)/2 or as the (sum of n observations)/n. The metadata will include the details needed to understand those distinctions.

Version 2.0 4 September 29, 2015
6. The CORe data ingest system will find the new data in the valid csv file and add it to the
database.
7. The data will be available for immediate access using web services, allowing LTAR sites to
view/review/display the data from the site easily.
8. QA/QC Review may pass data between CORe and LTAR sites via FTP as needed for local
review and revision of QC codes by LTAR site personnel.
Each aspect of this workflow is described in the following section.
Related workflows, such as batch input of data that pre-dates LTAR creation and files of QC results,
will follow the same general principles, but the details have not yet been defined. CORe collection of
events, such as sensor maintenance or changes in the weather station surroundings, will be
addressed in a subsequent workflow document during FY16.
2.2 Workflow Details
2.2.1 Data Logger to Office
If the LTAR site is currently collecting near real-time data, the existing process should be usable.
For sites installing new equipment to meet common observation specifications, it should be
Instruments
CORe Database
FTP Site NAL
FTP Site (LTAR Site)
Office Computer
NAL Processing
NAL Web Server
Data Logger
LTAR Common Obs
Web services API
Wifi, Cell, Satellite
Media transfer,
network wire
1
2
3
4
5
6
8
Web Services
7 Web servers Web browsers Models Tablet/phone
apps GIS software GIS web apps
Figure 1: Near real-time data flow from meteorology instruments to the CORe and available via page pages and web service APIs. Number in blue circles correspond to workflow description and document subsections. USDA components are shaded green.

Version 2.0 5 September 29, 2015
possible to share data logger programs, etc., to facilitate implementation. Sites without existing near
real-time capacity will also receive peer support.
2.2.2 Data to CSV
The csv format was chosen for data transfer because of its ease of use. In particular, each data value
will be followed by a comma to separate it from the next data value. Data loggers generally can
produce csv outputs. Excel, R, and most other software can easily create and read csv files. The
current recommendation is to use one csv file for each month’s data. There are approximately 3000
observations at 15-minute intervals for a month. Since each meteorological observation is less than
200 characters, the size of that monthly file is about 1.2 megabytes (including both legacy and
common values.) Data volume is not expected to be an issue for bandwidth transmitting the file to
the FTP server. For other types of observations (hydrology, eddy flux, etc.), the duration of data in
the file may be different (e.g., weekly, daily) to efficiently utilize bandwidth for different data
volumes.
File naming conventions are described in Appendix B. Details of the proposed format for the data in
the csv file are described in Appendix C.
2.2.3 CSV to FTP
Transmission of the data file from the LTAR site to their FTP server will be automated. The details
are site-specific depending upon their IT configuration. There are ways to run a “script” or program
periodically to perform this task. To improve data integrity and reduce unnecessary data
communications, it is beneficial for the script/program to also compute a hash (also called a “check
sum”)4 and transmit it in a separate file to the FTP server. The hash is computed by a mathematical
algorithm that is designed to detect any change in the file content. Such computations can be
performed with open source programs available for Windows and Linux environments.
Recommended software and configuration parameter values can be provided. The use of the hash is
not essential, but it is easy to do and does protect data integrity5.
2.2.4 CORe Retrieves from FTP
Periodically, the data will be retrieved by CORe from each LTAR site FTP server using secure FTP.
To avoid unnecessary data transmission, only new/changed data file(s) will be downloaded. This
detection will be based upon the timestamp of the file on the FTP server and/or the value in the
hash file on the FTP server.
Various parameters will be maintained for this data retrieval process in CORe. These are not
directly visible to the LTAR sites but can improve transfer efficiency, detect errors, and handle
variability between LTAR sites. The parameters will default to values appropriate for hourly
4 Commonly used hash functions use SHA-2 and MD5 algorithms. You may have seen hash values displayed for downloadable files for software, for example from web sites offering downloadable software. The purpose there is so you can verify that the file you received is the file the author created (and not a file modified to include malware). GitHub, SourceForge and other systems that manage software code also use hashes to determine when programmers have made intentional changes to files. 5 Admittedly, it is unlikely that someone would maliciously change meteorological data values, but the hash could detect such unauthorized modifications of data helping to meet requirements in the Data Quality Act of 2002.

Version 2.0 6 September 29, 2015
download of observations stored in monthly meteorology data files. Appendix D provides details of
this processing.
2.2.5 CORe Ingest – Validation
After downloading the latest data file via FTP, validation is performed to quickly detect grossly
missing or malformed data in order to promptly resolve problems with the originating site.
The first step is to confirm that there are no differences between the data file that was uploaded by
the LTAR site and the file that was received by CORe. This is accomplished by computing the hash of
the file and ensuring that it matches the hash value the LTAR site provided in the hash file on their
server. If there is no hash file on the server, the file integrity cannot be assessed.
Data headings in the file will be compared to the version-specific expected headings. The number of
fields in each row will be compared for version-specific consistency. Where appropriate6, the
number of new records will be compared to the expected rate of observations and the time since
the last record in the previous download. For example, with 15-minute observations downloaded
hourly, it would check for 4 observations per hour with the expectation that there would be 4 new
record each download cycle, but would expect 8 new records if the previous download cycle had
not found new data. It is expected that there will be delayed receipt of data for numerous reasons.
In particular, when the voltage of solar-charged batteries is low, observing stations will divert
power usage from data transmission to the higher priority of obtaining and logging sensor data.
When the batteries recharge data transmission will resume and include all unsent data.
2.2.6 CORe Ingest – Database update
After basic file validity has been confirmed, the new data are placed in the CORe database. New data
are defined as records at the end of the file that were not present in the csv file the previous time it
was downloaded by FTP.
All near real-time data will be flagged as provisional, subject to revision after QC.
2.2.7 CORe Access and Output
Web services (using REST) will be developed to make data available to the public through an API
(application program interface). These web services will also be used to create an LTAR
meteorology web page. Content and features have yet to be defined. Metadata will be accessible
both via the web page and web services. The web services will be publically available and can be
used to develop apps, or feed LTAR met data to other web pages, models, or for integration by GIS
servers and applications. The initial file output format will be csv, with other formats to be made
available in FY16.
2.2.8 QA/QC Review
The overall QC process workflow will include an automated algorithmic review followed by human
review by site data manager or other qualified personnel at the originating LTAR site. Once these
6 At least one LTAR site uses a time sliced polling protocol for transmitting data to the office. Using that approach, the number of records added to the csv file per hour can vary widely. Furthermore, the records are added to the end of the file in the sequence in which they were received, not chronologically based on observation time.

Version 2.0 7 September 29, 2015
reviews have been completed, the data with QA/QC annotations will be submitted to CORe. The
submission of data after QC will follow a similar workflow as described for the raw data but on a
different schedule. An annual review of the meteorological data including interstation comparisons
will be performed by each LTAR site to certify the data as the final, official values. The database will
be updated to include the QA/QC flags and any data revisions. Data revisions are expected to be
rare, so the current CORe design will save the prior values separately from the observation values.
This approach will allow retrieval of the prior values using a special process so that data
downloaded in the past can be reproduced later7.
2.2.8.1 QC Review Levels
The expectation is that there will be a database field that indicates progress through the QA/QC
stages for each record in the database. Currently identified stages are:
Preliminary data – no review
Automated review – algorithms applied, not reviewed by a human
Initial – person has reviewed the automated results
Final – annual review and approval has been completed.
Each record will also have a QA/QC comments field to accommodate record- or element-level issues
that are not covered by existing common codes.
2.2.8.2 QC Reason Codes (“Flags”)
WMO acknowledges that “there is no currently, globally accepted [QA] flagging system”8 and
recommends including the flag value definitions in a link in the metadata. Each data element will
have an associated QA/QC field that provides a standard set of reason codes to explain why the data
value was not accepted or why the automated reason code is not valid. In order to have data that
are comparable across LTAR sites, the reason codes must have the same meaning at all sites.
2.2.8.3 Field Reason Codes and Quality Control Indicators
There are a wide variety of potential future users for the data. Some users, such as scientists using
the data for a new purpose, are likely to want the detailed reason codes. These codes will allow
them to evaluate the meaning of each code to include or exclude each data point depending upon
their research question. The implication is that data that one scientist chooses to exclude could be
included by another scientist asking a different question.
For other uses (e.g., public display on a web site), having a simple indicator of goodness would
allow the user to trust the data provider’s best judgement instead of having to interpret the reason
codes themselves. WMO has a current standard9 with the following “quality control indicators”:
Good Inconsistent Doubtful
7 This allows re-creation of datasets as they were at a prior point in time which could be valuable in replicating prior analyses. 8 WIGOS Metadata Standard, March 3, 2015 draft document id: Cg-17/Doc 4.2.2(3).ADD.1, no page numbers, Category 8: Data Quality section. 9 BUFR code 0 33 020, but it appears that other similar codes are also included in the 0 33 series of codes.

Version 2.0 8 September 29, 2015
Wrong Not Checked Has been changed Estimated Missing value
If it is desirable to have both a detailed reason code and a goodness indicator, two quality fields
could be needed for each data value. This provides two primary benefits. A user can easily pre-filter
data to their level of preference without having to interpret every reason code. The second benefit
is that it more clearly shows the results of both the automatic and human reviews. For example, the
automated code could indicate a value more than 3 standard deviations from the historical mean.
The data provider can then flag that as good/questionable/bad based on their knowledge of the
actual circumstances.
2.2.8.4 Multiple Reason Codes
It seems that more than one QC reason code could be applicable to the same data parameter value.
It seems likely that atypical values could be flagged multiple times during the automated QA/QC
process. For example, a near record-breaking value would fail a test for values within 2 or 3
standard deviations from the historic daily, monthly, and annual mean.
For robustness, CORe will be able to handle this situation without resorting to inelegant “work-
arounds.” However, if there is a certainty that multiple codes will never be needed, the processing
can be simplified. Answers to the following questions help to resolve this design issue:
What, if any, circumstances would require more than one reason code to be associated with
a data element?
Would it be sufficient to report only the most significant or severe reason?
Are there any circumstances in which reporting that one code together with a record-level
comment would not be sufficient?
Inclusion of multiple codes makes processing of downloaded data somewhat more complicated
since the user would need to interpret each of the codes. With multiple reason codes, the goodness
indicator could become more important as a cumulative assessment of the reason codes.
In the future, Big Data methods could provide more sophisticated machine learning algorithms to
improve the automated QC process. For example, it might be able to identify patterns in severe
weather recognizing that rapid decreases in barometric pressure, increasing wind speed, a pattern
of wind direction changes, and heavy precipitation occurring between June and November in the
appropriate locations indicates a tropical storm, explaining values that would otherwise be flagged.
The potential for such systems might be an argument in favor of implementing the more robust
multiple reason code approach for the CORe.
3 PhenoCam The PhenoCam network has already developed methods and procedures for setting up the
equipment and submitting hourly photos. It is assumed that LTAR sites will follow those

Version 2.0 9 September 29, 2015
procedures and keep copies of the current images at least for a reasonable duration. The PhenoCam
network is currently supported by NSF, with the data collected at the University of New Hampshire.
An assessment needs to be made of the importance of archiving some or all of the PhenoCam
images. The argument in favor of archiving all images is that they are irreplaceable observations of
conditions at that time and future re-use scenarios are not known. On the other hand, there may be
seasonal or other factors that could reduce the expected value of some portion of the images10.
Assuming long-term preservation is appropriate11, the images should be properly stored in a
location under USDA control.
The general strategy for managing the hourly photos is consistent with the other
common observatory data. The LTAR sites will upload images to their FTP server
(presumably the same site as used for the meteorology data) and NAL will ingest the
files from there. Since the PhenoCam images will be sent to the PhenoCam network
via FTP, it should be relatively easy to have the images sent to two FTP destinations.
The file size is not expected to be significant compared to the currently available
bandwidth.
Alternative approaches could be developed that avoid the need for the LTAR site to
send the images to two destinations. Both require more complex processing, so they
appear to be less attractive unless there is a bandwidth constraint.
Alternative A: The LTAR site uploads the image to their FTP server (and not
directly to the PhenoCam network). NAL retrieves the image and sends it to
PhenoCam network. NAL archives the image.
Alternative B: NAL obtains the images from the PhenoCam network. Since there is
no publically available API to obtain the images automatically, further research will
be needed to determine if this approach is feasible.
10 The PhenoCam network seems to eliminate night time photos. This seems reasonable unless, for example, someone in the future wants to use the photos to count airplane lights in the sky as an indicator of sonic disruption. 11 From an archival perspective, the assessment of the resources required for a “collection” and comparison to the scientific priorities of other data need to be evaluated to best allocate resources.

Version 2.0 10 September 29, 2015
Appendix A Meteorological Metadata
The details and history of local conditions, instruments, operating procedures,
data processing algorithms and other factors pertinent to interpreting data
(i.e., metadata) should be documented and treated with the same care as the
data themselves. (WMO Integrated Global Observing System (WIGOS)
Metadata Standard v0.1)
The term ‘metadata’ is used here to describe information that is related to the observed
meteorological values. This includes information about the area surrounding the weather station,
details about the sensors/instruments used for the observation, and information about
sensor/instrument changes, recalibration and other events that could impact the data recorded. All
of these metadata will be stored in CORe in a well-structured, machine-readable form. A
spreadsheet (or other simple application) will be developed to collect and update the metadata as
needed.
The CORe metadata for meteorological data are derived from newly evolving World Meteorological
Organization requirements12 combined with information from the National Weather Service and
incorporating a review of the SensorML 2.0 definition. The following table contains the categories
of metadata and their descriptions in the current draft of the WMO metadata requirements. The
standard continues to evolve and details of the specific metadata within each category are still
being discussed. It appears that most of the metadata elements are relevant for LTAR and
compatible with SensorML 2.0.
It should be noted that the most of the metadata will change infrequently, so the majority of the
effort is at the beginning. NAL will assist with the initial metadata creation for instruments/sensors
and procedures that are used at multiple LTAR sites. NAL will also facilitate sharing of re-usable
portions of metadata between LTAR sites. For example, NAL has already started to collect
information about the sensors in the Smart Forest recommendation list in order to jump start those
sensor metadata. An easy to use method will be devised for creating the weather observation
metadata. Design requirements are not yet determined, but it is likely to be a template with areas to
fill in with text and other places to select from pre-defined lists. The end result will be well
structured metadata compliant with international/national standards. This will facilitate re-use and
help preserve the long-term value of the common observatory meteorological data.
12 WIGOS Metadata Standard, March 3, 2015 draft document id: Cg-17/Doc 4.2.2(3).ADD.1

Version 2.0 11 September 29, 2015
Table 1 WMO Metadata Categories13
Category Description 1 Observed variable Specifies the basic characteristics of the observed variable and
the resulting datasets. 2 Purpose of observation Specifies the main application area(s) of the observation and
the observing program(s) and networks the observation is affiliated to.
3 Station/platform Specifies the environmental monitoring facility, including fixed station, moving equipment or remote sensing platform, at which the observation is made.
4 Environment Describes the geographical environment within which the observation is made. It also provides an unstructured element for additional meta-information that is considered relevant for adequate use of the data and that is not captured anywhere else in this standard.
5 Instruments and methods of observation
Specifies the method of observation and describes characteristics of the instrument(s) used to make the observation. If multiple instruments are used to generate the observation, then this category should be repeated.
6 Sampling Specifies how sampling and/or analysis are used to derive the reported observation or how a specimen is collected.
7 Data processing and reporting
Specifies how raw data are transferred into the observed variable and reported to the users.
8 Data quality Specifies the data quality and traceability of the observation. 9 Ownership and data policy Specifies who is responsible for the observation and owns it. 10 Contact Specifies where information about the observation or dataset
can be obtained.
The concept of temporal extent in the WMO metadata seems to be particularly relevant to the
definition of LTAR common meteorological observations. The figure illustrates the sampling time
period (duration of data collection) compared to the aggregation period (the duration of the
reported result). Using air temperature as an example, a 15-minute average computed based upon
3 second observations once a minute has a sampling time period of 3 seconds, temporal sampling
interval of 1 minutes and an aggregation period of 15 minutes.
13 Ibid

Version 2.0 12 September 29, 2015
Figure 2: Graphical representation of temporal elements referenced in WIGOS Metadata categories.
Version 2.0 13 September 29, 2015
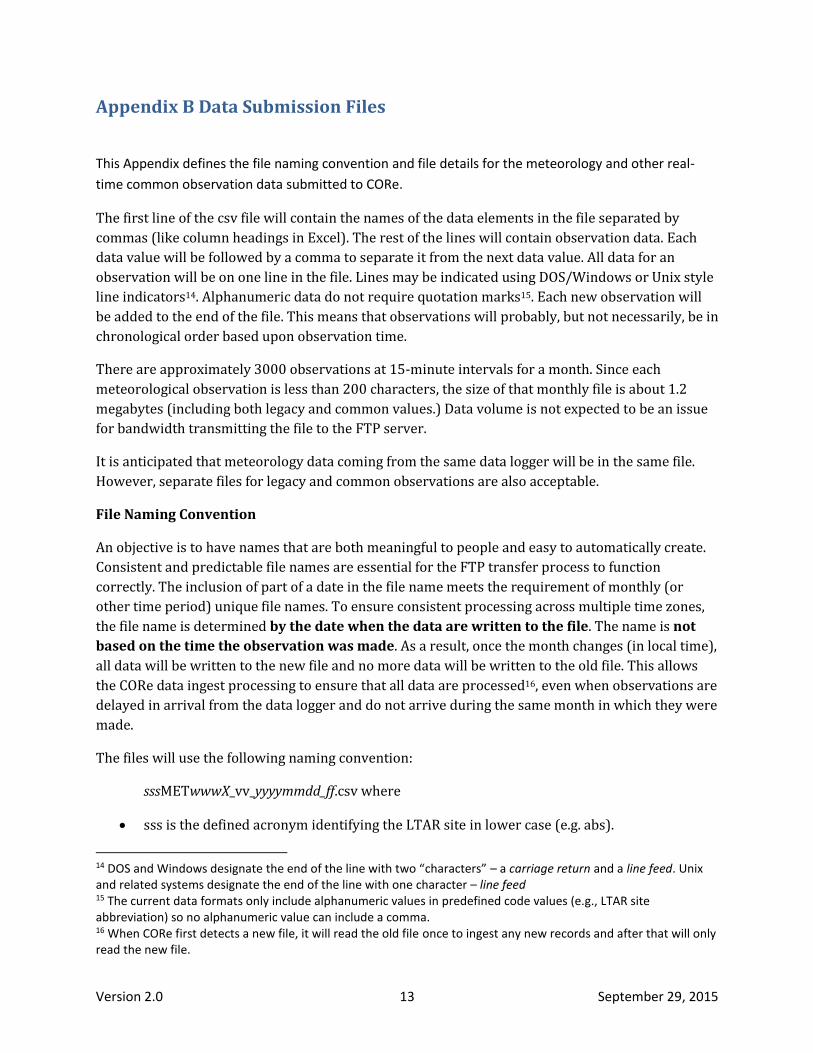
Appendix B Data Submission Files
This Appendix defines the file naming convention and file details for the meteorology and other real-
time common observation data submitted to CORe.
The first line of the csv file will contain the names of the data elements in the file separated by
commas (like column headings in Excel). The rest of the lines will contain observation data. Each
data value will be followed by a comma to separate it from the next data value. All data for an
observation will be on one line in the file. Lines may be indicated using DOS/Windows or Unix style
line indicators14. Alphanumeric data do not require quotation marks15. Each new observation will
be added to the end of the file. This means that observations will probably, but not necessarily, be in
chronological order based upon observation time.
There are approximately 3000 observations at 15-minute intervals for a month. Since each
meteorological observation is less than 200 characters, the size of that monthly file is about 1.2
megabytes (including both legacy and common values.) Data volume is not expected to be an issue
for bandwidth transmitting the file to the FTP server.
It is anticipated that meteorology data coming from the same data logger will be in the same file.
However, separate files for legacy and common observations are also acceptable.
File Naming Convention
An objective is to have names that are both meaningful to people and easy to automatically create.
Consistent and predictable file names are essential for the FTP transfer process to function
correctly. The inclusion of part of a date in the file name meets the requirement of monthly (or
other time period) unique file names. To ensure consistent processing across multiple time zones,
the file name is determined by the date when the data are written to the file. The name is not
based on the time the observation was made. As a result, once the month changes (in local time),
all data will be written to the new file and no more data will be written to the old file. This allows
the CORe data ingest processing to ensure that all data are processed16, even when observations are
delayed in arrival from the data logger and do not arrive during the same month in which they were
made.
The files will use the following naming convention:
sssMETwwwX_vv_yyyymmdd_ff.csv where
sss is the defined acronym identifying the LTAR site in lower case (e.g. abs).
14 DOS and Windows designate the end of the line with two “characters” – a carriage return and a line feed. Unix and related systems designate the end of the line with one character – line feed 15 The current data formats only include alphanumeric values in predefined code values (e.g., LTAR site abbreviation) so no alphanumeric value can include a comma. 16 When CORe first detects a new file, it will read the old file once to ingest any new records and after that will only read the new file.

Version 2.0 14 September 29, 2015
MET indicates that the file contains meteorological data
www is the weather station 3 digit number.
The value 000 indicates the LTAR site common observatory station.
Other values for www allow an LTAR site to submit data from more than one met
station in the future.
X is a single upper case character that indicates the observation method (s) included in the
file.
L for only observations using the legacy methods/definitions
C for only observations using the common observation methods/definitions
B for both legacy and common observation data
vv indicates the version of the data format contained in the file
the current value is 01
yyyy is the four digit year for the observation
mm is the two digit month. Values less than 10 have a leading 0 (January is 01, not 1)
dd is a placeholder for the two digit day, with leading zero if less than 10.
For files containing more than one day, like meteorology, the dd value is 00
This is for future compatibility with other common observations that could be in daily
files
ff is a two digit indicator to support multiple files for a day or month that have arbitrary
divisions
o 00 is the default meaning that the file contains the entire period indicated in
yyyymmdd.
o Divided files would increment from 01.
o For example, weekly files for April 2015 would be named
sssMETwww_vv_20150400_01.csv, sssMETwww_vv_20150400_02.csv, etc.
.csv indicates a comma separated file
The underscores in the file name facilitate human reading and avoid potential problems with
handling of file names containing spaces. Likewise, the site acronym is in lower case to visually
distinguish it from the upper case MET.
Examples:
Archbold common observatory station met data with one file written during April 2015 containing
both legacy and common values:
absMET000B_01_20150400_00.csv
Future full usage: Archbold, weather station 3, two files per day, April 15 2015
absMET003B_01_20150415_01.csv and absMET003_01_20150415_02.csv
Archbold common observatory met data written duringApril 2018 when file format version 7 is
used containing only the common values:
absMET000C_07_20180400_00.csv
Using the same file naming for Hydro data from Archbold written during April 2015
absHYD00C_01_20150400_00.csv
Version 2.0 15 September 29, 2015
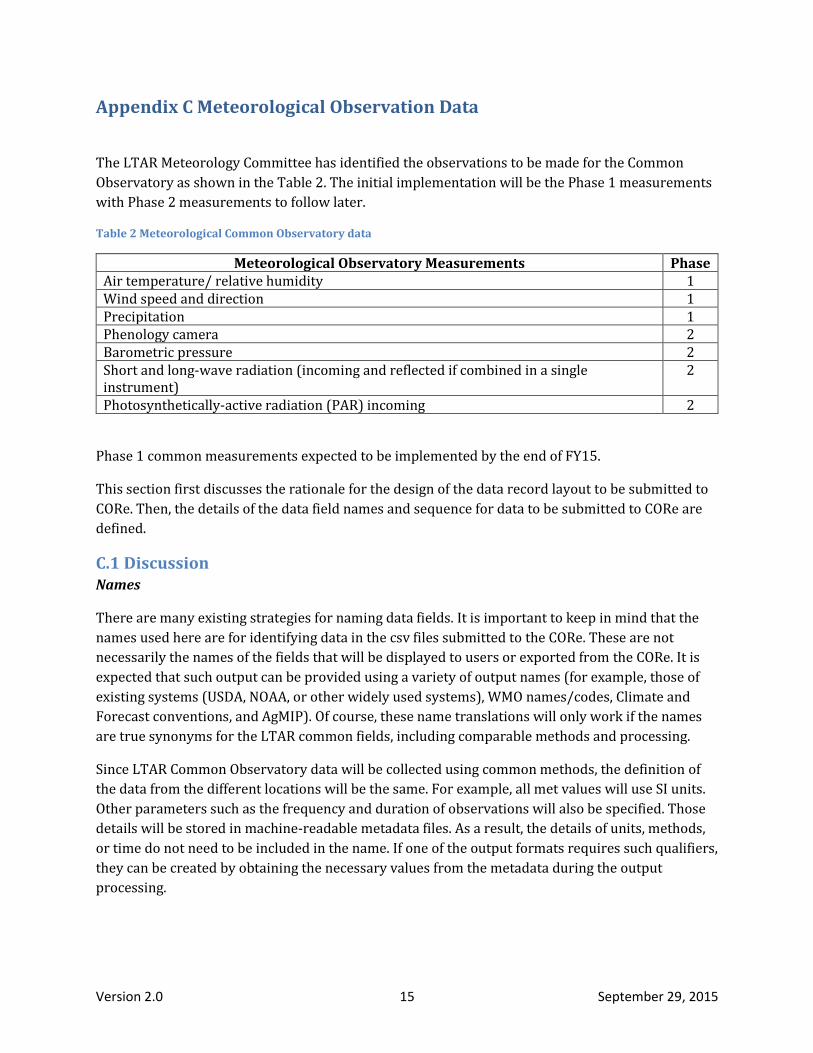
Appendix C Meteorological Observation Data
The LTAR Meteorology Committee has identified the observations to be made for the Common
Observatory as shown in the Table 2. The initial implementation will be the Phase 1 measurements
with Phase 2 measurements to follow later.
Table 2 Meteorological Common Observatory data
Meteorological Observatory Measurements Phase Air temperature/ relative humidity 1 Wind speed and direction 1 Precipitation 1 Phenology camera 2 Barometric pressure 2 Short and long-wave radiation (incoming and reflected if combined in a single instrument)
2
Photosynthetically-active radiation (PAR) incoming 2
Phase 1 common measurements expected to be implemented by the end of FY15.
This section first discusses the rationale for the design of the data record layout to be submitted to
CORe. Then, the details of the data field names and sequence for data to be submitted to CORe are
defined.
C.1 Discussion Names
There are many existing strategies for naming data fields. It is important to keep in mind that the
names used here are for identifying data in the csv files submitted to the CORe. These are not
necessarily the names of the fields that will be displayed to users or exported from the CORe. It is
expected that such output can be provided using a variety of output names (for example, those of
existing systems (USDA, NOAA, or other widely used systems), WMO names/codes, Climate and
Forecast conventions, and AgMIP). Of course, these name translations will only work if the names
are true synonyms for the LTAR common fields, including comparable methods and processing.
Since LTAR Common Observatory data will be collected using common methods, the definition of
the data from the different locations will be the same. For example, all met values will use SI units.
Other parameters such as the frequency and duration of observations will also be specified. Those
details will be stored in machine-readable metadata files. As a result, the details of units, methods,
or time do not need to be included in the name. If one of the output formats requires such qualifiers,
they can be created by obtaining the necessary values from the metadata during the output
processing.

Version 2.0 16 September 29, 2015
For legacy values, the use of SI units are required. By definition, the legacy values will have
variations in methods. Again, those are also included in the site-specific machine-readable
metadata.
Names are written without spaces, periods, underscores or other special characters. The first letter
of each word or part of the name is in upper case. For example, AirTemperature, not
airtemperature, air_Temperature, TempAir, etc.. This allows easy creation of the file by a wide
variety of applications and programming languages that have restrictions on the types of characters
allowed in field names.
Short, simple names that will display nicely in columns (in Excel, etc.) are preferred over names
that have distinguishing characters at the end of the names. This is largely aesthetic but it can make
displays of many columns easier to use and less likely to be confused.
Missing Values
Any values that are not provided will be represented in the record layout as no space or one space.
Within the comma separated record, this will appear as , , or ,, For example, a record with the third
value missing would be expressed as either of these (with or without a space): 11,22,,44
11, 22, , 44
There is no special numerical value to indicate missing so that subsequent processing does not have
to know that particular value to produce correct statistics. Internally, missing data will be stored as
nulls, which are easily distinguished from zero.
Phase 2 Observations
The current design includes meteorology observations (e.g., radiation) that are in the second phase
of met data priorities. Values for these observations using legacy methods will be accepted before
the common methods are defined. This decision was made to reduce the number of predictable
changes in the record layout. In other words, programs or scripts written now can include
parameters that are not yet available.
Observation Timing
The Met Committee is discussing sampling time period, sampling interval, and aggregation periods
for the observations. The key factors are the dynamics of the parameter being measured, and the
time constant of the sensors and how they interact to affect the durations considered to be
instantaneous17. The current plan is for four data records per hour with timestamps every 15
minutes.
17 See WMO Guide to Meteorological Instruments and Methods of Observation, available at https://www.wmo.int/pages/prog/www/IMOP/CIMO-Guide.html for more information on this topic.

Version 2.0 17 September 29, 2015
C.2 Meteorology Data Fields and Format The fields to be included in the data submitted to the CORe are identified in Table 3. This is a
preliminary design which will be updated as details for the Met Committee refines methodological
and temporal issues.

Version 2.0 18 September 29, 2015
Table 3 LTAR meteorology data submission format
Name Units Definition Notes LTARSiteAcronym code Selected from
standard list 3-5 characters
StationID code Unique number identifying station at site
3 digit integer with leading zeros
DateTime Local standard time with UTC offset
The date and time at the end of the observation period
ISO8601 format YYYY-MM-DDTHH:MM:SS-nn:nn where nn:nn is the offset from UTC expressed in hours:minutes
RecordType Code L = legacy (site-specific definition) C = Common observation protocol
Site-specific metadata for the observation protocol is required to define legacy.
AirTemperature Degrees C WindSpeed m/s WindDirection Degrees Azimuth measured
from true north
RelativeHumidity percent Precipitation mm Liquid precip
Phase 2 AirPressure kPa PAR µ mol m-2 s-1 ShortWaveIn W m-2 (totals in kJ m-2) Unclear if Met
committee wants total or instantaneous
LongWaveIn W m-2 (totals in kJ m-2) Unclear if Met committee wants total or instantaneous
BatteryVoltage Volts DC Voltage supplied to the data logger if available
Used for logger health monitoring and QC
LoggerTemperature Degrees C Internal temperature of the data logger if available
Used for logger health monitoring and QC
BatteryVoltage and LoggerTemperature have been included since these values are typically
provided by the data loggers and provide troubleshooting and QC information.

Version 2.0 19 September 29, 2015
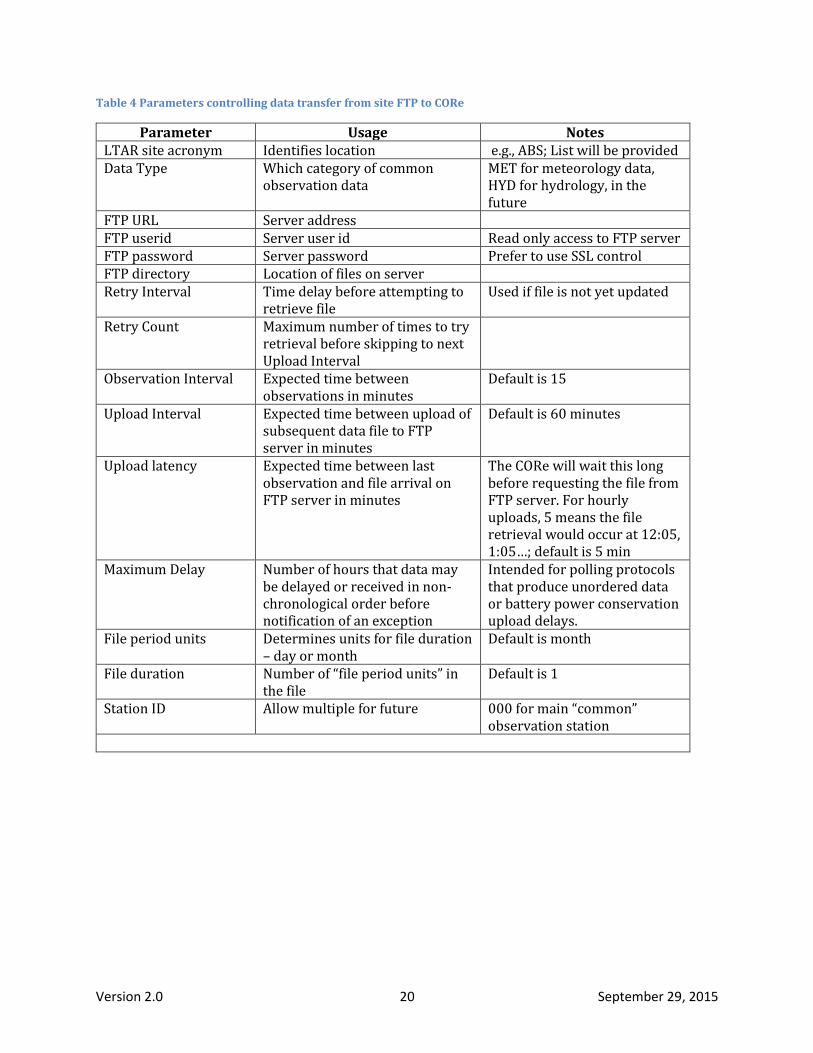
Appendix D CORe Data Receipt Details Periodically, the CORe will retrieve data from the LTAR site FTP server using secure FTP. To avoid
unnecessary data transmission, only new/changed data file(s) will be downloaded. This detection
will be based upon the timestamp of the file on the FTP server and/or the value in the check sum
file on the FTP server.
Various parameters will be maintained for this data retrieval process in the CORe. These are not
directly visible to the LTAR sites but can improve transfer efficiency and handle variability between
LTAR sites. The parameters will default to values appropriate for hourly download of observations
stored in monthly meteorology data files. Table 4 provides the details. These parameters are
intended to also support other data areas (hydrology, eddy flux…) and may not be fully
implemented for this initial system.
Correctly identifying new data in the csv file is a critical function for the CORe. Multiple checks are
performed to prevent and detect errors. Each time a file is processed, the CORe keeps the count of
records processed and the data in the last record. Those two pieces of information allow the CORe
to quickly skip over the records that have already been processed.
Storing the data in the last record from the previous version of the file is an extra level of
protection. It could detect gross unexpected changes to the file such as accidentally overwriting a
file or a program bug that caused a record to be added to the file somewhere other than at the end.
These types of errors are very unlikely to occur after the processing logic has been tested. However,
if undetected they could cause significant data corruption. The test is much easier to perform than
is the potential recovery effort.
For example, if the file contained 21 records (header plus 5 hours of 15-minute data), the CORe
would store the number 21 and the contents of record 21. After the next successful download of the
file it would contain a larger number of records. (25 records would be expected if four more 15-
minute records were added), The CORe would read until it got to record 21, verify that the stored
contents of record 21 match the current contents of record 21, and then add records 22-25 to the
database.
As a final check that all data in the csv file have been stored in the database, periodically, each
record in the file can be read and verified that a corresponding record is in the database.
Version 2.0 20 September 29, 2015
Table 4 Parameters controlling data transfer from site FTP to CORe
Parameter Usage Notes LTAR site acronym Identifies location e.g., ABS; List will be provided Data Type Which category of common
observation data MET for meteorology data, HYD for hydrology, in the future
FTP URL Server address FTP userid Server user id Read only access to FTP server FTP password Server password Prefer to use SSL control FTP directory Location of files on server Retry Interval Time delay before attempting to
retrieve file Used if file is not yet updated
Retry Count Maximum number of times to try retrieval before skipping to next Upload Interval
Observation Interval Expected time between observations in minutes
Default is 15
Upload Interval Expected time between upload of subsequent data file to FTP server in minutes
Default is 60 minutes
Upload latency Expected time between last observation and file arrival on FTP server in minutes
The CORe will wait this long before requesting the file from FTP server. For hourly uploads, 5 means the file retrieval would occur at 12:05, 1:05…; default is 5 min
Maximum Delay Number of hours that data may be delayed or received in non-chronological order before notification of an exception
Intended for polling protocols that produce unordered data or battery power conservation upload delays.
File period units Determines units for file duration – day or month
Default is month
File duration Number of “file period units” in the file
Default is 1
Station ID Allow multiple for future 000 for main “common” observation station

Version 2.0 21 September 29, 2015
Parameter Usage Notes System maintained values
Last file name Used to detect new data System maintained Last file timestamp Used to detect new data Last file length (bytes) Used to detect new data Last file record count Used to detect new data Last file hash Used to detect new data Last record timestamp For unordered data, may not be
the highest value or most recently received record
Last record data A copy of the last data record Used to skip to that point in the file to find new records. Used in conjunction with Last file record count.
Enable connection log Records information on connection, retries, etc., to help tune retrieval
Initially set to True but set to false once tuning is complete
Last error Most recent error encountered Occurs even if logging is not enabled
Last error timestamp Time and date of most recent error

Version 2.0 22 September 29, 2015
Appendix E Meteorology Data Format Examples
The following examples are based on real 15-minute observations from a non-USDA site for two
days in July 2009. They have been assigned to the virtual “NAL” LTAR site. Following the file
naming convention, the file is named nalMET000L_01_20090710_00.csv, since it the first (and only)
data file for July 2009. Hourly ingest by the CORe is assumed.18
D.1 Normal Observations The first two records are:
LTARSiteAcronym,StationID,DateTime,RecordType,AirTemperature,WindSpeed,WindDi
rection,RelativeHumidity,Precipitation,AirPressure,PAR,ShortWaveIn,LongWaveIn
,BatteryVoltage,LoggerTemperature
NAL,000,2009-07-10T00:00-05:00,L,18.4,0.6,127,21,0,102.4,0,,,12.93,20.40
This is interpreted as follows:
LTARSiteAcronym is NAL StationID is 000, indicating this is the common observatory site for NAL DateTime is Midnight, July 10, 2009 which is -5 hours from UTC (this is the proper offset for
EST) RecordType is L for legacy AirTemperature is 18.5 degrees Celsius WindSpeed is 0.6 meters per second WindDirection is 125 degrees (compass, 0 = true north) RelativeHumidity is 21% Precipitation is 0 AirPressure is 102.4 kPa PAR is 0 ShortWaveIn is missing LongWaveIn is missing BatteryVoltage is 12.93 volts LoggerTemperature is 20.40 degrees Celsius
Note that units of measure are those that are defined by the Meteorology Committee for the
common observatory. Legacy values must use those units, but other aspects of the observation can
be different (e.g., instantaneous vs. average values).
18 Since the time zone for the station is known (and included in the UTC offset for the DateTime data element), correct processing will occur regardless of the time zone for CORe. To avoid confusion in the examples below, assume that the CORe and station time zones are the same.

Version 2.0 23 September 29, 2015
After the 1:00 AM data are collected, the file transferred to the FTP site would contain:
LTARSiteAcronym,StationID,DateTime,RecordType,AirTemperature,WindSpeed,WindDi
rection,RelativeHumidity,Precipitation,AirPressure,PAR,ShortWaveIn,LongWaveIn
NAL,000,2009-07-10T00:00-05:00,L,18.5,0.6,125,21,0,102.4,0,,
NAL,000,2009-07-10T00:00-05:00,L,18.4,0.6,127,21,0,102.4,0,,,12.93,20.40
NAL,000,2009-07-11T00:15-05:00,L,18.3,0.5,122,23,0,102.4,0,,,12.50,20.30
NAL,000,2009-07-10T00:45-05:00,L,18,0.3,102,22,0,102.4,0,,,13.34,20.00
NAL,000,2009-07-10T01:00-05:00,L,17.6,0.3,77,23,0,102.4,0,,,12.49,19.60
NAL,000,2009-07-10T01:15-05:00,L,17.4,1.2,87,24,0,102.4,0,,,12.14,19.40
After the 2:00 AM data are collected, the file transferred to the FTP site would contain:
LTARSiteAcronym,StationID,DateTime,RecordType,AirTemperature,WindSpeed,WindDi
rection,RelativeHumidity,Precipitation,AirPressure,PAR,ShortWaveIn,LongWaveIn
NAL,000,2009-07-10T00:00-05:00,L,18.4,0.6,127,21,0,102.4,0,,,12.93,20.40
NAL,000,2009-07-11T00:15-05:00,L,18.3,0.5,122,23,0,102.4,0,,,12.50,20.30
NAL,000,2009-07-10T00:45-05:00,L,18,0.3,102,22,0,102.4,0,,,13.34,20.00
NAL,000,2009-07-10T01:00-05:00,L,17.6,0.3,77,23,0,102.4,0,,,12.49,19.60
NAL,000,2009-07-10T01:15-05:00,L,17.4,1.2,87,24,0,102.4,0,,,12.14,19.40
NAL,000,2009-07-10T01:30-05:00,L,17.3,0.8,92,24,0,102.4,0,,,11.52,19.30
NAL,000,2009-07-10T01:45-05:00,L,17.2,0.6,85,24,0,102.4,0,,,12.77,19.20
NAL,000,2009-07-10T02:00-05:00,L,17.1,0.5,331,26,0,102.4,0,,,12.58,19.10
After the 3:00 AM data are collected, the file transferred to the FTP site would contain:
LTARSiteAcronym,StationID,DateTime,RecordType,AirTemperature,WindSpeed,WindDi
rection,RelativeHumidity,Precipitation,AirPressure,PAR,ShortWaveIn,LongWaveIn
NAL,000,2009-07-10T00:00-05:00,L,18.4,0.6,127,21,0,102.4,0,,,12.93,20.40
NAL,000,2009-07-11T00:15-05:00,L,18.3,0.5,122,23,0,102.4,0,,,12.50,20.30
NAL,000,2009-07-10T00:45-05:00,L,18,0.3,102,22,0,102.4,0,,,13.34,20.00
NAL,000,2009-07-10T01:00-05:00,L,17.6,0.3,77,23,0,102.4,0,,,12.49,19.60
NAL,000,2009-07-10T01:15-05:00,L,17.4,1.2,87,24,0,102.4,0,,,12.14,19.40
NAL,000,2009-07-10T01:30-05:00,L,17.3,0.8,92,24,0,102.4,0,,,11.52,19.30
NAL,000,2009-07-10T01:45-05:00,L,17.2,0.6,85,24,0,102.4,0,,,12.77,19.20
NAL,000,2009-07-10T02:00-05:00,L,17.1,0.5,331,26,0,102.4,0,,,12.58,19.10
NAL,000,2009-07-10T02:15-05:00,L,16.8,0.3,21,27,0,102.4,0,,,12.03,18.80
NAL,000,2009-07-10T02:30-05:00,L,16.6,0.5,353,28,0,102.4,0,,,12.50,18.60
NAL,000,2009-07-10T02:45-05:00,L,16.4,0.2,350,28,0,102.4,0,,,13.12,18.40
NAL,000,2009-07-10T03:00-05:00,L,16.3,0.2,8,29,0,102.4,0,,,11.68,18.30

Version 2.0 24 September 29, 2015
D.2 Abnormal Observations This section illustrates variations in the data record that could result from sensor or other failures.
These are illustrated using the first data record in the file. In all examples, additional spaces can be
included before or after a comma without changing the meaning or validity of the data record.
The first two records are:
LTARSiteAcronym, StationID, DateTime, RecordType, AirTemperature, WindSpeed,
WindDirection, RelativeHumidity, Precipitation, AirPressure, PAR,
ShortWaveIn, LongWaveIn, BatteryVoltage, LoggerTemperature
NAL, 000, 2009-07-10T00:00-05:00, L, 18.4, 0.6, 127, 21, 0, 102.4, 0, , ,
12.93, 20.40
Missing Air Temperature
NAL,000,2009-07-10T00:00-05:00,L,,0.6,127,21,0,102.4,0,,,12.93,20.40
Missing Wind Data
NAL,000,2009-07-10T00:00-05:00,L,18.4,,127,21,0,102.4,0,,,12.93,20.40
Unreasonable PAR Value
NAL,000,2009-07-10T00:00-05:00,L,18.4,0.6,127,21,0,102.4,0,850,,12.93,20.40
Note: The initial values submitted to the CORe are always provisional and have not been processed
by either automated or manual QC review. If the met station reported high PAR values in the middle
of the night, those data will be submitted as is.
D.3 Processing Times The timing of the CORe’s obtaining data from the LTAR site FTP servers is described in Appendix C.
The examples here use the default configuration of the site adding 4 records to the file each hour
and transferring the file to their FTP server within 5 minutes of the top of the hour. Like the
examples, above, times are in standard time for the station. The same sample data file is used.
Normal Processing
At 1:05 AM, the CORe will connect to the site’s FTP server and check for an update file (as described
in section 2.2.4). Assuming the connection succeeded and there is an updated file, it will be
downloaded. This file corresponds to the 1:00 AM file above.

Version 2.0 25 September 29, 2015
If the connection attempt at 1:05 fails to retrieve an updated file, the CORe will try again after the
Retry Interval (5 minutes) has occurred (1:10) and after every Retry Interval after that until the
Retry Count limit (3) occurs so 1:20 would be the last attempt until the next hour.19
Delayed File
If the CORe is unable to obtain an updated file from the FTP server, the next successful file transfer
will contain all of the data records since the file is cumulative (new records are added at the end of
the file). For example, the 3:00AM file is the same regardless of whether the 2:00AM file transfer
was successful.
Non-chronological Records
Some communications protocols between the data logger and field office may result in receipt of
data records not in same sequence as the observations were made. There may be significant delays
until the data logger is able to complete transmission of a queue of data. The process of writing data
from the data logger to the csv file is the same regardless of whether or not the data are in the same
sequence as the observations. Data are written to the csv file in the sequence in which they were
received (which does not necessarily match the observation sequence). Data received after the
duration limit for a csv file (i.e., after the end of the month) are written to the csv file for the new
month.
19 Upload Latency, Retry Interval, and Retry Count can be specific to each LTAR site to best match the local processing timeline.