Embed Size (px)
Citation preview

LSO-000-286-1410
F-I ,,o,.,,o,:,oo,<,:T,OO,t,:,:,INTEGRATION STUDY& TECHNOLOGY OFFICE J
/
\
LRBI STUDY SYNOPSISVOLUME II OF V
FINAL REPORTPHASE I
81005-01 BL3
/DY2
NAS10-11475
NOVEMBER 1988
"_'.._'Locl_eedSpace Operations Company-
https://ntrs.nasa.gov/search.jsp?R=19910020941 2020-07-29T16:35:30+00:00Z

LSO-000-286-1410
LIQUID ROCKETINTEGRATION
BOOSTERSTUDY
VOLUME II OF VSTUDY TASK SUMMARY
KENNEDY SPACE CENTERNAS10-11475
PREPARED BY:
LOCKHEED SPACE OPERATIONS COMPANY
Gordon E. Artley
Lockheed Study Manager
W. J. Dickinson
NASA Study Manager
L.P. Scott
Lockheed Deputy Study Manager
81117o01B NOVEMBER 1988CK1

LRBI FINAL REPORT
CONTENTS GUIDE
VOLUME I - EXECUTIVE SUMMARY
VOLUME 11-STUDY SUN[MARY
SECTION 1: LRBI Study Synopsis - An assessment of the study objectives, approach,
analysis, and rationale. The study findings and major conclusions are presented.
SECTION 2: Launch Site Plan - An implementation plan for the KSC launch site integra-
tion of LRB ground processing. The plan includes details in the areas of facility activa-
tions, operational schedules, costs, manpower, safety and environmental aspects.
SECTION 3: Ground Operatiorl_ Cost Model (GOCM) - The updating and enhancement
of this NASA provided computer-based costing model are described. Its application to
LRB integration and instructions for modification and expanded use are presented.
SECTION 4: Cost - Summary and Analysis of KSC Costs.
VOLUIVlE HI -STUDY PRODUCTS
The study output has been developed in the form of nineteen derived study products.
These are presented and described in the subsections of this volume.
VOLUME IV - REVIEWS AND PRESENTATIONS
The progress reviews and oral presentations prepared during the course of the study are
presented here along with facing page text where available.
VOLUME V - APPENDICES
Study supporting data used or referenced during the study effort are presented and indexed
to the corresponding study products.

LIST OFABBREVIATIONS AND ACRONYMS
ADP
A&E
AF
AI
AL
AL-Li
ALS
ALT
AOA
AOPL
AP
APU
ARF
ARTEMIS
ASRM
ASSY
ATO
ATP
AUTO
AWCS
Automatic Data Processing
Architecrual and Engineering
Air Force
Artificial Intelligence
Aluminum
Aluminum Lithium Alloy
Advanced Launch Systems
Alternate
Abort Once Around
Advanced Order Parts List
Auxiliary Platform
Auxiliary Power Unit
Assembly and Refurbishment Facility
Accounting, Reporting, Tracking, & Evaluation Management - Information
System
Advanced Solid Rocket Motor
Assembly
Abort to Orbit
Authority to Proceed
Automatic
Automated Work Control System
BITE
BLOW
BOC
BSM
Built-in Test Equipment
Booster LiRoff Weight
Base Operations Contractor
Booster Separation Motor
ii

C
CAD
CAtS
CCAFS
CCB
CCC
CCF
CCMS
CDDT
CDR
CEC
CER
CG
CH4
CITE
CM
C/O
CONC
C ofF
COMM
CPF
CPF2
CPF3
CPM
CPU
CR
Cryo
c/s
CT
CY
Celsius
Computer Aided Design
Computer Aided Logistics System
Cape Canaveral Air Force Station
Change Control Board
Complex Control Center
Compressor Converter Facility
Checkout, Control and Monitor Subsystem
Countdown Demonstration Test
Critical Design Review
Core Electronics Contractor
Cost Estimating Relationships
Center of Gravity
Methane
Cargo Integration Test Equipment
Construction Management
Configuration Management
Closeout
Checkout
Concrete
Cost of Facilities
Communications
Cost per Foot
Cost per Square Foot
Cost per Cubic Foot
Critical Path Management
Central Processing Unit
Control Room
Cryogenic
Contractor Support
Crawler Transporter
Calendar Year
..°
11/

dBase
dc
DDS
DDT&E
DE
DEQ
DFRF
DFI
DHC
DIST
DOD
DOS
DOT
Data Base - Software Program
Direct Current
Data Processing System
Design, Development, Test & Engineering
Design Engineering
Direct Equivalent Head Count
Dryden Flight Research Facility.
Development Flight Instrumentation
Direct Head Count
Distributor
Department of Defense
Disk Operating System
Department of Transportation
ECLSS
ECS
EL
ELS
ELV
EMA
EMERG
EPA
EPDC
EPL
ET
ET-HPF
ETR
Environmental Control & Life Support System
Environmental Control System
Elevation
Eastern Launch Site
Expendable Launch Vehicle
Electrical Mechanical Actuator
Emergency
Environmental Protection Agency
Electrical Power and Distribution Control
Emergency Power Level
Extemal Tank
External Tanks - Horizontal Processing Facility
Eastem Test Range
F
FAA
F&D
FEP
FLT
Fahrenheit
Federal Aviation Administration
Fill & Dram
Front End Processor
Flight
iv

FMEA/CIL
FRF
FRSC
ft
FSS
FWD
FY
Failures Modes & Effects Analysis/Critical Items List
Flight Readiness Firing
Forward Reaction Control System
Feet
Fixed Service Structure
Forward
Fiscal Year
G&A
G,g
GAL
GDSS(GD)
GEN
GFE
GH2
GHe
GLOW
GLS
GN2
GN&C
GOAL
GOX
GOCM
GPC
GPM
GRD
GSE
GSFC
GTSI
GUCP
General and Administrative
Acceleration of Gravity
Gallons
General Dynamics Space Systems
Generator
Govemment Furnished Equipment
Gaseous Hydrogen
Gaseous Helium
Gross Liftoff Weight
Ground Launch Sequencer
Gaseous Nitrogen
Guidance, Navigation & Control
Ground Operations Aerospace Language
Gaseous Oxygen
Ground Operations Cost Model
General Purpose Computer
Gallons Per Minute
Ground
Ground Support Equipment
Goddard Space Flight Center
Grumman Technical Services, Inc.
Ground Umbilical Carrier Plate

H2
HAZGAS
H.B
HDP
He
HIM
HMF
HPF
HQ
HVAC
tTW
HYD
HYPER
Hz
Hydrogen
Hazardous Gas
High Bay
Holddown Post
Helium
Hardware Interface Module
Hypergolics Maintenance Facility
Horizontal Processing Facility
Headquarters
Heating, Ventilation, and Air Conditioning
Hardware
Hydraulic(s)
HypergoLic
Hertz
IBM
ICD
I/F
ILC
INST
INTEG
IOC
IPR
IRD
IUS
International Business Machines
Interface Control Document
Interface
Initial Launch Capability
Instrumentation
Integration
Initial Operational Capability
Intemm Problem Report
Interface Requiremems Document
Interial Upper Stage
JSC Johnson Space Center
vi

K
K
KLB
KSC
KW
Thousands
Kelvin
Thousands of Pounds
Kennedy Space Center
Kilowatt
LAC
LC-39
LCC
LCC
LCH4
LESC
LETF
LEO
LH2
Li
LN2
LNG
LO2
LOX
LPS
LRB
LRB-HPF
LRBI
LRU
LSE
LSOC
LUT
Launch Accessories Contractor
Launch Complex 39
Life Cycle Cost
Launch Control Center
Liquid Methane
Lockheed Engineering and Science Company
Launch Equipment Test Facility
Low Earth Orbit
Liquid Hydrogen
Lithium
Liquid Nitrogen
Liquid Natural Gas
Liquid Oxygen
Liquid Oxygen
Launch Processing System
Liquid Rocket Booster
Liquid Rocket Booster Horizontal Processing Facility
Liquid Rocket Booster Integration
Line Replaceable Unit
Launch Support Equipment
Lockheed Space Operations Company
Launcher Umbilical Tower
MAX
MECO
MDAC
MIL
Maximum
Main Engine Cutoff
McDonnell Douglas Astronautics Company
Military
vii

MIN
MLP
MMC
MMH
MOD
MOU
MP
MPS
MSBLS
MSFC
MST
MTI
Mininluln
Mobile Launch Platform
Martin-Marietta Corporation
Mono Methyl Hydrazine
Mission Operations Directorate
Memorandum of Understanding
Manpower
Main Propulsion System
Microwave Scanning Beam Landing System
Marshall Space Flight Center
Mobile Service Tower
MortonThiokol, Inc.
N2
NASA
NDE
NDT
NF
N202
NPL
NPSH
NRC
NSTL
NSTS
NWS
Nitrogen
National Aeronautics and Space Administration
Non-Destructive Evaluation
Non-Destructive Test
Nose Fairing
Nitrogen Tetroxide
Nominal Power Level
Not positive Suction Head
National Research Council
National Space Technology Laboratories (Stennis Space Center)
National Space Transportation System
National Weather Service
OAA
OIS
OJT
O&M
OMD
Orbiter Access Arm
Operational Intercommunications System
On-the-job Training
Operations and Maintenance
Operating and Maintenance Documentation
.°.
VIII

OMI
OMRF
OMRSD
OMS
OPF
OPS
OMBUU
ORB
ORI3
ORI
OSHA
OTV
Operations and Maintenance Instruction
Orbiter Maintenance and Refurbishment Facility
Operational Maintenance Requirements and Specifications Document
Orbital Maneuvering System
Orbiter Processing Facility
Operations
Orbiter Mid Body Umbilical Unit
Orbiter
Operational Readiness Date
Operational Readiness Inspection
Occupational Safety & Health Administration
Operational Television
PA
PAWS
P/A
Pc
PC
PCM
PCR
PDR
PER
PGHM
PIC
PIF
P/L
PMM
PMS
PO
POP
PR
PRACA
PRCBD
PubLic Affairs
Pan Am World Services, Inc.
Propulsion/Avionics Module
Engine Combustion Chamber Pressure
Personal Computer
Pulse Code Modulator
Payload Changeout Room
Preliminary Design Review
Preliminary Engineering Report
Payload Ground Handling Mechanism
Pyro Initiator Controller
Payload Integration Facility
Payload
Program Model Number
Permanent Measuring System
Purchase Order
Programs Operations Plan
Problem Report
Problem Reporting and Corrective Action
Program Review Control Board Directive
ix


PRC
PRD
PRESS
PROP
PRR
PSI
psia
psig
PSP
PT&I
P&W
Planning Research Corporation
Program Requirements Document
Pressure, pressurization
Propellant
Preliminary Requirements Review
Pounds Per Square Inch
Pounds Per Square Inch Absolute
Pounds Per Square Inch Gage
Process Support Plan
Payroll Taxes and Insurance
Pratt & Whitney Company
Q
QA
Q-Alpha
Qc
QD
QTY
Dynamic Pressure
Quality Assurance
Dynamic Pressure x Angle of Attack
Quality Control
Quick Disconnect
Quantity
R
RAM
RCS
R&D
RF
RFP
RIC
ROM
RP-I
RPL
RPS
RPSF
Ranking
Random Access Memory
Reaction Control System
Research and Development
Radio Frequency
Request for Proposal
Rockwell International Corporation
Rough Order of Magnitute
Propellant (Kerosene Related Petroleum Product)
Rated Power Level
Record and Playback System
Rotation, Processing & Surge Facility
X

R/R
RSLS
RSS
R&T
RTLS
Remove/Replace
Redundant Set Launch Sequencer
Rotating Service Structure
Research and Technology
Remm to Launch Site
SAIL
SAB
SCAPE
SDI
SDV
SEB
SEC
SGOS
SIES
SIT
SLC-6
SLF
SOH
-SOW
SPC
SPF
SPDMS
SRB
SRM
SRSS
SR&QA
SSC
SSME
SSV
STD
STS
Shuttle Avionics Integration Laboratory
Shuttle Assembly Building
Self-Contained Atmospheric Protective Ensemble
Strategic Defense Initiative
Shuttle Derivative Vehicle
Source Evaluation Board
Second(s), Secondary
Shuttle Ground Operations Simulator
Supervision, Inspection & Engineering Services
Shuttle Integrated Test
System Integrated Test
Shuttle Launch Complex No.6
Shuttle Landing Facility
Spray On Foam Insulation
Statement of Work
Shuttle Processing Contractor
Software Production Facility
Shuttle Processing Data Management System
Solid Rocket Booster
Solid Rocket Motor
Shuttle Range Safety System
Safety, Reliability and Quality Assurance
Stennis Space Center (NSTL)
Space Shuttle Main Engine
Space Shuttle Vehicle
Standard
Space Transportation System
xi

SUBSTA
SW
S/W
Substation
Switch
Software
TAL
TBD
T&C/O
TFER
T-0
TOPS
TPS
TSM
TTV
TVA
TVC
T/W
TYP
Transatlantic Landing
To Be Determined
Test and Checkout
Transfer
Liftoff Time
Technical Operating Procedures
Thermal Protection System
Tail Service Mast
Termination/Test/Verification
Thrust Vector Activator
Thief Vector Control
Thrust to Weight Ratio
Typical
ULCE
UMB
UPS
USAF
USS
Unified Life Cycle Engineering
Umbilical
Unintegrated Power System
United States Air Force
Utility Substation
V
VAB
VAFB
VIB
VLS
VPF
Volt(s)
Vehicle Assembly Building
Vandenberg Air Force Base
Vertical Integration Building
Vandenberg Launch Site
Vertical Processing Facility
xii

WAD
WBS
WIP
WSMR
WTR
Work AuthorizationDocument
Work BreakdownStructure
Work in Progress
WhiteSandsMissile Range
Western Test Range
.oo

VOLUME II
TABLE OF CONTENTS
SECTION I
1.1
1.1.1
1.1.2
1.1.3
1.1.4
1.1.4.1
1.1.4.2
1.2
1.2.1
1.2.2
1.2.3
1.2.4
1.2.5
1.2.6
1.2.7
1.3
1.4
1.4.1
1.4.2
1.3
1.5.1
1.6
1.6.1
1.6.2
1.6.3
1.6.4
1.6.5
1.7
1.7.1
1.7.2
BACKGROUND
MSFC Phase-A LRB Study
KSC LRBI Study
JSC LRB Integration
LRB Project Team
Team Members
Technical Working Group
LRBI STUDY OBJECTIVES
Impacts (Operations and Facilities)
Scenarios
Design Recommendations
Operationally Efficient LRB System
Ground Operations Cost Model
LSE/GSE
Launch Site Support Plan
KEY STUDY FINDINGS
TECHNICAL APPROACH/STUDY PLAN
Task Breakdown/Interrelationships
Task Schedule/Milestones
STUDY PRODUCTS
Task/Product Relationships
MSFC PHASE-A SELECTED CONFIGURATIONS
GDSS/MMC LRB Design Approach
Configuration Details
Launch Site Design Recommendations
KSC Requirements Checklist
LRB Design Requirements Assessment
CONCLUSIONS
Processing Scenarios
Impacts To On-Going Activities
!-I
I-!
1-3
1-3
1-3
1-3
1-6
1-6
1-6
1-6
1-8
1-8
1-8
1-8
1-9
1-9
1-12
1-12
1-16
1-16
1-16
1-18
1-18
1 - 20
1 -27
1 - 29
1 - 29
1 - 33
1 - 33
1 - 35
liv

1.7.2.1
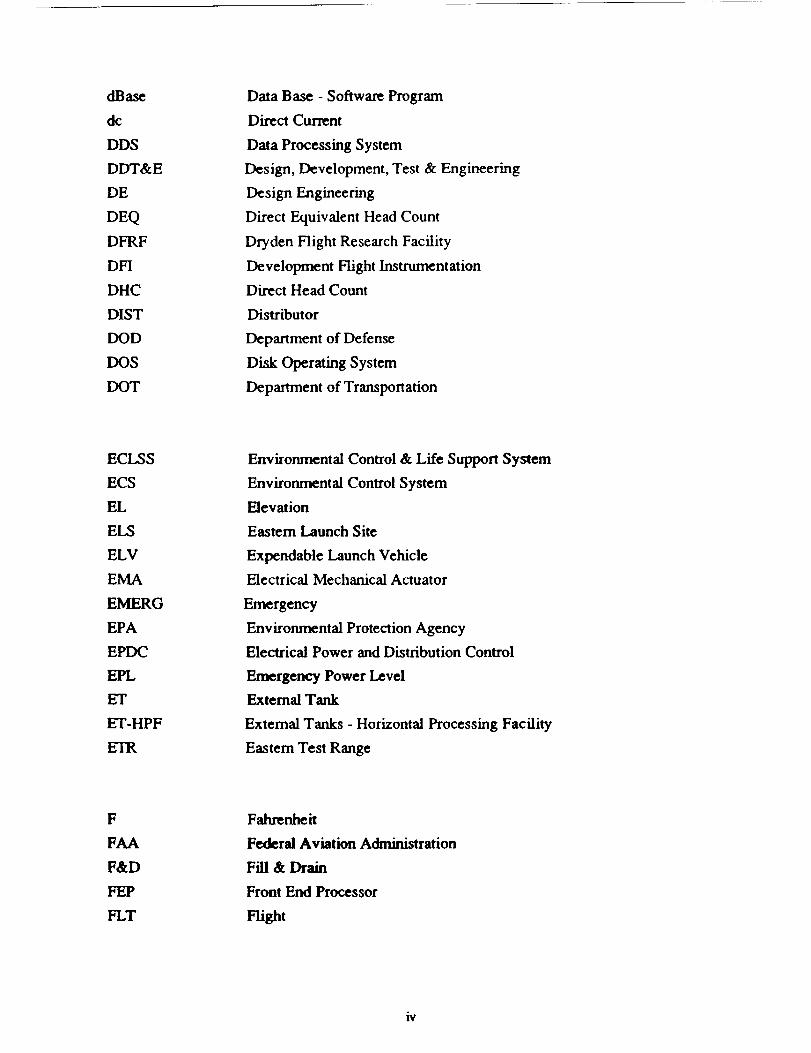
1.7.2.2
1.7.2.3
1.7.3
Facility Activation
Transition
Operational Phase
Major Issues for Follow-On Study
1 -37
1 -41
1 -43
1 - 43
SECTION II
2.1
2.2
2.3
2.3.1
2.3.2
2.4
2.4.1
2.4.2
2.4.3
2.5
2.5.1
2.5.1.1
2.5.1.2
2.5.1.3
2.5.1.4
2.5.1.5
2.5.1.6
2.5.2
2.6
2.6.1
2.6.2
2.6.3
2.6.4
2.7
2.7.1
2.7.2
2.7.3
2.7.4
2.8
OBJECTIVE
APPROACH AND RATIONALE
GROUNDRULES AND IMPLICATIONS
Groundrules/Assumptions
Environmental and Safety Implications
IMPLEMENTATION PLAN AND PHASES
Activation Phase
Transition Phase
Operational Phase
FACILITY IMPACTS
New Construction
LRB MLP #4 and #5
ET Horizontal Processing Facility
LRB Horizontal Processing Facility
LRB Engine Shop
ET/LRB HPF Control Center/LPS
ET/LRB Processing Facility Siting
Modifications
INTERFACE REQUIREMENTS
Johnson Space Center (JSC)
Marshall Space Flight Center (MSFC)
Department of Defense (DOD)
KSC/Other
SPECIAL KSC REQUIREMENTS
SRB/LRB Joint Activities
Facility Contractor Support
LRB Launch Support Services (LSS)
Recovery Requirements
MANAGEMEN'T/MANNING
2-1
2-1
2-2
2-2
2-3
2-a,
2-8
2-8
2-9
2-9
2- 10
2- 10
2- 13
2- 14
2- 14
2- 15
2-15
2-17
2-19
2-19
2-19
2- 20
2 - 20
2 - 20
2-21
2-21
2 - 22
2 - 22
2 - 23
XV

2.8.1
2.8.1.1
2.8.2
2.8.3
2.8.4
2.8.5
2.8.6
2.9
2.9.1
2.9.2
2.9.3
2.9.4
LRB Processing
Non-SPC SRB Processing Support
NASA Operations Interface
NASA Engineering Interface
Activation Management Team
SRB Manning
LRB versus SRB
LAUNCH SITE IMPLEMENTATION COSTS
Facilities and Equipment
Recurring Material and Commodity Costs
Management/Manning Costs
Major LRB Life Cycle Costs
2 - 23
2-23
2 - 23
2 - 25
2 - 25
2 - 25
2 - 26
2 -26
_ - _7
2 - 27
"_ 33
2 - 35
SECTION III
3.1
3.1.1
3.1.2
3.1.2.1
3.1.3
3.1.4
3.1.5
3.2
3.2.1
3.2.2
3.2.2.1
3.2.2.2
3.2.3
3.2.3.1
3.2.3.2
3.2.4
3.2.5
3.2.6
3.2.7
3.2.7.1
3.2.7.2
USER'S EXPERIENCE
New User Impressions
Early Model Evaluation
Strengths and Weaknesses
Study and GOCM Development Approach
Utility Evaluation
Potential Modular Growth
CALIBRATION
Scope
Realism and Completeness
Realism
Completeness
Gross Cost Evaluation
1985 Budget (WBS) vs. GOCM Comparison
GOCM Evaluation
Ground Processing STS LRB/SRB CER Verification
Facility Cost Driver Verification
Transition
Cost Reduction Curves
Reliability and Maintainability Growth Curves
Learning Curves
3-2
3-2
3-4
3-4
3-8
3-10
3-12
3-13
3-14
3-16
3-16
3-19
3 - 22
3 -22
3 -22
3 - 25
3 - 25
3 - 25
3 - 27
3 - 27
3 - 29
xvi

3.2.7.3
3.2.7.4
3.2.8
3.2.8.1
3.3
3.3.1
3.3.1.1
3.3.1.2
3.3.2
3.3.2.1
3.3.2.2
3.4
3.4.1
3.4.2
3.4.2.1
3.4.2.2
3.4.2.3
3.4.2.4
3.4.3
3.4.4
3.4.5
3.5
3.5.1
3.5.1.1
3.5.2
Cost Reduction Curves for Ground Processing 3 - 30
Ground Processing Curve Assimilation 3 - 31
Success Oriented vs. Post 51-L 3 - 35
Applying the Ground Processing Curve 3 - 38
MODEL ENHANCEMENTS 3 - 38
Configuration 3 - 38
Baseline 3 - 39
Enhanced/Modified 3 - 40
Future Potential Enhancements 3 - 45
Short Range 3 - 45
Long Range 3 - 45
GOCM APPLICATION TO LRBI STUDY 3 - 46
Cost Estimates 3 - 46
Cost Comparison 3 - 46
LRBI Study Comparison 3 - 46
General Dynamics 3 - 46
Martin Marietta 3 - 49
NASA Planning 3 - 49
Role in LRBI 3 - 49
Trade Studies 3 - 51
Overview/Conclusions of GOCM Utility to LRBI 3 - 51
FUTURE DIRECTION 3 - 52
GOCM Recommendations 3 - 52
Recommended Statement of Work for Follow-on GOCM Development 3 - 52
Future Applications 3 - 56
SECTION IV
4.1
4.1.1
4.1.2
4.1.2.1
4.1.2.2
4.2
4.2.1
4.2.2
RECURRING COST ANALYSIS
Program Cost Significance
Cost Sensitivity
STS Sensitivity to Transition
Launch Rate Capability
NON-RECURRING COST ANALYSIS
Facility Impact and Requirements Sensitivity to Booster Diameter
Facility Impact and Requirements Sensitivity to Booster Length
4-1
4-1
4-4
4-8
4-8
4-11
4-11
4-12
xvii

4.2.3
4.3
4.3.1
4.3.2
4.3.3
4.3.4
4.3.5
4.3.6
4.4
4.4.1
4.5
4.5.1
4.5.2
4.5.3
Facility Impact and Requirements Sensitivity to Fuel
LRB COST PROJECTIONS
KSC Initial Conceptual Estimate
Initial GOCM Estimate
General Dynamics Estimate
Martin Marietta Company Estimate
KSC Detail Bottoms-up Estimate
Final GOCM Estimate
LRB COST ESTIMATE
Final LRB Cost Estimate
COST OVERVIEW
Recurring Costs in Comparative Terms
KSC Delta Booster Costs Mixed Booster Fleet vs. SRB Boosler Fleel
Final KSC LRB Cost Conclusion
4-12
4- 12
4-12
4-15
4- 15
4-15
4-15
4-15
4-16
4-16
4-16
4-18
4-19
4-19
XV'.II

VOLUME II
LIST OF FIGURES
SECTION I
1.1.1-1
1.1.3-1
1.1.4.1-1
1.2-1
1.3-1
1.4.1-1
1.4.2-1
1.5.1-1
1.6.2-1
1.6.2-2
1.6.2-3
1.6.2-4
1.6.2-5
1.6.2-6
1.6.2-7
1.6.3-1
1.6.4-1
1.6.5-1
1.7.1-1
1.7.1-2
1.7.1-3
1.7.2-1
1.7.2-2
1.7.2.2-1
Summary of MSFC Phase A LRB Findings
LRB/STS Integration by LESC/JSC
LRB Study Team Members
Study Objectives
LRBI Key Study Findings
Methodology/Study Tasks
LRB Integration Study Schedule
Study Tasks/Products Relationships
MMC Pump-Fed LO2/RP-1 Vehicle Configuration
MMC Pump-Fed LO2/RP-1 Booster Configuration
MMC Pump-Fed Vehicle Data Summary
MMC Pressure-Fed LO2/RP-1 Vehicle Configuration
MMC Pressure-Fed LO2/RP-1 Booster Configuration
MMC Pressure-Fed Vehicle Data Summary
GDSS Selected LRB Configurations-October 1988
KSC-LRB Design Recommendations
LRB Requirements Checklist Categories
LRB Design Requirements Summary
Preliminary LRB Scenario
Generic LRB Process Flow
SRB/LRB Flow Comparison
Launch Site Plan Overview
LRB Launch Site Plan Synopsis
KSC SRB to LRB Transition Plan
1-2
1-4
1-5
1-7
1-10
1-13
1-17
1-19
1 -21
1 - 22
1 - 23
1 - 24
1 - 25
1 - 26
1 -28
1 - 3O
1 -31
1 - 32
1 - 34
1 - 34
1 - 36
1 - 38
1 -39
1 - 42
SECTION II
2.4-1
2.4-2
2.4-3
LRBI Launch Site Plan
LRB Launch Site Phases
LRB Launch Site Plan Synopsis
2-5
2-6
2-7
xix

2.5.1-1
2.5.1-2
2.5.1.6-1
2.5.2-1
2.8-1
2.9-1
2.9.1-1
2.9.1-2
2.9.1-3
2.9.2-1
2.9.3-1
2.9.4-1
First Line Facility Activities
Second Line Facility Activities
ET/LRB Horizonal Processing Facility-Site Plan
VAB High Bay 4 Crawlerway
Time Phased LRB Integration Headcount
LO2/RP-1 Pump-Fed Booster POP
LRB First Line Facility Non-Recurring Cost Summary
LRB Second Line Facility Non-Recurring Cost Summary.
Life Cycle LRB Facility Costs
Life Cycle LRB Recurring Material and Commodity Costs
Life Cycle LRB Management/Manning Costs
LRB Integration Costs
2-11
2-16
2-18
2 - 24
2-28
2 - 29
" 30
2-31
2- 32
2 - 34
2 - 35
SECTION III
3.0
3.1.2-1
3.1.2-2
3.1.2-3
3.1.3-1
3.2-1
3.2-2
3.2.3.1-1
3.2.3.1-2
3.2.4-1
3.2.6-1
3.2.7.4-1
3.2.7.4-2
3.2.7.4-3
3.2.7.44
3.2.7.4-5
GOCM Evolution 3 - 3
GOCM Modularization 3 - 5
KSC Conceptual Cost 3 - 7
Figure Cost Estimating Methods Versus Program Maturity 3 - 9
GOCM Study Plan 3 - 11
Present and Future STS/SRB Ground Processing Operations 3 - 15
Relationship Between Calibration and Verification for Various
Cost Elements 3 - 17
GOCM Calibration Concerns 3 - 18
Relationship Between Number Problem Reports and
Turnaround Time 3 - 21
LRBI STS Flight History 3 - 23
GOCM Estimate Versus Actual Cost Comparison for FY 85 3 - 24
Ground Processing Shift Comparison 3 - 26
Simplification of GOCM Averaging and Smoothing Applied to
Transition Cost 3 - 28
Turnaround Experience 3 - 32
Processing Times by Orbiter by Flight 3 - 33
Process Trends for Orbiter Introductions 3 - 33
Overall STS Ground Processing Curve 3 - 34
Ground Processing Curve 3 - 36
x Jr

3.2.7.4-6
3.4.1-1
3.4.2-1
3.4.2.4-1
3.5.1.2-1
Ground Processing Sensitivity to Ground Processing Curves
GOCM KSC STS Life Cycle Cost
KSC LRB Life Cycle Cost Matrix
Ground Processing Work
Feature and Attributes of Various Cost Model Types
3-37
3 -47
3 -48
3 - 50
3 - 54
SECTION IV
4.1.1-1
4.1.2-1
4.1.2-2
4.1.2.1-1
4.1.2.2-1
4.3-1
4.3-2
4.5
Estimate of Processing Portion of KSC Cost, and
Program Life Cycle Cost 4- 2
Typical KSC Cost Breakout 4- 3
Calendar Year 1985 SPC Manhours By Flight Element and
Station Set 4 - 5
STS LCC Estimate 4 - 6
Approximate STS LCC and Program Life Sensitivity to Launch Rate 4 - 7
Potential Cumulative Launch Rate Sensitivity to One Year
Slip in LRB 4 - 9
Generic LRB/SRB Process Flow Comparison 4 - 10
KSC Cost Generation Evaluation and Comparison 4 - 13
KSC LRB Life Cycle Cost Matrix 4 - 14
GOCM KSC STS Life Cycle Cost 4 - 17
xxi

VOLUME il
SECTION 1
LRBI STUDY SYNOPSIS
81005-01BlVl2"n'l

LRBI FINAL REPORT
CONTENTS GUIDE
VOLUME I - EXECUTIVE SUMMARY
VOLUME II - STUDY SUMMARY
SECTION 1: LRBIStud£ Synopsis - An assessment of the study objectives, approach,
analysis, and rationale. The study findings and major conclusions are presented.
SECTION 2: Launch Site Plan - An implementation plan for the KSC launch site integra-
tion of LRB ground processing. The plan includes details in the areas of facility activa-
tions, operational schedules, costs, manpower, safety and environmental aspects.
SECTION 3: Ground Operations Cost Model (GOCM) - The updating and enhancement
of this NASA provided computer-based costing model are described. Its application to
LRB integration and instructions for modification and expanded use are presented.
SECTION 4: Cost - Summary and Analysis of KSC Costs.
VOLUME III - STUDY PRODUCTS
The study output has been developed in the form of nineteen derived study products.
These are presented and described in the subsections of this volume.
VOLUME IV - REVIEWS AND PRESENTATIONS
The progress reviews and oral presentations prepared during the course of the study are
presented here along with facing page text where available.
VOLUME V -APPENDICES
Study supporting data used or referenced during the study effort are presented and indexed
to the corresponding study products.

LIST OF ABBREVIATIONS AND ACRONYMS
ADP
A&E
AF
AI
AL
AL-Li
ALS
ALT
AOA
AOPL
AP
APU
ARF
ARTEMIS
ASRM
ASSY
ATO
ATP
AUTO
AWCS
Automatic Data Processing
Architectual and Engineering
Air Force
Artificial Intelligence
Aluminum
Aluminum Lithium Alloy
Advanced Launch Systems
Alternate
Abort Once Around
Advanced Order Parts List
Auxiliary Hatform
Auxiliary Power Unit
Assembly and Refurbishment Facility
Accounting, Repotting, Tracking, &
System
Advanced Solid Rocket Motor
Assembly
Abort to Orbit
Authority to Proceed
Automatic
Automated Work Control System
Evaluation Management - Information
BITE
BLOW
BOC
BSM
Built-in Test Equipment
Booster Liftoff Weight
Base Operations Contractor
Booster Separation Motor

C
CAD
CALS
CCAFS
CCB
CCC
CCF
CCMS
CDDT
CDR
CEC
CER
CG
CH4
CITE
CM
c/o
CONC
C ofF
COMM
CPF
CPF2
CPF3
CPM
CPU
CR
Cryo
c/s
CT
crY
Celsius
Computer Aided Design
Computer Aided Logistics System
Cape Canaveral Air Force Station
Change Control Board
Complex Control Center
Compressor Converter Facility
Checkout, Control and Monitor Subsystem
Countdown Demonstration Test
Critical Design Review
Core Electronics Contractor
Cost Estimating Relationships
Center of Gravity
Methane
Cargo Integration Test Equipment
Construction Management
Configuration Management
Closeout
Checkout
Concrete
Cost of Facilities
Communications
Cost per Foot
Cost per Square Foot
Cost per Cubic Foot
Critical Path Management
Central Processing Unit
Control Room
Cryogenic
ContractorSupport
Crawler Transporter
Calendar Year
°°.
Ill
dBase
dc
DDS
DDT&E
DE
DEQ
DFRF
DFI
DHC
DIST
DOD
DOS
DOT
Data Base - Software Program
Direct Current
Data Processing System
Design, Development, Test & Engineering
Design Engineering
Direct Equivalent Head Count
Dryden Flight Research Facility
Development Flight Instrumentation
Direct Head Count
Distributor
Department of Defense
Disk Operating System
Department of Transportation
ECLSS
ECS
EL
ELS
ELV
EMA
EMERG
EPA
EPDC
EPL
ET
ET-HPF
ETR
Environmental Control & Life Support System
Environmental Control System
Elevation
Eastern Launch Site
Expendable Launch Vehicle
Electrical Mechanical Actuator
Emergency
Environmental Protection Agency
Electrical Power and Distribution Control
Emergency Power Level
Extemal Tank
External Tanks - Horizontal Processing Facility
Eastern Test Range
F
FAA
F&D
FEP
FIT
Fahrenheit
Federal Aviation Administration
Fill&Drain
Front End Processor
Flight
iv

FMEA/CIL
FRF
FRSC
ft
FSS
FWD
FY
Failures Modes & Effects Analysis/Critical Items List
Flight Readiness Firing
Forward Reaction Control System
Feet
Fixed Service Structure
Forward
Fiscal Year
G&A
G,g
GAL
GDSStGD)
GEN
GFE
GH2
GHe
GLOW
GLS
GN2
GN&C
GOAL
GOX
GOCM
GPC
GPM
GRD
GSE
GSFC
GTSI
GUCP
General and Administrative
Acceleration of Gravity
Gallons
General Dynamics Space Systems
Generator
Government Furnished Equipment
Gaseous Hydrogen
Gaseous Helium
Gross Liftoff Weight
Ground Launch Sequencer
Gaseous Nitrogen
Guidance, Navigation & Control
Ground Operations Aerospace Language
Gaseous Oxygen
Ground Operations Cost Model
General Purpose Computer
Gallons Per Minute
Ground
Ground Support Equipment
Goddard Space Flight Center
Grumman Technical Services, Inc.
Ground Umbilical Carrier Plate
V

H2
ItAZGAS
HB
HDP
He
HIM
HMF
HPF
HQ
HVAC
HW
HYD
HYPER
Hz
Hydrogen
Hazardous Gas
High Bay
Holddown Post
Helium
Hardware Interface Module
Hypergolics Maintenance Facility
Horizontal Processing Facility
Headquarters
Heating, Ventilation, and Air Conditioning
Hardware
Hydraulic(s)
Hypergolic
Hertz
IBM
ICD
I/F
ILC
INST
INTEG
IOC
IPR
IRD
IUS
lntemational Business Machines
Interface Control Document
Interface
Initial Launch Capability
Instrumentation
Integration
Initial Operational Capability
Interum Problem Report
Interface Requirements Document
Interial Upper Stage
JSC Johnson Space Center
vi

K
K
KLB
KSC
KW
Thousands
Kelvin
Thousands of Pounds
Kennedy Space Center
Kilowatt
LAC
LC-39
LCC
LCC
LCH4
LESC
LETF
LEO
LH2
Li
LN2
LNG
LO2
LOX
LPS
LRB
LRB-HPF
LRBI
LRU
LSE
LSOC
LUT
Launch Accessories Contractor
Launch Complex 39
Life Cycle Cost
Launch Control Center
Liquid Methane
Lockheed Engineering and Science Company
Launch Equipment Test Facility
Low Earth Orbit
Liquid Hydrogen
Lithium
Liquid Nitrogen
Liquid Natural Gas
Liquid Oxygen
Liquid Oxygen
Launch Processing System
Liquid Rocket Booster
Liquid Rocket Booster Horizontal Processing Facility
Liquid Rocket Booster Integration
Line Replaceable Unit
Launch Support Equipment
Lockheed Space Operations Company
Launcher Umbilical Tower
MAX
MECO
MDAC
MIL
Maximum
Main Engine Cutoff
McDonnell Douglas Astronautics Company
Military
vii

MIN
MLP
MMC
MMH
MOD
MOU
MP
MPS
MSBLS
MSFC
MST
MTI
1Vliflilnum
Mobile Launch Platform
Martin-Marietta Corporation
Mono Methyl Hydrazine
Mission Operations Directorate
Memorandum of Understanding
Manpower
Main Propulsion System
Microwave Scanning Beam Landing System
Marshall Space Flight Center
Mobile Service Tower
MortonThiokol, Inc.
N2
NASA
NDE
NDT
NF
N202
NPL
NPSH
NRC
NSTL
NSTS
NWS
Nitrogen
National Aeronautics and Space Administration
Non-Destructive Evaluation
Non-Destructive Test
Nose Fairing
Nitrogen Tetroxide
Nominal Power Level
Not positive Suction Head
National Research Council
National Space Technology Laboratories (Stennis Space Center)
National Space Transportation System
National Weather Service
OAA
OIS
OJT
O&M
OMD
Orbiter Access Arm
Operational Intercommunications System
On-the-job Training
Operations and Maintenance
Operating and Maintenance Documemation
viii

OMI
OMRF
OMRSD
OMS
OPF
OPS
OMBUU
ORB
ORD
ORI
OSHA
OTV
OperationsandMaintenanceInstruction
OrbiterMaintenanceandRefurbishmentFacility
OperationalMaintenanceRequirementsandSpecificationsDocument
OrbitalManeuveringSystem
OrbiterProcessingFacility
Operations
Orbiter Mid Body Umbilical Unit
Orbiter
Operational Readiness Date
Operational Readiness Inspection
Occupational Safety & Health Administration
Operational Television
PA
PAWS
P/A
Pc
PC
PCM
PCR
PDR
PER
PGHM
PIC
PIF
P/L
PMM
PMS
PO
POP
PR
PRACA
PRCBD
Public Affairs
Pan Am World Services, Inc.
Propulsion/Avionics Module
Engine Combustion Chamber Pressure
Personal Computer
Pulse Code Modulator
Payload Changeout Room
Preliminary Design Review
Preliminary Engineering Report
Payload Ground Handling Mechanism
Pyre Initiator Controller
Payload Integration Facility
Payload
Program Model Number
Permanent Measuring System
Purchase Order
Programs Operations Plan
Problem Report
Problem Reporting and Corrective Action
Program Review Control Board Directive
ix

PRC
PRD
PRESS
PROP
PRR
PSI
psia
psig
PSP
PT&I
P&W
Planning Research Corporation
Program Requirements Document
Pressure, pressurization
Propellant
Preliminary Requirements Review
Pounds Per Square Inch
Pounds Per Square Inch Absolute
Pounds Per Square Inch Gage
Process Support Plan
Payroll Taxes and Insurance
Pratt & Whitney Company
Q
QA
Q-Alpha
Qc
QD
QTY
Dynamic Pressure
Quality Assurance
Dynamic Pressure x Angle of Attack
Quality Control
Quick Disconnect
Quantity
R
RAM
RCS
R&D
RF
RFP
RIC
ROM
RP-I
RPL
RPS
RPSF
Ranking
Random Access Memory
Reaction Control System
Research and Developmem
Radio Frequency
Request for Proposal
Rockwell Intemational Corporation
Rough Order of Magnitute
Propellant (Kerosene Related Petroleum Product)
Rated Power Level
Record and Playback System
Rotation, Processing & Surge Facility

R/RRSLS
RSS
R&T
RTLS
Remove/Replace
Redundant Set Launch Sequencer
Rotating Service Structure
Research and Technology
Return to Launch Site
SAIL
SAB
SCAPE
SDI
SDV
SEB
SEC
SGOS
SIF_.S
SIT
SLC-6
SLF
SOFI
SOW
SPC
SPF
SPDMS
SRB
SRM
SRSS
SR&QA
SSC
SSME
SSV
STD
STS
Shuttle Avionics Integration Laboratory
Shuttle Assembly Building
Self-Contained Atmospheric Protective Ensemble
Strategic Defense Initiative
Shuttle Derivative Vehicle
Source Evaluation Board
Second(s), Secondary
Shuttle Ground Operations Simulator
Supervision, Inspection & Engineering Services
Shuttle Integrated Test
System Integrated Test
Shuttle Launch Complex No.6
Shuttle Landing Facility
Spray On Foam Insulation
Statement of Work
Shuttle Processing Contractor
Sot_wa_ Production Facility
Shuttle Processing Data Management System
Solid Rocket Booster
Solid Rocket Motor
Shuttle Range Safety System
Safety, Reliability and Quality Assurance
Stennis Space Center (NSTL)
Space Shuttle Main Engine
Space Shuttle Vehicle
Standard
Space Transportation System
xi

SUBSTA
SW
S/W
Substation
Switch
Software
TAL
TBD
T&C/O
TFER
T-0
TOPS
TPS
TSM
TTV
TVA
TVC
T/W
TYP
Transatlantic Landing
To Be Determined
Test and Checkout
Transfer
Liftoff Time
Technical Operating Procedures
Thermal Protection System
Tail Service Mast
Termination/Test/Verification
Thrust Vector Activator
Thrust Vector Control
Thrust to Weight Ratio
Typical
ULCE
LIMB
UPS
USAF
USS
Unified Life Cycle Engineering
Umbilical
Unintegrated Power System
United States Air Force
Utility Substation
V
VAB
VAFB
VIB
VLS
VPF
Volt(s)
Vehicle Assembly Building
Vandenberg Air Force Base
Vertical Integration Building
Vandenberg Launch Site
Vertical Processing Facility
xii

WAD
WBS
WIP
WSMR
WTR
Work Authorization Document
Work Breakdown Structure
Work in Progress
White Sands Missile Range
Westem Test Range
°.°
XIU

VOLUME II
TABLE OF CONTENTS
SECTION I
1.1
1.1.1
1.1.2
1.1.3
1.1.4
1.1.4.1
1.1.4.2
1.2
1.2.1
1.2.2
1.2.3
1.2.4
1.2.5
1.2.6
1.2.7
1.3
1.4
1.4.1
1.4.2
1.5
1.5.1
1.6
1.6.1
1.6.2
1.6.3
1.6.4
1.6.5
1.7
1.7.1
1.7.2
BACKGROUND
MSFC Phase-A LRB Study
KSC LRBI Study
JSC LRB Integration
LRB Project Team
Team Members
Technical Working Group
LRBI STUDY OBJECTI'_T_S
Impacts (Operations and Facilities)
Scenarios
Design Recommendations
Operationally Efficient LRB System
Ground Operations Cost Model
LSE/GSE
Launch Site Support Plan
KEY STUDY FINDINGS
TECHNICAL APPROACH/STUDY PLAN
Task Breakdown/Interrelationships
Task Schedule/Milestones
STUDY PRODUCTS
Task/Product Relationships
MSFC PHASE-A SELECTED CONFIGURATIONS
GDSS/MMC LRB Design Approach
Configuration Details
Launch Site Design Recommendations
KSC Requirements Checklist
LRB Design Requirements Assessment
CONCLUSIONS
Processing Scenarios
Impacts To On-Going Activities
1-1
1-1
1-3
1-3
1-3
1-3
1-6
1-6
1-6
1-6
1-8
1-8
1-8
1-8
1-9
I-9
1-12
1-12
1-16
1-16
1-16
1-18
1-18
1 - 2O
I -27
1 - 29
1 - 29
1 - 33
1 - 33
1 - 35
xiv

1.7.2.1
1.7.2.2
1.7.2.3
1.7.3
Facility Activation
Transition
Operational Phase
Major Issues for Follow-On Study
1 -37
1 -41
1 - 43
1 - 43
SECTION II
2.1
2.2
2.3
2.3.1
2.3.2
2.4
2.4.1
2.4.2
2.4.3
2.5
2.5.1
2.5.1.1
2.5.1.2
2.5.1.3
2.5.1.4
2.5.1.5
2.5.1.6
2.5.2
2.6
2.6.1
2.6.2
2.6.3
2.6.4
2.7
2.7.1
2.7.2
2.7.3
2.7.4
2.8
OBJECTIVE
APPROACH AND RATIONALE
GROUNDRULES AND IMPLICATIONS
Groundrules/Assumptions
Environmental and Safety Implications
IMPLEMENTATION PLAN AND PHASES
Activation Phase
Transition Phase
Operational Phase
FACILITY IMPACTS
New Construction
LRB MLP #4 and #5
ET Horizontal Processing Facility
LRB Horizontal Processing Facility
LRB Engine Shop
ET/LRB HPF Control Center/LPS
ET/LRB Processing Facility Siting
Modifications
INTERFACE REQUIREMENTS
Johnson Space Center (JSC)
Marshall Space Flight Center (MSFC)
Department of Defense (DOD)
KSC/Other
SPECIAL KSC REQUIREMENTS
SRB/LRB Joint Activities
Facility Contractor Support
LRB Launch Support Services (LSS)
Recovery Requirements
MANAGEMENT/MANNING
2-1
2-1
2-2
2-2
2-3
2-4
2-8
2-8
2-9
2-9
2- 10
2- 10
2-13
2-14
2-14
2-15
2- 15
2- 17
2-19
2-19
2-19
2 - 20
2 - 20
2 - 20
2-21
2-21
2 - 22
2 - 22
2 - 23
xv

2.8.1
2.8.1.1
2.8.2
2.8.3
2.8.4
2.8.5
2.8.6
2.9
2.9.1
2.9.2
2.9.3
2.9.4
LRB Processing
Non-SPC SRB Processing Support
NASA Operations Interface
NASA Engineering Interface
Activation Management Team
SRB Manning
LRB versus SRB
LAUNCH SITE IMPLEMENTATION COSTS
Facilities and Equipment
Recurring Material and Commodity Costs
Management/Manning Costs
Major LRB Life Cycle Costs
2-23
2 - 25
2 -26
2 - 26
2 - 27
2 - 27
2 - 33
2 -35
SECTION III
3.1
3.1.1
3.1.2
3.1.2.1
3.1.3
3.1.4
3.1.5
3.2
3.2.1
3.2.2
3.2.2.1
3.2.2.2
3.2.3
3.2.3.1
3.2.3.2
3.2.4
3.2.5
3.2.6
3.2.7
3.2.7.1
3.2.7.2
USER'S EXPERIENCE
New User Impressions
Early Model Evaluation
Strengths and Weaknesses
Study and GOCM Development Approach
Utility Evaluation
Potential Modular Growth
CALIBRATION
Scope
Realism and Completeness
Realism
Completeness
Gross Cost Evaluation
1985 Budget (WBS) vs. GOCM Comparison
GOCM Evaluation
Ground Processing STS LRB/SRB CER Verification
Facility Cost Driver Verification
Transition
Cost Reduction Curves
Reliability and Maintainability Growth Curves
Learning Curves
3
3
3
3
3
3
3
3
3
3
3
3
3
3
3
3
3
3
3
3
3
-2
-2
-4
-4
-8
-10
-12
-13
-14
-16
- 16
-19
-22
-22
- 22
- 25
- 25
- 25
- 27
- 27
- 29
xvi

3.2.7.3
3.2.7.4
3.2.8
3.2.8.1
3.3
3.3.1
3.3.1.1
3.3.1.2
3.3.2
3.3.2.1
3.3.2.2
3.4
3.4.1
3.4.2
3.4.2.1
3.4.2.2
3.4.2.3
3.4.2.4
3.4.3
3.4.4
3.4.5
3.5
3.5.1
3.5.1.1
3.5.2
Cost Reduction Curves for Ground Processing 3 - 30
Ground Processing Curve Assimilation 3 - 31
Success Oriented vs. Post 51-L 3 - 35
Applying the Ground Processing Curve 3 - 38
MODEL ENHANCEMENTS 3 - 38
Configuration 3- 38
Baseline 3 - 39
Enhanced/Modified 3 - 40
Future Potential Enhancements 3 - 45
Short Range 3 - 45
Long Range 3 - 45
GOCM APPLICATION TO LRBI STUDY 3 - 46
Cost Estimates 3 - 46
Cost Comparison 3 - 46
LRBI Study Comparison 3 - 46
General Dynamics 3 - 46
Martin Marietta 3 - 49
NASA Planning 3 - 49
Role in LRBI 3 - 49
Trade Studies 3 - 51
Overview/Conclusions of GOCM Utility to LRBI 3 - 51
FUTURE DIRECTION 3 - 52
GOCM Recommendations 3 - 52
Recommended Statement of Work for Follow-on GOCM Development 3 - 52
Future Applications 3 - 56
SECTION IV
4.1
4.1.1
4.1.2
4.1.2.1
4.1.2.2
4.2
4.2.1
4.2.2
RECURRING COST ANALYSIS 4 - 1
Program Cost Significance 4 - 1
Cost Sensitivity 4 - 4
STS Sensitivity to Transition 4 - 8
Launch Rate Capability 4 - 8
NON-RECURRING COST ANALYSIS 4 - 11
Facility Impact and Requirements Sensitivity to Booster Diameter 4 - 11
Facility Impact and Requirements Sensitivity to Booster Length 4 - 12
xvii

4.2.3
4.3
4.3.1
4.3.2
4.3.3
4.3.4
4.3.5
4.3.6
4.4
4.4.1
4.5
4.5.1
4.5.2
4.5.3
Facility Impact and Requirements Sensitivity to Fuel
LRB COST PROJECTIONS
KSC Initial Conceptual Estimate
Initial GOCM Estimate
General Dynamics Estimate
Martin Marietta Company Estimate
KSC Detail Bottoms-up Estimate
Final GOCM Estimate
LRB COST ESTIMATE
Final LRB Cost Estimate
COST OVERVIEW
Recurring Costs in Comparative Terms
KSC Delta Booster Costs Mixed Booster Fleet vs. SRB Booster Fleet
Final KSC LRB Cost Conclusion
4-12
4-12
4-12
4-15
4-15
4-15
4-15
4-I5
4-16
4-16
4-16
4-18
4-!9
4-!9
xviii

VOLUME II
LIST OF FIGURES
SECTION I
1.1.1-1
1.1.3-1
1.1.4.1-1
1.2-1
1.3-1
1.4.1-1
1.4.2-1
1.5.1-1
1.6.2-1
1.6.2-2
1.6.2-3
1.6.2--4
1.6.2-5
1.6.2-6
1.6.2-7
1.6.3-1
1.6.4-1
1.6.5-1
1.7.1-1
1.7.1-2
1.7.1-3
1.7.2-1
1.7.2-2
1.7.2.2-1
Summary of MSFC Phase A LRB Findings
LRB/STS Integration by LESC/JSC
LRB Study Team Members
Study Objectives
LRBI Key Study Findings
Methodology/Study Tasks
LRB Integration Study Schedule
Study Tasks/Products Relationships
MMC Pump-Fed LO2/RP-1 Vehicle Configuration
MMC Pump-Fed LO2/RP-1 Booster Configuration
MMC Pump-Fed Vehicle Data Summary
MMC Pressure-Fed LO2/RP-1 Vehicle Configuration
MMC Pressure-Fed LO2/RP-1 Booster Configuration
MMC Pressure-Fed Vehicle Data Summary
GDSS Selected LRB Configurations-October 1988
KSC-LRB Design Recommendations
LRB Requirements Checklist Categories
LRB Design Requirements Summary
Preliminary LRB Scenario
Generic LRB Process Flow
SRB/LRB Flow Comparison
Launch Site Plan Overview
LRB Launch Site Plan Synopsis
KSC SRB to LRB Transition Plan
1-2
1-4
1-5
1-7
1-10
1-13
1-17
1- 19
1 -21
1 - 22
1 -23
1 - 24
1 - 25
1 -26
1 -28
1 - 30
1 -31
1 -32
1 - 34
1 - 34
1 - 36
1 -38
1 - 39
1 - 42
SECTION II
2.4-1
2.4-2
2.4-3
LRBI Launch Site Plan
LRB Launch Site Phases
LRB Launch Site Plan Synopsis
2-5
2-6
2-7
xix

2.5.1-1
2.5.1-2
2.5.1.6-1
2.5.2-1
2.8-1
2.9-1
2.9.1-1
2.9.1-2
2.9.1-3
2.9.2-1
2.9.3-1
2.9.4-1
First Line Facility Activities
Second Line Facility Activities
ET/LRB Horizonal Processing Facility-Site Plan
VAB High Bay 4 Crawlerway
Time Phased LRB Integration Headcount
LO2/RP-1 Pump-Fed Booster POP
LRB First Line Facility Non-Recurring Cost Summar).
LRB Second Line Facility Non-Recurring Cost Summary
Life Cycle LRB Facility Costs
Life Cycle LRB Recurring Material and Commodity Costs
Life Cycle LRB Management/Manning Costs
LRB Integration Costs
2-11
2-12
2-16
2-18
2 - 24
2-28
2 - 29
2 - 30
2-31
2- 32
2 - 34
2- 35
SECTION III
3.0
3.1.2-1
3.1.2-2
3.1.2-3
3.1.3-1
3.2-1
3.2-2
3.2.3.1-1
3.2.3.1-2
3.2.4-1
3.2.6-1
3.2.7.4-1
3.2.7.4-2
3.2.7.4-3
3.2.7.4-4
3.2.7.4-5
GOCM Evolution 3 - 3
GOCM Modularization 3 - 5
KSC Conceptual Cost 3 - 7
Figure Cost Estimating Methods Versus Program Maturity 3 - 9
GOCM Study Plan 3 - 11
Present and Future STS/SRB Ground Processing Operations 3 - 15
Relationship Between Calibration and Verification for Various
Cost Elements 3 - 17
GOCM Calibration Concerns 3 - 18
Relationship Between Number Problem Reports and
Turnaround Time 3 - 21
LRBI STS Flight History 3 - 23
GOCM Estimate Versus Aclual Cost Comparison for FY 85 3 - 24
Ground Processing Shift Comparison 3 - 26
Simplification of GOCM Averaging and Smoothing Applied to
Transition Cost 3 - 28
Turnaround Experience 3 - 32
Processing Times by Orbiter by Flight 3 - 33
Process Trends for Orbiter Introductions 3 - 33
Overall STS Ground Processing Curve 3 - 34
Ground Processing Curve 3 - 36
XX

3.2.7.4-6
3.4.1-1
3.4.2-1
3.4.2.4-1
3.5.1.2-1
Ground Processing Sensitivity to Ground Processing Curves
GOCM KSC STS Life Cycle Cost
KSC LRB Life Cycle Cost Matrix
Ground Processing Work
Feature and Attributes of Various Cost Model Types
3 -37
3 - 47
3 - 48
3 - 50
3 -54
SECTION IV
4.1.1-1
4.1.2-1
4.1.2-2
4.1.2.1-1
4.1.2.2-1
4.3-1
4.3-2
4.5
Estimate of Processing Portion of KSC Cost, and
Program Life Cycle Cost 4 - 2
Typical KSC Cost Breakout 4 - 3
Calendar Year 1985 SPC Manhours By Flight Element and
Station Set 4 - 5
STS LCC Estimate 4 - 6
Approximate STS LCC and Program Life Sensitivity to Launch Rate 4 - 7
Potential Cumulative Launch Rate Sensitivity to One Year
Slip in LRB 4 - 9
Generic LRB/SRB Process Flow Comparison 4 - 10
KSC Cost Generation Evaluation and Comparison 4 - 13
KSC LRB Life Cycle Cost Matrix 4 - 14
GOCM KSC STS Life Cycle Cost 4 - 17
xxi

VOLUME II
SECTION 2 i
LAUNCH SITE PLAN
(NOTE: STRUCTURE PLAN AS A LEVEL 2 RESPONSETO MSFC PROGRAM LEAD)
B1005-01BM3

VOLUME 1I SECTION 1
LRBI STUDY SYNOPSIS
Launch site integration of liquid rocket boosters (or any new STS element) is a complex undertak-
ing requiring early planning and coordinated integration with on-going (parallel) launch opera-
tions. The successful integration of a liquid rocket booster into the STS system can only be
achieved through changes in the launch site configuration and processing procedures. The pur-
pose of this study was the identification of all such changes and the assessment of the resulting
impacts to transition the launch site and ground systems to support LRB/STS launch processing.
This KSC study was designed to complement the MSFC LRB studies in the assessment of launch
site impacts, processing/launch operations, and facility requirements for the implementation of
LRB at KSC. A cursory evaluation of Vandenberg Air Force Base (VAFB) as a LRB launch site
was also to be considered.
This section discusses the detailed study objectives and how this study was designed to support the
three-center (KSC, MSFC and JSC) NASA project teams and their LRB contractor activities.
The formulation of the technical approach resulted in the breakdown of activities into a structured
study plan. This plan, the resulting study products, and the task interrelationships are presented
and described in this section.
I.I BACKGROUND
1.1.1 MSFC Phase-A LRB Study
The MSFC Phase-A study contracts to General Dynamics and Martin Marietta began in October
1987. They were designed to provide the required preliminary concept studies of alternate liquid
rocket boosters as a replacement for the SRBs currently used on the STS. These studies were
directed toward the def'mition of candidate pump-fed and pressure-fed LRB configurations. The
MSFC study of the LRB flight configurations was entitled "Liquid Rocket Booster for STS Sys-
tems Study". Major findings and conclusions of these studies to date are presented in Figme 1.1.1-
1. Other identified issues and the final selected LRB conf_n_rations are descn'bed in Section 1.6.
1-1

MSFC LRB STUDY F_iDINGS
• LRB SHOULDBE EXPENDABLE BOOSTER
• ALL CONFIGURATIONS ARE 4-ENGINED-LOX TANK FORWARD
• NEW LOW-COST ENGINE DEVELOPMENT IS REQUIPED
• LOX/RP-1 IS FAVORED PROPELLANT FOR STS
• LOX/LH2 PUMP-FED IS PREFERRED FOR ALTERNATE APPLICATIONS
BOTH PUMP AND PRESSURE+-ED OPTIONS ARE VIABLE
(PRESSURE-FED REQUIRES TECHNOLOGY DEVELOPMENTS)
ALL SELECTED CONFIGURATIONS CAN BE FLOWN WITHIN
CURRENT STS CONSTRAINTS
LRB WILL IMPACT KSC
- BOOSTER DIAMETERS
(13.9TO 18.0 FEET)- BOOSTER LENGTHS
(147 TO 197 FEET)- ET/ORBFrER INTERFACES MAINTAINED
- UFT_F1 = UMBILICALS BASELINED
f
Figure 1.1.1-1. Summary of MSFC Phase A LRB Findings (Ref. GDSS/MMC).
81012-02E 2-1 11/14 5:00p
l-2

1.1.2 KSC LRBI Study
In March 1988 Lockheed Space Operations Co. was placed under contract to perform the launch
site impact evaluation effort and to participate in the LRB Technical Working Group. The LRBI
Statement of Work is presented for reference in Appendix 20-7.
1.1.3 JSC LRB Integration
The third key NASA center involved with the LRB study is Johnson Space Center. JSC and their
contractor, Lockheed Engineering & Science Company (LESC) performed the Level II integra-
tion function for the LRB evaluation. Figure 1.1.3-1 highlights some of the major functional areas
of investigation by LESC/JSC. More detailed results of studies at MSFC and JSC can be found in
the final reports and presentation materials published at the conclusion of their studies.
1.1.4 LRB Project Team
1.1.4.1 Team Members
The LRB Project was comprised of study efforts at three NASA Centers. Each of these activities
supported the LRB program management function at MSFC as shown in Figure 1.1.4.1-1. The
prime contractors for the MSFC system design studies were General Dynamics and Martin Mari-
etta.
LRB Phase A flight hardware studies for MSFC were led by Tom Mobley at MMC]Michoud and
Steve Seus at GIXSS/San Diego. Ned Hughes, LRB Chief Engineer, coordinated these studies,
reporting to Larry Wear, LRB Program Manager. In addition, MSFC provided basic wind tunnel
model data to support the LRB aerodynamic design.
The Lockheed Engineering & Science Co. (LESC) study at JSC was led by Jim Mc Curry in
support of Jim Akkerman, NASA/JSC in the Level II integration and system performance evalua-
tions. The LSOC study team was led by Gordon Artley and reported to NASA, Bill Dickinson,
KSC Advanced Program Office, for all of the LRB launch site integration assessments.
The total study project reported through Advanced Program DeveloIanent under Darrell Bran-
scome to the Office of Space Flight, NASA/HQ.
1-3

JSC STUDY ISSUES
• STS/LRB ASCENT FLIGHT DESIGN
-GDSS AND MMC CONFIGURATIONS
-ASCENT PERFC_MANCE EVALUATIONS
-INTACT ABORT PERFORMANCE
• CONTINGENCY ABORT ASSESSMENTS
• LRB CONTROLLABILITY ANALYSIS
• PRELIMINARY LRB FME/VCIL ANALYSIS
• JSC MISSION OPERATIONS DIRECTORATE
IMPACTS (SOFTWARE MGOS. ETC.)
• INTEGRATED AVIONICS/GN & C
• TOWER CLEARANCE STUDIES
• LRB-TO-STS INTERFACE EVALUATIONS
• LRB/STS SYSTEM LOADS/THERMAL ANALYSIS
• STAGING AND SEPARATION ANALYSIS
'i
81012-021
F_gure 1.1.3-I. LRB/STS Integration By LESC,/JSC.2-1 11111 10:00l
1-4

NASA/ HQ
OFFICE OF
SPACE FLIGHT
ADVANCED
PROGRAM
DEVELOPMENTDARRELL BRANSCOME
IMSFC
LARRY WEAR
PROGRAM MANAGER
LSOC KSC
GORDON ARTLEY BILL DICKINSON
INTERCENTER
TECHNICAL
WORKING GROUP
- PHASE A CONFIGURATION STUDY
- PROPULSION EVALUATION
- AEROOYNAMIC SUPPORT
- SYSTEM DESIGN STUDIES
- LAUNCH SITE OPS INTEGRATION
o FACIUTY ACTIVATION
- TRANSITION PLANNING
LESC
JIM McCURRY I
JSC II
JIM AKKERMAN
- STS INTEGRATION
I - SYSTEM REQUIREMENTS- ABORT CAPABILmES
- SYSTEM EVALUATION
81012-02G,P_.,K1
Figure 1.1.4.1-1. LRB Study Team Members.
1-5
2-1.2 11/19 11:00a

1.1.4.2 Technical Working Group
The intercenter Technical Working Group consisted of representatives of the three involved
NASA centers, contractors and subcontractors. This group met approximately every two months
during the study period to assess major LRB planning, design and integration issues. This open
and active communication loop made a significant contribution to the quality and maturity of the
study products. Early coordination of vehicle design aspects with launch site capabilities and
ground system design features enhanced the teams' ability to control life cycle costs for the
planned LRB program.
1.2 LRBI STUDY OBJECq'IVF_
The LRB Integration Study is designed to achieve the seven study objectives summarized in
Figure 1.2-1. These objectives are briefly discussed below with reference to the major contributing
study products located in Volume Ill. The overall technical approach and associated study plan is
described in Section 1.4.
1.2.1 Impacts ¢O_t_rafions and Facilities]
The operational impacts of the LRB program on the launch site were developed through a struc-
tured assessment; a station set by station set approach. This assessment includes evaluation of
manpower, procedures, facilities and GSE/L,SE requirements to support the LRB integration
scenario. In addition, the major impacts to on-going launch site activities are summarized in
Section 1.7.2 and Study Product 8 (Volume HI).
1.2.2 Scenm_
The preliminary launch site scenarios were developed to support the selected LRB configurations
from the MSFC Phase A feasibility studies. These scenarios begin with the delivery of the LRBs
to the launch site and conclude after launch with booster recovery/refurbishment (pending con-
figuration selection). Processing timelines describing the LRB scenarios and schedules for the
activation/modification of all major facilities arc sununafized in Study Product 2 (Volun_ IR).
1-6

IMPACTS
S_N_K_S
DESIGN
RECOMMENDATIONS
OPERATIONALLYEFFICIENT LR8
COST
MOOEL
LSFJGSE
LAUNCH SITESUPPORT PLAN
LRBI STUDY OBJECI"IVES
, i
DEVELOP LAUNCH SITE OPERATIONS AND FACILITYIMPACTS FOR MSFC-SELECTED LR8CONFIGURATIONS
DEVELOP PRELIMINARY OPERATIONAL SCENARIOSFOR SELECTED LRB _FIGURATIONS
PROVIDE FLIGHT HARDWARE DESIGN REC_ATIONSBASED ON OPERATIONAL CONSIDERATIONS
ASSIST IN THE DEVELOPMENT OF AN OPERATIONALLYEFFICIENT I.FIB SYSTEM
UTILIZE THE GROUND OPERATIONS COST(_ IN THE PREPARATION OF LRB LAUNCHSITE COST ASSESSMENTS
DEVELOP PRELIMINARY LSE/GSE CONCEPTS FORLRB PROCESSING
DEVELOP LAUNCH SITE SUPPORT PLAN DEFININGMANPOWER REQUIREMENTS FOR LRBIMPLEMENTATION AND OPERATION
81012-02F
F'Hgure1.2-1. Study Objectives.
1-'/
2-1.1 1t/11 10:(X)I

1.2.3 I)esima Recommenda)igas
Through participation in the LRB Technical Working Group meetings and informal communica-
tions our LRBI Study Team members were given the opportunity of presenting recommended
LRB flight hardware design features which would significantly enhance LRB ground processing
operations and thus reduce life cycle costs. The results including discussions of the specific proc-
essing advantages are presented as Study Product 12 (Volume III).
1.2.4 Operationally Efficient LRB System
The Study Team developed a preliminary launch site plan for the LRB which, based on derived
LRB processing requirements, establishes the most cost efficient and manpower efficient ap-
proach possible, while minimizing launch schedule risk. However, this plan could be significantly
refined in the Phase-B preliminary design activities as more def'mitive requirements are de-
veloped. A combination of all study products contributed to this objective. The launch site plan is
presented in Section 2 of this volume.
1.2.5 Ground Operations Cost Model (CK)CM)
Launch site cost assessments for LRB integration have been evaluated using the GOCM. This
computerized costing model has been enhanced and expanded for more detailed costing, and new
program documentation was developed. Documentation for the improved program is described in
Study Products 13, 14, and 15 (Volume HI).
1.2.6 LSE_SE
Preliminary (concept level) designs for major items of launch support and ground support equip-
ment were developed. In a station set by station set evaluation, the required LSE/GSE designs
were identified and related to cost and utility of existing designs in current use for STS processing.
These concepts including MLP-mounted umbilicals and major handling GSE are documented as
Study Products 4 and 5 (Volmne RI).
1-8

1.2.7 Launch Site Su__oport Plan
A comprehensive launch site plan has been developed to support the implementation of LRB
operations and launch site integration. This plan is described in Section 2 of this volume. The
plan includes all three phases of integration: 1. Activation, 2. Transition, and 3. Operations. All
related study products supporting the Launch Site Plan are presented in Volume Ill, Study
Products.
1.3 KEY STUDY FINDINGS
Twelve key study findings are presented as a function of the above study objectives in Figure 1.3-1.
These major findings are:
. The shared facilities and manpower during transition constitute significant risk of launch
delays, even though the planned LRB processing scenario is designed to minimize risks to
the schedule of on-going launch activities. Schedule risk is, in general, insensitive to the
selected I./LB design.
. Integration of LRB at KSC will require new and modified facilities and GSE:
New - MLPs (2)
- Horizontal Processing Facility for LRB and ET offline processing
Mods - Pads (2)
- VAB (I-IBM and I-IB-3)
- LCC (and LPS)
- LETF (mods and testing)
, Extent of modifications to existing facilities and related costs are highly sensitive to select-
ed L.RB design characteristics (propellant, length, diameter, etc.). Major areas, of design
impact are: 1) Flame deflector and flame trench requirements, and 2) Swing arm and
vehicle interface requirements to accommodate vehicle excursions and launch clearances.
. Pad modification timelines do not fit the available open windows (at 14 latag:hes per year)
for the construction to implement LRB changes. During LRB pad modification approxi-
mately eight months of exclusive access will be required. During this period all launches
1-9

LRBI KEY STUDY FINDINGS / ACCOMPLISHMENTSSTUDY OBJECTIVES
1. IMPACTS (OPS + FAC)
2. SCENARIOS
3. LRB DESIGN RECOM
4. OPER. EFF. LRB
5. COST MODEL
6. LSE - GSE
7. LAUNCH SITE
SUPPORT PlAN
• SHARED FACILmES / MANPOWER ARE SIGNIFICANT
TRANSmON RISK
• NEW LIB FACILmES REQUIRED PLUS MOOS TO EXISTING
• MOST SCHEDULE - CRITICAL FAC. MODS ARE PADS A&B
• MOST SCHEDULE - CRITICAL NEW FAC IS TWO MLPs
• LRB PROC SCENARIO DESIGNED TO AVOID SCHED RISK
• DETAILED LRB PROCESSING TASKS DEFINED
• LRB DESIGN FEATURES IDleD FOR LS. OPS EFFICIENCY
• LOX/I_H2 IS KSC PREFERRED PROPELLANT
• LS. CONSTRAINTS ID'ED TO ACCOMODATE LRB OPTIONS
• KEY LRB DES FEATURES ID'ED FOR L.S. OPS EFFICIENCY
• LS. PROCESSING ADVANTAGES OF LRB DEFINED
• GOCM IMPROVED AND DOCUMENTED
• LRB LAUNCH SITE PROJECTED COSTS DEFINED
• CONCEPT LEVEL GSE - LSE DEFINED TO ACCOM LRB
• MANPOWER FOR ACTIVATION, TRANSQON, OPS DERNED
• KSC NEEDS DEDICATED ACTIVATION TEAM FOR _ INTEG
81012- 02Y/CK1
Figure 1.3-1. LRBI Key Study Findings.
1 - 10
2-1 11/19 11.lX)a

are forced to the other pad. These single pad launch operations must be compressed to
achieve the planned launch rates.
. New MLP design and construction is the critical path activity to meet first LRB launch in
FY96 (assumes a FY91 ATP).
. Launch site costs are approximately $1B non-recurring and $1B recurring for a 10-year (122
mission) life cycle. Cost savings due to SRB phase-out still require further evaluation.
. Manpower requirements will peak during FY94-FY95 at an additional 800 people to
support activation, transition and operational phases of LRB implementation, plus approx-
imately 1500 A&E and construction/installation contractor personnel.
° The LRB has a significantly shorter integration timeline on the MLP, in the VAB, com-
pared to SRB. This feature provides greater launch site capabiLity to achieve a 14 per year
launch rate.
. Key LRB configuration design features were identified which result in enhanced launch
site operations. These were documented and presented to the MSFC Phase-A contractors.
Many, but not all, were incorporated into the LRB designs.
10. LOX/RP-I and LOX/LH2 are both viable and acceptable propellants for the new LRB.
LOX/LH2 is the preferred propellant at the launch site. Other propellants studied were
less acceptable.
11. The Ground Operations Cost Model (GOC_) has been shown to be a useful parametric
tool for Phase-A cost analysis. The Model was enhanced, applied to the LRB launch site
integration and documented. In its current form it is ready to apply to any emerging new
launch vehicle evaluation at KSC.
12. KSC needs a dedicated activation team for LRB activation and transition planning with
follow-thru to implement new booster operations. This team and its responsibilities are
described in the study products and the Launch Site Plan, Section 2 of this volmne.
1-11

1.4 TECHNICAL APPROACH/STUDY PLAN
Our study team's technical approach consisted of the formulation of a task oriented study plan for
the assessment of all LRB integration issues. The performance of these serial and interrelated
tasks were designed to produce the desired study products and satisfy the objectives of the study.
The study plan was implemented by a core team of dedicated specialists. This team coordinated
access to LSOC resident experience in the major disciplines, operational areas and facility design
groups affected by the planned LRB integration. Each of the defined tasks was assigned a task
leader and the KSC Study Team became a structured entity.
1.4.1 Task Breakdown/Interrelationships
The study methodology is illustrated in the study plan presented in Figure 1.4.1-1. The study tasks
were designed to progress from the establislunem of baseline requirements/scenarios through the
impact analysis (including MSFC project integration) to the output of the study in the form of
plans, products and a cost model.
The task descriptions and functional relationships are summarized as follows:
Task 1 - Baseline
This effort was directed toward the establishment of the long range SRB/STS baseline of launch
site processing operations, facilities, schedules and manpower, projected over a ten year period.
This facilitated the identification of impacts and changes required for the LRB implementation.
Task 2 - LRB Reouirements
Working with the LRB design teams, the selected LRB configurations were documented and the
launch site processing requirements were derived. Many of these requirements are common for
all booster configurations. However, several unique configuration - dependent requirements were
identified; such as: ground pressurization for the pressure-fed boosters and hydrogen vent systems
for the LOX/LH2 configuration. In addition, the larger LRB configurations were found to re-
quire special modifications of ground systems to accommodate their size.
Task 3 - Preliminary LRB Scenarios
Initially a "baseline" LRB launch site scenario was formulated for the pump-fed LOX/RP-I cow
figurations. It was designed to satisfy the defined processing and facility requirements from Task
1 - 12

BA.._4EUNE REGU1REkERT8
--4 1
LRBREOUIFEMENTS
TASK_PRELIMINARY
LR88CENARK)6
i/
R,ANS. PROOUGTS ANO MOOEL
RE_
81TER,.AN$
81012-02C
Figure 1.4.1-1. Methodology/Study Tasks.
1 - 13
2-1.3 11/19 11:00a

2. The baseline scenario permitted the formulation of facility planning, processing timelines and
impact analysis in the LRB assessments. The LRB scenario was merged with the STS baseline
flow developed in Task 1 to construct activation, transition and operations launch site planning.
This baseline launch site scenario was refined during the study as configurations changed and
requirements matured. The baseline scenario was also reviewed against the configuration unique
requirements identified in Task 2 for the remaining LRB configurations; and, where necessary,
amended to incorporate those requirements.
Task 4 - Impact Analysis
The performance of this task required a station set by station set evaluation of the LRB scenario
and the integration of that scenario into the baseline STS processing flow. Impact evaluations
spanned the design, operations and facility aspects of KSC integration. A cursory analysis of the
Vandenberg launch site was developed for LRB. Results of these analysis are presented as study
products and discussed in Volume Ill.
Task 5 - LRB Design Recommendations
Many launch site compatibility issues were identified in the development of the impact analysis of
Task 4. From these definitions and the experience base of the launch site study participants, a
series of LRB design recommendations were derived. These were formalized and submitted
through our KSC Program Manager to the MSFC design study teams. Feedback was received
through the Technical Working Group interactions and informal communication. Many, but not
all, of these design recommendations resulted in changes to the flight article design which en-
hanced launch site processing and lowered life cycle costs for the LRB.
Task 6 - Launch Site Plan
The launch site plan for LRB implementation was developed directly from the impact analysis
defined in Task 4 and for selected LRB configurations. Tiffs launch site plan provides details in
the areas of facility activations, operations, schedules, costs, manpower, safety and environmental
aspects. The LRB launch site plan is described in Section 2 of this volume.
Task 7 - Follow-on Recormnendations
During the performance of this nine-month integration study specific areas requiring further study
were identified. They are described in Study Product 16 (Volume 111). These areas of study are
f
1 - 14

recommended as Study Options I or II to Strl_On planning for LRB Phase B preliminary design
and/or to define application of LRB to alternate vehicles.
Preliminary goals of a Phase-B program have been laid out by both MSFC contractors for the
preliminary design of the LRB flight article. The primary goals of our launch site integration
activity in support of Phase B will include the following:
• Ref'med analysis of the LRB launch site scenario and facility plan/schedules.
• Continued development of the major LRB to launch site interface definitions and required
ICDs.
• Preliminary designs for new and modified facilities, GSE and LSE.
• Definition of manpower, documentation and support requirements for activation, transition
and operational phases.
• Refined launch site cost projections for selected LRB configuration.
Task 8 - Final Re_tmn
The f'mal report summarizes the results of our team's study effort and documents the developed
study products.
Task 9 - Ground Op¢_rations Cost Model
NASA/KSC provided the computer-based Ground Operations Cost Model (GOCM) to LSOC for
utilization in the LRB cost trade studies. GOCM is a parametric project costing model. The
Study Team performed the following cost modeling actions:
1. Used _ and other costing techniques in the cost assessment of ground operations for the
LRB integration evaluations.
2. Expanded the utility and relevance of GOCM to the KSC STS Program.
3. Evaluated and updated the Cost Estimating Relationships (CERs) resident within GOCM
and incorporated cost sensitive design and support scenarios into the model.
4. Integrated lessons learned from the I.JRBI study.
1 - 15

5. Developed and delivered the following study products: 1) Detailed User's Manual for the
operation of GOCM, 2) Instructions for modifying GOCM and 3) All developed software.
1.4.2 Task Schedule/Milestones
The LRB Integration contract ATP was 17 March 1988. The period of performance covered nine
months. Using the earlier described task breakdown of the study plan a schedule of performance
was developed as shown in Figure 1.4.2-1. This schedule has been generally followed during the
course of the study; however, several of the milestones were adjusted to support the MSFC down
select process as new configurations were considered or existing configurations were changed.
Also noted in Figure 1.4.2-1 are the major study milestones including progress reviews and period-
ic reports presented during the study.
1.5 STUDY PRODUCTS
1.5.1 Task/Product Relationships
The study plan contains the planned tasks which when executed resulted in satisfying the study
objectives. This process is carried out through the development of the study products. The
minimum required study products identified in the contract axe:
.
2.
3.
4.
5.
6.
7.
8.
9.
10.
11.
12.
13.
14.
LRB Ground Operations Plan
LRB Processing Timelines
LRB Facility Requirements and Concepts for New Facilities
LRB Launch Support Equipment Definition
LRB Ground Support Equipment Definition
LRB Manpower
Cost Estimates Including Transition
Potential Impacts to On-Going Launch Site Activity
Preliminary Transition Plan
Potential Environmental and Safety Implications
Propellant Acquisition,Storage and Handling Requirements
Recommended Changes to LRB Design for Operational Efficiency
A detailed User's Manual for GOCM Operation
Instructions for Updating/Modifying the GOCM Program
1 -16

_S-BASIC STUDY M A M J J A S O N D
MILESTONES
PROGRAM REVIEWS
CONTRACT AWARD
NOTIFICATION OF CONCURRENT OPTION A
STUDY PLAN REVISION/APPROVALS
PROJECT REVIEWS
MONTHLY PROGRESS REPORTS
WORKING GROUP/BI-MONTLY MEETINGS _b,
)OWPI SEU "CT R -VIEV_
$ $ 0
KSC
MSF KSC• l_,di= • 1=,41L ,d • Msr-c_IIL A 4_ 4L ,L_°
PROJECT STUDY TASKS
1. BASEUNE
2. LRB REQUIREMENTS
3. LRB SCENARIOS •
4. IMPACT ANALYSIS
5. DESIGN RECOMMENDATIONS i
6. LAUNCH SITE PLANS
7. FOLLOW-ON RECOMMENDATIONS • i(OPTIONS/PROPOSALS)
8. FINAL REPORT
9. GROUND OPERATIONS COST MODEL _ IL -- -- --
J__ it
i roll
% COMPLETE
81012-02B
Figure 1.4.2-1. LRB Integration Study Schedule.
1 - 17
2-1.3 11/19 11._X)a

15.
16.
All Software Developed
Recommendations for FoUow-on Study Activity
During the course of study activity additional products were defined by the Study Team in order to
more fully meet the study objectives. These added products are:
17.
18.
19.
VLS Assessment for LRB
LRB Engine Processing Study
Evaluation of LRB Processing and Storage in the VAB
In order to ensure the timely development of these study products a Task/Product Matrix, Figure
1.5.1-1 was developed. Here, each of the study products is represented as an output from a dis-
crete task. In some cases, other tasks support the product development and are so noted. The
study team found that assignment of each product to a defined single task resulted in better trace-
ability of responsibility and timely study progress. Task leaders were then directly accountable for
defined study products.
Volume II1 of this final report contains a comprehensive presentation of these 19 study products.
1.6 MSFC PHASE-A SELECTED LRB CONFIGURATIONS
1.6.1 GDSS/MMC LRB Design Approach
After the identification of selection criteria both General Dynamics and Martin Marietta pro-
ceeded with a series of trades and analyses resulting in a Phase-A down selection of the fmal LRB
concepts. It is significant to note that MMC and GD considered launch site compatibility as a
primary selection criteria and worked closely with the LRBI Study Team during the selection
process.
All selected configurations were capable of STS/LRB delivery of 70,500 pounds to 150 nautical
mile, 28.5 degree inclination orbit. Both pump-fed and pressure-fed configurations were evaluat-
ed. Propellants considered were RP-I, methane, propane, hydrogen and hypergols. Trade studies
included recovery concepts, split expander engine designs, optimum number of engines, and
launch ignition sequencing.
1 - 18

, _.._NOO_,_N S X X
. ,,,=.,,-Y___pTs S X X
" _-._ S X X
9 PRELIM INARY TRANSITION PLAN S X X
,, ,,,_,_s,,:_,,,_.,_ X X12 DESIGNREC/OPER EFFlC E NCY S X X
.. _..s_,_s X X,_ Go__,_,,,_ XX
,, ,,.s,__,,,_,,_.. S X X
19 LRB PFIOCE_O_GIE INVAB S X iX
S - SUPPORTING INPUT (TASK/PRK:X)UCT)X - PRIME T_T
81012-02D Figure 1.5.1-1. Study Tasks/Products Relationships. 2-1.4 11/11 lO:OOa
! - 19

The following basic groundrules were established:
A requirement for safe abort (or ATO) with one LRB engine out
Minimum Orbiter and ET hardware changes
Maintain existing Booster - ET interfaces
Maintain or lower peak Orbiter wing loads at max Q
Relieve SSME throttle down requirement at max Q
Minimize changes to KSC facilities and integrated processing
Consider design for growth and evolution to other booster applications
1.6.2 Configuration Details
The final LRB propellants for each of the Phase-A contractor configurations were selected after
extensive trade studies. The primary pump-fed and pressure-fed configurations use LOX/RP-I
propellants. The GDSS altemate pump-fed booster uses LOX/LH2. The following discussions
describe other configuration details for each contractor's LRB selections. Physical characteristics
of each configuration, as of the June 1988 f'mal oral reviews at MSFC, are presented in Volume V,
Appendix 20-6.
Martin Marietta Configurations
The MMC pump-fed configuration is shown in Figures 1.6.2-1 and 1.6.2-2. Dual LOX external
feedlines of 17-inch diameter route the oxidizer around the RP-I tank. The forward thrust at-
tachment to the ET is located in a reinforced forward skirt area. Elliptical bulkheads are used on
all tankage. Overall dimensions are close to SRB size. Weights and volumetric data are present-
ed in Figure 1.6.2-3.
The MMC pressure-fed configuration is shown in Figures 1.6.2--4 and -5. The feedlines are exter-
nal 24-inch diameter (dual). Tank wall thickness is approximately l-inch to contain the intemal
tank pressurization levels. With engine chamber pressures of 660 psi. tank pressures axe in the
range of 1000 psi. Full hemispherical tank bulkheads are used. Booster Gross Liftoff Weight
(GLOW) is over 1.3 million pounds as shown in Figure 1.6.2-6 (SRB liftoff weight is approximate-
ly 1.25 M pounds). Also shown in this figure are the other weights and volumetric data. More
definitive design details of the Martin configurations were presented in their final oral presenta-
tion charts of June 1988. All MMC engine designs for LRB were developed by Aerojet Corp.
under subcontract.
I - 20

52.4'
150.9'
15.3'
]I I
t17.3'
81012-02J
Figure 1.6.2-1. MMC Pump-Fed LO2/RP-1Vehicle Configuration (10/6/88).
! -21
MANNED SPACE SYSTEMS
2-1.5 11/19 11:00a

LRB FWDATTACH FRAME
FORWARD
11752
181
110
629
FWD A'FI'ACHPOINT
183.00 O/D
AFT TANK-RP-1
LRB AFTATTACH FRAME
SS DOOR184
t207
AFTATTACH FRAME
265.90 DIA
MANNED SPACE SYSTEMS
81012_2N1
Figure 1.6.2-2. MMC Pump-Fed LO2/RP-1
Booster Configuration.
1-22
2-1.5 11119 11.'00s

VEHICLE DIMENSIONS
• LENGTH (IN)
• DIAMETER (OO - IN)• ENGINE EXITAREA (IN 2)
pFiQpELLANT VOLUMES (FT 3_
• LO2
• RP-1
• FEEDLINES
1,810.7183.0
7,359
10,769
5,798245
WEIGHT (LB_ INCLUDES 10% CONTINGENCY
• STRUCTURE
• PROPULSION SYSTEM
• OTHER SUBSYSTEMS
• USABLE IMPULSE PROPELLANT
•LO2
• RP-1
• RESIDUALS GASES AND LIQUIDS
GLOW (GROSS LIFTOFF WEIGH'13
PROPELLANTS/GASES
77,840
34,820
11,060
123,720
701,302
268,698
5,335
975,335
1,099,055
@MANNED SPACE SYSTEMS
81012-02Q/CK1
Figure 1.6.2-3. MMC Pump-Fed Vehicle Data Summary (10/6188).2-1.5 11119 11:00a
1-23

162.7'
I
25.8' DIA
IJI
I
21.0"
117.3'
!
MANNED SPACE SYSTEMS
81012-02P
Figure 1.6.2-4. MMC Pressure-Fed LO2/RP-1Vehicle Configuration (10/6/88).
1.24
2-1.5 11/19 11.1)0a

THRUSTFEI-I'INGSANDLONGERON- /
ET/t.RB FWD AI-I'ACH
FORWARD TANK-LOX J
AFT TAN! \
BOOSTER SEPARATION
t
_BOOSTER SEPARATION MOTORS
HELIUM IRESSURANT TANK
_.-- ACCESS DOOR
[ \
23O _,.J
593 = I
1 152
265_J
f_fEm
252
"-LI_
DOOR
336
m
m
_.¥_
310.0 DIA
194.00/D
AFT ATrACH
81012-02N
MANNED SPACE SYSTEMS
Figure 1.6.2-5. MMC Pressure-Fed LO2/RP-1
Booster Configuration (10/6/88). 2-1.s 11/19 11.ooa
1-25

VEHICLE DIMENSIONS
• LENGTH(_• DU_E'rER(OO-_• ENGII_E EXIT AREA (_I 2)
PROPELLANT VOLUMES (FT3_
• LO2
• RP-1
• FEEDLINES
1,952.0194.0
9,365
12,012
6,328
214
WEIGHT _B'b INCLUDES 10°/oCONTINGENCY
• STRUCTURE
• PROPULSION SYSTEM
• OTHER SUBSYSTEM_
_WE_HT
• USABLE IMPULSE PROPELLANT
oL(_2
• RP-1
• RESIDUALS GASES AND LIQUIDS
• HELIUM-PRESSURE SYSTEM
• PFK_ELLANT-PRESSURE SYSTEM
GLOW _ _ WEGI-Fr_
PROPELLANTS/SYSTEMS
166,760
44,030
10,730
221,520
782,084
292,916
5,910
11,790
22,56O
1,115,260
1,336,780
MANNED SPACE SYSTEMS
Rgure 1.6.2-6. MMC Pressure-Fed Vehicle Data Summary (10/6/88).81012-02M 2-1.5 11/19 11:00a
1-26

General Dynamics Configurations
The three LRB configurations recommended by GDSS are presented in Fig. 1.6.2-7. During the
f'mal evaluation GDSS deleted the LOX/CH4 split expander configuration after studies showed
no significant advantages over the basic LOX/RP-I pump-fed option. However, the split expan-
der engine design was considered significant and is being carried as an optional design for the
LOX/LH2 configuration. The GD pump-fed and pressure-fed configurations are LOX/RP-1
designs. The LOX/LH2 configuration is proposed as an alternate pump-fed design. A unique
feature of the pressure-fed design is the central 24 inch diameter LOX feedline which penetrates
the lower fuel tank.
Selected data on the GDSS configurations is compared with the SRB characteristics in Fig. 1.6.2-7.
More definitive design details of the General Dynamics configurations can be found in their fmal
report presented to MSFC during August 1988. All GDSS engine designs were developed by
Rocketdyne under subcontract.
At the writing of this final report GDSS was engaged in optimizing the length vs. diameter trade
study for the LOX/LH2 pump-fed configuration. The current configuration shows a diameter
growth to 18 feet and a shortened height of 168 feet. This length allows clearance of the ET GOX
vent ann at the pad and prevents a major ground system modification. Additional size trades were
in work at our print time to configure this LRB for altemate (non-STS) applications.
1.6.3 Launch Site Design Recommendations
LRB flight article design features which would enhance, simplify or streamline ground processing
operations at the KSC launch site have been identified and provided to MSFC and the Phase-A
contractors.
Feedback on these recommendations was provided and many features have been incorporated
into the Phase-A designs. In addition, the KSC facility constraints have been identified and all
proposed designs have been affected by these STS constraints. Attempts have been made to
minimize the magnitude of required launch site mods (i.e. the pad flame trench) due to the ex-
tended mod period required. Impacts to on-going launch operations can thus be reduced.
1 - 27

,\m
N
i
m
1 ' -- 147'
b _r
['-" /_/1_
le
I.v
Ie
I
I
e
I
tu
1"41 a'w v.ml'
168 •
DATA
(ONEBOOSTER)
SOLIDFIOCKET
BOOSTER
BECO (Nc)
LO2/FIP-1PUMP FED
LO2/1Jq2"PUMP FED
LO2/RP.1PRESS FED
DRY WEIGHT (K bs) 146 104 131 216
STRUCTURE (K I_) -- 46.7 75.6 127
LR8 GLOW ( K I_) 1,250 1,032 775 1,602
THRUST PER ENGINE 2,912 546 481 850(sea level)(K 1106)(nominal)
INITIAL T/W 1.S 1.37 1.34 1.S4
120 123 126 119
• N.TE_TE: SPLITEXPANDERCYCLE
81012-02S
Figure 1.6.2-7. GDSS Selected LRB Configurations - October 1988.2-I 11/11 10'JO01
1-2:8

Figure 1.6.3-1 summarizes the launch site LRB design recommendations and indicates those
incorporated into the Phase-A LRB designs. Question marks indicate further analysis required
before incorporation, "N.A." indicates recommendation not accepted and "poss.alt." indicates
possible ahemate design approach under consideration.
1.6.4 KSC Requirements Checklist
Early in the LRB evaluation process our study team drafted a "KSC Requirements Checklist for
LRB". This document, after review and approval at KSC, was circulated to the Martin and
General Dynamics Study Teams. The checklist is designed in the form of a questionnaire on
ground processing requirements for LRB. Responses were received from both of the flight
element contractors and are included as Appendix 20-1 and 20-2. The format of the checklist
addressed both general groundrules and specific categories of requirements. Figure 1.6.4-1
presents the organization of topics within the checklist.
During the evaluation process a series of "generic" answers to this questionnaire were developed
by LSOC and LESC personnel in order to document a baseline definition of pump-fed and pres-
sure-fed configurations for JSC and KSC integration analysis. However, because the configura-
tions remained in a state of evolution over the study period these generic answers do not corre-
spond to any specific selected configuration. The generic draft copy developed for launch site
analysis is presented in Appendix 20-3.
During Phase-B preliminary design it is anticipated that the requirements checklist will be updat-
ed to be descriptive of the final selected LRB configuration. A blank checldist for this purpose is
presented in Appendix 20-4.
1.6.5 LRB Design Requirements Assessment
Our Study Team performed an assessment of the documented LRB Design Requirements found
in the General Dynamics final report. These requirements were developed from study goals and
assumptions and applicable program level requirements fNS'rS 07700, etc.). This section from the
GDSS final report is presented in Appendix 20-5. A sunmaary of the findings is shown in F'ggure
1.6.5-1 where the total requirements in each of 5 categories is identified. The number of requhe-
ments judged to have ground system design impacts are noted in the right column. Almost 70% of
these preliminary booster design requirements have ground system implications. We can see from
this assessment that booster design and ground system design/redesign will be a significant inte-
gration challenge during the Phase B study. Data from the MMC requirements is expected to
1-29

INO3RPCX_TEDDESIGN
FEATURE
,/
DESIGNI:EC_MMENDA_
• NO HYDRAUL_ HYDRAZINE
• USE LFT-OFF UMBILICALS-NOSW1NGAF_MSOR LUT
• MAXEdUMLRBDIAMETERLESSTHAN16FEET
? • LOCATEAVIONICSLRLrsINAFTSKIRTAREA
• FACILITATEENGINE FI/RIN VERTICALON MLP
• USE EXPENDABLEDESIGN
• LOX/RP-IPROPELLANTSHAVEMINIMUM PAD IMPACTS
? • NO FLAMETRENCH (CONCREI_ MGOSAT PAD
• FACI.ITATEVERTICALAND _AL CHECKoLrr
• MAKEBOOSTERAUT_ WITHM_IMUM _ INTERFACES
? • USE SEPARATEBOOSTER DOWNLINK(FIF)
• FACILITATESEPARATELRBSTANDALC_IETEST ANDCHECXOUT
• ON BOAF_ LOXVENTS/NO BEANIECAP
POSS. ALT. • HARDMOUNTEDENGINES(NO771FCdldBALSFORTVC)
_' • MINIMIZEETMOOS
N.A • EUMI_TE ENGINE PURGES, BI.EF.DSAND SPECIALPREPS
• (:X:X_IS[_ EXIBINAL POD FORA_ AND BATIBIES TO
N.A. FACILITATEACCESS AND EASEOF
81012-0"_-I
,/• AVOID FIFF,H/U_rTTRUNKS (TRAPS)IN PIREX_LLAN'rUNESTHAT
_ SPEC,IALATrEI_rrlc_I_I
F'_um 1.6.3-1. KSC-LRB Design Recommendations.
1-30
2-1.5 11/11 lO:OOa

PROPERTIES
• BOOSTER PROPERTIES
- PUMP-FED- PRESSURE-FED- SPLIT EXPANDER
• PROPELLANTS
-- LOX / RP-1- LOX / LH2
i i x-
GENERALREQUIREMENTS
• CONFIGURATION DATA
• EQUIPMENT DESCRIPTIONS
• OPERATING CRITERIA
• INTERFACE REQUIREMENTS
• LAUNCH SITE CONSTRAINTS
• HANDLING REQUIREMENTS
SYSTEM-SPECIFICREQUIREMENTS
• RECEIVING / HANDLING
• ASSEMBLY / PROCESSING
• INTENTION
• SAFETY / ENVIRONMENTAL
• SPARES / LOGISTICS
• TEST / CHECKOUT
• PRE4_AUNCH
• GROUND SOFTWARE
• LAUNCH OPS
• ABORT/SCRUB
• RECOVERY
• REFURBISHMENT
81012-02R
Figure 1.6.4-1. LRB Requirements Checklist Categories.
I -31
2-1 11/19 11:00a

ITEM*
A. GUIDELINESGOALS, ASSUMPTIONS
B°
C°
LEVEL I REQUIREMENTS
(SPACE TRANSPORTATION SYSTEM)
LEVEL II REQUIREMENTS
(SPACE SHUrrLE VEHICLE)
D. LEVEL III REQUIREMENTS
(LIQUID ROCKET BOOSTER)
E. LEVEL IV REQUIREMENTS
(AVIONICS / FIT CONTROLS /SEPAPATION
SYSTEMS)
TOTALS
TOTAL
12
8
NUMBER wrrH _D
SYSTEMS IMPLICATIONS
11
8 4
11 9
9 2
48 33
* SEE APPENDIX 20-5 FOR COMPLETE LISTING OF DESIGN REQUIREMENTS FROM GDSS FINAL REPORT.
81012-02X/CK1
Figure 1.6.5-1. LRB Design Requirements Summary.2-1 11/19 11:00a

show the same trends. As of this report's printing time the MMC final report had not been re-
ceived.
1.7 CONCLUSIONS
The LRBI Study findings and conclusions are described in Volumes I and II of this f'mal report.
Definitive reports on each of the nineteen study products are presented in Volume HI. The fol-
lowing sections describe the major findings and conclusions in summary form and illustrate the
major project planning issues for launch site integration of the LRB system. The section is con-
cluded with a description of major issues recommended for follow-on study.
1.7.1 Processing Scenarios
The Study Team assessment of the KSC launch site integration of LRB processing and launch
operations have resulted in the formulation of the launch site scenarios presented in Figure 1.7.1-
1. This scenario begins with the anticipated delivery of the assembled boosters by barge to the
turn basin near the VAB, followed by offload of the boosters via towed transporters. The boosters
are then towed to the Horizontal Processing Facility (HPF) where all standalone checkout and
flight certification activities are performed. The boosters begin the integrated part of ground
processing by being towed (still on the delivery transporter) to the VAB. After all MLP prepara-
tions are completed the LH and RH boosters are rotated and lifted up into the new HB-4 integra-
tion cell where they are mated and aligned on the MLP holddown system. As noted in the figure
the MLP is new and custom-built for the LRBs. The remainder of VAB operations are similar to
current procedures. The ET is mated to the boosters, followed by closeout operations and prepa-
rations for Orbiter mate. Following Orbiter mate, the all-up Shuttle Integrated Test (SIT) i._
performed.
Transfer to the Pad via the crawler transporter is followed by standard SSV to Pad interface
checks, payload ops and system readiness checks. The LRB fuel loading (if RP-I is selected) can
precede the countdown ops by several days. Existing LOX and LH2 (if selected) propellant facili-
ties will be modified to provide adequate storage and transfer capabilities to support LRB re-
quirements. Loading software and procedures will be updated to accommodate LRB.
/
1-33

OPF/ORBITERPROCESSINGUNCHANGED
BARGE
ELtVERY
NEW MLP (2)
_T/t.RB
HORIZONTALPROCESSINGFACILITY
NEW iINTEG.
C:L __ VAB MODS I
LETF SUPPORT "_'_ LCC MODS
Figure 1.7.1-1. Preliminary LRB Scenario.
• LRB BARGE ON DOCK KSC
I 18• OFFLOAD/TRANS
TOHPF• REC4NSP• SYS FUNCT
CHECKOUTS• ENGINE/PROP
SYS LEAK &FUNCTIONAL
I LRB STANDALONE CHECKOUT (5/3)
,I, LRB MOVE TO VAB
'--'1 MLP MATE & CLOSEOUTS (7/'3)
•ETMATE
I 11
I LRB FLOW. 58 DAYS II
I ET/LRBCLOSEOUTS(7/3)
S IORBMAI--_NTEGSYSTEST(7_)
SSV PREPSKRANSFER TO PAD •
I• SSV STD OPS• PAYLOAD OPS
2O
eCDOT• LRB ENG SYS READINESS• LRB FUEL ) TANKINGORB Hyp' RE(RL)OAD/CLOSEOUTv
• LAUNCH COUNTDOWN(INCLUDING CRYO LOAD)
Figure 1.7.1-2. Generic LRB Process Flow.
81012-02V
]-34
lr, LAUNCH(S/3)
2-1 11/11 10:(X]la

The overall LRB scenario will incorporate planned testing support at the Launch Equipment Test
Facility (LETF) and significant modification of application software and new fLring room consoles
in the Launch Control Center (LCC).
The timeline for a typical LRB flow through this launch site scenarios is presented in Figure 1.7.1-
2 where a summary of the 130-item task processing schedule is illustrated. Flow time in work
days is shown to total 58 days from receipt of booster hardware to launch. This same span for
SRB is 78 days. Therefore LRB operations should result in lowered demand on launch site re-
sources for the same sustained flight rate or, alternately, the enhanced potential for increased
launch rate capability. This is illustrated in Figure 1.7.1-3 where SRB and LRB flows are com-
pared.
Detailed timelines for LRB processing are summarized in Study Product 2, Volume III. A sum-
mary of integrated processing timelines for the transition period is presented and described in
Study Product 9, Volume Ill, Preliminary Transition Plan.
1.7.2 Impacts to On-going Activities
Potential impacts to launch site on-going activities can be summarized in three major categories
(or phases):
1. Facility Activation
- Design/Modification/Verification
2. Transition
- LRB start up/and increasing launch rate
3. Operational Phase
- Mature multiflow launch rate capability with LRB
Each of these phases was evaluated to establish impacts in the attributes of manpower, schedule
and costs.
The implementation of effective LRB operations will require the following major provisions:
• An activation management team to affect the facility activations, modification and verifica-
tions with minimum impacts to existing launch operations.
! _i 1 "35

WORK DAYS
SR8 LR8 % REDUCTION
VAB HB (INTEG CELL) 21 4 81%
MI.P US_ PER FLOW 55 40 27%
INTEG CRITICAL PATH
(BOOSTER STACK TOORB MATE) 32 15 53%
PAD FLOW 18 20 -I I%
BOOSTER FLOW (PRE-I.AUNCH) 78 58 25%
81012-02T
F_gure 1.7.1-3. SRB/LRB Flow Comparison.
1-36
2-1 11/11 10:00..

• Dedicated manpower, trained and certified for LRB processing.
• Effective planning for LRB launch rate build up and integration with on-going launch ops.
• Advanced budget provisions (C of F and R & D).
• Integrated planning with the flight hardware contractor using the assistance of a launch
support services function.
• Documentation of procedures and planned support functions.
• Effective project management, tin,ely analysis and decision making.
Using the overview of the launch site plan shown in Fig. 1.7.2-1 the three basic phases of the
project can be seen to span a period of approximately 16 years at the launch site. The launch
profile portion of the "life cycle" of the LRB program extends over 122 LRB missions. This profile
was used by all LRB planners for LCC recurring cost evaluations. The major issues of facility
activation and transition requirements over these launch site phases are summarized in Figure
1.7.2-2.
1.7.2.1 Facility Activation
The initial facility activation phase (FY 91 through FY 95) consists of the design, construction and
modification of the first line facilities required for LRB initial launch capability (ILC). During
this period the major potential for impact to KSC on-going launch operations are:
I. New Facility Construction - HPF and MLP #4 for LRB: These new facility activations will be
monitored by the processing contractor. Design/construction will be by outside A & E firms.
Although in the LC-39 area, the planned sites should offer no significant schedule, manpower
or cost impacts to on-going launch operations. Risks of delays to LRB implementation do
exist. Funding and ATP must support FY91 Phase-C/D go ahead for the design and construc-
tion of these new facilities.
, Existing Facility Mods - VAB/I-IB-4 will be converted to a full SSV integration cell. New
superstructure and extensible platforms would be added to support LRB/ET and Orbiter
integration and test. This work will be scheduled and carried out on a non-interferen_ basis
with on-going VAB operations. Techniques such as remote platform construction and off-
shift installation should be exercised to avoid schedule impacts due to safety clears etc. These
roods will be designed by the processing contractor with construction performed by an outside
1
1 - 37

I 1991 II 111993 II 111995 111997 II 111999 II
II 14 - SRB
I O- LRB
xL_XL..Ax_x_x..xA,, FACILITIES ACTIVATION _////M__STS TRANSITION PHASE
t PHASE /f_
I(SRB CAPABILITY
(GROUND OPS PLAN) RETAINED)
(PRELIMINARY TRANSITIONPLAN)
0 - SRB14- LRB
FULL OPERATIONAL PHASE
LRBLAUNCH SITE PLAN"
"TIME LINE BASED ON ACCOMPLISHING A MINIMUM OF 122LF_ BOOSTER MISSIONS IN THE PROGRAM LIFE CYCLE
81012-02U
Figure 1.7.2-1. Launch Site Plan Overview.2-i 11/11 lO:O0a
1 - 38

TODAY'S FACILmES
USEASIS• BARGE DOCKS
• OPF
• VAB HIGH BAYS
• CRAWLERWAY
eLET1 =
• LCC
• LAUNCH PAD FAC
• ELEC. PWR. DIST.
ADDn'IONAL FACILmES
• LRB/ET PROCESSING
• MLPs
SUPPORTING
• OMD
• OMI/PMONIs
SOFTWARE CHANGES
• RSLS & GLS
• FL_HT
• ACTIVATION
• BUDGET
• AUTHORITY
• CONTRACTS• ENGINEERING
• PROCUREMENT
• CONSTRUCTION J
• INSTALLATION J
• VERIFICATION
• TURN OVER J
• CERTIFICATIOy
TRANSR1ON
j/_ HARDWARE ONDOCK
//_ bUTIAL LAUNCHCAPABEn'Y
GRADUATED LAUNCH RATE
3 MISSIONS IN 1996
GAPABLIIY
6 MISSIONS IN 1997
9 MISSIONS IN 1998
12 MISSIONS IN 1999
14 MISSIONS IN 2000
TRANS_COMPLETE14-LRB 0-SRBMISSIONS/YEAR
OPERATIONS
(MINIMUM SUSTAINED
LAUNCH RATE 14/YR)
FUTURE POTENTIAL
• SHUTrLE _'
• ALS
• STANDALONE
81019-04B1
Figure 1.7.2-2. LRB Launch Site Plan Synopsis.
I - 39
2-1.7 11/11 lO.'00a

fixed price contractor. Manpower and funding requirements have been identified; however,
risks of schedule and cost still remain.
. Pad B Mods - Pad B has been selected for use on initial LRB launches due to the cycles of
normal mods and update intervals which places Pad B in line for an upgrade at about the
thneframe of LRB activations. Inlpacts with planned launches at Pad B during this mod
period will be avoided by diverting certain SRB launches from Pad B to Pad A. Exclusive
access for the modifications is needed for the last eight months leading up to Pad certification
for LRB. The diversion of on-going launches to a single Pad poses one of the highest poten-
tial risks for STS launch impact or delay in the implementation of facilities for LRB. Mods
for LRB axe planned to retain existing MLP-to-Pad capability for SRB/STS launches after
conversion. Potential schedule impacts could occur at the Pad if required mods grow more
significant. For example, flame deflector, vent arms and flame trench (concrete) roods are
potential "hitters" due to the increasing diameter of recent LRB configurations. In addition,
any anomalies discovered during the planned LRB "Pathfinder" flow could delay LRB
implementation placing more SRB launch schedule pressure on Pad A. Manpower and
funding requirements axe included in our activation plan.
. Other Facility Mods - The LZrF must support the development and verification testing of all
MLP mounted launch support equipment (LSE). The facility will be modified to support this
testing and the manpower, schedule and funding have been identified. No other significant
impacts are anticipated in this "so-called" off line facility modification. The Launch Control
Center will be modified with new software and consoles for LRB processing and launch
support. By specifying a standalone mini-LPS at the HPF the existing control rooms will be
relieved of the need to support standalone LRB operations. However, LRB integration in the
VAB will require control room interfacing with LRB systems and, of course, all pad launch
operations will require this monitoring and control interface. Potential impacts to on-going
LCC operations can be anticipated with four firing rooms supporting SRB launches at a rate
of 14 per year while part of the system is in mod to support software and console mods for
LRB. Careful scheduling of these LCC activities is required to avoid impacts. Implementa-
tion of the second generation LPS will be significant in easing the impacts of LRB activation.
I -40

1.7.2.2_
The transition from SRB launches to LRB launches is planned over a 5 year period, FY 96
through FrY 2000. The LRB launch rate builds up in a 3, 6, 9, 12, 14 ramp during this period and
additional facilities are required to achieve these increases as illustrated in Figure 1.7.2.2-1.
This study has proposed and evaluated a five year transition period planned to avoid unpacts to
on-going launch operations. However, potential impacts during transition still exist and must be
addressed during the anticipated Phase B activity. The major potential risks during transition are
identified as follows:
. Manpower - KSC and the Shuttle Processing Contractor must map out the manpower imple-
mentation plan for LRB and take the necessary steps before LRB introduction to hire and
train an initial core LRB processing and launch team. This initial team, although small, must
be "KSC-wise" and have representative talent from each of the major LRB processing and
launch operationsareas. The integration of this LRB team and its functions into the on-going
operations during the transition period will prevent major disruption in the continuing launch
processing activities. The impact to KSC will be the costs of parallel staffing initially for this
dedicated function plus the potential loss of talent from existing resources when staffing from
within is selected. Staffing and manpower requirements for LRB are discussed in Study
Product 6, Volume HI, and the Launch Site Plan, Section 2 of this volume.
. Costs - Provisioning of the major C of F and R & D funds required to carry out the initial
facility activations is crucial to the implementation of LRB initial launch capability. During
transition the success of increasing launch rate for LRB will also depend on continued funding
of the second line of required facilities, i.e. conversion of HB-3 to support LRB and the
second new MLP and second pad modification. All launch site cost aspects for LRB imple-
mentation both non-recurring and recurring are discussed in detail in Sections 2 and 4 of this
volume.
3. Sc_dule - The highest potential for schedule impacts during LRB transition can be found in
the integrated functions of STS launch processing. Major areas are:
VAB
Initial integration for all LRB launches will be processed in HB-4. However, in the third year
of transition near a LRB launch rate of nine per year an additional integration cell will be
required to support the continued launch rate build up. Of course, by this time the SRB rate
1 -41
119901i i 11,,21 I1,,,I
1St LINE ACTIVATION
1st LRB MLPET/LRB HPFVAB HB-4 MOD1st LAUNCH PAD LRB MODLETF MOOSLCC/LPS MODS
1 1"981 1200012°°2112°°4112°°6114-11 SRB
0-3 LRB
ILC _ 11-8 SRB
3-6 LRB
_c !o_o.s81 M_ Tol"_1=UNECAP_IL_3 I _ I _ I _ I _ _ I _ I _ I' I_1 _ I
1 J2nd LRB MLPVAB HB-3 MOD _ 8-5 SRB2nd PAD LRB MOD ,_.___ 6-9 LRB
-I_ 5-2 Sl _B9-12 LRB
2-0 SRBL._ 12o14 LRB
! 1 I 4 I 6
s.B,.,,ss_.sll.,,., 1., ,.,u_B,.,_s, o Io Io Io11 8 5
O_E_T,O.S._*Oo,'rION_M,SS_C_.B,U_I _ I ' I ' I _ I _ I
olololololo ITOTAL LRB MISSIONS THRU MID-2006=122
81012-02W/CK1
Figure 1.7.2.2-1. KSC SRB to LRB Transition Plan.
! - 42
2-1 11119 11:00a

has decreased to six per year; all of which can be processed out of a single high bay. This
makes HB-3 available for conversion to LRB compatibility. This conversion is planned on a
non-interferance basis with on- going VAB operations. Careful integrated scheduling will be
required during this period to avoid delays and schedule impacts.
Pad
Much as Pad B mods offer the highest potential schedule impact during initial activation, so
do the mods at Pad A offer the highest threat to launch impact during the transition phase.
During the last (5th) year of transition, in order to meet the full 14 mission goal, Pad A must
be taken out of service for eight months for LRB modification. During this period all launch-
es must be conducted at Pad B. Some added benefits will be possible due to lessons learned
during the earlier Pad conversion. Although a threat to schedule, this impact can be planned
with more confidence. Unique launch windows will cause added challenge for single pad
support to the launch manifest.
This brief summary of transition impact issues is taken from the major findings in our preliminary
transition plan described in detail as Study Product 9, Volume IN.
1.7.2.30p¢_ rational Phase
After transition to LRB the full beneficial aspects of LRB over existing SRB operations will be
realized. The schedule pressure on integrated resources is significantly reduced. The increased
flexibility of booster operations permits the integration of alternate vehicles such as Shuttle C,
ALS and standalone ELVs with significantly lower launch site impacts.
No significant launch site schedule impacts are envisioned in the operational phase. Manpower
requirements will peak during the transition phase dual (SRB/LRB) launch operations. On-going
LRB processing activities are fully staffed for the planned 14 - 15 launch manifest. Costs at the
launch site during the operational phase are considered to be significantly lower than that
planned to support the SRB launch processing. This lower operational cost at the launch site is
due mostly to the elimination of booster retrieval, disassembly and refurbishment operations. A
full discussion of launch site life cycle cost issues is presented in Sections 2, 3 and 4 of this volume.
1.7.3 Major Issues for Follow on Study
I
1 - 43

During the performance of the first phase of the LRB Integration Study the study team developed
analysis techniques and launch site models which are universally applicable for the evaluation of
any new element integration activity.
The LRB Phase-A contractors for MSFC have moved into the definition of altemate LRB appli-
cations in their current contract extensions. In order to continue the integration of launch site
aspects in the planning for these new LRB configurations, LSOC proposes to apply these newly
developed techniques and models in the evaluation of launch site requirements, scenarios, impacts
and costs for altemate applications of LRB. The following outline of tasks describes the approach
to this optional study in two major areas: 1. Application of LRB to alternate launch configura-
tions, and 2. Analytic Model Improvements. Detailed descriptions of approaches and subtask-
breakdowns are described in Study Product 16, Volume m.
A. Application of LRB to Altemate Launch Configurations
Launch Site Requirements Definition for Alternate Configurations
Expand the dialogue with flight hardware design teams and begin merging launch site integration
planning with altemate vehicle system design. This will achieve control of life cycle cost elements
and will assure the satisfaction of anticipated requirements in the areas of:
• Processing/lVlaint ainability
• Launch Operations
• Recovery Operations
Candidate Scenarios for Study
Establish candidate launch site scenarios with efficient ground operations concepts for the follow-
ing:
• Payload Canister/Shroud Flow
• Core Vehicle Flow
• Booster Options/Processing Approaches
• Vehicle IntegrationfLaunch Processing
1-44

Preliminary Facilities Plan
Evaluate horizontal vs. vertical processing for the altemate configurations. Evaluate existing facil-
ities and required modifications vs. new facility requirements. Use of MLP vs. alternate ap-
proaches should be evaluated. Candidate design concepts at Pad "C" should be defined and
evaluated for the alternate vehicle designs. Define impacts to on-going STS Operations for the
transition to support the alternate applications and evaluate the envelopes of minimum impacts at
each required station set. Evaluate the potential shared use of STS facilities and GSE/LSE.
B. Analytic Model Improvements
Processing Flow Model Improvements
The SRB/STS Ground Processing Flow Model is an Artemis network based planning tool. It
provides timeline visibility for facility planning and utilization at the launch site in a multi-mission
environment. The model is based upon a generic set of ground rules and assumptions which are
incorporated as the network database. The LRBI Study Team was provided this model configured
as the SRB/STS ground processing baseline. The model was manually revised to incorporate
multiple LRB flows and used in mixed fleet (SRB/LRB) impact analysis.
These manual manipulations were time consuming and laborous. It is apparent that the utility of
the modeling could be enhanced by the incorporation of an automatic generator for mixed fleet
scenarios.
An enhanced STS Ground Processing Flow Model has the potential, to be a useful tool for ad-
vanced programs schedule and resource analysis. It can be tailored for multi-mission, mixed fleet
evaluation and standardized impact analysis for any new vehicle integration at the launch site.
Modif-y/Update GOCM
Post 5 I-L ground processing environment must be incorporated into GOCM as derived from KSC
ground processing operations. Simultaneously, GOCM needs to be redeveloped using a more
capable software system in order to achieve greater friendliness, and application. Another pro-
posed modification is the incorporation of a mixed fleet (STS and alternate vehicle) capability into
GOCM.
The KSC Ground Operation Cost Model (CK)C_) is now capable of analyzing costs of both Solid
and Liquid Booster configurations launching concurrently during the same fiscal year. This
capability for STS-type vehicles provides more flexibility in the model to analyze alternative
scenarios. It is recommended that this enhancement be further developed to include mixed fleet

capability for two altemative shuttle type vehicles such as in the Shuttle II and Shuttle C configu-
rations. Results from these studies should be incorporated into the GOCM database.
This enhancement to GOCM would increase the utility of the cost model and allow greater flexi-
bility in the analysis of ahemate vehicle configurations at KSC. A mixed fleet analysis is essential
to evaluate the phase-in of new programs while existing programs are in place, or are being
phased out.
Develop GOCM II
Design and implement a ground processing cost and schedule assessment system which will serve
future program planning at KSC. The ability to tailor a GOCM type modeling system to a specific
application and phase of study requires the concept of modularity to be employed. Many GOCM
features today would just as easily handle parameters developed from accounting techniques, as
well as the current configuration which was developed parametrically. Therefore, with further
refmement, GOCM could span the vast needs for costing over a wide range of study phases. Both
types of costing could be performed 1) the quick broad response obtained from parametric as-
sessment and 2) the focused, detailed accounting cost technique. These capabilities would be
available in various mixes for each application.
1 - 46

VOLUME IISECTION 2
LAUNCH SITE PLAN
This plan summarizes the costs, implementation plans for the facilities and manning, and identi-
fies the support requirements at Kennedy Space Center (KSC) to integrate the Liquid Rocket
Booster (LRB)into the STS program. Information is presented on the facilities, types and
numbers of personnel, scheduling and costs associated with LRB implementation. This informa-
tion was developed from the analyses performed by the Study Team in separate studies to activate
the facilities, process the LRBs, Perform the phased replacement of LRBs for SRBs on planned
shuttle launches and provide an ongoing LRB/'Shuttle launch capability for the total life cycle of
the LRB program. An overview of these study resdts is contained in Volume 11, Section 1 of this
report. The detailed analyses, results and recommendations of the LRB integration studies are
described in Volume 11I, Sections 1-19.
2.1 OBJECTIVE
The costs and implementation plans contained in this report describe the impact that the LRB
integration will have on the current STS ground operations at KSC.
The level of detail pursued in this Phase-A study is sufficiem to determine impacts to launch site
facilities with the corresponding cost estimates and implementation plans. However, due to the
undetermined final configuration or hardware contractor for the LRB, the study was not taken to
a level sufficient to actually implement the program at KSC.
2.2 APPROACH AND RATIONALE
A baseline configuration was assumed to be the pump-fed LOX/RP-1 option proposed by the two
contractors. Any significant cost differences of the other proposed options are stated where ap-
plicable. Life Cycle Costs are depicted which include the up-front non-recurring costs and the
learning curve of the first three LRB launches at the beginning of transition.
2-1

All costs in this report are Rough Order of Magnitude (ROM) and are presented in FY 1987
dollars. The implementation schedules for proposed modifications, new construction, manning
and support requirements are presented so that costs can be determined by fiscal year.
Facility costs estimates were developed using a "bottoms-up" approach. Costs for each item were
estimated using the Means Construction Estimating Guide. Similar items, buildings or systems
already designed and built for the STS were also used and costs were adjusted for size and loca-
tion where applicable.
Manpower costs and numbers were based on skills being used for similar activities on current
contracts and processing activities at the launch site.
2.3 GROUNDRULES AND IMPLICATIONS
2.3.1 Groundmles/Assumptions
The following groundrules and assumptions were used in developing this implementation plan:
• Launch sites are the existing STS/SRB sites at KSC, including currently existing capabilities as
well as programmed improvements.
The "KSC Flow Model" developed in ARTEMIS was used to project Shuttle missions
throughout the 15-plus years of this program. This model is based on the March 1988 NASA
manifest.
• Construction and modification during the activation phase is based on providing capability to
support processing and launch in early 1996 of the first LRBs delivered in 1995.
• This plan is baselined on the pump-fed LOX/RP-1 configuration submitted by the two LRB
hardware contractors.
Planned activities during the activation and transition phases are designed to minimize the
impact to the ongoing SRB processing/launch program and any joint use of personnel or
equipment is on a non-interference basis to the SRB opesatiom.

o The plan listsonly thecostsattributedto integrationof LRBs.
o Management/manning from the existing NASA Contractor Community required for support
to this program has been identified but not priced.
• LRBs are assumed to be expendable.
• A sustained launch rate of 14 SRB/Shuttle launches per year is assumed to be ongoing at the
start of LRB launches.
• No other emerging launch vehicle programs are reflected in this study.
• All SRBs launched during the transition to LRBs will be recovered and refurbished.
2.3.2 Environmental and Safety_ Implications
The environmental and safety implications of the LRB Integration Study were developed using
data provided by MSFC LRB systems studies conducted by General Dynamics and Martin Marri-
etta Corporations. The full report on the environmental and safety impacts is presented in
Volume lIl, Section 10. The results of that report indicate that the LRB offers significant envi-
ronmental and safety improvements over the current SRB operations. The conclusions of Section
I0 are listed below.
A° There will be less impact on operations in the VAB since no live propellants are
being handled. This will eliminate the need for establishing many of the control
zones currently required when processing the SRBs.
B, The hazardous operation of processing live SRB segments in the Rotation, Processing and
Surge Facility (RPSF) will be eliminated.
C. The ability to abort after ignition provides added safety features should problems arise
after ignition and prior to launch.
Do Ignition by-products from the LRB me less damaging to the environment than those of the
SRB.
2-5

I. Launch vehicle safety concerns on the PAD are reduced since no propellant is introduced
into the LRB until launch countdown.
F. The ability of the LRBs to be drained and inerted following an on-Pad emergency signifi-
cantly reduces the hazards posed to sating and securing crews entering the blast area.
The analyses and findings of the Environmental and Safety Study were used to develop the data in
this Implementation Plan.
2.4 IMPLEMENTATION PLAN AND PHASES
The overall launch site plan to implement the LRB program at KSC is depicted in Figure 2.4-1. In
order to begin LRB processing and accomplish the first LRB mission in 1996 as shown, the re-
quired facility work and OMD development must begin concurrent with ATP. This will necessitate
early funding and preparation of Program Operating Plans (POPs) during the Phase-B Study in
1989. Cost data for the POPs is supplied in Paragraph 2.9 and accompanying figures.
All of the activities depicted here are dependent upon timely completion of any preceding mile-
stones with a minimum amount of schedule slippage allowed in any area. An extensive amoum of
coordination among all involved agencies will be needed to accomplish these tasks. Written
agreements and Memoranda of Understanding will be needed between Shuttle processing agen-
cies and numerous contractor agencies coming on site. Additional manning and/or reassignments
of current manpower will be required in NASA and SPC organizations to manage/monitor var-
ious engineering, construction and installation activities. Additionally, increased support require-
menta in areas such as parking, badging, security, food service, utilities and etc., will be needed.
The new construction and facility modifications will use outside contractor organizations. An
impact of as many as 2000-3000 additional people working in the launch site area during peak
activity of the facility work should be anticipated.
The LRB program has been grouped into three phases to support the construction, modifications
and preparations for the first LRB/Shuttle launches in 1996, the incremental replacement of
SRBs with LRBs, and the full-up LRB operational phase to complete 122 LRB launches. TheoeP,
phases are defined as: Facilities Activation, Transition and Operational (see Figure 2.4-2). :._
The activities in the first two phases are planned to yield minimum impact to the ongoing KSC
launch operations with SRBs until the SRB launches have been phased out. A synopsis of the
planned activities is shown in Figure 2.4-3.
2-4

_2-5

FY
PROGRAM PHASES
81021-01B
Figure 2.4-2. LRB Launch Site Phases.
2-6
2-2 11/11 lO".'.'.'.'.'.'.'.'_a

TODAYS FACLmES
USEASlS• BARGE _
• OPF
• VAB HIGH BAYS
• CRAWI_ERWAY
•LETF
• LCC
• LAUNCH PAD FAC
• ELEC. PWP,. DIST.
N)DITIONAL FACLmES
• LRB/ET PROCESSING
• MLPs
_JPPOm'ING
J_EUMEKT,t_I
•OMD
• OMI/PMONIs
SOFTWARE CHANGES
• RSLS & GLS
•FLIGHT
• ACTNATION
• BUDGET
• ALrrHORITY
• CONTRACTS
• ENGINEERING
• PROCUREMENT
• CONSTRUCTION
• INSTALLATION
• VERIFICATION
• TUFIN OVER
• CERTIFICATION
TRANSmON
//_ HARDWARE ONDOCK
/_ INmAL LAUNCHCAPABILITY
(_RADUATED LAUNCH RATE
3 MISSK)NS IN 1996
INmAL OPERATIONALCAPABILITY
6 MISSIONS IN 1997
g MLSSK3NS IN lgg8
12 MISSIONS IN 1999
14 MISSIONS IN 2000
/_ TRANSITIONCOMPLETE14-LRB 0-SRBMISSIONS/YEAR
OPERA_
(MINMUMSUSTAIf_DLAUNCH RA'rE 14/YR)
FUTURE POTENTIAL
• SHUTll.E 'C"
• ALS
• STANDALONE
8101 g-O4B
Figure 2.4-3. LRB Launch S;te Plan Synopsis.
- 7 _,
2-2.4 11/11 1=

2.4.1 Activation Pha_
This phase is planned for a ten-year period from the beginning of FY 1991 until the end of FY
2000. Activities in this period include design, construction and activation for the first launch in
early FY 1996; preparation of O&M documents; ta'aining/certification of personnel; demonstra-
tion tests and an FRF with the pathfinder hardware; and completion of the facilities work in the
latter half of the phase.
The duration of the early facility work in this phase is based on the arrival of the first LRBs in FY
1995 from one of the manufacturing contractors and back filled to include time to prepare the
facilities to support first LRB launches. This will require an Authority To Proceed (ATP) no later
than the beginning of FY 1991. This schedule may necessitate some budgeting, contracting, and
engineering activities prior to the start of the phase.
2.4.2 Transition Phase
This phase is planned for the five-year period from the beginning of FY 1996 until the end of FY
2000. This includes the ovedap period of the last half of the activation phase and the first half of
the operational phase. Activities in this period include completion of the remaining facility prepa-
rations to support sustained operational LRB launches; receipt of the first operational hardware;
graduated increase in the LRB launch rate with a corresponding decrease in SRB launches; ILC
at the first I..RB launch; IOC at the fourth LRB launch; and phaseout of SRB launch capability in
FY 1999.
The phased LRB launches consist of three in FY 1996, six in FY 1997, _ in FY 1998, 12 in FY
1999, and 14 in FY 2000. At this time the SRB launches will be phased out and the LRBs will be
the only Shuttle launches being conducted. This will result in 44 LRB launches during this phase.
A detailed study on this phase is presented in Volume III, Section 9.
J.
2-8r

2.4.3 _Operational Phase
This phase is planned for the ten-plus year period from the beginning of FY 1996 until the latter
part of FY 2006. A sustained launch rate of 14 LRBs per year is expected during the latter part of
this period. This decreases to eight launches during FY 2006 if the program is terminated. This
will complete the total of 122 launch missions projected for the life cycle of the I.,RB program.
2.5 FACILITY IMPACTS
Concurrent with the development and production start-up of the LRB hardware, the launch site
facilities must be prepared for LRB processing. In order to support the first launch of LRBs in
early 1996, a facility activation conceptual plan has been developed. The minimum facility
changes, new and modified, conducted during the activation phase to support early LRB launches
during the transition phase, are designated as first line facility activities. The additional facilities
required to support the LRB launches during the latter stage of the transition phase and the
remainder of the operational phase are designated as second line facility activities. These are
activated during the latter part of the activation phase. A detailed analysis and discussion of the
facility requirements and concepts for new facilities is covered in Volume HI, Section 1.
Facility requirements were developed from LRB requirements checklists completed by General
Dynamics and Martin Marrietta and from their interim reports. The requirements checklist cov-
ered the following items:
.
2.
.
4.
,
6.
7.
8.
9.
10.
11.
General configuration of each booster option
Ground equipment description and requirements based on
differences to existing Shuttle equipment design
General operating criteria
Nozzle configuration details to determine flame deflector and
trench impacts at the PADs.
LRB component weights, diameters and hard points
Receiving/handling requirements
Assembly requirements
Integration requirements
Test/Checkout Requirements
Launch Requirements
Abort/Scrub Requirements
2-9

12.
13.
FRF Requirements
Recovery Operations (If Applicable)
The detailed checklist and contractor responses are shown in Volume V, Appendix 20.
2.5.1 New Construction
To avoid impacts to the ongoing STS/SRB launch program and provide compatibility with the
new size/shape of the LRBs, selected new facilities must be designed and constructed. These
consist of two new MLPs and a new ET/LRB Processing Facility designated as the Horizontal
Processing Facility (HPF). The HPF will also contain an LRB engine shop and a processing
control center. Summaries of these facilities are presemed in the subparagraphs below.
The schedule for these new facilities is shown in Figure 2.5.1-1 and 2.5.1-2. Scheduled work time-
lines are shown based on the latest start and latest lrmish times required to meet ILC. The float
timelines represent the earliest opportunities upon which facility implementation is initially
planned.
2.5.1.1 LRB MLP #4 And #5
To avoid impact to the ongoing STS/SRB Launch Program, consideration was initially given to
construction of one new LRB MLP and the modification of an existing SRB MLP. Further analy-
sis revealed that it was impractical to modify an existing MLP since a primary structural girder
must be cut or modified to provide proper exhaust flame holes for all of the proposed LRB con-
tractor configurations. Additionally the estimated cost and time involved in the modification
effort and the potential impact to STS/SRB launches was more significant than the construction
of a new LRB MLP. Details of MLP construction and considerations are discussed in Volume RI,
Section 3.
The construction of MLP #-4 must begin at ATP to support pathfinder activities and ILC. This
approximate 5 year effort, starting at the beginning of FY 1991, must be completed in the fourth
quarter of FY 1995. MLP #5 construction can start in the second quarter of FY 1993 and must
be completed at the end of the third quarter of FY 1998. Due to the shnilarity to MLP #4 and
overlap of some construction activities, MLP #5 is progrmnnmt for a slightly less than 5 year
r
2- 10

FY1990 FY1991
ACTIVATION PHASE
TRANSITION PHASE
FY 1992 FY 1993 FY 1994 FY 1995 FY 1996 FY 1997 FY 1998 F'Y 1999 FY2000
MLP PARKSITE#2 (M)
LRB MLP #4 (N)
LETF (MLP #4) (M]
ET HORIZPR(X_. FAC. (N)
VABHB-4 (M)
HB4 CRAWLERWAY (M)
LRB HORIZ PROCFAC (N)
PAD B (M)
LCCA.PS (M)
HIGH VOLT.PWR. DIST. (M)
-'--1
,.I
I IEl_
wmmm
F---_
LEGEND: I I
[----]M
(N)
SCHEDULED WORK
FLOAT
MOO
NEW CONS/Rt_TION
81021-01C2
Figure 2.5.1-1. First Line Facility Activities.2-2 11111 10_)a
2-11

ACTIVATION PHASE
TRANSITION PHASE
FY 1990 FY1991 FY 1992 FY1993 FY1994 FY 1995 FY199E FY 1997 FY1998!FY 1999IIIIIIii111IIIIIIIIIII IIIII!11111!11111111111IIIIIIIII11 IIIIIIIIIII IIIIIIIII!1 !!111111111Iii11111111Iii11111111
F'Y20_
IIIIIIIIIII
LRB MLP #5 (N) [-2,." t i
LETF(MLP_) (M !....... ] "7
VAB HB-3 (M) [-" "1 1
PADA (M)
HIGH VOLT.
PWFL DIST. (M)
LEGEND: I I
[2222]M
SCHEDULED WORK
FLOAT
MOO
NEW GONSTRUCTION
81012-01S
Rgure 2.5.1-2. Second Line Facility Activities.
2 - 12
2-2 11/11 10"J0a

effort. Summary schedules for MLP 04 and MLP #5 are shown in Figures 2.5.1-1 and 2.5.1-2
respectively, and detailed schedules are in Volume HI, Section I.
The ROM cost for MLP 04 is $153.3M and MLP #5 is $120.7M. These costs include design by an
A&E firm, construction by an outside contractor, the LSE/GSE, T'I'V and initial spares but do not
include the Activation Management Team. Part of the efforts of the Activation Management
Team as described in Section 2.8, have been apportioned to this effort at a cost of $22.9M and
$18.1M respectively. This equates to the equivalent services of head counts of 85 and 72 team
members respectively for each MLP for each furl year of construction activity.
2.5.1.2 ET HorjzQntal Processing F_cility
To provide a location for STS/LRB integration without impacting STS/SRB integration currently
conducted in the VAB HB-1 and HB-3, VAB HB-4 was selected for modification to accommodate
LRBs. This selection necessitated moving the ET storage and processing from HB-4 to an off-line
facility. The proposed new facility can be combined with the new LRB Horizontal Processing
Facility which also contains the LRB Engine Shop. These functions will have separate processing
areas but can share the office space, shops, and storage space. Most operations currently per-
formed on the ET can be accomplished in a horizontal position.
The construction of this facility must be in the early part of the activation phase to permit ET
processing to move out of HB-4 and allow modification of HB-4 in time to support the planned
fast LRB launch in early 1996. Construction of this facility can start at the beginning of FY 1991
at the earliest and must be completed in the second quarter of FY 1993. The summary schedule
for this approximate two year effort is shown in Figure 2.5.1-1 and a detailed schedule is in
Volume In, Section 1.
Since this facility will be part of a joint use facility as described above, pricing was included in the
ROM cost of $73.3M for the ET/LRB HPF. This includes the complete implementation under a
design/build contract. Part of the Activation Management Team as described in Section 2.8, has
been apportioned to this effort at a cost of $11.0M. This equates to the equivalent services of 51
team members for each full year of construction activity.
2- 13

2.5.1.3 LRB Horizontal Processing Facility
To provide necessary space and facilities and to prevent impact to the SRB processing, a new
LRB Horizontal Processing Facility will be constructed. This facility will be attached to the El"
HPF as described in Paragraph 2.5.1.2. Details on this facility can be found in Volume m, Section
3.
The construction of this facility can begin during the latter part of construction on the ET HPF.
The earliest start is programmed for the first quarter of FY 1993 and latest finish in the third
quarter of 1995. The summary for this approximate 2.0 year effort is shown in Figure 2.5.1-1 and a
detailed schedule is in Volume Ill, Section 1.
Since this facility is also part of the ET/LRB HPF the ROM cost is included in the $73.3M total
for the ET/LRB HPF.
2.5.1.4LRB_gineSh_
A facility is required to support the engine related and contingency processing activities of the
LRB similar to the SSME processing shop. This facility should provide for the receipt, storage,
installation/removal, modification, checkout and maintenance of the LRB engines and any relo-
cated operations associated with the GSE needed for engine processing. The engine shop is also
part of the ET/LRB HPF.
The construction of this facility is concurrent with, and a part of, the LRB HPF. The construction
schedule is included in the same schedule as the LRB HPF discussed above and shown in Figure
2.5.1-1.
Pricing was done separately on this facility as discussed in Volume m, Section 7. The ROM cost
is $29.0M. This includes the GSE and initial spares. The design and facility implementation are
included in the ET/LRB costs above.
The part of the Activation Management Team apportioned to the LRB HPF is the same for this
facility.
2- 14

2.5.1.5 _T/LRB HPI: Control Center/LPS
To avoid an LCC impact to SRB processing during LRB standalone processing, an independent
control room concept for the LRB processing is proposed. This is included as part of the
ET/LRB HPF to conduct ET and LRB component and system checkout without using the LCC
facility. Each operations system engineer will have a console to perform functional testing of
LRBs. Checkout will include engine, avionics, instrumentation, power and gimbaling tests. ET
horizontal processing can also be supported from this facility.
The costs of this facility are included in the ET/LRB HPF cost breakout with the major part
consisting of equipment.
2.5.1.6 ET/LRB Processing Facility Siting
A siting selection study was accomplished to determine the most optimum location for this facility.
The selection criteria included the following considerations:
A. VAB proximity
B. Tum basin proximity
C. Blast danger area (quantity/distance)
D. Launch Danger Area
E. Environmental Impacts
F. ET and LRB tow routes
G. LC-39 Area Congestion
H. Availability of utilities/services
I. Demolition and relocation of existing facilities
J. Site preparation costs
The primary site chosen that best meets this criteria is located in the vicinity of the existing press
site (see Figure 2.5.1.6-1). This site is in close proximity to the barge terminal and tow route.
Safety concerns are eliminated since the site is beyond the VAB quantity/distance zone. Envi-
ronmental concerns are minimized since an existing location is being converted.
f'_.
2- 15

#4 dALTERNATE "
BASIN "
SITE # 2PRIMARY
SITE # 1SECONDARY
I
81019-04C
F'_jure 2.5.1.6-1. ET/LRB Processing Facirdy - Site Plan.
ORIGINAL PAGE IS2-16 OF POOR QUALITY
2-2.5 11/19 11.'00a

2.5.2
Some of the existing KSC facilities used for STS/SRB processing must be modified to accommo-
date the LRB processing. These modifications have been planned to provide minimum impact to
the ongoing SRB processing. Facilities requiring modification are as follows:
A. MLP parksite #2 - Required to support construction and operation of new LRB MLPs.
(hnplementation time - 0.85 years, cost $2.6M)
B. LETF (MLP #4 and MLP #5) - Required to provide functional checkout and verification of
new MLP #4 and MLP #5. (Implementation times - 2.6 and 2.1 years, costs $11.1M and
$9.0M)
C. VAB HB-4 - Required to stack/mate LRBs/ET/Orbiter without impacting ongoing SRB
operations in liB-1 or HB-3. (Implementation time - 2.85 years, cost $25.9M)
D. HB-4 Crawlerway - Required for access to HB-4 for roll out to the PAD (Figure 2.5.2-1)
(Implementation time -1.4 years, cost $5.1M)
E° PAD A and B - Required to accommodate the new requirements of LRBs for structural,
communication, data transfer and propellant connections. (Implementation times - 2.7 and
3.15 years, costs $69.2M and $70.8M respectively)
F. LCC/LPS - Required to provide new computer hardware and software to support the LRB.
(Implementation time - 2.75 years, cost $14.31VID
G. VAB HB-3 - Required to stack/mate with LRBs or SRBs during the transition phase and
LRBs only during sustained operational phase. (Implementation time - 1.6 years, cost $10.2M)
H° High Voltage Power Substation - Required to distribute and supply electrical power to the
new facilities and support increased demands at modified facilities. (Implementation time - 4
years, cost $18.4M)
_ 2- 17

GATE
IECS
DUCT 1
15KV
COMM MH_
12"1
81019-04A
Figure 2.5.2-1. VAB High Bay 4 Crawlerway.
2 - 18
2-2.5 11/11 10:30a

2.6 INTERFACE REQUIREMENTS
Since the LRB integration at the launch site represents a significant change to the current booster
processing operations, other agencies and their relationships to KSC will be affected. These
changes will affect manpower, procedures and equipment at other government, contractor and
commercial organizations as well as at KSC. A KSC NASA LRB program/project office should
be established to manage these interfaces. The specific interface support requirements to inte-
grate the LRB program were not def'med during this Phase-A study. However, similarities to the
existing SRB and SSME processing requirements as deirmed in the Launch and Landing Program
Requirements Document/Processing Support Plan (PRD/PSP) were used to estimate comparable
support required. The additional staffing of an LRB program/project office to provide the launch
site interface support to the LRB integration are included in the management/manning data in
Section 2.8 of this plan. An explanation and concept of these interface requirements for the
major affected organizations is presented in the subparagraphs below.
2.6.1 Johnson Space Center (JSC)
The introduction of the LRB processing and launches into the ongoing STS/SRB program will
create new interface requirements with JSC. The most significant of these will be the additional
performance data on the LRBs that will be transmitted to and monitored by JSC during launch
and new flight software development for LRB. New ground software will have to be tested and
certified at KSC to support these requirements. This will necessitate additional support at KSC
over and above the STS/SRB support which will still be ongoing during the activation and transi-
tion phases. This type of launch site support has been factored into the manloading in Section 2.8.
2.6.2 Marshall Space Flight Center (MSFC)
A significantly increased load of requirements will be placed on MSFC since the contractual link
to the LRB hardware contractor will be through MSFC. New tasks at the launch site will require
support in areas such as: 1) Barge delivery and transport to the ET/LRB HPF 2;) processing
requirements for flight; 3) Comprehensive instrumentation and performance data collection; 4)
Err mockup tool development for the pathfinder LRBs; and 5) All associated tasks to suppmt a
new concept booster throughout its checkout and integration.
2- 19

2.6.3 Dep_,'tmcnt Of Defense (IX)D)
Support required from DOD agencies, including the Eastern Test Range (ETR), (range tracking,
range safety, camera and telemetry data coverage, weather support, etc.) are expected to be simi-
lar to those for the SRB program. A slight increase in KSC support for these new requirements
during the transition phase has been factored into the manloading in Section 2.8.
2.6.4 KSC/Other
The introduction of the LRB program at KSC while maintaining an uninterrupted SRB program
will create additional interface support requirements at KSC due to increased construction, facility
modifications, and new products/methods being used. These requirements are discussed in Sec-
tion 2.7. Other agencies which may require coordination for the LRB program are the Goddard
Space Flight Center (GSFC) and the National Weather Service (NWS). This type of interface
support is also factored into the management/manning data in Section 2.8.
2.7 SPECIAL KSC REQUIREMENTS
The increased activity at the launch site to support LRB integration will in some way affect almost
every agency operating at KSC. Until an LRB hardware contractor is selected and the configura-
tion is determined, the actual impacts cannot be completely defined. However, based on experi-
ence with other systems integrations, current Shuttle processing operations and the requirements
listed in the Launch and Landing PRD/PSP, a general concept of activities can be estimated.
The introduction of a new system into an ongoing operation, without impacting the ongoing opera-
tion, will require separate teams of management/monitoring personnel. These personnel, typical-
ly government managers/monitors/engineers or designated contractors will need to be thoroughly
knowledgeable of the new system as weU as the operations of the current system. In order to
perform LRB integration without impacting the STS/SRB program, these types of dual assigned
personnel must be kept to a minimum, but must be maintained in the key coordination roles of
integrated scheduling and planning.
2 - 20

2.7.1 SRB/LRB Joint Activities
These LRB activities are those that potentially interfere with the ongoing STS/SRB operations
and could cause downtime, area clear, schedule delays, special permits, sharing of tools, person-
nel, and space,etc. These types of activities will require comprehensive coordination and schedul-
ing throughout aU KSC areas. These tasks have typically been performed under the auspices of
KSC/NASA operations and O&M personnel. This activity has been included in the manage-
ment/manning data in Section 2.8.
2.7.2 Facility_ Contractor Suvport
In addition to the interface activities discussed above, numerous activities will be accomplished on
a standalone basis. These are primarily the facility modifications and new construction to be
handled by outside contractor firms. The facilities involved are summarized in Section 2.5 and
discussed in detail in Volume HI, Section 3.
KSC activities to support this effort are typically controlled through the KSC_ASA DE/vehicle
engineering organizations. This effort will consist of design, development, procurement, engineer-
ing review, contract monitoring, facility inspection, test termination and verification fITV), activa-
tion, and acceptance/tum over activities. Extensive coordination must also be maintained among
all other KSC agencies to keep impacts to the on-going SRB program to a minimum.
To enable the Shuttle processing contractor to assume operation and maintenance responsibilities
of the facilities after they have been certified, teams of activation personnel must be involved
throughout the activation process. These personnel will work closely with the A&E finns conduct-
ing the facility modifications and new construction. Details of this manning are covered in
Volume lIl, Section 6. These facility activities are included in the management/manning data in
Section 2.8. As part of the activation management team, personnel win be needed for the man-
agement/monitoring of numerous logistics and material handling functions during the
phases of construction and modification. These personnel, typically government or contractor
designated, are covered in the management/manning data in Section 2.8.
2-21

2.7.3 LRB Launch S _up_ort Services (LS_$.)
The LRB hardware contractor will require office and equipment storage space at KSC. This
dedicated space will be in addition to the current SRB contractor requirements since there will be
a dual LRB/SRB program during the activation and transition phase. This new space require-
ment will increase during the latter part of the activation phase and early part of the transition
phase to support increased efforts of the LRB facilities start up, checkout, FRF, and other efforts
in support of the initial LRB flights. Requirements should be somewhat greater than the SRB
contractor's current support for booster activities.
2.7.4 Recovery_ Requirements
Recovery of expended LRBs similar to SRBs was considered by the study team and element
contractors but was not recommended. The up-front costs to develop the concept and the opera-
tional risks of the concept were greater than the Life Cycle Costs to use non-recoverable LRBs.
However, the option is still open to further study the feasibility of a water, land impact, or mid air
intercept recovery. If a decision is made to retrieve the LRB for salvage or reuse of components,
additional facilities will be required.
The water recovery docking area must be expanded to accommodate the LRBs if ocean recovery
is selected. An additional facility would be needed to disassemble, clean and refurbish LRB
reusable parts since the existing facility would be supporting SRB retrieval/disassembly. Consid-
eration might be given to barging the expended LRBs back to the manufacturer or other conm_r-
cial facility for rework. After the transition phase when SRBs are phased-out, the SRB retriev-
al/disassembly facility could be modified to accommodate LRB rework. The existing recovery
ships could probably be used for LRB recovery with some level of modifications. These modifica-
tions were not evaluated in this study.
A land recovery, although not fully studied or defined, would require specialized equipment to
accomplish the landing, recover the LRBs, and transport them to a rework facility on a suitable
roadway.
f
/
2- 2_ -_

2.8 MANAGEMENT/MANNING
2.8.1. LRB Processing
The significant differences between LRBs and SRBs will necessitate a totally different type of
processing and therefore different skills of manpower. Although the SRB technicians can eventu-
ally be cross-trained and transitioned to LRB activities, the initial phases of LRB work will require
additional LRB dedicated personnel to avoid impact to the on-going SRB activities. A generic
SRB Baseline Study, described in Volume V, Appendix 6, was conducted to determine the types
and numbers of technicians needed to support the processing of LRBs. A determination of
numbers and types of SPC support personnel involved in LRB processing is also included in the
Baseline Study.
The manning in this group consists of those personnel directly involved in the hands-on processing
of LRBs. These include the technicians and their direct support from Engineering,
Facility/Ground Support, Logistics, Quality, Safety, Operations Planning and Control, Overhead,
and LPS. The head count of these types of personnel was derived in Volume HI, Section 6 and is
shown in Figure 2.8-1.
2.8.1.1 Non-SPC SRB Processing Support
Additional manning linked to the LRB processing include personnel from the Base Operations
Contractor and NASA. These are part of the LRB processing team but are shown separately as
NASA/Non-SPC Processing Support in F'_mra 2.8-1 since they are also part of the SRB Process-
ing Team. These personnel are identified in the Generic SRB Baseline Study.
2.8.2 NASA _Operations Interface
In addition to the hands-on LRB Processing and Activation Personnel, support will be required
from the NASA/Contractor Community similar tO that currently provided to the on-going KSC
operations. These personnel must be dedicated to the LRB Program, especially in the early
phases of activation and transition. Whether or not these are actually additional personnel or
reassigned/cross-utilized personnel cannot be determined in this study.
r
2 - 23

j .......
L i! :!ili iii ii::i:iiii!i!ii i!I ii ! i_ _ _ ._
I : /_i_,_
o
o- 77711ili ,-o ; I iiiiT_iiiii!i
/ i _ iiiiiiiiiiiiiii.=, m : 7ii:,_itii¢ "-'_ / _!:!:!:i:i:..':!:!
0 .................... ,_:::::_:)_ ,,.=
n" _!i!i'_i!/ ,i .................._ _>
o oI /,f. --...... ,,,/- ................................_. ............................";_ 11. ::t
I:::: _(9 III J / / I .F: :I
Z _ _. ........................................ _ _ "- =I"ILl (,,,) '_[ ill :_ _Io o<o.,:.,_//),s e
_, I_ ,-,, ..........................,:::: _,_:i:" _ _
_'- I_i_ : i::' O.... r,#)I.U ..........................:........ :: :lO
......... itl
__' .....--' t,,!z _ o
r'r' Z :0..._ Z : ,,- ,- _ ,-<o u..°. < _ !£
_0 \ _ _i uJ _ > _) _<_-..< \ I I n"o u.l ,,, _--
..............................:...............................................\_........._...................._......._......:,i_,,......
2.24

Tim organization from the NASA/Contractor Community consists of direct operational/'mterface
support from Ground Engineering, Vehicle Engineering, Shuttle Logistics Project Management
Office, Shuttle Operations Office, Cemer Support Operations, Safety and Reliability Office, and
the LRB Project Office. Functional support of these organizations is described in Volume HI,
Section 6. The time phased head count required to support LRB integration is shown in Figure
2.8-1.
2.8.3 NASA Engineering Interface
These personnel, also from the NASA/Contractor Community, are involved in all areas of engi-
neering support/management for LRB Operations. These personnel must be dedicated to the
LRB during activation and transition and may be additional personnel or reassigned/cross-utilizod
personnel.
This organization will provide engineering/management interface support from Engineering
Development, STS Management and Operations, Ground Engineering, Vehicle Engineering,
Shuttle Operations, Shuttle Logistics Project Management, Safety and Reliability, Quality Assur-
ance, Environmental Impacts and the LRB Program Office. Functional support of these organiza-
tions is described in Volume 111, Section 6. The time phased head count required to support LRB
Integration is shown in Figure 2.8-1.
2.8.4 Activation Managemem Team
The facility construction and modifications will be performed by outside A&F_/construction firms.
This activity will require direct interface support from a designated Activation Management
Team. This team, consisting of NASA and/or Contractor personnel, will be the link between the
construction firms and aU of the launch site coordination activities to ensure the finished product
meets the requirements of LRB Integration. Details of this organization and their functions are
covered in Volume HI, Section 1 and Section 6. The time phased head count required to support
LRB integration is shown in Figure 2.8-1.
2.8.5 f _Ma at
The non-LRB manning covered in this Section includes SRB processing personnel and their direct
support similar to that described for LRB processing in paragraph 2.8.1 above. The genetic SRB

BaselineStudy in Volume V, Appendix 6, also included information on SRB retrieval/disassembly
personnel and the USBI refurbishment operations at KSC of approximately 600 people under
the MSFC contract. The Baseline Study reflected an estimated 400 head count for USBI-KSC in
1985 and was updated to the more current 600 headcount used here.
The total head count for Morton Thiokol SRB Processing technicians is 221 which includes 62 for
SRB retrieval and disassembly. To permit a closer comparison with the LRB Processing Techni-
cians, the total technician count was reduced by 62 leaving a total of 159. Additionally, 59 techni-
cians support both ET and SRB processing. Fifty percent of these (29) have been aUotted to ET
functions and are also subtracted leaving a total of 130. The factors used to determine the direct
support for LRB technicians from Engineering, Facility/Ground Support, Logistics, Quality,
Safety, Operations Planning and Control, Overhead, and LPS were also applied to the SRB proc-
essing technicians to arrive at total of 336. This is the steady state head count for SRB processing
used in Figure 2.8-1.
Since the LRB will not be retrieved, the refurbishing functions at KSC will decrease as SRB
launches decrease and phaseout. The steady state head count for retrieval and disassembly tech-
nicians and their support is 160 based on the same factors used above. Additionally, the MSFC
contracted SRB refurbishment process by USBI at KSC will phaseout with SRB launches. These
time phased head counts are also shown in Figure 2.8-1.
SRB processing is also supported by the Base Operations Contractor and NASA similar to that
described in Paragraph 2.8.1.1 for LRB. This support is shown in Figure 2.8-1 to increase with
LRB phase-in and return to prior levels after SRB phaseout.
2.8.6 LRB Versus SRB
After SRB phaseout, the LRB Processing and NASA/Non-SPC Support (LRB) personnel total
608. These are essentially replacements to the SRB Processing, NASA/Non-SPC Processing
Support (SRB), SRB Retrieval/Disassembly, and the MSFC funded USBI Refurbishment/Sup-
port personnel totaling 1263 (Ref. Fig. 2.8-1). This indicates a net decrease of 655 personnel due
to the replacement of SRBs with LRBs.
2.9 LAUNCH SITE IMPLEMENTATION COSTS
This section summarizes costs by major category of activities involved at the launch site. The sub-
sections below cover cost summaries for facilities with selected equipment, recun'ing material and
2o_ _

commodity costs, and management/manning costs. Time phased summaries are included to iden-
tify fiscal year costs by major category. All costs are Rough Order of Magnitude (ROM) hi 1987
dollars. These data will support early POPs preparation during Phase-B. Summary data for the
baseline configuration POP is shown in Figure 2.9-I.
2.9.1 Facilities and Equipment
The costs of the new facilities and modification of existing facilities discussed in Section 2.5 of this
plan are covered in this section. Figure 2.9.1-1 lists the costs for the first line facilities which total
$397.7M. Figure 2.9.1-2 lists the costs for the second line facilities, totaling $215.2M. Costs are
shown for design, facility, equipment (LSE and GSE), TI'V and initial spares and do not include
the Activation Management Team. Figure 2.9.1-3 is a breakout of these costs time phased by
fiscal year. These costs are a straight line breakout by fiscal year of the totals based on the facili-
ties schedules shown in Figures 2.5.1-I and 2.5.1-2. A more rigorous cost analysis could be done in
follow-on work during Phase-B which would better allocate the cost throughout the time periods.
Volume HI, Section 7 contains details of facility and equipment costs.
2.9.2 Recurring Material and Commodity Costs
This subsection sununadzes the major costs of expendable commodities (fuels, gases, oxidizer)
and the spares for LSF_,/GSE required for the facilities discussed in Section 2.5. Figure 2.9.2-1 lists
the costs for these items by category, time phased by fLscal year. Volume HI, Section 11 contains
details of commodity costs.
Propellant and gas consumptions per load-and-launch of two LRBs were used for the highest
priced and lowest priced options for the two contractor's LOX/RP-1 versions. These options yield
a lowest cost of $490.4K for the MMC pump-fed version and $610.4K for the General Dynamics
pressure-fed version. The other two LOX/RP-I versions fall between these costs and are not
discussed here since differences are minimal. Additionally the General Dynamics LH2/LOX
version yields a per load-and-launch cost of $678.8K. Each of these costs includes the fuel RP-1
(or LH2), oxidizer LOX, and the increase in purge/pressurizing gases GN2 and GHe over that
/2-27

&
2-28
a_0Q.
00
o0
E
"7
o..1
&e,i
°_U_

NON-RECURRINGFACILITY COSTS
DESIGN FACIJTY "I-FVLSEGSE
INITIALSPARES
TOTALCOST
19875 M
FIRST LINEFACIUTIES
MLPPARKSITE #2
(M)0.4 2.2 2.6
LRB MI_P #4 (N) 20.9 51.9 76.1 4.4 153.3
LETF MLP #4 (M) 11.1 11.1
ET/LRB HORIZPROC FAC (N) 9.9 46.4 15,6 1.4 73.3
VAB HB-,4 (M) 4.1 20.0 1.6 0.2 25.9
HB-4CRAWLERWAY
(M)0.8 4.3 5.1
LRB ENGINESHOP (N)
26.6 2.4 29.0
PAD B (M)10.0 14.5 42.8 3.5 70.8
0.3 1.7 12.3 -- 14.3
LCC/I_PS (M) (S/W)
HIGH VOLTPWR DIST (M)
_G_D:(M)MOO
_NEW
1.9 10.4 m 12.3
TOTAL = 397.7
81012-01W
Figure 2.9.1-1. LRB First Line Facility -Non-Recurring Cost Summary. 2-2 11/14 5.'00p

NON-RECURRINGFACILITYCOSTS
DESIGN FACLrrY "i-rv LSE
GSE
I_IrlIAL
SPARES
TOTAL
COST
19875 M
SECOND LINE
FACIUllESLRB MI.P #5 (N) 13.9 51.9 3.0 ..... 1.9 120.7
LL=TFMLP#5 (M) 9.0 9.0
VAB HB-3 (M) 1.4 _ 7.5 1.2 0.1 10.2
PADA (M) 8.4 14.5 42.8 3.5 69.2
HIGH VOt.TPWR DIST (M)
1.0 5.1 6.1
LEC_.ND: _
_NEW TOTAL = 215.2
81012-01V
Figure 2.9.1-2. LRB Second Line Facility -
Non-Recurring Cost Summanl.
2-30
2-2 11/11 10"30a

2-31

O.
.e--
,e--
,e,,-
f_
&
00
°_
"00EE00
-e-
:E
z_0
n'*
n--.I
0
0O)
--.I
&o_
z_O_
°_
U_
I,Ll,<
904
0
CO
2 - 32

beingusedfor SRB activities. Thesecostsaccountfor averagewaste/lossfor eachlaunchbut do
not include any scrub/abort/recycle missions.
The cost of LSE/GSE spares for each year of the life cycle is based on 14% of the initial cost of
the equipment. The first set of spares for each facility is assumed to be purchased during the last
year of initial construction or modification and continue each year through the life cycle. This
factor was phased down by 50% and 75% in the last two years of the life cycle to phaseout the
program. Figure 2.9.2-1 includes these costs for the three options discussed above.
2.9.3 Management/Manning Costs
This subsection summarizes the manpower costs for the manning discussed in Section 2.8 for the
LRB integration operations. The head counts developed in Figure 2.8-1 for LRB and SRB proc-
essing, SRB Retrieval/Disassembly and their support personnel were multiplied by $50K to arrive
at the estimated costs per year. For the fiscal years 1994 and 1995 when LRB personnel are enter-
ing training/certification and no launches are being performed, a ramp-up head count was used to
arrive at the costs. A ramp-down head count is used to phaseout SRB personnel. The USBI-KSC
Refurbishment/Support data used from the generic SRB Baseline Study was included in the head
count in Paragraph 2.8 to reflect total booster population at KSC but is not priced in this section
since it is not a KSC cost. Figure 2.9.3-1 lists costs for each type of personnel, time phased through
their period of activity.
The activation management team consists of approximately two-thirds engineering type skills and
one-third procurement/matetial management skills. Annual costs used for these personnel was
estimated at $60K and $48K per year respectively for each type and averaged to $56K for the
team. This was based on averages from similar types of activity on other projects.
The manning categories of NASA Operations Interface and NASA Engineering Interface dis-
cussed in Paragraphs 2.8.2 and 2.8.3 are not included in the cost data. These two organizations
consist of personnel who will most likely be reassigned or cross utilized from existing Shuttle
related functions on the launch site and, therefore, would not be an added cost to the LRB pro-
gram.


2.9.4 Major LRB Life Cycle Costs
Figure 2.9.4-1 presents a diagram of the life cycle non-recurring and total costs for the LRB Pro-
gram. The costs for three different booster options is also shown. Non-recurring totals include the
facility costs and Activation Management Team costs.
ANNUAL
PROGRAM
COSTS
(87 SM)
300
200
100
TOTAL
NON- RECURRING
I I I1991
o %
I I i I I I I I I I I I I1992 1993 1994 1995 1996 1997 1998 1999 2000 2001 2002 2003 2004 2005 2006
FISCAL YEAR
BOOSTER OPTIONS: Q MMC LOX/RP-1 PUMP-BASEUNE
(_ GDSS LOX/RP-1 PRESS
(_ GDSS LOX/I_H2 PUMP
81012o01X
Figure 2.9.4-1. LRB Integration Costs.
2 - 35
2-2 11/14 5.'OOp

VOLUME II
SECTION 3 IGROUND OPERATIONS COST AND MODEL
(GOCM)
81005-01BM4

SECnON 3
GROUND OPERATIONS COST MODEL
Three independent KSC LRB cost estimates were performed, and are reported in Volume II,
Section 4. One of the estimates employed the use of the Ground Operations Cost Model
(CK)C_). GOCM is a NASA developed parametric cost model which develops Ground Process-
ing Cost, and was provided to the study group for use in the LRB program.
In addition to utilizing GOCM to estimate LRB costs, the study team was instructed to study and
evaluate GOCM and to provide updates to the software and its documentation. This section
reports the C_d2)CM study findings and the work accomplished to enhance GOCM.
The GOCM was provided to the study team by KSC under contract NASI0-11475 dated April 15,
1988. In accordance with the Statement Of Work, the study team was to:
Utilize GOCM and other costing techniques as appropriate in the preparation of cost as-
sessments of ground processing operations conducted in support of the Liquid Rocket Booster
(LRB) configurations trade-studies.
• Expand and enhance the utility and relevance of GOCM to the KSC STS program and incor-
porate lessons learned from the LRB integration study.
Evaluate and update GOCM Cost Estimating Relationships (CEILs) and incorporate detail
design and alternative support scenarios that are cost significant and sensitive into GOCM as
a module.
Develop and deliver the following products: GROUND OPERARATIONS COST MODEL
USER'S MANUAL (Vol III Sec 13), INSTRUCTIONS (Vol HI Sec 14) for updating and
modifying GOCM, and DEVELOPED SOFTWARE (Vol HI Sec 15).
GOCM as provided by KSC is hereafter called the baseline. The baseline was enhanced to make it
more user friendly and expansion ready without altering its CERs and methodology. This version
of GOCM is called the enhanced version. It provides a good framework for the construction of
future GOCM derivatives and revisions. The enhanced GOCM is the subject to which the study
team has applied the Statement Of Work. A variant of the enhanced GOCM called the enhanced
3-1

modified GOCM was also devel_ It incorporates the lessons learned from the LRBI which
have resulted in CER additions and modifications. (See Figure 3.0)
GOCM was found to be an excellent macro level cost generation tool which is suitable for pre-
Phase A and Phase A studies. GOCM also provides an effective framework for _ing mote
discrete CERa which would span over to the micro level and be usefid in Phase A, Phase B and
Phace C trade studies.
While proving to be limited in applicability to Phase A trade studies, GOCM has performed some
very important functions. They are:
• Identifying ground processing sensitivities and shortfalls
• Providing a cost reference
• Macro budget planning
• Initial cost estimates
• Identifmg major cost drivers
This report provides the LRBI GOCM user's experience, STS calibration/modifications to
GOCM, explains model enhancements made by LSOC, explains the application and the role
GOCM had in the LRBI, explores GOCMs potential and recommends future direction for
GOCM.
The LRBI provided an ideal opportunity to evaluate GOCM and apply the lessons learned to
simplify its operation, expand its utility and enhance its relevance.
3.1 USER'S EXPERIENCE
3.1.1 New User Impressioas
Initial impressions of GOC_ were overwhelming. The baseline model was large, nearly utilizing
the total capacity of an IBM PC AT computer. Model operations were slow and difficult at first.
The user's operations manual was terse and incomplete. Early GOCM operations proved to be a
formidable task.
It was initially recognized that a comprehensive knowledge of ground processing and space craft
configurations was needed in order to ascertain the functional relationships of each GOCM cost
element. This could have been made simpler with a more comprehensive user's manual. This
3-2

GROUND OPERATIONS COST MODEL EVOLUTION
BASICGOCM
• POWERFUL PARAMETRIC TOOL
• PARTIAL DOCUMENTATION
• SINGLE BOOSTER CONFIGURATION ANALYSIS
• DESIGNED FOR EXPERIENCED USERS
• LIMITED COMPUTER MEMORY AVAILABLE
NEWGOCM
• USER MANUAL & INSTRUCTIONS INCLUDED
• GOCM ANALYZES MIXED BOOSTER FLEET
• MODULES PROVIDED FOR EXPANSIONS AND ENHANCEMENTS
• LEARNING CURVES FOR MANPOWER &/OR PROCESSING
• GRAPHIC OUTPUTAND PRINT WINDOWS
• USER FRIENDLY FOR INEXPERIENCED USERS
• ADDITIONAL CERs FOR FACILITIES AND BOOSTERS
FUTUREGOCM
• CENTRALIZED, STANDALONE SOF-rWARE
I • CAPABILITY FOR LARGE DATABASE• MIXED BOOSTER AND VEHICLE FLEET ANALYSIS
• QUICK AND SIMPLE INPUT AND ANALYSIS
• CALIBRATED AND DOCUMENTED CERs AND DATABASE
80916-02Z
Figure 3.0. GOCM Evolution.
3-3
2-3 11/15 9:00a

manual should be written to a tedmical audience but one with tittle space operations and launch
preparations knowledge. The new user also needs a model dictionary which should be carried over
into the Instruction Manual. The dictionary should contain STS ground processing and GOCM
peculiar temp.
1"he instruction manual will become very important to the user as he becomes pmficiem in oper-
ating GOCM. He naturally wants to know how GOCM generates those fascinating costs! Here is
where the user becomes lost. There is no place be can currently turn to except the model's code,
which is a very difficult to interpret. The Instruction Manual provided as a result of this study will
simplify this situation. It provides direction and guidance to the user for accomplishing model
integration and for incorporating updates and changes. Using the instruction manual the GOCM
user can probe GOCMs CEILs and understand their operation.
It was the above experiences and impressions that provided guidance in the creation of the
GOCM USER'S MANUAL, the INSTRUCTIONS MANUAL, and the software enhancements
contained in the enhanced version of GOCM.
3.1.2 Early Model Evaluation
3.1.2.1 Strengths and Weaknesses
GOCM is very flexible. The flight element configurations can vary, their size can vary, Mission
profiles is a variable and the cost due to learning has been accounted for in this model. This flexi-
bility allows the user to evaluate a multitude of flight hardware types and mission scenarios. For
instance, GOCM can be used to estimate the ground processing cost for the Shuttle, Shuttle II,
Shuttle "C", small expendable rockets, and the proposed ALS.
GOCM was developed in three parts; Processing, Operations and Facility models (see Figure
3.1.2-1). This allowed it to be partitioned in order that it would fit into the available PC memory.
Each model part has a very distinct purpose, and the combination generates the overall cost pro-
jections. LSOC has taken this concept of modularization even further in its development of the
enhanced version, and in the process provided more available memory. The additional available
memory was partially used to maximize user friendliness and to provide model growth potential.
Early in using GOCM, certain shortcomings were recognized. GOCM did not break out costs by
flight element. Only the system level processing cost were provided. Therefore cost assessments of
various subsystems within the overall system could not be evaluated. This was the case with the
3-4

AAS_IeLLG_I
i WMOKXtlI4_IU I!
1ECI.(NOt.OGY MSEOSadOq'r • TYPE OF PRO_SI_
• ttUS.JIE tm47r'tt.E)
• _(CUmB_
• ,q_'N/CED _
STAGEo LOCKY_N - N..INE VS SIDEMOUNT
• ENGI_ _ OF: BqGNES
• FECOVERY METHO£_'YSTEM
• PAYI DAD: V_I_T_rTTGRAT1ON
I _IG'_ I I "_co_• I • RATE C_='AIBLrl_
........................................IV_=j..UCLEi_ ii_,_OATA B,m,..q_.: m [ V_=_,ICLECOST_IATA_.... i
I• MANPOWER P_OF__ES
• WOFI( SC4-1EZ:XJLE(VZ., r_. E'I_.)• MAX. F_CILrW I.RI.iZAT¢_
• _ C(:_;T RATE
• LEARNNG CURVE APPLICATION
[ FRCLITY _ I
FACILITY COSTSEQUPMENT COSTS
LVEHICLE FACIUT_ DATA BASE i
* FECM IS AN _LTERNATEFACIL_Y MC_EL
v,,,_,,._,.,oo_I i ,.,_,_,,=,,._i I.,_,,=,._ I
• _ LOCATION• MANPOWER RATE
• I',OE_ YEN:t
• W'OR_ ,_CF_[X.I..E
- _YS'WE_
. _.F'T'rS_A¥
- _YS/YR
• ESCALATION
• U'Tt. _7_'T)ON
• ._JRG_ RATE
• START YEAR
vAR
I
• VEPICLE NAME
• "tECHNOLOGY
o_
• VEHICLE
-MODULE-NUMBER
-ELEMENT- LOCATION
- R.,EL
.RECOVERY
•any'name" .PRO
ENHANCED GOCM
• START YEAR
• SRB VEHICLE
- P/LWEO-fl"
- I=YLUTIUZE
• LRB VEHICLE
- PC WEIGHT
. l:)A.t.R'l.2_
- FLIGHTS,'YR
"arty,name" .TRF
,i,
HEGHTNO. FACILR'F.S
S_V_ED Wn"H s'rs?
VARIABLE RATE
"anyr_n_" .FhC
4, 4,
i VEHICLE 'TYPE
:.,_o._.RATEJ:PROCESS RATE
FLIGHT NUMBER
START YEARAPPLY TO PROCESS
•enyname" .FAC
J OPERATION MODEL
l,• P,ETREVE DATA
",_fr_e" .TFU:• _l-rm_" .PRO
-_ "a'_,_a_e" .VAR
"ar,C_'m" .FAC
•a_)-_ame" .F_C
• E_.,'M_AFIY COST REPORT
• PROCESS_IG TIME SCHEDULE• F/_UTY PROCESS,NG CAPAB_ITY REPCFIT
• F0__..O_T REPORT
• VARUI_LE COST REPORT
• F_CIUI'V REQUIREMENT
• RJGHT HARDWARE RF_PORT
80916-02YFigure 3.1.2-1. GOCM Modularization.
3-5
2-3.1 11/14 5:0010

LRB. Another feature which was desirable for the LRB study and not available was the ability to
conduct Mixed Fleet cost projections. The LRB is envisioned in this study to be phased into opera-
tion while the SRB is phased out. Therefore, there is a period of mixed booster fleet operations.
The mixed booster fleet operations complicates the foreseen ground operations. Concunent with
SRB operations, facilities and equipment used will be subject to modifications to support LRB
processing. LRB preparations and site activations will be occurring simultaneously with SRB
operations during the transition (see Figme 3.1.2-2). Therefore, scheduling the use of facilities is
not only dependent on their recurring utilization capability, it is also dependent on their downtime
for the non-recurring modification activity. This is something that the current model is incapable
of handling. GOCM also does not estimate facility modification costs. Most of the current in
place facilities are being considered for use in the LRB program after the appropriate modifica-
tions are performed. Outside techniques will need to be employed to incorporate these cost
eleng_ts into the overall cost. Curremly, GOCM will derive the "new" facility requirements and
their associated costs when required to meet the desired launch schedule. These costs, however,
are not flowed backwards from the date the facility is needed to accommodate budget develop-
ment. Furthermore, only facilities that are in the modules repertoire can be added. That is,
GOCM can only increase the quantity of in place facilities or build similar new replacement facili-
ties for a new vehicle configuration. New type facilities in addition to the modification of existing
facilities must be handled elsewhere.
These shortcomings do not detract from GOCM's utility. They simply reinforce the belief that no
model can be fabricated for universal application. Cost development usually requires a user's
expertise that can not be totally captured in the cost model's logic. The user must know the limits
of this model and understand its application. In this light, we view the projection of ground proc-
essing cost to require a dynamic system of interactive cost models, cost modules, and cost data-
bases (see Paragraph 3.3.2), where the user is as an important part of the cost generation process
as the tools he uses. GOCM, in its baseline form, is an excellent beginning in the development of
a ground processing cost generation tool kit.
It is believed that further progress beyond the enhanced version of GOCM is severely limited by
the architecture employed. The systems approach advocated elsewhere in this report (see Para-
graph 3.3.2 and 3.5) requires the use of different software and hardware systems. It also requires
the development of resident expertise and a systematic program of development, maintenance,
and use. It is the conclusion of this study that the evolutionary improvements are coming to an
end and the next generation redesign of GOCM is needed.
One of the prime limitations of a parametric model is the insensitivity it has to detail design lea-
3-6

TOTAL OPS COST
_ _I
/_" .s_ _T _/ -.
m=_
v
TRANSITION -_
Mixed Fleet Operations Conceptual Cost at KSC.
L=
ui¥_n _ FFT LRB FLIGHT HARDWAREAND GROUND PROCESSING SYSTEM
DEVELOPMENT CONCURRENT WITHSRB OPERATION.
•mA_.errr_ LRB INmAL OPERATIONS,TEST AND EVALUATION CONCURRENTWITH COMBINED LRB/SRB OPERATIONS.
TRAINING TAKES PERSONNEL OUT OFTHE CONCURRENT COMBINED
OPERATIONS, NECESSITATING MOREPERSONNEL TO SUSTAIN OPERATIONS.
• ANOTHER TRANSITION COST ELEMENT
IS DUPLICATE BOOSTER MANUFACTURERON SITE REPRESENTATION DURINGCONCURRENT COMBINED OPERATIONS.
|
I--
w
v
NR COST
!!
i
ZO
d
-JO
f
NR COST
Z
<><o
TOTAL
KSC Cost Element Summary
TWONON-RECURRING(NR)COST ELEMENTS HAVE BEENLEVELFLOWED AND ADDEDTOTHE OPS COST.
THE NR COST REPRESENTSNEW FACILmES, MODIFICATIONSTO EXISTING FACILITIES, GSE,LSE, AND ACTIVATION COST.
NOT SHOWN FOR CLARITYPURPOSES IS THE PROCESSPLANNING NR COST ELEMENTi.e.: OMI DEVELOPMENT.
0oor._ ...j
!:N:::_:i.:.x:_.:.:.:.:.::s'..:__
ii! iiliiiii!ilKSC Conceptual Cost Total
• THE OPS COST AND NR COST SUMMEDUP REPRESENT THE TOTAL
KSC COST.
80916-02T
Figure 3.1.2-2. KSC Conceptual Cost.
3-7
2-3.1 11Ill 10:30a

tures which often are significant cost drivers. For instance, the nozzle placement and booster
dimensions of the LRB when employed on the Shuttle can drive the program to require a new
launch pad! The insensitivity of a parametric model limits ones ability to employ them in conduct-
ing post configuration trade studies. Again these limitations are not often as bad as they seem
when tempered with good engineering judgment and the interactive use of the cost model. For
instance, the trade study considering Pad replacement could be conducted outside GOCM using
the _ and cost data within GOC_. There may be little or no need for further model devel-
opment for this one time trade study. But for repetitive trade studies, it is often advantageous to
employ a more specialized module or model. This is especially true for very complex trade studies
requiring great rigor and/or the use of iteration.
The LRBI Study confmned the belief that the use of parametric models is greatly dependent on
the phase of program study/design. That is, the mix of its cost generation techniques employed on
a program varies with program maturity. Initially, during a Phase A conceptual evaluation and
study, an all up parametric technique may be employed. Soon to follow, as the program ad-
vances in Phase A and/or transitions into Phase B, certain cost drivers and/or cost elements semi-
five to design or planning decision will require examination in greater detail and the employment
of engineering estimates (analogy). Select cost elements deemed to be very sensitive and signifi-
cant may transition early and directly to detail estimates. Such elements may be crucial to trade
studies or early budgetary planning. These type estimates will have to be conducted outside
GOCM. Figure 3.1.2-3 graphically illustrates the typical mix of cost generation techniques em-
ployed for each study/design phase. It implies that the use of parametrics and parametric models
decreases with program development and must interact with other techniques in varying ways
throughout the development and operation phases of the program. This realization is important
for two reasons. First, it places real limitations on the completeness and accuracy one should
expect from a parametric model. Second, it brings to attention the desirability of having a family
of cost generating tools each capable of interfacing with the other and all being interactive with
the user.
3.1.3 Study and GOCM Development Approach
The data requirements to run GOCM are small and the data is easily acquired during a Phase A
program. The LRBI Study experienced no difficulty in acquiring/developing the GOCM input
data. The utility of this parametric model was vividly portrayed when it was applied to the LRB as
evidenced by the early Phase A cost estimates made by LSOC.
Output format options and graphics flexibility were missing from the GOCM baseline. The output
3-8

% USE OFESTIMATING
METHOD
PHASE A PHASE B PHASE C PHASE DPLANNING AND PRELIMINARY DETAIL DESIGN PRODUCTION
CONCEPT SYSTEM AND ORDESIGN DESIGN DEVELOPMENT CONSTRUCTION
(DETAILED ESTIMATING)
PROGRAM MATURITY (TIME) v
80916-02E
Figure 3.1.2-3. Figure Cost Estimating Methods Versus Program Maturity.
2-3.1 11/11
3-9
10:30a

to some users was confusing and unm, cessarily large (nearly 35 pages). It became obvious that no
single output report would be universally acceptable. Therefore it became desirable to have some
output flexibility.
value of OOCM and its meagths were quickly recognized by the study team. As a result our
efforts transitioned e,_y from evaluation to the enhancements of GOCM. A phased enhancement
program was applied to CK)CM (see Figure 3.1.3-1).
The baseline GOCM was given to the study group by NASA and from its evaluation two new
model configurations have evolved. The first is called the enhanced. It preserves the baseline
CElLs while streamlining its execution. It is more user friendly and is expansion ready. The degree
of user friendliness and expansion potential was limited by the use of the Symphony spreadsheet
software which was inherited from the baseline configuration (see Paragraph 3.3). It is believed
that GOCM has outgrown Symphony software in size and complexity.
The enhanced modified configuration of GOCM is the third and most recent version of GOCM. It
provides the same operations as the enhanced version but no longer preserves the baseline CERs.
The expansion feature was exploited in the development of new and/or modified CERs found
necessary during the calibration effort, and in use. These are discussed in Paragragh 3.2.
The enhanced baseline evaluation for friendliness was performed using computer illiterates.
These subjects were given the GOCM USER'S MANUAL and a functional computer. No prepara-
tion nor outside help was provided. Some subjects were observed while others were later interro-
gated. From this evaluation many lessons were learned and incorporated into the enhanced ver-
sion. We looked for those user common difficulties which were within the software and hardware
capability for rectification. This made GOCM more user friendly for the f'LrSttime users, thereby
expanding the utility of the model to a greater work force (see Paragraph 3.3).
Some of the user enhancements and example screens are found under Paragraph 3.3. It is be-
lieved that greater strides in achieving user friendliness could be made simultaneously with achiev-
ing greater costing rigor if new software and hardware were implemented in a follow on study.
3.1.4 Utility Evaluation
For nonmixed fleet estimates a reasonable level of merit is obtained for the ground processing
costs at KSC for various flight hardware configurations. The enhanced GOCM provides cost
projections per fiscal year in both an expeditious and easy manner and requires simple Phase A
3- I0

LRBI TASK 1-8
SPC LSOC MM COACT EST EST ESTSRB LRB LRB LRB
I I I
ESTIMATECOMPARISONS
EVALUATION
ID MODELSYST/CER
INADEQUACIES
SRBACT
LRBEST
MOD/DEVCERS/MODEL
SIMILARITY
i,_ RECOMMENDATIONS
COST EVALUATION
MODEL EVALUATION
SOFTWARE
REALISMACCURACY
USERMANUAL
INSTRUCTIONSUSER
MANUAL
LRBI TASK
USEMODEL
REASON -ABLENESS
ID SENSITIVITYID DRIVERS
PRIORITIZECER
(LRB IMPACT)
EVALUATEMODELSYS'W_M
LEARNGOCMMODEL
IDENTIFYCONCERNS
80916-32R
Figure 3.1.3-1. GOCM Study Plan.
3 -11
2-3 11114 5:00p

conceptual data for input. Paragraph 3.5.2 lists some of the potential applications for the en-
hanced and/or enhanced modified GOCM.
GOCM projects only current or factored current KSC operations applied against various flight
hardware configurations. If a new way of ground processing is envisioned, new or altered facility
and ground processing CERs may be required. For instance, the A/_ and Shuttle II configura-
tions may require totally different type facilities to accomplish tasks similar to those accomplished
elsewhere today. Fright hardware integration may be accomplished at the Pad. Therefore, an
expansion ready/modifiable model is necessary. Within limits the enhanced and enhanced modi-
fied GOCM are expandable and modifiable. However, ff the ALS were run in an unmodified
version of GOCM you would be processing a new flight configuration by yesterdays processing,
factored to represent tomorrow. This may be good for early comparison, but it would be poor for
anything more than a rough estimate of future cost.
As mentioned earlier, GOCM can only perform macro trade studies regarding configuration types.
The GOCM generated LRB costs were invariant to the LRB options. GOCM was sensitive only to
gross changes in physical dimensions and not to the variations within design. Therefore, Phase-B
trade studies concerning KSC ground processing will require engineering type cost modules
and/or a logistics support cost model which is more sensitive to design variations.
3.1.5 Potential Modular Growth
A capability such as provided by GOCM is necessary for pre-Phase-A and Phase-A analysis which
considers KSC ground operations. It is believed there will be a need in the future to perform
these analysis, since all near term alternate and proposed Space Transportation Systems will
either be compared against the Shuttle and/or be processed and launched at KSC/E, astem Test
Range. Therefore, it is recommended that GOCM be further developed and maintained. Further
development entails more than merely expanding the model. A more flexible and responsive
approach to cost projection is envisioned. It would be based on a modular model which could
evolve and span across the program phases.
The modular approach recognizes that no model, no matter how sophisticated and complex, can
answer all questions completely. It is futile to pursue the development of such models. A great
majority of the issues to be studied during the upcoming years could be handled in large part by
versions (modified perhaps) of developed utilities already resident in GOCM. For instance, the
traffic module in GOC-WI which handles the manifest by year can be employed independently of
the CER type and their validity. These utlilities would form the framework for processing future
3- 12

selectedmodules.Eachmodulewouldhaveits own CERs and instructions. For instance, the user
might wish to compare the STS Shuttle with either an AL3 or Shuttle 1I. From the GOCM system
library a user would call up the most current versions of the STS Shuttle and ALS modules. There
might be a dozen modules required to perform this study. The ALS or Shuttle II might require
the use of many new type facilities. Previous studies would have been in(xnixnmed into the ALS
and Shuttle II modules, so that when a comparison was needed in support of some
program/management decision (such as the evaluation of a Mars mission utilizing LEO fabrica-
tion of a space vehicle), lessons and conclusions previously learned could easily be applied.
The module database and full time resident expertise would eventually be capable of assimilating
peculiar modules from existing modules. Nonparametric study data could be selectively applied
for specific studies in module form.
The modular approach would maintain configuration control of databases, CElLs, methodologies,
and utility libraries. More detail recommendations are provided in paragraph 3.5. Paragraph
3.3.2.1 and 3.3.2.2 address in detail some of the long-term and short-term software recommenda-
tions resulting from this study.
3.2 CALIBRATION
The study team saw the need to verify GOCM and the baseline GOCM CEILs, and if necessary, to
modify and add to them. This process was called calibration. Initially it was believed only the
SRB portion of ground processing should be addressed. However, it soon became obvious that it
was of value to address the entire Shuttle system if only in a cursory manner.
The calibration process was envisioned to primarily consist of collecting "actuals" by WBS, and
rolling them up to the station sets and flight element level. This roll up is referred to "as putting
the money in the proper bucket". The data collection was performed for the period of December
1985 through January 1986 and provides a data base for the verification of ground processing
CERs.
The WBS is an extensive cost, labor and financial event data base. This data on past cost and
events is an excellent source of data for the prediction of future costs. Future costs, however, may
differ significantly from the costs of similar past activities. Frequently past costs must be adjusted
to reflect probable changes resulting from procedure and hardware changes i.e. Post 5 I-L or LRB.
3-13

3.2.1
One of the difficulties in using the W'BS accounting records is that some costs are recorded in a
single category, even though they are in fact composed of discretely different costs. These cost
categories often differ from those generated in the GOCM. Therefore, an allocation and filtering
technique must be employed to regroup and roll up actual costs into GOCM cost categories.
Each category in GOCM is correlated with one or more facilities which (for the Shuttle system)
currently exist at KSC. The facilities are manloaded to achieve their design maxium output which
is defined by the duration of each task performed within the facility. Each time the given launch
rate exceeds a particular facility's capability, a new facility is added and manioaded. Therefore,
the current in place STS facilities and their manloading represent a nearly fixed cost which can
effect 1-12 launches before additional facilities and personnel are required. Within the nearly
fixed cost of processing resides some variability. It is the employment and use of additional first
shift personnel and the increased use of second and third shifts. The ground processing cost
elements are also subject to three factors. They are technology, learning, and turnaround.
Current programs employ current (baseline) technology. Learning rate is selected by the user,
(Paragraph 3.2.7). The baseline version of G_ uses a cumulative Wright learning curve; which
is described in Section 3.2.7. Turnaround is designated as Pre-51-L or Post-51-L ground process-
ing time.
The ground processing portion of GOCM was originally generated based on the 1985 SPC WBS.
For example, for the WBS dictionary call out 1.1.1, "Orbiter Operations", the total manhours
charged against WBS 1.1.1 was divided by two to account for two OPF high bays. This number
was divided by 3 to represent the number of people per bay per shift. The duration (or number of
shifts) in a facility for each flow is easily derived from Shuttle Processing "as run data" Summary
(NASA Kennedy Space Center SO-MPO).
The difficulty encountered in attempting to calibrate the GOCM CERs occurs when flight ele-
ments processing (charged) manhours are accumulated in less discrete categories.
SPC facility loading at Kennedy Space Center can in part be obtained from the 511 report which
records cost/manhours by WBS and department code. The 1.1.1 WBS against the Orbiter can be
assumed to apply primarily to the OPF. Other flight elements share facilities and professional
judgment must be used to allocate their facility utilization. For example, the boosters use the
RPSF and the VAIl, as does the integration activity of mating the Orbiter, ET and boosters use
3- 14

I SRB ROTATIONPRO(_SSING 'ANDSURGEOPS (RPSF)
r-iit it
VAB ET.,_RB OPERATIONS
El"CHECKOUTOPS
ET,_CIBMATESRB STACKAND ANDCLOSEOUT
CLOSEOUT
Q.OSEC_JT:
!
INTEGRATEDOPERATIONS (V,_)
I
Io sI PAD OPERATIONS
LFTOFF
;II
I , 1
LAUNCHOONll:_L CENTER F'EmG ROOM OPERATIONSFR)
MOBILE _ PLATT-ORMOPERAT)OI_ (MLP)
Q SRB STACKING ON MLP AT EXPANDED RPSF - FACILITY
LEGEND:m
m
CURRENT OPERATIONS
PLANNED CHANGES
POST-51-L CHANGES TO GROUND PROCESSING
POSmME NEGATIVE
• SECOND PAD (IN PROCESS)
• THIRD MLP (IN PROCESS)
• IMPROVED SPARES LAY IN
• MAJOR MODIFICATIONS COMPLETE
TO GSE, LSE, FLIGHT HARDWARE
• SRB STACKING ON MLP AT EXPANDED
RPSF (FUTURE)
• NEW OPF (FUTURE)
• EXPANDED WORK, REQUIREMENTS AND
PAPER WORK
• PERIODIC INSPECTIONS
• AGING GSE
80916-02N
Figure 3.2-1. Present and Future STS/SRB Ground Processing Operations2-3.2
3-15
11/14 5:00p

the VAB. Most of the Err work is also perfom_d at the VAIl (see Figure 3.2-I). The WBS inte-
gration category is very broad and stretches from roUout of the Orbiter from the OPF to lift off at
the Padl
Hence, without complete documentation as to how the initial allocation was conducted in the
formulation of CK)CM, there is no way to replicate or verify the empirically derived CEILs used in
GOCM for accuracy and realism. It is further realized that the GOCM CERs contain non-SIC
cost elements, i.e. NASA, BOC, utilities, etc .... This further complicates the verification process.
To verify anything more than the top gross projections performed by GOCM is an academic exer-
cise at best, since the way we performed ground processing during Pre 51-L is vastly different from
the near term Post 5 l-L, and long range projected Post 5 I-L ground processing activities. Post 5 I-
L activity has seen a growth in the OMRSD, and an intense conservative approach to ground
processing incorporated into the OMIs. Ground processing has become more complex, formal,
and a larger activity (see Figure 3.2-2).
Changes to facilities, which will affect the nature of ground processing are planned (see Figure
3.2.-1). For instance, an added OPF bay and the conversion of the OMRF to become a third OPF
bay are planned. The RPSF is planned to have an addition which will be utilized to perform both
the SRB stacking, and its mating to the MLP. This will relieve the VAB high bays, implying a
greater yearly VAB processing rate. These type changes to ground processing and the ground
processing facilities will need incorporation into GOCM. It is for these reasons that only a cursory
calibration of the gross numbers was performed on GOCM. Even this was difficult (see Figure
3.2-3).
3.2.2 Realism And Completeness
3.2.2.1 Realism
The concept of realism, as applied herein, describes the quality of a model which accounts for and
predicts the behavior of the appropriate cost generation mechanisms found in ground processing
such that, when properly calibrated, it can execute realistic cost estimates. This concept recog-
nizes relationships within ground processing which are dependent on the flight program perform-
ance that generate cost. A good model will replicate these relationships (mechanisms) in its cost
generation activities. The study team has found GOCM to be realistic on the macro level.
GOCM while offering a high degree of realism regarding processing and facilities at KSC, does
3- 16

STS-1
CALIBRATE
51-1.
VERIFY
CONSISTENCY
WITH PLANS
(REASONABLENESS)
STS COMME_I
COST OF FACILITIES
FACILITY O&M COST
_ND
PROCESSING COST
GOCM BASELINE
I
INVN:II_gr VARIANT
BOOSTER
VARIANT
®SRB CALIBRATION
IS VERY SENSITIVE
TO PRE/POST 51 -L
ONLY COST OF FACILITIES AND FACILITY O&M COST FOR
THE STS COMMON/BOOSTER PECULIAR, CAN BE CALIBRATED.
PROCESSING COSTS CAN NOT BE CALIBRATED UNTIL MORE
HISTORICAL DATA IS GENERATED. THEREFORE WE CAN ONLY
VERIFY CONSISTENCY W1TH PLANS AND THE REASONABLENESS
OF COST PROJECTIONS.
80916-02V
Figure 3.2-2. Relationship Between Calibration and Verificationfor Various Cost Elements.
3 - 17
2-3.2 11/14 5:00p

YEARLYLAUNCHRATE
15
14
13
12
11
10
9
8
76
54
32
I
i
i
i
u
n
I
m
i
u
m
i
m
m
i
i
m
CALBO,ATN3N
ENVIRONMENT
• ____CONSTRAINTS - A _RPOST 514. LAUNCH RATE_N_ REACHING 14FLIGHTS PER YEAR BY 1991
i i i i i r i-i i I , l i II 11
YEAR 81 82 83 84 85 86 87 88 89 90 91 92 93 94 J
51-L
CALIBRATION
COSTACCURACY
.
• DOES _M REFLECT THEPOST 51-L LAUNCHENVIIRONMENT?
F NOT- HOW DO_ MOOIFY
• THERE WILL BE:• DIFFERENT GROUND
PROCESSINGTIMES
• NEW / MODIFIED FACILITIES
I YEAR 81 82 83 84 85 86 87 88 89 90 91 92 93 94 ]
Z_ 51-L
• REMOTE STACKING FORSRBs
• LRB HORIZONTALPROCESSING
• CHANGE TO VAB, PAD,LCC, MLP
80916-02A
Figure 3.2-3. GOCM Calibration Concerns.
3 -18
2-3 11/1 1 10:30a

not offer budgeting and start-up realism. All additional facility requirements and cost of facilities
instantly appear the year they are needed. These costs should be flowed back to represent design,
construction and activation budget requirements during the years leading up to initial facility utili-
zatiorL
Another important cost element that is present in GOCM, but not visible, is the transition cost.
For instance, personnel in training to process the new booster configuration will not be available
to process the current booster configuration. Similarly the duplication in booster manufacture on
site management/personnel is missing. While these transitional costs may be small in comparison
with the overall Life Cycle Cost, they are significant for the transition budget years.
Some cost analyst might think the transitional costs are considered in the learning curve. This is
not the case. Transition costs only occur during the start-up through replacement phase of the
LRB program. Learning theory applies over a greater period and addresses the recurring tasks.
Transition is a peculiar non-recurring task.
3.2.2.2 Completeness
The degree of completeness inherent to a cost model is dependent on the level of observation or
sensitivity. GOCM is a macro level model. At the macro level GOCM is considered very com-
plete. GOCM recognizes, but is not limited to, the following:
• Overall system flight hardware configuration
• Launch rate
• Facility needs and new facility cost
• 0 & M facility costs
• Inflation
• Technology impacts
• Turn around (pre/post 5 I-L)
• Learning Curves
• Shifts, days, holidays, etc...
• KSC personnel staff'mg practices
At the next indenture or level of resolution GOCM becomes very incomplete. It does not recog-
nize the following:
3- 19

• Flight hardware achieved reliability, maintainability, and supportability (RM&.S)
• RM&S sensitivity
• Sensitivity to hardware costs
• Sensitivityto flightand ground subsystem configuration
• Managementcoordination
• Paper_ (procedutea)
• Logisticsdelays,i.e.spares,GSE availabifity
While GOCM is complete in its representation of KSC ground processing and offers a reasonably
complete and moderately accurate cost projection, its usefulness is limited in engineering studies
by its insensitivities to design and processing subtlies. GOCM's lack of visibility to design features
has already been documented in Paragraph 3.1.2. GOCM's insensitivity to processing delay
mechanisms doe.m't allow the creation of success criteria and measures of merit for trade studies
aimed at stre.amlining ground processing.
Ground processing delays arc more cosily than is generally perceivexl. The most commonly used
measure of merit is dollars per pound of payload. MSFC, JSC, and KSC have a fLxed manpower
loading which can be amortized by the number of launches, which can be related to payload
capacity. The greater the launch rate the lower the cost per payload pound. Schedule delays
therefore directly translate to fewer flights per year which means greater cost per payload pound.
This was thoroughly analyzed and discussed in Volume H, Section 4.
While GOCM empirically accounts for launch schedule realism, it does not provide sensitivity to
the causes for launch delay. This level of sensitivity can only be obtained in a Logistic Support
Cost (LSC) type model, which considers reliability, maintainability, logistics and other processing
influences.
Figure 3.2.2-1 shows a strong correlation between the number of problem reports (Pigs) generated
per flow and the duration of the flow. PRs axe generated in response to the need to accomplish
unplanned work, (corrective maintenance, Paragraph 3.2.7.3) which translates into a delay. While
PRs are not responsible for delays, the quantity of PRs is an indication of the delay duration. The
causes which generate PRs are primarily discovered noncompliances and hardware failures.
Noncompliance discrepancies are usually viewed as quality problems and failures are viewed as
reliability problems. However, both are greatly affected by the ground processing friendliness of
the hardware design and support process. GOCM is insensitive to these considerations and can
not provide the necessary sensitivity to evaluate the impact and costs of ground processing friend-
liness enhancements. See Paragraph 3.2.7 for additional explanation of the role R&M plays in the
generation of KSC ground processing cost.
3-20

I-
150-
120-
90
6O
3O
t
1. _NDTIME DEPENDENT
ONPRGENERA'nON143
•-"-'- TURNAROUND
PR's
130
18 1,40AT PALMDALE
4 WK STORAGE VAB /_
. S "%
I I I i I I I I i I I I ISTS-20 STS-22 STS-24 ST9-26 STS-28 STS-30 STS-32
STS-21 STSo23 STS-25 ST$-27 STS-29 STS-31 STS-33
-5000
40O0
3000
"2000
1000
80916-02Q
Figure 3.2.2-1. Relationship Between Number ProblemReports and Turnaround Time.
3-21
2-3.2 11/14 5:00p

3.2.3 Gross Cost Evaluation
3.2.3.1 1985 Budget (WBS) vs GOCM Comparison
GCK_'s estimate of program launch cost incorporates SIC, non SIC, Civil Service, and utility
costs. The POP 85 projects these costs and could be used as a yardstick to evaluate the GOCM
gross cost estimates. However, this would only determine whether GOCM captured the projected
costs for the year its formulation was based on. This would not verify GOCMs accuracy in the
extrapolation of future costs and has not addressed actual dollars spent. The LSOC 533 Report
capture only the SPC (WBS cost element expenditures) and therefore provides only a portion of
the total STS costs at KSC. The use ofpre-1985 and post-1985 POPs is not considered valid since
the earlier years experienced launch rates too low tO verify facility potential processing capabilities
and the later years experienced zero launches. Hence, 1985 is the only viable year available to
calibrate GOCM (see Figure 3.2.3.1-1).
The gross cost evaluation of GOCM in the year 1985 are presented in Figure 3.2.3.1-2. It appears
GOCM was 80% accurate. This is excellent for a preconceptual/conceptual parametric cost
model. Further evaluation and calibration will require the generation of a new historical data
base.
3.2.3.2 GOCM Evaluation
The 1985 evaluation did not accomplish the verification of added facilities costs. Nor did it verify
the facilities potential processing capability with regard to flows per year. Since future STS appli-
cations of GOCM will address the Post 5 I-L environment, and will probably require the consider-
ation of employing new facilities, the evaluation of GOCM performed above is considered incom-
plete.
The continued evaluation of GOCM will be addressed in Section 3.2.4, where select CERs and/or
results derived from them are compared with other available source data. This should provide a
greater degree of calibration, but is considered incomplete.
The important distinction between realism and accuracy must be made, for it precisely applies to
the evaluation of GOCM. Based on investigation and use, GOCM realistically portrays the KSC
ground processing activity. GOCM identifies macro cost elements and activities and realistically
3 - 22

LL=O
LL
03
I,J..It)
03
>-U.
i,
FLT
1
2
3
4
5
6
7
8
9
10
11
12
13
14
15
16
17
18
19
20
21
22
23
24
25
DESIGNATION
STS-1
STS..2
S'1"S-3
STS-4
STS-5
STS-6
STS-7
STS-8
STS-9
STS-11 / 41 -B
STS-13 / 41 -C
STS-14 / 41-D
STS-17 / 41 -G
STS-19 / 51 -A
STS-20 / 51 -C
STS-23 / 51 -D
STS-24/51 -B
STS-25151 ..G
STS-26 / 51 -F
STS-27 / 51-1
STS-28 / 51 -J
STS-30 / 61-A
STS-31 / 61-B
STS-32 / 61-C
STS-33 / 51 -L
VEHICLE
OV-102
OV-102
OV-102
OV-102
OV-102
OV-099
OV-099
OV-099
OV-102
OV-099
OV-099
OV-103
OV-099
OV-103
OV-103
OV- 103
OV-099
OV-1 O3
OV-099
OV- 103
OV- 104
OV-099
OV- 104
OV-102
OV-099
LAUNCH PAD MLP
04-12-81 A 1
11-12-81 A 1
03-22-82 A 1
06-27-82 A 1
11-11-82 A 1
04-04-83 A 2
06-18-83 A 1
09-13-83 A 1
11-28-83 A 1
02-03-84 A 2
04-06-84 A 1
08-30-84 A 2
10-05-84 A 1
11-08-84 A 2
01-24-85 A 1
04-12-85 A 1
04-29-85 A 2
06-17-85 A 1
07-29-85 A 2
08-27-85 A 1
10-O3-85 A 2
10-30-85 A 1
11-26-85 A 2
01-12-86 A 1
01-28-86 A 2
AUGUST 06 1988
LAND SITE
04-14-81 EAFB
11-14-81 EAFIB
03-3O-82 WSt,/B:I
07-04-82 EAFB
11-16-82 EAFB
04-09-83 EAFB
06-24-83 EAFB
09-19-83 EAFB
12-08-83 EAFB
02-11-84 KSC
04-13-84 EAFB
09-05-84 EAFB
10-13-84 KSC
11-16-84 KSC
01-27-85 KSC
O4-19-85 KSC
05-06-85 EAFB
06-24-85 EAFB
08-06-85 EAFB
09-03-85 EAFB
10-07-85 EAFB
11-06-85 EAFB
12-03-85 EAFB
01-18-86 EAFB
u.
>-O
80916-02C
Figure 3.2.3.1-1. LRBI STS Flight History
3-23
2-3.2 11/11 10:30 p

FIXED PROGRAM COST _iPUT
FIXED _IPLFr COSTS: (_)
BOG - 652 PEOPLE
CML SERVICE - 754 PEOPLE
PAYLOAD OPERATIONS = 476 PEOPLE
PROPELLANTS = 11.5M ($)
100% LEARNING APPLIED IN GOCM ESTIMATES
THE RESULTS OF GROUND PROCESSING LEARNING WERE NOT REALIZED IN MANPOWER
REDUCTIONS. RATHER, THE RESOURCE SAVINGS WERE APPLIED ELSEWHERE. FORINSTANCE: PAD AND OTHER FACILITY NON-RECURRING ACTIVATION. THE EFFECTS OF
LEARNING DID MANIFEST THEMSELVES IN ACHIEVING A SHOR'rF_R TURNAROUND WHICH
EQUATES TO A GREATER LAUNCH RATE CAPABILITY.
SINCE GOCM CAN ONLY APPLY LEARNING TO BOTH TURNAROUND AND MANPOWER, OR
ONLY MANPOWER, WE ELECTED TO APPLY NO LEARNING TO THE CALIBRATION
PROCESS.
C__$T SUMMARY
GOCM KSC
$ 442M $ 549M (_
GOCM - 19% VARIANCE
Q O ACTUAL COST IS PROVIDED IN "CONGRESSIONAL EXERCISE ON SHUI-FLE OPERATIONSCOST TRENDS" AC - REQ, NOV. 15, 1985.
80916-02X
Figure 3.2.3.1-2. GOCM Estimate versus Actual Cost
Comparison for FY85.
3-24
2-3.2 11/15 9:00a

relates them to launch operations. GOCM is realistic. GOCM appears to be accurate. It is
possible for a model to be realistic and inaccurate! The beauty of G(K_M is it could be made to
realistically process a host of next generation CERs. This is GOCMs strength.
3.2.4 Ground Processin_ SIS LRB/SRB CER Verification
It is important to the LRBI study to compare the POST 51-L GOCM CERs with the Shuttle
Operations Mission Planning Office processing projections and with the LRBI projections.
Comparison of processing shifts is provided in Figure 3.2.4-1 for the Post 51-L environment.
While there seems to be points of great variance, the overall costs sensitivity to the processing
variance is modest. For instance, the VAB variance between GOCM and LRBI represents ap-
proximately $600,000 dollars for 14 launches per year. This represents approximately .12% of the
total program yearly cost at KSC.
3.2.5 Facili w Cost Driver Verification
The facility costs are invariant to turnaround, and technology. The original facility cost model has
more documentation than the original processing model. However, the opportunity to verify the
CERs is not available, since much of the source data is no longer available.
Facilities are a very significant cost and schedule driver, and verifying the accuracy of the GOCM
CEILs for select facilities is important. A comparison of facility cost generated by GOCM with
cost independently developed in the LRBI was possible only for the MLP (the only new LRBI
facility in the GOCM repitoire). The two costs were within a few percent of each other.
3.2.6 Transition
There has never been a transition of the type and magnitude envisioned to occur with the LRB
introduction in NASA history. There is little experience applicable to transition planning, devel-
opment of transition cost and transition management. We can only approximate the cost by fac-
toring past experience (i.e. change from Saturn V to Shuttle at KSC) and using professional
judgement.
GOCM treats startup (Facility & Ground Processing) expenditure growths by averaging and
smoothing the changes over a two year period. This in effect generates an extra buffer for transis-
tioning on the growth side. GOCM smoothes transient expenditures.
3 - 25

ELEMENT/ /EFFECTIVITYF CUn'/
8
rr
8"®
rr
tr
5O
OPF
SECOND OPERATIONAL
YEAR112 POWER ON
56 POWEROFF
168 POWER (56)
WORKING SHIFT
7/3
VAB 1e (6) 7/3
PAD 3 (21) 6/3
OPF 12O (4O) 7/3
VAB 36 (12) O 7/3
PAD 42 (14) 6/3
OPF 120 (40) 7/3
VAB 21 (7) 7/3
PAD 42 (14) 6/3
OPF 7/3
VAB (20) 7/3
PAD (2O) 6/3
THE VARIANCE BETWEEN THE CURRENT PLANNING FACTORS FOR POST 51 -L AND THE
GOCM POST 51-L PROJECTED FACTORS FOR THE STS/SRB ARE SIGNIFICANT, THE GOCM
LRB IS MORE CLOSELY ALIGNED WITH THE PLANNED SRB,
Q GOCM BASELINE CONFIGURATION, UTILIZING POST 51-L TURNAROUND, BASELINETECHNOLOGY AND NO LEARNING/GROUND PROCESSING CURVES.
Q STACKING ACCOMPLISHED IN PARALLEL (24 SHIFTS).
80916-02P
Figure 3.2.4-1. Ground Processing Shift Comparison.
3-26
2-3.2 11/11 10:30a

The LRB growth should aecmmdam a substantial cushion in GOCM during the transition. Figure
3.2.6-1 conceptually illustrates these effects. It is felt the GOCM transition costs are high.
However, a smooth efficient transition is not expected. The transition period is subject to great
cost, schedule and technical risk. It is therefore considered prudent to cover these risks with a
conservative (high) estimate. The GOC_ approach (bow wave modeling) is as good as any. It
applies 1/2 the years additional eatamditu_ to the prior year. Decreases in expenditures, howev-
er occurs in real time. Therefore, SRB phase-out should see a real time decrease in personnel
costs while LRB phase-in will see a one-half plus delta buildup one year before the needed
growth. This is transition. Either one-half of the equivalent additonal personnel are in training or
they are performing duplicate duties on an ahemate basis.
3.2.7 Cost Reduction Curves
The baseline configuration of GOCM employs a typical manufacturing learning curve feature.
Learning curves and growth curves are addressed under the concept of cost reduction curves, since
they both vary cost as a function of cumulative launches. Learning curves and growth curves are
treated separately for discussion purposes, but are applied within a composite curve which also
contains modification work and other activities. The composite curve is called the ground process-
ing curve.
3.2.7.1 Reliabili_ and Maintainability_ Growth Curves
It is common for new products to be less reliable during early development and production than
later in the program when improvements have been incorporated into the program as a result of
failures observed. This was fLrst analyzed by J. T. Duane. He observed that the cumulative mean
time between failure (MTBF) plotted against total time on log-log paper gave a straight line. The
slope gave an indication of reliability growth.
The Duane method can be employed to assess the amount of time required to attain a target
MTBF (contractual requirement) during the test phase. This assessment is typically presented as
a reliability growth curve.
Achieved reliability is important to ground processing planning. The Orbiter, for instance, experi-
ences many failures during ground processing. Systems are routinely powered up to support
modification check-outs, system integrity checks, and to support ground operations. Failures
occurring on the ground will result in unplanned corrective maintenance events, which will burden
the ground processing activity, and frequently cause delays. Additional ground failure may be
3-27

i-
8
F TRANSITION COST (GOCM)
GOCM COST LOADED
GOCM REQ COST
I I I I I1 2 3 4 5
YEARS
GOCM LOADS A REQUIRED INCREASE EXPENDITURE BY TAKING ONE-HALF THE CHANGE
(DELTA) AND APPLYING IT ONE YEAR EARLIER.
IT IS BELIEVED THIS COVERS TRANSITION.
80916-020
Figure 3.2.6-1. Simplification of GOCM Averaging and SmoothingApplied to Transition Costs.
3-28
2-3.3 11/14 5:00p

induced by scheduled ground processing activities. It is for these reasons the ground processing
activity is concerned with the degree of achieved reliability and maintainability (R&M) prior to
the first manned launch and the resulting degree of subsequent growth there after.
For the LRB program, the degree of achieved R&M growth is dependent on the magnitude of
R&M incorporated into the initial design and the duration and intensity of the follow through
during initial operations test and evaluation (lOT&E). Follow through of initially realized R&M
performance is only achieved through contractual implementation and institutionalization (during
IOT&E). This requires rigorous quantitative contractual R&M requirements to be imposed on
the prime developing and support contractor as a function of cumulative launches. In other words,
R&M performance is contractually def'med by use of a growth curve.
The important concept underlying the use of growth curves in projecting great cost enhancements
over time is to realistically ascertain whether the contracted and institutional mechanisms are in
place or will be employed for the realization of R&M growth.
3.2.7.2 Learning Curves
The learning curve is a graphical or analytical representation of the anticipated reduction in re-
quired input resources as the production process is repeated. Empirical evidence supporting the
existence of this learning phenomena has been extensively documented.
The most widely used technique to generate learning curves is the one developed by Dr. Wright
for use in the aircraft production industry. This technique has found broad use in the aircraft
industry and in the governmental agencies responsible for military procurements. However, while
the existence of learning curves is observed in many other repetitive processes, the technique for
the generation of learning curves and their application is the subject of much debate.
The model Wright formulated was:
Yi = a(i) -b
where i is the production count beginning with the first unit
a - is the labor hours required for the first unit
b - is the measure of the rate of reduction
y - is the i th unit labor hours
fJ
3 - 29

Typically this is mmslmed into the following form:
Iny=InA-bini
Where b is derived from early experience with:
b=Ini
3.2.7.3 Cost Reduction Curves for Ground Processing
Great d[ff'lcu]1y is encountered in the application of the leaming theory and the growth theory to
the STS ground processing. Both theories are based on task impact reduction for repetitive activi-
ties, and do not consider non-repetitive (unique) tasks or delays. A significant portion of the
ground processing activity is the modification of flight hardware, which is a non-repetitive task.
The modification activity introduces schedule delay due to the planned extra work and schedule
delay due to the unscheduled corrective maintenance resulting from the planned extra work
(induced, and processing operating failure). The frequent Shuttle modifications and their associ-
ated unscheduled maintenance introduces significant delays to ground processing which is not
normally addressed by the learning and growth curve theory.
These processing delays have many contributing elements. A few are listed below:
o Logistics delays due to budget short falls
o Management problems
o Modification requirements
o Quality procedures
o Other, payload, etc...
There is an undedying belief by many people that there are cost curve mechanisms in effect relat-
ed to user experience or accumulative launches. In projecting future KSC costs, some estimators
have employed the aircraft industry manufacturing growth rate of 85%, which greatly affects the
overall life cycle ground processing costs. Investigation of the KSC ground processing activity
reveals that the 85% learning curve does not apply to ground processing! However, further inves-
tigation does show an empirical trend regarding Shuttle turnaround, which can be handled in a
Wright fashion. We call this a ground processing curve.
3 - 30

3.2.7.4 _ Proce_in_ Curve A_sim/lat/on
The best data available for developing ground processing curves appears to be the processing
times for various missions (see Figure 3.2.7.4-1). Even they are not pure and require careful
evaluation, and only represent 24 ground processing flows. However, some interesting curves
emerge upon careful investigation.
There is a trend regarding each successive Orbiter delivery to KSC and the delay experienced in
their first flight processing. It quickly decreases (see Figures 3.2.7.4-2 and 3.2.7.4-3). It appears
lessons learned in early processing delays have been incorporated in follow-on production. The
early Orbiters have experience after delivery manufacturing which was performed at KSC. This
appears to be quickly diminishing with each successive Orbiter delivery.
The cost reduction curves for the LRB should differ from the Shuttle derived curves. The LRB is
not reusable. However, it could experience growth and early field modifications at KSC and this
would burden the initial ground operations process. If a rigorous contractual R&M requirement
is levied up front during development, and follow-on development is institutionalized within
ground processing, then a more gradual curve would be expected.
The overall empirical STS ground processing curve is presented in Figure 3.2.7.4-4. Applying
learning curve methodology (Wright) graphically, and varying the rate of reduction (learning), an
excellent fit was obtained on the computer. The rate of reduction was 59% (b = .755). This is in
close agreement with another curve developed earlier and independently by SIC subcontractor,
PAN-AM. They derived a 60% (b = .725) curve.
The STS learning should be small since the OMIs for ground processing should be extensively
preplanned and frozen before initial operations. R&M growth and learning should also be small
if the program strives to achieve high up front R&M performance requirements and if the hard-
ware design and support process is made processing friendly. Hence, it is believed (if the above is
true) that the STS should experience a 90% cost reduction curve.
Upon reevaluation of the historical ground processing data, a different set of curves can be de-
rived which bears out the above belief in a small rate curve (90%). Figure 3.2.7.4-4 is believed to
exhibit two distinct mechanisms. There are new Orbiter introductions into the fleet which perturb
ground processing and the recurring ground operations curve. If the four perturbations are curve
fitted (alone) a 70% curve is derived. This curve is called the transitory Orbiter introduction
curve. The remaining is the ground processing performance curve. If the highest and lowest
3-31

MISSIONNO.
1 1
2 2
3 3
4 4
5 5 31-A
6 6 31-B
7 7 31-C
8 8 31-D
9 9 41-A
10 11 41-B
11 13 41-C
12 14 41-D
13 17 41-G(F)
14 19 51-A
15 20 51-C
ct3-1 (22) (51-E)
16 23 51-D(D')
17 24 51 -B
18 25 51-G
19 26 51 -F
20 27 51-1
21 28 51-J
22 30 61 -A
23 31 61-B
ORBFLTNO.
102-1
102-2
102-3
102-4
102-5
099-1
099-2
099-3
102-6
099-4
099-5
103-1
099-6
103-2
103-3
O99
103-4
099-7
103-5
099-8
103-6
104-1
099-9
104-2
LAUNCHDArE DArE
WORKDAYS IN:
OPF TOTAL
04-12-81 04-14-81 532 668
11-12-81 11-14-81 99 187
03-22-82 03-30-82 55 97
06-27-82 07-04-82 41 77
11-11-82 11-16-82 48 102
04-04-83 04-09-83 123 244
6O34
1261822
06-18-83 06-24-83
08-30-83 09-05-83
11-28-83 12.08-83
02-03-84 02-11-84 52
04-06-84 04-13-84 31
08-30-84 09-05-84 1232
55
128
8O
53
210
10-05-84 10-13-84 53 80
11-o8-84 11.16-84 34 56
01-24-85 01-27-85 31 56
(03-07-85) 57 (82)
04-12-85 04-19-85 53' 73
04-29-85 05.06-85 31
06-17-85 06-24-85 37
VAB PAD
33 104
18 70
12 30
07 29
09 45
06 115
05 21
Io41 25123 342
06 22
Io41 18153 722
05 22
05 17
05 20
05 14(6)
05 15
Io41 15
07 114105 31
07 22
14 34
04 114104 15
50
58
7507-29-85 08-06-85 39
08-27-85 09-03-85 27 56
10-03-85 10-07-85 84 132
10-30-85 11-06-85 35
11-26-85 12-03-85 27
53
1461COMPOSITE EXPERIENCE 26 04 14 1441MINIMUM MODFICATIONS
80916-02G
Figure 3.2.7.4-1. Turnaround Experience.
3 -32
2-3.2 11111 10:30a

70O
6OOT
?A S00L
PRO 400C
|S 30OI
NG
20ODAYS 100
0LEGEND:
"1" OV099
---,,--- OV102
OV103
OV104
J i I I
0 2 4 6 8 10
NUMBER OF STS FLIGHTS PER ORBf_R
Figure 3.2.7.4-2. Processing Times by Orbiter by Flight.
80916-02U
7oo
6oo
2oo
lOO
t t 1
0V102 OV099 OV103 OV104 (or105)ORBITER
LEGEND:
RRST FLOW TREND
Figure 3.2.7.4-3. Process Trends for Orbiter Introductions.
2-3.2 11/1 1 10:30a
3-33

700|
600
500
400
3O0
200
100
I I I I I I I
0 10 20 30 40
STS FLIGHT NUMBER
LEGEND:
[] PROCESS CURVE TREND
-FACTUAL PROCESS TIME
80916 -O?.J
Figure 3.2.7.4-4. Overall STS Ground Processing Curve.
3.34
2-3.2 11111 10:30a

points are independently connected they form two curves which are interpreted to be fl_ upper
and lower performance limits. Figure 3.2.7.4-5 shows these curves with a m/d-point (average)
curve. This ground processing curve is recommended for use in all studies of ground processing at
KSC in the near term. Long-term applications may require a new curve ff different processing
reduction mechanisms are cram-actually and/or institutionally employed.
There is difficulty in applying a peculiar curve to the booster in GOCM without applying it to the
overall Shuttle system. This is because GOCM in its present configuration won't segregate the
flight element costs. This may not be a problem for GOCM operations. Booster processing
represents a small portion of the overall flow, with the LRB processing costs being equal or slight-
ly larger in magnitude to the SRB processing costs.
Cost reduction curves rates are dependent on either an intense effort spent early to quicHy realize
lower potential cost (high rate) or an intensive follow up improvement program concurrent with
operations or test (low rate), i.e. engineering change requests. If no new effort for improvement is
spent (a high rate), then little improvement is realized. Hence, a high rate learning curve only
provides little improvement to either poor cost performance or good cost performance. The
ground processing curve rate is the most sensitive early life cycle GOCM ground processing
parameter. Figure 3.2.7.4-6 illustrates the effect a 90%, 80%, 70% and 60% ground processing
curve has with regard to the overall ground processing time.
3.2.8 Success Oriented vs Post 51-L
As illustrated in Paragraph 3.2-7, the ground processing curves represent the most significant and
sensitive initial ground processing cost drivers. Since pre-51-L turnaround CER values are not
applicable, and Post-51-L actual values are already becoming available, the primary issue concern-
ing GOCMs accuracy is in the application of the ground processing curve. It is assumed that the
GOCM CERs will soon be updated. It is further assumed that users will not wait for additional
launches to derive a new processing curve. Therefore the issue of success oriented versus accuracy
is reduced to the soundness of applying the ground processing curve.
GOCM can handle any curve the user wishes to incorporate into the cost analysis. The difficulty is
choosing the correct curve. The choice of curve is dependent on the potential for improvement
and the presence of in-place incentives and mechanisms to realize the programs potential (per-
formance). Paragraph 3.2.7 derived a ground processing curve based on the assumption that the
growth/learning in place at KSC will be present in the near future to effect the STS and similar
programs.
3-35

STS GROUND OPERATIONS PROCESSING
i
70O
6O0
5O0
400
3O0
UPPER LIMIT20O
AVERAGE
LOWER LIMIT
100
I
0 4 8 12 16 20 24
STS FLIGHT NUMBER
LEGEND:
!-1 9O% LEARNING
80"/oLEARNING
70=1,LEARNING
Z_ 6O°/,,LEARNING
V ACTUAL PROCESSING
80916-02W
Figure 3.2.7.4-5_ Ground Processing Curve
2-3.2 11Ill 10:30a
3-36

7O0!
,oo k
_ 4oo
100 "
0 " I I I I I I I I I | I I
0 4 8 12 16 20 24
STS FLIGHT NUMBER
LEGEND:
r"t 9o%_l_
<_ 8O% LEARNING70% LEARN 114(3
V ACTUAL PROCESSING
Figure 3.2.7.4-6. Ground Processing Sensitivity to Ground Processing Curves80916-021 2-3 11/11 10:30a
3- 37

The Post-51-L ground processing performance will be a partial "flesh start". The ground process-
ing system and flight hardware have experienced significant changes since Flight 5 I-L. While past
user experience has not been forgotten, new changes independent of it have been implemented.
As a l_sult, some people think KSC is embarking on a new progr_n, subject to starting all over
again on the processing curve. This contention does not ignore the benefits of past experiences
which prevails on the program today. The debate on where to resume on the curve is not very
important to LCC, however, since it is relatively flat after 30 launches (assuming mature program
reductions in cost are realized).
The magnitude of change to the ground processing duration resulting from 51-L is so great that it
inferes a great potential for improvement. This supports the contention that ground processing
should commence at the beginning of the curve. The real question is whether the pre-5 I-L poten-
tial and improvement mechanisms still prevail at KSC. It is our contention that they do as evi-
denced by the manifest and NASA's recent investigations into Ground Processing efficiencies,
i.e. VITRO, Boeing.
Therefore, it is believed the early portion of the curve should be applied at the STS 26R launch
for extrapolation into the future. It is concluded the ground processing curve derived in Section
3.2.7 is the preferred curve and that no perturbations should be added until the introduction of the
fifth Orbiter in 1992-1993. The baseline GOCM utilizes the preferred processing curve and does
not address new Orbiter introduction for STS applications.
3.2.8. I Applying The Ground Processing Curve
The ground processing curve is applied to STS 26R and up (Paragraph 3.4.2). The interesting
conclusions are:
• Through 1994 the planned STS launch rate is not likely to be achieved.
• The degree of follow-on STS ground processing improvement from 1994 and on, is small, and
for a fhst order approximation can be ignored from this point on to simplify the LRB analysis.
3.3 MODEL ENHANCEMENTS
3.3.1
The original Ground Operations Cost Model is based on a IBM PC-compatible microcomputer
3 - 38

with a hard disk, 640K of RAM memory and Symphony 1.2 software. The operation and automa-
tion of the model was based on Symphony macro instructions. The original model was highly
innovative in its approach. It provided a high degree of analysis with a moderate degree of user
experience and with minimum user input. It made effective use of the familiarity with Lotus
spreadsheet products as used on IBM PC-compatible hardware. Symphony itself is classified as an
integrated software product. It provides, in one software package, sl_v, adsheet, word processing,
graphics, database and communication capabilities. Symphony is "RAM resident", which means
that the entire Symphony program and Symphony spreadsheet must completely co-reside in the
computer's memory. As a result, the size of the spreadsheet is restrained by the size of computer's
memory. Since Symphony is designed to work with the PC DOS operating system, the user is
limited to 640K of RAM memory without the use of "expanded memory" (which requires a special
expansion board and software). Many IBM PC-compatible computers at the Kennedy Space
Center are simply not equipped with this expensive option.
The original Ground Operations Cost Model evolved over several years. As a result, a new area
added to the model would reference a value in the area above it. This second value would in turn
reference another value higher in the spreadsheet, and so on. This led to a string of references
that provided accurate information but was extraordinarily difficult to "unravel".
Spreadsheet software provides exceptional visibility to calculations and is easy to use. The name
of the original microcomputer electronic spreadsheet, VisiCalc, was a contraction of visible calcu-
lator. This visibility makes the use of electronic spreadsheets much less intimidating for inexperi-
enced microcomputer users. In addition, Lotus Symphony provides its spreadsheet with an inter-
hal application language. This language is formally called the Symphony Command Language, but
is informally referred to as "macros." The use of macros allows quick development of sophisticat-
ed, menu-driven spreadsheet automation within a limited range of functions. Unfortunately,
macros are also highly unstructured and difficult to document. As application languages go,
macros, when used outside a limited range, can be very awkward for the programmer. Ease of use
is offset by lack of power.
3.3.1.1 Baseline
The original Ground Operations Cost Model consisted of one large spreadsheet (Opsmod.WR1)
and 2 much smaller, supplementary spreadsheets (Procmod.WR1 and Facmod.WRl, (see Figure
3.1.2-1). Opsmod.WRl was so large that only 11K of user memory was available for expansion or
enhancements. With the original model configuration, this constraint was a fatal limitation.
The original model provided up to 35 pages of output. This included facility utilization, vehicle
3 - 39

characteristics, technology influences, record of facilities shared with the SRB, a traffic model,
new facility requirements, a Wright Learning Curve, a summary of intermediary results, and a
final analysis output.
The user was guided through all these areas with macros and macro menus that were all contained
in the Opsmod.WRl slneadsheet. These macros were located across a large portion of the
spreadsheet, and determining their logical flow was difficult. As this model was originally intended
for the personal use of experienced employees, the users manual was austere. In addition, some
places were found to be incomplete.
3.3.1.2 Enhanced/Modified
In order to initiate any enhancements or modifications, we first had to make better use of the
available RAM. This was a problem that did not confront the original model, as it did not exceed
the 640K limit. However, to make the model more comprehensive and "user friendly" required
making the model larger. In the original configuration, there was simply no room to do this. We
were able to achieve a reduction in the memory requirements of the main model by modularizing
all supplementary data areas. This approach had the added benefit of allowing experienced users
to build a library of output data f'des. For example, a variety of facility "portfolios" could be creat-
ed and saved to disk. At a later time, a less experienced user would be able to access the different
output Ides, and import them into the main Operations model at will. Since each module saves
output files with a unique file extension, only the appropriate output file library is displayed to the
user.
This task was begun in the original model, which had a processing and facility submodules. Varia-
ble and traffic data areas were extracted from the original model and established as separate
modules. The original Processing and Facility submodules were enhanced with a more compre-
hensive user interface.
We assume that the model was first programmed in Lotus 1-2-3 and then ported into Symphony.
We have based this assumption on a variety of powerful Symphony functions and enhancements,
not available in Lotus 1-2-3 that were not incorporated in the original model. For example,
Symphony database functions, multiple windowing capabilities and a variety of Symphony envi-
ronments were not addressed in the original model. We aimed at using the full power of the Sym-
phony spreadsheet and Command Language to 1) enhance the power of the model where possi-
ble, and 2) refine the user interface for those with limited PC experience.
3-40

We first addressed the user interface. Our guiding philosophy was to keep the format and infor-
marion on the monitor screen as stationary as possible. We would then let the macros and macro
menus move data in and out of the screen. Where appropriate, different windows would overlay
the screen without disruptingthe originalinformationwhen the window was removed. This leads
to a more stable screen envinmngm that inexperienced users find less confusing.
Processing Module
The original Processing module presented the user with different choices for vehicle configura-
tion. The user chose the configuration, technology status and turnaround rate. Based on this
information, the module generated the appropriate number of shifts and manpower and assigned
them to the appropriate Shuttle systems. This information was exported to the main Operations
model as an extracted f'fle.
Based on the original CEILs and logic, we reprogrammed the Processing module with a number of
enhancements. The macro automation was made more robust, the required user input was unified
into one stationary screen, and the elements and processing systems were standardized. In addi-
tion, the enhanced module allowed a wider choice of configurations, including mixed booster fleet
vehicle configurations.
We attempted to achieve a level of comprehensiveness that would allow the model, as new infor-
mation was generated, to accurately evaluate the widest possible number of future configurations
without structural modification to the model. We view this improvement as making the model
"expansion ready." The structure for future enhancements are in place. The incorporation of
additional formulas and CERs can be made as they become available.
As an example, the use of the Symphony @CHOOSE function in the selection of technology and
turnaround levels allows the addition of new levels to be quick, easy, and virtually self-document-
ing.
3-41

The main screen for the Processing module is shown below:
Processing Factors
Vehicle===============> STS
Technology============> BASELINETurnar ound==_---=======> REVISED
Vehicle Configuration
Module J Number Element Location Fuel RecoveryD
SRB I 2 4 SIDE SOLID WATER PARACHUTE
LRB I 0 N/A N/A N/A N/A
CORE I 1 0 SIDE LH2 EXPENDABLE
LEO I 1 3 SIDE LH2 MANNED GLIDEBACK
PAYLOAD I 2 INTERNAL
The original Facility Module provided CERs which are based on facility dimensions, Cost of
Facilities, Equipment Costs and Support Facility Costs. With this solid foundation as our base, we
aimed at 2 enhancements. First, we would improve the user interface. Second, we would use this
interface to allow the user to simultaneously evaluate a wider range of facilities. For instance, the
original model did not allow the user to send both LRB and SRB facility information to the main
Operations model. You had to choose one or the other. Using Symphony's database functions,
the Form environment, and window overlays for on-screen instruction, the user can now choose
multiple booster facilities. Financial information on all these facilities can now be simultaneously
sent to the main Operations model.
The enhanced module provides two levels of user involvement. At the "INPUT" level (shown
below), the user is presented a database edit form and is able to view all facilities in the model.
This allows inexperienced users to send a variety of facility combinations to the main Operations
Model.
3-42

GENERIC NAME LEOPF
CER 4
NUMBER OF FACILITIES :
SHARED FACILITIES : YELEMBNT LENGTH: 122
ELEMENT WIDTH: 78
ELEMENT WRIGHT : 57
IFACILITY LENGTH 197.0
FACILITY WIDTH 150.0
FACILITY HEIGHT 95.0"--
COF $28.2 ($M)
EQUIP $173.9 ($M)SUPT $5.2 ($M)
_ -- ---- w -- -- -- -- . .....
3
(Y or
(ft)
(ft)
(ft)
(ft)
(ft)
(ft)
N)
INPUT--+
More experienced users may wish to modify the original CERs, change facility dimensions, or alter
the costs.
Variable Module
The original model did not have a Variable module. A variety of variables were assigned
throughout the spreadsheet. These variables were the basis of much of the original model's flexi-
bility, and were inherent to meaningful output. However, they were dispersed throughout the
spreadsheet, and were often difficult to locate. In addition, there was no guidance for inexperi-
enced users as to standard rates and factors. We unified the majority of these variables into the
Variable module. Changes are made via macro menus, and on-screen standard rates and factors
also guide the inexperienced user. The escalation and discount factors were combined into one
variable. This allows the user to more easily select an index year, and express any time period in
index year dollars. For example, this module permits the user to create factors that allows the
period 1988 to 2006 to be expressed in 1995 dollars. Facility Utilization, Manpower Rate, Sched-
uled Days per Week, Scheduled Shifts per Day, Surge Factor, Index Year, and the Location of
Launch Site are all user modifiable, as shown by the following:
3-43

Variable Rates and Factors
Location of Launch Site==> ETR
Manpower Rate==========---> $186
Index Year====--=-=-===_--==> 1987
Schedule Days/Week===_--==> 6
Shifts/Day======> 3
Holidays/Year===> 19Factors Escalation Rate=> 0.0%
Facility Utiliz=> 85.0%
Surge Factor====> 0.0%
Standard is: ETR
Standard is: 186 (19875)
Standard is: 1987
Standard is: 6
Standard is: 3
Standard is: 19
Standard is: 4.5 (NASA)
Standard is: 85
Standard is: 0.0 (NASA)
Start Year ....... > 1996
Rate Factor ...... > 1
Nth Factor ........... > 8
(From Traffic Model)
(From escalation)
(Start_year less
Index_year )mmm
YEARS 1996 1997 1998 1999 2000
INDEX FACTOR 1.000 1.000 1.000 1.000 1.000
ESCALATION FACTOR 1.000 1.000 1.000 1.000 1.000
ESCALATION RATE 1.000 1.000 1.000 1.000 1.000
Im_mM_NM
The Traffic module was extracted from the original Operations model and expanded to include
either a SRB, LRB (or both) flight schedule. It permits the user to select a starting year, the
maximum weight each vehicle can carry into space, the payload utilization factor, and a variety of
different predetermined flight schedules. The user can call up a schedule by name, or create a
customized schedule for, among other things, special sensitivity analyses, as shown below:
3 -44

Traffic Rates and Factors
START YEAR========> 1996
SRB VEHICLE=======> CUSTOM LRB VEHICLE_==_==> LRB STUDY
MAX WEIGHT========> 65 K-LBS MAX WEIGHT========> 75 K-LBS
PAYLOAD UTILIZE===> 100% PAYLOAD UTILIZE_==> 100%
FLIGHTS : CUSTOM 11 8 5 2 0
FLIGHTS : LRB STUDY 3 6 9 12 14
WEIGHT (CUM) K-LBS 195 390 585 780
SCHEDULE 1996 1997 1998 1999 2000
POP 85 20 20 20 20 20
POP 87 14 14 14 14 14
POP 88 1 7 10 10 12
MAIFEST 1 5 10 10 11
LRB STUDY 3 6 9 12 14
GENERIC 1 3 4 4 10
CUSTOM 1 1 1 1 1
3.3.2 Future Potential Enhancemen_
3.3.2.1 i,_X¢.R.l_ilgt
Short range potential enhancements are constrained by the current use of Symphony software, the
IBM PC, and the DOS operating system. The enhancements we have made to the Ground Opera-
tions Cost Model have, as mentioned earlier, made the model "expansion ready." As a result, the
model has been restructured with the idea of additional CERs in mind. As our knowledge and da-
tabase increases, more and more CEILs, and more refined CERs, can be inserted into the model.
The constraint here is not the model's ability to compute, but human inability to provide the
model with perfect information. Despite the hardware and software limitations discussed above,
this model provides an exceptional opportunity to refine our thinking and explore more sophisti-
cated areas of financial analysis that apply to ground processing. The Operation Model is also in
good posture to be modified to accept mixed vehicle fleet in addition to mixed booster fleet con-
figurations.
3.3.2.2
Long range enhancements will have to acknowledge the imminent advances in computer hard-
ware, application software, and operating systems. OS2, when available and supported, will
remove the current IBM PC memory restraints. A new generation of application software will
- 3 - 45

open doors to data and analysis that are presently closed and locked. The CElLs developed now,
along with improved technology, will be an invaluable foundation for any future effort. The power
provided by advances in hardware and software are the raw means of calculation. Nevertheless,
the wisdom behind these calculations will determine their viability.
We believe, however, that for the model to continue to grow in power and sophistication, we will
have to abandon the use of spreadsheet software. More advanced graphics, more sophisticated
database management, access to elements of artificial intelligence, use of virtual memory and
commercially available subroutines all point to the use of a more powerful application language
such as dBASE IV or PASCAL. Symphony is exceptionally versatile in a limited area. Neverthe-
less, to expand one step beyond this area requires a totally new software envkonment.
3.4 GOCM APPLICATION TO LRBI STUDY
3.4.1
The LRB single fleet and LRB/SRB mixed fleet costs are provided in Figure 3.4.1-1.
3.4.2 Cost Comparison
GOCM cost projections are compared with LRBI, General Dynamics, and Martin Marietta pro-
jections in Figure 3.4.2-1.
3.4.2.1 LRBI Study Comparison
The LRBI Study "bottoms-up" approach to the generation of cost is an engineering detail estimate,
providing greater resolution in costs. Its accuracy and realism are undetermined, but its cost
generation is more rigorous than GOCMs. The LRBI analysis is a Phase-B and C estimating
technique and, as such, was probably too ambitious too soon to be both complete and accurate.
Follow-on LRB study will have to apply the "bottoms-up" approach to more use, on a select basis,
and be supplemented with parametric CERs. It is also possible to supply the cost element values
to a derivative of GOCM in order to generate cost reports. These cost reports would provide the
effects of learning, inflation, discount, flight schedule, work days, work shifts, etc.., to the Life
Cycle Cost. See Figure 3.4.2-1 for the LRBI cost estimate.
3.4.2.2 General D3,namics
3 - 46

NON-RECURRING RECURRING TOTALSCENARIO COST COST COST
MIXED 369 _ 5498FLEET (716) _JJ 5,109 (5825)
SRB373 Q 5,236 5609FLEET
111M
DELTA 16.0M 127.0M (219 )
LRB(_ 716 700 1416
(Alone)
SRB Q 373 472 845( Alone )
NOTE: NO LEARNING HAS BEEN APPLIED ALL COSTS FY 87 DOLLARS.
Q ONE NEW MLP, HORIZONTAL PROCESS FACILITY, 1 VAB HIGH BAY ,, 389M,PLUS 1 EXTRA MLP AND MODS TO PAD 327M (GOCM DATA APPLIED TO MEETLRB / KSC CONSTRAINTS)
Q FOR SRB TO ACHIEVE 14 LAUNCHES PER YEAR REQUIRES 1 NEW MLP OREC_IVALENT, 1 VAB HIGH BAY ACCORDING TO GOCM.
Q BOOSTERS ALONE DO NOT EXPERIENCE THE ECONOMIES OF SCALE ASTHEY DO IN THE STS PROGRAM.
81108-02B/JF2/JN2
Figure 3.4.1-1. GOCM KSC STS Life Cycle Cost2-3 11/19 10:30a
3 -47

COST EST NON-(FY87 B$) FECUI_NG
1 KSC INITIALCONCEPTUAL .476ESTIMATE
NA_SINGLE FLEET
2 INITIAL ,LRBGOCM SRB
3A .337GENERALDYNAMICS
3B MARTIN _MARIETTA
KSC BOTTOMS- _)
UP ESTIMATE (_
LRBRNAL GOCMESTIMATE
SRB
FINAL LRB (_)
COST ESTIMATE (_
.324
.7O5
.826
.716
.373
FECURRI_IG
.501
NA
.488
.501
.974
SUB- TOTAL
.977
NA
.825
.825
1.70
ADJUS_(_
40%
NA
TOTAL
4O%
1.368
NA
1.155
1.155
1.70
.974
.700
.472
1.80
1.42
.845
40%
.,A ®1.80
25% @
25% @
N_A O
N_A O
1.78
1.06
.700 1.00 1.70 1.70
1.00 1.00 2.00 2.00
Q NASA FACTOR @ 40°/= (FEE @ 10%, GOVq" SUPPORT @ 5% AND CONTINGENCY @ 25%)
INCLUDES 400/° IN SOURCE DATA
@ RP-1/LOX
(_ LH2/LOX
@ INCLUDES FEE & GOV'T SUPPORT, MUST APPLY CONTINGENCY
(_) MIN VALUE
(_) MAX VALUE
81108-02F/JN
Figure 3.4.2-1. KSC LRB Life Cycle Cost Matrix.
3 - 48
2-3 11/14 5:00p

The General Dynamics KSC LCC for LRB ground processing was provided to LSOC in their final
study _laort. Little insight into the cost generation was provided. The GOCM was used in part in
their cost estimate.
3.4.2.3 Martin Marietta
The Martin Marietta Company used the initial LSOC conceptual cost estimate (dollar value) in
their total Life Cycle Cost estimate. Subsequent cost generation analysis is unknown.
3.4.2.4 NASA Plarminf
The comparisons between the GOCM ground processing projections and Shuttle Operations
Mission Planning Office Plans differ greatly. The LRB Study Planning factors and the SRB
manifest are at variance with the GOCM projected launch rate based on the existing facilities
capability, in the post 51-L environment for the SRB. This is shown in Figure 3.4.2.4-1. The
implication is that KSC has to do something different in order to achieve the planned launch rate,
or more facilities and associated personnel (and flight hardware) will be needed. Since facility
costs are very significant, in that there is the non-recurring cost of facilities and there is the large
recurring O&M costs, the overall KSC cost impact could be very large. Figure 3.4.2.4-1 indicates
roughly doubling the facilities and O&M costs may be required, more than 3 billion dollars!
The importance of the above implication is either greater cost in facility/personnel will be experi-
enced, or new planning and processing will be implemented which isn't visible to GOCM, or the
launch rate must be reduced. The last implication infers the cost per launch will grow (do less for
the same cost). Since many of the LRB trade studies performed by the prime contractors and
NASA centers are based on 128 launches over 15 years for STS, their conclusions may be in ques-
tion.
3.4.3 Role in LRBI
GOCM has generated two types of cost estimates. They are single booster fleet and mixed boost-
er fleet. The single fleet estimates were generated early in the study using the baseline version of
GOCM. All GOCM estimates were insensitive to LRB configuration. The single fleet analysis
was performed to support cost element comparisons with cost developed independently in the
LRBI, i.e. MLP costs, etc...
3 - 49

700-
600 -
500 -¢/)
400
3OO
200
100
STS-26R
----'-- PLANNED CALENDER DAYS
........ PLANNED WORK DAYS
GROUND PROCE_ CURVES
PROJECTION (WORK DAYS)
A KSC SHUI"I1.E LAUNCH
RATE COMPATIBILITY
(SHUTrLE OPERATION-MISSION PLANNING OFFICE.
(AUG 1, 1988)
KSC SHUTrLE PLANNING
ASSESSMENT REPORT FOR
STS-26 AND 27
(MAR15,1988)
250 DAYS
I I I I I I I
1 4 8 12 16 20 2425
LAUNCHES
THERE IS A LARGE VARIANCE BETWEEN THE GROUND PROCESSING CURVE pROJECTED WORKDAYS PER
FLOW AND THE PLANNED WORK DAYS PER FLOW FOR THE NEAR TERM POST 51-L LAUNCH ENVIRONMENT.
THIS INDICATES A NEED FOR INNOVATIVE PLANNING, PROCESSING AND MANAGEMENT IN ORDER TO
ACHIEVE A BETTER (LOW RATE) GROUND PROCESSING CURVE, F THE PLANNED LAUNCH RATE IS TO BEATTAINED. THESE INNOVATIONS ARE NOT CURRENTLY VISBLE TO GOCM.
IT IS BELIEVED THESE INNOVATIONS WILL NEED TO COMPRISE MORE THAN IMPROVEMENTS IN TECHNICIAN
EFFICIENCY, ADDITION OF MORE FACILITIES, AND A REDUCTION IN PROCESSING REQUIREMENTS.
(_) EXTRAPOLATED BASED ON GROUND PROCESSING FOR PLANNED STS-27.
80916-02S
Figure 3.4.2.4-1. Ground Processing Work.
3-50
2-3.4 11/14 5:00p

The mixed booster fleet cost estimates were performed late in the study after the mixed fleet
capability was incorporated into the Enhanced Modified version of CK)CM. Independent of the
concem over CER accuracy, GOCM was capable of performing a much more sophisticated cost
estimate than was accomplished elsewhere in the study. GOCM addressed:
• Transition
• Learning (Ground Processing Curve)
• Activation (Facility)
• Escalation/Discount
• Yearly cost/customer cost
• Cost categories, variable, fixed O&M
GOCM estimates throughout the study proved to be an excellent cost reference and at the end,
with lessons learned, it became a good budgetary aid for planning. GOCM has been unable to
provide an adequate level of completeness at the lower levels of resolution to conduct trade stud-
ies and, therefore, has not been employed in this manner. Lessons learned in the LRBI were not
in sufficient detail for incorporation into GOCM for trade study use.
3.4.4 Trade Studies
No trade studies with cost sensitivity were performed in the LRBI study.
3.4.5 Overview/Conclusions of GOCM Utili_ to LRBI
GOCM while limited in applicability to Phase-A trade studies, has performed some very impor-
tant functions:
• Identified Processing Sensitivities And Shortfalls
• Provided Cost Reference
• Budget (Macro) Planning
• Initial Cost Estimates
• Indentified Major Cost Drivers
GOCM is an excellent macro decision tool, for Phase A and Pre-Phase A studies. GOCM also
provides an effective framework for processing more discrete CERs which would span over to the
micro level and be useful in Phase A, and Phase B trade studies.
GOCM has identified launch rate as an area of cost risk, as it involves facility capability and the
3-51

ground processing curves. However, besides the cost (non-recurring) to build facilities, facility
O&M costs have been identified to be a KSC cost driver.
3.5 FUTURE DIRECTION
3.5.1 GOCM Recommend_ons
Expanding GOCM to provide more options expands its applicability. Changes to software em-
ployed and to hardware enables the expansion to be conducted. Establishing a full time custodial
and development organization assures future viability in cost generation.
The capability viewed below is more than the ability to respond to outside requests, RFPs, and
challenges from competing concepts. A capability as described below could evaluate major KSC
ESRs, conduct internal trade studies, and be used to plan and implement efficiencies into the KSC
operation. It could perform budgetary estimates at many indenture levels. GOCM could be used
to assess and evaluate future proposals involving KSC, and participate in NASA center cost
working groups. For the above reasons the following preliminary recommendation is offered:
• Establish a cost projection organization (CPO) to serve KSC composed of:
• CPO would include an R&M team for generation of logistics support cost elements and to
participate in operational capability assessments
• CPO would include estimators
• Technical experts in flight hardware and ground processing
• Business/computer programming experts
• Clerical, graphic,typing
3.5.1.2 Recoramen(;l¢(;! Statement Of Work For Follow-on GOCM Develooment
Purpose
Design and implement a ground processing cost and assessment system which will serve KSCs
future program planning.
Requirements
The ability to tailor a GOCM type modeling system to the application and its phase of study re-
quires the concept of modularity to be employed. Many in place GOCM features today would
just as easily handle parameters developed elsewhere from accounting techniques, engineering
3 - 52

judgement and logistics support cost models, as well as those cun'ently developed paran_trically.
Therefore, with further refinement GOCM (as a redesign it would become CK)CM H) could span
the vast needs for costing over a wide range of study phases. There would be the quick broad re-
sixakse obtained from parametrk:s to the focused, detailed accounting cost techniques, available in
various mixes for each application (see Figure 3.5.1.2-1).
• Expand GOCM to provide more option and expand its applicability
• Develop the requirements for the establishment of a full time custodial, development and
user organization, referred to hereafter as the Cost Projection Organization (CPO).
• Establish a CPO plan and budget request
• Participate or at least review all studies conducted relating to launch/ground processing activ-
ities, tO:
• Expand the CPO Database
• Perform Cost Evaluation
• Establish cost and effectiveness projection for NASA, and its customers
• Develop costing and measure of merit capability
Participate in NASA/'mdusuy working groups
• Cost
eR&M
• Technology
• Other
• Other
• Assist budget generation, review etc...
Develop a supplementary data collection system which would supply the necessary feedback
data to maintain the GOCM CERs currency and relevancy. This data system would also be
used to create and maintain CERs of greater resolution for phase A-D Studies (budgets and
trade studies). Typical SPC data elements would be:
,o By station/facility
"o Shifts, manpower, elapse time per flow
3 -53

PARAMETRIC MODEL
MODEL
TYPE
CERGREATER
VARIEDAPPLICABILITY
FAST&
EASY
SMALL & GENERAL(CONRGURA'nON
DATA)
ATrRIBUTE AND FEATURE
COSTGENERATIONTECHNIQUE
APPLICABILITYEASE AND
SPEEDOF USE
DATAREQUIREMENTS
DETAILED EST / ACCOUNTING MODEL
ACCOUNTING
SPECIALIZEDFOCUSED
&APPLICATION
LIMITED
SLOW&
LABORINTENSE
EXTENSIVE(ENG. DESIGN
DATA)
80916-02B
Figure 3.5.1.2-1. Features & Attributes of Various Cost Model Types.
3 -54
2-3 11/11 10:30a

• Associated flight/ground hardware R & M
Logistics data
• Spares
• Other Cost Elements
• Indirect SuR_on
• B(X_
• Civil Service
Study alternate computer hardware and software programs that are currently on the market,
to further enhance the utility of the GOCM. Enhancements can include standalone capabili-
ty, enlarged database memory, user friendly menus and pop-up help screens.
• Integrate an enhanced mixed fleet capability into GOCM which could evaluate combined
concurrent Shuttle II, Shuttle C, ALS and other possible vehicle operations.
• Consider expanding model to include mixed site capability to include concurrent launches
from the Eastern Test Range (KSC and CCAFS) and Western Test Range.
Consider optimization capability to include both mixed fleet and mixed site launch operations.
This option would allow the user to optimize costs of putting various types of payloads into
orbit based on space, weight or configuration constraints.
Consider combining a schedule module to GOCM that would allow automatic mission model
schedules to be produced. A trade study should be made to determine if GOCM could be
integrated with the LSOC mission model that uses Artemis software or find an alternate
program that would integrate both costs and schedules.
• Evaluate the utilization of a Database Management System incorporating Global commands.
Product_
l° MODEL/DATA SYSTEM CONFIGURATION CONTROL
• SOFTWARE
• DATABASE
• DOCUMENTATION
• USER'S MANUAL
3-55

s MODEL/DATASYSTEM ASSESSMENT REPORT
• COMPLETENESS
• ACCURACY
3. SUBJECT APPLICATION
3.5.2 Future Applications
Aside from the functions described above a GOCM type system (enhanced Modified GOCM or
GOCM 1I) has many potential program applications. Some are listed and explained below:
. Shuttle Booster Assessment for ASRM, LRB, RSRB and other. Booster replacements and
modifications are being considered due to shortfalls in reliability, and Payload capability.
Considerable interest has been shown regarding KSC impacts and the effect on schedule.
Some alternative designs are technology transfer candidate for future systems i.e. LRB
engineering for ALS.
. More Shuttle and Shuttle derivatives. With the constrained post 5 I-L launch capability,
achieving ambitious launch rates to serve the backlog, DOD launch growth, to lift space
station, future moon and mars missions, will require altemate systems, and/or derivatives
like Shuttle C and/or more Shuttles. Each option will likely involve KSC and need to
evaluate ground processing costs and the capabilities of existing and new facilities and
practices.
3. International cooperative space ventures -- KSC will likely be involved.
, Transition launch vehicles and their derivatives. New systems are likely to be more reliable
and have a large up-front cost. Economic viability of a new system is dependent on launch
rate. This would require GOClVl application to the ground processing system in order to
quantify the cost and merit of considered derivative system.
. Advanced Launch System. Office of Technology Assessment of the United States Congress
(ISC-391 July 88) states "current launch systems are neither sufficiently economical to
support SDI deployment nor reliable enough to support a dramatically increased military
space program". KSC's role would be ground processing. Launch rate development and
ground processing costs estimates would need a model like GOCM 1I.
-.. 3 -56

VOLUME !1
SECTION 4
COST ASSESSMENT
81005-01BM47

VOLUME II
SECTION 4
COSTS
The STS/LRB recurring KSC costs are not very sensitive to the LRB options, and are slightly
larger than current SRB recurring costs. The LRB n0n-recurring KSC cost range from 5-12 per-
cent of the projected LRB LCC, and are sensitive to LRB option. The principle potential non-
recurring cost driver is the potential need to build a new Pad for large diameter boosters.
The comparison of KSC booster processing costs with the STS program LCC reveal the booster to
be less than 1% of the total, indicating the KSC booster costs are insignificant. However, this is
very misleading. STS LCC is very sensitive to KSC ground processing delays and in this manner
the booster (and other flight elements) is an important cost driver.
This report demonstrates the extreme importance of achieving ground processing efficiency and to
minimizing facility requirements.
4.1 RECURRING COST ANALYSIS
It is necessary to understand the STS cost sensitivity to booster ground processing in order to
assess the overall potential LRB cost impact to the STS program. This encompasses the KSC
ground processing cost, and ground processing schedule impact which can be related to cost per-
formance.
4.1.1 Pro_am Cost Sitmifican¢¢
It is estimated (using NASA STS congressional data as collected and reported by JSC/LEMSCO)
that the KSC budget for 1983-1988 represents less than 5% of the total to date STS budget (Life
Cycle Cost) See Figure 4.1.1-1. Approximately 4% of the total KSC STS operating budget during
the period has been spent processing SRBs. This equates to .14% of the total STS life cycle cost!
From this it can be concluded, thatff the LRB recuning KSC ground processing costs me similar
in magnitude to the SRB, then the LRB KSC ground processing costs will be less than 2% of the
overall STS LCC. Therefore, the LRB is not a significant program recurring cost driver.
An approximate breakdown of KSC yearly costs is provided in Figure 4.1.1-2. From this figure it
4-1

®
LCCTO
FY8g
72 BILLIONDOLLARS
KSC 4.1%
(2.96B)
- 4% KSC STSPROCESSING COST
STS/LRB COST MODEL BRIEFING, JUNE 24, 1988 ADVANCE PROGRAM OFFICE. JSC,BLUMENTRITT/LEMSCO.
KSC COST FY83-88, AC-REQ NOV. 15, 1985. SUBJECT: "CONGRESSIONALEXCERCISE ON SHUTTLE OPERATIONS COST TREND" (2.96B).
81018-01A
Figure 4.1.1-1. Estimate of Processing Portion of KSC Cost,
and Program Life Cycle Cost.
4-2
2-4.1 12/1 8.-00a

TOTAL(SOS.S)
PROPELLANT (11.5)
"-v LAUNCH OPS (364)
R & PM FIXED (133)
.__---I_ FLIGHT HARDWARE--D_ BOOSTER
(_ (108.4M) (25M)SPC (282.7)
FAC O&M (_(20M)
.._11_ BOC (30)
--'-_" PAYLOAD (21.9)
LAUNCH SUPPORT FIXED (29.2)
@
NOTE 1: COST FY85 IN (MILLION DOLLARS)
NOTE 2: SOURCE DATA:AC-REQ/COMPTROLLER, "CONGRESSIONAL EXCERCiSE ON SHUTFLE OPERATIONS
COST TRENDS', LAUNCH OPERATIONS COST (FY85) ENCLOSURE 2, NOV. 15, 1985
Q WBS1.3 = 20M
(_) BOOSTER EST USING WBS (1985)
Q COST FY85 vs CALENDAR YEAR 85 RESPECTIVELYIS 282.7M vs 307M
81018-01B
Figure 4.1.1-2. Typical KSC Cost Breakout.
4-3
2-4.1 11/011 10.'30

can be seen again that the SRB processing costs still represents 4% of the KSC STS budget.
Included in the SRB processing costs are the indirect (amortized) facility O&M costs, utilities, and
the other SPC costs (see Figure 4.1.1-3). Absent from them is NASA and other subcontractor
costs.
4.1.2 Cost SensitiviW
An approximate STS/SRB life cycle cost estimate out to the year 2006 is presented in Figure
4.1.2-I. This estimate includes the time period of LRB deploymem. It assumes the current STS
yearly budget of approximately 5 billion dollars per year and accumulate it through out the life
cycle (2006) and arrives at a cost (FY 87 dollars) of $162 billion dollars for 212 (SRB) flights.
Similarly for the STS/LRB the LCC is projected to be $182 billion dollars. These results are uti-
lized below.
There are three potential STS cost mechanisms. The first holds the period of operational life
constant. The more flights achieved during this period, the cheaper the cost per flight and, there-
fore, the cost per payload pound. The second mechanism holds the planned number of flights
constant. The larger the launch rate, the shorter the period of operation. This lowers cost. The
implication is those years after the required number of launches has occurred; do not contribute
cost to the STS program. The third increases resources to meet launch schedule and to meet the
programs life constraint.
The first cost mechanism is not considered viable. A programs life is not held constant with
respect to calendar time. programlife is usually determined by the persistence of mission need
and/or by the life of the flight hardware. The life of a program is usually determined by the re-
quired calendar time needed to reach the end of the hardware life. Hardware life is usually ex-
pressed in number of operating hours or the designed number of launches. Currently the STS
program is defined to achieve 212 launches. Therefore the second cost mechanism is considered
to be viable.
The third cost mechanism implies launch rate to be a priority, with little regard to LCC. Facilities
and flight hardware quantities would be increased to meet launch rate, i.e. additional Pads, LC-_,
OPF and Orbiters. This cost mechanism has been ground ruled out since a launch rate priority
has not been identified.
Applying the second cost mechanism to the one-hundred-twenty-eight (128) launches tentatively
planned for the last ten (10) years of LRB operations, we can derive the delta LCC and delta
program duration (years) for various launch rates,( see Figure 4.1.2-2). This allows schedule slip-
4-4

I-zI.U3ELU
f--
.--I
u.
4-5
0°_
ell
"1o
E
ILl
r-
LL
0r-et_
13.b3u_cO
ID>-
L_
"10C
c,iI
.8.
z
o
o

#
YEAR: 1970
DURATION
COST
,T. $ (CUM)
1988 1996 2006
A 18 YEARS "_J= 8 YEARS _" 4J-..-- 10 YEARS ----_
A 72B '= -"
-32B NR \~40B REC) 72B
40B "= "" 50B _
112B 162B
ILAUNCHES
(CUM)
YEARS
PROGRAMPHASE
BOOSTER
COST
F_. $ (CUM)
STS OPERATIONS
SRB
.4 72B
LAUNCHES(cuM)
26
.,d
84 212'41_----128_1_'186 v
1991 1996 2001 2006
26I
ACTWATION TRANSl- OPERA-TION TIONS
"_LRB
15B 4-- 27.6 (1_ ,_.--33.7.._ 41.-33.7-1>
87B 112.9B
II
f
182B
I212I
NOTES:
• STS/LRB ESTIMATES NON-KSC LCC BASED ON GDSS
• KSC COSTS ARE FINAL LRB COST ESTIMATES
81018-01E
Figure 4.1.2-1. STS LCC Estimate.
4-6
2-4.1 11114 5:00p

310
27O
• TOTAL PFK:X_RAM LAUNCHES (212,_ARE CONSERVED
• ASSUME STS YEARLY BUDGETIS ~5B
• LEARNING CURVE IS NOT APPLIED
• DOES NOT CONSIDER LRBNON-RECURRING COST
230®
YEARLY LAUNCH RATE 15 12.4 10 8 5
110
70
3O1988 1993 1998 2003
(_ LAUNCH RATE IS 186
LAUNCHES / 15 YEARS - 12.4
81018-01CDY2/DY1
2008 2013 2018 2023
YEAR
Figure 4.1.2-2. Approximate STS LCC and
Program Life Sensitivity to Launch Rate. 2-4.1 11/14 5:00p
4-'/

page to be expressed in terms of dollars and years.
It is seen (Figure 4.1.2-2) that a variation in launch rate from twelve (12) to eight (8) per year
requires an additional $28 billion dollars and six (6) extra years! Therefore, the STS life cycle cost
is very sensitive to achieving the "designed to launch rate" for a fixed number of planned launches.
4.1.2. I $T$ Sensitivity To Transition
The transition period is illustrated in Figure 4.1.2.1-1. In a manner similar to that discussed above
for mechanism two (2), an LCC impact due to slippage in the launch schedule during transition
can be derived. It shows a one-year slip in the manifest could be worth about $5 billion dollars!
4.1.2.2 Launch Rate Capability
KSC's ability to generate scheduled launch rates is dependent on the degree of achieved ground
processing friendliness, planning effectiveness, management effectivity, and the degree of devia-
tion from the planned generic ground processing flow. The booster prime contractor principally
influence the booster design attributes which control ground processing fa'iendliness. It is a con-
clusion of Volume If, Section 4 that the degree of achieved ground processing friendliness will
greatly influence the achieved launch rate, thereby significantly influencing the recurring cost
portion of the STS LCC.
Figure 4.1.2.2-1 shows the time allocated to the serial ground processing flow involving the SRB in
the Shuttle Operations Mission Planning office "KSC Shuttle Planning Assessment Report for STS
26 through STS 77", March 15, 1988. It appears that all LRB candidates with proper GSE/LSE
and facilities in place can meet the allocated time in theory. Therefore, first order recurring costs
are invariant to the LRB configuration (option). But LCC is very sensitive to booster ground
processing delays and achieved ground processing times.
The long and short term recurring cost risk can be substantially reduced if vigorous studying and
planning is accomplished early, before Phase B, and if the results are incorporated as the KSC
ground processing requirements in the LRB System Specification and LRB Phase B, C, and D
statement of work (see Volume II Section 3-5).
In order to reduce long term (STS LCC) risk the LRB must achieve processing times which are
less in duration than those planned for the Post 5 I-L SRB. A smooth LRB transition will reduce
the short term cost risk.
4-8

YEAR
PLANNED LAUNCHES
LRB
SLIP
SRB
TOTAL LAUNCHES
TRANSITION
1 2 3 4 5 CUM
14 14 14 14 14 70
3 6 9 12 14 44
- 3 6 9 12 30
11 8 5 2 0 26
11 11 11 11 12 56
--J_ 14LAUNCHES
2• LRB LAUNCH RATE IS CONSTRAINT BY PROCESSING, FACILmES, AND
TRANSITION ACTIVmES (INCLUDING ACTIVATION DELAYS) AND IS BELIEVEDTO HAVE LITTLE RESILIENCY
• SRB PROGRAM MAY HAVE SOME CAPACITY TO MAKE UP SOME OF THE LRB
SHORTFALL HOWEVER, DURING TRANSITION SRB PROCESSING IS UNDER-
GOING PHASE OUT, GREATLY DEGRADING ITS RESILIENCE TO ACCOMMODATEA YEARS DELAY TO TRANSITION
• AT A 5B PER PROGRAM YEAR COST, A ONE YEAR SLIP COULD COST THEPROGRAM 5B TO MAKE UP OR THERE WOULD BE 14 IFSS LAUNCHES IN THE
LIFE CYCLE
81018-011
Figure 4.1.2.1-1. Potential Cumulative Launch RateSensitivity to One Year Slip in LRB.
4.9
2-4 11/14 5.'OOp

,_ LRBBARGEON DOCK KSC
I t _1 ! OFFLOAD I LRB STANDALONE CHECKOUT
_, LRB MOVE TO VAB
|
, Ill IETMATEANDC-OLAUNCH
I LRB FLOW'S8 DAYS I
BOOSTERCRmCALFLOW_ STS,_TEGTEST /_11--9.-_TS MOVE TO PAD "Lr15 DAYS
°
I 20 I PADOPS
LRBPROJECTED
FLOW
A SRB AFT SKIRTS AT RPSF
I 17 I AFT BOOSTER BUILD-UP
I 11 i 6 I INSPECTION / SEGMENT OFFLOAD
I
I 24t
I
I I 11|
I
BOOSTER CRITICAL FLOW35 DAYS
I LRB FLOW - 81DAYS I
----23 DAYS
I BOOSTER STACKING
II ET MATE AND C-O
I
J _ STS INTEG TEST
STS MOVE TOPAD
[ 21
LAUNCH
PAD OPS
SRBPLANNED
FLOW
NOTE: SRB RETRIEVAL, DISASSEMBLY, REFURBISHMENT AND REMANUFACTURING ARE NOT SHOWN.
• FLOW TIMES FOR EVERY STS FLIGHT ELEMENT HAVE HISTORICALLY EXPERIENCED
ENORMOUS GROWTH BETWEEN DESIGN PLANNING AND IMPLEMENTATION.
• LRB SHOWS A 20-DAY DECREASE IN FLOW DURING INITIAL STUDIES.
• ACHIEVED FLOW CANNOT EXCEED 35 DAYS.
81108-_A_Y2
Figure 4.1.2.2-1. Generic LRB/SRB Process Flow Comparison.
4- I0
2-4 11/11 10:30

4.2 NON-RECURRING COST ANALYSIS
STS LCC are sensitive to the KSC non-recurring cost for facilities, GSE, and LSE. A cursory
analysis shows the KSC LRB non-recurring cost to be greater than 1 billion dollars and less than
$3 billion dollars. This represents between 5% and 15% of LRB LCC! This variance is due to
potential facility impacts and requirements (at KSC) sensitive to the selected booster option.
4.2.1 Facility Impact and Requirement Sensitivi_ To Booster Diameter
The MLP and Pad facility cost impacts are significant and are most sensitive to booster diameter.
The two exhaust holes on the existing MLP are not sized properly for the LRB.
Changes in booster placement are a function of their diameter. The impacts range from requiring
modifications to the MLP to abandoning the MLP and building new MLPs to accommodate the
changes to the exhaust hole placement and size due to LRB skirt diameter. However, schedule
constraints originating from the transition requirements dictates building new (2) MLPs. There-
fore, the sensitivity to booster diameter is ground ruled out - LRB will require two new MLPs
costing in excess of 173 million dollars each. The estimated time to construct each MLP is five
years.
The new MLPs and LRBs with a diameter greater than 14 ft. present major technical problems to
the launch pad. The side flame deflectors, rather than serving the original purpose to channel the
flame, now becomes a flame trench extension which significantly increases weight and complexity.
The required placement of the new deflectors necessitate they be portable and be removed to
allow access for the crawler to deliver and retrieve the MLP. The new portable deflector is a
major technical and schedule risk to the program. Early estimates of the flame deflector costs are
$40 million dollars for two pads.
An altemative is to consider building a new Pad. However, current estimates for a new launch
pad are $770 million (plus contingency=$1 billion) dollars. Pad construction time may exceed the
activation period and would delay first launch and impact LCC.
The LRB diameter for all options impact the ETK)Coiter umbilicals and LSE due to inmrference
and clearance constraints, i.e. ET Hydrogen vent. The LSE will require redesign and replace-
ment, and is estimated to cost $I00 minion dollars per pad.
4-11

4.2.2 Facility_ Impacts and Requirements Sensitivity to Booster Lent, lh
Booster lengths major impact occurs at the Pad. Boosters which exceed 170 feet in length require
new LSE at the Pad. Very preliminary estimates place the cost at $20 Million dollars per pad
($40M).
4.2.3 Facility Impacts and Requirements Sensitivity. to Fuel
The LO2/RP-I propellant booster options require two sets (1 per pad) of facilities which cost
$112 Million. The LO2/LH2 option will cost $200 Million dollars.
4.3 L.RB COST PROJECTIONS
A multitude of cost estimates were performed and evaluated as part of the LRB cost projection
effort. Figure 4.3-1 illustrates the approach used.
The various costs generated are presemed in Figure 4.3-2. A brief review of each estimate is
presented below.
4.3.1. KSC Initial Conceptual Estimate
The source data for this estimate was the generated by a LSOC subcontractor, utilizing both
LSOC WBS data and NASA data. SRB processing was examined and adjusted using early LRB
proce,_ing timelines to arrive at a LRB processing cost. LSOC developed the non-recurring cost
of facilities and combined the elements for the initial KSC LCC comparison/estimate of
STS/LRB and STS/SRB.
It is believed this estimate was a good early attempt to identify cost elements and cost drivers. It
did, however not encompass some of the more subtle cost mechanisms in place at KSC which
drives the processing costs. For instance, manloading facilities to their designed level of perform-
ance. This early estimate did not recognize the limits of estimating I_C cost as a cost per flight
multiplied by the flights per year.
Other weaknesses became apparent as the study progressed. Facility modifications and cost of
new facilities grew as a better understanding of LRB processing was attained.
w
4-=-12

1.0 KSC INITIAL CONCEPTUAL ESTIMATE 2.0 INITIAL GOCM EST
FLIGHT HARDWARECONCEPT INPUT
FACILITY REQ. INPUTEVALUATION - COMPARISON - ANALYSIS
PROCESS REQUIRED
T3.0 GD/MMC EST.
ANALYSIS
COST EST.
PLANNING FACTORS
t5.0 RNAL GOCM EST.
4.0 KSC DETAIL Bo'n'OMS UP EST.
81108-02C
Figure 4.3-1. KSC Cost Generation, Evaluation and Comparison.
4 - 13
2-4 11/14 5.'OOp

COSTEST NON- ADJUSTMENT(FY87B$) RECURRING RECtJ_ SUB-TOTAL (_
1 KSCINITIALCONCEPTUAL .476 .501 .977ESTIMATE
NA
2 _INITIAL SINGLELRBFLEET NA NASRB
3A GENERALDYNAMICS .337 .488 .825
3B MARTIN .324 .501 .825MARIE'i-I'A
KSC BOI-I"OMS-UP ESTIMATE
LRBRNALGOCMESTIMATE
SRB
FINAL LRB @
COST ESTIMATE O
.705
.826
.974
.974
1.70
1.80
1.42
40%
NA
40=/o
40=/°
NA
_ NA (N
®•716 .700 25%
.373 .472 .845 25% (_
.700 1.00 1.70 NA (_
1.00 1.00 2.00 NA ®
TOTAL
1.368
NA
1.155
1.155
1.70
1.80
1.78
1.06
1.70
2.00
O NASA FACTOR @ 40"/o(FEE @ 10%, GOVq" SUPPORT @ 5% AND CONT1NC_NCY @ 25=/0)
(_ INCLUDES 40% IN SOURCE DATA
(_ RP-1/LOX
(_ LI-124.OX
Q INCLUDES FEE & GOV'T SUPPORT, MUST APPLY CONTINGENCY
(_) MIN VALUE
Q MAX VALUE
81018-01G/DY1
Figure 4.3-2. KSC LRB Life Cycle Cost Matdx.
4 - 14
2-4 11/14 5.'001)

4.3.2. baitial GOC_ Estimate
The initial GOCM estimate was very useful. It calculated costs for two scenarios. The first was an
all STS/SRB fleet, the second was an all STS/LRB fleet. GOCM (initially) could not model the
study's mixed fleet scenario. However, GOCM did employ leaming curves, Post 51-L processing,
and advance technology.
GOCM proved to be a good sounding board for the independent cost estimates (bottoms-up).
The facility cost generating capability was given high regard by the study group. The initial esti-
mates were good for comparative purposes. It showed the LRB had a substantial Life Cycle Cost
saving potential.
4.3.3 General Dynamics Estimate
The General Dynamics KSC LCC for LRB ground processing was provided to LSOC in their final
study report. Little insight into the cost generation was provided. The GOCM was used in Part B
of their cost estimate.
4.3.4 Mart_ Marietta Company Estimate
The Martin Marietta Company used the initial LSOC conceptual cost estimates dollar value in
their total life cycle cost estimate. Subsequent cost generation analysis is unknown.
4.3.5 KSC Detail Bottom-up Estimate
This cost estimate utilized the LRB study findings and products as source data. Timelines provid-
ed processing manpower and shifts. Facility requirements had estimated costs which were used in
developing the non recurring cost. The strength of this estimate is in the resolution derived and
completeness of study that was undertaken. This effort did not extrapolate costs based on the cost
per flight, but rather manloaded the facility and costed the capability.
It is felt this is a more complete and accurate cost estimate, than was previously perfonne.d, and
was used in large part to derive the fmal estimate.
4.3.6 Final QOCM Estimate
4 - 15

GOCM was modified to perform an STS - LRB and SRB mixed fleet cost estimate. It was also
calibrated and errors were corrected. GOCM was found to be 80% accurate and to have realisti-
cally covered the cost generation mechanisms in place at KSC. The final cost estimates included
new facility CERs (LRB peculiar facilities). The final GOC_ cost estimates were a major con-
tributor to the final estimates.
4.4 LRB COST ESTIMATE
4.4.1 Final LRB Cost Estimate
The "bottoms-up" cost estimate is $1.8 billion dollars. _ supports this cost estimate. LSOC
believe that the actual cost is between $1.7 to $2 billion dollars. Ira set of new (2) launch pads are
required the estimate increases to $2.7 to $3 billion dollars.
The recurring cost estimates are insensitive to booster option, but very sensitive to achieved
launch rate. In depth follow-on study and evaluation is recommended before and during OT&E
(Phase B, C and D). More sensitive study tools (cost and schedule models) may be needed in
order to perform these studies and evaluations. Their development is recommended.
4.5 COST OVERVIEW
The STS/SRB will need additional facilities according to GOCM to insure it has the capability to
support a launch rate of 14 per year. The GOCM achieves this launch rate by adding a new VAB
high bay and fourth MLP.
KSC is planning to achieve the launch rate in a different manner. They plan to perform off-line
stacking on a MLP and to acquire an additional OPF bay.
The important conclusion reached is: the STS/SRB configurations needs a large non-recurring
expenditure to achieve the planned launch rate. This applies to mixed booster fleet operations
and single STS/SRB fleet booster operations. Therefore, the delta cost shown for mixed fleet and
SRB fleet costs in Figure 4.5 can not he considered in the comparison of LRB and SRB costs at
KSC.
The utilization of LRB on the Shuttle presents an additional $716M non-recurring (besides the
SRB $373M) cost. The Figure 4.5 costs needs to be inflated by 25% to be in the same terms as
Figure 4.3-2. The final GOCM STS/LRB and STS/SRB costa are inesented in Figure 4.3-2. The
4- 16

SCENARIO NON-RECURRING RECURRING TOTALCOST COST COST
5,109MIXEDFLEET
SRBFLEET
Q(716)
5498
( 5825 )
373 @ 5,236 5609
DELTA 16.0 U 127.0 a 111 M( 219 )
LRB @ 716 700 1416(Alone)
SRB(_ 373 472 845
(AJone) v
NOTE: NO LEARNING HAS BEEN APPLIED. ALL COSTS FY 87 DOLLARS.
Q ONE NEW MLP, HORIZONTAL PROCESS FACILITY, 1VAB HIGH BAY 1 389 M,PLUS 1 EXTRA MLP AND M(:X)S TO PAD 327 M ( GOCM DATA APPLIED TO MEETLRB / KSC CONSTRAINTS)
FOR SRB TO ACHIEVE 14 LAUNCH PER YEAR REQUIRES 1 NEW MLP OREQUIVALENT, 1 VAB HIGH BAY ACCORDING TO GOCM.
BOOSTERS ALONE DO NOT EXPERIENCE THE ECONOMIES OF SCALE ASTHEY DO IN THE STS PROGRAM.
81109-02G/DY2
Figure 4.5. GOCM KSC STS Ufe Cycle Cost.2-4 11/19 10:30a
4- 17

GOCM STS/LRB cost could have been adjusted further with a pre-5 l-L error correction applied
in the post-5 I-L environment (20% discovered during calibration) which would bring the total Life
Cycle Cost estimates to $2B. However, this adjustment was not applied.
Accuracy is not believed to be an issue with these estimates. However, the degree of complete-
ness is a concern. The final estimate is between the "bottoms-up" estimate and the GOCM esti-
mate. It was rounded up to an upper value of $2 billion doUars. It is believed this buffer might
account for cost element oversights.
Incorporating the Final LRB KSC cost estimate and the General Dynamics (removed KSC cost)
estimate into the projected LCC in Figure 4.1.2-2, we arrive at a new STS/LRB LCC: $182B.
Therefore, the previously performed sensitivity analysis (Figure 4.1.2-2 and 4.1.2.1-1) could be
updated and would be expected to show an approximate 12% greater sensitivity.
4.5.1 Recurring Costs in Comparative Terms
Comparing SRB vs. LRB recurring cost in equivalent terms is difficult for two masons. First, the
distribution of assumed cost varies from one booster program to another. For instance, MSFC
assumes the solid booster cost which encompasses fuel. The LRB will be fueled at KSC. KSC
assumes these costs. Second, SRB processing has undergone an unquantified change since pre-5 I-
L to present (post-5 l-L). Therefore, comparing the predicted LRB costs with pre-51-L actual
SRB costs is incorrect.
Adjusting the "bottoms-up" LRB estimate for SRB comparison (fuel, spares, transition) the $.97B
dollar recurring cost decreases to $.58B.
Adjusting SRB 1985 actual recurring costs for future equivalent performance with the LRB (1.4
greater processing time assumed, O&M for an additional 185M of SRB facilities to achieve 14
launches/year, and adding one civil service/non SPC person for every four SPC person) a $.74B
recurring cost is arrived at.
Adjusting the GOCM SRB recurring cost with a correction factor based on the measured accuracy
for 1985, an SRB recurring cost of $.5913 is arrived at. Again there is unceRainty associated with
the post-51-L environment.
In as near equivalent terms as possible the LRB and SRB recurring processing costs for 15 years
of operation are:
4- 18

LRB $.59B- $.70B
SRB $.59B- $.74B
It is noted the above costs are not the KSC recurring cost (which are higher). It is also noted that
there is uncertainty associated with post-51-L SRB costs. GOCM cost for the STS/SRB vs.
STS/LRB shows the STS/LRB recurring cost is $127M more affordable.
4.5.2 KSC Delta Booster Costs Mixed Booster Fleet vs. SRB Booster Fleet
If KSC were to maintain (only) STS/SRB operations it would experience its current recurring
costs and an additional new facility recurring and non-recurring cost.
Implementing the LRB at KSC encompasses the above costs plus the LRB peculiar costs and the
transition peculiar costs. The delta between these two scenarios is approximately:
Mixed Booster Fleet SRB
716M NR Mixed Booster Fleet
373M NR SRB Booster Fleet 373M
1.100B
-0.127 Rec.
0.970B .373B
Delta STS/SRB, STS/LRB KSC LCC is: ~ .6B (LRB more expensive).
4.5.3 Final KSC LRB Cost Conclusion
In summary the following cost conclusions have been reached:
I.
2.
3.
4.
.
Upper bound for LRB LCC at KSC is 2B dollars (NR~IB, R-1B)
KSC recurring costs are insensitive to LRB option
KSC non-reCtLrring costs are sensitive to LRB option
STS overall LCC is sensitive to achieved launch rate, which translates to flight element
processing friendliness, i.e. LRB
There are potential cost escalators, i.e. Pad, $1B
4- 19

REPORT DOCUMENTATION PAGE
_ditie/#Nl_ d 411*J m,_mt4m._j Ih4r d_te ¢)¢o,l_d+ _.d cu_vtin_ tt,_ 0Bv*#_nQ I_ _il'( I_n .| ml_).ndllO/_ L.urld _;omme.lt Ee*),,idm._ Ll.b buld._h c)l.h*Lu L_! ,=rJy Gihwl =L.TL._I_t =O| th*5
(l_lll.li(_lt GI inlol'mdt_, lft_lu_¢ll_l Iw}Ug'llio(ll I_ di_l_l_,ltlg I.It,l_, I_uld_/I. 10 Wdlhl_lOli Ne'_,l_lUdt lilt 'NI¢_I(II. l_ll_¢l_4llr lul I/_lolm44*_n I_l_lt .I+_Wt =llld 14_llbL.hf I) IjlrlQ_'ll_
1. A_ENCY USE ONLY (L_'_Vv bl_/_k) ......... .
Llqu'Id Rocket Booster
Integret ton Study
F].nai Report. Phip_? ]_
Gordon E. Artley, Lockheed Study Manoger
LoPe Scott, Lc_ckheed Deputy Study Manager
W.J, Dickinson, NASA Study Manager__ L __ 'L-- U U| _ i _lll l i
7. PEIi_O_(MING ORGANIZATION N_AMI_(5) AND AOUfl|_({S) qLockheed Space Operations Company
. Advanced Projects Office _ L._O- (_O_1100 Lockheed Way, Titusvllle, FL 32780
]_RtP0R¥-OATf ..... 3,-REPORT TYPE AND I,)ATI_$ COVEREDNovember 1988 F_naJ Report, Phase I
NAS 10-11475
J.... i t;'r-" ,"'+ [ ..... • : '
..... _1. . _ J II I ±
' II_-PEP.FORMINGO_GANIZATIPN-m _+Rf_POt(T NUMIIII_R I:'
LS0-000-286-1410 '_
tO. SPO'NSO&iNG / MONITORING ': 1!!;*',
+
9.--SPO_$O'P,iN6 / MON'ITORi40-_,13_Nc,rNAM[(S)^N'_ kOO6|,s;([ $)" " _*'......... ''NASA / Kennedy Sl_ce Center
Advanced Projects Technology and Commercialization Office
Future Launch Systems
Kennedy Space Center, FI 32899
i I+ l.l ..... , _ J, i.l II ................... I,__I _t _,L III
11, SUPPLEMENTARY NOTES
This study supplemented the Liquid Rocket Booster Studies performed by Martin Marietta and General Dynamics
tot NASA/MSFC under Senate contracts. Follo_-on activities in Phase II (1989) and Phase III (1990) _ere
performed and separate quarterly reviews _ere provided as documentation to Kennedy Space Center.I .I IJ 1 I J
12,i" blSTIUoUTiON i AVAILAItlI.ITY STA'TEMENT _ I 'i'21)'.''Dt$+HIBIJTION CODe
Document is available for public distribution.
(Unclassltied - Unlimited)
Y
, , , , • i I . + _ I I I I .L III l l+l l I
il.-AISTI_CT (Md_imum _OOwO¢_) '- ' • +_..... ".... " .............
The Impacts of Introducing Liquid Rocket Boosters (L_) Into the STS/KSC Launch envtronNnt are Identified
and evaluated. Proposed ground systems configurations are presented along with a launch site requirements
summary. Pre-launch processing scenarios are described and the required facility _dtftcations and ne,
facility requirements are analyzed. Flight vehicle design recom_edattons to enhance launch processing
are discussed. Processing approaches to integrate LR_ _Ith existing STS launch operations are evaluated.
The key features and significance of laurlCh site transition to a new STS configuration In paralZel with
on-going launch activities sre enumberoted.
The LRB Integration Study Final Report is presented in Five volumes as follo_s:
VOL I Executive Summary
VOL II " " Study Summary
VOL Ili Study Products
VOL IV Reviews and Presentations
VOL V Appendices
I II I
'i4.' SUBJECT TERMS Liquid Rocket Boosters for STS
Launch Site Operations
Launch Site Facility Requirements
17. SECURITy CLASSIFICATION 18_+ SECURITY CLASSIFICATIONOf K[POKT OF Tiffs PAG[
Unclassified Unclassified
NSN 7_4U.uI 2uU _uU
............ NuM= i,AO=S3500
1+. SECUIilTY CLASSIFICATION 30. LIMITATION OF ABSTRAC1_'OF AUSTRACT
, i I i,|m
",L,r_d-,rd I'_+rn 291} (fluv 2+Q9)Pi|"i_llJNt**l,l U_ i_N4#i _IIU //*+ll 1
J'.*U IU_
FF427 REV 0CT86