Embed Size (px)
Citation preview

EN
LR8431-20MEMORY HiLOGGER
Instruction Manual
Aug. 2015 Revised edition 3 LR8431B980-03 15-08H


Contents
i
1
2
ContentsIntroduction ..............................................................................1Confirming Package Contents ................................................2Safety Information....................................................................3Operating Precautions.............................................................6
Chapter 1Overview ____________________________________13
1.1 Product Overview and Features .............................131.2 Measurement Flow ..................................................141.3 Names and Functions of Parts ...............................161.4 Screen Configurations ............................................181.5 Basic Operation .......................................................21 Screen Operations ...........................................................21 Starting and Stopping Recording .....................................22 Disabling Key Operations (Key-Lock Function) ...............23 Saving Data ......................................................................23 Verifying the Input Level (Level Monitor) ..........................24
Chapter 2Measurement Preparations_________________25
2.1 Using the Battery Pack (Option) ............................26 Install the Battery Pack ....................................................29 Charge the Battery Pack ..................................................29
2.2 Connecting the AC Adapter ....................................302.3 Connecting Measurement Cables to the Memory
HiLogger ...................................................................31 Connecting Measurement Leads or Thermocouples
(for voltage or temperature, respectively) ........................32 Connecting the Optional Model 9641 Connection Cable
(for Pulse Signal Input) .....................................................332.4 Turning the Power On and Off ...............................342.5 Zero Adjustment ......................................................35
LR8431B980-03

Contents
ii
Chapter 3Setting before Measurement_______________ 37
3.1 Pre-Operation Inspection ....................................... 373.2 Operating Flow Overview ....................................... 383.3 Setting Configuration 1 – Recording Settings ..... 42 Specify the Recording Interval ......................................... 42 Setting the Display Time Base (horizontal axis
magnification,set as needed) ........................................... 43 Selecting the Recording Start/stop Method ..................... 44 Set the Recording Length for Repeated or One-time
Recording ......................................................................... 45 Enable Digital Filtering (noise suppression) (as needed) 45 Automatic Saving ............................................................. 46 Replacing Removable Storage During Real-Time Saving 48
3.4 Setting Configuration 2 – Input Channel Settings 49 Voltage Measurement Settings ........................................ 50 Temperature Measurement Settings ............................... 51 Integration (Count) Measurement Settings ...................... 53 Revolution Measurement Settings ................................... 54
3.5 Display Settings ...................................................... 56 Selecting Waveform Display Color .................................. 56 Specifying Vertical Display Range by Magnification and
Zero Position (vertical axis expansion/compression) ....... 56 Specifying the Vertical Display Range by Upper and
Lower Limits (expansion/compression) ............................ 57 Converting Units (Scaling function) .................................. 58
3.6 Entering Comments ................................................ 603.7 Viewing All Channel Settings in a List .................. 62 Batch Copying Channel Settings ..................................... 63 Batch Setting Waveform Display/Hide and Waveform
Color Settings for All Channels ........................................ 63 Initializing Settings (to factory defaults) ........................... 64 Aligning Zero Positions on the Grid ................................. 64 Display Celsius (°C) temperature values as
Fahrenheit (°F) ................................................................. 65

Contents
iii
4
5
3
6
Chapter 4Specifying Criteria for Measurements (Triggering, Alarm and Timer) ______________67
4.1 Setting Criteria to Start and Stop Recording ........68 Setting the Input Signal Trigger Threshold (Level Trigger) 69 Setting Lower and Upper Trigger Thresholds
(Window Trigger) ..............................................................70 Selecting Trigger Sources and Combinations ..................71 Setting Criteria for Pre-Trigger Recording (Pre-Trig) .......72
4.2 Alarm Output ............................................................734.3 Confirming Trigger and Alarm Criteria Settings
(List) ..........................................................................754.4 Starting and Stopping Recording by Timer ..........764.5 About Recording Operation ...................................78
Chapter 5Waveform Analysis__________________________81
5.1 Viewing Waveforms .................................................82 Scrolling Waveforms ........................................................82 Verifying Waveform Display Position ...............................82 Magnifying and Compressing Horizontally .......................83 Viewing Any Waveform Location (Jump Function) ..........83
5.2 Selecting Display Options ......................................84 Displaying Gauges ...........................................................84 Displaying Cursor Values .................................................84 Specifying a Waveform Time Span ..................................86 Viewing Input Signals as Numerical Values .....................87
5.3 Inserting Event Marks (Search Function) ..............88 Inserting Event Marks While Viewing Waveforms ............88 Inserting Event Marks Using External Input Signals ........89 Searching Event Marks ....................................................90
Chapter 6Saving & Loading Data _____________________91
6.1 About Saving and Loading Data ............................916.2 Using a CF Card/USB flash drive ...........................93 CF Card Insertion & Removal ..........................................94

Contents
iv
USB flash drive Insertion & Removal ............................... 94 Formatting a CF Card/USB flash drive ............................ 95
6.3 Saving Data ............................................................. 96 Automatic Saving ............................................................. 97 Selecting the Manual Saving Method
[Quick Save]/[Select & Save] ........................................... 98 Saving Waveform Data (with the SAVE Key) .................. 99 Capturing a Screen Image (With the SAVE Key) ........... 100 Saving Numerical Calculation Results
(With the SAVE Key) ...................................................... 101 Saving Setting Configurations ........................................ 102
6.4 Loading Data on the Memory HiLogger .............. 103 Loading a Setting Configuration ..................................... 103 Loading Waveform Data and Screen Images ................ 104
6.5 Data Management ................................................. 105 Switching removable storage ......................................... 105 Viewing Folder Contents and the Parent Folder ............ 106 Deleting Data ................................................................. 106 Renaming Files and Folders .......................................... 107 Copying Data ................................................................. 108 Sorting Files ................................................................... 109
6.6 Transferring Data to a Computer (USB Drive Mode) ................................................. 110
Select the USB Drive Mode ........................................... 110 Connecting the USB Cable ............................................ 111
Chapter 7Numerical Calculations ___________________113
7.1 Calculation Methods ............................................. 113 Auto Calculation ............................................................. 114 Manual Calculation ........................................................ 115 Apply Calculations to a Specific Time Span
(Manual Calculation Only) .............................................. 1167.2 Numerical Value Calculation Expressions ......... 117

Contents
v
7
8
9
10
11
AppendixInde
6
Chapter 8System Environment Settings ____________ 119
8.1 Screen and Key Operation Settings ....................120 Using the Auto-Resume Function
(Resume After Power Restoration) ................................120 Adjust Backlight Brightness ............................................120 Enabling and Disabling the Backlight Saver ..................121 Selecting Black or White Screen Background ................121 Enabling or Disabling the Beeper ...................................121 Selecting the Horizontal (Time) Axis Display .................122 Selecting the Display Language .....................................122
8.2 CSV File Saving Settings ......................................123 CSV File Data Decimal and Separator Characters ........123
8.3 Making System Settings .......................................124 Setting the Date and Time .............................................124 Initializing the Memory HiLogger (System Reset) ..........125 Switching the USB mode ...............................................126 Self-Test .........................................................................127
Chapter 9External Control __________________________ 129
9.1 Connecting to the External Control Terminals ...1299.2 External Trigger Input ...........................................1319.3 External Signal Output (Trigger Output) .............1329.4 Alarm Signal Output (Alarm Output) ...................1349.5 Synchronous Measurements with Multiple
Instruments ............................................................135
Chapter 10Specifications_____________________________ 137
Chapter 11Maintenance and Service_________________ 147
11.1 Troubleshooting ....................................................14711.2 Cleaning .................................................................14911.3 Disposing of the Instrument .................................150
x

Contents
vi
Appendix____________________________________ A1Appendix 1 Error Messages and Remedial Actions .........A1Appendix 2 File Naming ......................................................A7Appendix 3 Text File (CSV) Internal Format ......................A8Appendix 4 Binary File Size Calculation............................A9Appendix 5 List of Default Settings..................................A10Appendix 6 Maximum Recordable Time ..........................A11Appendix 7 Reference .......................................................A12Appendix 8 Concerning Noise Countermeasures ..........A13Appendix 9 Using the Application Program ....................A19
Installing Logger Utility ....................................................A20 Installing the USB Driver .................................................A23 Connecting the Memory HiLogger to the Computer with
a USB Cable ...................................................................A26 Starting and Ending Logger Utility ..................................A29 Uninstalling the Logger Utility .........................................A29
Appendix 10Frequently Asked Questions .......................A30 Installation and Settings ..................................................A30 Triggering ........................................................................A32 Measuring .......................................................................A33 Data Saving ....................................................................A34 Logger Utility ...................................................................A38
Appendix 11Pulse Input Circuit Diagram.........................A39
Index___________________________________Index 1

Introduction
1
Thank you for purchasing the HIOKI "Model LR8431-20 Memory HiLogger." To obtain maximum performance from the instrument, please read this manual carefully, and keep it handy for future reference.
Registered trademarks• Windows is a registered trademark of Microsoft Corporation in
the United States and/or other countries.• CompactFlash is a registered trademark of Sandisk Corporation
(USA).
Introduction

Confirming Package Contents
2
About options:Contact your dealer or Hioki representative for details.
Confirming Package Contents
When you receive the instrument, inspect it carefully to ensure that no damage occurred during shipping. In particular, check the accessories, panel switches, and connectors. If damage is evident, or if it fails to operate according to the specifications, contact your dealer or Hioki representative.
Confirm that these contents are provided.
Model LR8431-20 ......................... 1Memory HiLogger
Model Z1005 AC Adapter............ 1with supplied power cord
(p. 30)
Measurement Guide .................... 1
USB Cable .................................... 1
CD ................................................. 1• Instruction Manual (PDF)
(This document)• Logger Utility Instruction Manual (PDF)• Logger Utility (Data acquisition
application program)
(p. A26)
The latest version can bedownloaded from our web site.
Model 9780 Battery Pack Model Z1005 AC Adapter Model 9641 Connection Cable (for pulse inputs) Model 9782 Carrying Case Model 9812 Soft Case
Model 9727 PC Card (256MB) Model 9728 PC Card (512MB) Model 9729 PC Card (1GB) Model 9830 PC Card (2GB) Model 9809 Protection Sheet

Safety Information
3
This manual contains information and warnings essential for safe operation of the instrument and for maintaining it in safe operating condition. Before using it, be sure to carefully read the following safety precautions.
The following symbols in this manual indicate the relative importance of cautions and warnings.
Safety Information
This instrument is designed to comply with IEC 61010 Safety Standards, and has been thoroughly tested for safety prior to shipment. However, mishandling during use could result in injury or death, as well as damage to the instrument. However, using the instrument in a way not described in this manual may negate the provided safety features.Be certain that you understand the instructions and precau-tions in the manual before use. We disclaim any responsibil-ity for accidents or injuries not resulting directly from instrument defects.
Safety Symbols
In the manual, the symbol indicates particularly important information that the user should read before using the instrument.
The symbol printed on the instrument indicates that the user should refer to a corresponding topic in the manual (marked with the symbol) before using the relevant function.
Indicates DC (Direct Current).
Indicates AC (Alternating Current).
Indicates the ON side of the power switch.
Indicates the OFF side of the power switch.
Indicates that incorrect operation presents an extreme hazard that could result in serious injury or death to the user.
Indicates that incorrect operation presents a significant hazard that could result in serious injury or death to the user.
Indicates that incorrect operation presents a possibility of injury to the user or damage to the instrument.
Indicates advisory items related to performance or correct operation of the instrument.

Safety Information
4
AccuracyWe define measurement tolerances in terms of f.s. (full scale), rdg. (reading) and dgt. (digit) values, with the following meanings:f.s. (maximum display value or scale length)The maximum displayable value or scale length. This is usually the name of the cur-rently selected range.Example: For the 1 V range, f.s. = 1 Vrdg. (reading or displayed value)The value currently being measured and indicated on the measuring instrument.dgt. (resolution)The smallest displayable unit on a digital measuring instrument, i.e., the input value that causes the digital display to show a "1" as the least-significant digit.
Symbols for Various Standards
This symbol indicates that the product conforms to regulations set out by the EC Directive.
This is a recycle mark established under the Resource Recycling Promotion Law (only for Japan).
WEEE marking:This symbol indicates that the electrical and electronic appliance is put on the EU market after August 13, 2005, and producers of the Member States are required to display it on the appliance under Article 11.2 of Directive 2002/96/EC (WEEE).
Ni-MH
Other Symbols
Indicates the prohibited action.
(p. #) Indicates the location of reference information.
Indicates that descriptive information is provided below.
[ ] The names of setting objects and buttons on the screen are indicated by square brackets [ ].
SET(Bold characters)
Bold characters within the text indicate operating key labels.
Unless otherwise specified, "Windows" represents Windows 2000, Windows XP, Win-dows Vista, Windows 7 or Windows 8.
Click: Press and quickly release the left button of the mouse.Double click: Quickly click the left button of the mouse twice.

Safety Information
5
Measurement categoriesTo ensure safe operation of measurement instruments, IEC 61010 establishes safety stan-dards for various electrical environments, categorized as CAT II to CAT IV, and called mea-surement categories.
Using a measurement instrument in an environment designated with a higher-numbered cat-egory than that for which the instrument is rated could result in a severe accident, and must be carefully avoided.Use of a measurement instrument that is not CAT-rated in CAT II to CAT IV measurement applications could result in a severe accident, and must be carefully avoided.
Difference between "Measurement" and "Recording" The measurement and recording processes are distinguished as follows for the purposes of these instructions.
Measured data (data acquired in internal memory) is erased whenever a new measurement starts. To retain data, always record (save) it.
CAT IIPrimary electrical circuits in equipment connected to an AC electrical outlet by a power cord (portable tools, household appliances, etc.)CAT II covers directly measuring electrical outlet receptacles.
CAT IIIPrimary electrical circuits of heavy equipment (fixed installations) connected directly to the distribution panel, and feeders from the distribution panel to outlets.
CAT IV The circuit from the service drop to the service entrance, and to the power meter and primary overcurrent protection device (distribution panel).
Measurement: The acquisition of input values into internal HiLogger memory or to a PC via communications.
Recording: Storing measurement data on a CF card, USB flash drive or on a PC via data communication.

Operating Precautions
6
Follow these precautions to ensure safe operation and to obtain the full benefits of the various functions.
• Before using the instrument for the first time, verify that it operates normally to ensure that no damage occurred during storage or shipping. If you find any dam-age, contact your dealer or Hioki representative.
• Before using the instrument, make sure that the insulation on the cables is undam-aged and that no bare conductors are improperly exposed. Using the instrument in such conditions could cause an electric shock, so contact your dealer or Hioki rep-resentative for replacements.
• Operating temperature and humidity: 0 to 40°C at 80% RH or less (non-conden-sating)
• Temperature and humidity range for guaranteed accuracy: 23±5°C, 80%RH or less
Operating Precautions
Before Use
Instrument Installation
Avoid the following locations that could cause an accident or damage to the instrument.
Exposed to direct sunlightExposed to high tempera-ture
In the presence of corrosive or explosive gases
Exposed to water, oil, other chemicals, or solventsExposed to high humidity or condensation
Exposed to strong electro-magnetic fieldsNear electromagnetic radia-tors
Exposed to high levels of particulate dust Near induction heating sys-
tems(e.g., high-frequency induc-tion heating systems and IH cooking utensils)Subject to vibration
The maximum operating (ambient) temperature for the LR8431-20 is 40°C. Do not attempt to use in higher temperature environ-ments.

Operating Precautions
7
Installation Precautions• If the instrument is used in any state other than the following, the
measurement accuracy may not satisfy the device specifications.
• Leave sufficient space around the ventilation holes and install the instrument with the holes unobstructed.
• Avoid temperature changes around the terminal block. Especially avoid directed airflow such as from an electric fan or air conditioner vent.Thermocouple inputs are prone to measurement errors.
• When the HiLogger is moved to a location with significantly dif-ferent ambient temperature, allow at least 30 minutes for thermal equalization before measuring.
• Correct measurement may be impossible in the presence of strong magnetic fields, such as near transformers and high-cur-rent conductors, or in the presence of strong electromagnetic fields such as near radio transmitters.
• If liquid enters the enclosure through an air vent or other opening, it may damage the instrument's internal circuitry. Exercise caution con-cerning the surrounding environment when installing the instrument.
Horizontal placement Upright placement
Handling the Instrument
• Do not allow the instrument to get wet, and do not take mea-surements with wet hands. This may cause an electric shock.
• Do not attempt to modify, disassemble or repair the instru-ment; as fire, electric shock and injury could result.
To avoid damage to the instrument, protect it from physical shock when transporting and handling. Be especially careful to avoid physical shock from dropping.
This instrument may cause interference if used in residential areas. Such use must be avoided unless the user takes special measures to reduce electromagnetic emissions to prevent interfer-ence to the reception of radio and television broadcasts.

Operating Precautions
8
Handling the Cords and Cables
• Avoid stepping on or pinching cables, which could damage the cable insulation.
• To avoid breaking the cables and probes, do not bend or pull them.• To avoid damaging the power cord, grasp the plug, not the cord,
when unplugging it from the power outlet.
Before Turning Power On
Using the Battery Pack• For battery operation, use only the HIOKI Model 9780 Battery
Pack. We do not take any responsibility for accidents or damage related to the use of any other batteries.
See: 2.1, "Using the Battery Pack (Option)" (p. 26)
Using the AC Adapter• Use only the supplied Model Z1005 AC Adapter. AC adapter
input voltage range is 100 to 240 VAC (with ±10% stability) at 50/60 Hz. To avoid electrical hazards and damage to the instrument, do not apply voltage outside of this range.
• Turn the instrument off before connecting the AC adapter to the instrument and to AC power.
• To avoid electrical accidents and to maintain the safety spec-ifications of this instrument, connect the power cord pro-vided only to a 3-contact (two-conductor + ground) outlet.
• Use only the designated power cord with this instrument. Use of other power cords may cause fire.
• Before turning the instrument on, make sure the supply volt-age matches that indicated on its power connector. Connec-tion to an improper supply voltage may damage the instrument and present an electrical hazard.
When the power is turned off, do not apply voltage or current to the connectors. Doing so may damage the instrument.
• After use, always turn OFF the power.• Brief power interruptions of 40 ms or less will not cause this
instrument to malfunction. However, Longer interruptions may cause the Memory HiLogger to shut itself off, so consider local power conditions before installing, as appropriate.
• To ensure that recording is not interrupted by power outages, you can use the Z1005 AC Adapter and 9780 Battery Pack together.

Operating Precautions
9
About Inputs and Measurement
• The maximum input voltage (and the maximum rated volt-age to earth) for the analog input terminals is 30 Vrms (or 60 V DC). If these limits are exceeded, the instrument may be damaged and personal injury or death could occur, so do not attempt measurement.
• Do not leave the Memory HiLogger connected to test objects in environments where a voltage surge might exceed the dielectric withstand voltage. Doing so could result in damage to the Memory HiLogger, bodily injury or fatal accident.
• Channels are insulated by semiconductor relays. When a voltage beyond the specification is applied between the channels, the semiconductor relay may short circuit. Please ensure that a voltage beyond specification, especially a surge such as a lightning, is never applied. When an abnor-mal measurement value is observed, please contact your dealer or Hioki representative for inspection.
The waveform for an open channel may sometimes appear to be influenced by the signals of the other channels being measured. If you do not like this, please set the waveform display of the open channel to OFF or short-circuit the input terminals of the open channel by connecting the positive and negative terminal.

Operating Precautions
10
CD Handling
• Always hold the disc by the edges, so as not to make fingerprints on the disc or scratch the printing.
• Never touch the recorded side of the disc. Do not place the disc directly on anything hard.
• Do not wet the disc with volatile alcohol or water, as there is a possibility of the label printing disappearing.
• To write on the disc label surface, use a spirit-based felt pen. Do not use a ball-point pen or hard-tipped pen, because there is a danger of scratching the surface and corrupting the data. Do not use adhesive labels.
• Do not expose the disc directly to the sun's rays, or keep it in conditions of high temperature or humidity, as there is a danger of warping, with consequent loss of data.
• To remove dirt, dust, or fingerprints from the disc, wipe with a dry cloth, or use a CD cleaner. Always wipe from the inside to the outside, and do no wipe with circular movements. Never use abrasives or solvent cleaners.
• Hioki shall not be held liable for any problems with a computer system that arises from the use of this CD, or for any problem related to the purchase of a Hioki product.

Operating Precautions
11
Using a CF Card/USB flash drive
• Inserting a CF card/USB flash drive upside down, backwards or in the wrong direction may damage the CF card, USB flash drive, or HiLogger.
• Never eject a CF card /USB flash drive while measuring or when the HiLogger is or accessing the card. Data on the CF card/USB flash drive may be destroyed. (The CF icon/USB flash drive icon at the lower right is red while the card is being accessed.)
• Do not transport the HiLogger while a USB flash drive is connected. Damage could result.
• As the CF card/USB flash drive is sensitive to static electricity, damage to the CF card/USB flash drive or wrong operations by the HiLogger may occur due to static electricity. Please be careful when handling it.
• With some USB flash drives, the HiLogger may not start up if power is turned on while the USB flash drive is inserted. In such a case, turn power on first, and then insert the USB flash drive. It is recommended to try out operation with a USB flash drive before starting to use it for actual measurements.
• The Flash memory in a CF card/USB flash drive has a limited operat-ing life. After long-term usage, data storage and retrieval become diffi-cult. In this case, replace the CF card/USB flash drive with a new one.
• We cannot provide compensation for data loss in a CF card/USB flash drive, regardless of content or cause of the damage. Data is also cleared from memory if a long time passes after measuring. Always maintain a backup of important data stored on a CF card/USB flash drive.
• Although real-time saving to USB flash drive is supported, a CF card is recommended for data preservation. Performance cannot be guaranteed when using storage media other than a Hioki-specified CF card option.
• Use a USB flash drive whose continuous current consumption does not exceed 300 mA (peak 500 mA). (The peak value is displayed as "Max Power" under the USB flash drive self-test on the [System] screen.)
• Depending on how USB is used, the USB connector and instrument set-tings may vary as shown in the chart below.
• The three USB methods of use described in the chart below involve exclusive settings and cannot be used simultaneously.
USB method of use Connector used
[System] screen USB mode setting
Use a USB flash drive. Type A USB Memory (Default)
Communicate with the LR8431-20 and initiate measurement using the Logger Utility software from a com-puter (using a USB cable).
Type B USB Communication
Read files on a CF card that is con-nected to the LR8431-20 from a computer (using a USB cable).
Type B USB Drive

Operating Precautions
12

1.1 Product Overview and Features
13
3
1
Chapter 1 O
verview
The Hioki LR8431-20 Memory HiLogger is a compact, lightweight, easy-to-operate waveform recorder. It can run on batteries, and can be quickly deployed when a power anomaly occurs.Measurement data can be monitored, subjected to calculations and analyzed on a personal computer using the supplied application program.
Overview Chapter 1
1.1 Product Overview and Features
Record anomaliesAbnormal events can be ana-lyzed by recording with the trigger function (p. 67)Use the alarm function to out-put signals when anomalies occur (p. 73).
Measurement data and setting configurations are stored, read and managed as data filesMeasurement data can be stored to and read from a CF card or USB flash drive (p. 91).
Waveform analysis
mV A
Cursor Measurements (p. 84)A B Using the A/B cursors, values at cursor lo-
cations on waveforms and the time at trig-ger positions can be displayed.
Performs six calculation types, including maximum and average values.
Numerical Calculations (p. 113)
123.4V
Acquire pulse signalsMeasure integrated pulses or revolutions from sensors and pulse output devices such as watt-hour meters.
Gauge display (p. 84)Zoom in/out (p. 83)
Numerical display (p. 87)
Analysis on a PCMonitor and analyze measurement data with the supplied application program (p. A19).Event search
(p. 88)
T
1 2
Display in converted unitsUsing the scaling function, input val-ues can be displayed in units of the actual physical quantity being mea-sured, such as current or flow vol-ume (p. 58).
Observe voltage fluctua-tions and temperature changesJust connect measurement leads or thermocouples to mea-sure as needed.

1.2 Measurement Flow
14
1.2 Measurement Flow
Installing, Connecting and Turning On
To save data, insert a CF card or USB flash drive. (p. 94)
AC adapterconnection (p. 30)
Install the Battery Pack (option) (p. 26)
Connect to the Model LR8431-20 (p. 25), and Set Up (p. 7)
Turn the Power On (p. 34)
Measurement cables connections (p. 31)
12
SettingsConfigure Recording Settings (p. 38)
Using a previously saved setting configuration
Reload a previously stored setting con-figuration from Model LR8431-20 memory or a CF card or USB flash drive, and measure (p. 103)
Set the data acquisition (recording) inter-val, and recording length (time span).Select the type of measurement data to save when automatically saving to a CF card or USB flash drive. Remaining data stored in the instrument can be saved when finished measuring.
Move to a setting item
Open thesetting options
Select Apply
1
2

1.2 Measurement Flow
15
3
1
Chapter 1 O
verview
Configure Input Channels (p. 38)
Select input channels, and set input types and measurement ranges.Make other settings as desired.
Move to a setting item
Open thesetting options
Select Apply
Starting and Stopping MeasurementPress the START/STOP Key (p. 22)
Record once, and stop.[Repeat]: Off Stop
Measurement
StartMeasurement
When recording using the trigger function, recording occurs only when the input waveform satisfies specified trigger criteria.
Record repeatedly. [Repeat]: On
(default setting)
Data AnalysisView Measurement Data (p. 81)Waveforms can be zoomed and numerical values confirmed.
Save Data (p. 91)Measurement data, waveform data, screen images and numerical calculationresults can be saved.
Calculate (p. 113)Numerical measurement data can be applied to calculations.
View on a Computer (p. A19)Analyze recorded data using the supplied application program.
When FinishedTurn the Memory HiLogger Off (p. 34)

1.3 Names and Functions of Parts
16
1.3 Names and Functions of PartsFront Panel
Operating Keys
Rear Panel
Battery Compartment (p. 26)The optional Model 9780 Battery Pack isinstalled here.
Manufacturer's Serial No.Shows the serial number.Do not remove this label, as it is required for product support.
Display Screen (p. 81)4.3-inch TFT color LCDScreen Configurations (p. 18)
WAVE/DATASelects among waveform screen displays (p. 18). SETDisplays the Settings screens, and switches among the screen tabs with each press (p. 20). FILEDisplays file information(p. 19).
CH/Select channels. ESCCancels changes to settings. Cursor KeysMoves the position of the cursor (blinking selection) on the screen. ENTERAccepts displayed settings. KEY LOCKDisables keypad op-erations. Press and hold the left and right cursor keys simultaneously for three seconds to lock and un-lock the keys. (Zero Adjust)Performs zero adjust-ment. Press the up and down keys simul-taneously to execute (p. 35).Press to save data manu-
ally (p. 96).
Press the center key to select waveform scrolling or A/B cursor movement, then press the left and right cursor keys to scroll or move (p. 21).
Setup and display
Saving operations
Scroll waveforms and read cursor values
Choose a screen
Start and stop measure-ment. The LED at the left lights green while mea-suring (p. 22).
Start and stopmeasurement
Operating Keys

1.3 Names and Functions of Parts
17
3
1
Chapter 1 O
verview
Top Panel
AC Adapter SocketConnect the supplied Model Z1005 AC Adapter (p. 30).
CF Card SlotInsert an optional CF card. (p. 93)
Analog Input TerminalsConnect measurement leads for voltage mea-surement, and thermocouples for temperature (p. 31).
CHARGE LEDThis LED lights when the battery is charging (p. 29).
Pulse Input ConnectorConnect an optional 9641 cable (p. 33).
External Control TerminalsControl signals can be received from andoutput to external devices (p. 129).
Right Side
POWER SwitchTurns the instrument on and off (p. 34)
Power Off
Power On
USB Port(USB 2.0 mini-B receptacle)• Using the included Logger Utility applica-
tion software, you can monitor measure-ment data on the computer and transfer settings to the instrument. (p. A26) (To use, set the USB mode on the [System] screen to [USB Communication].)
• You can transfer data on the instrument’s CF card to a computer. (p. 110) (To use, set the USB mode on the [System] screen to [USB Drive].)USB flash drive Slot
(Type A USB 2.0 receptacle)Used to save data to a USB flash drive. (p. 94) (To use, set the USB mode on the [System] screen to [USB Memory].)
The [USB Memory], [USB Communication], and [USB Drive] USB mode settings are exclusive and cannot be used simultaneously.

1.4 Screen Configurations
18
1.4 Screen Configurations
Selects between seven display types.
The screen switches each time you press the key.
Operational infor-mation is displayed along the bottom of the screen.
[Wave] ScreenMeasurement data is displayed as waveforms (p. 81).
[Value+Cmnt] ScreenMeasurement data is displayed as numerical values with com-ments (p. 87).
[Wave+Calc] ScreenMeasurement data is displayed as waveforms with calculation results (p. 115).
[Gauge+Wave] ScreenMeasurement data is displayed as waveforms with gauges (p. 84).
[Wave+Value] ScreenMeasurement data is displayed as waveforms and numerical values (p. 87).
[Value] ScreenMeasurement data is displayed as numerical values (p. 87).
[Wave+Crsr] ScreenMeasurement data is displayed as waveforms with cursor val-ues (p. 84).
Waveform/Numerical Screens
Selection is also available from the name of the current screen displayed near the bottom right
[Gauge+Wave]
[Wave]
[Wave+Value]
[Value+Cmnt]
[Value]
[Wave+Calc]
[Wave+Crsr]

1.4 Screen Configurations
19
3
1
Chapter 1 O
verview
Waveform/Numerical Screens (About the Icons)
Clock"Setting the Date and Time" (p. 124)
Power source indicatorIndicates the Memory HiLogger's power source.
AC adapter operationBattery pack operation (Fully charged battery pack)Battery pack operationBattery pack operation (Low battery indicator)
CF cardDisplayed when a CF card is inserted.The icon appears red when accessing the card.
USB source indicatorIndicates the USB status.
Operating in USB Memory mode.Operating in USB Communication mode.
File Screen
View and manage files on the CF card or USB flash drive (p. 91).
File Screen
Operational infor-mation is displayed along the bottom of the screen.

1.4 Screen Configurations
20
[CH] ScreenMake input channel settings while viewing the monitor dis-play (p. 49).
[Scaling] ScreenMake these settings to convert measured values to arbitrary units for display (p. 58).
[Comment] ScreenEnter channel comments(p. 60)
[Setting] Screen
[Range] ScreenMake settings while viewing all channel settings (p. 62).
[Trig & Alm] ScreenRecording criteria (triggering) and warning sounds can be set for each channel (p. 67).
[System] ScreenConfigure the system environ-ment (p. 119).
Settings Screens
Press the left/right cursor keys to se-lect between the Settings screens.
Selects between seven display types.
The screen switch-es each time you press the key.
Operational infor-mation is displayed along the bottom of the screen.
Make settings for recording (p. 42). Set numerical calculation, auto-saving and timers.

1.5 Basic Operation
21
3
1
Chapter 1 O
verview
1.5 Basic Operation
Screen Operations
Select the item to change.
Show availablesetting options.
Select the desired setting.
Changing screen contents
Setting Screen
Waveform Screen
Apply the newsetting,or cancel it.
Scrolling a waveform
Earlier Later
See: "Scrolling Waveforms" (p. 82)
Reading values at cursors
1Display the A/B cursors.
2Move the A/B cursors.Values at cursor positions can be read numerically.
You can select the cursor display type and which cur-sor(s) to move (p. 84).

1.5 Basic Operation
22
Acquire measurement data on the Memory HiLogger, and start recording.When recording stops depends on data recording settings (repeat recording, triggering, timers, etc.). (p. 78)
When you want measurement data to be automatically saved, before starting recording, check that auto-save is enabled (p. 46), that a CF card or USB flash drive is correctly inserted (p. 94), and that sufficient storage capacity is available (p. A11).
Starting and Stopping Recording
Press the START/STOP key.The green LED lights.When using the trigger function, the times when measurement starts and when recording (data acquisition) starts are not the same.
A confirmation message appears when you press the START/STOP key to start recording. Save important data to a CF card or USB flash drive before starting, because previous measure-ment data will be overwritten when recording starts.
Start Measurement
When [Repeat] (record multiple instances of the specified recording length) or [Cont] (record continuously) is enabled:Pressing the START/STOP key stops recording.
When [Repeat] and [Cont] are disabled (Off):Recording stops after the specified recording length. Pressing the START/STOP key during recording displays a confirmation message. Select [Yes] to stop recording.
For details about repeating and continuous recording:See: "Selecting the Recording Start/stop Method" (p. 44)
"Set the Recording Length for Repeated or One-time Record-ing" (p. 45)
Finish Measurement

1.5 Basic Operation
23
3
1
Chapter 1 O
verview
Keys can be disabled to avoid inadvertent operations.
Measurement data, settings, screen images and numerical calculation results can be saved.For details of the saving methods, see Chapter 6, "Saving & Loading Data" (p. 91).
(Default settings)Saving Method: [Select & Save] (Press the SAVE key to select and save data.)
Disabling Key Operations (Key-Lock Function)
Saving Data
Press and hold the right and left cursor keys for three seconds to lock the other keys, and repeat to unlock.
Insert a CF card or USB flash drive.
Press the SAVE key.A dialog appears.
Select the save destination and item to save, and press ENTER key. Select [Yes] in the confirma-tion dialog, and press ENTER again to save the data to the CF card or USB flash drive.
• When using a USB flash drive, set the USB mode on the [Sys-tem] screen to [USB Memory]. USB flash drives cannot be used while the USB mode setting is [USB Communication] or [USB Drive].
• The [USB Memory], [USB Communication], and [USB Drive] USB mode settings are exclusive and cannot be used simulta-neously.

1.5 Basic Operation
24
You can verify the input status and display range while making settings on the Setting screen. This is not available while measuring.
Verifying the Input Level (Level Monitor)
Current Input Signal Level and Channel Number
Level Monitor
Display Channel and GaugeShows the gauge for the current-ly selected channel. The gauge display is linked to the measure-ment and display range settings. Press the CH / keys to dis-play the gauge for another chan-nel.
Changing the Monitor DisplaySelect whether to display all channels, or only se-lected channels. [All Ch]/[SlctCh]/[Value]
• [All Ch]The channels displayed in the level monitor are those with a check mark ( ) displayed next to the channel number in the settings.
• [SlctCh] (Selected Channels)The level monitor displays the channel selected on this screen.
• [Value]The input values of all channels are displayed numerically.
Displayable Waveform RangeThis is determined by the waveform display rangesetting.
Input Waveform AmplitudeIndicates real-time input ampli-tude.Using the Scaling function(p. 58), measurement units can be converted as desired for display.

25
3
2
Chapter 2 M
easurement Preparations
Measurement Preparations Chapter 2
Rear View
Install the 9780 Battery Pack(option) (p. 26)
1
3
(To save data)Insert a CF card or USB flash drive (p. 93)
4
2 Connect measurement cables (p. 31)
Pulse signals: Connect the Hioki 9641connection cable
Voltage measurement: Connect the measurement leads.Temperature measurement: Connect thermocouples.
External control signal inputs External control signaloutputs (p. 129)
Turn the power on (p. 34)Execute zero adjustment (p. 35)
5
Connect the AC adapter (p. 30)

2.1 Using the Battery Pack (Option)
26
If commercial power is not available when the AC adapter is connected, the LR8431-20 Memory HiLogger can operate from the Model 9780 battery pack, so when using commercial power, the battery pack serves as a backup supply during power outages. Charge the battery pack fully before using it the first time.
2.1 Using the Battery Pack (Option)
Be sure to observe the following precautions. Incorrect han-dling may result in liquid leaks, heat generation, ignition, bursting and other hazards.• Do not use a battery pack other than the 9780 Battery Pack.
We cannot accept responsibility for accidents or damage related to the use of any other batteries.
• To avoid the possibility of explosion, do not short circuit, disassemble or incinerate battery pack.
• When storing the instrument, make sure no objects that could short-circuit the connectors are placed near them.
• The battery pack contains lye, which can cause blindness if comes into contact with the eyes. Should battery liquid get into your eyes, do not rub your eyes but rinse them in plenty of water and seek the immediate attention of a physician.
Installing and replacing the battery pack• To avoid electric shock, turn off the power switch and dis-
connect the cables before replacing the battery pack. • After installing or replacing the battery pack, replace the
battery compartment cover and screw.• Handle and dispose of batteries in accordance with local
regulations.

2.1 Using the Battery Pack (Option)
27
3
2
Chapter 2 M
easurement Preparations
Observe the following to avoid damage to the instrument.• Use the battery pack in an ambient temperature range of 0 to
40°C and charge it in an ambient temperature range of 5 to 30°C to be on the safe side.
• If the battery packs fails to complete charging within the stipu-lated time, disconnect the AC adapter from the pack to stop charging.
• Consult your dealer or nearest service station should liquid leaks, strange odor, heat, discoloration, deformation and other abnormal conditions occur during use, charging or storage. Should these conditions occur during use or charging, turn off and disconnect the instrument immediately.
• Do not expose the instrument to water and do not use it in exces-sively humid locations or locations exposed to rain.
• Do not expose the instrument to strong impacts and do not throw it around.
• The battery pack is subject to self-discharge. Be sure to charge the battery pack before initial use.
• When recharging a discharged battery pack in the LR8431-20, allow it to charge for at least ten minutes with the LR8431-20 turned off to maximize battery longevity.
• The battery pack is a consumable. If the battery capacity remains very low after correct recharging, the useful battery life is at an end. It can be recharged up to about 500 times.
• To prevent battery pack deterioration when the battery will not be used for 1 month or longer, remove it and store it in a dry location with an ambient temperature range of between -10 to 30°C. Be sure to discharge and charge it every two months. Long-term storage when capacity has decreased will make charging impos-sible and reduce performance.
• Remove the battery pack from instrument once a month and check that appearance is normal.
• As long as battery charge remains, waveform data is retained in internal memory while the Memory HiLogger is turned off, so the battery continues to gradually discharge. When the battery charge is depleted, stored waveform data is lost.

2.1 Using the Battery Pack (Option)
28
When to charge
When powering the instrument from the battery pack without the Model Z1005 AC Adapter, the low battery indicator ( ) is displayed when the battery charge is depleted, indicating that the battery pack requires charging. Note that if the Memory HiLogger is turned off under this situation, waveform data may fail to be backed up, and could be lost.
Approximate charging time:About 200 minutes at 23°C when recharged at the first appearance of the low battery indicator.
Approximate continuous battery-only operating time(When saving data to a CF card at a temperature of 23°C)* When using a USB flash drive, the continuous operating time may decrease
depending on the particular USB flash drive in use.• After a full charge, with the LCD backlight always on (default setting):
approximately 2.5 hours• After a full charge, with the LCD backlight off (five minutes after last key-
press): approximately 3 hoursSee: "Enabling and Disabling the Backlight Saver" (p. 121)

2.1 Using the Battery Pack (Option)
29
3
2
Chapter 2 M
easurement Preparations
Regardless of whether the Memory HiLogger is on or off, the battery pack recharges whenever the Z1005 AC Adapter is plugged in to a power source. Therefore, charging is provided by merely keeping the battery installed in the Memory HiLogger.
Install the Battery Pack
Charge the Battery Pack
Required tool:One Phillips screwdriver (No.2)
ImportantDisconnect the AC adapter when installing the battery pack.
Battery CompartmentCover
1 Place the Memory HiLogger face down, and remove the battery com-partment cover screw and cover.
2 Connect the plugs of the battery pack to the connectors and insert the battery pack with the label side up.
Replace the bat-tery compartment cover and screw.
3
Pull the battery pack plug straight out to remove the battery pack.
Make sure that thecables are not pinched.
2
Be sure to properly seat the connectors.
1
Connect the power cord to the inlet socket on the AC adapter.
1
2Connect the output plug of the AC adapter to the instrument.
Plug the power cord into the mains outlet.
3
Refer to 2.2, "Connecting the AC Adapter" (p. 30) for details about the AC adapter.
The CHARGE LED lights red when charging begins.Charging is finished when the CHARGE LED turns off.

2.2 Connecting the AC Adapter
30
Connect the power cord and the instrument to the supplied Model Z1005 AC Adapter, then plug the power cord into an outlet. When used with the battery pack installed, the battery serves as an operating backup supply in case of power failure, and the AC adapter otherwise has priority.
Before Connecting
2.2 Connecting the AC Adapter
• Use only the supplied Model Z1005 AC Adapter. AC adapter input voltage range is 100 to 240 VAC (with ±10% stability) at 50/60 Hz. To avoid electrical hazards and damage to the instrument, do not apply voltage outside of this range.
• Turn the instrument off before connecting the AC adapter to the instrument and to AC power.
• To avoid electrical accidents and to maintain the safety specifications of this instrument, connect the power cord only to a 3-contact (two-conductor + ground) outlet.
To avoid damaging the power cord, grasp the plug, not the cord, when unplugging it from the power outlet.
Connect the power cord to the inlet socket on the AC adapter. Rated supply voltage is 100 to
240 VAC, and rated supply fre-quency is 50 or 60 Hz.
1
2 Connect the output plug of the AC adapter to the instrument.
Plug the power cord into the mains outlet.
3

2.3 Connecting Measurement Cables to the Memory HiLogger
31
3
2
Chapter 2 M
easurement Preparations
Connect the appropriate cables for the intended recording application.• When recording voltage fluctuations or temperature changes (p. 32) • When recording pulse signals (p. 33) Be sure to read the "Operating Precautions" (p. 6) before connecting the cables.Connecting to the Analog Input Terminals
2.3 Connecting Measurement Cables to the Memory HiLogger
• The maximum input voltage (and the maximum rated volt-age to earth) for the analog input terminals is 30 Vrms (or 60 V DC). If the voltage is exceeded, this device will be dam-aged and personal injury will result. Therefore, do not per-form measurement in this case.
• Do not leave the Memory HiLogger connected to test objects in environments where a voltage surge might exceed the dielectric withstand voltage. Doing so could result in damage to the Memory HiLogger, bodily injury or fatal accident.
• Do not connect a cable to the instrument while it is con-nected to the object to be measured. Otherwise, an electric shock accident may occur.
• To avoid short-circuit accidents, make certain that connec-tions are secure.
• Channels are insulated by semiconductor relays. When a voltage beyond the specification is applied between the channels, the semiconductor relay may short circuit. Please ensure that a voltage beyond specification, espe-cially a surge such as a lightning, is never applied. When an abnormal measurement value is observed, please contact your dealer or Hioki representative for inspection.
• Measurements may be affected by noise or other electromag-netic ingress if input leads are longer than about three meters.
• Route measurement leads and cables as far away as possible from power and earth lines.
• Measurement values may be scattered if the leads are routed in parallel with other devices. If they must be parallel, check opera-tion before taking measurements.
• Avoid temperature changes around the terminal block. Especially avoid directed airflow such as from an electric fan or air-conditioner vent.
• If connecting crimped terminals to the analog input terminals, use insulated terminals for M3 screws with the size shown below.
6 mm max.
6 mm max.

2.3 Connecting Measurement Cables to the Memory HiLogger
32
Connect the voltage and temperature measurement (thermocouple) leads to the analog input terminals.
Connecting Measurement Leads or Thermocouples (for voltage or temperature, respectively)
Using the screwdriver, loosen the terminal block screws, insert the bare ends of the leads, and tighten the screws.
Connect to themeasurement object.
Analog Input Terminals
12
When applying 4 - 20 mA input current
Connect a 250 shunt resistor as shown.
Tools required: Phillips screwdriver (for M3 screws)
(For details on instrumentation control equipment measure-ments, see p. 50 .)

2.3 Connecting Measurement Cables to the Memory HiLogger
33
3
2
Chapter 2 M
easurement Preparations
Connecting to the Pulse Input Connector
Connect the optional 9461 connection cable to the pulse input connector.
To avoid electric shock and short circuit accidents or damage to the instrument, pay attention to the following:• The ground terminal for the
optional 9641 Connection Cable is not isolated from the Memory HiLogger's ground (chassis ground). Therefore, if the measure-ment object connects to AC, it should have a grounded, polarized plug, and be con-nected to the same power outlet as the Memory HiLogger’s AC adapter. If the Memory HiLogger and measurement object are con-nected to different mains circuits, or if an ungrounded power cord is used, the potential difference between the dif-ferent grounding paths may result in current flow through a connection cable that could damage the measurement object or Memory HiLogger.
• The input voltage range limits are 0 to +10 V. If these limits are exceeded, the instrument could be damaged and per-sonal injury or death could occur, so do not attempt mea-surement.
Measurement Object
MemoryHiLoggerConnection
Cable
For safety, we recommend using only Hioki’s connection cable (measurement lead cable).
P1 White (H)P1 Red (L)
P2 Yellow (H)P2 Black (L)
P3 Green (H)P3 Blue (L)
P4 Gray (H)P4 Brown (L)
Ends of the 9641 Connection Cable
(connects to Memory HiLogger common ground)
Shield
Connecting the Optional Model 9641 Connection Cable(for Pulse Signal Input)
Connect the other end of the cable to the pulse source(s) to be mea-sured.
Pulse Input Connector
1
2
2.4 Turning the Power On and Off
34
2.4 Turning the Power On and Off
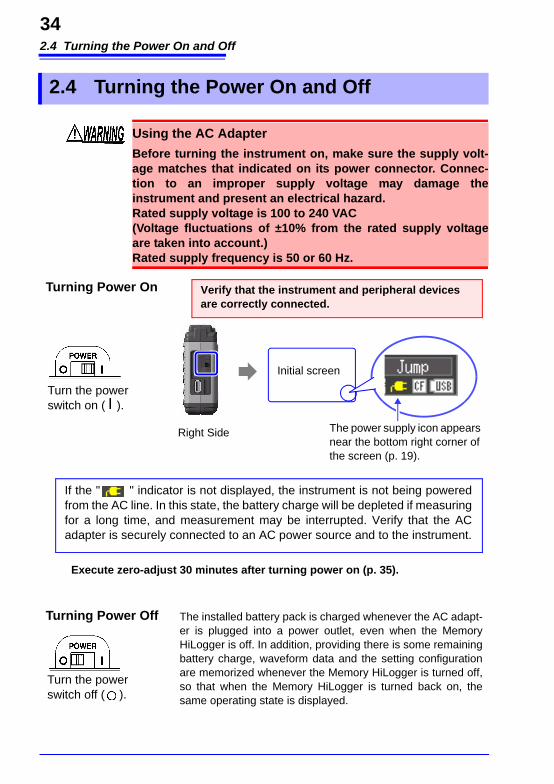
Using the AC AdapterBefore turning the instrument on, make sure the supply volt-age matches that indicated on its power connector. Connec-tion to an improper supply voltage may damage the instrument and present an electrical hazard.Rated supply voltage is 100 to 240 VAC(Voltage fluctuations of ±10% from the rated supply voltage are taken into account.)Rated supply frequency is 50 or 60 Hz.
Right Side
Turn the powerswitch on ( ).
If the " " indicator is not displayed, the instrument is not being powered from the AC line. In this state, the battery charge will be depleted if measuring for a long time, and measurement may be interrupted. Verify that the AC adapter is securely connected to an AC power source and to the instrument.
Turning Power On
Turn the powerswitch off ( ).
The installed battery pack is charged whenever the AC adapt-er is plugged into a power outlet, even when the Memory HiLogger is off. In addition, providing there is some remaining battery charge, waveform data and the setting configuration are memorized whenever the Memory HiLogger is turned off, so that when the Memory HiLogger is turned back on, the same operating state is displayed.
Verify that the instrument and peripheral devices are correctly connected.
Turning Power Off
Execute zero-adjust 30 minutes after turning power on (p. 35).
Initial screen
The power supply icon appears near the bottom right corner of the screen (p. 19).

2.5 Zero Adjustment
35
3
2
Chapter 2 M
easurement Preparations
Zero adjustment corrects for voltage offset at the input terminals, so that Mem-ory HiLogger measurements are relative to zero volts.Perform the zero adjustment procedure when using the instrument in a loca-tion where the ambient temperature is markedly different.
2.5 Zero Adjustment
Any zero-adjust setting is cleared upon system reset (p. 125).
Turn on the power and wait for 30 minutes to stabilize the internaltemperature of the Memory HiLogger.
With the Waveform or [CH] screen displayed, press and hold these keys simultaneously for one second.
The Zero Adjust dialog appears.
From the Setting screen
Select [Zero Adjust].
Apply
1
2
Zero adjustment is executed.
(simulta-neously)

2.5 Zero Adjustment
36

3.1 Pre-Operation Inspection
37
3
3
Chapter 3 Setting before M
easurement
Setting before Measurement Chapter 3
3.1 Pre-Operation Inspection
Is the insulation of the measure-ment cable to be used damaged, or is bare metal exposed?
1
2
Peripheral Device Inspection
Before using the instrument the first time, verify that it operates normally to ensure that the no damage occurred during storage or shipping. If you find any damage, contact your dealer or Hioki representative.
MetalExposed
No Metal Exposed
Do not use if damage is present as you could re-ceive an electric shock. Replace the damaged items.
To
If damage is evident, request repairs.
YesIs damage to the instrumentevident?
Instrument Inspection
When turning power on
Does the HIOKI logo appearon the screen?
No
2
The power cord may be damaged, or the instru-ment may be damaged internally.Request repairs.
Is the Waveform or Setting screen displayed? (When power is turned on the first time after purchase, the Set-ting screen should appear.)
No
Yes
The instrument may be damaged internally.Request repairs.
Nothing appears, orthe display is abnormalYes
Inspection complete
3.2 Operating Flow Overview
38
3.2 Operating Flow Overview
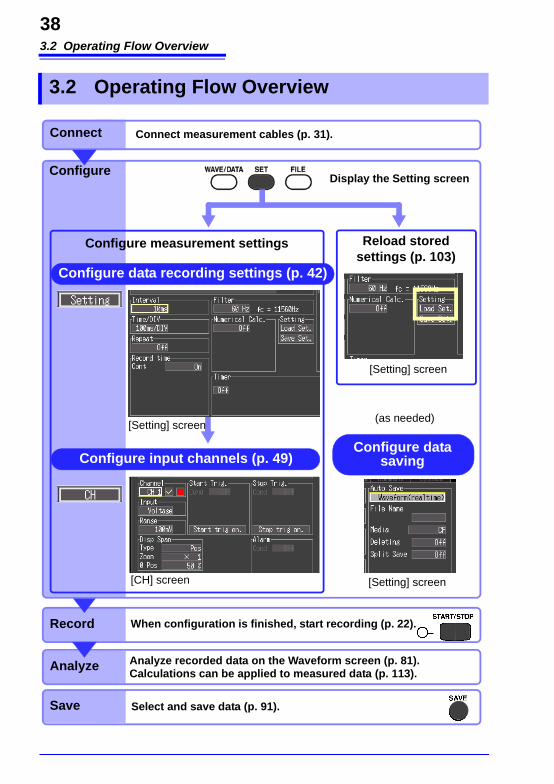
Record
Display the Setting screen
Configure measurement settings
Connect
Configure
Connect measurement cables (p. 31).
Configure input channels (p. 49)
Analyze Analyze recorded data on the Waveform screen (p. 81).Calculations can be applied to measured data (p. 113).
Save Select and save data (p. 91).
When configuration is finished, start recording (p. 22).
Reload storedsettings (p. 103)
[Setting] screen
[Setting] screen
[CH] screen
Configure datasaving
[Setting] screen
(as needed)
Configure data recording settings (p. 42)

3.2 Operating Flow Overview
39
3
3
Chapter 3 Setting before M
easurement
Before measuring, configure the measurement settings on the [Setting] and [CH] screens. A brief operational description of the currently selected (high-lighted) setting item appears at the bottom of the screen.
Three recording methods are available. Timed recording, which record between specified start and stop times, can be used in combination with these methods (p. 76).
Measurement Configuration (Setting Screen)
Recording Method Description
Normal Recording Records for the specified recording length beginning when measurement starts (Cont: Off).
Continuous Recording Records continuously beginning when measurement starts (Cont: On).
Repeat Recording Records repeatedly for the specified recording length (time span) (Repeat: On).
. Must be set before measuring.
Make other settings as needed. Save automatically
while measuring(p. 46)
Reloading Settings(p. 103)
Saving Settings(p. 102)
Enter a title for mea-surements (p. 60)
Filter out noise(p. 45)
Perform numerical calculations (p. 113)
Record by timer(p. 76)
Configure recording settings: [Setting] screen
Data recording (acquisition) interval (p. 42)* Display time base (time per horizontal division) (p. 43) Recording start/stop method (p. 44)* Recording length (time span) for repeated or one-time re-
cording (p. 45)*
Horizontal Axis (Time Axis) Settings

3.2 Operating Flow Overview
40
Make other settings as needed. Entering channel comments (p. 60) Selecting channel display colors (p. 56) Setting the display range
Specifying the display position (p. 56)Specifying upper and lower display limits (p. 57)
Recording specific events (triggering) (p. 68) Setting alarm output (alarm function) (p. 73) Setting Unit Conversion (Scaling) (p. 58) Switching the monitor display (p. 24)
Configure input channel settings: [CH] screen
Voltage measurement (p. 50) Temperature measurement
(p. 51) Integration (pulse count) (p. 53) Revolution measurement
(p. 54)
Input Channel Settings

3.2 Operating Flow Overview
41
3
3
Chapter 3 Setting before M
easurement
Certain setting items are available on the Waveform screen. Setting details are the same as for those on the Setting screen.
Measurement Configuration (Waveform Screen)
Specify the recording interval (data acquisition interval) (p. 42)
Specify the display time base (time per hori-zontal division) (p. 43)
Enable digital filtering (noise suppression)(p. 45)
Waveform Screen
Horizontal Axis Settings
Voltage measurement (p. 50) Temperature measurement (p. 51) Integration (pulse count) (p. 53) Revolution measurement (p. 54) Alarm settings (p. 73)
Setting the display rangeSpecifying the display position (p. 56)Specifying upper and lower display limits(p. 57)
Select the alarm display type (p. 84) Eject (replace the CF card/USB flash drive
during real-time save operation)(p. 48) Displaying any point in time (Jump function)
(p. 83)
Waveform Display Settings
Input Channel Settings
About Channel SettingsPressing the CH / keys selects channel setting and gauge display items. However, while measurement data is displayed, such changes affect only those channels selected (by a check mark [ ]).

3.3 Setting Configuration 1 – Recording Settings
42
Configure the horizontal axis and recording settings on the [Setting] screen.To save data while measuring, auto save must be enabled beforehand (p. 46).
Select the data acquisition interval to suit your measurement objectives. Note that shorter recording intervals restrict the maximum recording time.
3.3 Setting Configuration 1 – Recording Settings
Move to a setting item.
Apply
Open the setting options for the item to be set.
Select from the listed options.
1
2Select the [Setting] screen.
Specify the Recording Interval
Select from the [Interval] setting options.Setting options:10ms, 20ms, 50ms, 100ms, 200ms, 500ms, 1s, 2s, 5s, 10s, 20s, 30s, 1min, 2min, 5min, 10min, 20min, 30min, 1h ( default setting)
Some waveform peaks may not be displayable with certain interval settings.For example, when the [Interval] is 1 s and the [Time/DIV] (time base) is 5 s.
5s/div
1s
PeakBroken wire detection is automatically disabled when the interval is set to 10, 20 or 50 ms (p. 51).

3.3 Setting Configuration 1 – Recording Settings
43
3
3
Chapter 3 Setting before M
easurement
Displayed waveforms can be expanded or compressed along the horizontal axis. Shorter setting values corre-spond to greater magnification. This setting can be changed both during and after measurement without affecting acquired data (p. 83).
Available display time base settings depend on the selected recording interval.Horizontal axis display options are affected when the recording interval is changed after measuring, because the options for expanding (or compressing) the displayed axis depend on the recording interval used when measuring.
Setting the Display Time Base (horizontal axis magnification, set as needed)
1 div
: Selectable, ×: Not selectable, : Not selectable while measuring
Hori-zontal axis
Recording interval[ms] [s] [min] [h]
10 20 50 100 200 500 1 2 5 10 20 30 1 2 5 10 20 30 1100ms × × × × × × × × × × × × × × × ×200ms × × × × × × × × × × × × × × ×500ms × × × × × × × × × × × × × × ×1s × × × × × × × × × × × × ×2s × × × × × × × × × × × ×5s × × × × × × × × × × × ×10s × × × × × × × × × ×20s × × × × × × × × ×30s × × × × × × × × ×1min × × × × × × ×2min × × × × × ×5min × × × × × ×10min × × × ×20min × × ×30min × × ×1h ×2h 5h 10h 12h 1day
Select from the [Time/DIV] setting options.Setting options:100ms, 200ms, 500ms, 1s, 2s, 5s, 10s, 20s, 30s, 1min, 2min, 5min, 10min, 20min, 30min, 1h, 2h, 5h, 10h, 12h, 1day [/DIV] ( default setting)
When auto save is enabled for waveforms, 100, 200 and 500 ms settings are automatically changed to 1 s when measurement starts, and the shorter values cannot be se-lected while measuring.

3.3 Setting Configuration 1 – Recording Settings
44
Specify how you want recording to start and stop. The following methods are available.• Record continuously: Record continuously between starting and stop-ping measurement.• Specified length (time span): Record only for a specified time span (can be set to automatically repeat) (p. 45)
Selecting the Recording Start/stop Method
Continuous Recording
Repeat Re-cording (speci-fied lengths)
StartMeasurement
StopMeasurement
To record continuously,Enable continuous recording (set [Cont] to [On]). (default setting)
Recording continues until you press the START/STOPkey, or until a “stop trigger” event occurs. When auto save is enabled for measurement data, the saving method depends on whether [Deleting] or [Split Save] (segmented save) is selected (p. 46).
To record for a specified length (time span),1 Set [Cont] to [Off].
2 Specify the duration of one recording length (time span).Setting options:d (days) 0 to 499, h (hours) 0 to 23, min (minutes) 0 to 59, s (seconds) 0 to 59
1
2
Recording proceeds for the specified length. Record-ing stops early if you press the START/STOP key be-fore the recording length has elapsed, or if a “stop trigger” event occurs.
Change 1’s digit
Change 10’s digit
Maximum recording length and data samplesIndicates the maximum record-ing time to internal memory, and the maximum number of data samples. These values are limit-ed by the specified recording length and the number of mea-surement channels used.See: Appendix 6, "Maximum
Recordable Time" (p. A11)
3.3 Setting Configuration 1 – Recording Settings
45
3
3
Chapter 3 Setting before M
easurement
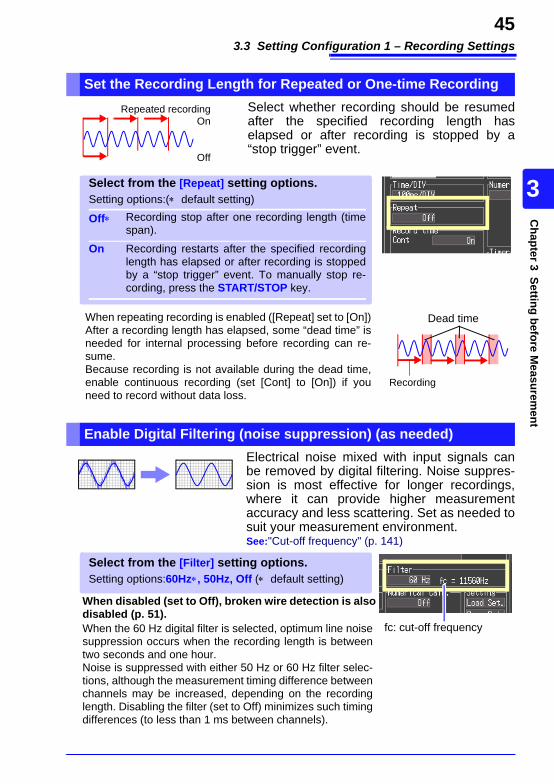
Select whether recording should be resumed after the specified recording length has elapsed or after recording is stopped by a “stop trigger” event.
Electrical noise mixed with input signals can be removed by digital filtering. Noise suppres-sion is most effective for longer recordings, where it can provide higher measurement accuracy and less scattering. Set as needed to suit your measurement environment.See:"Cut-off frequency" (p. 141)
Set the Recording Length for Repeated or One-time RecordingRepeated recording
On
Off
Select from the [Repeat] setting options.Setting options:( default setting)
Off Recording stop after one recording length (time span).
On Recording restarts after the specified recording length has elapsed or after recording is stopped by a “stop trigger” event. To manually stop re-cording, press the START/STOP key.
Dead timeWhen repeating recording is enabled ([Repeat] set to [On])After a recording length has elapsed, some “dead time” is needed for internal processing before recording can re-sume.Because recording is not available during the dead time, enable continuous recording (set [Cont] to [On]) if you need to record without data loss.
Recording
Enable Digital Filtering (noise suppression) (as needed)
Select from the [Filter] setting options.Setting options:60Hz, 50Hz, Off ( default setting)
fc: cut-off frequencyWhen the 60 Hz digital filter is selected, optimum line noise suppression occurs when the recording length is between two seconds and one hour.Noise is suppressed with either 50 Hz or 60 Hz filter selec-tions, although the measurement timing difference between channels may be increased, depending on the recording length. Disabling the filter (set to Off) minimizes such timing differences (to less than 1 ms between channels).
When disabled (set to Off), broken wire detection is also disabled (p. 51).

3.3 Setting Configuration 1 – Recording Settings
46
Measurement data can be automatically saved to a CF card or USB flash drive while measuring.The available types and formats of automatically saved data are as follows.
*1.Numerical calculation settings must be made before starting recording (p. 113).*2.The [CSV (real time)] and [CSV + Calc] settings are not available when the record
interval is 10ms or 20ms. Also, when opening a CSV file in a spreadsheet program, note that the number of rows that can be loaded at one time is limited (p. A7).
Automatic Saving
SavedContent Setting File
Extension Description
Waveform data only
Waveform(realtime) .MEM Waveform data is saved to the CF card while re-
cording.
CSV(realtime)*2 .CSV
Waveform data is saved in CSV text format while recording. Saved data cannot be reloaded in the HiLogger.
Calcula-tion results only *1
Calc(post meas.) .CSV
After recording, calculation results are saved to the CF card.When [Repeat] is enabled ([On]), calculation re-sults for each recording are included in the record-ed data file.
Waveform data and calcula-tion results *1
Waveform + Calc
.MEM,
.CSVWaveform data is saved while recording, and cal-culation results are saved when recording finishes.
CSV + Calc*2 .CSV,.CSV
Waveform is saved in CSV text format while re-cording, and calculation results are saved when recording finishes. Saved data cannot be reloaded in the HiLogger.

3.3 Setting Configuration 1 – Recording Settings
47
3
3
Chapter 3 Setting before M
easurement
1 Select which content to save from the [Auto Save] settings.Setting options: Off*, Waveform(realtime), CSV(re-altime), Calc(post meas.), Waveform + Calc, CSV + Calc ( default setting)
When [Waveform(realtime)], [CSV(realtime)], [Waveform + Calc], [CSV + Calc] is selected2 (As needed) You can enter a file name for the
waveform files.See: 3.6, "Entering Comments" (p. 60)If left blank, file names are created automatically.See: Appendix 2, "File Naming" (p. A7)
3 Select the removable storage priority (CF card or USB flash drive)
4 Select the [Deleting] method for saving data when the CF card or USB flash drive becomes full.Setting options:( default setting)
5 Select whether to create a new file for each recording length, or to create new files at specified intervals (using [Split Save]).Setting options:( default setting)
Off* Saving stops when the CF card or USB flash drive becomes full.
On When space on the CF card or USB flash drive declines to a certain level when starting or dur-ing automatic saving, the oldest file is deleted. If the file cannot be deleted, saving stops. Only waveform files can be deleted in this way.Appendix 2, "File Naming" (p. A7)
Off* One file is created for each recording length.
On Specify the length (time span) of saved segments. A measurement data file is cre-ated for each segment.
Ref TimeSpecify a reference time and segment length (time span). A file is saved after each segment time span beginning at the reference time.
12
34
[Split Save: On]
[Split Save: Ref Time]Ref Time (reference time): 0:0 to 23:59Length (Segment length):1, 2, 5, 10, 15, 20, 30 minutes, 1, 2, 3, 4, 6, 8, 12 hours, 1day
Segment length: Days (0 to 30), Hours (0 to 23), Minutes (0 to 59)
When starting measurement, the message “Sync fixed time” is displayed until the re-cording interval synchronizes with specified reference time.
Horizontal axis settings are in-hibited during automatic sav-ing of waveforms (p. 43).
5
Regardless of the split save setting, the file will be automatically split when the file size nears 2 GB.

3.3 Setting Configuration 1 – Recording Settings
48
During real-time saving, removable storage can be replaced without interrupting mea-surement. This procedure describes replacing a USB flash drive.
Replacing Removable Storage During Real-Time Saving
Move the cursor to [EJECT].
Execute
Insert a formatted removable storage. Measurement data acquired while the de-vice was removed is automatically written.See: Formatting: (p. 95)
Insertion: (p. 94)
Remove the USB flash drive (p. 94).
Right bottom of the screen
Move the cursor to [Unmount USB memory].Execute
Move the cursor to [Yes].
Execute
Bottom of the screen
When both a CF card and USB flash drive are in-stalled and either is removed, the save destina-tion automatically switches to the remaining media.
ExecuteThe media icon display will change to the eject display.
• If a storage device is not replaced within two minutes after selecting "Yes" in the "Do you want to remove the USB memory/CF card?" con-firmation dialog, data may overflow internal memory and be lost.
• If a storage device is replaced during real-time saving, data is saved to a new file.
• If measurement ends while the removable storage is ejected, even if a removal storage is then inserted, the remaining data is lost. If this occurs, the measurement data remaining on the instrument can be retrieved with the manual save function.See: 6.3, "Saving Data" (p. 96).

3.4 Setting Configuration 2 – Input Channel Settings
49
3
3
Chapter 3 Setting before M
easurement
Configure the input channel settings on the [CH] screen. You can make these settings while viewing input signal amplitude on the level monitor. There are two general types of input signals, analog channels CH1 – CH10 and pulse channels P1 to P4. The analog channels can be used to measure voltage and temperature (with thermocouples), and the pulse channels can be used for pulse counting (integration) and revolution measurement.
Settings can be changed while viewing all channel settings on the [Range], [Scaling], [Trig & Alm], and [Comment] screens.In this example, settings are made on the [CH] screen while viewing the level monitor.You can specify recording criteria with the input settings to control recording, or to output alarm signals. See Chapter 4, "Specifying Criteria for Measure-ments (Triggering, Alarm and Timer)" (p. 67) for details.
3.4 Setting Configuration 2 – Input Channel Settings
Analog channels Pulse channels
"Voltage Measurement Settings" (p. 50) "Integration (Count) Measurement Settings" (p. 53)
"Temperature Measurement Settings" (p. 51) "Revolution Measurement Settings" (p. 54)
Select the [CH] screen.
Move to a setting item.
Apply
Open the setting options for the item to be set.
Select from the listed op-tions.
1
2
Level monitor (p. 24)
Use the CH / keys to change the selected channel.

3.4 Setting Configuration 2 – Input Channel Settings
50
Configure these settings for each voltage measurement channel.
Voltage Measurement Settings
1 Select a channel (CH 1 to CH 10) for the [Channel] setting contents.
2 To enable measurement on the channel, select On to display the check mark ( ).
3 Select [Voltage] for the [Input] (input type) setting.
4 Select the appropriate measurement ampli-tude range for the [Range] setting.Setting options:100mV, 1V, 10V, 20V, 100V, 1-5V ( default setting)
1
2
3
4
: On: Off
Instrumentation and Control Device MeasurementsFor instrumentation control signal measurements, select [1-5 V]. This range corre-sponds to the 4-20 mA output standard for instrumentation control. This setting automat-ically sets 1- and 5-volt lower and upper limits, respectively, in the 10 V range. Measurement accuracy is ±10 mV ±5 mV. To measure 4-20 mA current, connect a 250shunt resistor between + and – analog input terminals (p. 32).
Use the scaling function to scale measurements to any arbitrary unit value for display (p. 58).

3.4 Setting Configuration 2 – Input Channel Settings
51
3
3
Chapter 3 Setting before M
easurement
Configure these settings for each temperature measurement channel.
Temperature Measurement Settings
1 Select a channel (CH 1 to CH 10) for the [Channel] setting contents.
2 To enable measurement on the channel, select On to display the check mark ( ).
3 Select [Tc] for the [Input] (input type) set-ting.
4 Select the type of thermocouple to be used.Setting options:K, J, E, T, N, R, S, B ( default setting)
5 Enable or disable [Burn Out].Setting options:( default setting)
6 Select the reference junction compensa-tion (RJC) method for the [RJC] setting.Setting options:( default setting)
Off Do not detect broken (disconnected) wires.Normally when the thermocouple is dis-connected, the value will fluctuate, etc. and will not be stable.
On Detect broken wires.(This setting is available only when the re-cording interval is at least 100 ms, and the 50 Hz or 60 Hz digital filter is enabled.)When the wires are disconnected, “OVER” will be displayed as the measure-ment value.
Int Use the Memory HiLogger’s internal com-pensation. Measurement accuracy is the sum of the temperature measurement ac-curacy and the RJC accuracy.
Ext Use an external RJC method instead of the Memory HiLogger’s internal compen-sation. Memory HiLogger measurement accuracy is equivalent to the temperature measurement accuracy.
1 2 : On: Off
Temperature Measurement Range(Depends on thermocouple type)
JIS C 1602-1995With type B, the display shows 0 to 400°C, but accuracy is not guaranteed.
K -200°C to 1350°C
J -200°C to 1200°C
E -200°C to 1000°C
N -200°C to 1300°C
T -200°C to 400°C
R 0°C to 1700°C
S 0°C to 1700°C
B 400°C to 1800°C
3 4 5 6

3.4 Setting Configuration 2 – Input Channel Settings
52
[C]1000
400
0-200
-1000
If Thermocouple Measurement Range is ExceededExample: Using a type T thermocouple with range -200 to +400°CWhen measurements are outside of the range of the thermocou-ple, the waveform saturates and clings to the top of the screen as shown at the right.The numerical measurement values are displayed as “OVER” and the cursor measurement value, calculation values and saved data are handled as full-scale output values of the 16-bit A/D converter.See: "LR8431-20 Measurement Values" (p. A12)
About Burn Out DetectionBroken (disconnected) thermocouple wires are detected using a tiny (300 nA) sensing current. The thermal equivalent of the thermoelectromotive force (thermocouple resis-tance () times the 300 nA sensing current) is added to the measured value. However, measurement errors can occur if the thermocouple wire is long or if the wire itself has a large resistance, in which cases broken wire detection should be disabled (set to Off).
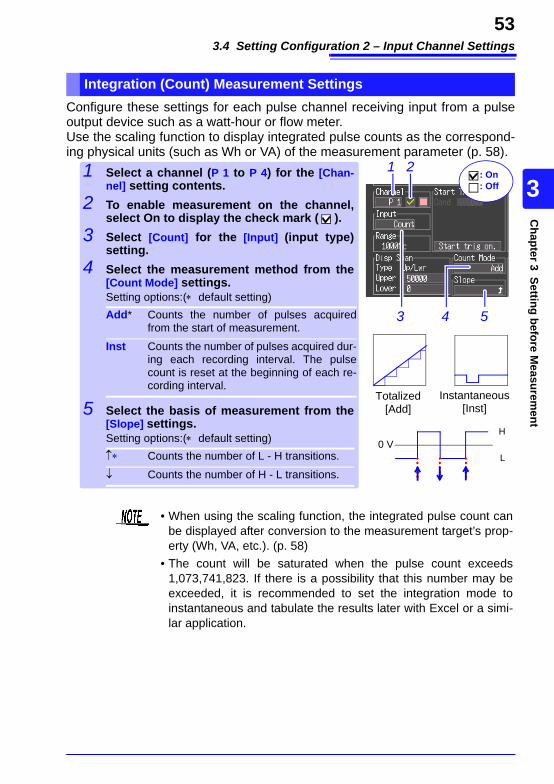
3.4 Setting Configuration 2 – Input Channel Settings
53
3
3
Chapter 3 Setting before M
easurement
Configure these settings for each pulse channel receiving input from a pulse output device such as a watt-hour or flow meter.Use the scaling function to display integrated pulse counts as the correspond-ing physical units (such as Wh or VA) of the measurement parameter (p. 58).
Integration (Count) Measurement Settings
• When using the scaling function, the integrated pulse count can be displayed after conversion to the measurement target’s prop-erty (Wh, VA, etc.). (p. 58)
• The count will be saturated when the pulse count exceeds 1,073,741,823. If there is a possibility that this number may be exceeded, it is recommended to set the integration mode to instantaneous and tabulate the results later with Excel or a simi-lar application.
1 Select a channel (P 1 to P 4) for the [Chan-nel] setting contents.
2 To enable measurement on the channel, select On to display the check mark ( ).
3 Select [Count] for the [Input] (input type) setting.
4 Select the measurement method from the [Count Mode] settings.Setting options:( default setting)
5 Select the basis of measurement from the [Slope] settings.Setting options:( default setting)
Add* Counts the number of pulses acquired from the start of measurement.
Inst Counts the number of pulses acquired dur-ing each recording interval. The pulse count is reset at the beginning of each re-cording interval.
Counts the number of L - H transitions.
Counts the number of H - L transitions.
Totalized[Add]
Instantaneous[Inst]
0 VL
H
1 2 : On: Off
3 4 5

3.4 Setting Configuration 2 – Input Channel Settings
54
Configure these settings for each pulse channel on which you will be counting pulses corresponding to revolutions, such as output from a rotary encoder or tachometer. The revolution measurement is obtained by counting the number of pulses input per second. The scaling function can be used to display the results of converting measured values to physical properties of the measure-ment target. (p. 58).
Revolution Measurement Settings
Change 1’s digit
Change 10’s digit
0 VL
H
1 Select a channel (P 1 to P 4) for the [Chan-nel] setting contents.
2 To enable measurement on the channel, select On to display the check mark ( ).
3 Select [Revolve] for the [Input] (input type) setting.
4 Set the [Pulse/Rev] setting to the number of pulses per revolution.Setting options: 1 to 1000 ( default setting)The range is automatically determined by this set-ting.
5 Select the basis of measurement from the [Slope] setting.Setting options:( default setting) Counts the number of revolutions based on
L - H transitions.
Counts the number of revolutions based on H - L transitions.
5000 r/s (n=1)
1 2 : On: Off
3
4 5

3.4 Setting Configuration 2 – Input Channel Settings
55
3
3
Chapter 3 Setting before M
easurement
Revolution Measurement TheoryPulse count is measured using the Memory HiLogger’s internal 10 ms sampling interval.The revolution rate (r) per second during time ts is obtained by dividing the number of pulses from (t-1) to ts by the num-ber of pulses per revolution.
Example: Pulses per revolution = 4 When the number of pulses counted in one second is P100 = 1000 c,and the number of pulses counted in two seconds is P200= 2000 c,then the revolution rate (rps) at t=2s (rt=2) can be obtained.
When time ts is less than one secondThe pulse count at (t –1)s (whole seconds) cannot measured, so 100 times the pulse count between (t -0.01)s and ts serves and the pulse count for one second to obtain the revolution rate.As a result, revolution measurements when t is less than one second are scattered.
0 10 ms 20 ms 1 s 2 s
Pulse CountP200P100P2P10
Pulses per revolutionPulse count at ts minus pulse count at (t -1) sr [rps] =
(rps: Revolutions per second)
rt=2 =4
2000 1000 = 250 [rps]
Pulses per revolution
Pulse count at ts minus pulse count at (t -0.01) sr [rps] = x 100

3.5 Display Settings
56
Configure how each channel is displayed, as needed. These settings can be changed on the Numerical/Waveform screen after measurement.
Different display colors can be selected for each input channel waveform.
The vertical display range and zero position can be specified for each channel.The magnification setting determines the displayed range. Waveforms are expanded or compressed vertically relative to the cen-ter of the screen.Magnification and zero-position settings are ignored when the display range is defined by upper and lower limits.In the 1-5V range of a voltage measure-ment and in integration measurement, [Position] cannot be specified.
3.5 Display Settings
Selecting Waveform Display Color
Select from the waveform display color set-ting options.Setting options:Off ( x ), 24-color
Specifying Vertical Display Range by Magnification and Zero Position (vertical axis expansion/compression)
Zero Position: 50% 25%
0 V100%
0%50%
0 V25%
Normal Display MagnifiedDisplay (x2)
1 Select [Position] for the [Type] setting options.
2 Select from the [Zoom] setting options.Setting options:x100, x50, x20, x10, x5, x2, x1, x1/2 ( default setting)
3 Set the desired zero position [0 pos] as a percentage of screen height.Setting options:-50 to 150% (with x1 magnification)
1
2
3Change 1’s digit
The expansion/com-pression range de-pends on the selected magnification.

3.5 Display Settings
57
3
3
Chapter 3 Setting before M
easurement
The vertical display range can be defined by upper and lower limits.Using this method, the voltage range does not need to be selected because the opti-mum range is selected automatically for the display. However, upper and lower limit set-tings are ignored when magnification and zero position are enabled to define the dis-play range.As the upper and lower limits in the 1-5V range are fixed, they cannot be changed.
50% 100%0%
50%100%50%
100%
0%0%
100%50%
0V
Zero Position: 0%
Display range(Zoom: x1)Measurement range
Default Setting
Input type Zoom Zeroposition Input type Zoom Zero
positionVoltage x1 50 Integration (Count) Temperature (Tc) x20 0 Revolution (Revolve) x1 0
Specifying the Vertical Display Range by Upper and Lower Lim-its (expansion/compression)
10
-100
5
-50
1 Select [Upper/Lower] for the [Type] setting item.
2 Specify the [Upper] value for the top of the display.
3 In the same way, specify the [Lower] value for the bottom of the display.The display range and scaling settings are in-terlinked.
The range is not automatically optimized when the upper and lower limits are set on the wave-form screen.
1
23
Default SettingInput type Range
Voltage -50m to 50mTemperature (Tc) 0 to 100Integration (Count) 0 to 5000Revolution (Revolve) 0 to 5000
After making the settings, press [OK].

3.5 Display Settings
58
Use the scaling function to convert input voltage to the physical units of the measure-ment parameter for display, such to convert voltage input for display as electrical current.Converted values can be displayed in fixed- or floating-point notation.
Setting Analog Channel or Pulse Channel (Revolution) Scaling
Converting Units (Scaling function)
Normal Display (Off)
Scaling Enabled
AmV
1 For the [Cond](condition) setting, select the desired numerical notation.Setting options:( default setting)
2 Move to the next item to the right, and select the scaling method.Setting options:( default setting)
3 Enter the [Unit] name on the comment entry screen.See: 3.6, "Entering Comments" (p. 60)
4 Ratio: Enter the conversion ratio and offset.2-pt: Enter the values at two points before and after conversion.
Dec Displays converted values using fixed-point notation
Exp Displays converted values using floating-point notation
Off* Scaling is disabled.
Ratio* Convert by specifying the ratio of physical units per volt of input signal (conversion ra-tio), offset, and the name of the units.
2-pt Convert by specifying the input signal volt-age at two points, the physical unit values at those points, and the name of the units.
1 2 3
Conversion Ratio Setting
Conversion Ratio Setting
2-Point Setting
2-Point Setting
[Cond: Exp]
[Cond: Dec]
4
AHAL
VL VH [V]Actual measurement values (input values)Converted unit values
Conversion Ratio Setting MethodUnits (eu)
Offset
Slope (Conversion ratio: eu/v)
2-Point Setting Method
Units: [A]Param 1:VH value AH valueParam 2:VL value AL value
Example VH:High value AH:Converted
high valueVL:Low valueAL:Converted
low value
Combining scaling and display positioning (upper/lower limits)To use both scaling and upper/lower display limits, set the scaling first, then upper/lower limit val-ues. With scaling enabled, the upper and lower limit setting ranges are constrained as follows:-9.9999E+19 Setting value-1.0000E-19, Setting value = 0, +1.0000E-19 Setting value +9.9999E+19

3.5 Display Settings
59
3
3
Chapter 3 Setting before M
easurement
Setting Pulse Channel (Integration) ScalingIntegrated pulse values can be converted for display as physical units of the mea-surement parameter (such as Wh or VA).Pulse output devices determine the amplitude per pulse in physical units, or the num-ber of pulses per fundamental unit (for example, per kWh, liter or m3).
1 For the [Cond] (condition) setting, select the desired numerical notation.Setting options:( default setting)
2 Enter the [Unit] name on the comment entry screen.See: Entering Comments (p. 60)
3 Specify the physical units per pulse or the number of pulses per fundamental unit (for example, if 1 c = 1 pulse, select [1 pulse]).The settings for physical units per pulse and pulses per fundamental unit are interlinked.
Dec Displays converted values using fixed-point notation
Exp Displays converted values using floating-point notation
Off* Scaling is disabled.
1
3
2
Using fixed-point notation
Using floating-point notation
Scaling Setting ExampleFor integration with a 50,000 pulse/kWh watt-hour meter:Cond: DecUnits: kWh1kwh=50000 pulse
For integration with a 10 liter/pulse flow meter:Cond: DecUnits: L1 pulse=10L

3.6 Entering Comments
60
Comments of up to 40 characters can be entered as a title for the measure-ment data, and as a label for each input waveform. Titles and comments are displayed on the waveform screen (Comments appear only when [Value+Cmnt] display is selected.Titles can be entered on the [Setting] and [Comment] screens, and comments can be entered on the [CH] and [Comment] screens. This description enters a comment on the [CH] screen.
The following characters are converted as follows when saved to a text file.
3.6 Entering Comments
Select the [CH] screen.
Select the field to enter the comment.
1
2
ApplyThe character entry screen appears.
3 Select the characters to enterTo enter a space, select a blank character.
ApplyCharacters appear in the entry field as you select them.
Entry field
Select [OK]Accepts your entry and returns to the[Comment] screen.
Navigate the entry fieldFinished with entry
Entered character
Converted plain text equivalent ^2 ^3 ^u ~o ~c ~e

3.6 Entering Comments
61
3
3
Chapter 3 Setting before M
easurement
Operating PanelOnly the keys displayed on the operating panel are en-abled.• List (WAVE/DATA key)
Measurement related terms are registered in the list beforehand.
• Hist (History, SET key)You can select previously entered terms from the pick list.
• Clear (FILE key)Clears all entered characters.
• Char Input (CH key)Switches between the pick list and character selection frames.
• / (Cursor up/down key) Selects from the pick list frame.
• Select (ENTER key) Accepts the item selected in the pick list.
• Cancel (ESC key) Cancels entry.
• <</ >> (SCROLL/CURSOR left/right key) Move input position.
• BS (SCROLL/CURSOR middle key) Deletes one character.
• OK (START/STOP key)Accepts entry.
The operating panel depicts the functions of Memory HiLogger's operating keys.

3.7 Viewing All Channel Settings in a List
62
All channel settings can be viewed and changed in the list. You can copy batches of settings between channels.
3.7 Viewing All Channel Settings in a List
[Range] screen
[Scaling] screen
Input Types ( : Voltage, : Temperature, : Integration, : Revolution, : Alarm)
[Trig & Alm] screen
Input Types ( : Voltage, : Temperature, : Integration, : Revolution, : Alarm)
[Comment] screen

3.7 Viewing All Channel Settings in a List
63
3
3
Chapter 3 Setting before M
easurement
The CH1 and P1 channel settings can be copied to other channels.
The display of all waveforms can be hidden, and all waveform display colors can be set to defaults.
Batch Copying Channel Settings
Select the screen showing the channel to copy.[Range], [Scaling], [Trig & Alm]
Select [Batch Proc].
1
2
Apply
The selected items are displayed.
3 Select the desired action.
Apply
• [Copy settings of CH1 to all other analog channels] : Copy the settings from channel 1 to channels 2 through 10.
• [Copy settings of P1 to all other pulse channels] : Copy the settings from channel P1 to channels P2 through P4.
Except for the following, the settings dis-played on the screen are copied.• Waveform display color• Input type (although this can also be
copied from the [Range] screen, p. 62 )
Batch Setting Waveform Display/Hide and Waveform Color Set-tings for All Channels
This setting is only available on the [Range] screen.
Select [Batch Proc].1
2
ApplyThe selected items are displayed.
Select the desired action.
Apply • [Set all analog channels color off]:Sets all channel waveforms to be hidden.
• [Set all analog channels color default]:Sets all channel waveform colors to their defaults.

3.7 Viewing All Channel Settings in a List
64
All settings in the current window are reset to their factory default values.
Analog channel waveforms can be positioned evenly along the vertical grid, with CH1 at the top. ([Range] screen only)This functionality is valid only for channels with the same input time as CH1 and for which [Display range] has been set to [Setting: Position]. CH1 to CH10 waveforms can be displayed together with each allotted 5% or 10% of the screen height.
Initializing Settings (to factory defaults)
Select which screen you want to initialize, from the [Range], [Scaling], [Trig & Alm] screens.
Select [Batch Proc].
1
2
ApplyThe selected items are displayed.
3 Select [Reset all settings in this page].
Apply
Aligning Zero Positions on the Grid
This setting is only available on the [Range] screen.
Select [Batch Proc].1
2
ApplyThe selected items are displayed.
Select the desired action.
Apply

3.7 Viewing All Channel Settings in a List
65
3
3
Chapter 3 Setting before M
easurement
All measured temperature values can be converted at once from Celsius to Fahrenheit units.The conversion is simultaneously reflected appropriately on all scaled values.To revert from Fahrenheit units to Celsius, disable (set to Off) the scaling func-tion (p. 58).
Alignment Example (with CH1 zero-position aligned at 95% and occupying 10% of vertical screen height)Channel Zero-position (%)CH1 95CH2 85CH3 75CH4 65CH5 55CH6 45CH7 35CH8 25CH9 15CH10 5
CH10 0 V
100%
0%
50%
CH1 0 V
Display Celsius (°C) temperature values as Fahrenheit (°F)
This setting is only available on the [Scaling] screen.
Select [Batch Proc].1
2
ApplyThe selected items are displayed.
Select the desired action.
Apply

3.7 Viewing All Channel Settings in a List
66

67
34
Chapter 4 Specifying C
riteria for Measurem
ents (Triggering, Alarm
and Timer)
You can set recording to start and stop under specific criteria (start/stop triggers), and to output alarm signals. You can also set specific times to start and stop record-ing, using the Timer function.Triggering is the process of controlling the start and stop of recording by specific signals or conditions (criteria). When recording is started or stopped by a specific signal, we say the trigger is "applied" or "triggering occurs". In this manual, indicates a "trigger point", as the time at which a trigger is applied.
Criteria can be specified for the following event trigger types.
Set trigger criteria for individual channels on the Channel [CH] screen, and set trig-ger and alarm settings for all channels on the [Trig & Alm] screen (p. 75).
Specifying Criteria for Measurements (Triggering, Alarm and Timer) Chapter 4
Trigger Type Description Setting Screen Ref.
Start Trigger Recording starts when the specified Start Trigger crite-ria are satisfied.
[CH]/[Trig & Alm] (p. 68)
Stop TriggerRecording stops when the specified Stop Trigger crite-ria are satisfied. When [Repeat] is enabled (set to [On]), recording restarts automatically.
[CH]/[Trig & Alm] (p. 68)
Pre-trigger Records data acquired during a specified period prior to each trigger event. [Trig & Alm] (p. 72)
Trigger Source
Various trigger criteria can be combined with logical AND/OR operations for each channel. [Trig & Alm] (p. 71)
External Trigger
Triggering can be applied by an external signal at the EXT.TRIG input terminal. [Trig & Alm] (p. 71)
Alarm An alarm signal can be output when any specified cri-teria are met.
[CH]/[Trig & Alm] (p. 73)
Timer Records at a specified date and time. [Setting] (p. 76)
Trigger criteria met
T
T
Pre-trigger
Start (Start trigger) Stop (Stop trigger)
Alarm
Timer
T T
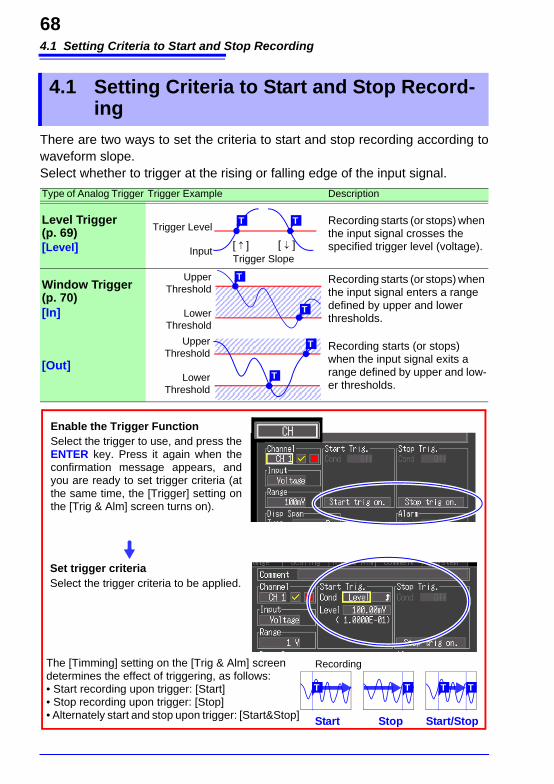
4.1 Setting Criteria to Start and Stop Recording
68
There are two ways to set the criteria to start and stop recording according to waveform slope.Select whether to trigger at the rising or falling edge of the input signal.
4.1 Setting Criteria to Start and Stop Record-ing
Type of Analog Trigger Trigger Example Description
Level Trigger(p. 69)[Level]
Recording starts (or stops) when the input signal crosses the specified trigger level (voltage).
Window Trigger(p. 70)[In]
Recording starts (or stops) when the input signal enters a range defined by upper and lower thresholds.
[Out]Recording starts (or stops) when the input signal exits a range defined by upper and low-er thresholds.
[ ] [ ]
T TTrigger Level
Input Trigger Slope
T
T
Upper Threshold
Lower Threshold
T
TUpper Threshold
Lower Threshold
Enable the Trigger FunctionSelect the trigger to use, and press the ENTER key. Press it again when the confirmation message appears, and you are ready to set trigger criteria (at the same time, the [Trigger] setting on the [Trig & Alm] screen turns on).
Set trigger criteriaSelect the trigger criteria to be applied.
The [Timming] setting on the [Trig & Alm] screendetermines the effect of triggering, as follows:• Start recording upon trigger: [Start]• Stop recording upon trigger: [Stop]• Alternately start and stop upon trigger: [Start&Stop]
Recording
T
Start Stop Start/Stop
T T T

4.1 Setting Criteria to Start and Stop Recording
69
34
Chapter 4 Specifying C
riteria for Measurem
ents (Triggering, Alarm
and Timer)
Enter the signal level threshold at which to start or stop recording, and whether triggering occurs on the upslope or downslope of the input signal.Recording starts or stops when the signal crosses the specified threshold. The level value is an instanta-neous (not rms) value.Levels can be confirmed on the level monitor or on the Waveform screen.
Select the [CH] Screen.
Move to a setting item.
Apply
Open the setting options for the item to be set.
Select from the listed options.
1
2
Setting the Input Signal Trigger Threshold (Level Trigger)
T T
Level Setting Ranges and ResolutionChannels Input type Range Resolution Channels Input type Range ResolutionCH1 - CH10
Voltage
100mV 25 V P1 - P4 Count 1 c1V 250 V Revolve 1 r/s10V 2.5 mV20V 5 mV100V 25 mV1-5V 2.5 mV
Tc 0.5C
1 Select [Level] as the [Cond] setting option for the start or stop trigger.
2 Select the input signal rising () or falling () edge setting option.Setting options: ( default setting)
3 Set the [Level] setting to the input signal level at which to start or stop recording.
Recording starts (or stops) when the signal cross-es the threshold on the upslope (rising edge).
Recording starts (or stops) when the signal cross-es the threshold on the downslope (falling edge ).
12
3
When scaling is enabled, the scaled value is also dis-played.
Default setting: 0

4.1 Setting Criteria to Start and Stop Recording
70
An input signal level “window” within which recording will (or will not) occur can be defined by upper and lower threshold levels. You can select whether record-ing starts or stops when the input signal level enters (In) or exits (Out) of this window.Upper and lower thresholds can be verified in the level monitor or on the Waveform screen. When scaling is enabled, the scaled threshold values are displayed.
Setting Lower and Upper Trigger Thresholds (Window Trigger)
T T
T
In Out
T
Upper/Lower Threshold Ranges and Resolution
Channels Input Range ResolutionDefault settingUpper Lower
CH1 - CH10Voltage
100mV 25 V 2 mV -2 mV1V 250 V 20 mV -20 mV10V 2.5 mV 0.2 V -0.2 V20V 5 mV 0.4 V -0.4 V100V 25 mV 2 V -2 V1-5V 2.5 mV 0.2 V -0.2 V
Tc 0.5C 40C -40C
P1 - P4Count 1 c 80 0Revolve 1 r/s 80 0
1 Select [Window] as the [Cond] setting option for the start or stop trigger.
2 Select inside [In] or outside [Out].Setting options: ( default setting)
3 Enter the upper threshold value for the [Upper] setting.
4 Enter the lower threshold value for the [Lower] setting.
In Trigger when the input signal level enters the window defined by the upper/lower thresholds.
Out Trigger when the input signal level exits the window defined by the upper/lower thresholds.
1234
When scaling is enabled, the scaled value is also dis-played.

4.1 Setting Criteria to Start and Stop Recording
71
34
Chapter 4 Specifying C
riteria for Measurem
ents (Triggering, Alarm
and Timer)
Enable the trigger function (set to On), select recording start/stop timing, and set trigger criteria. Triggering is affected only by those channels for which trig-ger criteria have been set.Make these settings on the [Trig & Alm] screen.If trigger settings have been made on the [CH] screen, skip steps 1 and 2.The settings in steps 1 and 2 are interlinked with those on the [CH] screen.
Selecting Trigger Sources and Combinations
1 Set the [Trigger] to [On].
2 Select the [Timming] setting option to deter-mine how triggering will affect recording.Setting options: ( default setting)
(Start and stop triggers can be set for each channel in-dependently.)
3 Select how trigger sources are logically com-bined using the [Trig Source] - [Start] and [Stop]setting options.Setting options:( default setting)
4 (When an external trigger is applied)Set the [Ext trig] - [Start] or [Stop] setting to
Start* Start recording according to Start Trigger criteria.
Stop Stop recording according to Stop Trigger criteria.
Start&Stop Start and stop recording according to the Start and Stop Trigger criteria, respec-tively.
OR* Triggering occurs when any one of the spec-ified trigger source criteria is met. (includes external trigger signal)
AND Triggering occurs only when all of the speci-fied trigger source criteria are met. (includes external trigger signal)
12
3
4
[AND]One waveform has crossed above 0V as the other crosses on the upslope
[OR]Either waveform crosses 0V on the upslope
StartMeasurement
Trigger....... LevelLevel............. 0 VSlope
To apply a trigger when the upslope () of the waveform crosses zero volts:StartMeasurementT T T T
When the trigger combining logic is set to [AND]If trigger criteria are already met when you press the START/STOP key, no trig-gering occurs. Triggering occurs only after all trigger sources have ceased to meet the criteria at once, and are sub-sequently met again.

4.1 Setting Criteria to Start and Stop Recording
72
Select the [Start] or [Start&Stop] trigger timing setting to record waveforms both before and after trigger events.However, pre-trigger recording is disabled when [Stop] trigger timing is selected.Make the setting on the [Trig & Alm] screen.
Setting Criteria for Pre-Trigger Recording (Pre-Trig)
T
For the [Pre-Trig] setting, specify the time (or number of days) to record before a trigger event.
To record waveforms after a trigger event, simply spec-ify a recording time that is longer than the pre-trigger recording time.
Difference between [Waiting for pre-trigger] and [Wait-ing for trigger]When measurement is started, the specified pre-trigger length is recorded. This period is indicated as the [Waiting for pre-trigger]. After the specified pre-trigger length has been recorded, the period indicated as [Waiting for trigger] continues until a trigger occurs. During the [Waiting for pre-trigger] period, trigger events are not recognized even when the trigger criteria are met.
The maximum settable time span is displayed.
Change 1’s digit
Change 10’s digit
T
Pre-Tirg: 15 minutes
Recording length(10 minutes)
Recording ends at trigger event
Recording Time shorter than Pre-Trigger Time
Recording Time longer than Pre-Trigger Time
T
Pre-Tirg: 5 minutes
Recording length(15 minutes)
Records both before and after trigger event
Recording ends when recording length has passed
Pre-Trigger vs. Recording Time

4.2 Alarm Output
73
34
Chapter 4 Specifying C
riteria for Measurem
ents (Triggering, Alarm
and Timer)
You can enable beep tones and an alarm output signal (for external use) for each input channel by setting its alarm criteria. You can also view alarm output status on screens that display numerical values ([Wave+Value], [Value+Cmnt] and [Value]).
External alarm output requires connection to the external control terminals. See Chapter 9, "External Control" (p. 129) for details.Select alarm input channels on the [CH] screen, and specify alarm criteria on the [Trig & Alm] screen.
4.2 Alarm Output
Alarm CriteriaChannel alarm status (CH1 to CH10 and P1 to P4)• Yellow*: alarm criteria are satisfied• Green: alarm criteria are not satisfied*. When [Hold Alarm] is enabled (set to [On]), the indicator remains yellow because the criteria remain satisfied (until measurement is finished).The [Buzzer] alarm sound can be set to on or off. When [All display] is set to [On], the de-tected waveforms for CH1 to 10 and P1 to 4 set to the alarm source will also be displayed. Alarm output status (ALM)• Red: alarm signal output active• Green: alarm signal output inactive
1 Select the [Channel] setting option to [ALM].
2 Set a check mark [ ] as shown to enable alarm output.
3 Set the [Hold Alarm] as required for your alarm output destination device.Setting options:( default setting)
4 Enable or disable the alarm beeper by the [Buzzer] setting.Setting options:( default setting)
Off Disable the alarm output signal when alarm criteria are no longer met.
On Hold the alarm output active state until mea-surement is finished.
Off The Memory HiLogger will not sound an au-dible beep during alarm signal output.
On The Memory HiLogger will sound an audible beep during alarm signal output.
1 2: On: Off
3 4
Configuring Alarm Output
Select the [CH] Screen.
To stop the alarm beeper while measuring, set the beeper to [Off] in the ALM channel settings on the Waveform screen.

4.2 Alarm Output
74
1 For the [Channel], select a channel for which you want to set alarm criteria.
2 Select [Alarm on.] to enable alarm criteria settings.
3 Select the alarm criteria type from the [Cond]setting options.Setting options:( default setting)
Alarm criteria settings are not available unless a check mark [ ] is displayed next to the channel number.
4 Set the alarm criteria.If you have selected [Level].Setting options:
If you have selected [Window].Setting options:
Off* Disable alarms for this channel.
Level Trigger an alarm when the input reaches a specified level.
WindowTrigger an alarm when the input transitions through upper and lower limits (window).
Alarm output occurs when the input signal rises above the specified level threshold.
Alarm output occurs when the input signal falls be-low the specified level threshold.
In Alarm output occurs when the input signal enters the range defined by the thresholds.
Out Alarm output occurs when the input signal exits the range defined by the thresholds.
1Setting Alarm Criteria for Each Channel
ALM appears when no channel output is checked ( ). In this case, select [Alarm on.] to enable alarm output settings, and then set alarm criteria.
Select how you want to combine alarm output crite-ria from the [Alarm] setting options.Setting options:( default setting)OR* Alarm output occurs when the alarm criteria specified
for any alarm-enabled channel are satisfied.
AND Alarm output occurs only when the alarm criteria for every alarm-enabled channel are satisfied.
Selecting Combined Alarm Output Criteria
Select the [Trig & Alm] Screen.
If set to [Off], change it to [On].

4.3 Confirming Trigger and Alarm Criteria Settings (List)
75
34
Chapter 4 Specifying C
riteria for Measurem
ents (Triggering, Alarm
and Timer)
You can view and change trigger and alarm criteria settings for all channels.However, detailed criteria settings such as level, threshold and slope can only be changed on the [CH] screen (p. 68).
4.3 Confirming Trigger and Alarm Criteria Set-tings (List)
Channel-specific set-tings (start, stop and alarm triggers) are dis-played to the right of the list for the channel selected (highlighted) by the cursor.
Select [Batch Proc] to initialize settings and to copy trigger and alarm settings from CH1 or P1 to the other channels. Copyable settings include level, window thresholds and slope.See: "Batch Copying Channel Settings" (p. 63)
Input type: Voltage: Temperature: Integration: Revolution: Alarm

4.4 Starting and Stopping Recording by Timer
76
Make these settings to record at a specific time. Recording can be set to repeat at specific intervals between the set start and stop times.Before setting, confirm that the Memory HiLogger clock is set to the correct time. If not, reset the clock on the [System] screen (p. 124).
4.4 Starting and Stopping Recording by Timer
Select the [Setting] Screen.
Move to a setting item.
Apply
Open the setting options for the item to be set.
Select from the listed options.
1
2
Change 1’s digit Change 10’s digit
1 Set the [Timer] setting to [On].2 Enable (set to [On]) the desired timer set-
ting items.Setting options:
3 Set the year, month, day, hour, minute and second for the start or stop time.To enter the current time as the start or stop time, select the clock mark ( ) and press the ENTER key.
4 For the [Interval] settings, set the amount of time (days, hours, minutes and seconds) between recording repetitions.
5 Press START.[Wait Timer] will be displayed at the bottom of the waveform screen.
Start Set the recording start time.Stop Set the recording stop time.Interval Set the recording repetition interval.
This setting is enabled on when [Repeat] is set to [On].
Stop measurement
Startmeasurement
Recording
Recording time
Recording Interval
When recording times are specified, recording operation depends on the repetition and recording time settings(p. 78).

4.4 Starting and Stopping Recording by Timer
77
34
Chapter 4 Specifying C
riteria for Measurem
ents (Triggering, Alarm
and Timer)
Example: To record daily from 9:00 to 17:00 for one month beginning 1/1/2012, Repeat Recording: On, Timer: On
Note: When all channels are measured and the recording interval is slower than 200ms.
(YY-M-D) (H:M:S)(From) Start On 12-1-1 9: 0: 0(Until) Stop On 12-1-31 17: 0: 0(Time from one record-ing to the next) IntervalOn 1 0: 0: 0
(recording length) Cont: Off 8: 0: 0 9:00 to 17:00 is 8 hours
12-1-19:00
12-1-117:00
8 hours1 day
12-1-29:00

4.5 About Recording Operation
78
Recording operation depends on the combination of trigger, timer and repeat recording (On/Off) settings.
4.5 About Recording Operation
Cont. Trig-ger Timer Repeat: Off Repeat: On
Off Off Off
Off Off Off
Recording is stopped before one recording length has elapsed
Off Off Start
Off Off Stop
The stop time setting is after the recording length has elapsed
Off Off Stop
The stop time setting is within the recording length
Off Off Start/Stop
(Repeat Recording: same as Off)The stop time setting is within the recording length
Press START/STOP Timer start/stop time Trigger criteria matchT
Stop recordingStart recording
Recording
Recording time
Stop recordingStart recording
Recording
Recording time
Dead time
Stop recordingStart recording
Recording
Recording time
Stop recordingStart recording
Recording
Dead time
Recording time
Stop recordingStart recording
Recording
Recording time
Stop recordingStart recording
Recording
Dead time
Recording time
Stop recordingStart recording
Recording
Recording time
Stop recordingStart recording
Recording
Dead time
Recording time
Stop recordingStart recording
Recording
Recording time
Stop recordingStart recording
Recording
Dead time
Recording time
Stop recordingStart recording
Recording
Recording time

4.5 About Recording Operation
79
34
Chapter 4 Specifying C
riteria for Measurem
ents (Triggering, Alarm
and Timer)
Off Start Off
Off Stop Off
A stop trigger oc-curs before one recording length has elapsed
Off Start/Stop
Start/Stop
A start trigger oc-curs after the tim-er start time, and a stop trigger oc-curs before the timer stop time
On Off Off (Repeat Recording: same as Off)
On Stop Off
Cont. Trig-ger Timer Repeat: Off Repeat: On
Press START/STOP Timer start/stop time Trigger criteria matchT
Stop recording
RecordingT
Recording time
Start recording
Recording time
Stop recordingStart recording
RecordingT T
Stop recordingStart recording
RecordingT
Recording time Recording time
Stop recordingStartrecording
Recording
Dead time
T T
Stop recordingStart recording
RecordingT T
Recording time
Stop recordingStart recording
Recording
Dead time
T T T T
Recording time
Recording time
Stop recordingStart recording
Recording
Stop recordingStart recording
RecordingT
Stop recordingStart recording
Recording
Dead time
T T

4.5 About Recording Operation
80

81
3
5
Chapter 5 W
aveform A
nalysis
About the Waveform and Numerical Value Screens
Settings can be changed on the Waveform/Numerical screen.
Waveform Analysis Chapter 5
EjectAllows you to change the CF card or USB flash drive while sav-ing data in real time. (p. 48)
Analog and pulsewaveformsDisplays acquired data as waveforms.
Time Values
Scroll BarShows the range and position of the displayed waveform.Viewing the Scroll bar (p. 82)Information such as measure-ment start time and trigger times is displayed below the scroll bar.
MeasurementConfigurationYou can change these settings (p. 41)You can switch between channel settings and event search settings.“Event Search” (p. 88)
Jump Function (p. 83)
Trigger MarkIndicates a trigger event
You can select from seven screen configurations (p. 18) Gauges can be displayed for each channel (p. 84) Numerical values at waveform cursor positions can be
viewed (p. 84) Numerical calculation results can be displayed (p. 113) Measurement data can be displayed as waveforms and
numerical values, as numerical values with comments, or as numerical values only (p. 87).
Move to a setting item
Apply
Open the setting options for the item to be set.
Select from the listed options.
1
2Select the Waveform Screen.

5.1 Viewing Waveforms
82
When measuring or displaying an existing waveform, use the SCROLL/CURSOR keys to scroll.You can scroll to any part of a waveform while mea-suring. To return to the current waveform position, move the selection cursor to [Trace] at the lower right of the screen, and press the ENTER key.To jump to the start or end of a waveform, hold the ESC key while scrolling.
From the scroll bar you can verify the relative position and size of the displayed portion of a waveform within the overall recorded waveform.The width of the currently displayed time span indica-tor within the scroll bar depends on the time base (time per horizontal division) setting, even when the recording length is unchanged.
5.1 Viewing Waveforms
Scrolling Waveforms
Screen DisplayEarlier Later
If internal memory becomes full when measuring with [Cont] set to [On], recording continues by overwriting the oldest acquired data. Therefore, even when scrolling earlier parts of waveforms, the overwritten data is lost.
Internal Memory (max. recording length): scrollable viewing time spanErased Data
Verifying Waveform Display Position
Screen Display Range
Whole Waveform

5.1 Viewing Waveforms
83
3
5
Chapter 5 W
aveform A
nalysis
Waveforms can be magnified (expanded or com-pressed) along the time axis by changing the time per horizontal division.Detailed waveform data is usually best observed with the time axis expanded, while longer-term trends are best observed with it compressed.Horizontal magnification can be changed while mea-suring. However, when measuring with auto saving enabled, the 100, 200 and 500 ms settings are not selectable.
When the recording length of a waveform is long, you can specify the portion to be displayed immediately.
Magnifying and Compressing Horizontally
Select from the [Time/DIV] setting options.Setting options:100ms, 200ms, 500ms, 1s, 2s, 5s, 10s, 20s, 30s, 1min, 2min, 5min, 10min, 20min, 30min, 1h, 2h, 5h, 10h, 12h, 1day[/div] ( default setting)
Indicates the center point for horizontal magnification. When the A/B cursors are displayed, the position of cur-sor A becomes the reference point.
Viewing Any Waveform Location (Jump Function)
Select [Jump].
Apply
1
2
The location of the currently displayed portion of the over-all waveform is indicated by the mark on the scroll bar.
3 Move the mark to dis-play a different portion of the waveform.
The portion of the waveform at the mark is displayed.
Apply
Select the Waveform Screen.
4

5.2 Selecting Display Options
84
A gauge corresponding to the measurement range of each channel can be displayed at the left side of the screen, for confirming measurement values. The color of the gauge matches the waveform display color of its input channel.Press the CH or key to display the gauges for other channels. However, note that when measurement data is displayed, only those channels that are enabled (set to On ) for measurement can be selected.
Time difference and potential difference (and when scaling is enabled, scaling values) can be read as numerical val-ues using the A/B cursors.
5.2 Selecting Display Options
Displaying Gauges
1
2Select the Waveform Screen.
Gauge
Select [Gauge+Wave].
Apply
Displaying Cursor ValuesA
B
About Cursor ValuesCursor Type Example Cursor Value
TraceCursors
Displays the time and measurement values at the A/B cur-sors, or the time and measurement differences between the A/B cursors.Displays the intersections (trace points) of cursors and waveforms. (the intersections of waveform traces of se-lected channels)
VerticalCursors
Displays the time and frequency values at the A/B cursors, or the time and frequency differences between the A/B cur-sors.
HorizontalCursors
Displays the measurement values at the A and B cursors for the selected channel(s), or the difference between A/B cursor values.A/B cursors can be enabled for any channel.
AB
B-AB-A
A B
B-A
AB
B-A

5.2 Selecting Display Options
85
3
5
Chapter 5 W
aveform A
nalysis
Cursor values can be displayed for all channels, or for only desired channels.
1Displays the A/B cursors and the values at the cursor positions.To hide the cursor items again, press the SCROLL/CURSOR key.
2Move the cursors to display numer-ical values along the waveform.
Moving the CursorsSelect from the [Move] setting options.A CurB CurAB Cur( default setting)
Changing Cursor TypeSelect from the [Type] setting options.TraceVert (Vertical)Horz (Horizontal)( default setting)
Cursors
Selecting which channels have their cursor values dis-playedSelect from the [AB Crsr]setting options.• [All Ch]*
Displays all channels. The cursor selected for [Move] is displayed (select [AB Cur] to display B – A difference val-ues).
• [Ch Set]Specify which channels to display with A and B cursors. The cursor values for the specified channels are dis-played.
( default setting)
Cursor Values for All Channels
Cursor Value for Specified Channels
To move cursors more quickly, hold the ESC key.

5.2 Selecting Display Options
86
Specify a waveform time span when saving a partial waveform or applying numerical calculations (Trace cursors or Vertical cursors).
Specifying a Waveform Time Span
1The A/B cursors and cursor values are displayed.
3Move the A/B cursors to specify the time span.
Select [Move].2
Apply
Open the setting options for the item to be set.
Select which cursor(s) to move.
[Move]A CurB CurAB Cur

5.2 Selecting Display Options
87
3
5
Chapter 5 W
aveform A
nalysis
Numerical values can be displayed in three ways: numerical values only, waveforms and numerical values, and numerical values and comments.Displayed numerical values are those of the current input signals.
To display waveforms and numerical values
To display numerical values and comments
To display numerical values only
Viewing Input Signals as Numerical Values
Select [Wave+Value].
1
2
Apply
Select the Waveform Screen.
Select [Value+Cmnt].
1
2
Apply
Select the Waveform Screen.
Select [Value].
1
2
Apply
Select the Waveform Screen.
(Channels whose combination of mea-surement value and unit based on the scaling setting is longer than 13 charac-ters are indicated by smaller display characters.)

5.3 Inserting Event Marks (Search Function)
88
You can insert up to 100 event marks at any point while measuring, to help find them later.See "Searching Event Marks" (p. 90)Event marks can be inserted while viewing waveforms or by applying external signals.
Use this procedure to insert event marks while viewing data on the Waveform/Numerical Value screen during measurement. Event marks are numbered in the sequence they are inserted.
5.3 Inserting Event Marks (Search Function)1 2 3
Inserting Event Marks While Viewing Waveforms
Select [Event].
1
Event mark settings are displayed.
3
Apply
Select the Waveform Screen.
Move to [Make Mark].
Press to insert an event mark. Event numbers appear on the waveform displayed when you select [Make Mark].
2 Select [Channel].
2
3

5.3 Inserting Event Marks (Search Function)
89
3
5
Chapter 5 W
aveform A
nalysis
Event marks can be inserted by applying external input signals.See: Input signal specifications in section 9.2, "External Trigger Input" (p. 131)
Inserting Event Marks Using External Input Signals
Select the [System] screen.
Select [External Trig In].
Apply
Open the setting options for the item to be set.
Select [Event].
1
2
3 Connect the external signal input (p. 129).Event marks are inserted when the external trigger signal (EXT.TRIG input terminal 2) transitions on the falling edge from High level (3.0 to 5.0 V) to Low level (0 to 0.8 V).

5.3 Inserting Event Marks (Search Function)
90
Any event mark can be found by searching.
Searching Event Marks
1
2
3
Apply
Select the Waveform Screen.
For the [MoveNo.] setting, select the number of the event you want to find.
Select [Move].4
The waveform with the specified event number is displayed.
You can search by incrementing and decrementing the event number.[PrevEvent]: Search for the previous event mark.[NextEvent]: Search for the next event mark.
When [Channel] is displayed, switch to [Event].The event setting items are displayed.
2
3
4

6.1 About Saving and Loading Data
91
3
6
Chapter 6 Saving &
Loading Data
Measurement data acquired by the Memory HiLogger can be saved to a CF card or USB flash drive. (p.93)The CF card is treated as Drive A:, while the USB flash drive is treated as Drive B:. There are three save methods: [Auto Save], which saves data auto-matically at the time of measurement; [Select & Save], which allows data to be saved after measurement; and [Quick Save].Refer to 6.3, "Saving Data" (p. 96) for details.
When saving data, a folder named HIOKI_LR8431 is created, and files are stored in the folder as follows.
*1. Save waveform data in binary format if you intend to view it later in the HiLogger or on a computer with the supplied Logger Utility program. Waveform data and some measure-ment-related settings data are saved. To save a waveform partially, specify a period by using A/B cursors before saving (p.86).
*2. BMP Format: This is a standard Windows graphics format. These files can be handled by many graphics programs.
*3. Appendix 2, "File Naming" (p. A7)*4. Date (YY-MM-DD) folders are automatically created inside the DATA folder.*5. When opening a CSV file in a spreadsheet program, note that the number of rows that
can be loaded at one time is limited (p. A7).When an option other than [Separator: Comma] has been selected on the [System] screen, the file extension will be .TXT rather than .CSV.
Saving & Loading Data Chapter 6
6.1 About Saving and Loading Data
O = Available, X = Not available
File Type FileFormat Folder Name
File Name *3(Auto-numbered from 1)
Save Load
Auto Man-ual
Model LR8431-20
PC
Settings Data Binary CONFIG CONF0001.SET × O O ×
WaveformData*1
Binary DATA\(Date)*4(e.g. 12-07-30)
WAVE0001.MEM O O O O
Text *5 WAVE0001.CSV O O × ONumerical Calculation Results
Text *5 MEASUREMENT MEAS0001.CSV O O × O
Captured Screen Image BMP *2 PICTURE SCR00001.BMP × O O O

6.1 About Saving and Loading Data
92
Depending on file size and CF card or USB flash drive capacity, each folder can store over 1,000 files. However, the file screen display is limited to a maximum of 1,000 files. Also, as more files are created, more time is needed to start and stop recording. We recommend setting measurement criteria so that the number of saved files stays below 1,000 whenever possible.
Directory Structure for Saved Data
HIOKI_LR8431CONF0001.SET
WAVE0001.MEM
(Settings data folder)CONFIG
(Waveform data folder)DATA
MEASUREMENTWAVE0001.CSV
PICTURE
(Numerical calculation results folder)
(Screen image folder)
12-07-01(the folder name is the date of file creation)
MEAS0001.CSV
SCR00001.BMP
6.2 Using a CF Card/USB flash drive
93
3
6
Chapter 6 Saving &
Loading Data
To save and reload HiLogger measurement data, use an optional CF card or an after-market USB flash drive.
6.2 Using a CF Card/USB flash drive
Hioki options PC cards(includes adapter)• Model 9727 PC Card 256M• Model 9728 PC Card 512M• Model 9729 PC Card 1G• Model 9830 PC Card 2G*The Model 9726 PC Card 128M can also be used.
ImportantUse only CF cards sold by Hioki.Compatibility and performance are not guaran-teed for CF cards made by other manufactur-ers. You may be unable to read from or save data to such cards.
This Memory HiLogger does not require a CF (CompactFlash) adapter. See 6.5, "Data Management" (p. 105) for details about managing data storage in the card.
• During battery-only operation, data may fail to be stored properly if battery charge is exhausted while saving. In the worst case, the CF card could be damaged, so pay appropriate attention to the discharge state of the battery pack.
• If the Eject button is in the released position, press it in first before inserting the CF card all the way in. Inserting the CF card when the Eject button is released may damage the instrument. If the CF card does not go all the way in, do not force it in. Press the Eject button once to release it, then press it again and insert the CF card all the way in.
• Although data can be saved in real time to a USB flash drive, it is recommended to use a CF card for this purpose due to the supe-rior data protection offered by that media. Proper operation of media other than Hioki optional CF cards is not guaranteed.
• USB flash drives with security functionality such as password or fingerprint authentication cannot be used.

6.2 Using a CF Card/USB flash drive
94
CF Card Insertion & Removal
Cover Inserting a CF card
1 Open the CF card slot cover.
2 Press the Eject button in if it is in the released position.
3 Face the CF card with the arrow mark () on top, and insert it in the direc-tion of the arrow all the way in the slot.
Removing a CF card
1 Open the CF card slot cover.
2 Press the Eject button (to release it).
3 Press the Eject button again and pull the card out.
Eject Button
USB flash drive Insertion & Removal
Inserting a USB flash driveAlign the USB flash drive connector with the USB port, and insert it all the way in.
Removing a USB flash drivePull the USB flash drive out.See: "Replacing Removable Storage During Real-Time Saving"
(p. 48)
• When using a USB flash drive, set the USB mode on the [Sys-tem] screen to [USB Memory]. USB flash drives cannot be used while the USB mode setting is [USB Communication] or [USB Drive].
• The [USB Memory], [USB Communication], and [USB Drive] USB mode settings are exclusive and cannot be used simulta-neously.

6.2 Using a CF Card/USB flash drive
95
3
6
Chapter 6 Saving &
Loading Data
The CF card or USB flash drive can be formatted by a PC or by the HiLogger. Format a new CF card or USB flash drive before use.
This procedure describes how to format a CF card or USB flash drive in the HiLogger.
Formatting a CF Card/USB flash drive
Formatting irretrievably erases all data on the CF card/USB flash drive. Always backup important data from the CF card/USB flash drive before formatting.
Select the File Screen.
Select [Format].
Apply
Apply
1
2
The Format Confirmationdialog appears.
Select [Yes].
Open the Control Dialog box
Apply
Select [Yes].
The Format Confirmationdialog appears again.
3
4
5

6.3 Saving Data
96
Basically, three methods are available for saving.
The LR8431-20 and 8430-20 use compatible waveform data, display image, and settings data formats that can be read by both instruments.
6.3 Saving Data
Before saving, select the items to be saved on the [System] screen. These are saved immediately when you press the SAVE key. This is convenient for saving certain types of data, or when you want to save immediately while monitoring (p.98)
(Default setting)Press the SAVE key to se-lect and save the selected contents. No settings are needed be-fore saving this way (p.98).
Measurement data is si-multaneously saved during measurement. Calculation results are saved only after measurement is finished.Select the save contents before measuring (p.97)
Auto Save Quick Save Select & Save
Insert a CF card/USB flash drive.
Set the Auto Save (p.46)
Select what to save.
Measurement
Saving proceedsautomatically
[Setting] Screen
The following can be saved simultaneously:• Waveform Data• Numerical Calculation
Results
Insert a CF card/USB flash drive.
Set the function of the SAVE key to [Quick
Save] (p.98).
Select what to save.
Press the SAVE key.
Save
[System] Screen
• Waveform Data• Screen Image• Setting Data• Numerical Calculation
Results
Insert a CF card/USB flash drive.
Set the function of the SAVE key to [Select &
Save] (p.98).
Press the SAVE key.
Select what to save
Press the ENTER key.
Save
[System] Screen
Save Dialog
• Waveform Data• Screen Image• Setting Data• Numerical Calculation
Results
: To save a waveform partially, specify a period by using A/B cursors. (Saving a waveform section is not available with Auto Save) To save a screen image, display the de-sired screen before saving.
To save automatically while measuring
To save immediately upon pressing the SAVE key
To save selectedcontents

6.3 Saving Data
97
3
6
Chapter 6 Saving &
Loading Data
Before measuring, configure saving on the [Setting] screen. Waveforms and numerical calculation results can be saved automatically. Folders are created for saved data according to data type, and files are automatically numbered (p.91). For waveform data, folders named with the current date (YY-MM-DD) are cre-ated automatically. Before starting to measure, confirm that Auto Save is config-ured correctly, and that the CF card or USB flash drive is properly installed.
Automatic Saving
Apply
1
2
*1. Otherwise, make advanced settings as needed (p.46).See: "When [Waveform(realtime)], [CSV(realtime)], [Waveform + Calc], [CSV
+ Calc] is selected" (p. 47)*2.The [CSV (real time)] and [CSV + Calc] settings are not available when the
record interval is 10ms or 20ms. Also, when opening a CSV file in a spread-sheet program, note that the number of rows that can be loaded at one time is limited (p. A7). When an option other than [Separator: Comma] has been select-ed on the [System] screen, the file extension will be .TXT rather than .CSV.
To save calculation results automatically, configure calculation settings before starting measurement (p.113).When saving waveforms automatically, horizontal axis display setting is re-stricted when starting measurement, but can be freely adjusted for analysis af-terwards (although 100, 200 and 500 ms horizontal axis settings are automatically changed to 1 s when measurement starts, and cannot be rese-lected while measuring).
Save methods: Off Automatic saving is disabled.Waveform(realtime) *1
Waveform data in binary format is saved to CF card while recording.
CSV(realtime) *1,*2
Waveform data in text format is saved to CF card while re-cording. Saved data cannot be reloaded in the HiLogger.
Calc(post meas.) Calculation results are saved to CF card after recording.When [Repeat] is enabled ([On]), calculation results for each recording are included in the recorded data file.
Waveform + Calc *1
Waveform data in binary format is saved while recording, and calculation results are saved when recording stops.
CSV + Calc *1,*2 Waveform data in text format is saved while recording, and calculation results are saved when recording stops.
Select the desired save method from the [Auto Save] setting options.
After making any other necessary settings, press the START/STOP key.Data is automatically saved to the CF card or USB flash drive when measurement fin-ishes. ("Directory Structure for Saved Data" (p. 92))
3
Displays an estimate of the remaining time avail-able on the attached CF card/ USB flash drive.
Select the [Setting] Screen.

6.3 Saving Data
98
Two manual saving methods are available: [Quick Save] and [Select & Save], both of which offer the same setting options. When saving measurement data, folders are created on the CF card or USB flash drive for each data type, and files are automatically numbered (p.91).
Selecting the Manual Saving Method [Quick Save]/[Select & Save]
Move to a setting item.
Apply
Open the setting options for the item to be set.
Select from the listed op-tions.
1
2Select the [System] Screen.
Selecting [SAVE Key Operation] setting options.Setting options: ( default setting)Select & Save Pressing SAVE displays a dialog. Select the type of contents to be
saved, and save the data. Quick Save Pressing SAVE saves data according to the settings on the [Sys-
tem] screen.
The Save dialog appears.Select from the saving optionsin this dialog.• Save Waveforms (p.99)• Save Screen Image (p.100)• Save Numerical Calculation
Results (p.101)• Save Settings (p.102)
Setting items are displayed.Select your saving options.
[Select & Save]
[Quick Save]

6.3 Saving Data
99
3
6
Chapter 6 Saving &
Loading Data
Waveform data is saved in files named WAVEnnnn.MEM in folders named with the date of recording (YY-MM-DD), created in the [HIOKI_LR8431]-[DATA] folder (p.91).To save a partial waveform, specify the time span to save beforehand (p.86).
Saving Waveform Data (with the SAVE Key)
Set the [Priority media].(CF card/USB flash drive)
Quick SaveSelect & Save
(Before pressing the SAVE key, make settings on the System screen)
(Select from the dialog that appears when you press the SAVE key)
Select [Save] and press the ENTER key.
Select [Yes] in the confirmationdialog, and press the ENTER key.
Select [Waveform], and press the ENTER key.
Select [Waveform] as the [Save Type].
( default setting)For the [Format] setting, select the data saving format.Binary Select this format to be able to reload the saved data into the instrument,
or so that it can be loaded into the Logger Utility program.Text Select this format to save the data as a text file.
From the [Span] setting options, select the portion of the data to save.All *, A-B, Start-A, Start-B, A-End, B-End(All = all acquired waveforms, A = Cursor A, B = Cursor B, Start = start of acquired waveforms, End = end of acquired waveforms)
1
2
1 2
1
2
Set the [Save media].(CF card/USB flash drive)

6.3 Saving Data
100
Captured screen image files are automatically named SCRnnnnn.BMP in a folder named [HIOKI_LR8431]-[PICTURE] (p.91).
Capturing a Screen Image (With the SAVE Key)
Set the [Priority media].(CF card/USB flash drive)
Set the [Save media].(CF card/USB flash drive)
(Before pressing the SAVE key, make settings on the System screen)
(Select from the dialog that appears when you press the SAVE key)
Display the screen to captureSelect [Yes] in the confirmation dia-log, and press the ENTER key.
Select [Screen Image], and press the ENTER key.
Select [Screen Image] as the [Save Type].
Display the screen to capture, and press the SAVE key.
Quick SaveSelect & Save

6.3 Saving Data
101
3
6
Chapter 6 Saving &
Loading Data
Numerical calculation settings are necessary before saving results (p.113).Numerical calculation result files are automatically named MEASnnnn.CSV in a folder named [HIOKI_LR8431]-[MEASUREMENT] (p.91).
Saving Numerical Calculation Results (With the SAVE Key)
Set the [Priority media].(CF card/USB flash drive)
Set the [Save media].(CF card/USB flash drive)
(Before pressing the SAVE key, make settings on the System screen)
(Select from the dialog that appears when you press the SAVE key)
Display the numerical calculation results to be saved.
Select [Yes] in the confirmation dia-log, and press the ENTER key.
Select [Calc Results], and press the ENTER key (p.113).
Select [Calc Results] as the [Save Type].
By specifying a particular time span for numerical calculation, only the results for that time span are saved.
Quick SaveSelect & Save

6.3 Saving Data
102
Setting configurations can be saved as data files and later reloaded into the Memory HiLogger when you need to make more measurements with the same settings. Up to ten setting configurations can be saved to internal memory, and more can be stored on a CF card or USB flash drive.
Saving Setting Configurations
Select [Save Set.].
Apply
The Save dialog appears.
1
2
3Select whether to save to the LR8431-20’s memory or to a CF card or USB flash drive.Apply
4
Setting configuration files are automatically named CONFnnnn.SET in a folder named [HIOKI_LR8431]-[CONFIG] (p.91)To reload a setting configuration (p.103)
(When [Memory] is selected)
Select [Save] for the con-figuration instance (No.) to save.Enter a comment as needed.Apply
(When [CF Card/USB flash drive] is selected)
Comments entered on the [Comment] screen are displayed here.
Select the [Setting] Screen.

6.4 Loading Data on the Memory HiLogger
103
3
6
Chapter 6 Saving &
Loading Data
Previously stored binary waveform data, captured screen images and saved setting configurations can be reloaded into the Memory HiLogger (p.91)
Setting configurations saved in the Memory HiLogger’s memory or on a CF card or USB flash drive can be reloaded. See: "Saving Setting Configurations" (p. 102)
6.4 Loading Data on the Memory HiLogger
Loading a Setting Configuration
Select the [Setting] Screen.
Select [Load Set.].
1
2
Apply
Select the configuration file to load.(CONFnnnn.SET)
Memory HiLogger settings are reconfigured to those in the loaded configuration file.
Apply
The loading dialog appears.
3 Select whether to load a set-ting configuration from LR8431-20’s memory or CF card or USB flash drive.Apply
(If you selected [CF Card/USB flash drive])
When Loading from CF card or USB flash driveConfiguration files stored in the [HIOKI_LR8431]-[CONFIG] folder on the CF card or USB flash drive are displayed.
When Loading from Memory HiLogger MemoryThe list of configurations stored in Memory HiLogger memory is displayed.
4 (If you selected [Memory])
Select [Load] for the con-figuration you want to load.
Apply
To automatically load settings data (auto-setup)Settings data saved under the filename “STARTUP.SET” in the “HIOKI_LR8431”-”CONFIG” folder will be loaded automatically when the instrument is turned on. If settings have been saved on both the CF card and USB flash drive, the CF card’s settings will take precedence. (“STAR-TUP.SET” may not be loaded from USB flash drives that take a long time to be recognized.)

6.4 Loading Data on the Memory HiLogger
104
Binary waveform data or captured screen images can be reloaded into the Memory HiLogger.
Loading Waveform Data and Screen Images
Select the File Screen.
The contents of the CF card are displayed.
1
Apply
The control dialog box appears.
Select a file to load2
(When loading waveforms)When the amount of data in a file to be loaded exceeds the internal memory capacity, you can specify a data point (number) at which to start loading. The loadable data size shows the maximum number of data points that can be loaded. This setting is not needed if the data to be loaded will fit in internal memory. Select [OK] to load the data.
Select [Load].
Apply
3
Displays the parent folder.
Displays the child folder.After selecting a folder by pressing the ENTER key, select [Change] in the displayed control dialog box.
Waveform data file nameWaveform data trigger timeNumber of data points in the fileChannels saved in waveform data to be loaded (Analog, Pulse, and Alarm)Maximum number of data points that can be loaded (to internal memory)Settable range of offset to first data pointTimes of first and last data points to be loaded

6.5 Data Management
105
3
6
Chapter 6 Saving &
Loading Data
You can manage data stored on a CF card r USB flash drive in the Memory HiLog-ger.• Load a file (when the file is selected) (p.103)• Move displayed folders (when the folder is selected) (p.106)• Delete data (p.106)• Rename files and folders (p.107)• Sort files (p.109)• Format a CF card (p.95)• Copy data (p.108)
The following operations can be performed from the control dialog box displayed by pressing the ENTER key from the File screen.
6.5 Data Management
Select the File Screen.1
2 Opens the control dialog box.
Switching removable storage
Select the File screenCF card contents are displayed.
1
2
: When only a USB flash drive is in-serted in the HiLogger, its contents are displayed.
The drive cannot be switched.
Press FILE again.USB flash drive contents are dis-played. Press FILE to toggle between drive A (CF card) and B (USB flash drive).

6.5 Data Management
106
Folder and files on the CF card or USB flash drive can be deleted.
Viewing Folder Contents and the Parent Folder
Select the File Screen.
The contents of the card are displayed.
1
Displays the parent folder.
View child folder (view contents of the currently highlighted folder)(press the ENTER key and select [Folder] in the displayed control dialog box)
2 Select a folder to view.
Deleting Data
• The “HIOKI_LR8431” and “DATA” folders are locked to prevent the inadvertent deletion of data. If you wish to delete these fold-ers, change their names.
• Files whose read-only attribute has been set cannot be deleted. Delete them with a computer or other means.
Select the File Screen.The contents of the CF card are displayed.
1
Apply
Select a file to delete.2
A confirmation dialog appears.Select [Yes] and press the ENTER key to delete.
3Select [Delete].
Apply

6.5 Data Management
107
3
6
Chapter 6 Saving &
Loading Data
Folders and files on a CF card can or USB flash drive be renamed. File names may consist of up to 26 regular characters.
Renaming Files and Folders
Select the File Screen.The contents of the CF card aredisplayed.
1
Apply
Select the file or folder torename.
2
The character entry dialog appears.Enter the new file name (the same way as when entering a comment)(p.60)A confirmation dialog appears.Select [Yes] and press the ENTER key to apply the new name.
3Select [Rename].
Apply

6.5 Data Management
108
Files and folders can be copied between a CF card and USB flash drive.
Copying Data
Select the File Screen.1
Apply
Select a folder or file to copy.2
A confirmation dialog is displayed. Select [Yes] and press ENTER to execute the copy operation.
3Select [Copy].
Apply
What if the file I want to copy is not displayed?See: "Switching removable storage"
(p. 105)See: "Viewing Folder Contents and
the Parent Folder" (p. 106)
Apply
Select the copy destination folder.
4
• Folder copying is supported for up to eight hierarchical levels. Folders more than eight levels deep cannot be copied.
• A file cannot be copied if one with the same name already exists at the destination.
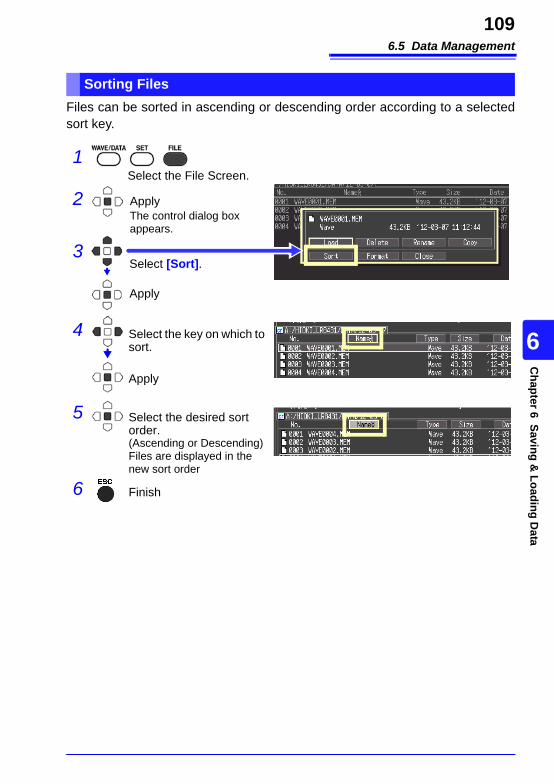
6.5 Data Management
109
3
6
Chapter 6 Saving &
Loading Data
Files can be sorted in ascending or descending order according to a selected sort key.
Sorting Files
Select the File Screen.1
4
3Select [Sort].
Apply
2 ApplyThe control dialog boxappears.
5
6
Apply
Select the key on which to sort.
Select the desired sortorder.(Ascending or Descending)Files are displayed in the new sort order
Finish

6.6 Transferring Data to a Computer (USB Drive Mode)
110
Data saved to a CF card can be transferred to a computer using the supplied USB cable. Before connecting the USB cable to the instrument, set the USB mode on the [System] screen to [USB Drive].To analyze data with the supplied Logger Utility program, refer to the pro-gram’s instruction manual on the CD.See: Appendix 9, "Using the Application Program" (p. A19)
6.6 Transferring Data to a Computer (USB Drive Mode)
Select the USB Drive Mode
Select the [System] Screen.
Select [USB Drive] on the USB mode pull-down menu.
ApplyA confirmation dialog ap-pears.
1
2
3 Select [Yes].
ApplyThe USB Drive Mode is enabled.
No other HiLogger operations are available when the USB Drive Mode is enabled. Also, HiLogger communica-tions with the supplied Logger Utility program are disabled.See: "To exit USB Drive Mode" (p. 111)
4 Connect the USB cable (p.111)
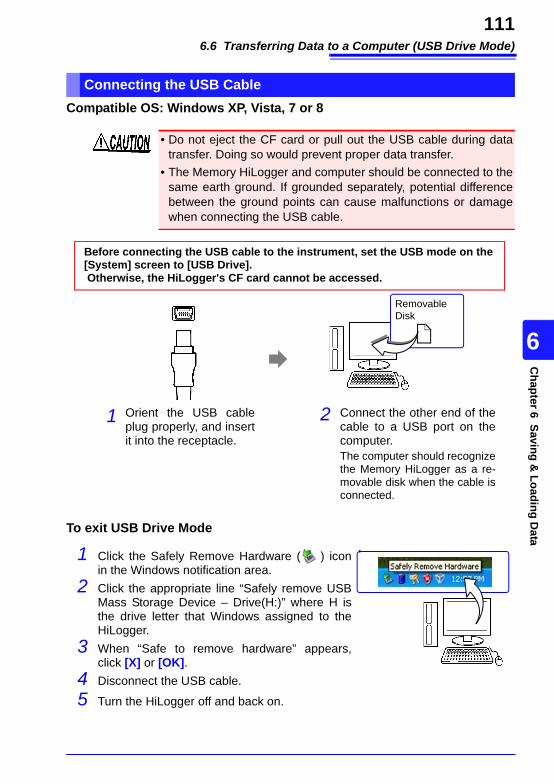
6.6 Transferring Data to a Computer (USB Drive Mode)
111
3
6
Chapter 6 Saving &
Loading Data
Compatible OS: Windows XP, Vista, 7 or 8
To exit USB Drive Mode
Connecting the USB Cable
• Do not eject the CF card or pull out the USB cable during data transfer. Doing so would prevent proper data transfer.
• The Memory HiLogger and computer should be connected to the same earth ground. If grounded separately, potential difference between the ground points can cause malfunctions or damage when connecting the USB cable.
Orient the USB cable plug properly, and insert it into the receptacle.
1 Connect the other end of the cable to a USB port on the computer.The computer should recognize the Memory HiLogger as a re-movable disk when the cable is connected.
2
Before connecting the USB cable to the instrument, set the USB mode on the [System] screen to [USB Drive]. Otherwise, the HiLogger's CF card cannot be accessed.
Removable Disk
1 Click the Safely Remove Hardware ( ) icon in the Windows notification area.
2 Click the appropriate line “Safely remove USB Mass Storage Device – Drive(H:)” where H is the drive letter that Windows assigned to the HiLogger.
3 When “Safe to remove hardware” appears, click [X] or [OK].
4 Disconnect the USB cable.
5 Turn the HiLogger off and back on.

6.6 Transferring Data to a Computer (USB Drive Mode)
112

7.1 Calculation Methods
113
3
7
Chapter 7 N
umerical C
alculations
Calculations can be applied to measured data. Six types of numerical calculation are available, four of which can be applied at the same time. Refer to 7.2, "Numerical Value Calculation Expressions" (p. 117) for details of the calculation methods. You can specify the measurement time span over which calculations are to be applied (p. 116).Types of calculations
Two methods are available for applying calculations, as follows.
Numerical Calculations Chapter 7
7.1 Calculation Methods
• Average value Average value of waveform data• Peak value Peak-to-peak value of waveform data• Maximum value Maximum value of waveform data• Minimum value Minimum value of waveform data• Time to maximum value Time elapsed from the start of measurement to the maximum
value• Time to minimum value Time elapsed from the start of measurement to the minimum
value
Configure numerical calculations before starting measurement. Calculations are per-formed automatically after measurement (p. 114).
Auto Calculation
(Setting Screen)Set Numerical Calculation to [On],
and select the calculation types
To save calculation results automatically(Setting Screen)
Enable Auto Save (p. 97)
Start and finish measuring
Analyze (p. 81)
Configure numerical calculations after measurement (p. 115).
Calculating After Measuring
End of Measurement
(Setting screen or Waveform screen)Set Numerical Calculation to [On], and select the calculation types.
(Waveform Screen)Execute Calculations
Analyze (p. 81)

7.1 Calculation Methods
114
Numerical calculations are performed automatically after measurement.
Auto Calculation
Select the [Setting] Screen.
Select [NumericalCalc.].
Apply
Open the setting options for the item to be set.
Select [On].
1
2
3 Select any of [Calc1] to [Calc4].
Apply
Open the setting options for the item to be set.
Select the calculation type.Calculation types:Average, P-P, Maximum, Minimum, Time To Max., Time To Min., (or Off, the default)
4 Enable Auto Save (if automatic saving is needed)"Automatic Saving" (p. 97)
5
6
Start and finish measuring.
Analyze (p. 81)
The results of numerical calculations are displayed on the Waveform screen.

7.1 Calculation Methods
115
3
7
Chapter 7 N
umerical C
alculations
Manual Calculation
Select the Waveform Screen. You can select it from the [Setting] screen.
Enable (set to [On]) numerical calculation.
1
2
4
Apply
Open the setting options for the item to be set.
Analyze (p. 81)The results of numerical calcula-tions are displayed.The displayed calculation results are determined by the selected cal-culation number.
Start and finish measuring.
5
Select [Exec].
Apply
6
7
Select [Calc1] to [Calc4] and move to the setting options.
3 Select [Wave+Calc] display.
Select the calculation type.Calculation types:Average, P-P, Maximum, Minimum, Time To Max., Time To Min., (or Off, the default)

7.1 Calculation Methods
116
After measuring, calculation can be applied to a specified time span.Make any other calculation settings before specifying the calculation time span (p. 115).
Apply Calculations to a Specific Time Span (Manual Calculation Only)
1
3
Position the A/B cursors to define the calculation time span.To select which cursor to move: (p. 86)
Select the [Span] setting option
2
Apply
Open the setting options for the item to be set.
Select the calculation time spanAll, A-B, Start-A, Start-B, A-End, B-End
Select [Switch to Calc].
Apply
4 Select [Exec].
Apply
The results of calculations are displayed.
Display A/B Cursors.
3
4
When you select [Switch to Calc] the calculation display screen appears, and A/B cur-sor motion is enabled. However, changing to the [Wave+Calc] display hides the A/B cursors (so they are not movable), although the calculation range can still be changed.
• All: The entire acquired waveform• A-B: The time span between cursors
A and B• Start-A:From the start of the acquired
waveform to cursor A• Start-B:From the start of the acquired
waveform to cursor B• A-End: From cursor A to the end of the
acquired waveform• B-End: From cursor B to the end of the
acquired waveform

7.2 Numerical Value Calculation Expressions
117
3
7
Chapter 7 N
umerical C
alculations
7.2 Numerical Value Calculation Expressions
Average
Obtains the average value of waveform data.AVE: Average value n : Data countdi : Data on channel number i
Peak Value(P-P)
Obtains the value of the difference (peak-to-peak value) between maxi-mum and minimum values of waveform data.
MaximumValue
Obtains the maximum value of wave-form data.
MinimumValue
Obtains the minimum value of wave-form data.
Time to maximum value
Acquires the time (s) elapsed from the start of recording to maximum value.When there are two or more maxima, this value is the first to occur.
Time to minimum value
Acquires the time (s) elapsed from the start of recording to minimum value.When there are two or more minima, this value is the first to occur.
AVE1n--- di
i 1=
n
=
Minimum value
Maximum value
Peak Value
Maximum value
Minimum value
Time to maximum value
Maximum value
Recording Start
Time to minimum value
Recording Start
Minimum value

7.2 Numerical Value Calculation Expressions
118

119
3
8
Chapter 8 System
Environment Settings
Settings affecting the clock, SAVE key operation and self testing are made from the System screen.
System Environment Settings Chapter 8
Select the saving method for the SAVE key (p. 98)
(for [Quick Save]) Select the type of data to save (p. 99) Select the time span to save (p. 99)
Save (Storage) Settings (SAVE key) Self Testing KEY/LED test (p. 127) LCD test (p. 127) ROM/RAM test (p. 127) CF card test (p. 127) USB memory check (p. 127)
Select external triggering (p. 131) Insert event marks by external in-
put (p. 89) Set the trigger output (p. 132)
External Control Terminals
System-Related Settings
Select CSV file data decimal and separator characters (p. 123)
CSV File Saving
Set the clock (p. 124) Reinitialize the Memory HiLogger
(p. 125) Transfer data (p. 110) Switch the USB mode (p. 126)
Screen and Key Operation Settings Specify operating behavior when recovering from power outages (Start Backup) (p. 120) Set backlight power saving (p. 121) Set backlight brightness (p. 120) Select black or white screen background (p. 121) Enable or disable the beeper (p. 121) Set the horizontal axis (time value display) (p. 122) Select display language (p. 122)

8.1 Screen and Key Operation Settings
120
If a power outage or other power loss causes an interruption in recording (while the LED on the left side of the START/STOP key is lit), you can automatically resume recording when the power is restored. If you are using triggers, the triggers are restored to the [Waiting for trigger] state.
Backlight brightness can be selected from four levels. Lower brightness settings pro-vide longer battery operating time.
8.1 Screen and Key Operation Settings
Move to a setting item.
Apply
Open the setting options for the item to be set.
Select from the listed op-tions.
1
2Select the [System] Screen.
Using the Auto-Resume Function (Resume After Power Restoration)
Bear in mind that data on the CF card or USB flash drive can be lost if power is disrupted while writing to it.
Adjust Backlight Brightness
Select from the [Start Backup] setting options.
Setting options:( default setting)
Off Do not use the Auto-Resume Function.On Use the Auto-Resume Function.
When the [Backlight Brightness] setting is selected, pressing the ENTER key repeated cycles through the four brightness levels.Setting options: 100%, 70%, 40%, 25%(four-step brightness setting) ( default setting)

8.1 Screen and Key Operation Settings
121
3
8
Chapter 8 System
Environment Settings
A backlight saver can be activated after a specified number of minutes during which no operation key is pressed. The backlight saver turns off the backlight of the LCD, prolonging the lifetime of the backlight by turning it off when not needed.To deactivate the backlight saver, press any key. The operating screen appears again.While the backlight saver is active, the Memory HiLogger’s measuring state is still indicated by the LED (lights green when measuring, and blinks when not measur-ing).
Be aware that power is still consumed even when the backlight is off, so be sure to turn the Memory HiLogger power switch off when not in use.
The screen background can be set to black or white.
The beeper can be set to sound when an error occurs.
Enabling and Disabling the Backlight Saver
Selecting Black or White Screen Background
Select from the [Backlight Saver] setting options.Setting options:( default setting)Off Disables the backlight saver func-
tion. The operating screen is al-ways displayed.
1min, 2min, 3min, 4min, 5min
The backlight saver is activated if the specified time is exceeded.
Black Background White Background
Select from the [Display Color] setting options.Setting options:( default setting)Black* Make background blackWhite Make background white.
Enabling or Disabling the Beeper
Select from the [Beep Sound] setting options.Setting options:( default setting)On Emit a beep sound on error messages (error
and warning displays).Off Do not emit beep sound.

8.1 Screen and Key Operation Settings
122
Select the display method for the horizontal axis at the bottom of the screen.
Select the display language.
Selecting the Horizontal (Time) Axis Display
1d2h3m4s 12-07-01 12:10:30 10
Select from the [Time Disp] setting options.Setting options:( default setting):Time* Displays the time span from the start of
measurement. If triggering is enabled, the displayed time span is from the last trig-ger event.
Date Displays the date and time of data acqui-sition.
Data Pts Displays the number of data points from the start of measurement. If triggering is enabled, the displayed data points begin from the last trigger event.
Selecting the Display Language
Select from the [Language] setting options.Setting options:( default setting)English* Display in English. Japanese Display in Japanese.

8.2 CSV File Saving Settings
123
3
8
Chapter 8 System
Environment Settings
Select decimal point and separator characters for CSV file data.
8.2 CSV File Saving Settings
CSV File Data Decimal and Separator Characters
Select from the [Decimal Mark] setting options.Setting options:( default setting)Dot Select the period character.Comma Select the comma character.
Select from the [Separator] setting options.Setting options:( default setting)Comma Select the comma character.Space Select the space character.Tab Select the tab character.Semicolon Select the semicolon character.
The comma character cannot be selected for both decimal point and separator at the same time. By default, comma is the separator charac-ter, so it is not available as the decimal character. To select comma as the decimal character, first select a different separator character.

8.3 Making System Settings
124
The LR8431-20 is equipped with an auto-calendar, automatic leap year detection, and a 24-hour clock.If the clock is not set to the correct time, measurement start time (trigger time) and file date information will be incorrect. If this occurs, reset the clock.
8.3 Making System Settings
Setting the Date and Time
Select [Clock Setting].
ApplyThe setting dialog appears.
1
2
3
4
Apply
Select an item to change. (year, month, day, hour, minute or second)
Apply
Adjust the setting.
Select [Set].
Apply
The clock is reset.
Change 1’s digit
Change 10’s digit
Select the [System] Screen.

8.3 Making System Settings
125
3
8
Chapter 8 System
Environment Settings
This procedure resets all settings to their factory defaults.The system is reset by pressing and holding the START/STOP key while turning the Memory HiLogger POWER switch on. For details about the factory default settings, see Appendix 5, "List of Default Set-tings" (p. A10).
Initializing all settings (reset all)• If you wish to reset settings stored in the instrumentÅfs memory as well as lan-
guage and USB mode settings, turn on the instrument while holding down the SAVE key and the START/STOP key.
• When the power is switched on, the language selection screen will display for you to choose the language you wish to use.
• After resetting all settings, the USB mode will be set to USB Memory.
Initializing the Memory HiLogger (System Reset)
1
2
3
Select the [System] Screen.
Select [Initialize].
ApplyA confirmation dialog appears.
Select [Yes].
Apply
Initialization proceeds.
Settings stored in the instrument’s memory and language and USB mode settings will not be reset.

8.3 Making System Settings
126
Three USB modes are available: [USB Memory], [USB Communication], and [USB Drive].
Switching the USB mode
Before changing the USB mode, disconnect both the USB com-munication cable and the USB flash drive from the instrument. Failure to do so will cause a message warning you to eject the devices to appear on the screen.
Select the [System] Screen.
Select [USB Memory], [USB Communication], or [USB Drive] from the pull-down menu.
ApplyA confirmation dialog appears.
1
2
3 Select [Yes].
Apply
[USB Memory]
[USB Communication]
[USB Drive]
USB method of use Connector used
[System] screen USB mode setting
Use a USB flash drive. Type A USB Memory (Default)
Communicate with the LR8431-20 and initiate measurement using the Logger Utility software from a com-puter (using a USB cable).
Type B USB Communication
Read files on a CF card that is con-nected to the LR8431-20 from a computer (using a USB cable).
Type B USB Drive

8.3 Making System Settings
127
3
8
Chapter 8 System
Environment Settings
The following self tests are available. Results are displayed on the screen.If any faults are found, have the Memory HiLogger repaired. Contact your dealer or Hioki representative.
Self-Test
1
2Select the self test to perform
Apply
Select the [System] Screen.
Self-Test Details
KEY/LED
Tests the keys and LEDs for correct operation. After every key has been pressed, the KEY/LED check finishes. Pressing the START/STOP key also tests whether the LED lights.
If you notice a malfunction, press the SAVE and START/STOP keys simultaneously to abort the test.
LCD
Tests the screen display (color test, gradation test, character test) The screen changes each time you press an operation key.
If the display screen seems abnormal, request repairs.
ROM/RAM Tests the instrument's internal memory (ROM and RAM)If "NG" appears, request repairs.
CF card Tests whether the Memory HiLogger recognizes the inserted CF card.The CF card is formatted (p. 95)
USB Memory
Tests whether the inserted USB flash drive is recognized by the HiLogger.
When the USB flash drive is recognized by the instrument, its capacity and peak current consumption will be displayed.

8.3 Making System Settings
128

9.1 Connecting to the External Control Terminals
129
3
9
Chapter 9 External C
ontrol
The external control terminals on the Memory HiLogger support trigger signal input and output.
External Control Chapter 9
ALARM (Output)A signal is output whenever the alarm criteria are satisfied (p. 134).
EXT.TRIG (External trigger input)Input external signals (p. 131).
Top View
GND(common with instrument ground)
TRIG.OUT (Trigger output)Output a signal when a trigger event occurs (p. 132).
9.1 Connecting to the External Control Terminals
To avoid electrical hazards and damage to the instrument, do not apply voltage exceeding the rated maximum to the exter-nal control terminals.
I/O terminals Maximum input voltage
Input EXT.TRIG 0 to 7 V DC
OutputTRIG.OUT 30 V DC
5 mA max, 200 mW maxALARM
To prevent electric shock accidents and damage to the equip-ment, always observe the following precautions when making connections to external terminal blocks and external connec-tors.• Before making connections, turn off the power on the
instrument and the equipment to connect.• Do not exceed the specified signal levels for signals sup-
plied to external terminal blocks.• Ensure that devices and systems to be connected to the
external control terminals are properly isolated.

9.1 Connecting to the External Control Terminals
130
• The external control ground terminal is not isolated from the Memory HiLogger’s chassis ground. Make certain that there will be no potential difference between the external control ground terminal and the ground of any connected device. Otherwise, the Memory HiLogger or device could be damaged.
• To avoid electric shock, use the recommended wire type to con-nect to the external control terminals, or otherwise ensure that the wire used has adequate current-handling capacity and insu-lation.
Terminal Connections
Required items:Recommended cables:
Single strand diameter 0.65 mm (AWG22),Multi-strand 0.32 mm2 (AWG22)
Usable cables:Single strand diameter 0.32 to 0.65 mm (AWG28 to 22),Multi-strand 0.08 to 0.32 mm2 (AWG28 to 22)Strand diameter 0.12 mm or greater (per wire)
Standard insulation stripping length: 9 to 10 mmButton operation specified tool: Flat-blade screwdriver
(shaft diameter 3 mm, tip width 2.6 mm)
Single strand
Multi-strand
10 mm
1 Push in the button on the connector with a flat-blade screwdriver or other tool.
2 With the button held in, insert the cable into the cable connection hole.
3 Release the button.The cable is locked.
1
2
3
Top View

9.2 External Trigger Input
131
3
9
Chapter 9 External C
ontrol
Triggering can be controlled by applying a signal from an external trigger source.This allows synchronous operation of multiple Memory HiLoggers by parallel trigger-ing (p. 135).
9.2 External Trigger Input
External signal input(EXT.TRIG)
Trigger event occurs.
Trigger Input SignalsVoltage range HIGH level: 3.0 to 5.0 V, LOW level: 0 to 0.8 VPulse width HIGH level: 1 ms or greater, LOW level: 2 s or greaterMaximum input voltage 0 to 7 V DC
HIGH3.0 to 5.0 V
LOW0 to 0.8 V 2 s or
greater
1 ms or greater
GND2200 pF
470 10 k
5 V
EXT.TRIG
[ ] [ ]
5 V
Signal Input Procedure
1 Connect the external trigger signal source and signal ground to external control terminals 3 (EXT.TRIG) and 1 (GND), respectively.
2 Press the SET key to open the [System]screen.
3 Set the [External Trig In] setting to [Trigger](default setting).
4 Open the [Trig & Alm] screen, and set the [Trig Func] to [On].
5 Specify trigger start and stop times by the [Tim-ing] settings, as needed.
6 Set the [Ext Trig] - [Start] and [Stop] settings to [On].
7 Either short the EXT.TRIG terminal to ground, or apply a pulse train (rectangular wave) to the EXT.TRIG terminal, with 3.0 to 5.0 V High and 0 to 0.8 V Low levels.Triggering occurs on the falling edge of the in-put waveform.
For the connection method (p. 130)
3
45
6

9.3 External Signal Output (Trigger Output)
132
You can output a signal when a trigger event occurs. This allows synchronous oper-ation of multiple Memory HiLoggers by parallel triggering (p. 135).
9.3 External Signal Output (Trigger Output)
Pulse wave isoutput.(TRIG.OUT)Trigger event occurs
Trigger Output Signals
Output signal Open collector output (with voltage output), active LOW
Output voltage range HIGH level: 4.0 to 5.0 V, LOW level: 0 to 0.5 VPulse width LOW level: 10 ms or greaterMaximum input voltage 30 V DC, 50 mA max, 200 mW max
GND
TRIG.OUT
10 k
5 V
10 ms or greater
HIGH4.0 to 5.0 V
LOW0 to 0.5 V
When triggering is not otherwise used, a trigger signal is output during measurement.

9.3 External Signal Output (Trigger Output)
133
3
9
Chapter 9 External C
ontrol
Signal Output Procedure
1 Connect the external trigger signal destination and signal ground to external control termi-nals 2 (TRIG.OUT) and 1 (GND), respectively.
2 Press the SET key to open the [System] screen.
3 Select from the [Trig Out] settings.Setting options: (* default setting)Trig * Output a signal only when a trigger
event occurs. The signal outputs syn-chronized to the setting of the trigger timing.
Start Output a signal even at the start of a measurement that is not a trigger event.
For the connection method (p. 130)
When a trigger event occurs, a pulse wave changing from the HIGH level (4.0 to 5.0 V) to the LOW level (0 to 0.5 V) is output from the TRIG.OUT terminal.
*1.Indicates that in trigger function On, the trigger is set at one of the following - analog channel, pulse channel or external trigger.
Trigger output setting
Trigger setting Trigger timing Trigger output timing
Trig Disabled - no outputEnabled *1
Start Start triggerStop Stop triggerStart/Stop Start trigger/stop trigger
Start Disabled - Start recordingEnabled *1
Start Start triggerStop Start recording/ Stop triggerStart/Stop Start trigger/stop trigger

9.4 Alarm Signal Output (Alarm Output)
134
This signal is output when alarm criteria are satisfied. Specify the desired alarm criteria.See: 4.2, "Alarm Output" (p. 73)
9.4 Alarm Signal Output (Alarm Output)
Alarm signal output(ALARM)
When alarm criteria are satisfied
About the Alarm Output Signal
Output signal Open-drain output (with voltage output), active LOWOutput voltage range HIGH level: 4.0 to 5.0 V, LOW level: 0 to 0.5 VOutput Refresh Every recording intervalMaximum input voltage 30 V DC, 5 mA max, 200 mW max
GND
ALARM
10 k
5 V
For the connection method (p. 130)
Connect the ALARM (No. 4) and GND (No. 1) terminals of the external control terminal block to the signal output line and ground, respectively. When the alarm criteria are satisfied, a Low level (0 to 0.5V) signal is output.
The ALARM pin implements active-low operation. In the example connection, current flows to the coil when there is no alarm output. Choose a relay with a contact architecture that implements the desired operation.
Relay
FET, etc.
GNDGND
ALARM
10 k
5 V DC
Instrument
DC power supply(Provide a DC power supply that accom-modates the relay coil's rated voltage.)
ALARM pin circuit architecture and example relay connection

9.5 Synchronous Measurements with Multiple Instruments
135
3
9
Chapter 9 External C
ontrol
Multiple instruments can be synchronized using the external control terminals.
Parallel synchronizationSet one instrument to master, and set the others to slave.
9.5 Synchronous Measurements with Multiple Instruments
GND
EXT.TRIGTRIG OUTGND
Connection example
EXT.TRIGTRIG OUTGND
EXT.TRIGTRIG OUTGND
Master
Slave
Slave
Set the master instrument.
1 Press the SET key to open the [System] screen.
2 Set the [Trig Out] setting to [Start].
Set the slave instrument.
1 Press the SET key to open the [System] screen.
2 Set the [External Trg In] setting to [Trigger].
3 Press the SET key to open the [Trig&Alm] screen.
4 Set as follows.Trig Func: OnTiming: StartTrig Source Start: ORExt Trig Start: On
Turn the start trigger setting for all the channels (analog, pulse) to Off. Failure to do so may start the measurement without synchronization.
Press the START/STOP key of the slave instrument to start the measurement (trig-ger waiting state). In this state, press the START/STOP key of the master instru-ment to start the measurement. The slave instrument will start the measurement at the same time.
1,2
3,4

9.5 Synchronous Measurements with Multiple Instruments
136

Chapter 10 Specifications
137
3
10
Chapter 10 Specifications
(1) General Specifications
Specifications Chapter 10
Basic SpecificationsNo. of channels (max.)
10 analog channels + 4 pulse channelsStandard product configuration. Pulse grounds share common ground with instrument.
Internal memory capacity
Total 3.5 MW (mega words)
Maximum sampling rate
10 ms/All channels
Timebase accuracy ±0.01%
External terminals External Trigger Input, Trigger Output, Alarm Output and GND
Clock functions Auto calendar, auto leap year judgment, 24-hour timerAccuracy: ±50ppm (0C to 40C), Nominal value: ±10ppm (25C)
Backup battery life Approx. five years for clock and settings (@25°C, 77°F)
Conditions of guaranteed accuracy
After 30 minutes warm-upDefined after zero adjustment has been performed.
Operating tempera-ture and humidity
0 to 40°C (32 to 104°F), 80% RH or less (non-condensating)
Temperature and hu-midity range for guar-anteed accuracy
Temperature 23±5°C (73±9°F), Humidity 80% RH or less (non-con-densating)
Storage temperature and humidity
Temperature -10 to 50°C (14 to 122°F), Humidity 80% RH or less (non-condensating)
Period of guaranteedaccuracy
1 year
Operating environment
Indoors, Pollution degree 2, up to 2000 m (6562-ft.) ASL
Dielectric strength 350 VAC for 15 seconds (between each input channel and chassis, and between input channels)

Chapter 10 Specifications
138
Power source • Model Z1005 AC AdapterRated supply voltage 100 to 240 V ACRated supply frequency 50/60 HzAnticipated transient overvoltage 2500 V
• Model 9780 Battery Pack 3.6 V(Note) The AC Adapter has priority when connected
• The external 12 V DC power source (10 to 16 V DC)• (Note) Wiring from the external power to instrument should be no
more than 3m long
Maximum ratedpower
When using the Z1005 AC adapter: 30 VA (including the AC adapt-er), 10 VA (HiLogger only)When using an external 12 V DC power source: 10 VAWhen using a 9780 Battery Pack 3 VA
Continuous operating time
When using the Model 9780 Battery Pack and saving data to a CF card, approx. 2.5 hours (@25C)
Charging function With the 9780 Battery Pack installed and the AC Adapter connectedCharging time: Approx. 200 minutes (@25°C)Note 1. Actual charging time depends on battery conditionNote 2. Charging temperature range: 5 to 30°C
Dimensions Approx. 176W × 101H × 41D mm (sans protrusions)(6.93"W × 3.98"H × 1.61"D)
Mass Approx. 550g (19.4 oz.) (without Model 9780 Battery Pack)Approx. 620g (21.9 oz.) (With Model 9780 Battery Pack installed)
Effect of radiated radio-frequency electromagnetic field
±5.0%f.s. at 3 V/m
Effect of conducted radio-frequency electromagnetic field
±5.0%f.s. at 3 V
Applicable Standards Safety EN61010EMC EN61326 Class A
EN61000-3-2EN61000-3-3
Basic Specifications
Display SectionDisplay character English/ Japanese selectable
Display type 4.3-in TFT Color LCD (480 × 272 dots)
Display resolution Waveform: Max. 20 divisions (time axis) × 10 divisions (voltage ax-is)(1 division = 20 dot (time axis) × 20dot (voltage axis))Note: The number of displayed time axis divisions depends on the display configuration.
Dot pitch 0.198mm × 0.198mm

Chapter 10 Specifications
139
3
10
Chapter 10 Specifications
External storage
Backlight On, Off
Backlight life span Approx. 10,000 hours (continuously on)
Backlight saver function
Selectable from on, or auto-off after selectable interval
Backlight brightness Selectable from four levels (100%, 70%, 40%, 25%)
Display Section
External InterfacesUSB standard USB2.0 compliant High Speed
Connector Series-mini B receptacle
Connecting devices PC
Function Supports data acquisition using a data acquisition application pro-gram Supports remote setting of measurement criteria using a data ac-quisition application programTransfer files between an installed CF card and connected PC
CF cardSlot One CompactFlash compliant slot
CF Card Type I accepted
Card type Flash ATA card
Card capacities Model 9727 (256MB), 9728 (512MB), 9729 (1GB), 9830 (2GB)
Data formats FAT and FAT32 supported
Storage contents • Setting configurations• Measurement data (binary and csv format)
(data between A-B cursors can be saved)• Screen images (compressed bitmap format)• Calculation results
USB flash driveSupported standard High-speed USB 2.0
Connector Series A receptacle
Data format FAT, FAT32
Storage contents • Setting configurations• Measurement data (binary and csv format)
(data between A-B cursors can be saved)• Screen images (compressed bitmap format)• Calculation resultsFunctionality not available when the USB external interface is in use.

Chapter 10 Specifications
140
Usable device USB flash drive
USB flash drive
CF card/ USB flash drive common functionalityDrive-to-drive copying Files and folders can be copied between drives.
Measurement Input SectionInput terminals M3 screw type terminal block (2 terminals per channel)
Pulse inputs use a special connector
Measurement object • Voltage• Thermocouple (K, J, E, T, N, R, S, B)• Pulse count integration (cumulative and instantaneous), revolu-
tion variations
Measurement ranges and resolution
Temperature measurement input range
K: -200C to 1350C J: -200C to 1200CE: -200C to 1000C T: -200C to 400CN: -200C to 1300C R: 0C to 1700CS: 0C to 1700C B: 400C to 1800C(JIS C 1602-1995)
*1: Upper and lower limits depend on sensor input range
Measurement Object Range Measurable Range Max. ResolutionVoltage 100mV f.s. -100 mV to +100 mV 5 V
1V f.s. -1 V to +1 V 50 V10V f.s. -10 V to +10 V 500 V20V f.s. -20 V to +20 V 1 mV100V f.s. -60 V to +60 V 5 mV1-5V 1V to 5V 500 V
Temperature(thermocouple)
2000C f.s. -200C to 1800C *1 0.1C
Pulse Integration 1,000M pulse f.s. 0 to 1,000M pulse 1 pulseRevolution Variation 5,000/n r/s f.s. 0 to 5,000/n r/s 1/n r/s
n = pulses/revolution, from 1 to 1,000

Chapter 10 Specifications
141
3
10
Chapter 10 Specifications
Measurementaccuracy
• Voltage: ±0.1% f.s. (For the 1-5V range, f.s = 10 V)• Thermocouple:
K, J, E, T: (-200C to less than -100C)±1.5C(-100C or more) ±1.0C
N: (-200C to less than -100C) ±2.2C (-100C or more) ±1.2C
R, S: (0C to less than 300C) ±4.5C (300C or more) ±2.2C
B: (400C to less than 1,000C) ±5.5C (1000C or more) ±2.5C• Reference junction compensation accuracy:
±0.5C (Horizontal placement)±1C (Upright placement)(Add to thermocouple measurement accuracy when internal RJC is enabled.)
Temperature characteristic
Add (Measurement accuracy × 0.1) /°C to measurement accuracy
Reference junction compensation
Internal/External selectable (for thermocouple measurements)
Digital filter Off, 50 Hz, 60 Hz (cut-off frequency set automatically according to recording interval)
Cut-off frequency
Input resistance 1 M±5% (broken wire detection disabled, for voltage and thermo-couple measurements)At least 800 k (with broken wire detection enabled for thermocou-ple measurements)
Normal mode rejection ratio
50dB minimum(with 50 Hz input with 5 s recording interval, and 50 Hz digital filter enabled) (with 60 Hz input with 2 s recording interval, and 60 Hz digital filter enabled)
Measurement Input Section
[Hz]Recording interval
Digital filter Recording interval
Digital filter60Hz 50Hz Off 60Hz 50Hz Off
10ms 11.56k 11.56k
11.56k
1s 108.2 108.2
11.56k20ms 5.78k 5.78k 2s 60 54.0350ms 2.216k 2.216k 5s 60 50100ms 1.096k 1.096k 10s 60 50200ms 542.5 542.5 20s or more 10 10500ms 216.6 216.6

Chapter 10 Specifications
142
(2) Measurement Functions
Common moderejection ratio
with 100 maximum signal source impedance100dB minimum (with 50 or 60 Hz input and digital filter disabled)140dB minimum (with 50 Hz input with 5 s recording interval, and
50 Hz digital filter enabled)(with 60 Hz input with 2 s recording interval, and 60 Hz digital filter enabled)
Broken wire detection
(Temperature input) selectable On or Off, approx. 300 nA detection current
Maximum inputvoltage
30 Vrms or 60 V DC (analog input channel)
Maximum ratedvoltage to earth
30 Vrms or 60 V DC (between each input channel and chassis, and between input channels)Anticipated transient overvoltage 330 V
Pulse input Non-voltage “a” contact (normally open)open collector or voltage input
Maximum input voltage
0 to 10 V DC
Maximum channel-to-channel voltage
Non-isolated(channels use the Memory HiLogger common ground)
Maximum ratedvoltage to earth
Non-isolated(channels use the Memory HiLogger common ground)
Detecting level High: 2.5 V min., Low: 0.9 V max.Pulse input period At least 200 µs (both H and L levels at least 100 µs)Slope Either rising or falling edge pulse detection can be set for each
channelFunction Integrated count, revolution variation
Basic SpecificationsRecording interval 10, 20, 50, 100, 200 or 500 ms; or 1, 2, 5, 10, 20 or 30 s; or 1, 2, 5,
10, 20 or 30 min; or 1 h
Recording length (time span)
Any, with continuous recording selectable
Recording repetition function
Repeatedly measures using the specified recording length
Timer function Records between specified start and stop times
Specifiable waveform colors
24 colors

Chapter 10 Specifications
143
3
10
Chapter 10 Specifications
Hybrid display configurations
• Simultaneous waveform and gauge display • Waveform display • Simultaneous waveform and numerical value display • Simultaneous numerical value and comment display • Numerical value display• Numerical calculation display (simultaneous calculation results
and waveforms) • Cursor value display (simultaneous A/B cursor values and wave-
forms)
Waveform compression and magnification
• Time axis (horizontal axis)100ms, 200ms, 500ms, 1s, 2s, 5s, 10s, 20s, 30s, 1min, 2min, 5min, 10min, 20min, 30min, 1h, 2h, 5h, 10h, 12h, 1day/division
• Voltage axis (vertical axis)×100, ×50, ×20, ×10, ×5, ×2, ×1, ×1/2(switchable to upper and lower limit settings)
Waveform scrolling Horizontal scrolling
Waveform storage The last 3.5 M data points (recording time for one analog channel) are stored in internal memory.Data retained in memory can be observed by backward scrolling.
Basic Specifications
Trigger SectionTrigger method Digital comparison
Trigger timing Start, stop, start&stop
Trigger source Analog input (CH1 to 10), Integrated pulse input (P1 to 4)
External trigger Triggering occurs when the external trigger and ground terminals are shorted, or on falling edges from High (3 to 5 V) to Low (0 to 0.8 V) levels.Maximum input voltage: 0 to 7 V DCMinimum response pulse width: 1 ms H, 2 s L
Trigger criteria AND or OR of each trigger source, Trigger criteria can be set for each channel.
Trigger types (analog and pulse)
• Level TriggerTriggering occurs when the signal rises (or falls) through a specified value.
• Window TriggerTriggering occurs when the input signal level enters or exits the amplitude window defined by upper/lower thresholds.
Trigger level resolution
Analog channel: 0.025%f.s. (f.s. = 10 divisions)Pulse channel: 1c (Pulse count integration), 1/n r/s (revolution)n = pulses/revolution
Pre-trigger Time span setting (any span). Settable with real-time saving.

Chapter 10 Specifications
144
Trigger output Open-collector output (with 5 V output, Active Low)Pulse Width: at least 10 ms You can choose to enable output at trigger activation only or at both trigger activation and measurement start.
Trigger input andoutput terminals
Push-button terminals
Trigger Section
Alarm OutputOutput settings OR, AND
Output occurs when the logical sum (OR) or product (AND) of alarm trigger sources is true.
Alarm Types The following criteria can be specified for each channel.• Level : An alarm is output by input rising above or falling below
a preset level• Window : An alarm is output by input crossing into or out of a win-
dow defined by preset upper and lower trigger levels
Latch setting Alarm output can be set to be held (latched), or not.
Beeper On/Off
Alarm output characteristic
Open-drain output (with 5 V pull-up, active low)
Output refresh At every recording interval
MiscellaneousNumerical calculations
Four calculations are available at the same time
Calculations Average value, peak value, maximum value, Time to maximum value, minimum value, Time to minimum value
Calculation time span
Can be specified by A/B cursors, or whole waveform
Cursor measurement functions
Time difference between A/B cursors, potential difference, potential at each cursor, time
Scaling functions Available for each channel independently
Comment entry Provided
Event mark insertion Event markers can be inserted by screen button or by signal input at the trigger input terminal (exclusive function)
Screen image capture function
Provided (compressed bitmap format)
Retain start condition function
Provided

Chapter 10 Specifications
145
3
10
Chapter 10 Specifications
(3) Miscellaneous
Auto save function Waveform data (real-time), numerical calculation results (after measurement), Power to the instrument must not be interrupted while data is being saved.
Real-time saving Saves real-time waveform data to CF card in binary or csv formatEach recording length can be save in a separate fileOverwriting save is availableUp to 3.5 M data points in binary format can be loaded from a spec-ified point (using one analog channel) Power to the instrument must not be interrupted while data is being saved.
Auto setup function Automatically loads settings from CF card at power on
Monitor function Indicates momentary values without storing data into memory
Waveform backup time function
Memory is retained (backed up) while the Memory HiLogger is turned off when a charged 9780 Battery Pack is present or with the Z1005 AC Adapter connected.
Waveform backup time 100 hours with a 9780 Battery Pack after full charge
Saving of settings Up to 10 setting profiles can be saved in the instrument's memory.
Miscellaneous
Accessories • Measurement Guide ....................................................... 1• CD .................................................................................. 1
(Instruction Manual (PDF), Logger Utility Instruction Manual (PDF), Logger Utility (Data acquisition application program)
• USB cable....................................................................... 1• Z1005 AC Adapter (with supplied power cord) ............... 1
Options • Model 9780 Battery Pack (Ni-MH, 3.6V, 1500mAh)• Model Z1005 AC Adapter• Model 9782 Carrying Case• Model 9812 Soft Case• Model 9641Connection Cable (for pulse input)• Model 9727 PC Card (256MB)• Model 9728 PC Card (512MB)• Model 9729 PC Card (1GB)• Model 9830 PC Card (2GB)• Model 9809 Protection Sheet

Chapter 10 Specifications
146

11.1 Troubleshooting
147
3
11
Chapter 11 M
aintenance and Service
Replaceable Parts and Operating LifetimesUseful life depends on the operating environment and frequency of use. Operation cannot be guaranteed beyond the following periodsFor replacement parts, contact your dealer or Hioki representative.
The fuse is housed in the power unit of the instrument. If the power does not turn on, the fuse may be blown. If this occurs, a replacement or repair cannot be performed by custom-ers. Please contact your dealer or Hioki representative.
Maintenance and Service Chapter 11
11.1 Troubleshooting
Inspection and Repair
Do not attempt to modify, disassemble or repair the instrument; as fire, electric shock and injury could result.
If damage is suspected, check the "Before Returning for Repair" (p.148) section before contacting your dealer or Hioki representative.Transporting• Use the original packing materials when transporting the instru-
ment, if possible.• Pack the instrument so that it will not sustain damage during
shipping, and include a description of existing damage. We can-not accept responsibility for damage incurred during shipping.
Part LifeLCD (to half brightness) Approx. 10,000 hours
Model 9780Battery pack
60% of initial battery capacity can be expected to remain after 500 com-plete charge/discharge cycles.
Battery packconnectors
Disconnection/connection times: 30 (the number of times that provides stable connection)
ElectrolyticCapacitors Approx. 10 years
Lithium BatteryApprox. 5 yearsThe instrument contains a built-in backup lithium battery. If the date and time deviate substantially when the instrument is switched on, it is the time to replace that battery. Contact your dealer or Hioki representative.

11.1 Troubleshooting
148
If abnormal operation occurs, check the following items.
Before Returning for Repair
Symptom Check Items
The display does not appear when you turn the power on.
• Is the power cord disconnected?• Are connections made correctly?• Is the battery pack installed correctly?
Verify that the power cord is connected prop-erly (p.30).Verify that the battery pack is correctly installed (p.26).
Keys do not work. • Is any key being held down?• Is the key-lock state active?
(A message appears when a key is pressed while key-lock is active.)
Verify key operation.Cancel key-lock:(Hold the cursor keys for three seconds)
Power does not turn on.
• A power protection component may be damaged.
Customers should not at-tempt to perform parts re-placement and repair. Contact your dealer or Hioki representative for service.
A waveform does not appear when you press the START/STOP key.
• Is the "Waiting for pre-trigger" mes-sage displayed?
• Is the "Waiting for trigger" message displayed?
• Is the waveform display color selec-tion box selected ( )?
When pre-triggering is enabled, triggering is ig-nored until the pre-trigger portion of the waveform has been acquired. Re-cording starts when a trigger occurs.
No changes occur in the displayed waveform.
• Is the measurement cable connected correctly?
• Is the measurement range set prop-erly?
Verify that the clamp sen-sor or connection cable is connected correctly(p.31).
Data cannot be saved to the re-moval storage.
• Is the removal storage inserted prop-erly?
• Is the removal storage formatted?• Is the remaining capacity of the
removal storage too low?
"Using a CF Card/USB flash drive" (p.93)
If the cause is un-known
• Try performing a system reset (p.125).• All settings are returned to their factory defaults.
Appendix 5, "List of Default Settings" (p. A10)

11.2 Cleaning
149
3
11
Chapter 11 M
aintenance and Service
To clean the instrument, wipe it gently with a soft cloth moistened with water or mild detergent. Never use solvents such as benzene, alcohol, acetone, ether, ketones, thinners or gasoline, as they can deform and discolor the case.Wipe the LCD gently with a soft, dry cloth.
9780 battery pack cannot be charged (CHARGE LED is not lit).
Please confirm that the surrounding tem-perature is within 5 to 30C range.
The temperature allowed for charging on the HiLogger is surrounding temperature of 5 to 30C. (p.26)
Is the HiLogger stored for a long time in a plugged condition?
The battery pack may have deteriorated and the battery life may be expiring soon. (p.147)Please purchase a new battery pack. Please contact your dealer or the nearest HIOKI represen-tative.If the HiLogger is not used for more than a month, please remove the battery pack for stor-age. (p.27)
Time that can be used with the bat-tery pack has be-come shorter.
Possibility of capacity decrease due to the deterioration of the battery pack.
The battery pack may have deteriorated and the battery life may be expiring soon. (p.147)Please purchase a new battery pack.Please contact your dealer or the nearest HIOKI representative.
11.2 Cleaning

11.3 Disposing of the Instrument
150
The instrument contains a lithium battery for memory backup.When disposing of this instrument, remove the lithium battery and dispose of battery and instrument in accordance with local regulations.
11.3 Disposing of the Instrument
Removing the Lithium Battery
To avoid electrocution, turn off the power switch and discon-nect the power cord and cables before removing the lithium battery.
Required tools:• One Phillips screwdriver (No.1) • One wire cutter (to remove the lithium battery)
1
Turn the Memory HiLogger over and remove the five screws affixing the lower case.
2 Remove the lower case. Then remove the two screws affixing the circuit board, and remove it.
Pull the lithium battery up from the cir-cuit board, and cut the two leads with a wire cutter.
3
Lead
Lithium Battery
Circuit board
Verify that the power is off, and remove the measurement cables and power cord.
4
Lithium BatteryUpper case
Lower case
Circuit board
CALIFORNIA, USA ONLYThis product contains a CR Coin Lithium Battery which contains Perchlorate Material - special handling may apply.See www.dtsc.ca.gov/hazardouswaste/perchlorate
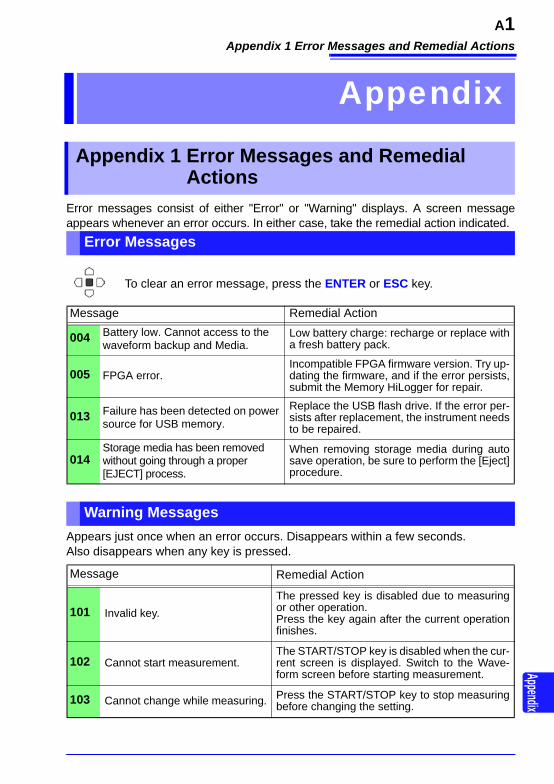
Appendix 1 Error Messages and Remedial Actions
A1Appendix
Error messages consist of either "Error" or "Warning" displays. A screen message appears whenever an error occurs. In either case, take the remedial action indicated.
To clear an error message, press the ENTER or ESC key.
Appears just once when an error occurs. Disappears within a few seconds. Also disappears when any key is pressed.
Appendix
Appendix 1 Error Messages and Remedial Actions
Error Messages
Message Remedial Action
004 Battery low. Cannot access to the waveform backup and Media.
Low battery charge: recharge or replace with a fresh battery pack.
005 FPGA error.Incompatible FPGA firmware version. Try up-dating the firmware, and if the error persists, submit the Memory HiLogger for repair.
013 Failure has been detected on power source for USB memory.
Replace the USB flash drive. If the error per-sists after replacement, the instrument needs to be repaired.
014Storage media has been removed without going through a proper [EJECT] process.
When removing storage media during auto save operation, be sure to perform the [Eject] procedure.
Warning Messages
Message Remedial Action
101 Invalid key.The pressed key is disabled due to measuring or other operation.Press the key again after the current operation finishes.
102 Cannot start measurement.The START/STOP key is disabled when the cur-rent screen is displayed. Switch to the Wave-form screen before starting measurement.
103 Cannot change while measuring. Press the START/STOP key to stop measuring before changing the setting.

Appendix 1 Error Messages and Remedial Actions
A2
201 Exceeding the setting range. The entered numerical value is out of the valid range. Enter a valid value.
204 Measurement range was changed.
When [Type] - [Range] is selected, the mea-surement range is automatically changed to match the upper and lower limits.
230 Recording time has been changed due to memory limit.
Increasing the number of measurement chan-nels has decreased Internal memory waveform data capacity.
231 The pre-trigger time setting has been changed.
Increasing the recording interval or length requires reducing pre-trigger recording time.
232Recording and pre-trigger times have been shortened due to memory limit.
Increasing the recording interval requires reduc-ing recording length and pre-trigger recording time.
233 Trigger or alarm settings for this channel have been changed.
The setting ranges for count integration and revolutions have been changed.
234 The burn out setting has been disabled.
Broken wire detection is disabled (turned Off) when the recording interval is set to 10, 20 or 50 ms, or when the digital filter is disabled.
235 Burn out cannot be enabled with current settings.
Broken wire detection is disabled (turned Off) when the recording interval is set to 10, 20 or 50 ms, or when the digital filter is disabled.
236 File partition period was changed.
The segment time span has been changed in response to changing the recording interval.
237 File partition time was changed. The segment time span has been changed in response to changing the recording interval.
238When the record interval is 10ms or 20ms, the CSV automatic saving cannot be set.
To select [CSV (real time)] or [CSV + Calc] for auto saving, the recording interval must first be set to at least 50 ms.
239Because the CSV automatic sav-ing is set, the record interval cannot be set to 10ms or 20ms.
To select 10 ms or 20 ms recording interval, first select a non-CSV auto saving method.
240 The timer stop time has been passed. Set the timer stop time to a future time.
301 No waveform dataNo waveform data is preset, so data saving and calculations cannot be performed. Press the START/STOP key to start acquiring measure-ment data.
302 Confirm the A-B cursor position. The A/B cursor positions are invalid (out of waveform range). Check the cursor positions.
303 No numeric calculation data Execute numerical calculation (p.113).
304 Invalid event marker. Try moving to an event mark that is not in mem-ory.
Message Remedial Action
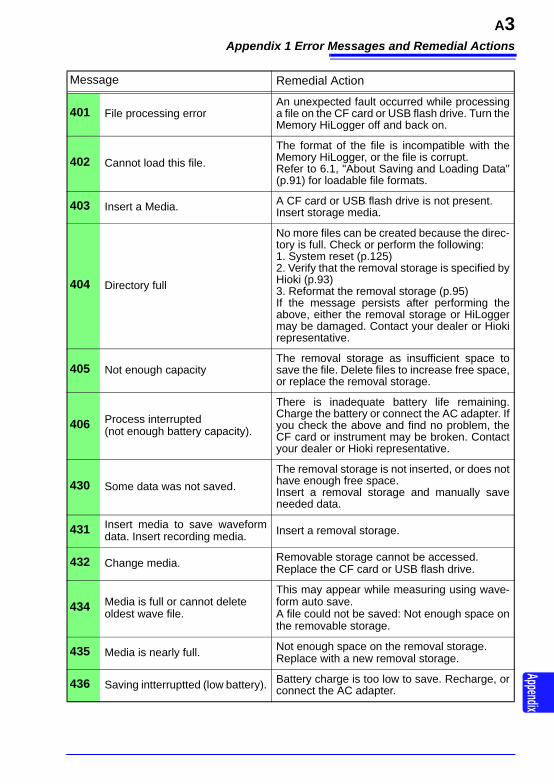
Appendix 1 Error Messages and Remedial Actions
A3Appendix
401 File processing errorAn unexpected fault occurred while processing a file on the CF card or USB flash drive. Turn the Memory HiLogger off and back on.
402 Cannot load this file.The format of the file is incompatible with the Memory HiLogger, or the file is corrupt.Refer to 6.1, "About Saving and Loading Data" (p.91) for loadable file formats.
403 Insert a Media. A CF card or USB flash drive is not present. Insert storage media.
404 Directory full
No more files can be created because the direc-tory is full. Check or perform the following: 1. System reset (p.125)2. Verify that the removal storage is specified by Hioki (p.93)3. Reformat the removal storage (p.95)If the message persists after performing the above, either the removal storage or HiLogger may be damaged. Contact your dealer or Hioki representative.
405 Not enough capacityThe removal storage as insufficient space to save the file. Delete files to increase free space, or replace the removal storage.
406 Process interrupted (not enough battery capacity).
There is inadequate battery life remaining. Charge the battery or connect the AC adapter. If you check the above and find no problem, the CF card or instrument may be broken. Contact your dealer or Hioki representative.
430 Some data was not saved.The removal storage is not inserted, or does not have enough free space.Insert a removal storage and manually save needed data.
431 Insert media to save waveform data. Insert recording media. Insert a removal storage.
432 Change media. Removable storage cannot be accessed. Replace the CF card or USB flash drive.
434 Media is full or cannot delete oldest wave file.
This may appear while measuring using wave-form auto save.A file could not be saved: Not enough space on the removable storage.
435 Media is nearly full. Not enough space on the removal storage. Replace with a new removal storage.
436 Saving intterruptted (low battery). Battery charge is too low to save. Recharge, or connect the AC adapter.
Message Remedial Action

Appendix 1 Error Messages and Remedial Actions
A4
437 Saving wave data.Please wait for a moment.
Some key operations are disabled because of the increased load during real-time saving.Minimize key operations as much as possible during real-time saving.
438 This folder is protected.Please rename for deleting.
This message is displayed to prevent accidental deletion of data folders. To delete a folder, first rename it.
441 Insert the recording media.Unsaved data will be lost soon.
Real-time saving was attempted without remov-able storage, and with less than 50% internal memory available. Insert removable storage.
442 File name is too long to change. The HiLogger cannot rename files with names longer than 26 characters. Use a PC to rename the file.
443 For USB Communication mode, USB memory is not available.
Switch to USB Memory mode on the [System] screen.
450 The save media changed to the CF card.
If the USB flash drive is removed while being used as the save media during auto save oper-ation, the save media will be changed to the CF Card.
451 The save media changed to the USB memory.
If the CF card is removed while being used as the save media during auto save operation, the save media will be changed to the USB flash drive.
501 File system error (I/O error).
An I/O error occurred while accessing the re-moval storage. Reformat the removal storage. If the error persists, try a different removal stor-age.If this error occurs while using a good removal storage, the HiLogger may be damaged, in which case contact your dealer or Hioki repre-sentative.
502 File system error(Incorrect file handle)
Turn the Memory HiLogger off and back on. If the fault persists, perform system reset (p.125).503 File system error
(system configuration)
504 File system error(not enough memory)
505 File system error (incompleted information).
The removable storage could not be recog-nized. Reformat the removable storage on a PC. If the error persists, try a different remov-able storage.If this error occurs while using a good remov-able storage, the HiLogger may be damaged, in which case contact your dealer or Hioki repre-sentative.
Message Remedial Action

Appendix 1 Error Messages and Remedial Actions
A5Appendix
506 File system error(incorrect device)
Turn the Memory HiLogger off and back on. If the fault persists, perform system reset (p.125).
507 File system error(file protected)
The requested write process (including dele-tion) could not be performed because the file at-tribute is read-only. Use a computer to cancel the read-only setting.
508 File system error (failed to recognize the format).
The removable storage could not be recog-nized. Reformat the removable storage on a PC. If the error persists, try a different remov-able storage.If this error occurs while using a good remov-able storage, the HiLogger may be damaged, in which case contact your dealer or Hioki repre-sentative.
509 File system error (limit of the number of files).
The number of files to be processed exceeds the limit, so processing cannot be performed. Delete files to increase free space, or try anoth-er removable storage.
510 File system error(same name file)
An attempt was made to create a file with the same name as an existing file. Change the name of the file to be created (p.107).
511 File system error(system busy)
Processing could not be performed because files are in use by another executing process. Wait for the current process to finish. If there is no other executing process, turn the Memory HiLogger off and back on.
512 File system error (too long path name).
The specified path name is too long. Re-enter the name of a removable storage fold-er from the PC.
513 File system error(no file)
Turn the Memory HiLogger off and back on. If the fault persists, perform system reset (p.125).
514 File system error(mode error)
515 File system error(invalid file handle)
516 File system error(file offset error)
517 File system error (not enough capacity).
Insufficient free space is available on the remov-able storage for the process to execute. Delete files to increase free space, or try another re-movable storage.
518 File system error(invalid file name)
The file name contains an invalid character. Rename the file (p.107).
Message Remedial Action

Appendix 1 Error Messages and Remedial Actions
A6
519 File system error(directory error)
Turn the Memory HiLogger off and back on. If the fault persists, perform system reset (p.125).
520 File system error(invalid file type)
521 File system error(file rename error)
522 File system error(internal parameter error)
523 File system error(block size error)
524 File system error(semaphore error)
525 File system error(not supported action)
680
Now in USB Communication mode.Do not connect anything to USB memory receptacle.(You can choose USB mode on the System screen.)
Disconnect the USB flash drive from the instru-ment. To use a USB flash drive, set the USB mode setting on the [System] screen to [USB Memory] and then connect the USB flash drive.
681
Now in USB Memory mode.Do not connect anything to USB cable receptacle. (You can choose USB mode on the System screen.)
Disconnect the USB communication cable from the instrument. To use USB communication functionality, set the USB mode setting on the [System] screen to [USB Communication] and then connect the USB communication cable.
Message Remedial Action

Appendix 2 File Naming
A7Appendix
File names are constructed as follows (must be exactly eight characters, not includ-ing extension).
Appendix 2 File Naming
W A V E 0 0 0 1 . M E M
1. File Type2. Automatic serial number
3. File Extension
File Type Folder Name 1. File Type 2. Automatic serial number 3. File Extension
Settings Data CONFIG CONF 0001,... 99999999 .SET
Waveform Data
DATA(Folders named by date are au-tomatically cre-ated) *2
Manual Save: WAVEAuto Save: (specified name) or AUTO
0001, ...99999999*1
.MEM (Binary)
.CSV (Text) *3, 4
Numerical Calculation Results
MEASURE-MENT
Manual Save: MEASAuto Save: (specified name) or AUTO
0001, ...99999999 .CSV *3, 4
Captured Screen Im-age
PICTURE SCR 00001...99999999 .BMP
*1 When auto saving waveform data and calculation results, automatically generated serial numbers (up to eight digits) are appended to the specified file name. If no file name is specified, AUTO is automatically entered.(XXXX0001.MEM, XXX00001.MEM, XX000001.MEM, X0000001.MEM)When auto numbering exceeds 9999, the file name characters are overwritten (right to left) until all eight digits are used for serial numbers. (Example: WAVE9999.MEM, WAV10000.MEM, .. )
*2 When [Deleting] is enabled with auto save, the oldest waveform file is deleted when the CF card is full. When all waveform files within a date folder have been deleted, the folder name (date) is automatically updated. (Example:) Before updating: 12-07-17After updating: 12_07_17_120719_101113 (old date_new date _new day and time)Hyphens (-) are changed to underbars (_) and the date when the folder name was last changed is appended.(The example shows a new date and time of July 19th 2012, 10:11:13.)
*3 The TXT file extension is applied except when [Separator:Comma] is selected on the [System] screen.
*4 Before loading data into a spreadsheet program such as Excel, note that the number of rows that can be loaded at one time is limited (to 60,000 rows in Excel 97 – 2003, and to one million rows in Excel 2007).Larger CSV files can be split by the following methods: • Use a CSV file-splitting program (downloadable for free from Hioki's website).• Before saving, select the [Split Save] saving method in the HiLogger.Note: The number of rows recorded per minute with 10 ms recording interval is:100 (data points per second) x 60 (seconds) = 6,000 rows

Appendix 3 Text File (CSV) Internal Format
A8
Text files consist of header and data portions.The header includes the following information related to measurement data.(1) File name and version, (2) Title comment, (3) Start trigger time,(4) Channel setting row content, (5) Channel setting rows, (6) Data row content, (7) Data rows
Appendix 3 Text File (CSV) Internal Format
"File name","WAVE0001.CSV","V 1.00" •••••••(1)"Title comment","" •••••••(2)"Trigger Time","'12-07-01 09:14:03" •••••••(3)"Ch","Mode","Range","Comment","Scaling","Ratio","Offset" •••••••(4)"CH-1","Voltage","100mV","","Off","-","-""CH-2","Voltage","1V","","Off","-","-""CH-3","Voltage","10V","","Off","-","-""CH-4","Voltage","20V","","Off","-","-""CH-5","Voltage","100V","","Off","-","-""CH-6","Voltage","1-5V","","Off","-","-""CH-7","Tc","2000 C","","Off","-","-""CH-8","Tc","2000 C","","Off","-","-" (5)"CH-9","Tc","2000 C","","Off","-","-""CH-10","Tc","2000 C","","Off","-","-""P-1","Count","1000000000c","","Off","-","-""P-2","Count","1000000000c","","Off","-","-""P-3","Revolve","5000r/s","","Off","-","-""P-4","Revolve","5000r/s","","Off","-","-""ALM","Alarm","","","Time","CH-1[V]","CH-2[V]","CH-3[V]","CH-4[V]","CH-5[V]","CH-6[V]","CH-7[C]","CH-8[C]","CH-9[C]","CH-10[C]","P-1[c]","P-2[c]","P-3[r/s]","P-4[r/s]","ALM-CH1","ALM-CH2","ALM-CH3","ALM-CH4","ALM-CH5","ALM-CH6","ALM-CH7","ALM-CH8","ALM-CH9","ALM-CH10","ALM-PLS1","ALM-PLS2","ALM-PLS3","ALM-PLS4","ALM-OUT","Event", •••••••(6) 0.000000000E+00,-1.30000E-04,-5.05000E-03,-5.50000E-02,-1.10000E-01,-5.45000E-01,-5.50000E-02, 3.59000E+01, 3.33000E+01, 3.17000E+01, 3.60000E+01, 0.000000000E+00, 0.000000000E+00, 0.000000000E+00, 0.000000000E+00,0,0,0,0,0,0,0,0,0,0,0,0,0,0,0,0, 1.000000000E+00,-2.15000E-04,-5.25000E-03,-5.55000E-02,-1.10000E-01,-5.45000E-01,-5.50000E-02, 2.62000E+01, 2.36000E+01, 2.28000E+01, 2.97000E+01, 0.000000000E+00, 0.000000000E+00, 0.000000000E+00, 0.000000000E+00,0,0,0,0,0,0,0,0,0,0,0,0,0,0,0,0, 2.000000000E+00, 1.06000E-03,-4.60000E-03,-5.50000E-02,-1.10000E-01,-5.45000E-01,-5.35000E-02, 1.73000E+01, 3.06000E+01, 2.99000E+01, 3.25000E+01, 0.000000000E+00, 0.000000000E+00, 0.000000000E+00, 0.000000000E+00,1,0,0,0,0,0,0,0,0,0,0,0,0,0,1,0, 3.000000000E+00,-2.30000E-04,-3.55000E-03,-5.50000E-02,-1.09000E-01,-5.45000E-01,-5.45000E-02, 5.06000E+01, 4.49000E+01, 4.11000E+01, 5.32000E+01, 0.000000000E+00, 0.000000000E+00, 0.000000000E+00, 0.000000000E+00,0,0,0,0,0,0,0,0,0,0,0,0,0,0,0,0, 4.000000000E+00,-8.50000E-05,-5.05000E-03,-5.55000E-02,-1.10000E-01,-5.45000E-01,-5.50000E-02, 3.49000E+01, 3.28000E+01, 3.17000E+01, 3.56000E+01, 0.000000000E+00, 0.000000000E+00, 0.000000000E+00, 0.000000000E+00,0,0,0,0,0,0,0,0,0,0,0,0,0,0,0,0, 5.000000000E+00,-6.35000E-04,-5.45000E-03,-5.65000E-02,-1.10000E-01,-5.45000E-01,-5.55000E-02, 2.04000E+01, 1.89000E+01, 2.49000E+01, 2.66000E+01, 0.000000000E+00, (7) 0.000000000E+00, 0.000000000E+00, 0.000000000E+00,0,0,0,0,0,0,0,0,0,0,0,0,0,0,0,0, 6.000000000E+00,-1.10500E-03,-5.25000E-03,-5.55000E-02,-1.10000E-01,-5.45000E-01,-5.55000E-02, 2.29000E+01, 2.27000E+01, 2.46000E+01, 2.19000E+01, 0.000000000E+00, 0.000000000E+00, 0.000000000E+00, 0.000000000E+00,0,0,0,0,0,0,0,0,0,0,0,0,0,0,0,0, 7.000000000E+00, 5.85000E-04,-5.10000E-03,-5.55000E-02,-1.10000E-01,-5.45000E-01,-5.60000E-02, 2.73000E+01, 2.53000E+01, 2.45000E+01, 2.31000E+01, 0.000000000E+00, 0.000000000E+00, 0.000000000E+00, 0.000000000E+00,1,0,0,0,0,0,0,0,0,0,0,0,0,0,1,0, 8.000000000E+00, 1.08000E-03,-4.45000E-03,-5.50000E-02,-1.09000E-01,-5.45000E-01,-5.50000E-02, 5.21000E+01, 4.28000E+01, 3.89000E+01, 6.01000E+01, 0.000000000E+00, 0.000000000E+00, 0.000000000E+00, 0.000000000E+00,1,0,0,0,0,0,0,0,0,0,0,0,0,0,1,0, 9.000000000E+00,-2.45000E-03,-5.85000E-03,-5.60000E-02,-1.10000E-01,-5.50000E-01,-5.60000E-02, 2.33000E+01, 2.37000E+01, 2.48000E+01, 2.64000E+01, 0.000000000E+00, 0.000000000E+00, 0.000000000E+00, 0.000000000E+00,0,0,0,0,0,0,0,0,0,0,0,0,0,0,0,0, 1.000000000E+01, 1.05000E-04,-6.35000E-03,-5.65000E-02,-1.11000E-01,-5.50000E-01,-5.65000E-02, 1.06000E+01, 1.39000E+01, 1.58000E+01, 1.28000E+01, 0.000000000E+00, 0.000000000E+00, 0.000000000E+00, 0.000000000E+00,1,0,0,0,0,0,0,0,0,0,0,0,0,0,1,0,

Appendix 4 Binary File Size Calculation
A9Appendix
(Byte units)
File size = Header size + Data size
Header size = Text header size + Binary header size
Text header size = 512 × (4 + no. of analog channels × 2 + no. of pulse channels × 2 + no. of alarm channels × 28)
Binary header size = 512 × (5 + no. of analog channels + no. of pulse channels + no. of alarm channels)
Data size = no. of analog channels × 2 + no. of pulse channels × 4 + no. of alarm channels × 2
You can check an estimate of the remaining time available on the attached CF card/ USB flash drive on the [Setting] screen. (About 90% of the time calculated using the above formulas is displayed as the [Avail-able save time] on the [Setting] screen, reflecting the fact that file and other informa-tion apart from actual data is also stored on the media.)
Appendix 4 Binary File Size Calculation
Displays an estimate of the re-maining time available on the at-tached CF card/ USB flash drive.

Appendix 5 List of Default Settings
A10
When shipped from the factory or initialized to factory defaults, the settings are as follows.
Appendix 5 List of Default Settings
Screen Setting Item Default SettingSetting Interval 10ms
Filter 60 HzTime/DIV 100ms/divCont OnRepeat OffNumerical Calc. Off
Calc1 OffCalc2 OffCalc3 OffCalc4 OffTimer OffAuto Save Off
CH On/Off CH1 to 10 and P1 to 4 all On
Input CH1 to 10: Voltage, P1 to 4: Count
Range 100mVThermo cou-ple K
Burn Out OffRJC IntCount Mode AddPulse/Rev 1Slope Disp Span Position
Zoom Voltage and Revolve: x1, Tc: x20
0 pos Voltage: 50%, Tc and Revolve: 0%
UpperVoltage: 0.05, Temperature: 100, Count and Revolve: 5000
LowerVoltage: -0.05, Tc, Count and Re-volve: 0
Scaling OffStart Trig. OffStop Trig. OffAlarm Off
Trig&Alm
Trig Func OffTiming StartTrig Source
Start ORStop OR
Ext TrigStart OffStop Off
Pre-Trig 0d 0h 0m 0sAlarm Off
Source ORSystem Start Backup Off
Backlight Saver Off
Backlight Brightness 100%
Display Color BlackBeep Sound OnExternal Trig In Trigger
Time Disp TimeLanguage EnglishSAVE Key Operation Select & Save
Decimal Mark DotSeparator CommaUSB memory mode USB Memory
Screen Setting Item Default Setting

Appendix 6 Maximum Recordable Time
A11Appendix
When saving waveform files in the form of binary data to either the instrument's internal memory or the CF card or USB flash drive, maximum recording times are as follows.The indicated times apply when recording all channels. Maximum recording time is inversely proportional to the number of recording channels. Because the header portion of waveform files is not included in these calculations, actual times should be expected to be about 90% of the listed values. Day values beyond 365 are not shown in the table.When saving data in text format (CSV), the maximum recording time is reduced to 1/10 of the value indicated in the table or less.
Appendix 6 Maximum Recordable Time
(d: days/ h: hours/ min: minutes/ s: seconds)
Interval
Recording capacityLR8431-20
internal memory (7MB)
9727(256MB)
9728(512MB)
9729(1GB)
9830(2GB)
10ms 32min 19h 37min 1d 15h 14min 3d 6h 29min 6d 12h 58min20ms 1h 4min 1d 15h 14min 3d 6h 29min 6d 12h 58min 13d 1h 57min50ms 2h 40min 4d 2h 6min 8d 4h 13min 16d 8h 26min 32d 16h 53min100ms 5h 21min 8d 4h 13min 16d 8h 26min 32d 16h 53min 65d 9h 47min200ms 10h 43min 16d 8h 26min 32d 16h 53min 65d 9h 47min 130d 19h 35min500ms 1d 2h 49min 40d 21h 7min 81d 18h 14min 163d 12h 29min 327d 59min1s 2d 5h 39min 81d 18h 14min 163d 12h 29min 327d 59min
2s 4d 11h 18min 163d 12h 29min 327d 59min
5s 11d 4h 16min
10s 22d 8h 33min
20s 44d 17h 6min
30s 67d 1h 39min
1min 134d 3h 18min
2min 268d 6h 36min
5min or more
Maximum Recordable Time = Recording capacity *1 x Recording interval (s)No. of recording channels *2 x 2
*1. Recording capacity: 7 x 1024 x 1024 (for internal memory)*2. No. of recording channels = (no. of analog channels) + (no. of pulse channels x 2) + (alarm
channel)

Appendix 7 Reference
A12
LR8431-20 Measurement Values
Appendix 7 Reference
Model LR8431-20
16 bits0 1 8000 FFFE FFFF
100 mV -OVER -163.835 mV 0.000 mV 163.830 mV OVER
1 V -OVER -1.63835 V 0.00000 V 1.63830 V OVER
10 V -OVER -16.3835 V 0.0000 V 16.3830 V OVER
20 V -OVER -32.7670 V 0.0000 V 32.7660 V OVER
100 V -OVER -163.835 V 0.0000 V 163.830 V OVER
Thermocouple -OVER -3276.7C 0.0C 3276.6C OVER
Model LR8431-20
32 bits0 1 3FFFFFFE 3FFFFFFF
Integration 0 c 1 c 1073741822 c OVERRevolution 0 r/s 1 r/s 1073741822 r/s OVER

Appendix 8 Concerning Noise Countermeasures
A13Appendix
Mechanism of Noise Introduction into Thermocouple Temperature Mea-surementsWhat are the sources of noise?Within a factory, power is provided by large current flows at 50/60Hz. The main loads are primarily L loads, such as motors and solenoids; in addition, large current pulses are produced by capacitor input-type switching power supplies for device such as inverters and high-frequency induction furnaces. Basic wave component leak current, harmonic wave current, and other types of noise become mixed into the flow from each ground point to ground lines.What are the paths of noise propagation?• Common mode voltage introduced between the ground points of the device being
tested and the instrument leaks to the input signal lines• AC magnetic fields produced by current in power lines couple into loops in the
input signal lines• Coupling due to electrostatic capacitance between input signal lines and power
supply linesWhat is common mode noise?Noise that is generated between ground and the "+" and "-" input terminals of the instrument.What is normal mode noise?Inter-line noise that is generated between the "+" and "-" input terminals of the instru-ment.Example of Connections Where Noise Can Affect Measurements
Appendix 8 Concerning Noise Countermea-sures
When using a thermocouple to measure temperature, noise can affect measurements unless both the device being tested and the instrument are grounded.Although there is no problem if the instrument is running on battery power, the instru-ment must be connected to ground if an AC adapter is being used.
Thermocouple
Device being Tested
Instrument

Appendix 8 Concerning Noise Countermeasures
A14
Equivalent Circuit of Noise Introduction Path
Common mode noise results from the interposition of ground impedance between the ground point of the device being tested and the ground point of the instrument, and from capacitor coupling between the ground wire and noise source.Common mode noise is converted to normal mode voltage (Enm) that is added to the "+" and "-" input terminals of the instrument as a result of the noise current (i1) and (i2) that flows to the coupling impedance (Z1) and (Z2) between the "+" and "-" input terminals of the instrument and ground. Because common mode noise is gen-erated between the input pins, it has a direct effect on the measurements.
Inverter or Commercial Power Supply
Electromagnetic Coupling
Signal Voltage Normal Mode Voltage
Coupling Impedance
Instrument
Voltage Generated by Ground Current(common mode voltage)
GroundResistance
Ground Impedance Ground Resistance
Leak current from other devices and ground current flow due to difference in ground potential.
Electrostatic Coupling
Measurements are directly affected by normal mode voltages from electromagnetical-ly induced noise resulting from electromagnetic coupling into looped instrument input lines by AC magnetic fields produced by inverters and commercial power lines, as well as the capacitive coupling that results from interline capacitance.
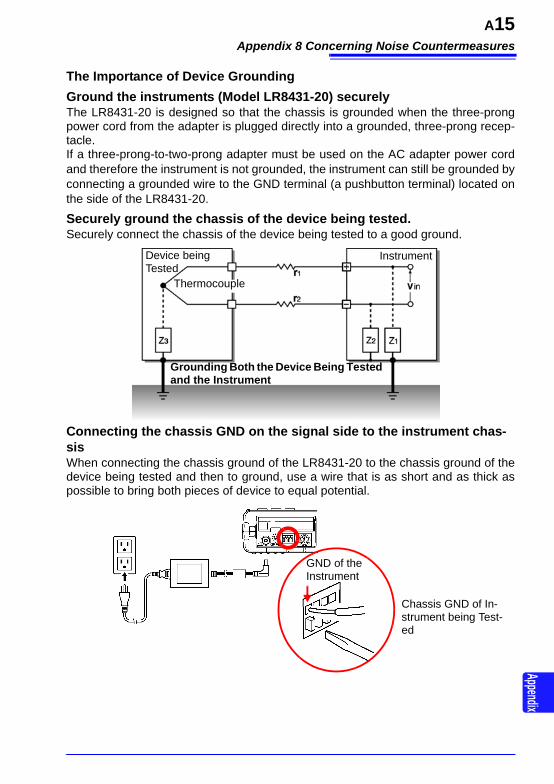
Appendix 8 Concerning Noise Countermeasures
A15Appendix
The Importance of Device GroundingGround the instruments (Model LR8431-20) securelyThe LR8431-20 is designed so that the chassis is grounded when the three-prong power cord from the adapter is plugged directly into a grounded, three-prong recep-tacle.If a three-prong-to-two-prong adapter must be used on the AC adapter power cord and therefore the instrument is not grounded, the instrument can still be grounded by connecting a grounded wire to the GND terminal (a pushbutton terminal) located on the side of the LR8431-20.
Securely ground the chassis of the device being tested.Securely connect the chassis of the device being tested to a good ground.
Connecting the chassis GND on the signal side to the instrument chas-sisWhen connecting the chassis ground of the LR8431-20 to the chassis ground of the device being tested and then to ground, use a wire that is as short and as thick as possible to bring both pieces of device to equal potential.
Thermocouple
Device being Tested
Instrument
Grounding Both the Device Being Tested and the Instrument
Chassis GND of In-strument being Test-ed
GND of theInstrument

Appendix 8 Concerning Noise Countermeasures
A16
Running the instrument (Model LR8431-20) on battery powerWhen the instrument is being powered by batteries and the AC adapter is not con-nected, the ground current loop is eliminated, making it possible to reduce the effects of common mode noise.For measurements of short duration, powering the LR8431-20 with batteries is an effective method for eliminating noise.Common Mode Noise Countermeasures
Connect the chassis GND on the signal side to a good ground with a sufficiently low ground resistance. If there is still a large amount of noise, it may be possible to re-duce the effects of common mode voltage by connecting a bypass ground wire to the GND terminal on the instrument.
Noise current (i1) and (i2) can be sup-pressed by suppressing the common mode voltage with a low-resistance ground wire or a bypass between ground poles. This suppresses the generation of normal mode voltages and reduces the effect on measurements.
Inverter or Commercial Power Supply Electro Magnetically Induced
Noise
Electrostatic Inductance Noise
Ground Wire
Coupled Impedance
Normal Mode Voltage
Voltage Generated by Ground Current(common mode voltage)
Ground Impedance
Device being Tested
Instrument
Thermocouple
If it is not possible to simply ground the instrument or the signal side, connect a ground wire between the chassis GND of the instrument and the signal side to equalize ground potentials. A basic requirement for obtaining stable measurements is to ground the de-vice.
Ground Wire

Appendix 8 Concerning Noise Countermeasures
A17Appendix
Blocking Noise from External SourcesKeep signal lines away from noise sourcesKeep input signal lines (of the thermocouple) away from wiring that is a noise source (such as power lines, etc.), and make any permanent installation with as much sep-aration as possible; for example, by running wires through a separate duct.Use shielded twisted pair wiringIt is effective to use shielded twisted pairs for the input signal lines (of the thermo-couple). Twisted pairs are effective for preventing electromagnetic induction, and shielded wires are effective for preventing electrostatic induction.The shielded wires should basically be grounded on the signal source side. If it is not possible to connect the signal source to ground, connect it to the chassis GND on the LR8431-20. Note that doing so has no effect if the LR8431-20 is not itself con-nected to ground through the three-prong power cord, etc.Shielded twisted pair wires for the thermocouple can be obtained from thermocouple manufacturers.Normal Mode Noise Countermeasures
Power Supply LineElectromagnetic Coupling
Electrostatic Coupling
Inverter or Commercial Power Supply
ShieldedTwisted Pair Wires
The shielding for the signal lines is grounded on the signal side
Keep the signal lines (of the thermocouple) away from wiring that is a noise source (such as power lines, etc.). It is also possible to shield the signal lines from elec-trostatic coupling and to block noise by grounding the shield.
Device being Tested
Instrument
Thermocouple
If the signal side is not grounded or if it is grounded inadequately, connect the instru-ment to ground. Also ground the shielding for the signal wires on the instrument side securely.
Ground Wire

Appendix 8 Concerning Noise Countermeasures
A18
Insulation from noise sources (temperature measurement by thermocou-ple)The analog input channels are insulated from the chassis and each other. Therefore, the instrument allows you to attach the thermocouple directly to a conductor with a potential to measure it, provided that the voltage to ground does not exceed the maximum rating. If noise is likely affect measurement, wrap heat-resistant tape around the thermocouple for insulation, or use an ungrounded thermocouple and electrically insulate the input line.
Setting the Digital FilterTo remove noise from input signals, the digital filter can be set for the analog chan-nels.The longer the recording interval is, the larger the noise reduction effect becomes; this ensures highly accurate measurement with little scatter.See: For recording interval and cutoff frequency (p.141)For example, assuming that the digital filter is set to 60Hz, noise reduction in the supply frequency is maximized at a recording interval from 2 sec. to 1 hr.
Inserting a Capacitor in the Signal LineWhen noise affects the signal source directly or when measuring high-frequency pulses, it is effective to insert a capacitor between the "+" and "-" input terminals so that the noise does not enter the LR8431-20. When inserting a capacitor, use one with a rated voltage that is equal to or exceeds the input voltage.When a capacitor is inserted between the "+" and "-" input terminals, there are no restrictions on the recording interval because the filter is applied before the channel scan operation.
The capacitance of the capacitor should range from several F to several thousand F. Insert the capacitor between the "+" and "-" in-put terminals.
Thermocouple
Device being Tested
Instrument

Appendix 9 Using the Application Program
A19Appendix
The following features are available when using the supplied computer application program.
The Logger Utility application program needs to be installed on the computer before use. A USB driver also needs to be installed on the computer to enable communica-tions with the Memory HiLogger. The application program can be installed from the supplied CD, or you can download the latest version from the Hioki web site. Use the following procedure to install the software on the computer. Verify operating environment compatibility before installing. For details such as application program operating instructions, read the instruction manual (PDF file) provided on the CD.
Appendix 9 Using the Application Program
Display on the computer screen waveform files that were saved to CF card or USB flash drive on the Memory HiLogger.Convert binary data to CSV format for import-ing to spreadsheet programs on the computer.
Configure Memory HiLogger settings on the computer, and transfer to the Memory HiLogger.
Search event marks and mea-surement data using various criteria such as maxima and fluctuation values.
Acquire batch measurement data in real time from up to five HiLoggers on one computer using USB connections. Moni-tor waveforms, numerical val-ues and alarm output status in real time while measuring.
Operating Environment• OS:
Windows 2000 (with SP4 or later) Windows XP (with SP2 or later)Windows VistaWindows 7Windows 8
• CPU: Pentium III (500 MHz) or better• Monitor Resolution: 1024 x 768 dots or
better• Internet Explorer: 6.0 or better• Memory: At least 512 MB• Interface: USB
1 Set the CD into the drive of the computer.
2 Install Logger Utility (p. A20).
3 Install the USB driver (p. A23).
4 Connect the AC adapter to the in-strument and turn on the power.
5 Set the USB mode to [USB Com-munication] on the [System] screen.
6 Connect the instrument and com-puter with the USB cable (p. A26).
Because the USB mode on the [System] screen must be set to [USB Communication], it is not possible to record data to or load data from a USB flash drive while using the Logger Utility applica-tion software. The [USB Memory], [USB Communication], and [USB Drive] USB mode settings are exclusive and cannot be used simultaneously.

Appendix 9 Using the Application Program
A20
Follow the procedure below to install Logger Utility. This explanation is for installing the software on Windows XP. The messages displayed may differ slightly depending on other operation system or settings you are using.
Installing Logger Utility
ImportantIf you are running software such as antivirus software, be sure to end the soft-ware before you start the installation. The installation may not be performed properly if antivirus software is running.
1 Start up Windows.
Exit all running applications.
2 Insert the included CD into the computer's CD-ROM drive, the installer run automatically.
If the installer do not start, execute "setup.exe" from the CD-ROM drive.
If the installer do not start, exe-cute "setup.exe" from the CD-ROM drive.In Vista, Although the dialog which ask for installation permis-sion of application, click [Allow].
Click

Appendix 9 Using the Application Program
A21Appendix
3 In the installer, click [Next]and confirm the installation destination.
The end user license agreement is displayed.Read the EULA, then select [Agree], and click [Next].
The installation destination folder can be changed on this screen.
If you are not changing the instal-lation destination, click [Next].
To change the installation desti-nation, click [Browse] to select another folder.
Click
Click

Appendix 9 Using the Application Program
A22
4 Click [Next] to start install-ing.
Installation starts.
Progress is displayed during in-stallation.
To interrupt installation in progress, click [Cancel].
Installation finished
Click
Click

Appendix 9 Using the Application Program
A23Appendix
Install the USB driver before you use the instrument with a USB connection.
Installing the USB Driver
1 (Insert the CD found in the package into the CD-ROM drive.)Install the driver.• Run [SetupDriver32.msi] in the CD.
If [Logger Utility] is already installed, run the CD from the following location.[c:\Program Files\HIOKI\LoggerUtility\Driver\SetupDriver32.msi]
If you are using the WindowsVista/7/8 64bit version:• Run [SetupDriver64.msi] in the CD.
If [Logger Utility] is already installed, run the CD from the following location.[c:\Program Files(x86)\HIOKI\LoggerUtility\Driver\SetupDriver64.msi]
Depending on the environment, the dialog box may take some time to appear so please wait till it does so.
2 Click [Next].
3 Check [Next].
When you want to change the in-stallation destination, click [Browse…] to change the folder to install into. Normally, there is no need to change.
Click
Click

Appendix 9 Using the Application Program
A24
4 Click [Next].
Start installing.
Installing.
For WindowsXPDuring the installation, a mes-sage saying that the software has not passed Windows Logo testing will appear a few times, click [Continue Anyway] to continue installing.
Click
Click

Appendix 9 Using the Application Program
A25Appendix
For WindowsVista/7/8When a dialog box requesting your permission to continue the program appears, click [Con-tinue].
Sometimes another dialog box requesting your permission to install the software may ap-pear. When it does, check “Al-ways trust software from “HIOKI E.E. CORPORA-TION”and click [Install] to con-tinue.
5 When installation is com-pleted and the dialog box appears, click [Close] to exit.
This completes the driver in-stallation.
Click
1 Click 2 Click
2 Click

Appendix 9 Using the Application Program
A26
Install the USB driver before you use the instrument with a USB connection. (p. A23)
Connecting the Memory HiLogger to the Computer with a USB Cable
• Do not pull out the USB cable during data transfer. Doing so would prevent proper data transfer.
• The Memory HiLogger and computer should be connected to the same earth ground. If grounded separately, potential difference between the ground points can cause malfunctions or damage when connecting the USB cable.
Orient the USB cable plug properly, and insert it into the receptacle.
1 Connect the AC adapter to the instrument and turn on the power.
2
Connecting with the HiLoggerthe first time
For Windows2000/Vista/7/8The HiLogger will be recognized automat-ically and the device will be ready to use.
For WindowsXPA “Found New Hardware Wizard” dialog box will appear and the new hardware de-tection wizard will begin (next page ).
The HiLogger is alreadyrecognized
Start the Logger Utility (p. A29)
Connect the other end of the cable to a USB port on the computer.
3
Set the USB mode on the [System] screen to [USB Communication] before con-necting the USB cable to the instrument. Connecting the USB cable without en-abling USB Communication mode will prevent the instrument from being able to communicate with the Logger Utility.

Appendix 9 Using the Application Program
A27Appendix
WindowsXP
1 Connect the instrument and computer with the USB cable.After the "Found New Hardware" window appears, the [Found New Hardware Wizard] dialog box will appear.
2 Check “No, not this time” and click [Next].
3 Check “Install the software automatically (Recom-mended)” and click [Next].
Please wait while the driver is being installed.
1 Click
2 Click
1 Click
2 Click

Appendix 9 Using the Application Program
A28
4 A message saying that the software has not passed Windows Logo testing will appear a few times, click [Continue Anyway] to con-tinue installing.
5 When installation is com-plete, the next dialog will appear. Click [Finish].
This completes the driver in-stallation.
Click
Click

Appendix 9 Using the Application Program
A29Appendix
Starting Logger UtilityFrom the Start Menu of Windows, click [All Programs] - [HIOKI] - [Logger Utility] - [Logger Utility].
Ending Logger UtilityClick [Exit Application] from the File menu of the main screen. Alternatively, you can click the [x] close button at the top right of the main screen.
Use the following procedure to uninstall the program.
Starting and Ending Logger Utility
Click
Click
Logger Utility starts with the settings in the same state as when the software was last ended. When you want to initialize the settings, click [Initialize All Settings] from the File menu.
Uninstalling the Logger Utility
1 From the Windows Start menu, select the [Control Panel], and double click [Add or Remove Programs].
2 From the list of installed programs, select [Logger Utility], and remove it.You are returned to the [Add or Remove Programs] screen.Settings files are not deleted during uninstall, so if no longer needed, delete them man-ually.
The [Add or Remove Programs] screen appears.
2 Click
1 Click
3 Click

Appendix 10 Frequently Asked Questions
A30
Here are some common questions and answers about the HiLogger.
Appendix 10 Frequently Asked Questions
Installation and Settings
Question Remedial Action Reference page
How to measure the tempera-ture of an object having ap-plied voltage?
The instrument provides this func-tionality. Since the maximum chan-nel-to-channel and channel-to-ground voltage is 30 Vrms AC or 60 V DC, exercise caution not to ex-ceed those levels. When exceeding them, take steps to prevent the volt-age from being applied to the instru-ment, for example by using an ungrounded thermocouple.
Precautions in 2.3, "Connecting Mea-surement Cables to the Memory HiLog-ger" (p.31)
What is the maximum measur-ing time using the battery pack?
The maximum measuring time is about 2.5 hours (25C reference val-ue when saving data to a CF card). When using a USB flash drive, note that the amount of time that mea-surement can be performed with the battery pack may be shortened de-pending on the USB flash drive be-ing used.
2.1, "Using the Bat-tery Pack (Option)" (p.26)
What is the power consump-tion?
Normal consumption is about 3.5 VA, and maximum (while charging the battery with maximum LCD brightness) is 10 VA.
"Maximum rated power" (p.138)

Appendix 10 Frequently Asked Questions
A31Appendix
Can recording resume auto-matically after a power outage?
Enable Auto Resume. Recording will automatically resume after a power outage.Because data measured before the outage is not retained in internal memory, we recommend enabling auto saving to removable storage.However, if the power goes out dur-ing real-time save operation, the data on the CF card may be corrupt-ed. It is recommended to back up the power supply with the battery pack. However, data on the CF card may still be corrupted if the battery pack power supply fails during an extended power outage. High-end LR8400 series instru-ments use a built-in, high-capacity capacitor to perform file termination processing in the event of a power outage, allowing them to save data up to the time of the outage.
"Using the Auto-Re-sume Function (Re-sume After Power Restoration)" (p.120)
If battery power fails while the instrument is being powered by the battery, will recording re-sume when AC power is re-stored?
When battery power fails while the instrument is being powered by the battery, the instrument will not turn back on until the power switch is cy-cled from OFF to ON. A high-end LR8400 series instrument is recom-mended for applications requiring this type of operation.
2.1, "Using the Bat-tery Pack (Option)" (p.26)
How to minimize thermocouple measurement error when mov-ing the HiLogger between plac-es with much different temperatures?
For thermocouple measurements, terminal temperature is measured by an internal sensor to provide ref-erence junction compensation. When the ambient temperature changes abruptly, or when air blows directly on the terminals, errors oc-cur due to thermal imbalance be-tween the terminals and emperaturesensor. When the HiLogger is moved to a lo-cation with significantly different am-bient temperature, allow at least 30 minutes for thermal equalization be-fore measuring.
"Instrument Installa-tion" (p.6)
Question Remedial Action Reference page

Appendix 10 Frequently Asked Questions
A32
When connecting a thermo-couple directly to the HiLog-ger, should reference junction compensation be set to exter-nal (EXT) or internal (INT)? How is accuracy affected?
Select INT when connecting a ther-mocouple (or compensating leads) directly to the HiLogger. Overall measurement accuracy is the sum of the accuracies of the thermocouple and the reference junction compensation (RJC).Example: When measuring a tem-perature from -100C to 1,300C with a K thermocoupleThe measurement accuracy is ±1.5C, obtained by adding the ref-erence junction compensation accu-racy of ±0.5C to the temperature measurement accuracy of ±1.0C.
"Temperature Mea-surement Settings" (p.51)
How to display only CH1 to CH3?
Select only the channels to be used on the Input Channel Settings dis-play. To acquire data without dis-playing it, select × as the waveform display color.
3.4, "Setting Configu-ration 2 – Input Chan-nel Settings" (p.49)"Selecting Waveform Display Color" (p.56)
I am measuring humidity with a converter that converts 0 to 100% RH to 1 to 5 V. How can I read humidity directly?
Set the scaling method to [2-pt], and enter the values.(1:1 conversion 0, 2:5 conversion 100, units: %RH)
"Converting Units (Scaling function)" (p.58)
Triggering
Question Remedial Action Reference page
Why does measurement not start when "Wating for trigger" is displayed?
Triggering is enabled. To start re-cording immediately with the START key, disable all trigger crite-ria or the trigger function on the [Trig & Alm] screen.
4.3, "Confirming Trig-ger and Alarm Crite-ria Settings (List)" (p.75)
How to acquire data before a trigger?
Enable pre-triggering to acquire data before trigger events.
"Setting Criteria for Pre-Trigger Record-ing (Pre-Trig)" (p.72)
Question Remedial Action Reference page

Appendix 10 Frequently Asked Questions
A33Appendix
How can I acquire data contin-uously starting on 1/4/2012, daily from 9:00 to 17:00, for one month?
Set as follows:Measurement Criteria[Interval]-[Cont]: Off, 8 hr 0 min 0 s[Repeat]: On Timer[Start]: On, 12 Year, 4 Mon, 1 Day, 9 Hour 0 Min 0 Sec[Stop]: On, 12 Year, 5 Mon, 1 Day, 9 Hour 0 Min 0 Sec[Interval]: On, 1 Day, 0 Hour 0 Min 0 Sec
3.3, "Setting Configu-ration 1 – Recording Settings" (p.42)4.4, "Starting and Stopping Recording by Timer" (p.76)
Is it possible to measure on 20 channels using two synchro-nized HiLoggers?
Measurement start can be synchro-nized using an external trigger. Sampling cannot be synchronized.
9.5, "Synchronous Measurements with Multiple Instruments" (p.135)
Question Remedial Action Reference page
Measuring
Question Remedial Action Reference page
What should I do about zero offset when the input is short-ed?
Execute zero adjustment to com-pensate for offset when the inputs are shorted.
2.5, "Zero Adjust-ment" (p.35)
Even though a signal is only in-put on CH1, why do similar waveforms appear on unused channels?
An open-circuit input terminal can be affected by signals on other chan-nels. By closing the input terminal circuit, normal measurement is pos-sible. If this is impractical, disable unused measurement channels, or short the + and - terminals together.
How to display numerical data values?
Press WAVE/DATA repeatedly to cycle through the Waveform (only), Waveform + Numerical Values, and Numerical Values (only) displays.Numerical values can be displayed in a large font on the enlarged nu-merical display.Numerical values at specific loca-tions can be displayed using A/B cursors.
1.4, "Screen Configu-rations" (p.18)"Displaying Cursor Values" (p.84)"Viewing Input Sig-nals as Numerical Values" (p.87)
What happens to pulse inte-gration when there are more than one million pulses?
The counter saturates at 1,073,741,823 counts. If you expect to exceed this count, we recommend measuring with the Integration Mode ([Count]) set to Instantaneous([Inst]), and summing later with a spreadsheet program.
"Integration (Count) Measurement Set-tings" (p.53)

Appendix 10 Frequently Asked Questions
A34
What is the timing difference between CH1 and CH2?
When the [Filter] is Off, the time dif-ference between data on neighbor-ing channels is about 780 s, regardless of recording interval. When the [Filter] is enabled (50 or 60 Hz), the time difference increases with longer recording intervals.
How can I apply markers while measuring for easy searching later?How can I search for alarm event locations?
Event marks can be applied by the following methods.• Press the on-screen [Make
Mark] button.• Apply a signal to the EXT.TRIG
terminal
5.3, "Inserting Event Marks (Search Func-tion)" (p.88)
Question Remedial Action Reference page
Data Saving
Question Remedial Action Reference page
Can after-market CF cards be used?
Operation cannot be guaranteed.Please use a Hioki-specified card to avoid problems.
6.2, "Using a CF Card/USB flash drive" (p.93)
Can after-market USB flash drives be used?
They can be used, although for real-time saving, we recommend using a Hioki-specified CF card option for data protection. Operation can only be guaranteed for Hioki CF card op-tions. Also, USB flash drive security features such as fingerprint authen-tication are not supported. Use a USB flash drive whose continuous current consumption does not ex-ceed 300 mA (peak 500 mA). (The peak value is displayed as "Max Power" under the USB flash drive self-test on the [System] screen.)
6.2, "Using a CF Card/USB flash drive" (p.93)
Can removable media be re-placed while measuring?
Yes. Put the cursor on the [EJECT] button at the lower right of the screen, press ENTER, and remove the media following the displayed message.
"Replacing Remov-able Storage During Real-Time Saving" (p.48)
How much recording space is available?
It depends on setting conditions (number of channels and recording interval).About 327 days of recording is pos-sible using 10 analog channels at 1 s recording interval to 1 GB media.
"Appendix 6 Maxi-mum Recordable Time" (p. A11)

Appendix 10 Frequently Asked Questions
A35Appendix
How can I process acquired data later with a spreadsheet program?
Auto-saved files recorded in [Wave-form(realtime)] mode to removable storage can be quickly and conve-niently converted to a text (CSV) file with the Utility Logger rogram, which can then be loaded into a spread-sheet program.Auto-saved files recorded in [CSV(realtime)] mode can be direct-ly loaded into a spreadsheet pro-gram, but note that the data cannot be reloaded into the HiLogger.
"Automatic Saving" (p.97)
How can I load data from a CF card onto the PC when it has no CF card slot?
Data can be transferred to a PC us-ing the supplied USB cable and the USB Drive mode.
6.6, "Transferring Data to a Computer (USB Drive Mode)" (p.110)
How can I create files every hour, from 0:00 (ideal split time)?
Set auto-saving [Split Save] to Peri-odic ([Ref Time]).
”Automatic Save”(p.47)
What is the file limit when auto saving to removable storage?
Depending on file size and CF card capacity, more than 1,000 files can be saved in one folder, although only 1,000 can be displayed on the file screen. As the number of files increases, the time required to start and stop mea-surement also increases, so we rec-ommend storing no more than 1,000 files, if possible.(When saving, a folder named "HIOKI_LR8431" is created, and files with different data types are saved in subfolders within it.)
6.1, "About Saving and Loading Data" (p.91)
Is data retained in internal memory when I turn the power off after measuring? I did not use auto saving to re-movable storage.
If the instrument is turned off with a 9780 Battery Pack with remaining power connected or the Z1005 AC Adapter connected, waveform data will be backed up to the instrument's internal memory. For the LR8431-20 with a fully charged 9780 Battery Pack, the waveform backup time is 100 hours.
"Waveform backup time function" (p.145)
Question Remedial Action Reference page

Appendix 10 Frequently Asked Questions
A36
If the power goes out while measurement is in progress, is the integrity of data being saved in real time to the CF card guaranteed?
If the power goes out during real-time save operation, the data on the CF card may be corrupted. It is rec-ommended to back up the power supply with the battery pack. Howev-er, data on the CF card may still be corrupted if the battery pack power supply fails during an extended pow-er outage. High-end LR8400 series instru-ments use a built-in, high-capacity capacitor to perform file termination processing in the event of a power outage, allowing them to save data up to the time of the outage.
2.1, "Using the Bat-tery Pack (Option)" (p.26)
Why is only part of the data saved when saving to remov-able storage after measuring?
When a save range has been set with the A and B cursors, only the selected range is saved. Only data remaining in the instrument's inter-nal memory (the last 3.5 M of data) will be saved after measurement.
To save data in excess of that 3.5 M of data, enable the auto save (real-time) setting prior to measurement.
"Specifying a Wave-form Time Span" (p.86)"Automatic Saving" (p.97)
After starting measurement with real-time auto saving, can I still acquire data if I neglected to insert removable storage media until later?
As long as storage media is inserted before internal memory overflows, data from the start of measurement will be saved to the removable stor-age.The instrument's internal memory can become full in as little as 32 min-utes. However, since it takes time to save unsaved data to a CF card or USB flash drive inserted during measurement, it is best to use one-third of that 32-minute figure, or about 10 minutes, as a rough esti-mate of the length of data that can be saved once measurement starts.
"Replacing Remov-able Storage During Real-Time Saving" (p.48)
Why does "Saving" continue to be displayed and saving not finish when saving internal memory data as text after mea-surement?
To save all data from a full internal memory to removable media as text after measurement takes about one hour.To abort the saving process, press and hold STOP for some time.We recommend saving binary data, and later converting to text with the Logger Utility (which takes only a few seconds).
"7.1.1 Saving Mea-surement Data as Text," Logger Utility instruction manual
Question Remedial Action Reference page

Appendix 10 Frequently Asked Questions
A37Appendix
How to view data saved in bi-nary format on a PC?
The Logger Utility PC application program is included on the supplied CD. Install it on the PC and use it to open the file.Double-clicking on a binary-format MEM file will not cause the file to be opened if the file has not been asso-ciated with the Logger Utility. In-stead of double-clicking the file, MEM files can be opened with the Logger Utility by dragging and drop-ping them onto the Logger Utility. (Similarly, they can be opened by using the "Open Waveform File" command on the "File" menu.)
"Appendix 9 Using the Application Pro-gram" (p. A19)
When opened in Excel, the time displayed is elapsed time from start. How can I display real time?
When saving data in CSV format on the HiLogger, the displayed time is determined by the [Time Disp] set-ting on the System screen. Select [Date] to display real time.When converting CSV format with the Logger Utility, set the [Time Axis Format] to [Absolute Time].
"Selecting the Hori-zontal (Time) Axis Display" (p.122)"7.1.1 Saving Mea-surement Data as Text," Logger Utility instruction manual
What are the files with .MEM and .LUW extensions?
MEM is the file extension for HiLog-ger waveform data, and LUW is the file extension for Logger Utility waveform data.LUW files cannot be loaded into the HiLogger.
6.1, "About Saving and Loading Data" (p.91)Logger Utility instruc-tion manual
How are event marks handled when converting data to text (CSV)?
When converting data to text with the HiLogger:Event numbers are included along-side measurement data. This is con-venient when you need to later extract only marked data.When converting data to text with the Logger Utility:Event mark information is not includ-ed.
5.3, "Inserting Event Marks (Search Func-tion)" (p.88)
Can't I use a USB flash drive? Or, warning 680 is displayed.
Set the USB mode on the LR8431-20's [System] screen to [USB Mem-ory]. (However, when [USB Memory] is selected, USB communications with the Logger Utility cannot be used.)
"Switching the USB mode" (p.126)
Question Remedial Action Reference page

Appendix 10 Frequently Asked Questions
A38
Logger Utility
Question Remedial Action Reference page
What kind of program is the Logger Utility?
Running on a PC connected to the HiLogger by USB cable, it provides real time data acquisition, display, and calculation; display and analysis of waveform (binary) data acquired by the HiLogger; conversion of bina-ry data to text (CSV) data; and print-ing.
Logger Utility instruc-tion manual
What is the method for con-verting data to a text (CSV) file with the Logger Utility?
1. In the menu bar, select [File]-[Save File in Text Format].
2. Select a file for CSV conversion in the displayed dialog, and set [CSV (comma separated)] as the file type.
3. Make other settings as neces-sary, and click the [Save] button.
Logger Utility instruc-tion manual
The Logger Utility cannot com-municate with the LR8431-20. Or, warning 681 is displayed.
Set the USB mode setting on the LR8431-20's [System] screen to [USB Communication]. (However, when [USB Communication] is se-lected, USB flash drives cannot be used.) If the USB driver has not been installed, install it. If the above procedure cannot be used to estab-lish communications, uninstall the USB driver by deleting "HIOKI 8423, 8430, LR8400 USB Driver" or "HIO-KI Logger USB Driver" on the "Add or Remove Programs" screen under "Control Panels." Then reinstall the USB driver.
"Switching the USB mode" (p.126)"Installing the USB Driver"(p.A23)

Appendix 11 Pulse Input Circuit Diagram
A39Appendix
The following diagram illustrates an example connection to the instrument's pulse input circuit:
Appendix 11 Pulse Input Circuit Diagram
ALARM pin circuit architecture and example relay connection
Instrument
5 V 5 V
100 k
100 k
150 pF

Appendix 11 Pulse Input Circuit Diagram
A40

Index
Index 1Inde
Number0 pos ...........................................................564-20 mA .....................................................32
AA/B cursors ................................................85Alarm ....................................................67, 73Alarm Output .....................................73, 134Analog input terminal ...............................31AND ............................................................ 71Auto Calculation ..............................113, 114Auto Save ......................................47, 96, 97Average value .................................113, 117
BBacklight Brightness ............................... 120Backlight Saver ....................................... 121Batch Proc ...........................................63, 64Battery pack .............................................. 26
Continuous battery-only operating time 28Beep Sound .............................................121Binary ......................................................... 91Burn Out .................................................... 51
CCalc(post meas.) .......................................97Calculation time span .............................116CF card ..............................................93, 127
Copy .....................................................108Delete ...................................................106Folder ...................................................106Format .................................................... 95Load ......................................................103Load Set. ..............................................103Rename ................................................107Sort ....................................................... 109
Clock Setting ...........................................124Comment ...................................................60Cont ............................................................ 44Cursor
Type ........................................................85
Cursor values ........................................... 84Cursors
Move ...................................................... 85
DDecimal Mark .......................................... 123Default setting ........................................ A 10Deleting (for saving data) ........................ 47Display Color .......................................... 121Display Range .......................................... 56Drive ......................................................... 105
EError Messages ....................................... A 1Event mark ................................................ 88EXT.TRIG ........................ 129, 131, 132, 134External control terminals ..................... 129External Trigger ................................ 67, 129
FFile name ................................................. A 7File screen ........................................ 95, 105Format (CF card) ...................................... 95
GGauge ........................................................ 84GND ................................................129, A 15
HHorizontal cursors .................................... 84
IInitializing .......................................... 64, 125Installing ................................................. A 20Integration ................................................. 53
JJump .......................................................... 83
Index
x

Index
Index 2
KKey
Keys do not work. ................................148KEY LOCK .......................................... 16, 23KEY/LED ..................................................127
LLCD ...........................................................127Length (Segment length) .........................47Level .................................................... 68, 69Level Monitor .............................................24Level Trigger ..............................................68Load ................................................. 103, 104Load Set. ..................................................103
MMaximum value .............................. 113, 117Measurement Configuration
Setting screen ........................................39Waveform screen ..................................41
Memory ........................................... 102, 103Minimum value ............................... 113, 117Monitor Display .........................................24
NNoise ...................................................... A 13Noise suppression ....................................45Numerical calculation results
Save ........................................................96Numerical Calculations ..........................113Numerical values ......................................87
OOperating Keys .........................................16OR ...............................................................71
PPeak value ...............................................113Pre-Trig ......................................................72
QQuick Save ......................................... 96, 98
RReference time ..........................................47Repair .......................................................147
Before Returning for Repair .............. 148Repeat ....................................................... 45Revolution Measurement ........................ 54RJC ............................................................ 51ROM/RAM ............................................... 127
SSave
Auto Save .............................................. 96Calc Results ........................................ 101File Type ................................................ 91Numerical Calculation Results .......... 101Quick Save ............................................ 96Save Set. ............................................. 102Screen Image ...................................... 100Select & Save ........................................ 96Waveform Data ..................................... 99
SAVE Key Operation ............................... 98Scaling ....................................................... 58Scrolling ..................................................... 82Select & Save ..................................... 96, 98Self-Test .................................................. 127Separator ................................................. 123Slope .......................................................... 54Specifications .......................................... 137Start Backup ........................................... 120Synchronous Measurements ................ 135System reset ........................................... 125System screen ........................................ 119
TTc ................................................................ 51Temperature Measurement .................... 51Time base (horizontal axis) ..................... 43Time Disp ................................................ 122Timer .................................................... 67, 76Title ............................................................. 60Trace .......................................................... 82Trace cursors ............................................ 84TRIG.OUT ............................................... 129Trigger ........................................................ 67
In ............................................................. 68Level ....................................................... 68Out .......................................................... 68
Trigger Input ............................................ 131Trigger output .................................. 129, 132Trigger source ........................................... 71

Index
Index 3Inde
UUninstalling .............................................A 29USB cable ...................................... 111, A 26USB Drive Mode .....................................110USB driver ....................................A 19, A 23USB flash driver
Copy .....................................................108USB mode ............................................... 126
VValues ........................................................21Vertical cursors ......................................... 84Voltage Measurement .............................. 50
WWaveform ..................................................99Waveform + Calc ...................................... 97Waveform Display Color ..........................56Waveform screen .....................................81Waveform(realtime) ..................................97Window Trigger ......................................... 68
ZZero Adjust ................................................35Zoom (vertical axis expansion/ compression) .............................................56
x

Index
Index 4


EN
LR8431-20MEMORY HiLOGGER
Instruction Manual
Aug. 2015 Revised edition 3 LR8431B980-03 15-08H