Embed Size (px)
DESCRIPTION
LPS' August Mortgage Monitor: Data Shows Loan Prepayment Activity Highest Since 2005
Citation preview
: : :
: : :
: :: :
: : :
: : :
: : :
: : :
: : :
: : :
: : :
:
LPS Mortgage Monitor
ON
S.O
NS.
: : :
: : :
: :
September 2012 Mortgage Performance Observations
WER
FUL
SOLU
TIO
WER
FUL
SOLU
TIO
Data as of August, 2012 Month-end
E S
OU
RC
E. P
OW
E S
OU
RC
E. P
OW
Lender Processing Services 1
ON
EO
NE
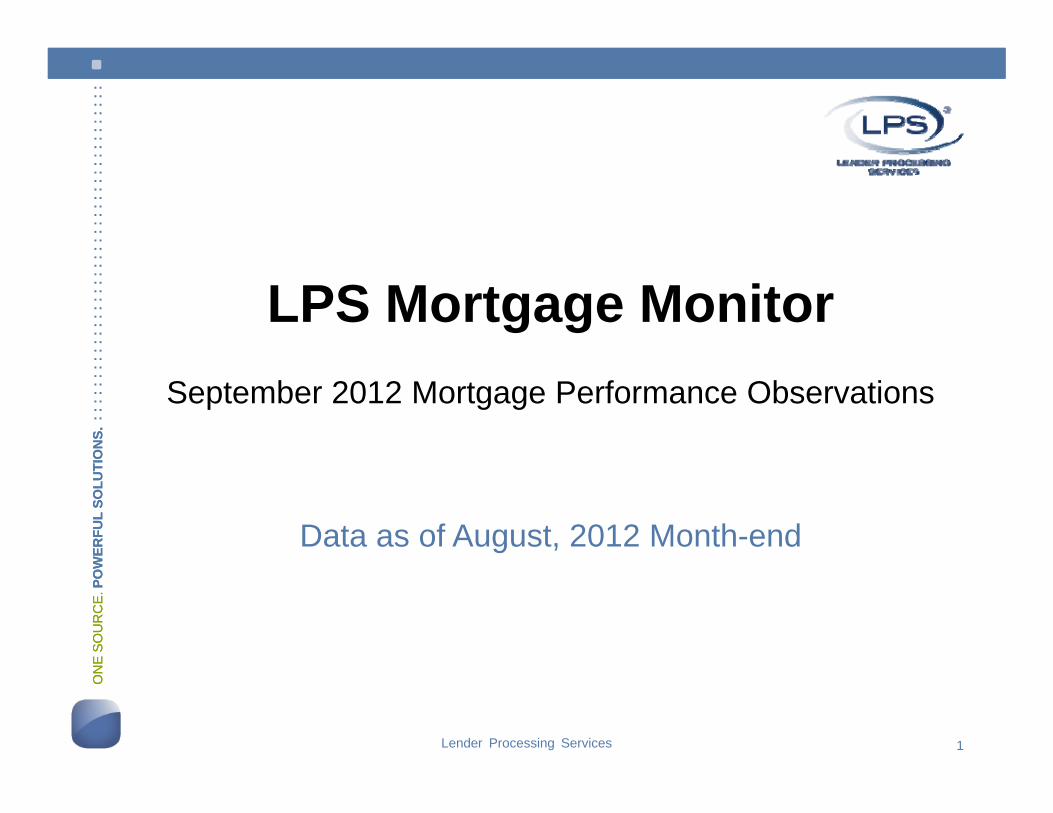
August 2012 “First Look”McDash Online Release: Sept 17th
Lender Processing Services 2

DQs are down almost 35% from peak; FCs still near highs
Lender Processing Services 3
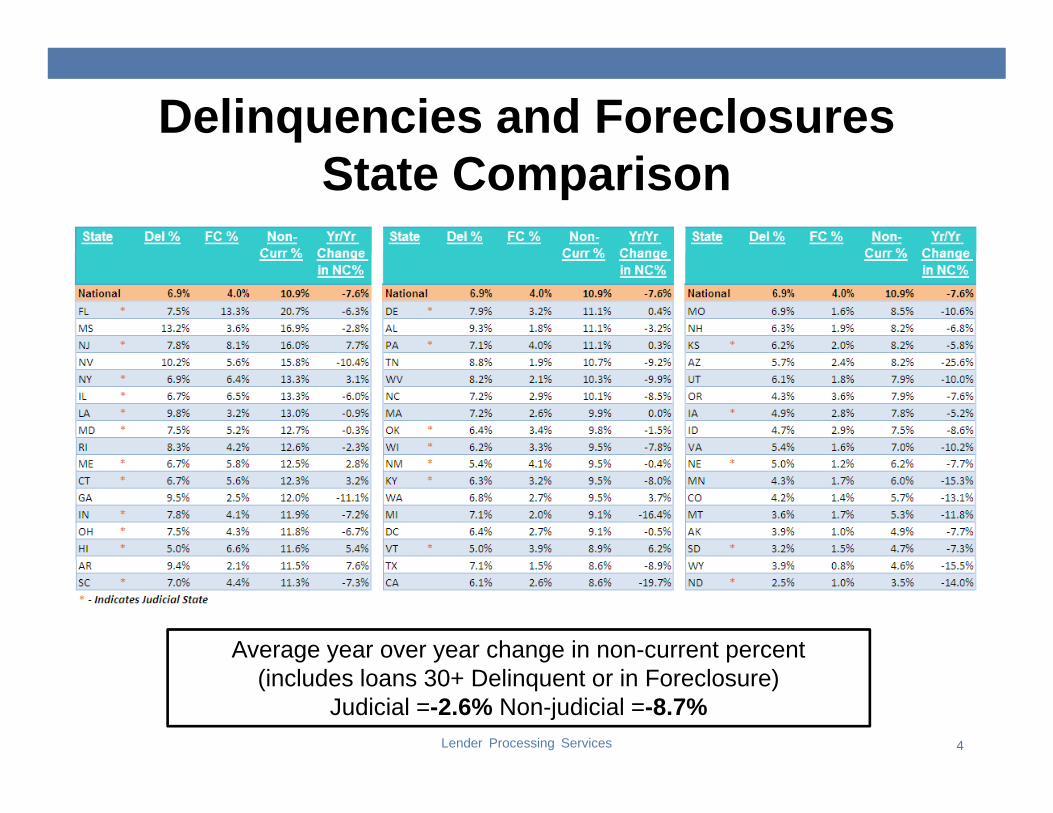
Delinquencies and Foreclosures State Comparison
Average year over year change in non-current percent
Lender Processing Services 4
(includes loans 30+ Delinquent or in Foreclosure)Judicial =-2.6% Non-judicial =-8.7%
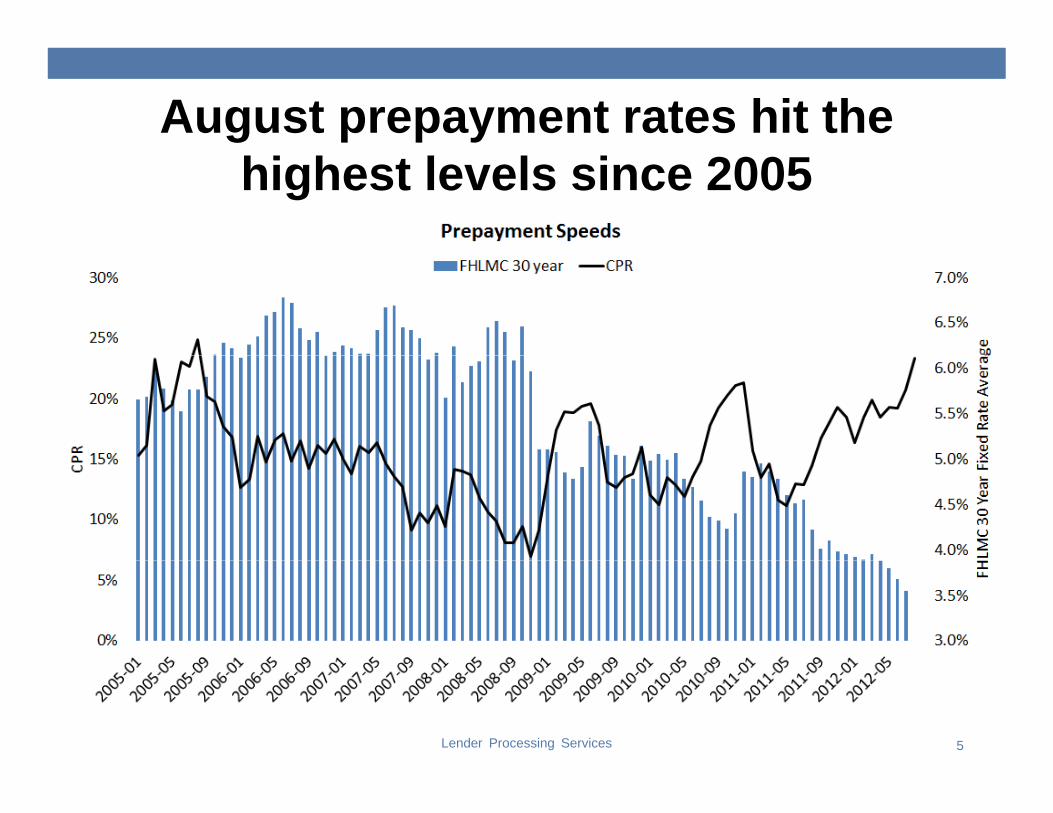
August prepayment rates hit the highest levels since 2005
Lender Processing Services 5

Loans with equity have much higher speeds, but HARP impact YTD is clear
Lender Processing Services 6
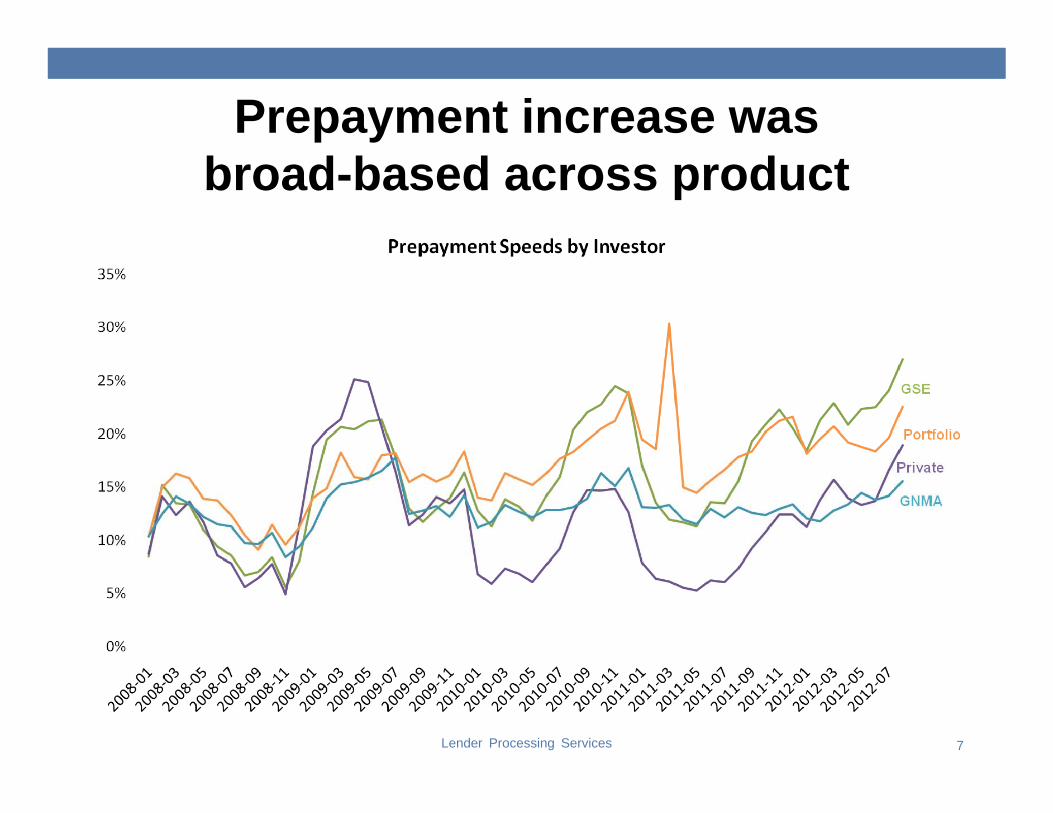
Prepayment increase was broad-based across product
Lender Processing Services 7
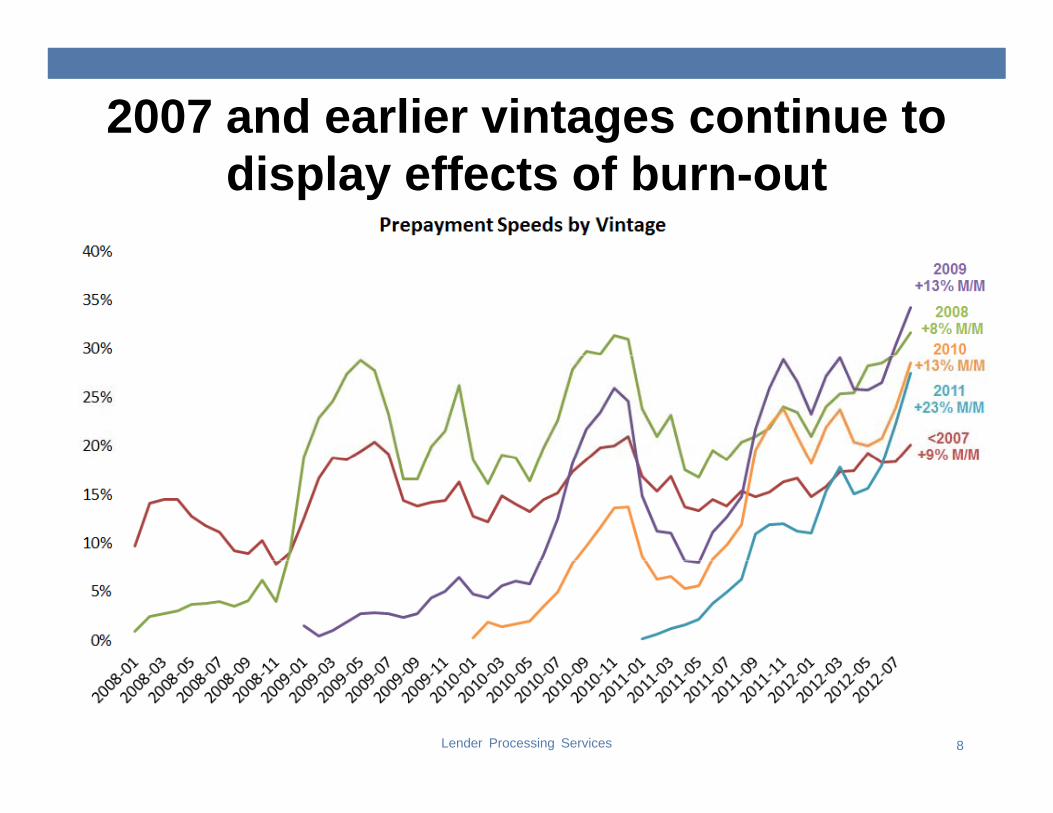
2007 and earlier vintages continue to display effects of burn-out
Lender Processing Services 8
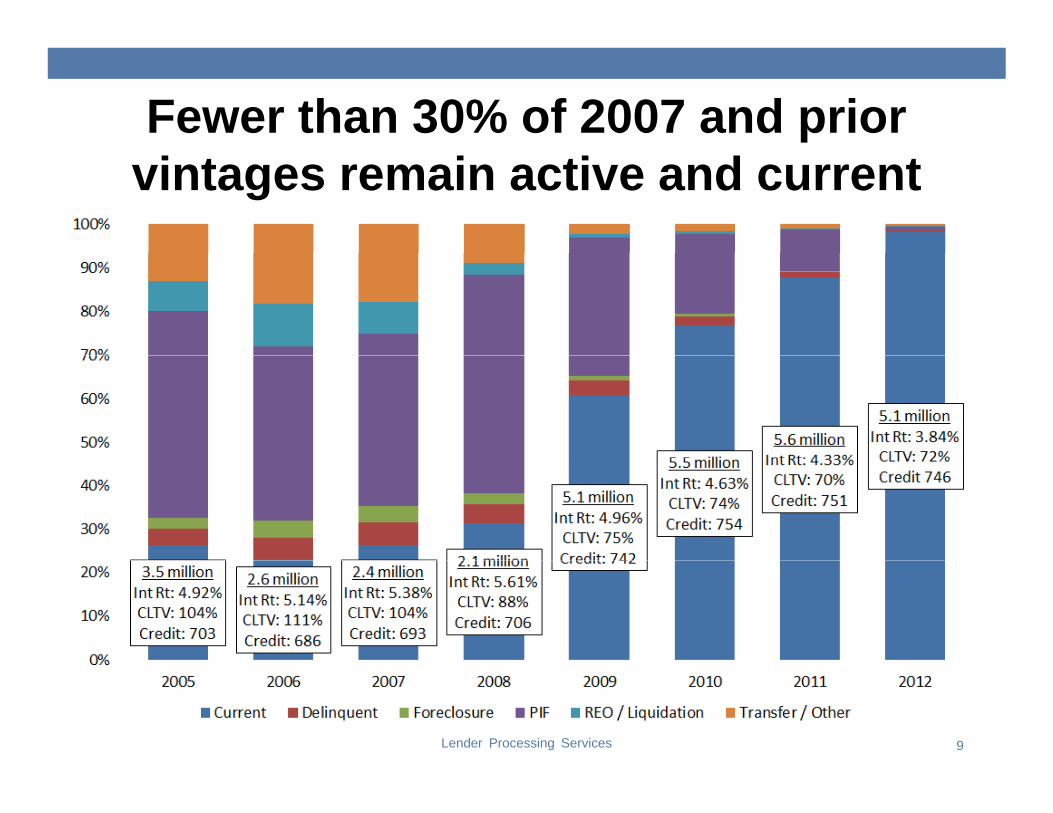
Fewer than 30% of 2007 and prior vintages remain active and current
Lender Processing Services 9
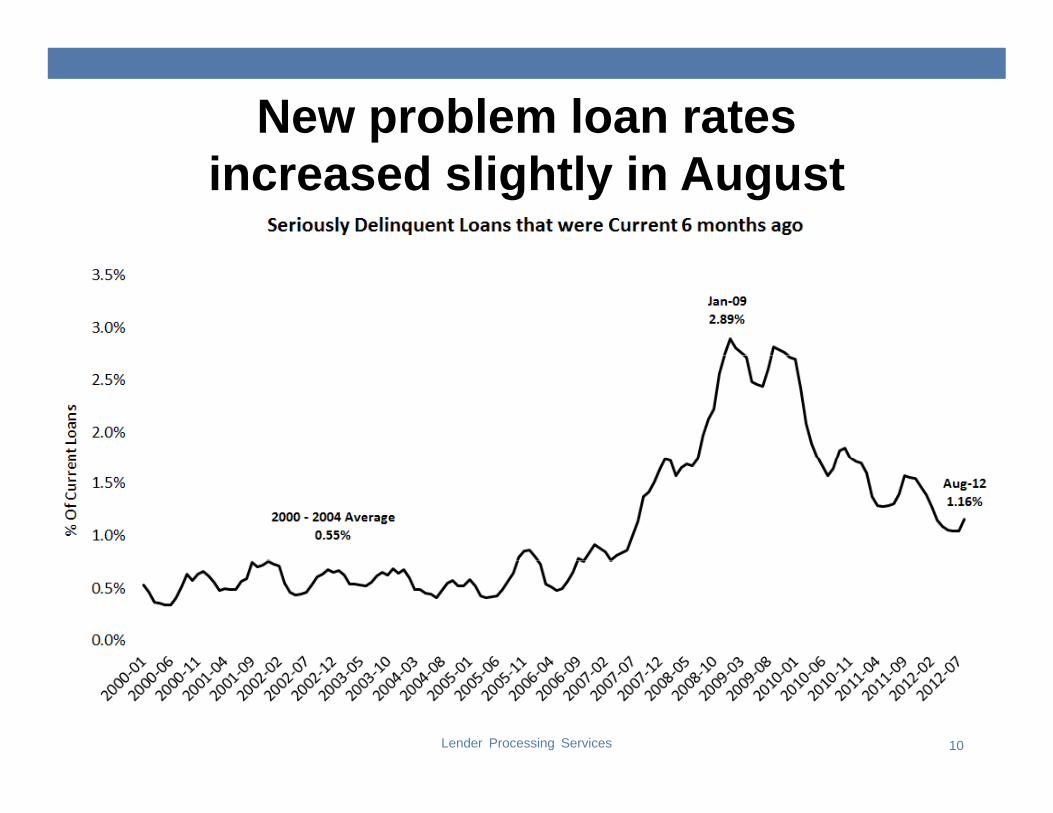
New problem loan rates increased slightly in August
Lender Processing Services 10
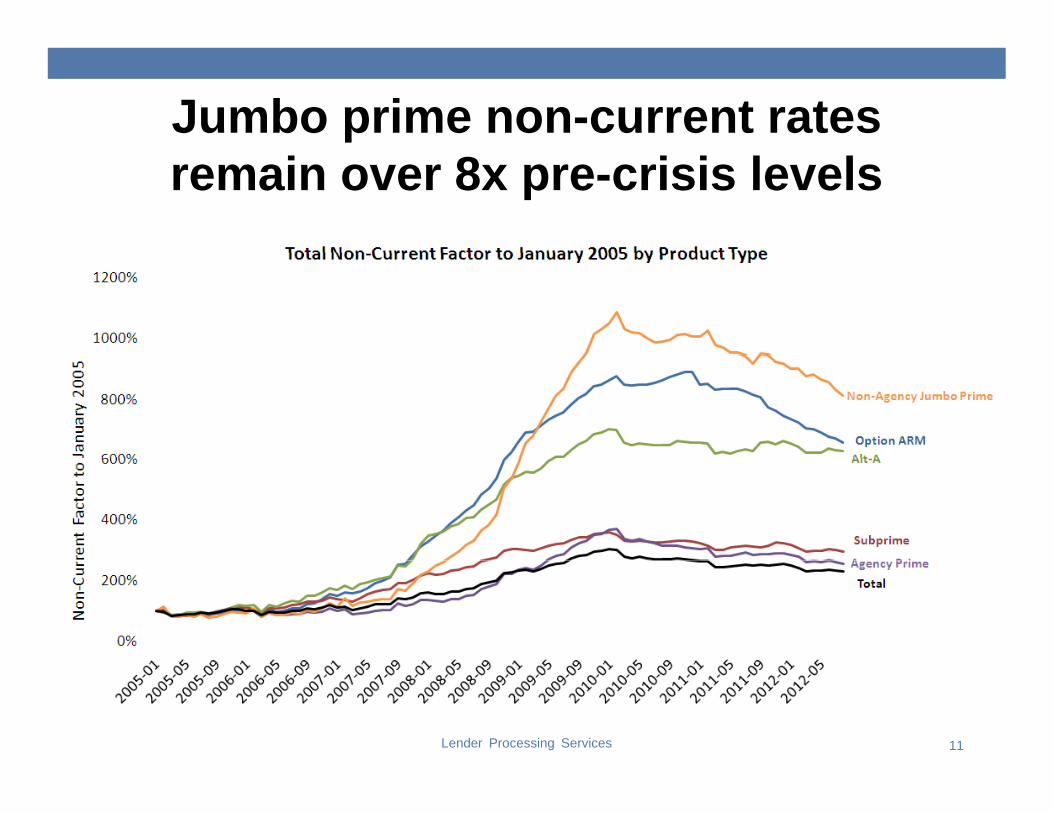
Jumbo prime non-current rates remain over 8x pre-crisis levels
Lender Processing Services 11
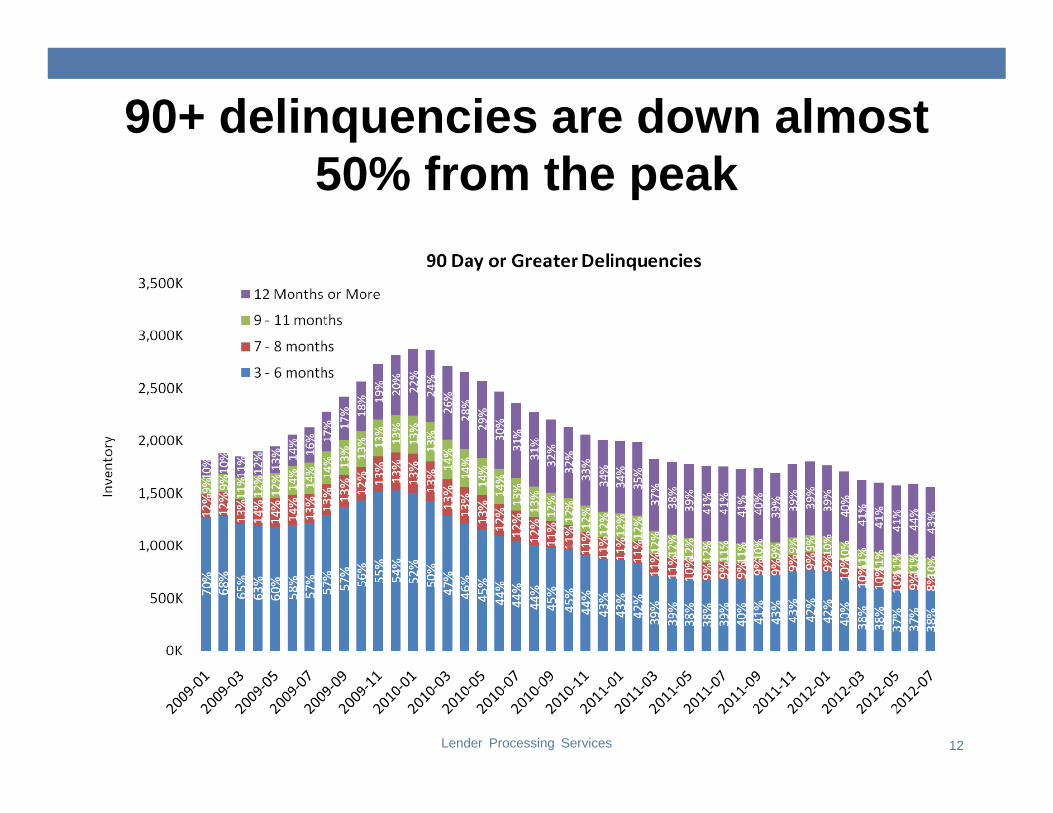
90+ delinquencies are down almost 50% from the peak
Lender Processing Services 12
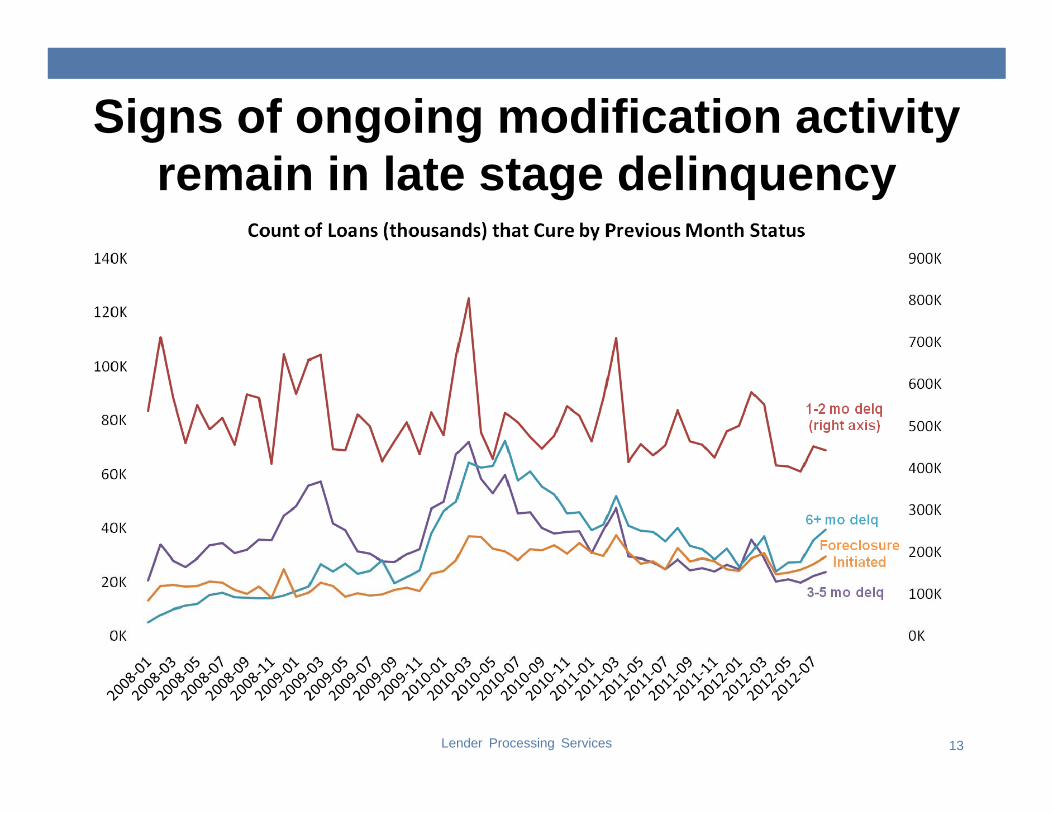
Signs of ongoing modification activity remain in late stage delinquency
Lender Processing Services 13
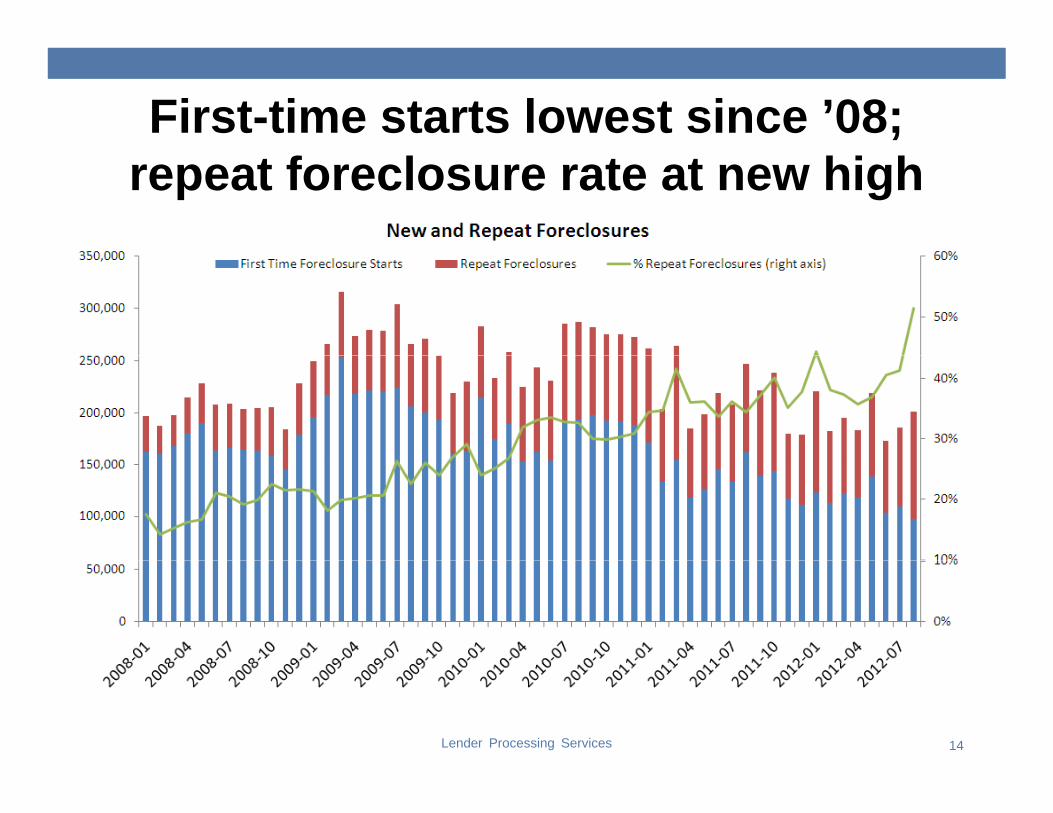
First-time starts lowest since ’08; repeat foreclosure rate at new high
Lender Processing Services 14

Increase in foreclosure starts was concentrated in judicial states
Lender Processing Services 15
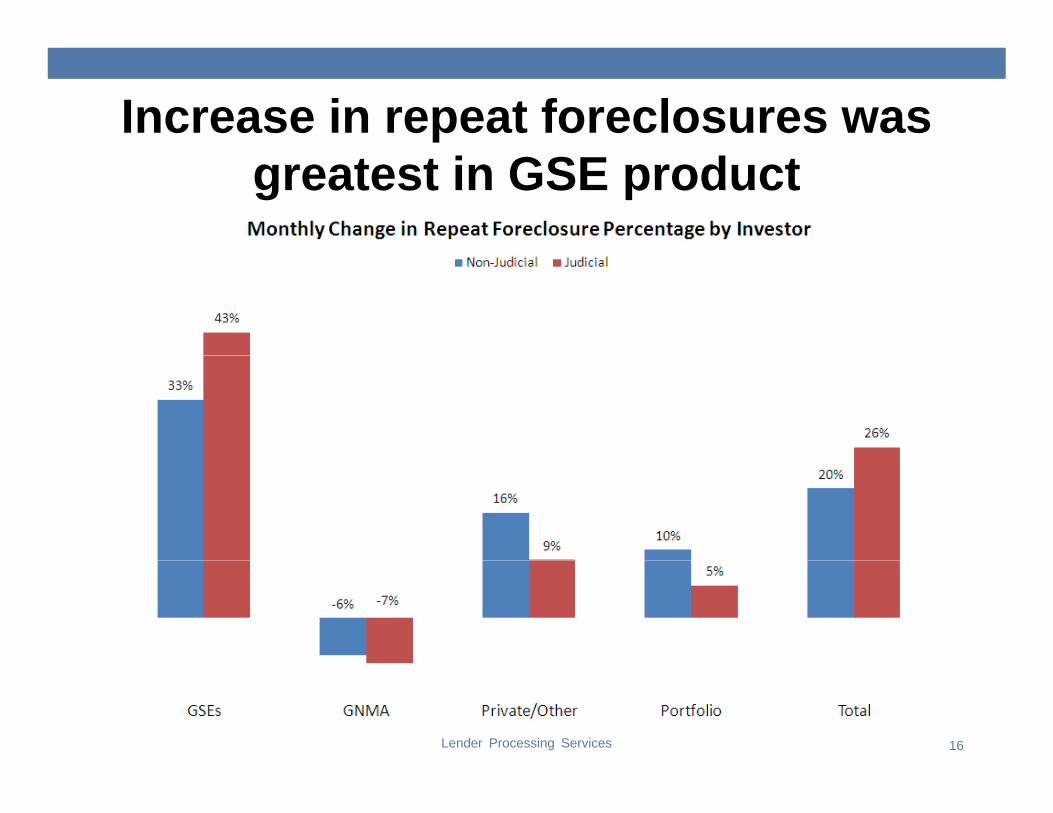
Increase in repeat foreclosures was greatest in GSE product
Lender Processing Services 16
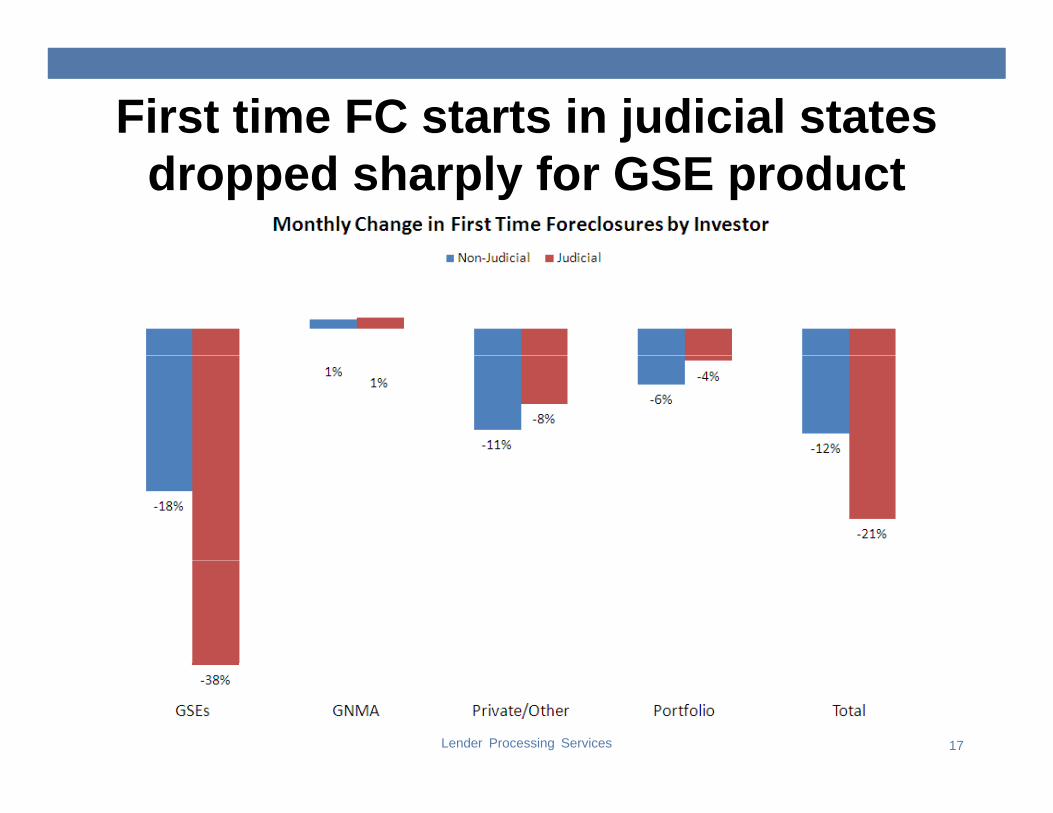
First time FC starts in judicial states dropped sharply for GSE product
Lender Processing Services 17
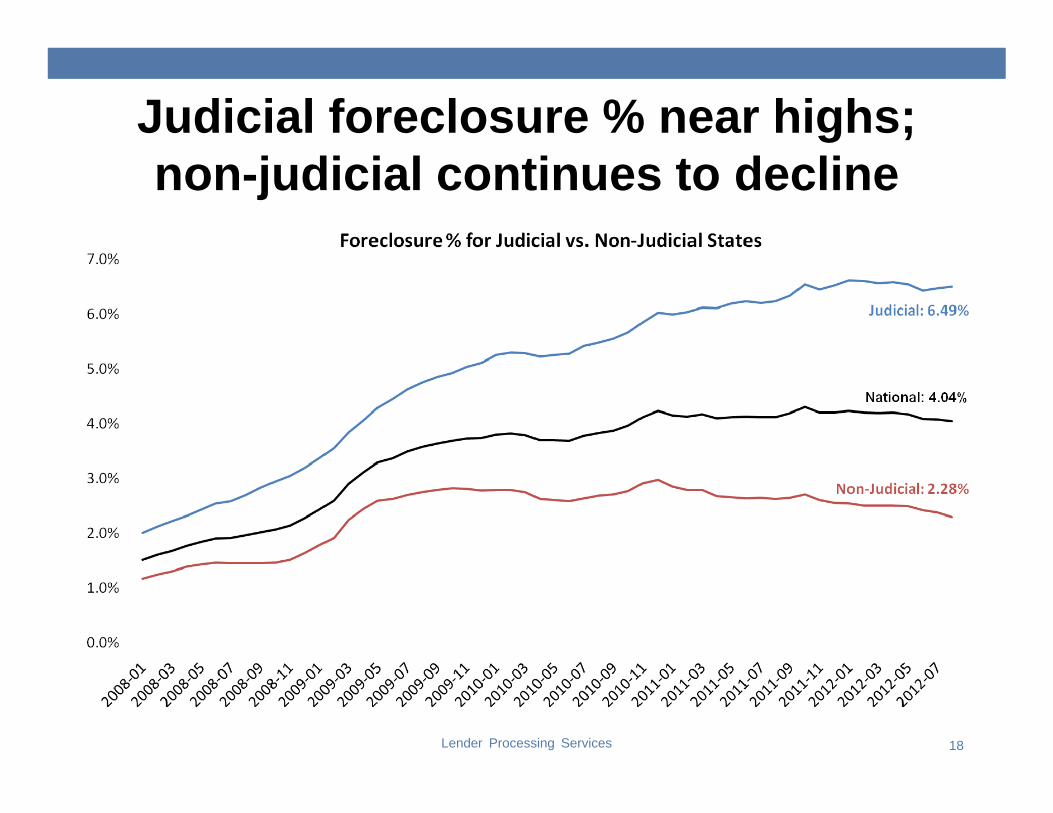
Judicial foreclosure % near highs;non-judicial continues to decline
Lender Processing Services 18
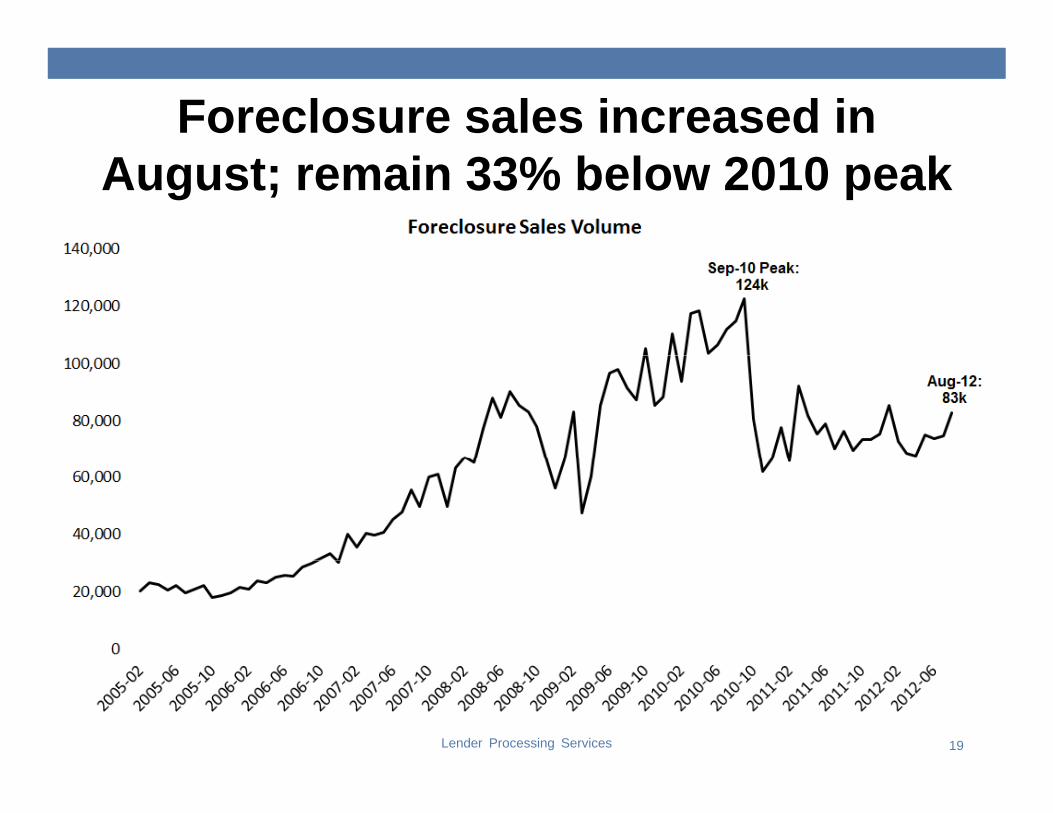
Foreclosure sales increased in August; remain 33% below 2010 peak
Lender Processing Services 19
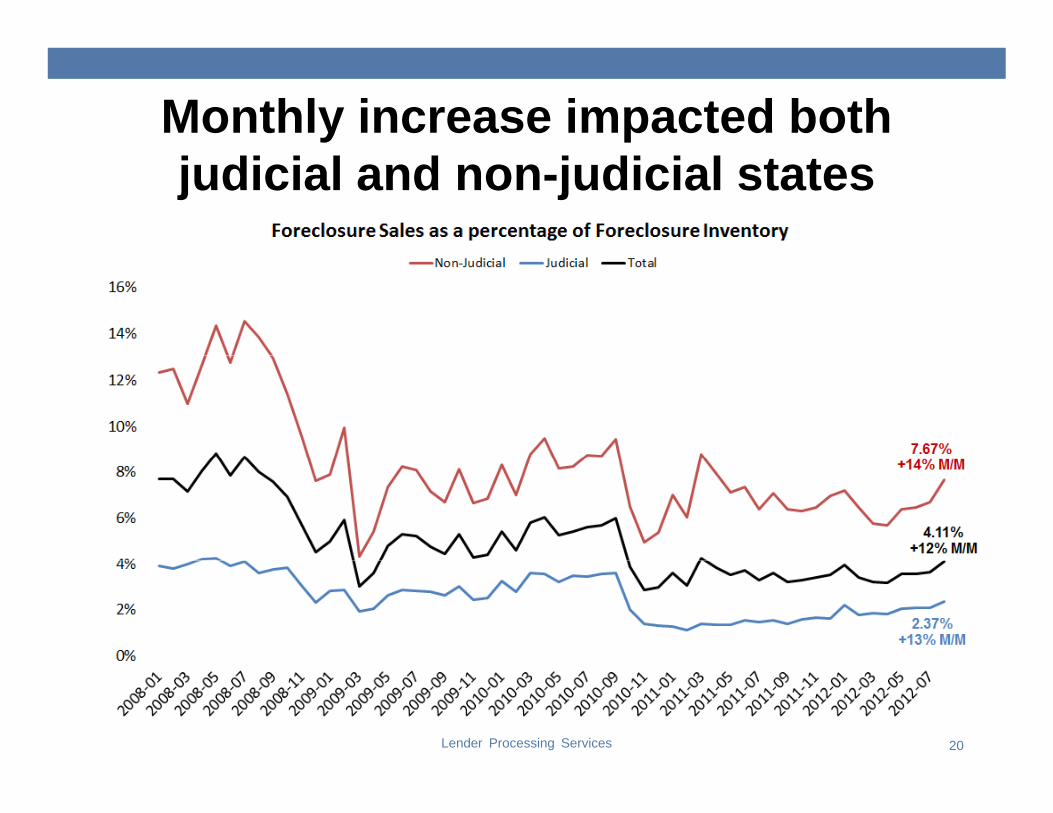
Monthly increase impacted both judicial and non-judicial states
Lender Processing Services 20
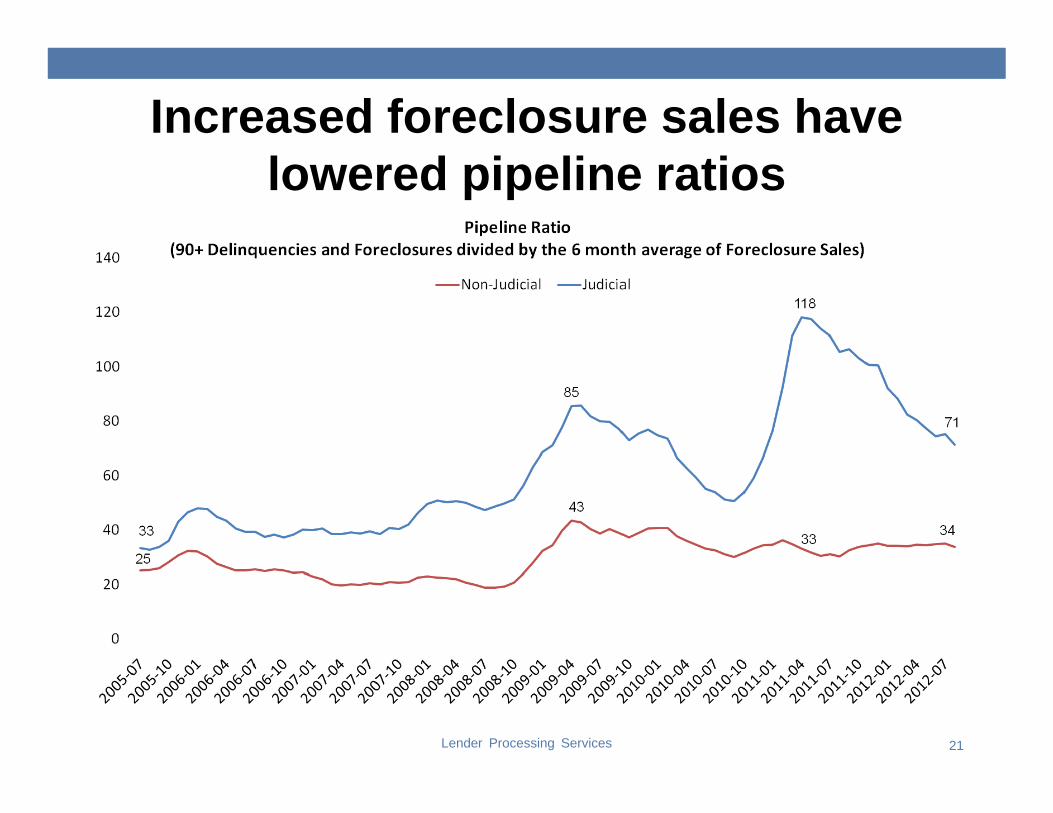
Increased foreclosure sales have lowered pipeline ratios
Lender Processing Services 21
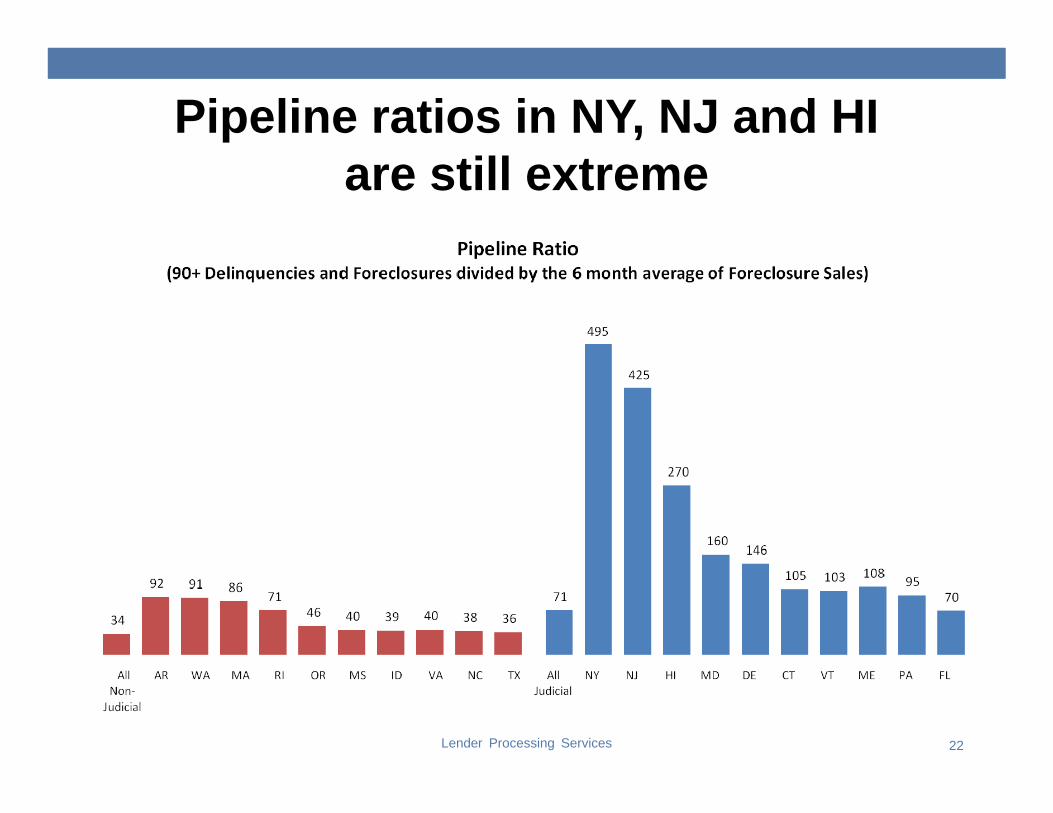
Pipeline ratios in NY, NJ and HI are still extreme
Lender Processing Services 22
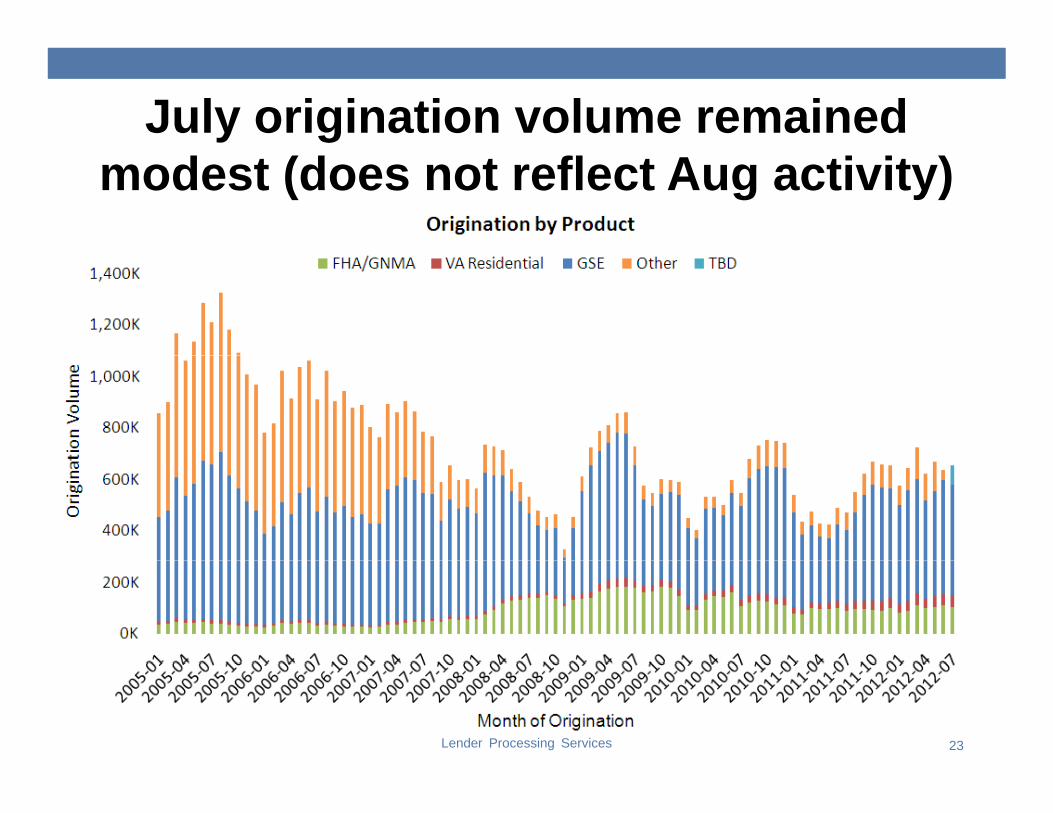
July origination volume remained modest (does not reflect Aug activity)
Lender Processing Services 23
: : :
: : :
: :: :
: : :
: : :
: : :
: : :
: : :
: : :
: : :
:
LPS Mortgage Monitor
ON
S.: :
: : :
: : :
Disclosures: Product / Metric Definitions and July 2012 Market Sizing Revisions
WER
FUL
SOLU
TIO July 2012 Market Sizing Revisions
E S
OU
RC
E. P
OW
Lender Processing Services 24
ON
E

Disclosure Page: Product DefinitionsDisclosure Page: Product Definitions
*Conforming limits do not account for temporary or high-cost area increases.
Lender Processing Services 25
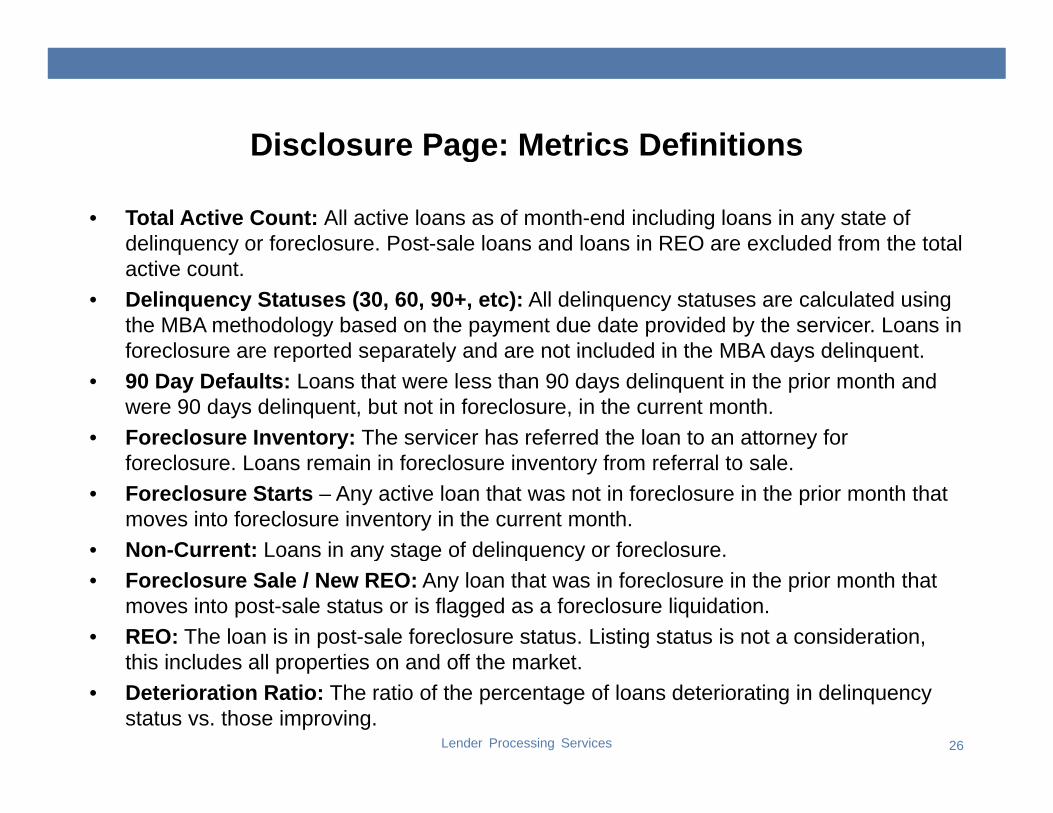
Disclosure Page: Metrics DefinitionsDisclosure Page: Metrics Definitions
• Total Active Count: All active loans as of month-end including loans in any state of delinquency or foreclosure. Post-sale loans and loans in REO are excluded from the total q yactive count.
• Delinquency Statuses (30, 60, 90+, etc): All delinquency statuses are calculated using the MBA methodology based on the payment due date provided by the servicer. Loans in foreclosure are reported separately and are not included in the MBA days delinquentforeclosure are reported separately and are not included in the MBA days delinquent.
• 90 Day Defaults: Loans that were less than 90 days delinquent in the prior month and were 90 days delinquent, but not in foreclosure, in the current month.
• Foreclosure Inventory: The servicer has referred the loan to an attorney for f l L i i f l i t f f l t lforeclosure. Loans remain in foreclosure inventory from referral to sale.
• Foreclosure Starts – Any active loan that was not in foreclosure in the prior month that moves into foreclosure inventory in the current month.
• Non-Current: Loans in any stage of delinquency or foreclosure.y g q y• Foreclosure Sale / New REO: Any loan that was in foreclosure in the prior month that
moves into post-sale status or is flagged as a foreclosure liquidation.• REO: The loan is in post-sale foreclosure status. Listing status is not a consideration,
this includes all properties on and off the market
Lender Processing Services 26
this includes all properties on and off the market.• Deterioration Ratio: The ratio of the percentage of loans deteriorating in delinquency
status vs. those improving.
With the June 2012 month-end data LPS has updated itsWith the June 2012 month end data, LPS has updated its extrapolation methodology to incorporate, among other things, improved estimates of market size, which includes hi h f t d b i d t dhigher coverage of government and subprime products and increases LPS’ estimate of the total first lien residential mortgage market by three percent to 50.4 million.
To ensure consistency in trend analysis, the new methodology has been applied to all historical data andmethodology has been applied to all historical data and previously reported mortgage performance statistics have been adjusted accordingly.
The following section contains information on market coverage and comparisons with previously reported
Lender Processing Services 27
statistics. Additional information is available upon request.
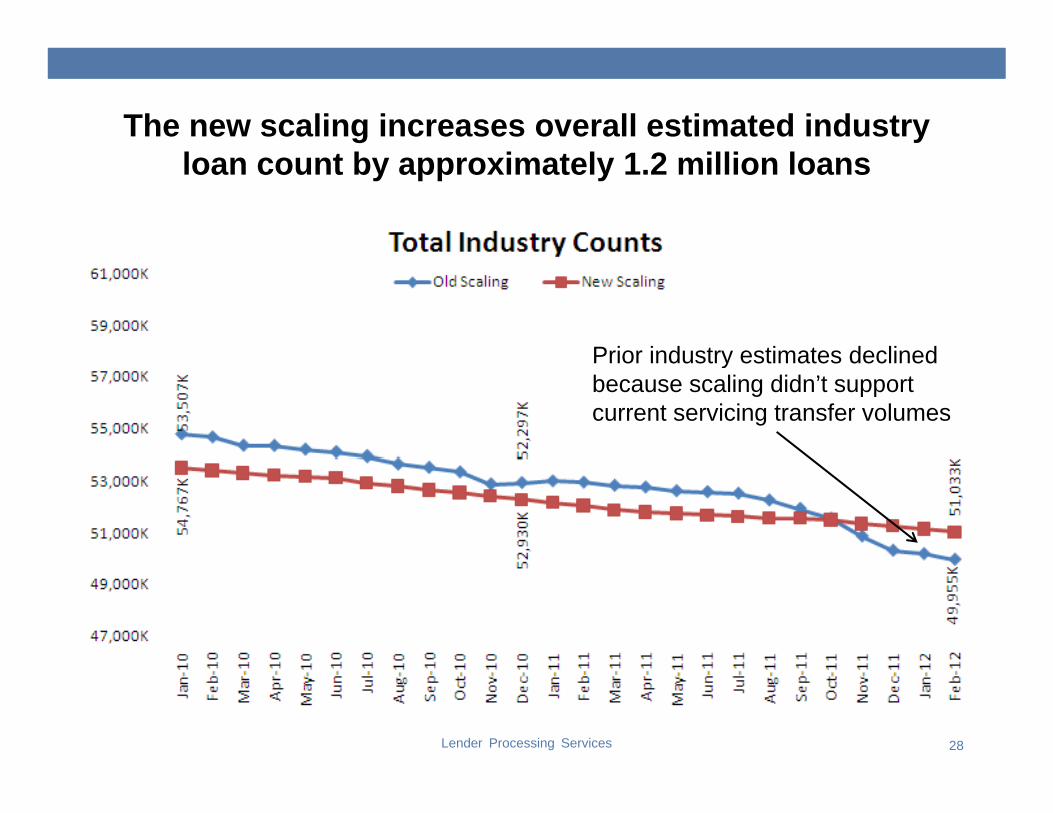
The new scaling increases overall estimated industry loan count by approximately 1.2 million loans
Prior industry estimates declinedPrior industry estimates declined because scaling didn’t support current servicing transfer volumes
Lender Processing Services 28
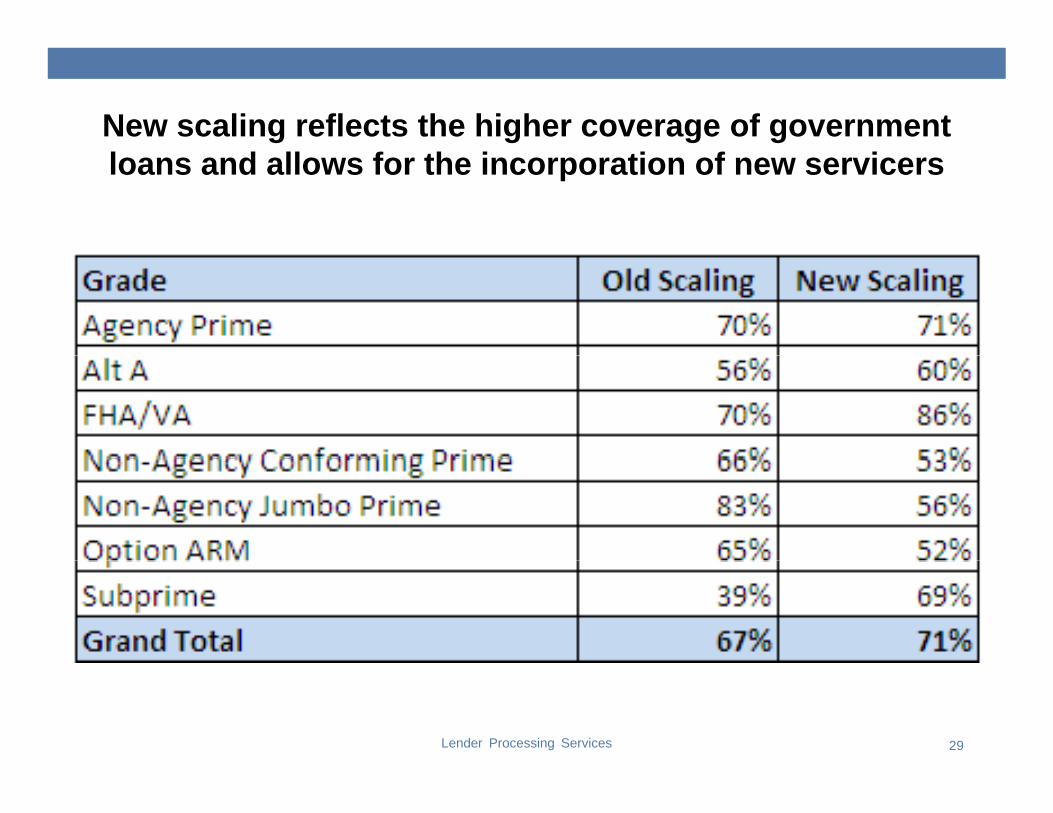
New scaling reflects the higher coverage of government loans and allows for the incorporation of new servicers
Lender Processing Services 29
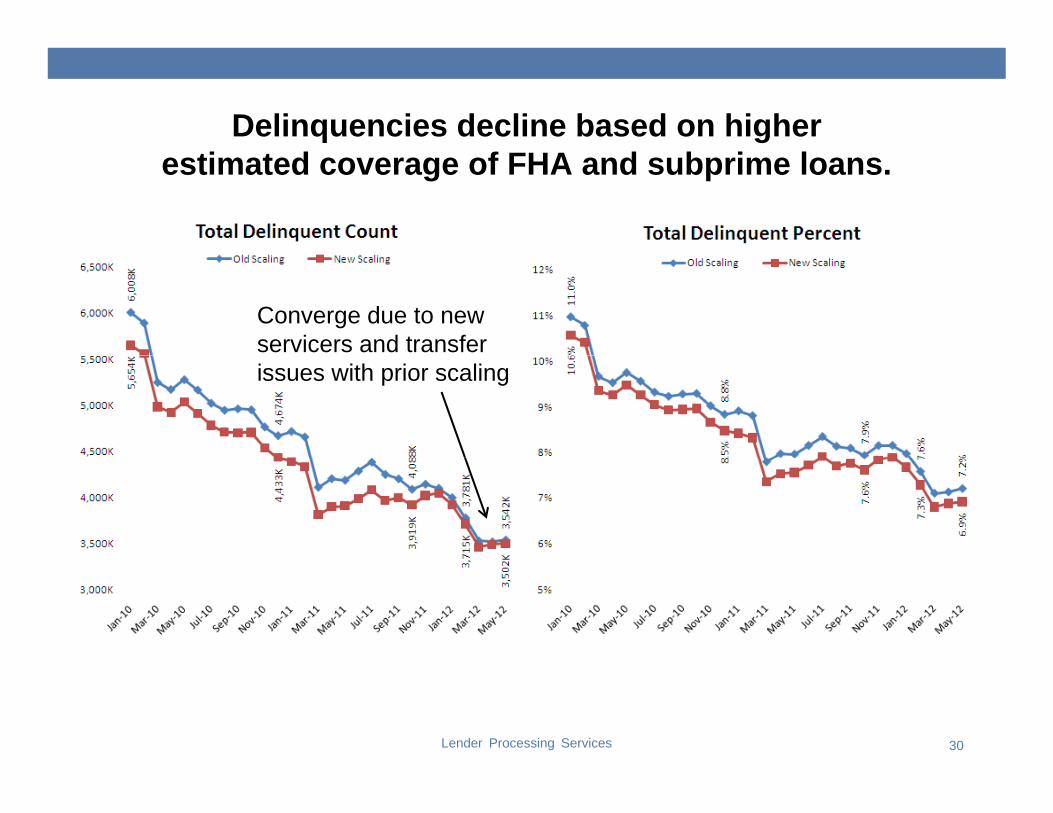
Delinquencies decline based on higher estimated coverage of FHA and subprime loans.
Converge due to new servicers and transfer issues with prior scaling
Lender Processing Services 30
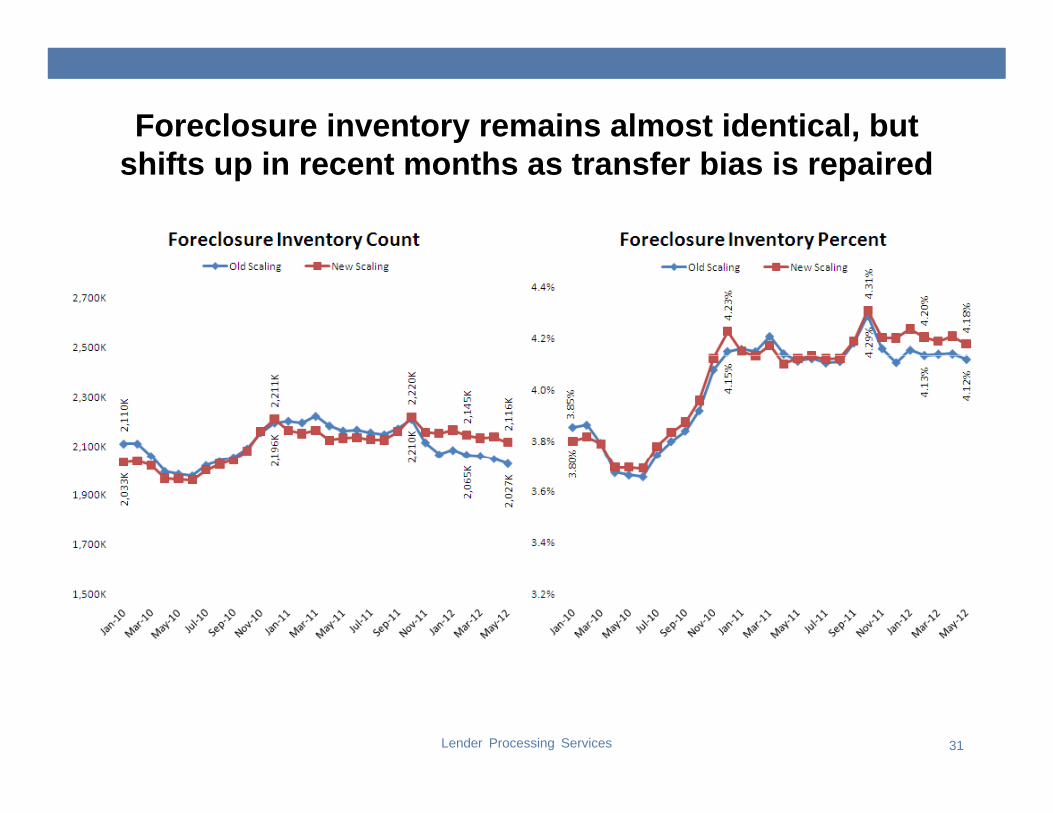
Foreclosure inventory remains almost identical, but shifts up in recent months as transfer bias is repaired
Lender Processing Services 31
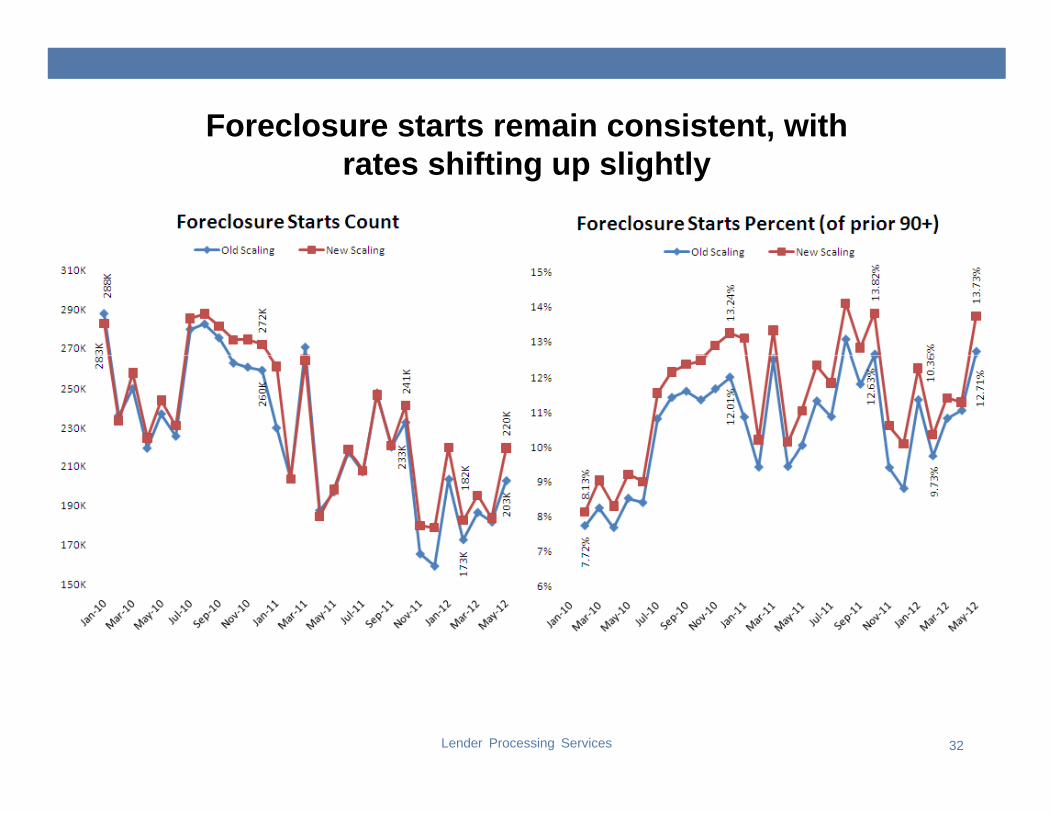
Foreclosure starts remain consistent, withrates shifting up slightly
Lender Processing Services 32
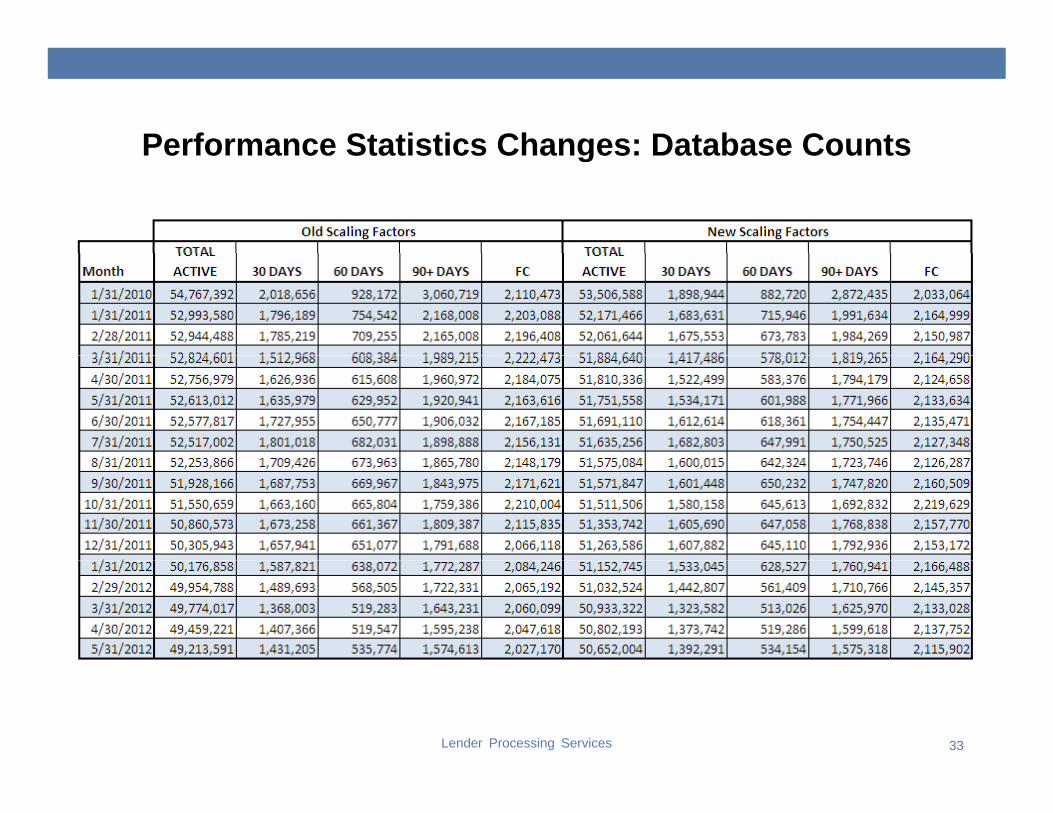
Performance Statistics Changes: Database CountsPerformance Statistics Changes: Database Counts
Lender Processing Services 33
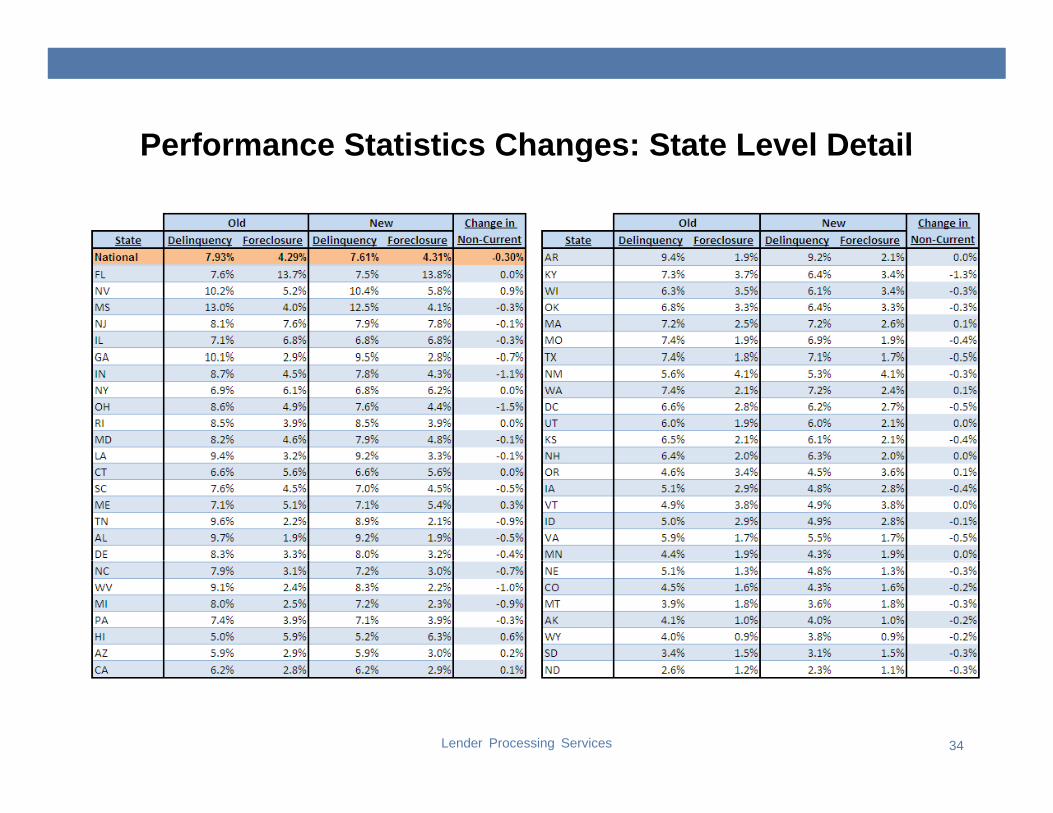
Performance Statistics Changes: State Level DetailPerformance Statistics Changes: State Level Detail
Lender Processing Services 34