Embed Size (px)
Citation preview
LOWERING CRIME IN MANHATTAN: THE EFFECTS OF IMPLEMENTING PREDICTIVE POLICING METHODS ON CRIME RATES
by Ellis Noerenberg
A capstone project submitted to Johns Hopkins University in conformity with the requirements for the degree of Master of Science in Data Analytics and Policy
Baltimore, Maryland August, 2021
© 2021 Ellis Noerenberg
All Rights Reserved
ii
Abstract:
Current research shows an unclear picture of the impact predictive policing has on
decreasing crime rates. Surging police officers to high-crime “hot spots” does lead to
some deterrence; however, the practice is unsustainable over a long period and has led to
new methods such as the “repeat victimization” method. The regression discontinuity
design used to examine crime rates before and after the implementation of the predictive
policing model focused on seven felony crimes: murder, rape, robbery, assault, burglary,
larceny, and vehicular larceny. The results were not uniform across the board with
murder, rape, assault, and vehicular larceny showing statistically significant differences
post-implementation while robbery, burglary, larceny, and total arrests did not show
significant differences. The crime rates for murder, rape, assault, and vehicular larceny
were all higher post-implementation than pre-implementation. Overall, the results in this
study are muddled and additional research is required before determining whether the
specific policies effectively result in lower crime.
iii
1 Introduction ..................................................................................................................... 1 2 Literature Review ............................................................................................................ 3 3 Data and Methods ........................................................................................................... 9 4 Results............................................................................................................................ 12
4.1 Murder Arrests ....................................................................................................... 12 4.2 Rape Arrests ........................................................................................................... 13 4.3 Robbery Arrests ...................................................................................................... 14 4.4 Assault Arrests........................................................................................................ 15 4.5 Burglary Arrests ..................................................................................................... 16 4.6 Larceny Arrests ...................................................................................................... 17 4.7 Vehicular Larceny Arrests ..................................................................................... 18 4.8 Total Arrests ........................................................................................................... 19
5 Conclusion ..................................................................................................................... 21 6 References ..................................................................................................................... 23
1
1 Introduction
In 2010, Manhattan District Attorney Cyrus Vance Jr. created the Crime
Strategies Unit within his office. The Unit’s goal was to use technology to identify
“crime drivers” or individuals who were at the root of crimes in given areas. By
identifying and arresting these aforementioned individuals, the idea was that crime rates
in the area would drop significantly. In order to carry out its mission, the Crime
Strategies Unit built a database that initially had roughly 200 “crime drivers,” sourced by
Assistant District Attorneys and police located around Manhattan. Unit Assistant District
Attorneys receive alerts when someone in the system has been arrested and periodically
interview arrestees to gain information and update their database on a weekly basis. The
Unit then uses this data to find patterns and form connections between seemingly
unrelated incidents.1
Previously, using data to stop and prevent crimes has produced mixed results—
prompting questions regarding how well the strategy works. Myriad studies on the matter
have used several different data analysis tools to attempt to stop crimes, including:
geospatial hot-spotting, Repeat Victimization modeling, and Pulling Levers method.
Although there are mixed results on the effects of predictive policing on lowering crime
rates, District Attorney Cyrus Vance expected that, because the Unit’s methodology was
taking the major “crime drivers” off the streets, crime rates would subsequently decrease
because such individuals would be unable to commit crimes or induce others to commit
crimes.
1 Chip Brown, “Cyrus Vance Jr.'s 'Moneyball' Approach to Crime,” The New York Times (The New York Times, December 3, 2014), https://www.nytimes.com/2014/12/07/magazine/cyrus-vance-jrs-moneyball-approach-to-crime.html.
2
This study focuses on what the New York City Police Department classifies as
“Seven Major Felony Offenses”: Murder and Non-negligent Manslaughter, Rape,
Robbery, Felony Assault, Burglary, Grand Larceny, and Grand Larceny of Motor
Vehicle. Using data from 2000 to 2019, the felony crime data is analyzed to determine
whether Manhattan District Attorney Cyrus Vance’s approach of predictive policing and
prosecution led to a downturn in felony crimes in Manhattan. Cyrus Vance took over the
District Attorney’s office in 2010 and in order to give us appropriate time series to
compare, the data from 2000-2010 has been compared to the data from 2011-2019. The
analysis of the felony crime data, provided by the New York Police Department, shows
that the felony crimes after Cyrus Vance implemented his Crime Strategies Unit had
mixed results with the murder, rape, assault, and vehicular larceny arrests having
significant increases in arrests post-implementation while the robbery, burglary, and
larceny arrests did not have statistically significant change post-implementation.
These findings were found by comparing the first 10 years of the data to the
second 10 years of the data. The data was grouped this way to account for time prior to
implementation and time after implementation. The data was tested to see if there was a
significant difference between Group 1 (2000-2010) and Group 2 (2011-2019). The
initial findings combined all felony crimes and found the Total Arrests did not have a
statistically significant change post-implementation.
3
2 Literature Review
Predictive policing is the use of analytic methods – often statistical and
mathematical – to identify patterns in crime statistics.2 Often, this is used to find crime
“hotspots” or areas where crime is extremely prevalent relative to other areas. Utilizing
these tools can be beneficial to police departments as they are stretched thin due to
budget cuts from the current economic conditions.3 Predictive policing can allow
leadership of departments efficiently make staffing decisions on where to have officers
patrol during their shifts. In the past, policing has followed the model of: random patrol,
rapid response, and reactive investigation. Post 9/11, intelligence became a crucial part of
police work but for the most part did not include quantitative models of crime.4 Police
departments have, for a long time, collected statistics as a way to determine progress in
how they are doing year to year. But the statistics are mainly used in a retrospective
capacity and not for any sort of predictive analytics.5
Predictive analytics have been used by different parts of society for many
different items such as supply chain issues. Large stores such as Walmart shift supplies
2 Walt L. Perry, “Predictive Policing: the Role of Crime Forecasting in Law Enforcement Operations,” in Predictive Policing: the Role of Crime Forecasting in Law Enforcement Operations (RAND Corporation, 2013).
3 Charlie Beck and Colleen McCue, “Predictive Policing: What Can We Learn from Wal-Mart and Amazon about Fighting Crime in a Recession?,” Predictive Policing: What Can We Learn from Wal-Mart and Amazon about Fighting Crime in a Recession? | Office of Justice Programs, March 13, 2014, https://www.ojp.gov/ncjrs/virtual-library/abstracts/predictive-policing-what-can-we-learn-wal-mart-and-amazon-about.
4 Ibid
5 Elizabeth R Groff and Nancy G La Vigne, “Forecasting the Future of Predictive Crime Mapping,” Crime Prevention Studies 13 (2002): pp. 29-57.
4
around when there are large-scale weather events to allow for key items to be close by
when the weather event occurs. The same logic applies to utilizing predictive analytics
for police resource deployment. In 2003, a risk-based approach was used to deploy police
officers on New Years Eve. This approach led to a decrease in complaints of random gun
fire.6 Past research has yielded evidence that crime is predictable because criminals often
commit crimes in areas where they feel comfortable. Criminals keep geographic and
temporal schedules and comfort zones. Criminals keep routines and operate in times they
know they have been able to commit a crime in the past and in an area where they have
successfully committed a crime.7
Not every predictive policing program has been a success however. In Shreveport,
Louisiana, the police department utilized predictive policing techniques to try to identify
areas where there would be at least one property crime in the next month. Officers would
then be surged to these areas to maintain a presence. The study found no evidence that
property crime was reduced in areas where the predictive policing techniques had
identified at being high risk for property crimes and had increase police presence than
areas which did not have an increased police presence.8 More success has been found in
utilizing geospatial analysis to find crime “hot spots”. These are highly focused areas as
6 Ibid; Charlie Beck and Colleen McCue, “Predictive Policing: What Can We Learn from Wal-Mart and Amazon about Fighting Crime in a Recession?,” Predictive Policing: What Can We Learn from Wal-Mart and Amazon about Fighting Crime in a Recession? | Office of Justice Programs, March 13, 2014, https://www.ojp.gov/ncjrs/virtual-library/abstracts/predictive-policing-what-can-we-learn-wal-mart-and-amazon-about.
7 Ibid; Walt L. Perry, “Predictive Policing: the Role of Crime Forecasting in Law Enforcement Operations,” in Predictive Policing: the Role of Crime Forecasting in Law Enforcement Operations (RAND Corporation, 2013). 8 Priscillia Hunt, Jessica Saunders, and John S Hollywood, Evaluation of the Shreveport Predictive Policing Experiment(RAND Corporation, 2014).
5
small as street blocks where a disproportionate amount of crime is centralized. Many of
these studies focus on crime deterrence by positioning police officers in the immediate
area of crime hot spots but one study in Baltimore, Maryland focused on “informal social
controls. This study collected data from surveys as well as observations taken found
displays of “collective efficacy” in highly focused geographic areas.9
Additionally, a study in Pittsburgh, Pennsylvania studied similar geospatial
analysis with a predictive element. This study worked to predict crime hotspots in one
month blocks of time as this is a routine time period in police departments as they
conduct monthly review meetings known as “Comp-Stat.”10 A variable that the
Pittsburgh, Pennsylvania study incorporated in their model was the seasonality of the
crimes. The seasonality focuses on the time of year where different crimes are
committed.11 In the Pittsburgh, Pennsylvania study, the police department focused on the
six police precincts in the city. The results showed that there needs to be at least 30
crimes per month in each police precinct to approach an acceptable accuracy for the
model. Additionally, the study found that there was not much evidence of pattern changes
when implementing force deployment to high crime areas as most of the variation in the
data was due to randomness. Seasonality was also not large enough to attribute to specific
peaks or dips in crime at the precinct level but may be large enough to use in a city wide
model.12
9 David Weisburd et al., “Enhancing Informal Social Controls to Reduce Crime: Evidence from a Study of Crime Hot Spots,” Prevention Science 22, no. 4 (2021): pp. 509-522, https://doi.org/10.1007/s11121-020-01194-4. 10 Wilpen Gorr, Andreas Olligschlaeger, and Yvonne Thompson, “Short-Term Forecasting of Crime,” International Journal of Forecasting 19, no. 4 (2003): pp. 579-594, https://doi.org/10.1016/s0169-2070(03)00092-x. 11 Ibid 12 Ibid
6
Predictive policing has been used in other ways besides using geospatial analysis
to identify crime hot spots. It has also been used to identify major criminal actors and
groups attempting to take them off the street.13 This technique, called “focused
deterrence” tests the hypothesis that by going after repeat offenders the overall crime will
drop in the surrounding area.14 These studies were conducted in the cities of Newark,
New Jersey, Chicago, Illinois, and Glasgow, Scotland. The Newark study measured the
number of weekly gunshot wound incidents. The Chicago study measured homicides and
gang related incidents. The Glasgow study measured violent crime. The Newark study
resulted in no statistically significant reduction in weekly gunshot wound incidents. The
Chicago study resulted in a statistically significant 32% decline in homicides. The
Glasgow study resulted in a 65% decline in weapon carrying among select individuals.15
The Newark study additionally evaluated whether when the focused deterrence
methodology was implemented the crime then bled into surrounding areas and away from
where it had been mainly occurring. The study did not report any crime shifts into
surrounding areas.16 Research in different studies have shown however that combining
focused deterrence with complementary strategies works more successfully than just
simply focused deterrence alone.17
Another form of predictive policing is the “pulling levers” strategy. The pulling
levels strategy is applied when the police and leadership determine what particular group
13 Anthony A. Braga, David Weisburd, and Brandon Turchan, “Focused Deterrence Strategies Effects on Crime: A Systematic Review,” Campbell Systematic Reviews 15, no. 3 (2019), https://doi.org/10.1002/cl2.1051. 14 Ibid 15 Ibid 16 Ibid 17 Ibid
7
or gang related crime they want to specifically focus on. Once they identify the key
offenders in the area, they use a variety of authorities to stop the individuals from
continuing the behavior.18 This strategy was used in Boston in 1996 and had success
lowering youth homicide. The predictive policing work was used to identify the key
offenders of the crimes and a 63% decrease in monthly youth homicides was seen
afterwards.19 Further analysis of this study has led researchers to believe however that the
decrease in youth homicides in this time frame transpired amongst a nationwide decrease.
It is also noted that there were other substantive policy changes in this time frame that
could have impacted the youth homicide statistics: increased number of police, increasing
prison population, and the end of the crack-cocaine epidemic, amongst others.20
Another predictive policing model that has been used in the past is the “Repeat
Victimization” model. The repeat victimization model focuses not on geographic areas or
“hot spots” but rather specific individuals or businesses. Previous studies have found that
a third of burglaries in hot spot areas are of repeat businesses or addresses.21 Further
more, research has also found that businesses or addresses near other repeat victims are
likely to be victimized.22 Another predictive policing model that has been used in the past
are univariate methods, random walk and naïve lag. Both of these only requires a single
variable that uses past data to predict future data. However, these method suffers when
working with time-series data or seasonal disruptors, both of which apply to crime
18 Ibid; Anthony A. Braga and David L. Weisburd, “Systematic Review of the Effects of ‘Pulling Levers’ Focused Deterrence Strategies on Crime,” Campbell Systematic Reviews 6, no. 1 (2010): pp. 1-30, https://doi.org/10.1002/cl2.70. 19 Ibid 20 Ibid 21 Ibid; Elizabeth R Groff and Nancy G La Vigne, “Forecasting the Future of Predictive Crime Mapping,” Crime Prevention Studies 13 (2002): pp. 29-57. 22 Ibid
8
patterns.23 An alternative predictive policing model is the leading indicator methods.
These use multiple independent variables to predict the value of the dependent variable.
The leading indicators should focus on specific features that could reasonably impact the
dependent variable.24 A more complex geospatial predictive policing approach is using
the Raster GIS methods. This method has been used to find the risk index for residential
burglary based on having vacant homes or buildings nearby.25
23 Ibid; Elizabeth R Groff and Nancy G La Vigne, “Forecasting the Future of Predictive Crime Mapping,” Crime Prevention Studies 13 (2002): pp. 29-57. 24 Ibid 25 Ibid
9
3 Data and Methods
The data used in this study is from the New York Police Department’s online data
portal. The data is from the years 2000 to 2019 and gives the total number of seven major
felonies for each of the years and by each individual police precinct in New York City.
This study is specifically focusing on the Manhattan District Attorney so the data was
subset to include only police precincts that are in Manhattan and fall under his authority.
The subsetting was done manually in Microsoft Excel by finding the police precincts that
are in Manhattan on the New York Police Department website and keeping only those
precincts in the Excel document.
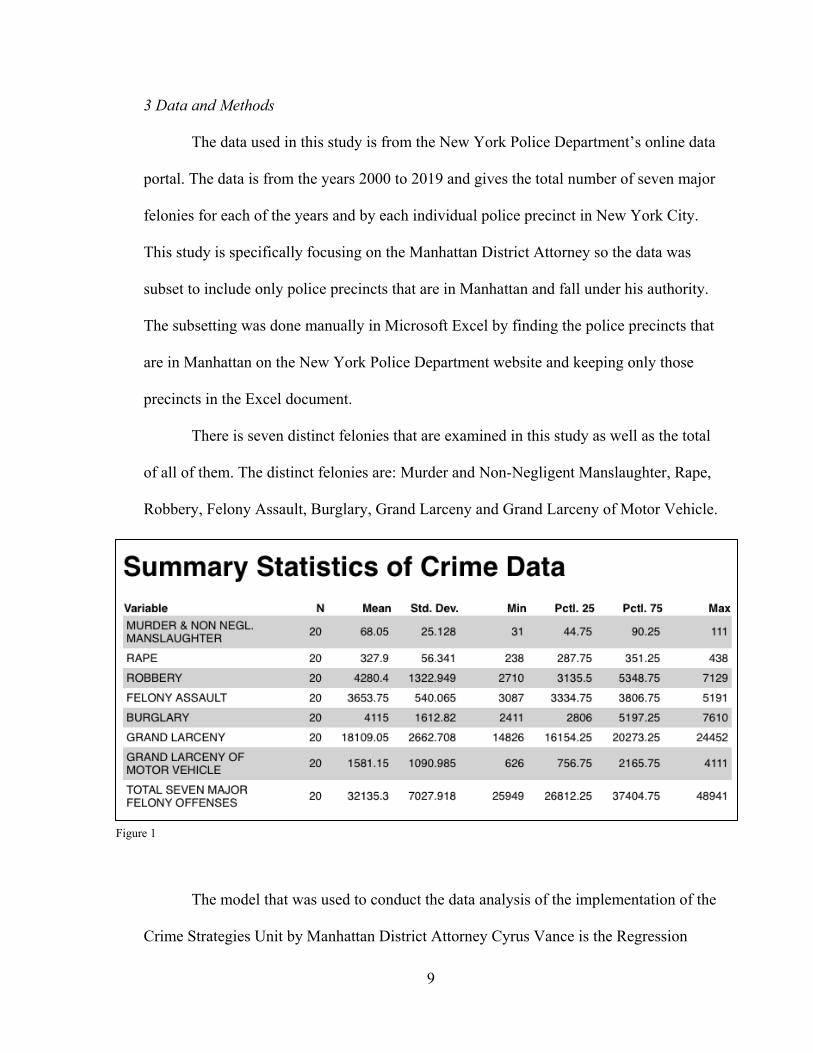
There is seven distinct felonies that are examined in this study as well as the total
of all of them. The distinct felonies are: Murder and Non-Negligent Manslaughter, Rape,
Robbery, Felony Assault, Burglary, Grand Larceny and Grand Larceny of Motor Vehicle.
The model that was used to conduct the data analysis of the implementation of the
Crime Strategies Unit by Manhattan District Attorney Cyrus Vance is the Regression
Figure 1
10
Discontinuity Design (RDD). This design is used to understand the casual effect of the
implementation of the Crime Strategies Unit in Manhattan. DA Vance implemented this
unit in mid-2010. The two different time periods that are analyzed are 2000 through 2010
and 2011 through 2019. This decision was made to compare full years with the Crime
Strategies Unit compared to years when it either hadn’t yet been created or a partial year
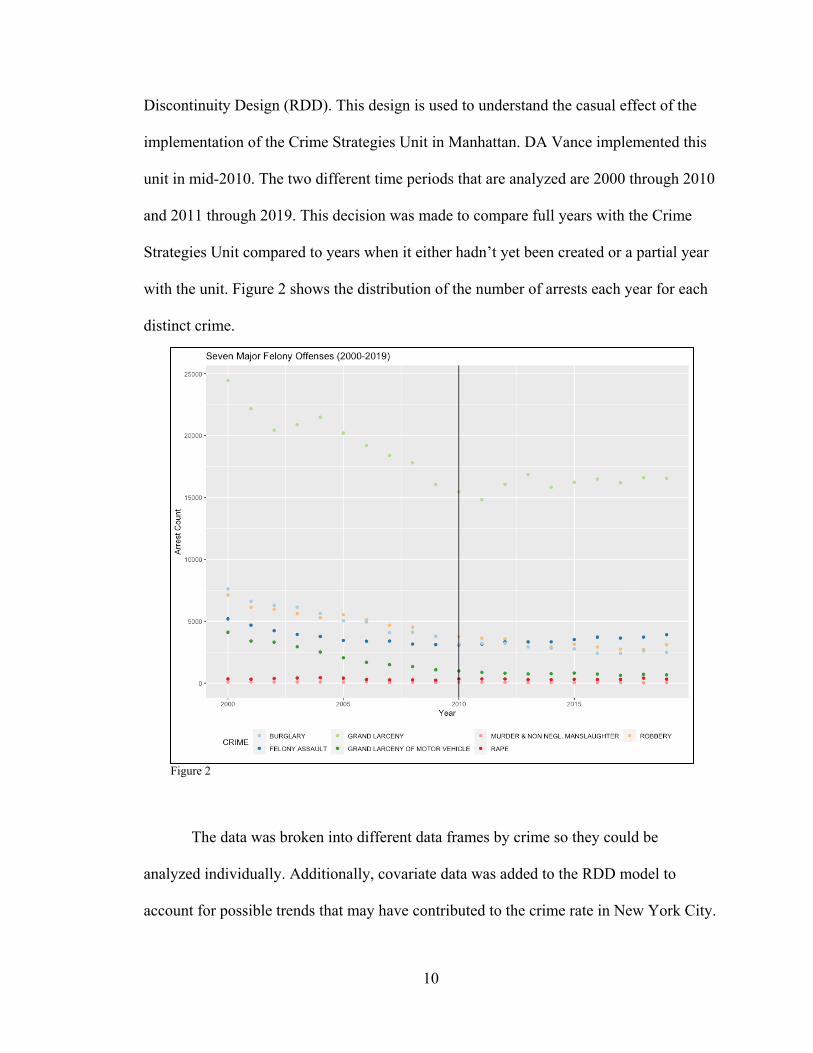
with the unit. Figure 2 shows the distribution of the number of arrests each year for each
distinct crime.
The data was broken into different data frames by crime so they could be
analyzed individually. Additionally, covariate data was added to the RDD model to
account for possible trends that may have contributed to the crime rate in New York City.
Figure 2
11
A dummy variable for the “Stop and Frisk” policy has been added with “1” signaling
when it was in effect and “0” signaling after it had been declared unconstitutional and the
New York Police Department significantly curtailed the use of it.26 The “Stop and Frisk”
policy in New York City was ruled unconstitutional in 2013 and the use of it sharply fell
off after. Additionally, the national arrest rate for all offenses was added as covariate data
to adjust for the national trend in crime. This data was added as the number of arrests per
100,000 individuals.27
26 Taahira Thompson, “NYPD's Infamous Stop-and-Frisk Policy Found Unconstitutional,” The Leadership Conference Education Fund, March 15, 2019, https://civilrights.org/edfund/resource/nypds-infamous-stop-and-frisk-policy-found-unconstitutional/. 27 “Arrests by Offense, Age, and Race,” Arrests by offense, age, and race, accessed July 4, 2021, https://www.ojjdp.gov/ojstatbb/crime/ucr.asp?table_in=2&selYrs=2000&rdoGroups=1&rdoData=r. (Arrests by offense, age, and race n.d.)
12
4 Results
The results for the Regression Discontinuity Design are broken down into distinct
graphs and tables for each of the separate felonies as well as the total number of felony
crime arrests. The initial null hypothesis for each of the felony crimes as well as the total
is that there is no difference between pre-2010 and before the Crime Strategies Unit
compared to post-2010 and after the Crime Strategies Unit was created, see Figure 3.
4.1 Murder Arrests
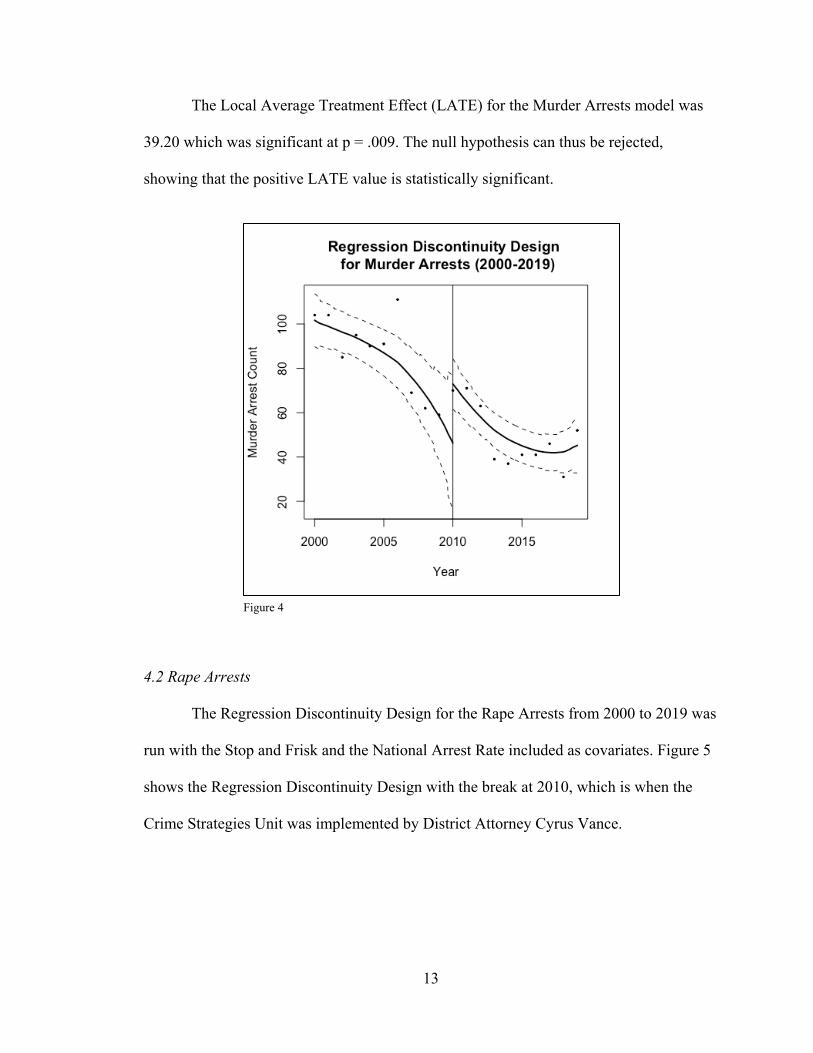
The Regression Discontinuity Design for the Murder Arrests from 2000 to 2019
was run with the Stop and Frisk and the National Arrest Rate included as covariates.
Figure 4 shows the Regression Discontinuity Design with the break at 2010, which is
when the Crime Strategies Unit was implemented by District Attorney Cyrus Vance.
H0: Treatment Effect = 0
HA: Treatment Effect ≠ 0 Figure 3
13
The Local Average Treatment Effect (LATE) for the Murder Arrests model was
39.20 which was significant at p = .009. The null hypothesis can thus be rejected,
showing that the positive LATE value is statistically significant.
4.2 Rape Arrests
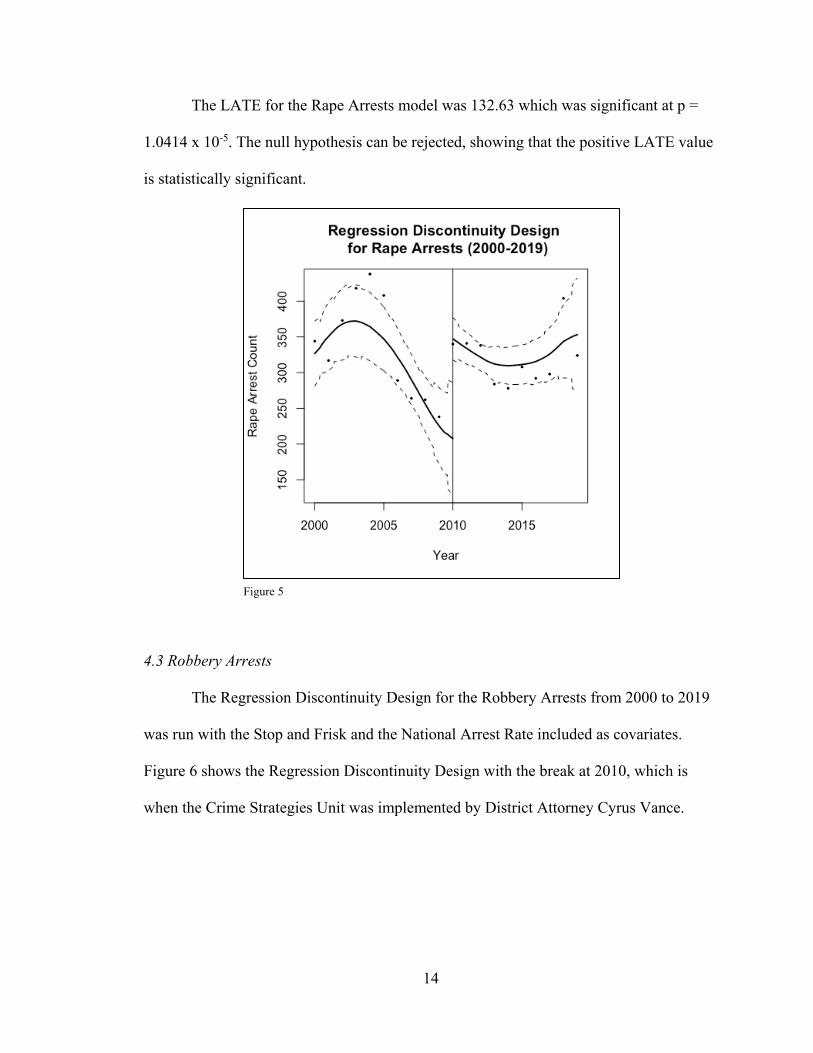
The Regression Discontinuity Design for the Rape Arrests from 2000 to 2019 was
run with the Stop and Frisk and the National Arrest Rate included as covariates. Figure 5
shows the Regression Discontinuity Design with the break at 2010, which is when the
Crime Strategies Unit was implemented by District Attorney Cyrus Vance.
Figure 4
14
The LATE for the Rape Arrests model was 132.63 which was significant at p =
1.0414 x 10⁻⁵. The null hypothesis can be rejected, showing that the positive LATE value
is statistically significant.
4.3 Robbery Arrests
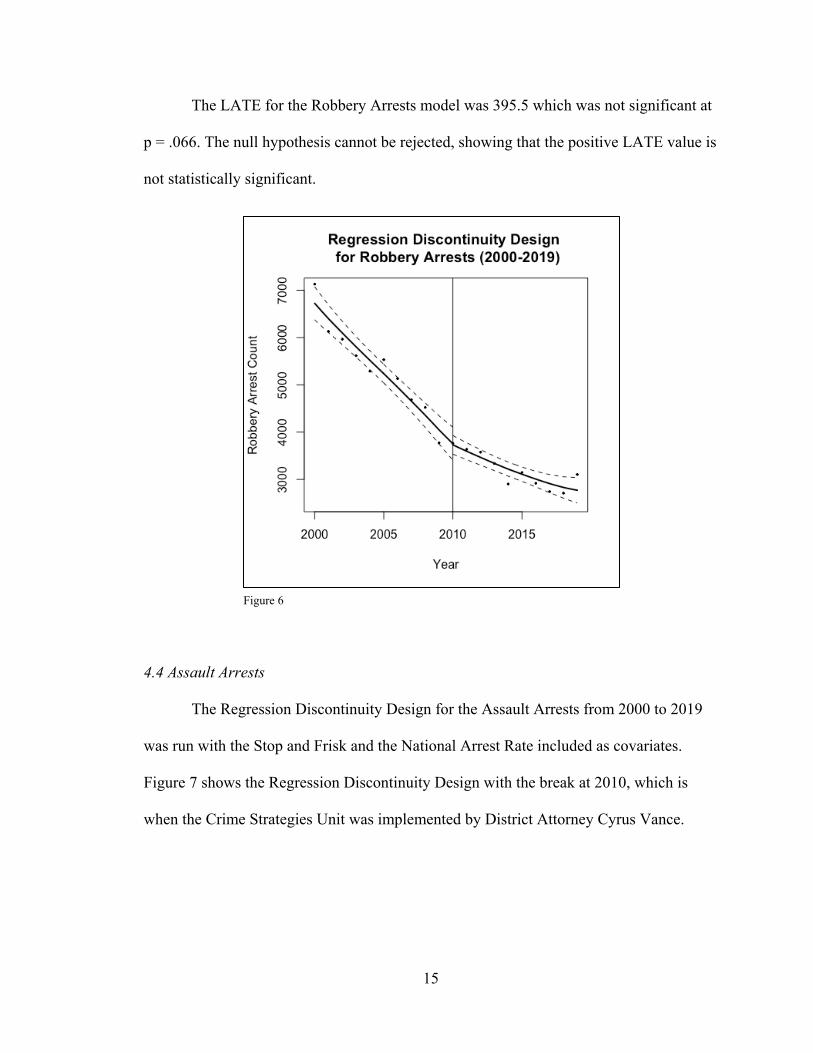
The Regression Discontinuity Design for the Robbery Arrests from 2000 to 2019
was run with the Stop and Frisk and the National Arrest Rate included as covariates.
Figure 6 shows the Regression Discontinuity Design with the break at 2010, which is
when the Crime Strategies Unit was implemented by District Attorney Cyrus Vance.
Figure 5
15
The LATE for the Robbery Arrests model was 395.5 which was not significant at
p = .066. The null hypothesis cannot be rejected, showing that the positive LATE value is
not statistically significant.
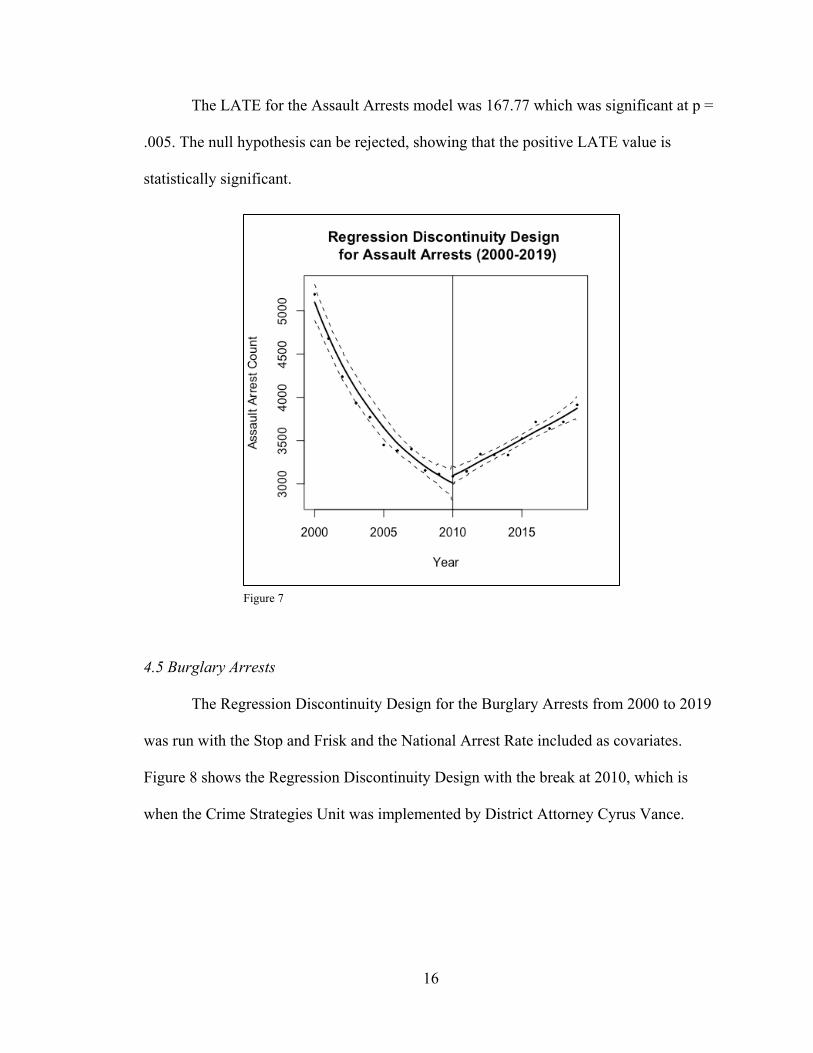
4.4 Assault Arrests
The Regression Discontinuity Design for the Assault Arrests from 2000 to 2019
was run with the Stop and Frisk and the National Arrest Rate included as covariates.
Figure 7 shows the Regression Discontinuity Design with the break at 2010, which is
when the Crime Strategies Unit was implemented by District Attorney Cyrus Vance.
Figure 6
16
The LATE for the Assault Arrests model was 167.77 which was significant at p =
.005. The null hypothesis can be rejected, showing that the positive LATE value is
statistically significant.
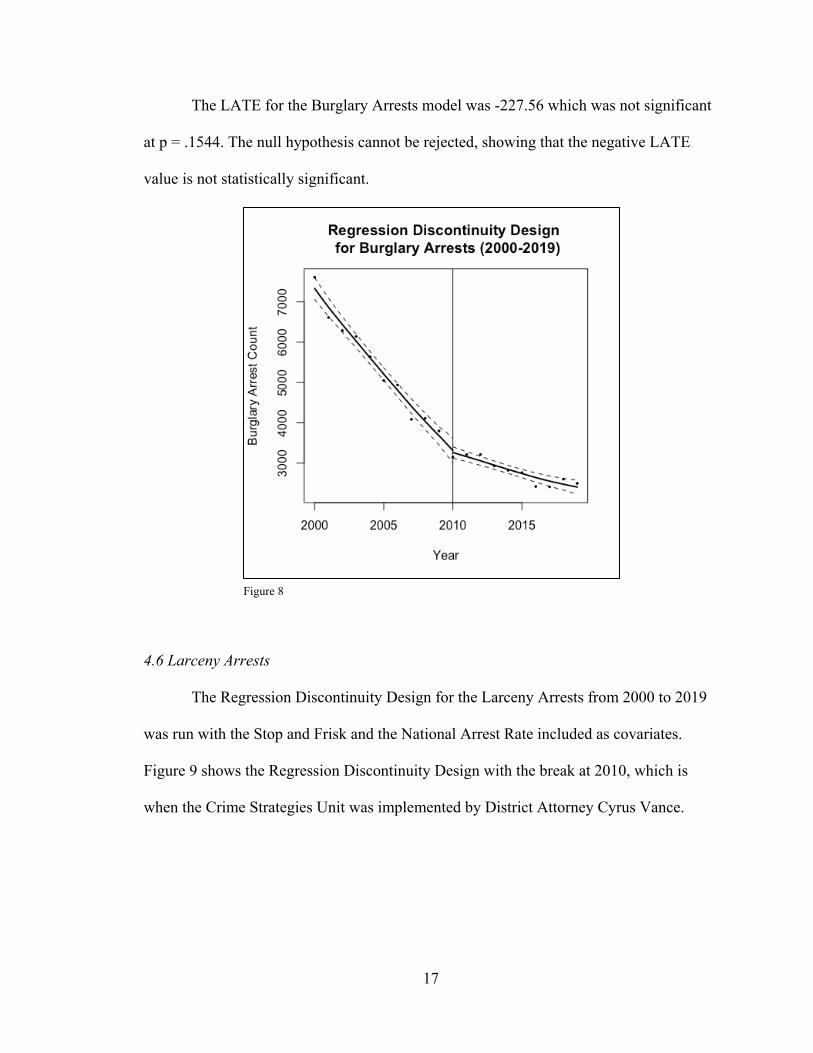
4.5 Burglary Arrests
The Regression Discontinuity Design for the Burglary Arrests from 2000 to 2019
was run with the Stop and Frisk and the National Arrest Rate included as covariates.
Figure 8 shows the Regression Discontinuity Design with the break at 2010, which is
when the Crime Strategies Unit was implemented by District Attorney Cyrus Vance.
Figure 7
17
The LATE for the Burglary Arrests model was -227.56 which was not significant
at p = .1544. The null hypothesis cannot be rejected, showing that the negative LATE
value is not statistically significant.
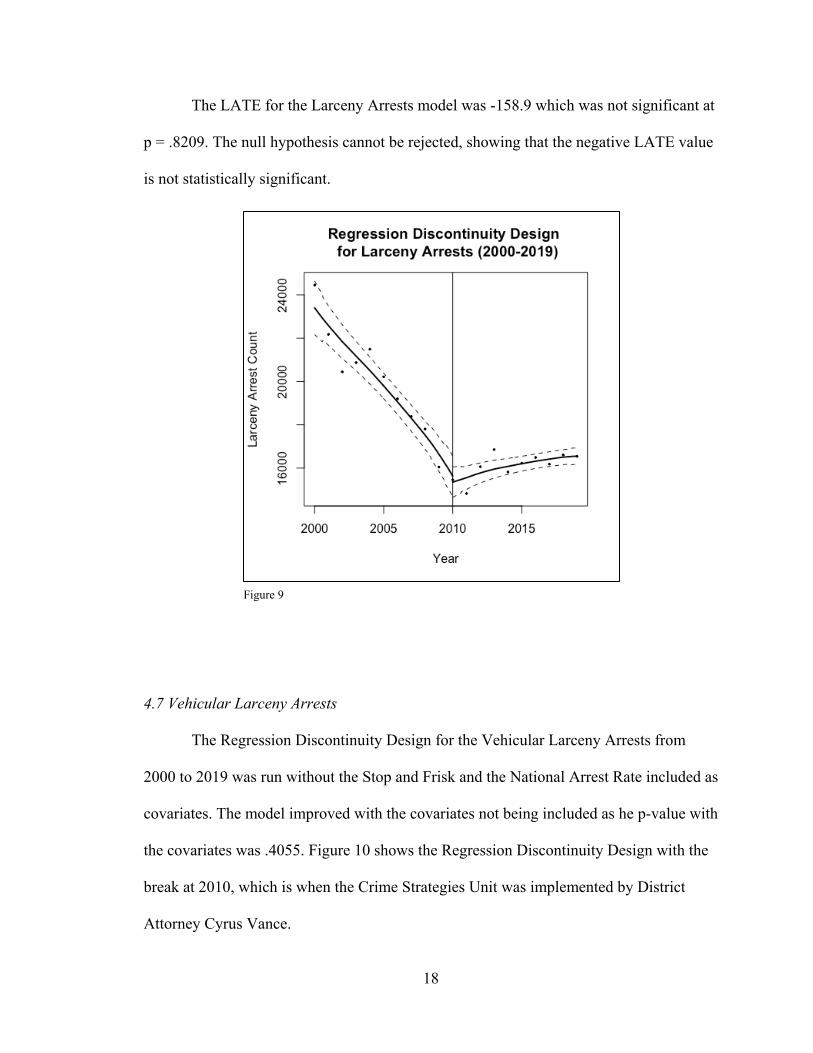
4.6 Larceny Arrests
The Regression Discontinuity Design for the Larceny Arrests from 2000 to 2019
was run with the Stop and Frisk and the National Arrest Rate included as covariates.
Figure 9 shows the Regression Discontinuity Design with the break at 2010, which is
when the Crime Strategies Unit was implemented by District Attorney Cyrus Vance.
Figure 8
18
The LATE for the Larceny Arrests model was -158.9 which was not significant at
p = .8209. The null hypothesis cannot be rejected, showing that the negative LATE value
is not statistically significant.
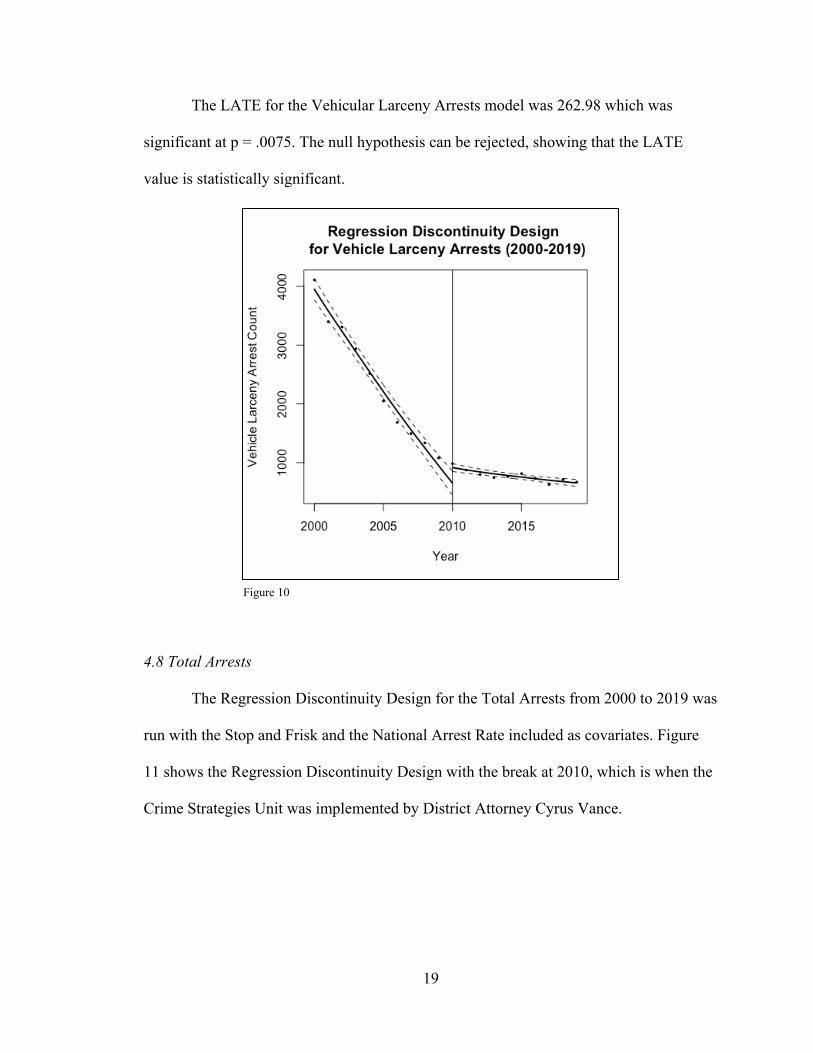
4.7 Vehicular Larceny Arrests
The Regression Discontinuity Design for the Vehicular Larceny Arrests from
2000 to 2019 was run without the Stop and Frisk and the National Arrest Rate included as
covariates. The model improved with the covariates not being included as he p-value with
the covariates was .4055. Figure 10 shows the Regression Discontinuity Design with the
break at 2010, which is when the Crime Strategies Unit was implemented by District
Attorney Cyrus Vance.
Figure 9
19
The LATE for the Vehicular Larceny Arrests model was 262.98 which was
significant at p = .0075. The null hypothesis can be rejected, showing that the LATE
value is statistically significant.
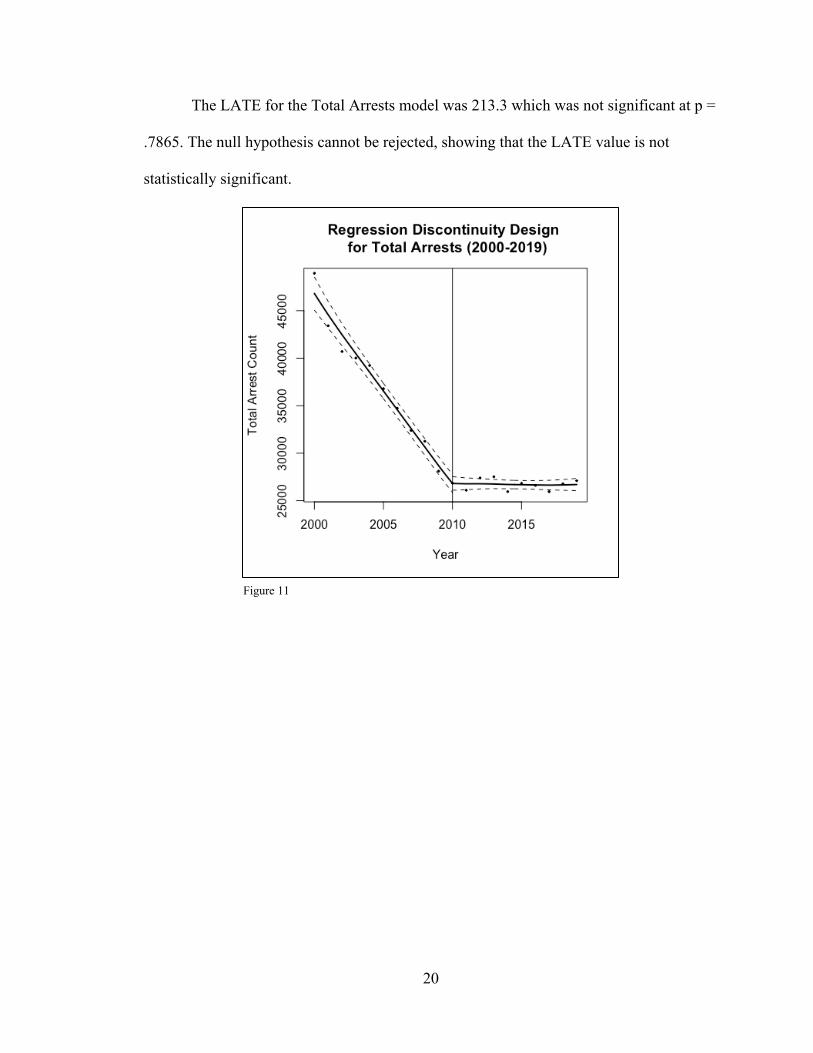
4.8 Total Arrests
The Regression Discontinuity Design for the Total Arrests from 2000 to 2019 was
run with the Stop and Frisk and the National Arrest Rate included as covariates. Figure
11 shows the Regression Discontinuity Design with the break at 2010, which is when the
Crime Strategies Unit was implemented by District Attorney Cyrus Vance.
Figure 10
20
The LATE for the Total Arrests model was 213.3 which was not significant at p =
.7865. The null hypothesis cannot be rejected, showing that the LATE value is not
statistically significant.
Figure 11
21
5 Conclusion
The purpose of this study into predictive policing methods in New York City and
specifically in Manhattan by District Attorney Cyrus Vance was to discover whether
there was a relationship between the methodology and crime rates and if crime rates
decreased as a result of the methodology being implemented. Overall, the results of the
research were inconclusive with the Murder, Rape, Assault, and Vehicular Larceny
arrests having statistically significant differences between before and after
implementation with the arrests increasing post-implementation. Meanwhile, the
Robbery, Burglary, Larceny, and Total Arrests did not have statistically significant
differences between the pre-implementation and post-implementation arrests. The null
hypothesis was that there was no Treatment Effect between the two time periods (Figure
2) and the null hypothesis was only rejected for some of the crimes and importantly not
for the Total arrests.
The limitations of the research was constricted by the parameters that the
Manhattan District Attorney had assigned to the predictive policy program. Further
research that explores a jurisdiction that combines the “crime drivers” technique
alongside a geospatial crime “hot spotting” technique would give further insight into
using both of these methods in conjunction and if that leads to significant decrease in
crime. Additionally, looking more closely into seasonal effects of policies would be a
bigger step as police departments likely be able to pull more out of an analysis when
broken down into months instead of years. This study was restricted by the data that was
reported by the New York Police Department as data by year.
22
The policy implications of the study can be utilized to further inform public safety
decision makers not only in Manhattan and New York City but other jurisdictions as
well. The study controlled for the use of “Stop and Frisk” which was declared
unconstitutional in New York City in 2013 and the national arrest rate for all offenses.
These were done to account for factors that may have played a role in the increase or
decrease of arrests that the study looked into. After controlling for these variables, there
was no significant evidence that the predictive policing methodology had a statistically
significant effect in decreasing crime. This doesn’t necessarily mean that policy makers
should discard the approach, but signifies the need to look deeper into the techniques and
examine why there isn’t a significant decrease in crime after having implemented the
policy for 10 years.
23
6 References
n.d. Arrests by offense, age, and race. Accessed July 4, 2021. “Arrests by Offense, Age, and Race,” Arrests by offense, age, and race, accessed July 4, 2021, https://www.ojjdp.gov/ojstatbb/crime/ucr.asp?table_in=2&selYrs=2000&rdoGroups=1&rdoData=r.
Beck, Charlie, and Colleen McCue. 2014. "Predictive Policing: What Can We Learn from Wal-Mart and Amazon about Fighting Crime in a Recession?" The Police Chief.
Braga, Anthony A, and David L Weisburd. 2010. "Systematic Review of the Effects of "Pulling Levers" Focused Deterrence Strategies on Crime." Campbell Systematic Reviews 1-30.
Braga, Anthony A, and David L Weisburd. 2011. "The Effects of Focused Deterrence Strategies on Crime: A Systematic Review and Meta-Analysis of the Empirical Evidence." Journal of Research in Crime and Delinquency.
Braga, Anthony A, David Weisburd, and Brandon Turchan. 2019. "Focused deterrence strategies effects on crime: A systematic review." Campbell Systematic Reviews.
Brown, Chip. 2014. Cyrus Vance Jr.'s 'Moneyball' Approach to Crime. December 3. Accessed August 15, 2021. https://www.nytimes.com/2014/12/07/magazine/cyrus-vance-jrs-moneyball-approach-to-crime.html.
Gorr, Wilpen, Andreas Olligschlaeger, and Yvonne Thompson. 2003. "Short-term forecasting of crime." International Journal of Forecasting 579-594.
Groff, Elizabeth R, and Nancy G La Vigne. 2002. "Forecasting the Future of Predictive Crime Mapping." Crime Prevention Studies 29-57.
Hunt, Priscillia, Jessica Saunders, and John S Hollywood. 2014. Evaluation of the Shreveport Predictive Policing Experiment. RAND Corporation.
Perry, Walt L. 2013. Predictive Policing: the Role of Crime Forecasting in Law Enforcement Operations.
Thompson, Taahira. 2013. NYPD's Infamous Stop-and-Frisk Policy Found Unconstitutional. August 21. Accessed July 4, 2021. Taahira Thompson, “NYPD's Infamous Stop-and-Frisk Policy Found Unconstitutional,” The Leadership Conference Education Fund, March 15, 2019, https://civilrights.org/edfund/resource/nypds-infamous-stop-and-frisk-policy-found-unconstitutional/.
Weisburd, David, Clair White, Sean Wire, and David B Wilson. 2021. "Enhancing Informal Social Controls to Reduce Crime: Evidence from a Study of Crime Hot Spots." Prevention Science.