Embed Size (px)
Citation preview
Lower East CoastRegional Water Supply Plan
Planning Document
prepared by
South Florida Water Management District
May 2000
Water Supply Planning and Development DepartmentWest Palm Beach, Florida

LEC Regional Water Supply Plan - Planning Document Acknowledgements
ACKNOWLEDGEMENTS
The Lower East Coast Regional Water Supply Plan was a large-scale planningeffort to ensure future water supplies for 75 percent of the South Florida WaterManagement District’s population through 2020. A large multidiscipline team withextensive technical support was required to perform the detailed analysis using state-of-the-art computer modeling tools.
The SFWMD would like to thank our own staff and recognize the followingindividuals.
Frank R. Finch Executive DirectorPatrick J. Gleason Governing Board Member and LEC Regional Water Supply Plan
Advisory Committee ChairmanKenneth G. Ammon Director, Water Supply DivisionDean Powell Deputy Director, Water Supply DivisionMatthew Morrison Director, Water Supply Planning and Development Department
Project Manager
John Mulliken
Plan Manager
Brenda Mills
Technical Editor
Kim Jacobs
Principal Contributors
Scott BurnsMax DayLou DevillonMurray Miller
Jayantha ObeysekeraDawn ReidCecile RossTommy Strowd
Dave SwiftJoel VanArmanCarl Woehlcke
Lead Regional Modelers
Luis Cadavid Ray Santee Ken Tarboton
Lead Ground Water Modelers
Diane AdamCallie Buchanan
Jeff GiddingsEmily Hopkins
Paul Linton
i

Acknowledgements LEC Regional Water Supply Plan - Planning Document
Supporting Contributors
Steve AndersonMaribel BalbinRick BowerHal Hennessey CorreaClyde DabbsKate EdgertonJulio FanjulSandra FormatiNestor GarridoJenni HiscockDan HaunertAmalia HernandezJim Karas
Siaka KoneKen KonyhaPete KwiatkowskiKathy LaMartinaJohn LukasiewiczJorge MarbanDick MarchSusan MasonJeff NeedleCal NeidrauerRick NevulisAnn OvertonAkin Owosina
Winnie ParksDonna RickabusKevin RohrerMorris RosenJeff RosenfeldBeth RossShawn SculleyJanet StarnesMilt SwitanekSharon TrostLen WagnerPat WalkerJohn Zahina
Supporting Modelers
Alaa AliJenifer BarnesLehar BrionKathy CollinsPhil Fairbanks
Angela MontoyaSashi NairRaul NovoaPaul TrimbleJose Valdes
David WelterMark WilsnackLucia Zamorano
Technical Support
Eric BergquistDebra BennettDebra CaseCheri CraftLynn CrutchfieldMatt DavisNancy DemonstratiJuan Diaz-CarrerasPattie Fulton
Matthew HintonJimmy KrampKumar KrishanShiyong LinMaryam MashayekhiRick MiessauMarie PietruchaKevin RodbergMike Rose
Kurt SaariKathy SantamarinaDonald StewartXiaosong WangCindy WhelanJanet WiseMike WarnerDale Woodruff
Past Project Managers
Ken Ammon Jayantha Obeysekera Tom Teets
Past Committee Chairs
Rep. Annie Betancourt Betsy Krant Miriam Singer
ii

LEC Regional Water Supply Plan - Planning Document Advisory Committee Members
Lower East Coast Regional Water Supply PlanAdvisory Committee Members
Patrick J. Gleason, Committee ChairmanSouth Florida Water Management District Governing Board
Sue AlspachMiami-Dade County
DERMAlternates: Carlos Espinosa
and Jean Envoy
Doug AndrewsCity of Boca RatonUtilities Department
Clarence AnthonyCity of South Bay
Stuart AppelbaumU.S. Army Corps of
EngineersAlternate: Steve Sutterfield
Sarah BellmundEverglades National Park
Alternate: Bob Johnson
Rim BishopSeacoast Utility Authority
Alternate: David Brown
John BondeIndian Trail Water Control
District
Al CallowayNAACP - Broward County
Ruth ClarkLeague of Women Voters
of Broward CountyAlternate: Barbara Marx
Captain Ed DavidsonFlorida Audubon Society
Ruth DooleyLeague of Women Voters
of Palm Beach County
Truman DuncanMiccosukee Tribe of
Indians of FloridaAlternates: Jim Harvey and
Terry Rice
Hugh EnglishA. Duda & Sons, Inc.Alternate: Tom Jones
Shannon EstenozWorld Wildlife Fund
David FerrellU.S. Fish and Wildlife
Service
Freddy FisikelliFlorida Wildlife Federation
Alternate: Barbara JeanPowell
J. W. FrenchLee County Public Works
Richard FrostBiscayne National Park
Teresita GarciaBermello, Ajamil &
Partners, Inc.
James GarnerAnnis, Mitchell, Cockey,
Edwards & RoehnAlternate: Irene Quincey
Carl GoodwinU.S. Geological Survey,
WRDAlternate: Barbara Howie
Richard HarveyU.S. EnvironmentalProtection Agency
Alternate: Jan Rogers
George HaughneyCity of Cooper CityAlternate: Mel Entus
Tony HuiBroward County Office ofEnvironmental Services
Tom KirbyMiami-Dade County Farm
BureauAlternate: Tom MacVicar
Gregory KiselaCity of Fort LauderdaleAlternate: Frank Coulter
Shawn KomlosNational Audubon Society
Paul LarsenLarsen & Associates
Wilhelmena MackRight Management
Consultants
Patrick MartinLake Worth Drainage
DistrictAlternate: Mark Perry
Mary Ann PooleFlorida Fish and Wildlife
Conservation Commission
Fred RapachPalm Beach County Water
Utilities
Ken ReardonCity of West Palm Beach
UtilitiesAlternate: Raymond Taylor
James ReynoldsFlorida Keys Aqueduct
AuthorityAlternate: JoLynn Cates
Roy ReynoldsBroward County WaterManagment DivisionAlternate: David Lee
Carol Rist1,000 Friends of Florida
Jorge RodriguezMiami-Dade County Water
& Sewer Dept.Alternate: Bertha
Goldenberg
Peter RosendahlFlorida Crystals, Inc.
Alta Renee RossLeague of Women Voters
of Dade Co.
Craig TepperSeminole Tribe of Florida
Alternate: SusieKippenberger
Whit Van CottCity of Hollywood Utilities
Dept.Alternate: Don Bayler
Malcolm Wade, Jr.U.S. Sugar Corporation
Alternate: Phil Parsons andSusan Brown
Patti WebsterEnvironmental Coalition of
Broward County
Herb ZebuthFlorida Department of
Environmental ProtectionAlternate: Michele Owens
iii

Advisory Committee Members LEC Regional Water Supply Plan - Planning Document
iv
LEC Regional Water Supply Plan - Planning Document Executive Summary
EXECUTIVE SUMMARY
Introduction
The Lower East Coast Regional Water Supply Plan (LEC Plan) provides ablueprint to help meet the water resource needs of a rapidly growing South Floridabetween now and 2020. Technical analyses of this area’s future water needs and theavailability of water supplies indicate that extensive actions are required to ensure that asustainable water supply is available to fulfill future urban, agricultural, and naturalsystems water needs. The actions recommended in this plan will meet these needs.Analyses show that the recommended projects must be built on schedule or the region willface a significant increase in the risk of water shortages and environmental decline.
The Lower East Coast (LEC) Planning Area is expected to experience substantialgrowth between now and 2020, increasing by almost 58 percent from 1995. Most of thisincrease in population will occur in the coastal area, which is projected to have almostseven million residents in 2020. This growth will create additional water demands forpotable and irrigation water. Agricultural water demand, primarily for irrigation of rowcrops, ornamental horticulture, and sugarcane, is projected to decrease by seven percentreflecting a reduction in the area cultivated to approximately 480,000 acres. The overallwater demands of consumptive users is projected to increase by 20 percent, to 2.52 billiongallons per day on average. In addition, significant increases in water supply deliverieswill be needed to sustain and restore the natural systems of South Florida.
Development of proactive water resource and water supply development projectsis imperative to both meet water demands and restore critical ecosystems in the coastalestuaries, Lake Okeechobee, the Everglades, and the Biscayne Bay. The South FloridaWater Management District (District) is primarily responsible for water resourcedevelopment. Local governments, water users, and water utilities are primarilyresponsible for implementing water supply development. When appropriate, and resourcesare available, the District will also assist water supply development efforts at the locallevel.
Purpose
The purpose of this plan is to fulfill the requirements of Section 373.0361, FloridaStatutes (F.S.), for regional water supply plans. Implementing this plan, which complieswith the statutory requirements, will ensure significant benefits to the people in SouthFlorida and the natural systems by providing guidance, funding, and resources needed todevelop regional and local water supplies.
v

Executive Summary LEC Regional Water Supply Plan - Planning Document
Achievements
Implementation of the LEC Plan will do the following:
• Create a water supply that fully meets the future (2020) needs ofalmost seven million people, agriculture and industries during a1-in-10 year drought
• Reduce the number and severity of violations of Minimum Flowand Levels (MFL) criteria for the Everglades, Lake Okeechobee,and the Biscayne aquifer by 2020
• Reserve from allocations sufficient water to allow for therestoration of the Everglades and enhancement of othersignificant natural systems
• Reduce the uncertainty for issuing long-term permits for waterusers as they invest in tomorrow’s water supply infrastructure
• Provide public forums to modernize District operationalprocedures and promote greater flexibility in the operation of theregional water management system
Relationship with Comprehensive Everglades Restoration Plan
In 1997, the District merged its LEC regional water supply analyses of major waterstorage facilities into the Central and Southern Florida Project Comprehensive Review(Restudy) process. The Restudy was a multiyear planning effort by the U.S. Army Corpsof Engineers and the District, which was completed in April 1999 with publication of theCentral and Southern Florida Comprehensive Review Study Final Feasibility Report andProgrammatic Environmental Impact Statement. The water supply planning effortscompleted from 1992 to 1997 for the LEC Plan provided the foundation, in the form ofanalytical tools, evaluation techniques, and storage projects for the Restudy. The Restudyis being refined and implemented through the Comprehensive Everglades RestorationPlan (CERP). This LEC Plan incorporates the CERP construction and operational featuresinto the state planning process to determine how much water can be made available fromthe regional system through the state regulatory program. The water supply planningprocess also verified that the sequencing of proposed Restudy components at five-yearincrements through 2020 would protect existing legal water users, protect water resourcesfrom significant harm, and balance the future water needs of the region. The LEC Planalso identified improvements to that should be considered as the CERP moves forward.
Statutory Requirements
The LEC Plan integrates the federal water management process (CERP) into thestate process, described in Section 373.0361, F.S., and other pertinent sections of Chapter373, F.S., by including the following:
vi
LEC Regional Water Supply Plan - Planning Document Executive Summary
• Analyses based on at least a 20-year planning period
• Estimated water supply demands for all existing and future usersand the environment up to a 1-in-10 year level of certainty
• Water resource development projects, implementation schedules,costs, and funding strategies
• Descriptions of water supply development options, theireffectiveness, and estimated cost to implement
• Minimum Flows and Levels (MFL) recovery and preventionstrategies for four priority water bodies and recommendations fordevelopment of MFLs for other water bodies
• Technical data and information to support the plan
Process
This planning document is the product of a public process, which relied heavily onan advisory committee representing federal, state, tribal, agricultural, urban, andenvironmental interests. The LEC Regional Water Supply Plan Advisory Committee wasinitiated in 1992. The committee participated in development of both the Interim Plan forLower East Coast Water Supply (LEC Interim Plan) (SFWMD, 1998b) and this 20-yearplan.
Two existing hydrologic models, the South Florida Water Management Model andthe Natural System Model, and five recently developed, high resolution, ground watermodels were applied to analyze how the hydrology of South Florida performs under futureconditions. Projections for urban and agricultural water demands and sources wereincorporated, as well as future land use projections, construction of water managementfeatures, such as the Everglades Construction Project, and operational features, such as theWater Supply and Environmental schedule for Lake Okeechobee. Performance measureswere applied to evaluate the computer simulations. The performance measures relate tothe goals of the plan, provide water to meet a 1-in-10 year level of certainty, and providefor hydrologic restoration of the Everglades through 2020.
Other planning efforts are linked to the LEC Plan and are important to meeting itsobjectives. Three District plans, the Lower West Coast Water Supply Plan (SFWMD,2000b), the Kissimmee Basin Water Supply Plan (SFWMD, 2000c), and theCaloosahatchee Water Management Plan (CWMP) (SFWMD, 2000d) were approved bythe Governing Board in April 2000. Two federal planning projects, the Water PreserveAreas and Southwest Florida feasibility studies, are under way. These other efforts wereintegrated to the greatest degree possible with the LEC planning process. TheCaloosahatchee Water Management Plan evaluated water supply in an area linked to theLEC Planning Area by virtue of its dependence on Lake Okeechobee. Itsrecommendations are included as part of the LEC Plan. Additional integration of the planwill occur as part of related implementation efforts or as water supply plans are
vii
Executive Summary LEC Regional Water Supply Plan - Planning Document
periodically updated. This plan will be reviewed and updated at least every five years toensure that future water needs of LEC Planning Area continue to be met.
Conclusions of Analysis
It was concluded that construction and implementation of the CERP componentsand appropriate management and diversification of water supply sources will ensuresufficient water to meet the needs of the LEC Planning Area up to and including a 1-in-10year drought condition. Urban areas may reach a 1-in-10 year level of certainty by 2010.Agricultural users that depend on Lake Okeechobee may reach a 1-in-10 year level ofcertainty by 2015 if the construction and operational features in the LEC Plan areimplemented. The proposed MFLs will also be achieved in Lake Okeechobee, theEverglades, and the Biscayne aquifer by 2020. Also, a majority of restoration targets forthe Everglades can be met by 2020 if this plan is implemented, although CERP featureswill not be fully implemented until 2037.
Recommendations for Water Resource Development
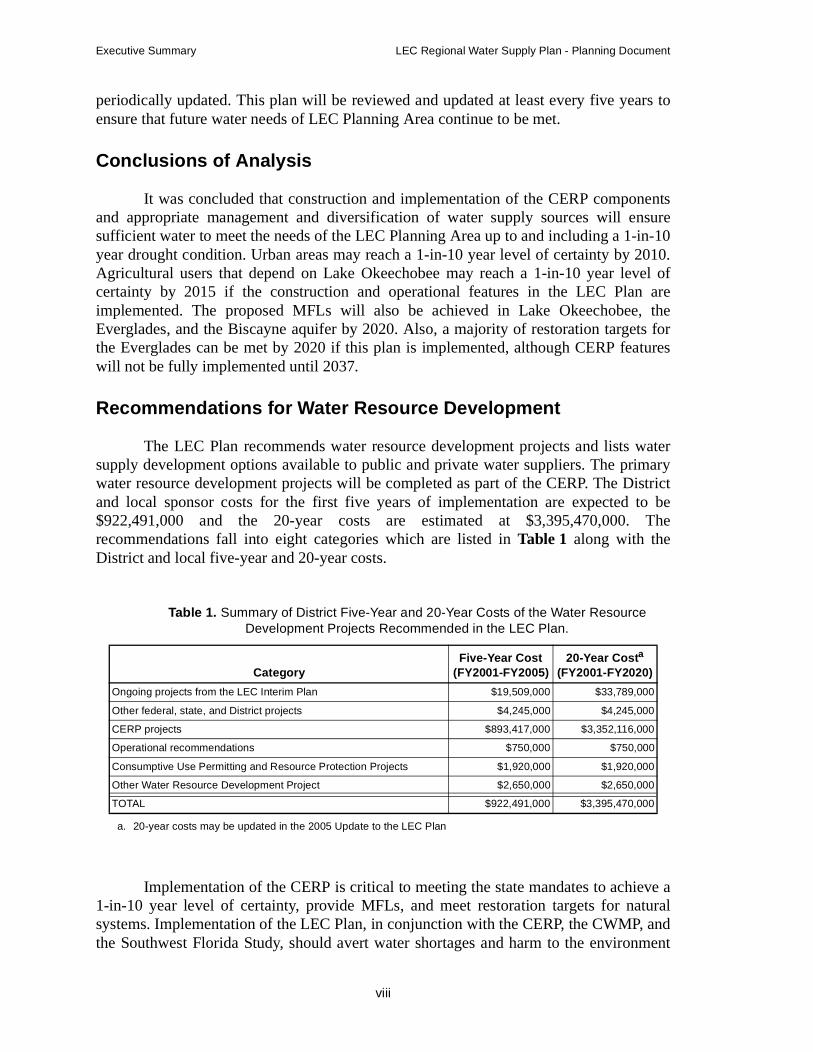
The LEC Plan recommends water resource development projects and lists watersupply development options available to public and private water suppliers. The primarywater resource development projects will be completed as part of the CERP. The Districtand local sponsor costs for the first five years of implementation are expected to be$922,491,000 and the 20-year costs are estimated at $3,395,470,000. Therecommendations fall into eight categories which are listed in Table 1 along with theDistrict and local five-year and 20-year costs.
Implementation of the CERP is critical to meeting the state mandates to achieve a1-in-10 year level of certainty, provide MFLs, and meet restoration targets for naturalsystems. Implementation of the LEC Plan, in conjunction with the CERP, the CWMP, andthe Southwest Florida Study, should avert water shortages and harm to the environment
Table 1. Summary of District Five-Year and 20-Year Costs of the Water Resource Development Projects Recommended in the LEC Plan.
CategoryFive-Year Cost
(FY2001-FY2005)20-Year Costa
(FY2001-FY2020)
a. 20-year costs may be updated in the 2005 Update to the LEC Plan
Ongoing projects from the LEC Interim Plan $19,509,000 $33,789,000
Other federal, state, and District projects $4,245,000 $4,245,000
CERP projects $893,417,000 $3,352,116,000
Operational recommendations $750,000 $750,000
Consumptive Use Permitting and Resource Protection Projects $1,920,000 $1,920,000
Other Water Resource Development Project $2,650,000 $2,650,000
TOTAL $922,491,000 $3,395,470,000
viii

LEC Regional Water Supply Plan - Planning Document Executive Summary
during a 1-in-10 year drought. However, successful implementation of the LEC Plan isdependent on completing the rule development for MFLs, reservations of water for theenvironment, and consumptive use permits.
The CWMP determined that projected surface water needs of the CaloosahatcheeRiver basin and estuary can be met based on recommended water management andstorage infrastructure that effectively capture and store surface water flows in the basin.The CWMP recommendations for modifications to demand projection methodology, theAquifer Storage and Recovery (ASR) Pilot Project, and the C-43 Storage Project will bereferred to the CERP and the Southwest Florida Study. As in the LEC Planning Area,meeting the 1-in-10 year level of certainty for the Caloosahatchee Basin depends oncompleting the CERP projects.
Recommendations for Water Supply Development
Use of the traditional source for public water, the Surficial Aquifer System, can beexpanded with completion of proposed water resource development projects and moreefficient use of regional and local water supplies. The Surficial Aquifer System is limitedin some areas due to increased potential for impacts on wetland systems and for saltwaterintrusion in coastal areas in the vicinity of public water supply wellfields. Coastal areaswith limited access to regional water are more likely to require implementation of thewater supply development options described in the LEC Plan.
Eight water source options were identified to address water supply needs of theLEC Planning Area. These options either make additional water available fromhistorically used sources or other sources, or provide additional management throughconservation and storage of water. The options are as follows (no implied priority):
Strong emphasis is placed on implementation of a comprehensive waterconservation program. Conservation will be encouraged through cooperative effortsamong water users, utilities, local governments, and the District. These efforts willincorporate many initiatives, including continued development and compliance with waterconservation ordinances, development and implementation of public education programs,use of alternative water sources, continued emphasis on water conservation in theDistrict’s surface water and consumptive use permitting programs, and other means. Localgovernments and users will play a key role in making these strategies a success, throughadoption of conservation ordinances, homeowner awareness programs, land use decisions,and development of water supply options by local governments, utilities, and water users.
• Conservation
• Surficial Aquifer System
• Floridan Aquifer System
• Reclaimed Water
• Seawater
• ASR
• Reservoirs
• Surface Water
ix
Executive Summary LEC Regional Water Supply Plan - Planning Document
The Floridan aquifer appears to be a promising source for additional potable waterin areas with limited access to regional supplies, but little is known about long-term waterquality impacts of sustained withdrawals from this aquifer. As a result, the District iscurrently refining the Floridan aquifer ground water model and the Floridan aquifer waterquality and water level monitoring networks. Several public water utilities already usereverse osmosis technology to remove salt from the saline water in the Floridan aquifer.
From a regional perspective, the use of ground water sources, reclaimed water,surface water, and storage through development of a regional or subregional irrigationwater distribution system(s) will be sufficient to meet the urban and irrigation demands.Water from the Surficial Aquifer System and reclaimed water have been used historicallyto meet such demands. However, in some areas of the LEC Planning Area, these sourceswill need to be augmented. The feasibility of developing a regional irrigation waterdistribution system using reclaimed water is being considered in northern Palm BeachCounty.
In the southeastern portion of the LEC Planning Area, it was concluded thatexisting surficial aquifer and Floridan aquifer system ground water sources are sufficientto meet the 2020 projected urban demands with minimal potential impacts. Somemodifications to wellfield configurations and well operations will be needed at the locallevel to meet a 1-in-10 year level of certainty and avoid potential impacts to waterresources and other existing legal users.
Improved management of surface water through storage could increase freshwateravailability in the region and reduce potential impacts resulting from water use. ASRtechnology shows promise both for treated and untreated water by providing capacity tocapture and store excess water when it is available. This technology is currently beingused by several utilities at the local level. In addition to continued use and development atthe local level, application of ASR on a regional scale has been identified as an option tocapture excess surface water in several basins including Lake Okeechobee. Regional andlocal retention projects will reduce excess water discharged to estuarine systems andincrease water availability inland by increasing water levels in canals and providingadditional ground water recharge.
x

LEC Regional Water Supply Plan - Planning Document Table of Contents
TABLE OF CONTENTS
Acknowledgements i
Advisory Committee Members iii
Executive Summary v
List of Tables xiii
List of Figures xix
List of Abbreviations and Acronyms xxi
Chapter 1: Introduction 1
Background ..............................................................................................................1
Overview..................................................................................................................3
Legal Basis...............................................................................................................5
Relationship to Other Plans and Programs ............................................................14
Meeting Present Needs and the Needs of Future Generations...............................21
Chapter 2: The Water Supply Planning Process 23
Process Overview ..................................................................................................23
Implementing the Process ......................................................................................25
Public and Government Participation ....................................................................42
Chapter 3: Planning Area Description 45
Introduction and Overview ....................................................................................45
Topography ............................................................................................................47
Geology and Soils..................................................................................................48
Climate...................................................................................................................50
Natural Systems .....................................................................................................51
Water Quality.........................................................................................................57
Water Management................................................................................................65
Socioeconomics .....................................................................................................74
xi

Table of Contents LEC Regional Water Supply Plan - Planning Document
Land Use ................................................................................................................74
Recreation Resources.............................................................................................75
Water Supply and Flood Control ...........................................................................76
Chapter 4: Analysis and Evaluation of Model Results 83
Analytical Process Overview.................................................................................83
Relationship Between Goals and Planning Criteria...............................................85
Planning Criteria and Performance Measures .......................................................85
Model Simulations .................................................................................................96
Analysis Overview...............................................................................................113
Urban and Agricultural Water Supply Results ....................................................114
Environmental Resources Results .......................................................................135
Systemwide Performance ....................................................................................175
Chapter 5: Implementation Strategies and Basis for Recommendations 187
Introduction..........................................................................................................187
Regional Water Supply Plan Implementation Strategies.....................................187
Statutory Definition of Water Resource Development and Water Supply Development ........................................................................................................204
Water Resource Development Projects ...............................................................206
Water Supply Development Options ...................................................................241
Conclusions..........................................................................................................268
Chapter 6: Recommendations 271
Introduction..........................................................................................................271
Water Resource Development Projects ...............................................................272
Water Supply Development Projects ...................................................................328
Relationship of Projects to the Five-Year Work Program...................................329
Funding ................................................................................................................329
Summary of Recommendations...........................................................................332
Glossary 343
References 355
xii

LEC Regional Water Supply Plan - Planning Document List of Tables
LIST OF TABLES
Table 1. Summary of District Five-Year and 20-Year Costs of the Water Resource Development Projects Recommended in the LEC Plan. ............................... viii
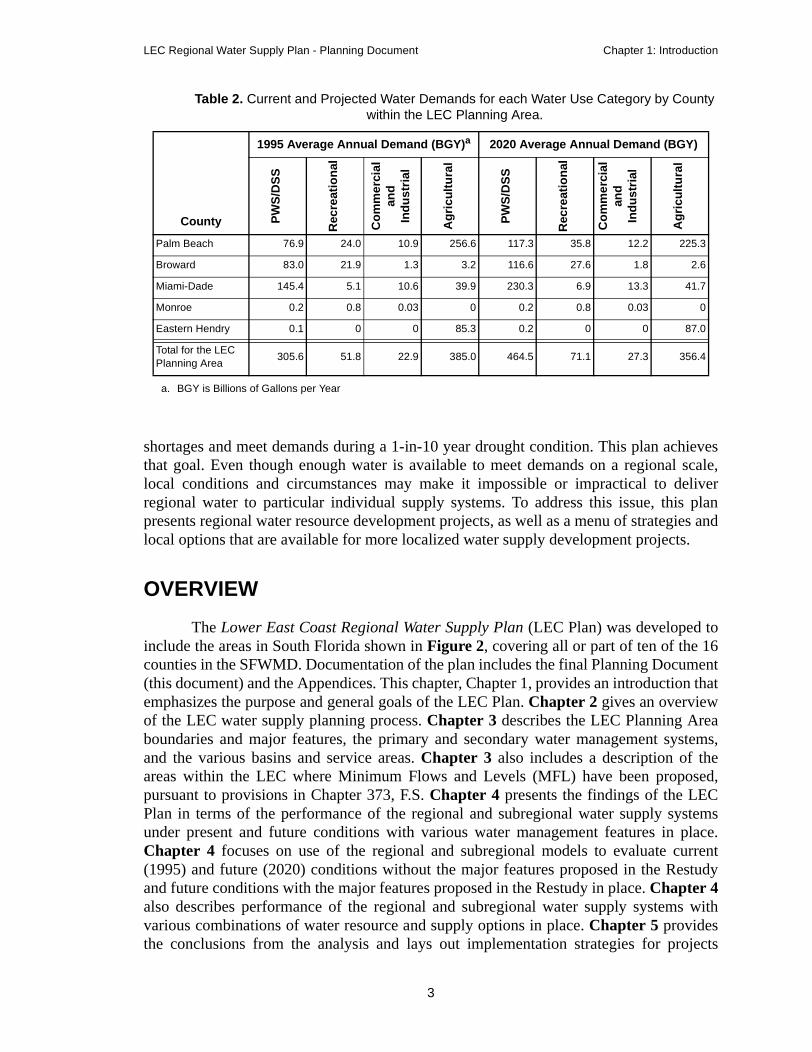
Table 2. Current and Projected Water Demands for each Water Use Category by County within the LEC Planning Area...........................................................................3
Table 3. Summary of Strategies and Recommended Actions Developed to Meet the Objectives of the LEC Plan. ............................................................................13
Table 4. Specifications of the High-Resolution Ground Water Models. .......................37
Table 5. Threatened and Endangered Plant and Animal Species Found in the Lower East Coast Planning Area. .......................................................................................56
Table 6. Minimum Canal Operation Levels of Coastal Canals. ....................................91
Table 7. Acronyms for SFWMM and Subregional Ground Water Model Base Case and Alternatives Simulations. .................................................................................98
Table 8. Comparison of Assumptions in the 1995 and 2020 Base Cases, 2020 with Restudy, and LEC-1 Simulations.....................................................................99
Table 9. Components Included in the 2020 with Restudy Model Simulations. ..........103
Table 10. Implementation Schedule for Restudy Components in Five-Year Increments......................................................................................................106
Table 11. Acronyms for SFWMM Incremental Simulations.........................................108
Table 12. Comparison of Assumptions for Incremental Model Simulations by theSFWMM. .......................................................................................................109
Table 13. Revised Performance Targets for the St Lucie Estuary. ................................113
Table 14. Information on All Water Restrictions in the SFWMM Simulations for the Base Cases and Alternatives for the Lake Okeechobee Service Area....................116
Table 15. Information on Water Restrictions in the SFWMM Incremental Simulations for the LOSA. ......................................................................................................117
Table 16. Comparison of Assumptions for the Base Case and Alternative Simulations. ...................................................................................................122
Table 17. Assumptions for the Incremental Model Simulations by SFWMM. .............122
Table 18. Number of Years with Water Restrictions Caused by Local Triggers in the Base Case and Alternative SFWMM Simulations for the Lower East Coast Service Areas During the 30 Water Years Simulated.................................................124
Table 19. Number of Times Water Restriction Triggers in the SFWMM Base Case and Alternatives for the Lower East Coast Service Area Were Triggered...........125
Table 20. Water Supply Results for Ground Water Model Simulations of the 2020 with Restudy and the LEC-1 Alternatives. ............................................................128
xiii
List of Tables LEC Regional Water Supply Plan - Planning Document
Table 21. The Number of Days Each Water Restriction Area Was Cutback in the LEC Service Areas Due to Local Ground Water Conditions.................................131
Table 22. Number of Years with Water Restrictions Caused by Local Triggers in the SFWMM Incremental Simulations for the Lower East Coast Service Areas during the 30 Water Years Simulated. ...........................................................132
Table 23. Number of Times Water Restriction Triggers in the SFWMM Incremental Simulations for the Lower East Coast Service Areas Were Triggered..........133
Table 24. South Florida Water Management Model Results for Base Cases and Alternatives for Natural Areas within the Lower East Coast Planning Area................................................................................................................137
Table 25. South Florida Water Management Model Results for Incremental Simulations for Natural Areas within the Lower East Coast Planning Area. ....................139
Table 26. Summary of Base Case and Alternative Modeling Results for Lake Okeechobee Priority Performance Measures. ....................................................................141
Table 27. The Ability of Base Case and Alternative Simulations to Meet Proposed Minimum Water Level Criteria for Lake Okeechobee for the 31-Year Simulation Period. .........................................................................................142
Table 28. Summary of Incremental Modeling Results for Lake Okeechobee Priority Performance Measures...................................................................................143
Table 29. Lake Okeechobee Minimum Flows and Levels Incremental Results for the 31-Year Simulation Period. ...........................................................................144
Table 30. Number of Times Discharge Criteria Were Exceeded for the St. Lucie Estuary During the 31-Year Simulation Period. .........................................................146
Table 31. Number of Times Discharge Criteria Were Exceeded for the 31-Year Simulation Period in the Incremental Simulations for the St. Lucie Estuary. ..........................................................................................................147
Table 32. Number of Times Discharge Criteria Were Exceeded for the Caloosahatchee Estuary During the 31-Year Simulation Period. ............................................148
Table 33. Number of Times Discharge Criteria Were Exceeded for the 31-Year Simulation Period in the Incremental Simulations for the CaloosahatcheeEstuary. ..........................................................................................................148
Table 34. Number of Times Discharge Criteria Were Exceeded for the Lake Worth Lagoon During the 31-Year Simulation Period. ............................................150
Table 35. Number of Times Discharge Criteria Were Exceeded During the 31-Year Simulation Period in the Incremental Simulations for the Lake Worth Lagoon. ..........................................................................................................150
Table 36. Duration of Average Annual Flooding in the Base Case and Alternative Simulations for the Everglades. .....................................................................153
Table 37. Number of Weeks Water Levels Were Below The Low Water Depth Criterion in the Base Case and Alternative Simulations for the Everglades.................154
xiv

LEC Regional Water Supply Plan - Planning Document List of Tables
Table 38. Number of Weeks the High Water Depth Criterion was Exceeded in the Base Case and Alternative Simulations for the Everglades. ..................................154
Table 39. Duration of Average Annual Flooding in the Incremental Simulations for theEverglades......................................................................................................155
Table 40. Number of Weeks Water Levels Were Below the Low Water Depth Criterion in the Incremental Simulations for the Everglades. .......................................155
Table 41. Number of Weeks the High Water Depth Criterion was Exceeded in the Incremental Simulations for the Everglades. .................................................156
Table 42. Total Average Annual Flows Discharged into Northern Everglades National Park, East and West of L-67A (1000 ac-ft). ..................................................165
Table 43. Mean NSM Hydroperiod Matches with Respect to NSM. ............................165
Table 44. Minimum Water Level, Duration, and Return Frequency Performance Measures for Selected Water Management Gages Located within the Everglades (SFWMD, 2000e)........................................................................168
Table 45. Minimum Flows and Levels Results of the Base Case and Alternative Simulations for the Everglades. .....................................................................169
Table 46. Minimum Flows and Levels Results of the Incremental Simulations. ..........171
Table 47. Total Mean Annual Flows Discharged into Northern, Central, and Southern Biscayne Bay for the Base Case and Alternative Simulations during the 31-Year Simulation Period. .........................................................................................172
Table 48. Total Mean Annual Flows Discharged into Northern, Central, and Southern Biscayne Bay for the Incremental Simulations during the 31-Year SimulationPeriod. ............................................................................................................173
Table 49. Number of Times Minimal Minimum Flows and Levels Operational Criteria Were Not Met for the Biscayne Aquifer........................................................173
Table 50. Description of Flow Arrows on the Primary Water Budget Components Maps...............................................................................................................176
Table 51. Water Resource Development Projects that Provide Water Supplies Associated with MFL Recovery Plans and Water Reservations. .....................................198
Table 52. Summary Information Regarding Water Resource Development Recommendations from the LEC Interim Plan..............................................206
Table 53. Minimum and Maximum Water Capacity of Major CERP Components......217
Table 54. Average Annual Amounts of Water Provided by CERP Components..........218
Table 55. Average Annual Basin-by-Basin Demands for the 31-Year Simulation Period and for Drought Years and How They Are Met. ...........................................219
Table 56. Summary of the LEC Water Utility Pumps On and Pumps Off Scenarios for Selected Everglades Sites for the 2020 Base Case. .......................................230
xv

List of Tables LEC Regional Water Supply Plan - Planning Document
Table 57. Results of the Model Simulation for Selected Everglades Sites: 2005 versus 2005 with a 30 Percent Cutback in Public Water Supply Withdrawals for Miami-Dade County. .....................................................................................231
Table 58. Results of the Model Simulation for Selected Everglades Sites: LEC-1 Revised versus LEC-1 Revised with a 30 Percent Cutback in Public Water Supply Withdrawals for Miami-Dade County. ..........................................................233
Table 59. Changes in Per Capita Water Use for Larger Utilities within the District. ...243
Table 60. 1998 Mobile Irrigation Lab Costs and Estimated Water Savings. ................245
Table 61. Representative Water Use and Cost Analysis for Retrofit Indoor Water Conservation Measures. .................................................................................246
Table 62. Representative Water Use and Cost Analysis for Retrofit Outdoor Water Conservation Measures. .................................................................................246
Table 63. Irrigation Costs and Water Use Savings Associated with Conversion from Flood Irrigation to Micro Irrigation. ..............................................................247
Table 64. Average Per Capita Water Use Resulting From Projections A and B...........247
Table 65. Percent Reduction in Total Average Use Resulting from Conservation. ......248
Table 66. Surficial Aquifer System Well Costs.............................................................251
Table 67. Lime Softening Treatment Costs. ..................................................................252
Table 68. Membrane Softening Costs............................................................................252
Table 69. Floridan Aquifer System Well Costs. ............................................................255
Table 70. Reverse Osmosis Costs to Treat Water from the Floridan Aquifer System. .255
Table 71. Concentrate Disposal Costs for Reverse Osmosis Disposal. .........................256
Table 72. Domestic Wastewater Treatment Facilities Providing Reuse........................257
Table 73. Reclaimed Water Utilization. ........................................................................258
Table 74. Disposal Facilities with No Reuse. ................................................................261
Table 75. Aquifer Storage and Recovery System Costs. ...............................................264
Table 76. Reservoir Costs. .............................................................................................266
Table 77. Estimated Schedule and Costs for Regional Saltwater Intrusion Management...................................................................................................274
Table 78. Estimated Schedule and Costs for Refining the FAS Ground Water Model.275
Table 79. Estimated Schedule and Costs for Completing the Northern Palm Beach County Comprehensive Water Management Plan......................................................277
Table 80. Estimated Schedule and Costs for Continuing the Implementation of the Eastern Hillsboro Regional ASR Pilot Project. ..........................................................278
Table 81. Estimated Schedule and Costs for the Hillsboro (Site 1) Impoundment PilotProject. ...........................................................................................................279
xvi

LEC Regional Water Supply Plan - Planning Document List of Tables
Table 82. Estimated Schedule and Cost for Developing Lake Worth Lagoon Minimum and Maximum Flow Targets. .........................................................................281
Table 83. Estimated Schedule and Costs for the Northern Broward County Secondary Canals Recharge Network. ............................................................................282
Table 84. Estimated Schedule and Costs for the Southeast Broward County Interconnected Water Supply System............................................................283
Table 85. Estimated Schedule and Costs for Broward County Urban EnvironmentalEnhancement..................................................................................................284
Table 86. Estimated Schedule and Costs for Developing the Miami-Dade WASD Utility ASR................................................................................................................285
Table 87. Estimated Schedule and Costs for Developing Biscayne Bay Minimum and Maximum Flow Targets.................................................................................286
Table 88. Estimated Schedule and Costs for the Critical Projects for which the District is the Local Sponsor. .........................................................................................287
Table 89. Estimated Schedule and Costs for the CWMP Well Abandonment rogram. ...........................................................................................................288
Table 90. Estimated Schedule and Costs for the CWMP Saltwater Influence Analysis. ........................................................................................................289
Table 91. Estimated Schedule and Costs for Permitting Issues Associated with ASRs. .............................................................................................................290
Table 92. Estimated Schedule and Costs for Establishing Mobile Irrigation Labs. ......291
Table 93. Nonfederal Funding Responsibility of CERP Projects in the Lower East Coast Planning Area. ...............................................................................................292
Table 94. Nonfederal Funding Responsibility of CERP Projects in the CaloosahatcheeBasin. .............................................................................................................295
Table 95. Estimated Schedule and Costs for the Implementation of the Caloosahatchee River ASR Pilot Project. ................................................................................304
Table 96. Estimated Schedule and Costs for the C-43 Basin Storage Reservoir and ASR Project. ...........................................................................................................304
Table 97. Estimated Schedule and Costs for the Southwest Florida Study. ..................306
Table 98. Estimated Schedule and Costs for Developing Systemwide OperationalProtocols. .......................................................................................................309
Table 99. Estimated Schedule and Costs for Developing Periodic Operational Flexibility.......................................................................................................311
Table 100. Estimated Schedule and Costs for the Lake Okeechobee Vegetation Management Plan. .........................................................................................312
Table 101. Target Dates for Establishing MFLs and Reservation Rules.........................314
Table 102. Estimated Schedule and Costs for Reservation of Water. .............................315
xvii
List of Tables LEC Regional Water Supply Plan - Planning Document
Table 103. Estimated Schedule and Costs for Establishing MFLs. .................................316
Table 104. Estimated Schedule and Cost for MFL Research for the Rockland Marl Marsh. ............................................................................................................317
Table 105. Estimated Schedule and Cost for MFLs for the Florida Bay.........................318
Table 106. Estimated Schedule and Cost for MFL Recovery Strategies.........................319
Table 107. Estimated Schedule and Cost for Establishing a MFL Monitoring System. .320
Table 108. Estimated Schedule and Costs for the Conservation Program. .....................323
Table 109. Estimated Schedule and Costs for a Feasibility Study for Reverse Osmosis Treatment of Seawater. ..................................................................................324
Table 110. Estimated Schedule and Costs to conduct a Feasibility Study for a Reclaimed Water System for Northern Palm Beach County. ..........................................325
Table 111. Estimated Schedule and Costs for the Aquifer Recharge Study....................327
Table 112. Estimated Schedule and Costs for High Volume Surface Water ASR Testing for Taylor Creek. .................................................................................................328
Table 113. Costs of Recommendations by Fiscal Year ($1,000s). ..................................333
xviii
LEC Regional Water Supply Plan - Planning Document List of Figures
LIST OF FIGURES
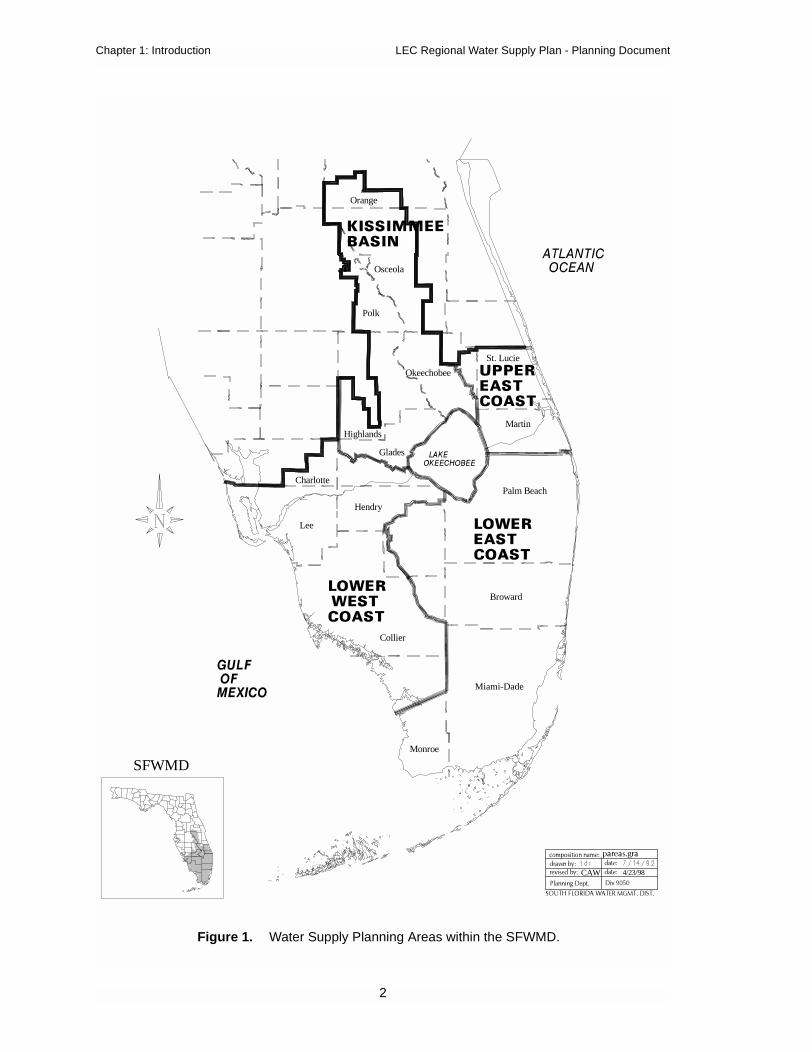
Figure 1. Water Supply Planning Areas within the SFWMD. ..........................................2
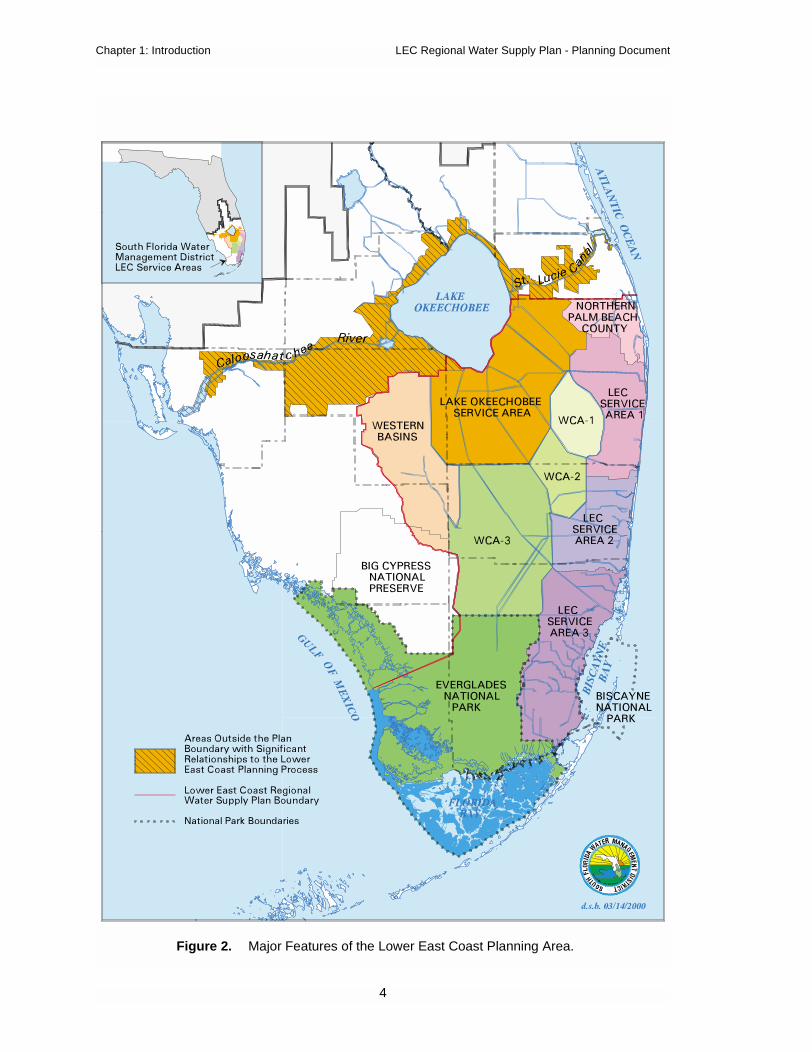
Figure 2. Major Features of the Lower East Coast Planning Area. ..................................4
Figure 3. Legal Framework for the LEC Plan...................................................................6
Figure 4. Major Components of the Comprehensive Everglades Restoration Plan........16
Figure 5. The Study Area for the Water Preserve Area Components. ............................17
Figure 6. Caloosahatchee Watershed Management Planning Area. ...............................19
Figure 7. Conceptual Relationship Among the Harm, Serious Harm, and Significant Harm Standards................................................................................................26
Figure 8. Boundaries and Grid Used for the SFWMM Simulations. ..............................33
Figure 9. Boundaries and Grid Used for the NSM Simulations......................................36
Figure 10. Generalized Soils Map of Lower East Coast Planning Area. ..........................49
Figure 11. Rainfall Patterns in South Florida, Indicating a. Average Wet Season, b. Dry Season, c. Annual Rainfall Amounts (inches), and d. Expected Rainfall During an Extreme Three-Day Rainfall for a 100-Year Return Period. ......................52
Figure 12. Changes in Natural Systems in the Lower East Coast Planning Area, 1900 to 1973. ................................................................................................................53
Figure 13. Results of FDEP Water Quality Assessment for Portions of the LEC Planning Region. .............................................................................................................59
Figure 14. Geologic Cross-Section of South Florida Showing the Location of the Aquifers. ..........................................................................................................61
Figure 15. Location of the Biscayne Aquifer in Eastern Miami-Dade, Broward, and Palm Beach Counties with a. Average Aquifer Depth and b. Elevation of the Surface of the Aquifer...................................................................................................62
Figure 16. Historical Extent of Saltwater Intrusion in Coastal Miami-Dade County. ......64
Figure 17. The Lake Okeechobee Service Area, including the Everglades Agricultural Area..................................................................................................................66
Figure 18. Everglades Protection Area. ............................................................................68
Figure 19. The North Palm Beach Service Area, including the Everglades Agricultural Area..................................................................................................................70
Figure 20. The Lower East Coast Service Area 1. ............................................................71
Figure 21. The Lower East Coast Service Area 2. ............................................................72
Figure 22. The Lower East Coast Service Area 3. ............................................................73
Figure 23. Water Conveyance in the Regional Systems During Wet Periods. .................79
xix

List of Figures LEC Regional Water Supply Plan - Planning Document
Figure 24. Water Conveyance in the Regional Systems During Dry Periods...................80
Figure 25. Locations of Indicator Regions Within the Everglades That Were Evaluated for the LEC Plan. ...................................................................................................93
Figure 26. Average Annual (1965-1995) Irrigation Supplies and Shortages for the Seminole Tribe Big Cypress Reservation. .....................................................122
Figure 27. Everglades Indicator Regions used in the Analysis of Model Run Alternatives. ...................................................................................................152
Figure 28. Location of Key Gages Used for Minimum Flows and Levels Simulations. 167
Figure 29. Key for the Water Budget Components Figures............................................180
Figure 30. Primary Water Budget Components for the 1995 Revised Base Case. .........181
Figure 31. Primary Water Budget Components for the 2005 Incremental Simulation...182
Figure 32. Primary Water Budget Components for the 2010 Incremental Simulation...183
Figure 33. Primary Water Budget Components for the 2015 Incremental Simulation...184
Figure 34. Primary Water Budget Components for the 2020 Incremental Simulation...185
Figure 35. A Summary of CERP Components, Total Costs, Areas They Benefit and Timelines for the Projects. .............................................................................214
Figure 36. Implementation Schedule for the Recommendations made within the LEC Plan. ...............................................................................................................335
xx
LEC Regional Water Supply Plan - Planning Document List of Abbreviations and Acronyms
LIST OF ABBREVIATIONS AND ACRONYMS
2005 SSM 2005 Supply-Side Management Scenerio (SFWMM)
2005R 2005 incremental simulation (SFWMM)
2010R 2010 incremental simulation (SFWMM)
2020R 2020 incremental simulation (SFWMM)
20Base 2020 Base Case (subregional models)
20BSR 2020 Base Case (SFWMM)
2020WR 2020 with Restudy (SFWMM)
20wres 2020 with Restudy (subregional models)
95Base 1995 Base Case (subregional models)
95BSR 1995 Base Case (SFWMM)
95BSRR 1995 Revised Base Case (SFWMM)
ac-ft acre-feet
ADAPS Automated Data Processing System
AFSIRS Agricultural Field Scale Irrigation Requirements Simulation
APT Aquifer Performance Test
ASCII American Standard Code for Information Interchange
ASR Aquifer Storage and Recovery
AWWA American Water Works Association
AWT Advanced Water Treatment
BMPs Best Management Practices
BOR Basis of Review
C&SF Project Central and Southern Florida Project for Flood Control and OtherPurposes
CERP Comprehensive Everglades Restoration Plan
CLBSA Central Lake Belt Storage Area
cfs cubic feet per second
CUP Consumptive Use Permitting
CWMP Caloosahatchee Water Management Plan
DAO District Administrative Order
xxi
List of Abbreviations and Acronyms LEC Regional Water Supply Plan - Planning Document
DERM Department of Environmental Resource Management
District South Florida Water Management District
DRI Development of Regional Impacts
DWMP District Water Management Plan
DWSA Districtwide Water Supply Assessment
EAA Everglades Agriculture Area
ERP Environmental Resource Permitting Program
ET Evapotranspiration
F.A.C. Florida Administrative Code
FAU Florida Atlantic University
FAS Floridan Aquifer System
FDACS Florida Department of Agriculture and Consumer Services
FDEP Florida Department of Environmental Protection
FFWCC Florida Fish and Wildlife Conservation Commission
FGS Florida Geological Survey
F.S. Florida Statutes
FTE Full-Time Equivalent
FWC Florida Wildlife Commission
FY Fiscal Year
GIS Geographic Information System
GPD gallons per day
GPCD gallons per captia daily
GRR General Reevaluation Report
IFAS Institute of Food and Agricultural Sciences
IR Indicator Region
ISGM Intergrated Surface Water Ground Water Model
IWR Institute of Water Resources
IWRP Integrated Water Resource Plan
LEC Lower East Coast
LEC-1R LEC-1 Revised simulation
LECSA Lower East Coast Service Area
xxii
LEC Regional Water Supply Plan - Planning Document List of Abbreviations and Acronyms
LOSA Lake Okeechobee Service Area
LOVFMT Lake Okeechobee Vegetation and Fire Management Team
LWC Lower West Coast
MDS Modified Delta Storage
MFL Minimum Flows and Levels
MGD million gallons per day
mg/L milligrams per liter
MGY million gallons per year
MIL Mobile Irrigation Laboratory
MOA Memorandum of Agreement
MOU Memorandum of Understanding
NGVD National Geodetic Vertical Datum
NLBSA North Lake Belt Storage Area
NPBCSA North Palm Beach County Service Area
NPDES National Pollution Discharge Elimination System
NRCS Natural Resources Conservation Service
NSM Natural Systems Model
NWI National Wetlands Inventory
O&M Operations and Maintenance
OPEs Other Project Elements
P2000 Preservation 2000
PDE Partial Differential Equation
PIR Project Implementation Report
P-M Penman-Monteith
ppt parts per thousand
PWS Public Water Supply
RECOVER Restoration, Coordination, and Verification
REDI Real Estate Data Information
Restudy Central and Southern Florida Project Comprehensive Review Study
RO Reverse Osmosis
RTA Reduced Threshold Area
xxiii
List of Abbreviations and Acronyms LEC Regional Water Supply Plan - Planning Document
SAS Surficial Aquifer System
SFWMD South Florida Water Management District
SFWMM South Florida Water Management Model
SFWRMS South Florida Water Resource Management System
SOW Statement of Work
SSM Supply-Side Management
STA Stormwater Treatment Area
SWCD Soil and Water Conservation District
SWFRPC Southwest Florida Regional Planning Council
SWFS Southwest Florida Study
SWFWMD Southwest Florida Water Management District
SWIM Surface Water Improvement Management
TDS Total Dissolved Solids
TMDL Total Maximum Daily Loads
UEC Upper East Coast
USACE United States Army Corps of Engineers
USACE-WES U.S. Army Corps of Engineers - Waterways Experiment Station
USDA United States Department of Agriculture
USDW Underground Sources of Drinking Water
USEPA United States Environmental Protection Agency
USFWS United States Fish and Wildlife Service
USGS United States Geological Survey
WASD Water and Sewer Department
WATBAL Water Balance Component
WCA Water Conservation Area
WMA Water Management Area
WRCA Water Resource Caution Area
WSE Water Supply and Environmental
xxiv

LEC Regional Water Supply Plan - Planning Document Chapter 1: Introduction
Chapter 1INTRODUCTION
BACKGROUND
The Lower East Coast (LEC) Planning Area is one of four regional planning areasin the South Florida Water Management District (District, SFWMD). The planning areacovers approximately 1,200 square miles and includes essentially all of Miami-Dade,Broward, and Palm Beach counties, most of Monroe County, and the eastern portions ofHendry and Collier counties (Figure 1). The entire Lake Okeechobee Service, whichincludes part of four additional counties, Martin, Okeechobee, Glades and Lee, wereincorporated into the analyses because of their reliance on the Lake Okeechobee for aportion of their water supply. Land use within the LEC region ranges from urban in theeast to undeveloped natural landscapes in the west, with some areas in between havingintense agricultural use. In the future, urban land use is expected to intensify and increasespatially and agricultural land use is expected to decline slightly. The ability to providemore water to the LEC planning area in the future also depends on activities in other areasof the District that depend on Lake Okeechobee for water supply, such as theCaloosahatchee and St. Lucie river basins.
The planning area faces many challenges to provide adequate water supply to meetgrowing urban demands, changing agricultural demands, and needs of the environmentthrough 2020. To some extent, these trends may offset each other in some basins andservice areas. Nevertheless, overall water demand is expected to increase by 20 percentfor urban and agricultural users (Table 2). The costs of implementing the optionsnecessary to meet the projected increases in demand are substantial, but these costs will bespread over a number of years and will be funded from various local, regional, state, andfederal sources.
This plan builds on analyses described in previous documents, including the LECWorking Document (SFWMD, 1993), the Interim Plan for Lower East Coast RegionalWater Supply (SFWMD, 1998b), and the Central and Southern Florida ProjectComprehensive Review Study Final Feasibility Report and Programmatic EnvironmentalImpact Statement (Restudy) (USACE and SFWMD, 1999), and ongoing efforts such asthe Comprehensive Everglades Restoration Plan (CERP). The CERP is being developedby the District, the United States Army Corps of Engineers (USACE), and other agenciesto refine and implement the recommendations from the Restudy. The time frame for thisplan is from the present to the future (2020). The computer modeling analysis for this planoriginally used population, agricultural production, and water use projections through theyear 2010, based on data provided from local governments. In order to comply withstatutory changes to Chapter 373, F.S., that were made in 1997, these projections werereviewed and updated to create new projections for 2020.
The District has established a planning goal to meet regional water needs,consistent with Florida statutes and ensure that sufficient water is available to avoid water
1
Chapter 1: Introduction LEC Regional Water Supply Plan - Planning Document
SFWMD
CAW
Polk
Orange
Osceola
Okeechobee
Highlands
St. Lucie
Martin
Palm Beach
Hendry
Collier
Broward
Monroe
Lee
Charlotte
4/23/98
Glades
Miami-Dade
Figure 1. Water Supply Planning Areas within the SFWMD.
2
LEC Regional Water Supply Plan - Planning Document Chapter 1: Introduction
shortages and meet demands during a 1-in-10 year drought condition. This plan achievesthat goal. Even though enough water is available to meet demands on a regional scale,local conditions and circumstances may make it impossible or impractical to deliverregional water to particular individual supply systems. To address this issue, this planpresents regional water resource development projects, as well as a menu of strategies andlocal options that are available for more localized water supply development projects.
OVERVIEW
The Lower East Coast Regional Water Supply Plan (LEC Plan) was developed toinclude the areas in South Florida shown in Figure 2, covering all or part of ten of the 16counties in the SFWMD. Documentation of the plan includes the final Planning Document(this document) and the Appendices. This chapter, Chapter 1, provides an introduction thatemphasizes the purpose and general goals of the LEC Plan. Chapter 2 gives an overviewof the LEC water supply planning process. Chapter 3 describes the LEC Planning Areaboundaries and major features, the primary and secondary water management systems,and the various basins and service areas. Chapter 3 also includes a description of theareas within the LEC where Minimum Flows and Levels (MFL) have been proposed,pursuant to provisions in Chapter 373, F.S. Chapter 4 presents the findings of the LECPlan in terms of the performance of the regional and subregional water supply systemsunder present and future conditions with various water management features in place.Chapter 4 focuses on use of the regional and subregional models to evaluate current(1995) and future (2020) conditions without the major features proposed in the Restudyand future conditions with the major features proposed in the Restudy in place. Chapter 4also describes performance of the regional and subregional water supply systems withvarious combinations of water resource and supply options in place. Chapter 5 providesthe conclusions from the analysis and lays out implementation strategies for projects
Table 2. Current and Projected Water Demands for each Water Use Category by Countywithin the LEC Planning Area.
County
1995 Average Annual Demand (BGY)a 2020 Average Annual Demand (BGY)
PW
S/D
SS
Rec
reat
ion
al
Co
mm
erci
alan
dIn
du
stri
al
Ag
ricu
ltu
ral
PW
S/D
SS
Rec
reat
ion
al
Co
mm
erci
alan
dIn
du
stri
al
Ag
ricu
ltu
ral
Palm Beach 76.9 24.0 10.9 256.6 117.3 35.8 12.2 225.3
Broward 83.0 21.9 1.3 3.2 116.6 27.6 1.8 2.6
Miami-Dade 145.4 5.1 10.6 39.9 230.3 6.9 13.3 41.7
Monroe 0.2 0.8 0.03 0 0.2 0.8 0.03 0
Eastern Hendry 0.1 0 0 85.3 0.2 0 0 87.0
Total for the LECPlanning Area
305.6 51.8 22.9 385.0 464.5 71.1 27.3 356.4
a. BGY is Billions of Gallons per Year
3
Chapter 1: Introduction LEC Regional Water Supply Plan - Planning Document
Figure 2. Major Features of the Lower East Coast Planning Area.
4
LEC Regional Water Supply Plan - Planning Document Chapter 1: Introduction
construction, recovery and prevention strategies to meet MFLs, reservations of water, andrule development. Chapter 6 presents the plan’s recommendations, based on allevaluations conducted as part of the LEC planning process.
Appendices to the LEC Plan document include the legal statutes pertaining to thewater supply plans (Appendix A), water demand analyses and projections (Appendix B),descriptions of water resource projects development (Appendix C), performancemeasures and indicators (Appendix D), hydrologic modeling tools (Appendices Eand F), engineering designs and cost estimates (Appendix G), results of the SFWMM andground water model runs (Appendix H), related planning materials (Appendix I), anddocumentation for the establishment of MFLs (Appendix J).
LEGAL BASIS
The LEC Plan provides strategies that are cost-effective, can be implemented, andassure that adequate water is available to meet future urban and agricultural, and naturalsystem demands within the planning area through the year 2020. In accordance withrecent changes to Chapter 373, F.S., a combination of water resource and water supplydevelopment projects is proposed. The plan has been evaluated to determine how well theproposed facilities and operational changes meet reasonable-beneficial water demandsduring a 1-in-10 year drought condition, while protecting the natural system from harm.
Currently, the regional water supply system meets the urban and agricultural needsfairly well. However, large portions of the Everglades and important estuary systems donot receive adequate quantities, timing, or distribution of water. Meeting the water supplyneeds for restoration of the environment is explicitly recognized as a responsibility ofequal importance to meeting urban and agriculture demands and is specifically addressedin the Restudy and the subsequent CERP. Although this LEC Plan is not intended toachieve full restoration, appropriate attention has been given to improving hydropatternswithin natural systems, particularly within the Everglades ecosystem. Furthermore, theplan incorporates proposed MFLs for Lake Okeechobee, the Everglades, and the Biscayneaquifer and outlines recovery and prevention strategies, where appropriate, to ensure thatminimum water levels, and the durations and frequency of wetland flooding are achievedand maintained.
All of the policies developed for the LEC Regional Water Supply Plan AdvisoryCommittee are governed by the general regional water supply planning requirements andpolicies as stated in the Florida Water Resources Act, Chapter 373, F.S. The purpose andscope of this plan are based on a hierarchy that progresses from law to more specificpolicy direction, and expressed District goals and objectives.
5
Chapter 1: Introduction LEC Regional Water Supply Plan - Planning Document
Regional Water Supply Plan Legal Requirements andImplementing Policies
Chapter 373 Planning Framework
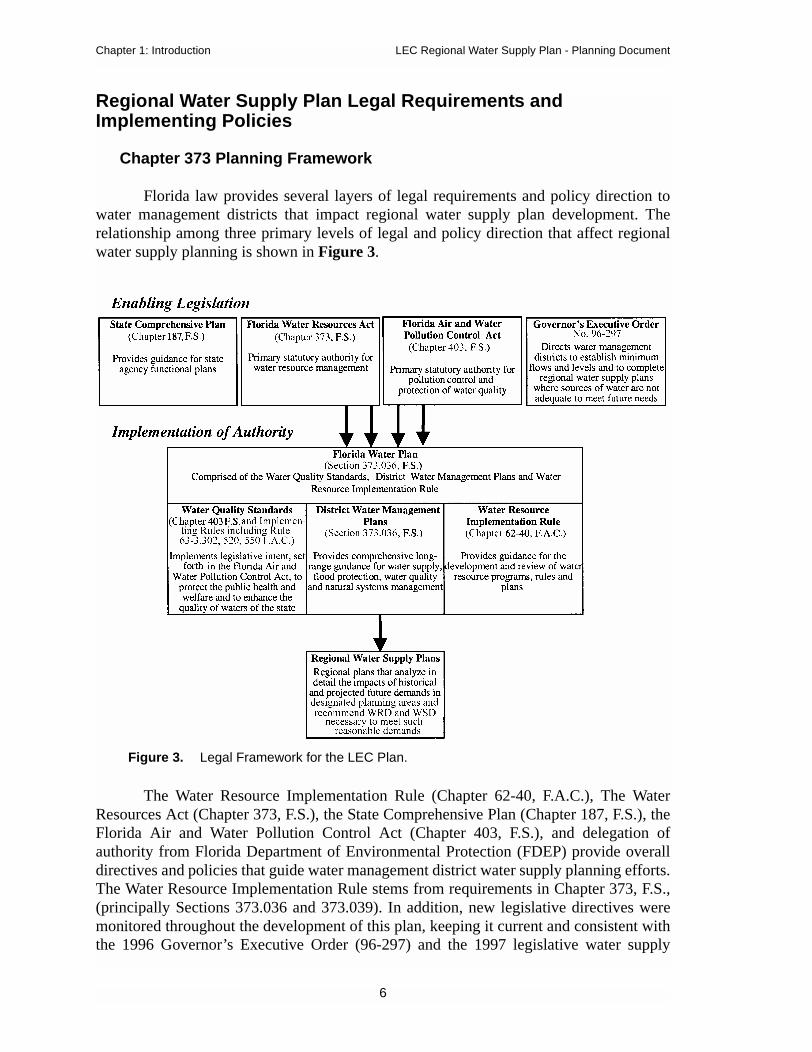
Florida law provides several layers of legal requirements and policy direction towater management districts that impact regional water supply plan development. Therelationship among three primary levels of legal and policy direction that affect regionalwater supply planning is shown in Figure 3.
The Water Resource Implementation Rule (Chapter 62-40, F.A.C.), The WaterResources Act (Chapter 373, F.S.), the State Comprehensive Plan (Chapter 187, F.S.), theFlorida Air and Water Pollution Control Act (Chapter 403, F.S.), and delegation ofauthority from Florida Department of Environmental Protection (FDEP) provide overalldirectives and policies that guide water management district water supply planning efforts.The Water Resource Implementation Rule stems from requirements in Chapter 373, F.S.,(principally Sections 373.036 and 373.039). In addition, new legislative directives weremonitored throughout the development of this plan, keeping it current and consistent withthe 1996 Governor’s Executive Order (96-297) and the 1997 legislative water supply
Figure 3. Legal Framework for the LEC Plan.
6
LEC Regional Water Supply Plan - Planning Document Chapter 1: Introduction
amendments to Chapter 373, F.S. The LEC Plan was developed by the SFWMD based onguidelines developed in the Regional Water Supply Assessment (SFWMD, 1998e) and tofulfill commitments made in the approved District Water Management Plan (SFWMD,2000a).
Key Direction for Regional Water Supply Plan Development
Within the three levels (enabling legislation, implementation of authority, and plandevelopment) there are three key provisions discussed below. They are 1) overall Chapter373, F.S., “Florida Water Resources Act” requirements; 2) district water management planpolicies, goals, and objectives; and 3) regional water supply plan policies, goals, andobjectives. These policies and legal requirements must be taken as a whole whenbalancing the often competing missions of the District.
Overall Chapter 373 Policies
Section 373.016, F.S., contains policy direction for the water management districtsto implement all of the programs authorized by the law, including the development ofregional water supply plans. It declares that the waters in the state are among its basicresources and they have not been conserved or fully controlled so as to realize their fullbeneficial use. It directs the FDEP and the District to take into account cumulative impactson water resources and manage those resources in a manner to ensure their sustainability.The section then lists detailed policies which must be applied as a whole:
• Provide for the management of water and related land resources
• Promote the conservation, replenishment, recapture, enhance-ment, development, and proper utilization of surface and groundwater
• Develop and regulate dams, impoundments, reservoirs, and otherworks
• Provide water storage for beneficial purposes
• Promote the availability of sufficient water for all existing andfuture reasonable-beneficial uses and natural systems
• Prevent damage from floods, soil erosion, and excessive drainage
• Minimize degradation of water resources caused by the dischargeof storm water
• Preserve natural resources, fish, and wildlife
• Promote the public policy set forth in Section 403.021, F.S.
• Promote recreational development, protect public lands, andassist in maintaining the navigability of rivers and harbors
• Otherwise promote the health, safety, and general welfare of thepeople of Florida
7
Chapter 1: Introduction LEC Regional Water Supply Plan - Planning Document
District Water Management Plans Policies, Goals and Objectives
General Direction
Pursuant to Section 373.036, F.S., each water management district must developan overall planning document for all of the programs implemented under Chapter 373,F.S. The district water management plans provide another layer of policy direction for thedevelopment of regional water supply plans. District water management plans are to beformulated with consideration to the following:
• Attainment of maximum reasonable-beneficial use of waterresources
• Maximum economic development of water resources consistentwith other uses
• Management of water resources for such purposes asenvironmental protection, drainage, flood control, and waterstorage
• Quantity of water available for application to a reasonable-beneficial use
• Prevention of wasteful, uneconomical, impractical, orunreasonable uses of water resources
• Presently exercised domestic use and permit rights
• Preservation and enhancement of the water quality of the state
• State water resources policies expressed by Section 373.036, F.S.
The District Water Management Plan (DWMP) (SFWMD, 2000a) represents theDistrict's overall strategy for future planning and implementation activities and provides acomprehensive examination of a myriad of issues related to water supply, flood protection,water quality, and natural systems management in South Florida. This plan alsoestablishes schedules for future District planning activities, including the LEC Plan. TheDWMP was published first in April 1995 (SFWMD, 1995c). Annual progress reportswere published over the next four years (SFWMD, 1996a, 1997, 1998a, 1999). In 2000,the five-year update of the DWMP was published and incorporates major features of theLEC Plan.
Goals and Objectives
The DWMP sets forth the following and objectives for water supply, that apply todevelopment of regional water supply plans. The goals and objectives are listed below.
Goals:
• Increase available water supply
8
LEC Regional Water Supply Plan - Planning Document Chapter 1: Introduction
• Promote the use of alternative water supply sources andconservation
• Protect the quality of source water from degradation and naturalsystems from significant harm, which could result from water use
Objectives:
• Increase available water supplies and maximize overall water useefficiency to meet identified existing and reasonable-beneficialfuture needs
• Prevent contamination of water supply sources.
These goals and objectives must work in concert with the Chapter 373, F.S.,policies discussed above.
Districtwide Water Supply Assessment
Each District must also produce a districtwide water supply assessment whichidentifies areas where development of regional water supply plans is required. Section373.036, F.S., requires the districtwide water supply assessment to include an analysis ofthe following:
• Existing legal uses, reasonably anticipated future needs, andexisting and reasonably anticipated sources of water andconservation efforts
• Whether existing and reasonably anticipated sources of water andconservation efforts are adequate to supply water for all existinglegal uses and reasonably anticipated future needs and to sustainthe water resources and related natural systems
The SFWMD Districtwide Water Supply Assessment (DWSA) was completed in1998 (SFWMD, 1998c). It recommends that water supply plans should be prepared forfour regions within the SFWMD that are anticipated to have the potential for demands tooutstrip available supplies by 2020. The assessment identified demands for the followingwater use categories:
• Public Water Supply
• Domestic Self-Supplied (and small public supply systems)
• Commercial/Industrial Self-Supplied
• Recreational Self-Supplied
• Thermoelectric Power Generation Self-Supplied
• Agricultural Self-Supplied
Projections for 2020 contained within the DWSA include demand levelsassociated with average rainfall conditions, as well as demands that would be anticipated
9

Chapter 1: Introduction LEC Regional Water Supply Plan - Planning Document
during a drought that could be expected to occur once in every ten years (as required bySection 373.036, F.S.). The water resource and demand analyses presented in the DWSAwill be refined every five years as part of each region’s water supply planning process.Environmental demands are not quantified in the DWSA. These needs are addressed in thewater supply planning process through the incorporation of restoration goals and targets,MFLs, performance measures, reservations of water, and resource protection criteria.
The DWSA provides demands for 1995 and projections for 2020 for each PublicWater Supply (PWS) utility in the SFWMD with projected pumpage of 0.5 million gallonsper day (MGD) or greater in 2020. Source locations for each of these utilities are alsoprovided. The DWSA also includes descriptions of agricultural, commercial/industrial,and recreational self-supplied uses; surface water and ground water resources; and theavailability and limits of water resources in each of the District’s four regions.
Regional Water Supply Plans
The District will continue to prepare water supply plans for each of its fourplanning regions, that cover the entire District. Regional water supply plans provide moredetailed, region-specific information than the DWSA. Water supply plans are based upondata that are related to the specific water needs, sources, and environmental features of theregional planning areas, and are updated every five years. Area-specific goals andobjectives were developed for the LEC Plan during the water supply planning process.
The preparation of water supply plans for the planning regions has been sequencedbased on the history of water shortage problems. The water supply plan for the LowerWest Coast Planning Area was the first to be initiated, followed by the LEC, Upper EastCoast, and finally the Kissimmee Basin. The District's water supply planning status for thefour regions is as follows:
• The Interim Plan for Lower East Coast Regional Water Supplywas completed in 1998 (SFWMD, 1998b). This plan describedvarious options that were under investigation, providedpreliminary recommendations, and laid out the process forcompleting the regional plan. The analyses in that document weresubsequently expanded to produce the present document.
• The Lower West Coast Water Supply Plan was completed in 1994(SFWMD, 1994), and was updated in 1999-2000. This updatedplan was approved by the Governing Board in April 2000(SFWMD, 2000b).
• The Upper East Coast Water Supply Plan was completed in 1998(SFWMD, 1998d), is currently being implemented, and will beupdated in 2003.
• The Kissimmee Basin Water Supply Plan Background Documentand Appendices were completed in 1996 (SFWMD, 1996b), andthe water supply plan for this region was developed in 1999-
10
LEC Regional Water Supply Plan - Planning Document Chapter 1: Introduction
2000. This plan was approved by the Governing Board in April2000 (SFWMD, 2000c).
Statutory Requirements for Regional Water Supply Plans
Section 373.0361, F.S., requires that each regional water supply plan be based onat least a 20-year planning period and include water supply and water resourcedevelopment components, a funding strategy for water resource development projects,MFLs established within the planning region, an MFL recovery and prevention strategy,and technical data and information supporting the plan.
The water supply development component must include the a quantification of thewater supply needs for all existing and projected future uses within the planning horizon,with a level-of-certainty planning goal for meeting needs during a 1-in-10 year droughtevent. It must also include a list of water source options for water supply development,including traditional and alternative sources, from which local government, governmentowned and privately owned utilities, self-suppliers, and others may choose. For eachoption, the amount of water available, the estimated cost of the project, and sources offunding must be identified.
The water resource development component must include a list of water resourcedevelopment projects that support water supply development. For each water resourcedevelopment project the following must be provided: an estimate of the amount of waterto become available through the project; the timetable for implementing or constructingthe project; the estimated costs for implementing, operating, and maintaining the project;sources of funding; the entities or agencies who will implement the project; and adescription of how the project will be implemented. The funding strategy for waterresource development projects must be reasonable and sufficient to pay the cost ofconstructing or implementing all of the listed projects.
The recovery and prevention strategy must be implemented if the flow or level ina water body is below, or within 20 years is projected to fall below, its established MFLs(Section 373.0421(2), F.S.). The strategy must include the development of additionalwater supplies and other actions to achieve recovery to the established MFLs or to preventthe existing flow or level from falling below the established minimum flow or level. Itmust also include a timetable which will allow for the provision of sufficient watersupplies for all existing and projected reasonable-beneficial uses.
The plan must also take into consideration how the water supply and waterresource development options serve the public interest or save costs overall by preventingthe loss of natural resources or avoiding greater future expenditures for water resourcedevelopment, water supply development, or resource restoration. However, unlessadopted by rule, these considerations do not constitute final agency action.
11
Chapter 1: Introduction LEC Regional Water Supply Plan - Planning Document
LEC Plan Goals and Objectives
Goal. The following provision from the State Comprehensive Plan (Section187.201(8a), F.S.) was adopted as the primary goal of the LEC Plan:
Florida shall assure the availability of an adequate supply of water for allcompeting uses deemed reasonable and beneficial and shall maintain thefunctions of natural systems and the overall present level of surface andground water quality. Florida shall improve and restore the quality ofwaters not presently meeting water quality standards.
This statewide policy is consistent with the water management policies in Chapter373, F.S., and the Water Supply Policy Document (SFWMD, 1995).
Objectives. The LEC Regional Water Supply Plan Advisory Committee alsodeveloped several specific objectives and associated strategies for the plan:
1. Protect and enhance the environment including federal, state,and locally identified natural resource areas
2. Protect and conserve the water resources of South Florida toensure their availability for future generations
3. Provide for the equitable, orderly, cost-effective, andeconomical development of water supplies to meet SouthFlorida's environmental, agricultural, urban, and industrialneeds
4. Improve resource management through the integration ofregional and local water supply plans and land use planning
Statutory Requirements. In addition to the above general goals and objectives,results of model simulations were analyzed to determine the ability of proposed projectsand actions to achieve other statutory requirements of water supply plans:
• Provide for 1-in-10 year Level of Certainty without causing harm
• Protect water resources from significant harm
• Restore natural systems
• Reserve water needed to protect fish and wildlife and publichealth and safety
These objectives and statutory requirements were used in the planning process todevelop water supply performance measures, resolve competing use issues, and identifyrecommendations.
Strategies. The plan identifies 14 general strategies and associatedrecommendations to achieve these objectives (Table 3).
12

LEC Regional Water Supply Plan - Planning Document Chapter 1: Introduction
Recommendations to achieve the goal, its associated objectives, and planrequirements through implementation of the listed strategies are discussed in Chapter 6of this document.
Regional and Local Components
The design of the LEC Plan provides guidance for local government and otherusers (e.g., private utilities, agriculture, etc.) to implement water supply developmentprojects. These projects will be financed primarily at local expense to use alternativesources to supplement water supplies available from the regional system and providegreater reliability. In conjunction with the CERP, the LEC Plan also supports waterresource development activities that are designed to increase the amounts of water that canbe stored in, and delivered from, the regional system. These options provide additionalwater to meet a broad range of environmental, urban, and agricultural needs and will befinanced primarily at public expense.
Table 3. Summary of Strategies and Recommended Actions Developed to Meet theObjectives of the LEC Plan.
General Strategy Objective(s)Addressed
ImplementingRecommendation
(see Chapter 6)
Implement CERP, Water Resource Development, andWater Supply Development Projects
all all
Refine regional/subregional models and conduct additionalsimulations
all1, 2, 6, 11, 19, 30,
37, 40
Implement a resource monitoring and adaptivemanagement process
all 1, 3, 6,17, 39
Recognize tribal water rights 3 8, 17
Implement actions described in the Caloosahatchee WaterManagement Plan (CWMP) (SFWMD, 2000d)
all 13,14, 28, 29, 30, 35
Resolve permitting issues associated with ASR 3 15
Develop and implement a water conservation program 2,3,4 16, 17, 38, 41
Implement actions recommended in this plan and theCWMP to improve performance of CERP projects
all 18-30
Improve management and operations of District and localfacilities
all 26-27, 31, 32
Improve water shortage/supply-side management plansand practices
1,2,3 31, 32
Establish reservations of water 1,2 9, 34, 35, 36, 37
Establish MFL criteria and MFL recovery and preventionplans
1,2 11, 35, 36, 37, 38, 39
Consumptive Use Permitting 2,3 2, 8, 40
13

Chapter 1: Introduction LEC Regional Water Supply Plan - Planning Document
In addition, the LEC Plan calls for the establishment of boundary conditions thatwill define the amount of regional system water available within a particular basin orservice area. This amount depends on the specific system components in place at any pointin time. If recommendations of this plan are implemented within appropriate time frames,sufficient water will be available to meet urban, agricultural and environmental demandsthrough 2020. Although investment in significant public infrastructure will be required tomeet the demands of future growth, the costs of developing the needed supplies will bedistributed among many users and should not overly burden the regional economy.
The LEC Plan has been constrained to include options and components that canreasonably be expected to be in place by 2020. These include water supply planningactivities, projects within the purview of the CERP, and additional structural andoperational features. Additional research may be required within the region to identify andmeet long-term water supply needs, environmental restoration goals, and appropriateminimum water levels.
RELATIONSHIP TO OTHER PLANS AND PROGRAMS
Comprehensive Everglades Restoration Plan
The Central and Southern Florida Project for Flood Control and Other Purposes(C&SF Project), which was first authorized by Congress in 1948, is a multipurpose projectthat provides flood control, water supply for municipal, industrial, and agricultural uses,prevention of saltwater intrusion, water supply for Everglades National Park, andprotection of fish and wildlife resources. The primary system includes about 1,000 mileseach of levees and canals, 150 water control structures, and 16 major pump stations. TheC&SF Project was designed in the 1950s to encompass a 50-year planning horizon Thedesign was based on forecasts that significantly underestimated the intensity of land usesand future population growth. Increased population and more intense land use haveresulted in higher than anticipated demands on the system's flood protection and watersupply capabilities.
In 1994, Congress authorized the U.S. Army Corps of Engineers (USACE) toreevaluate the C&SF Project and make recommendations to improve the project formultiple benefits, including the restoration of the Everglades system. The final report ofthis effort, the The Central and Southern Florida Flood Control Project ComprehensiveReview Study Final Integrated Feasibility Report and Programmatic EnvironmentalImpact Statement (Restudy), was submitted to Congress in July 1999. The Restudy wasdeveloped by a multiagency, multidisciplinary team which formulated and evaluatedalternative comprehensive plans based on computer simulations, field observations, andprofessional judgement. The purpose of this study was to reexamine and determine thefeasibility of modifying the C&SF Project to restore the South Florida ecosystem and toprovide for the other water related needs of the region, including flood control, theenhancement of water supplies, and other objectives served by the C&SF Project.Specifically, as required by the authorizing legislation, the study investigated makingstructural or operational modifications to improve the quality of the environment; improve
14
LEC Regional Water Supply Plan - Planning Document Chapter 1: Introduction
protection of the aquifer; improve the integrity, capability, and conservation of urban andagricultural water supplies; and improve other water related purposes. Therecommendations made in the Restudy will be refined and implemented in theComprehensive Everglades Restoration Plan (CERP).
In 1997, the LEC Regional Water Supply Plan Advisory Committee agreed to havemajor storage concepts developed by the District for the LEC Plan incorporated into theRestudy analysis. As a result, much of the Restudy’s recommended course of action isbased on concepts that were developed and refined in the LEC water supply planningprocess. Therefore, the Restudy and the LEC Plan are closely integrated, and key storagecomponents for this plan are eligible for federal funding.
The Restudy includes recommendations for structural and operational changes tothe existing C&SF Project that will capture and store much of the water that is now lost totide, in order to provide enough water in the future for the ecosystem, as well as urban andagricultural users. Water management options developed in the Restudy provide atemplate and basic infrastructure for Everglades restoration, regional water resourcedevelopment, and local water supply development efforts. The hydrologic managementgoals developed in the Restudy were also used as a basis to define the various harmstandards that are used in the Consumptive Use Permitting (CUP) process and to developMFLs.
The components identified in the Restudy will be refined and implemented in theCERP. The CERP will address modifications to improve the performance of the C&SFProject and restore the South Florida ecosystem, while providing for other water relatedneeds of the region. Proposed locations of the major features of this plan are shown inFigure 4.
Water Preserve Areas Feasibility Study
As part of the overall CERP effort, multipurpose water management areas areplanned in Palm Beach, Broward, and Miami-Dade counties between urban areas and theeastern Everglades. These Water Preserve Areas (WPAs) will have the ability to store andtreat urban runoff, reduce seepage, provide flood protection, and improve existing wetlandareas. The study area for the WPAs is shown in Figure 5.
The Water Preserve Areas Feasibility Study, scheduled for completion in 2001, isinvestigating methods to capture and store excess surface waters that are normallyreleased to tide via the C&SF Project canal system. This would be accomplished bybackpumping a portion of these surface waters to the WPAs. The regional and localbenefits associated with the WPAs include the following:
• Prevent overdrainage of the Everglades and reestablish natural hydropatternswithin existing natural areas
• Provide for the re-creation of natural storage systems lost due to the impacts ofdevelopment
15

Chapter 1: Introduction LEC Regional Water Supply Plan - Planning Document
ComprehensiveEverglades
Restoration Plan
Biscayne BayCoastal Wetlands
West and SouthMiami-Dade Reuse
Water Preserve Areas:Above Ground Storage,
ASR and SeepageManagement
Revised LakeOkeechobee Regulation
Schedule
Indian River LagoonWater Preserve Areas:
Storage in C-23, 24,25,44North and South Fork Basins
Taylor Creek/ Nubbin SloughStorage and Treatment Area
Water Preserve Areas:North and CentralLake Belt Storage
Everglades AgriculturalArea (EAA) Storage
Everglades RainDriven Operations
North of LakeOkeechobee Storage
St. Lucie EstuaryWater Supply
Lake Okeechobee ASR
Caloosahatchee Reservoirwith ASR and Caloosahatchee
Backpumping with STA
Caloosahatchee EstuaryWater Supply
Partial Decompartmentalizationof Water Conservation Area 3
and Everglades National Park
L-31 N LeveeSeepage Management
L-8 Modificationsand Storage
WCA-1 InternalCanal Structures
Lower East CoastWater Conservationand Broward CountySecondary Canals
C-111NSpreader Canal
Big Cypress /L-28I Modifications
Modify G-404and S-140 Pumps
1
2
3
4
5
6
7
8
9
1011
1213
14
15
16
17
18
19
20
21
22
Figure 4. Major Components of the Comprehensive Everglades Restoration Plan.
16

LEC Regional Water Supply Plan - Planning Document Chapter 1: Introduction
Figure 5. The Study Area for the Water Preserve Area Components.
17

Chapter 1: Introduction LEC Regional Water Supply Plan - Planning Document
• Provide for the increased spatial extent of short hydroperiod wetlands
• Provide a buffer between the Everglades and the urbanized LEC planning area
• Provide for an improved water supply to the LEC planning area
• Maintain flood protection to urban and agricultural lands
Integrated Water Resource Plans
Other efforts include the development of more location specific, LEC subregionalplans that are derived from the overall LEC regional water supply planning effort. Theseinclude the Northern Palm Beach County Comprehensive Water Management Plan, theSoutheast Palm Beach County Integrated Water Resource Strategy, the Broward CountyIntegrated Water Resource Plan, and the South Miami-Dade County Integrated WaterResource Plan. While the planning processes are in different stages of development,efforts will be made to complete these works, where appropriate, as quickly as possible.Results of these ongoing subregional efforts were incorporated into the LEC Plan. TheDistrict has shifted its emphasis toward implementation of regional water supply plansand the CERP. In cases where local governments decide to continue their own local watersupply planning processes, the District will attempt to remain supportive as long asresources are available and there is no conflict with the implementation of the watersupply plans or the CERP.
Other Regional Water Supply Plans
Three other water supply plans, the Upper East Coast Water Supply Plan(SFWMD, 1998d), the Lower West Coast Water Supply Plan (SFWMD, 2000b), and theKissimmee Basin Water Supply Plan (SFWMD, 2000c) are linked to the LEC Planbecause Lake Okeechobee serves as a common source of water for all of these areas. Forexample, the Caloosahatchee Basin, Lee County, and the City of Fort Myers rely on waterfrom Lake Okeechobee as a source of supply during dry periods. In addition, the St. LucieCanal, in the UEC Planning Area, and the Caloosahatchee River, in the LWC PlanningArea are outlets for discharge of excess water from Lake Okeechobee when water levels inthe lake exceed its regulation schedule. For this reason, these areas within the other watersupply planning regions were analyzed in the LEC planning process.
The Upper East Coast Water Supply Plan was the first water supply plandeveloped under this new statutory direction. The Lower West Coast Water Supply Planwas developed at the same time as the LEC Plan and was completed in 2000. The LECPlan follows the format established by these efforts, with modifications as needed toaddress specific features and issues that are unique to the LEC Planning Area. As otherwater management districts develop their water supply planning initiatives, the SFWMDand the FDEP will work with them to develop a compatible statewide approach. Aspectsthat may be reviewed for compatibility include application of the 1-in-10 year level ofcertainty goal and development of associated water demands. Any results of such effortswill be reflected in the five-year update to this plan.
18

LEC Regional Water Supply Plan - Planning Document Chapter 1: Introduction
Caloosahatchee Water Management Plan
Due to the special problems associated with providing water for irrigation toagricultural interests in the Caloosahatchee River Basin (Figure 6) and to public watersupply facilities in Lee County, a special management plan was developed for theCaloosahatchee River (SFWMD, 2000d). The Caloosahatchee Planning Area spans tworegional water supply planning areas, the Lower West Coast and the Lower East Coast.The Interim Plan for Lower East Coast Regional Water Supply (SFWMD, 1998)recommended that a water management plan be developed for the Caloosahatchee RiverBasin, in recognition of the unique features of this geographic area and its relationship tothe regional water management system. This plan was completed in 2000 and addressedthe long-term water supply needs from the regional system, and alternative methods toimprove management of available water within the watershed. The relevant conclusionsand recommendations of the Caloosahatchee Water Management Plan (SFWMD, 2000d)have been incorporated directly into Chapter 6 of the LEC Plan. The remaining portionsof the plan are incorporated by reference.
S-77
S-78
S-79
Figure 6. Caloosahatchee Watershed Management Planning Area.
19
Chapter 1: Introduction LEC Regional Water Supply Plan - Planning Document
Ecosystem Restoration
In addition to the CERP, restoration is under way in a number of other major SouthFlorida ecosystems and watersheds. Some examples are the Indian River Lagoon/St. LucieRiver, Caloosahatchee River, Loxahatchee Slough and River, the Lake Worth Lagoon,Biscayne Bay, Estero Bay, Kissimmee River Basin, Lake Okeechobee, and theEverglades. Everglades restoration projects include improvements to the C-111 Basin, theEverglades Construction Project, Modified Water Deliveries to Everglades National Park,and restoration of Florida Bay. These efforts are designed to avoid further degradation andultimate loss of the desirable characteristics of these ecosystems and to restore thesesystems to more closely resemble pre-impact conditions.
Rulemaking and Regulation
The District implements two main permitting programs for water resourceallocation and protection: the Consumptive Use Permitting (CUP) Program and theEnvironmental Resource Permitting (ERP) Program. Both require an evaluation of sourceimpacts, including flood protection, wetland protection, water quality, and water supply.Permits are required to withdraw ground water or modify surface water drainagecharacteristics and are issued after careful review of the applicant’s request. The Districtalso implements a water well construction permitting program.
Consumptive Use Permitting
Chapter 373, F.S., enables and directs the District to regulate the consumptive useof water within its jurisdictional boundaries. Consumptive use is any use of water whichreduces the supply from which it is withdrawn or diverted (SFWMD, 1997d). The purposeof the consumptive use regulatory program is to ensure that those water uses permitted bythe District are reasonable-beneficial. For consumptive uses to be considered reasonable-beneficial they must be efficient, consistent with the public interest, and not interfere withother presently existing legal uses. Reasonable assurances must be made that proposedwater uses meet these requirements on an individual and cumulative basis, as well as meetspecific water resource protection criteria.
Water Well Construction Permitting
The District implements a well construction permitting program which reviews thelocation, construction, repair, and abandonment of water wells, and the licensing of waterwell contractors. As of January 1999, the District had five well construction delegationagreements with local governments. The District intends to pursue delegation agreementswith other local governments.
20

LEC Regional Water Supply Plan - Planning Document Chapter 1: Introduction
MEETING PRESENT NEEDS AND THE NEEDS OFFUTURE GENERATIONS
An important part of the planning process has been to identify constraints that areneeded to protect water supplies while exploring opportunities to maximize reasonable-beneficial use of the resource. Balancing these two requirements involved extensivepublic input from the LEC Regional Water Supply Plan Advisory Committee, whosemembers represent a variety of disciplines and interests, such as local governments, publicwater supply utilities, environmental interests, agriculture, Native American tribes, andthe general public.
Water management in South Florida is multifunctional, reflecting the District’sfour main areas of responsibility: water supply, flood protection, water quality, and naturalsystems management. Due to the interrelationships of these areas of responsibility, thewater supply plan was coordinated with other planning, restoration and constructionefforts in the region. For example, other related studies are addressing freshwater inflowsto Biscayne Bay, Everglades National Park, and Florida Bay. The CERP and EvergladesConstruction Project are addressing needs of the Everglades regional ecosystem. Theresults of these and other investigations may further enhance regional water supply byincreasing surface water availability and improving water quality. This comprehensive,coordinated approach, combined with extensive public input throughout the planningprocess, ensures that solutions are balanced and consider all aspects of water management.
21

Chapter 1: Introduction LEC Regional Water Supply Plan - Planning Document
22
LEC Regional Water Supply Plan - Planning Document Chapter 2: The Water Supply Planning Process
Chapter 2THE WATER SUPPLY PLANNING PROCESS
PROCESS OVERVIEW
This section describes the planning process that was undertaken to develop theLower East Coast Regional Water Supply Plan (LEC Plan). The structure of the iterativeprocess used is summarized in the following steps that are described in this plan:
1. Define goals and objectives (Chapter 1, Chapter 2, andAppendix A)
2. Develop evaluation tools (Chapter 2, Appendix E, andAppendix F)
3. Develop performance measures (Chapter 2, Chapter 4, andAppendix D)
4. Estimate current and future base case (without action)conditions (Chapter 4 and Appendix B)
5. Identify problems and issues, including quantification ofsupplies, demands, and projected shortfalls (Chapter 4)
6. Identify options for inclusion in an alternative (Chapter 4)
7. Evaluate water management systemwide performance of thealternative(s); identify demands met and not met (Chapter 4and Appendix H)
8. Develop and analyze solutions and water supply options(Chapter 5 and Appendix H)
9. Develop recommendations based on the results of evaluations(Chapter 6)
10. Develop action plans and funding plans to implement therecommendations (Chapter 6)
To implement this process for the LEC Plan, staff first worked with the LECRegional Water Supply Advisory Committee to develop an overall goal and objectives forthe plan. These were presented and discussed in Chapter 1. Particular attention was paidto ensure that the water supply goal and objectives gave balanced consideration to meetingurban, agricultural, and natural system needs.
At the same time, steps were taken to develop or improve the hydrologic modelingtools that would be used to test and evaluate systemwide performance under variousalternatives. Key hydrologic modeling tools include the South Florida Water ManagementModel (SFWMM) and a series of subregional ground water models that were developed toaddress localized geographic areas.
23
Chapter 2: The Water Supply Planning Process LEC Regional Water Supply Plan - Planning Document
Performance measures were developed based on outputs from the hydrologicmodeling tools and results of related investigations. The performance measures are usedas indicators of the degree to which the water supply objectives are being met. Theperformance measures identify whether the proposed alternative system is providingwater with appropriate timing, frequency, and duration; in sufficient quantities; and at theproper locations to meet the objectives of the plan.
Next, the systemwide performance of the water management system was assessedunder conditions that presently occur, or that will occur in the future, without any actionsbeing taken based on the LEC Plan. These two without-action conditions are called the1995 (current) base case and the 2020 (future) base case. The year 1995 was selected asone anchor year because it represented the latest year for which complete historical datescould be incorporated into the plan. The year 2020 was selected as the other anchorbecause it represented the end point of a 20-year planning horizon (as stipulated inChapter 373, F.S.), based on the completion date of this plan (May 2000). The 1995 and2020 dates are also consistent with the time frames of the Districtwide Water SupplyAssessment (SFWMD, 1998c) and other regional water supply plans.
The 1995 base case includes land use, population, and water demands, as well asthe water management system and operating rules that applied at the time of the analysis(1999). The 2020 base case includes projections of 2020 land use, population, and waterdemands. It also includes modifications to the water management system, such as theEverglades Construction Project and the Kissimmee River Restoration, that are scheduledto be implemented by 2020.
Analyses of these baseline conditions, which are described in subsequent chapters,show that significant water resource problems can be expected to occur throughout theregion unless actions are taken to improve water supplies, redistribute flows, or reduceexpected demands. Results of the model simulations indicate that frequent waterrestrictions may occur within the coastal urbanized and interior farming areas. Seriousenvironmental concerns were also identified as likely to occur in Lake Okeechobee, theEverglades Protection Area, and the St. Lucie and Caloosahatchee estuaries.
Having defined the type and severity of potential future problems the planningprocess then began to develop and analyze alternative solutions. The first solution was toincorporate features of the Interim Plan for Lower East Coast Regional Water Supply(SFWMD, 1998b) and implement the various projects and activities recommended by theCentral and Southern Florida Project Comprehensive Review Study Final FeasibilityReport and Programmatic Environmental Impact Statement (Restudy) (USACE andSFWMD, 1999) that would be in place by 2020. Results of this analysis indicated thatmany of the problems identified to occur in the future were resolved. The most promisingmethods available to enhance water supply was to implement options that have beenidentified in previous LEC planning documents and additional new options.
The recommendations of this plan are based on the results of the alternativesanalyzed and provide a blueprint to address the future water needs of the region.Recommendations of the Caloosahatchee Water Management Plan (CWMP) (SFWMD,
24

LEC Regional Water Supply Plan - Planning Document Chapter 2: The Water Supply Planning Process
2000d) also have been included. The analysis of the Restudy components and the watersupply planning alternative provided insight into how the options functioned together andhow an integrated system could be designed. Some of the proposed recommendations willbe implemented as part of the Comprehensive Everglades Restoration Plan (CERP), itsassociated critical projects, feasibility studies, and project implementation reports. Otherrecommendations suggest actions to address regional and local water supply needs thatshould be implemented via the LEC Plan and the MFL recovery and prevention plans.More detailed implementation strategies, funding, and five-year water resourcedevelopment work plans will be prepared based on recommendations contained herein.
IMPLEMENTING THE PROCESS
Goal Clarification (Step 1)
The overall goal of Chapter 373, F.S., is to ensure the sustainability of waterresources of the state (Section 373.016, F.S.). Chapter 373, F.S., provides the District withseveral tools to carry out this responsibility. These tools have various levels of resourceprotection standards. Water resource protection standards in Chapter 373, F.S., must beapplied together as a whole to meet this goal. Pursuant to Parts II and IV of Chapter 373,F.S., surface water management and Consumptive Use Permitting (CUP) regulatoryprograms must prevent harm to the water resource. MFLs must be set at the point atwhich further withdrawals could cause significant harm to the water resources or ecologyof the area. Water shortage statutes, on the other hand, dictate that permitted watersupplies must be restricted in a manner that prevents serious harm from occurring to thewater resources. Other protection tools include reservation of water for fish and wildlife,or health and safety (Section 373.223[3], F.S.), and aquifer zoning to prevent undesirableuses of the ground water (Section 373.036, F.S.).
The levels of impacts cited above, harm, significant harm, and serious harm, arerelative resource protection terms. Each plays a role to help achieve the ultimate goal,which is a sustainable water resource. The role of MFLs is shown conceptually inFigure 7.
Consumptive Use Permitting Role - Harm Standard and Level of Certainty
Harm Standard
The resource protection criteria used for CUP are based on the level of impact thatis considered harmful to the water resource. These criteria are applied to various resourcefunctions to establish the range of hydrologic change that can occur without incurringharm. The hydrological criteria include water level, duration, and frequency componentsand are used to define the amount of water that can be allocated from the resource.Saltwater intrusion, wetland drawdown, aquifer mining, and pollution prevention criteriain Chapter 40E-2, F.A.C., together define the harm standard for purposes of consumptive
25

Chapter 2: The Water Supply Planning Process LEC Regional Water Supply Plan - Planning Document
use allocation. These harm criteria are currently applied using climate conditions thatrepresent an assumed 1-in-10 year level of certainty.
Level of Certainty
The level of certainty may be characterized as the point to which ground water orsurface water can be drawn down on a reoccurring basis, based on the severity of adrought event, without harming the water resources. The regulatory level represents thepoint of maximum resource development that protects the water resources from harm andprovides some degree of certainty to water use permittees. Another implication of thelevel of certainty in the planning process is that it defines where water resourcedevelopment projects need to be implemented to meet projected reasonable demands(Section 373.0361, F.S.).
Wetlands Protection
Section 3.3, Environmental Impacts, of the District’s Basis of Review for WaterUse Permit Applications (SFWMD, 1997d) requires that withdrawals of water must notcause adverse impacts to environmental features that are sensitive to magnitude, seasonaltiming, and duration of inundation. Maintaining appropriate wetland hydrology (waterlevels and hydroperiod) is scientifically accepted as the single most critical factor inmaintaining a viable wetland ecosystem (Duever, 1988; Mitch and Gosselink, 1986;Erwin, 1991). Water use induced drawdowns under wetlands potentially affect waterlevels, hydroperiod, and the areal extent of the wetland. A guideline of no greater than onefoot of drawdown at the edge of a wetland after 90 days of no recharge and maximum daywithdrawals is used currently for CUP purposes to indicate no adverse impacts. For CUPpurposes, wetlands are delineated using the statewide methodology as described inChapter 62-340, F.A.C.
Permittable Water
HARM
SIGNIFICANTHARM
SERIOUSHARM
Water LevelDecreasing
DroughtSeverity
Increasing
OBSERVEDIMPACTS
Temporary harm to thewater resource,
recovery will occurwithin 1 or 2 seasons
HARM
Harm that requires multipleyears for the water resource
to recover
SIGNIFICANT HARM
1-in-10 Year Level of Certainty
Phase IV Water Restrictions
Phase I Water Restrictions
Phase II Water Restrictions
Phase III Water RestrictionsMinimum Flows and Levels
NO HARM Environmental RestorationNO HARM
Permanent orirreversible damage to
the water resource
SERIOUS HARM
Reservation of Water
Figure 7. Conceptual Relationship Among the Harm, Serious Harm, and Significant HarmStandards
26

LEC Regional Water Supply Plan - Planning Document Chapter 2: The Water Supply Planning Process
The wetland protection criterion used in the modelling performance measures isdefined as follows: ground water level drawdowns induced by cumulative pumpingwithdrawals in areas that are classified as wetlands should not exceed one foot at the edgeof the wetland for more than one month during a 12-month drought condition that occursas frequently as once every 10 years.
The District began a research project in 1995 to support development of wetlanddrawdown criteria. This project involves long-term monitoring of wellfields and wetlandsystems. The wetland protection criterion regarding the relationship between water usedrawdowns and impacts to specific wetland types will be reviewed in the future as thesefield data become available.
Projects Needed to Meet Demands
This plan defines the water resource and water supply development projects thatare needed to assure reasonable-beneficial demands will be met. The regulatory process isone of several plan implementation tools. In order to be consistent with the plan, CUPapplications are reviewed by using the same level of certainty that was used for theplanning analysis, and similar resource protection constraints, on a smaller scale.
1-in-10 Year Level of Certainty
This plan must also meet the water demands for a 1-in-10 year drought event(Section 373.036, F.S.). This level of certainty planning criterion is incorporated into themodeling targets for the LEC Plan. The level-of-certainty planning criteria are designed toprevent harm to the resources up to a 1-in-10 year drought event. These criteria are notintended to be a minimum flow and level. For drought conditions greater than a 1-in-10year event, it may be necessary to decrease water withdrawals to avoid causing significantharm to the resource. Water shortage triggers are water levels at which phased restrictionswill be declared under the District’s water shortage program. The District can use thesetriggers to curtail withdrawals and help prevent water levels from declining to and below alevel where significant harm may occur to the resource could potentially occur.
Water Shortage Role - Serious Harm Standard
Pursuant to Section 373.246, F.S., water shortage declarations are designed toprevent serious harm from occurring to water resources. Serious harm, the ultimate harmto the water resources that was contemplated under Chapter 373, F.S., can be interpretedas long-term, irreversible, or permanent impacts to the water resource. Declaration ofwater shortages by the Governing Board can thus be used as a tool to prevent seriousharm.
When droughts occur, water users increase the amount of withdrawals, typicallyfor irrigation or outside use, to supplement water not provided by rainfall. In general, themore severe the drought, the more supplemental water is needed, and the more likely itbecomes that water shortage restrictions will be imposed. These increased withdrawalsalso increase the potential for serious harm to the water resource.
27

Chapter 2: The Water Supply Planning Process LEC Regional Water Supply Plan - Planning Document
By basing the CUP criteria on a specific and uniform level of certainty, it ispossible to estimate how often water may be restricted by water shortage declaration.Water shortage restrictions may be imposed due to climactic events, continued decline inwater levels, and/or saltwater intrusion and provide a means to curtail human use in theface of decreasing supplies. Each water level trigger corresponds to a particular level ofwater shortage restriction. These restrictions act to apportion the available resource amonguses, including the environment, in a manner that shares the adversity resulting from adrought event. Adoption of resource protection criteria as water shortage trigger indicatorsalso reminds users of the risks of damage and potential for loss due to water shortages.
The District has implemented its water shortage authority by restrictingconsumptive uses based on the concept of shared adversity between users and the waterresources (Chapter 40E-21, F.A.C.). Under this program, different levels or phases ofwater shortage restrictions with varying levels of severity are imposed relative to theseverity of drought conditions. The four phases of current water shortage restrictions arebased on progressively increasing resource impacts, leading up to serious harm. Under theDistrict program, Phase I and II water shortages primarily reduce water use throughconservation techniques and minor use restrictions, such as restrictions on car washingand lawn watering. Phases III and IV, however, require use cutbacks that are associatedwith some level of economic impact to the users, such as the potential for crop damagedue to agricultural irrigation restrictions.
Determining Environmental Water Needs
Water demands for urban and agricultural users are better established and knownthan environmental water demands. Urban and agricultural water uses are considered inthe plan based on historical data and irrigation practices. These are projected into thefuture considering changes in conservation practices, population, land use, and irrigationsystems. Urban, agricultural, and industrial uses of water are protected through the CUPprocess.
On the other hand, environmental demands have not historically been explicitlydefined as a component in the management of the regional water system, with the possibleexception of the rainfall-based operational plans being developed for Modified WaterDelivery Project for Everglades National Park. To clarify the LEC Plan’s objective ofprotecting and enhancing the environment and translate it into operational terms, twoprocesses were implemented during plan development. The first was a process todetermine appropriate MFLs for Lake Okeechobee, the Everglades Protection Area, andthe Biscayne aquifer. The second was the effort undertaken during development of theRestudy to define restoration. Results of these efforts are briefly discussed below. Thestate provides an explicit tool to ensure availability of water for natural systems.
28
LEC Regional Water Supply Plan - Planning Document Chapter 2: The Water Supply Planning Process
Reservations of Water
Chapter 373, F.S., gives the District authority to reserve water for environmentalpurposes:
The governing board or the department, by regulation, may reserve from use bypermit applicants, water in such locations and quantities, and for such seasons ofthe year, as in its judgment may be required for the protection of fish and wildlifeor the public health and safety (Section 373.223(3), F.S.).
Water reserved under this statute cannot be allocated for use under the CUPprogram. The reservation statute may be used effectively as the standard for therestoration of water resources. It is construed to offer a higher level of protection for fishand wildlife than the significant harm standard that applies to MFLs.
One of the most explicit protections of water supplies for natural systems in theLEC Planning Area is set forth in the Everglades Forever Act. In addition to its waterquality components, the Everglades Forever Act requires establishment of “programs andprojects to improve the water quantity reaching the Everglades Protection Area atoptimum times and improve hydroperiod deficiencies in the Everglades ecosystem”(Section 373. 4592(4)(b), F.S.). Although the Everglades Forever Act mandates this broadreaching goal, it explicitly directs the District to utilize existing legal mechanisms inChapter 373, F.S., to implement the hydroperiod enhancement program. The EvergladesForever Act generally refers to the District's other authority to reserve water forenvironmental purposes. The use of reservations may also be appropriate for setting asidewater from allocation necessary to ensure adequate flows to estuaries such as theCaloosahatchee Estuary, and water needed to prevent saltwater contamination, such asoccurs in the Caloosahatchee River in the vicinity of public water supply intakes in LeeCounty.
Minimum Flows and Levels - Significant Harm Standard
The District is responsible for the implementation of statutory provisions inChapter 373, F.S., including Section 373.042, F.S., which requires that the Districtestablish MFLs for watercourses and aquifers. Generally stated, the MFLs for a givenwatercourse or aquifer shall be the limit at which further withdrawals would besignificantly harmful to the water resources of the area. As a step toward meeting thestatutory requirement, a technical document was developed (SFWMD, 2000e) to identifyproposed minimum level depth, duration, and frequency criteria for Lake Okeechobee, theEverglades and the Biscayne aquifer The remaining Everglades include the WaterConservation Areas (WCAs), the Holey Land and Rotenberger Wildlife ManagementAreas (WMAs), and the freshwater regions of Everglades National Park. The District isalso proceeding with efforts to develop MFLs for associated areas, such as theCaloosahatchee River and Estuary, by 2000, the Loxahatchee and St. Lucie estuaries by2001, Florida Bay by 2003, and Biscayne Bay by 2004.
29
Chapter 2: The Water Supply Planning Process LEC Regional Water Supply Plan - Planning Document
Technical Criteria
As a first formal step to meet the deadlines for Lake Okeechobee, the Evergladesand the Biscayne aquifer, the MFL report includes the following:
• A conceptual framework for determining MFLs based on the best scientificinformation and ecological criteria available (this approach may be applied toother surface and ground waters within the District)
• A proposed definition of significant harm to water resources; i.e. a loss ofspecific water resource functions that takes multiple years to recover, whichresults from a change in surface water or ground water hydrology
• Proposed minimum water levels (depth, duration, and frequency) that should bemet to protect water and related resources in Lake Okeechobee, the Everglades,and the Biscayne aquifer
• Proposed technical criteria that provide the basis for determining what actionsshould be taken to reduce the number of times the MFL criteria for LakeOkeechobee, the WCAs, Everglades National Park, and the Biscayne aquiferare not met
The proposed MFL criteria for Lake Okeechobee, the Everglades, and theBiscayne aquifer were based on a review of available scientific literature, historical waterlevel and spatial (geographic) data, modeling results, expert opinion, and the results ofrecent water resource investigations. This information was compiled and analyzed todevelop criteria that could be applied to Lake Okeechobee, Everglades peat and marl soils,and the Biscayne aquifer. Work to define the freshwater needs of coastal estuaries such asthe Caloosahatchee, Loxahatchee, and St. Lucie estuaries, Biscayne Bay, and Florida Bayis ongoing.
Continuing technical review by additional scientists and concerned interests is anintegral part of the MFL development process. The Draft Minimum Flows and Levels forLake Okeechobee, the Everglades, and the Biscayne Aquifer (SFWMD, 2000e) wasformally peer reviewed by numerous impartial scientists and technical experts whoprovided substantive comments concerning all aspects of the document. The documentwas expanded and rewritten and the final report is referenced in this plan. Furtherrefinements of these documents are anticipated through time.
Recovery and Prevention Strategy
Once the MFL technical criteria have been established, the District must develop arecovery and prevention strategy for those water bodies that do not meet the proposedcriteria now or in the future (Section 373.0421, F.S.). The actions required to achieveMFLs will be laid out in this recovery and prevention strategy. This recovery andprevention strategy must be expeditiously implemented and include water resourcedevelopment projects, development of additional water supplies, and implementation ofconservation and other efficiency measures. The recovery or prevention strategy mustinclude phasing or a timetable for development of sufficient water supplies for all existing
30
LEC Regional Water Supply Plan - Planning Document Chapter 2: The Water Supply Planning Process
and projected reasonable-beneficial uses. Development of additional water supplies“concurrent with, to the extent practical, and to offset, reductions in permittedwithdrawals . . .” (Section 373.0421, F.S.) must occur pursuant to the recovery andprevention strategy. The recovery and prevention strategy is included in the LEC Plan(Appendix J). This strategy includes implementation of the MFL criteria throughrulemaking, which will occur subsequent to the planning process.
Comprehensive Everglades Restoration Plan Restoration Targets
The recommendations made in the Restudy will be refined and implementedwithin the Comprehensive Everglades Restoration Plan (CERP). While one goal of theCERP is the ecological restoration of the Everglades, this plan, as well as the broadscientific community, recognize that complete ecological restoration in this region is notpossible. Traditionally, restoration has been defined as the recovery of a natural system toa condition that existed during some prealtered period. For the Everglades, this goal mayrequire the creation of a system that mimics natural conditions that existed prior toconstruction of the first drainage canals and levees in the 1880s.
For at least two overwhelming reasons this goal is challenging. First, there havebeen substantial and irreversible reductions in the spatial extent of the wetland systems inSouth Florida (including an approximately 50 percent reduction in the extent of the trueEverglades), and in the total water storage, timing, and flow capacities of these systems.The second major hurdle is that few of the quantitative, ecological characteristics of thepredrainage wetlands of South Florida are known.
Because the predrainage Everglades cannot be recreated in its original form, therestoration goal for the CERP is to create a new Everglades that will be different from anysystem that existed in the past but will be substantially healthier than the current system.For this restoration project to be successful, it must recover important ecologicalindicators and patterns which are thought to have characterized the predrainage system,and it must be able to sustain these recovered ecological attributes over the long term.
It is too early in the South Florida ecosystem restoration process to state withcertainty exactly what the endpoint for the restored Everglades should become. It is likelythat the length of time required to implement the restoration projects, and the varying timelags in ecological responses, will mean that the current, managed system will evolve into anew Everglades. Thus, the point at which restoration is achieved, and the precisecharacteristics of that restored system, are unknown at present.
Because of these considerations and uncertainties, ecosystem restoration in SouthFlorida is viewed as an open-ended process. Restoration planning is a balancing actamong directions of change, general features that should be present in a restored system,flexibility concerning how and when certain objectives are achieved, and what therestored system should look like.
More importantly, the realistic perspective at present is that it is premature to forcethe debate over the question of, “what constitutes restoration?” At this point there is broad
31
Chapter 2: The Water Supply Planning Process LEC Regional Water Supply Plan - Planning Document
agreement that water management and development practices have caused much of theecological damage to the South Florida ecosystem and that restoration projects to correcthydrological stresses should produce strong improvements in the health of these existingecosystems.
Evaluation Tools (Step 2)
Computer models were used extensively to help in develop this plan. Modelingefforts for the LEC Plan included same basic tools that were used for the Restudy. Themodels produce a simplified version of the real world that may be used to predict thebehavior of the natural system under various conditions. The models do this through aseries of equations which simulate major components of the hydrologic cycle in SouthFlorida. These components include rainfall, evapotranspiration, infiltration, overland andground water flow, canals, canal-ground water seepage, levee seepage, and ground waterpumping. The models incorporate current or proposed water management controlstructures and current or proposed operational rules. Information from localcomprehensive plans, utilities, the University of Florida Institute of Food and AgriculturalSciences (IFAS), and the District’s permitting data base was used to support this analysis.Where specific information was not available, conservative professional judgement wasused. While results of these model runs and analyses are an important part of the LECplanning efforts, the model runs do not constitute a plan. Instead, the analyses providesupport for many of the plan’s recommendations.
These analyses were conducted using both regional surface water and high-resolution ground water computer models. The regional South Florida Water ManagementModel (SFWMM) was used to understand how changes in the Central and SouthernFlorida Project for Flood Control and Other Purposes (C&SF Project), Lake Okeechobee,and WCA schedules and other factors might affect the hydrology of the region and itsability to supply water. The regional Natural System Model (NSM) was used to simulateconditions that may have existed in South Florida before water management features wereconstructed. The subregional. high-resolution ground water models were used to identifypotential impacts of water use on the environment and ground water resources in the urbanand agricultural areas along the lower east coast of Florida. Outputs from these modelswere also analyzed to identify areas where the potential for future saltwater intrusionexists in the Surficial Aquifer System.
South Florida Water Management Model Version 3.7
The South Florida Water Management Model version 3.7 (SFWMM v3.7) is aregional-scale computer model that simulates the hydrology and the management of thewater resources system from Lake Okeechobee to Florida Bay. It covers an area of 7,600square miles using a mesh or grid of two mile by two mile cells. The model boundariesinclude Lake Okeechobee, the Everglades Agricultural Area (EAA), the WCAs,Everglades National Park, the LEC urban areas, and parts of the Big Cypress NationalPreserve (Figure 8). Inflows from Kissimmee River, and runoff and demands in theCaloosahatchee River and St. Lucie Canal basins are considered. The model simulates
32
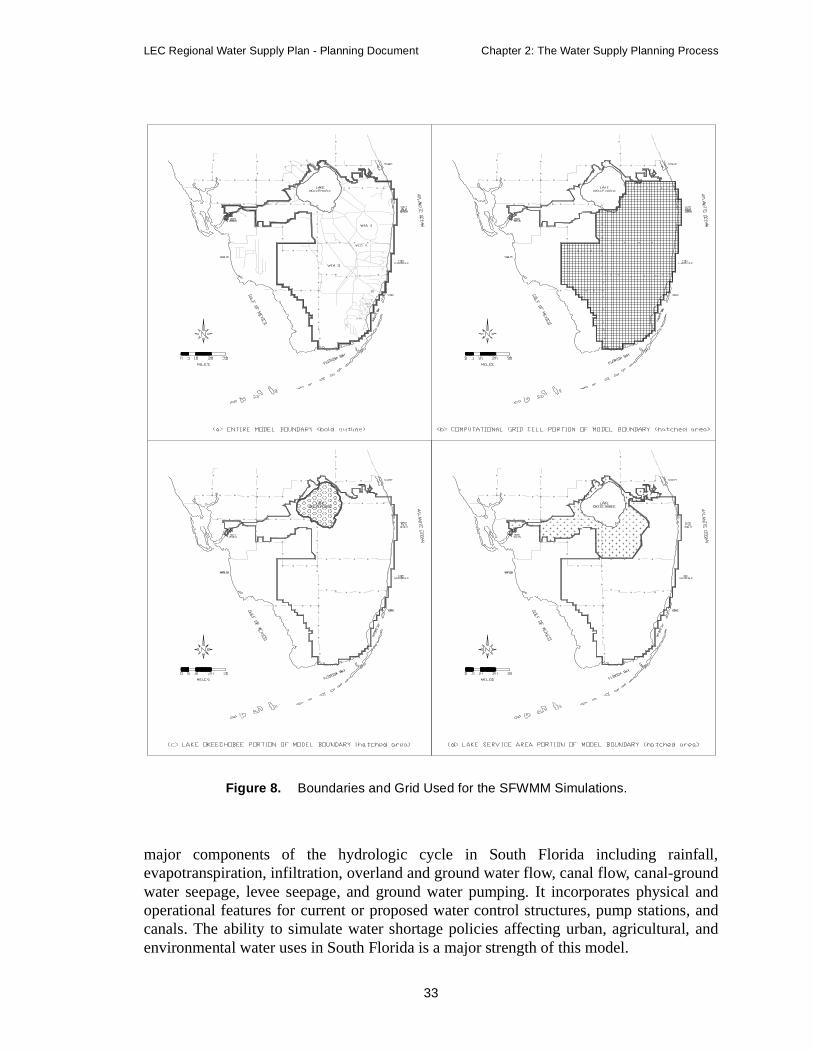
LEC Regional Water Supply Plan - Planning Document Chapter 2: The Water Supply Planning Process
major components of the hydrologic cycle in South Florida including rainfall,evapotranspiration, infiltration, overland and ground water flow, canal flow, canal-groundwater seepage, levee seepage, and ground water pumping. It incorporates physical andoperational features for current or proposed water control structures, pump stations, andcanals. The ability to simulate water shortage policies affecting urban, agricultural, andenvironmental water uses in South Florida is a major strength of this model.
Figure 8. Boundaries and Grid Used for the SFWMM Simulations.
33
Chapter 2: The Water Supply Planning Process LEC Regional Water Supply Plan - Planning Document
The SFWMM is an integrated surface water-ground water model that simulateshydrology on a daily basis using climatic data for the 1965-1995 period, which includesdroughts and wet periods. The model has been calibrated and verified using water leveland discharge measurements at hundreds of locations distributed throughout the regionwithin the model boundaries. Output of the model includes Lake Okeechobee stages anddischarge information, surface and ground water levels, overland flow, andevapotranspiration at any of the 1,700 four-square-mile model grid cells located within theLEC Planning Area. The SFWMM was developed in the early 1980s by the District forthe USACE and has been extensively modified and improved during the past 14 years.The model has been used for a number of applications to evaluate proposed structural oroperational changes to regional water management facilities. The SFWMM was used tohelp identify water supply problem areas in the LEC Planning Area and to assist staff inthe evaluation of the five proposed water supply plan alternatives. Technical staffs ofmany federal, state, and local agencies, and public and private interest groups haveaccepted the SFWMM as the best available tool for analyzing regional-scale structural andoperational changes to the complex water management system in South Florida.
The SFWMM was used in this plan because the hydrology of South Florida iscomplex, due to the flat topography, high water table, sandy soils, and high conductivityof the aquifer system. With the rapid population growth, the water control system in SouthFlorida has been expanded and its operation has become increasingly automated, resultingin a unique system. Federal and state agencies, local governments, and private interests arepresently involved in numerous environmental restoration and water resourcedevelopment projects that are necessary to sustain the quality of life in this rapidlygrowing region. These projects can potentially cost billions of dollars, so that accurateestimation of their benefits and costs is extremely important. Simulation models havebecome the preferred means to assess systemwide impacts of the proposed modificationsto the water resources system in South Florida. The SFWMM, developed specifically forthis region, is probably the best available tool that can simulate the complex systemfeatures and operational rules of proposed regional water management alternatives andprovide adequate information for making water management decisions.
Natural System Model Version 4.5
The Natural System Model (NSM) was created primarily to estimate naturalpredrainage flows and stages throughout the region, prior to significant human influenceon the landscape. The current NSM (version 4.5) uses the same calibrated algorithms asthose implemented by the SFWMM to represent surface and ground water flows, but thecanals and structures of the C&SF Project, as well as all of the water supply wellfields,were removed. Data (where available) and estimates of presubsidence topography and anapproximation of historical vegetation cover are used in lieu of the SFWMM data sets.Output from the NSM includes surface water and ground water levels, overland flow,ground water flow, and evapotranspiration.
The NSM uses recent rainfall data (1965-1995) to predict how water would movethrough an unmodified South Florida hydrologic system. The NSM is the mostcomprehensive tool available that describes the hydrology of South Florida prior to human
34
LEC Regional Water Supply Plan - Planning Document Chapter 2: The Water Supply Planning Process
influence. The NSM provides a reasonable estimate of hydrologic patterns that should beused as restoration targets. The model was especially useful for Everglades ecosystems inthe Holey Land and Rotenberger WMAs, WCA-1, WCA-2, WCA-3, Everglades NationalPark, and Big Cypress National Preserve. Many improvements have been made since theNSM was first developed. These improvements were based on comments and suggestionsreceived from scientific and technical peer reviewers, and improved information, such asbetter topographic data. The District has elected to use the improved versions of the modelas they became available. Outputs from the most recent version of the model provided abasis for the Everglades performance measures used in the LEC Plan.
In this study, NSM results were used in three ways. First, NSM predictions ofhydropattern conditions were used to identify when deliveries of water should be made tothe Everglades for environmental enhancement. Second, NSM hydropattern predictionswere incorporated into the rainfall driven schedules. Finally, NSM hydropatterns wereused in performance measures as reference points to estimate the degree to which thevarious alternatives achieve hydropattern restoration goals. NSM results have becomeaccepted by the scientific community as reasonable estimates of natural hydrologicpatterns that can be used as restoration targets, for the Holey Land and RotenbergerWMAs, the WCAs, and Everglades National Park.
The SFWMM and the NSM computer models perform, on a daily time step, acontinuous simulation of water conditions based on 31 years of historic rainfall andevaporation data. The NSM covers an additional 1,576 square miles of portions of Glades,Hendry, and Highlands counties that were tributary to the original Everglades (Figure 9).Because of the limited amounts of historical predrainage hydrologic data available, NSMresults cannot be directly calibrated to, or validated against, predrainage hydrologicconditions. As a result, NSM results are somewhat less certain than the SFWMM results.However, the NSM is considered the best tool available, combined with good scientificjudgment, to estimate the hydrologic patterns needed to restore the remaining Everglades.
Subregional Models
Ground water models used in the development of the LEC Plan include sixsubregional models: five overlapping ground water models that extend from Palm BeachCounty’s northern border to the tip of Florida and an integrated surface and ground watermodel that simulates the Caloosahatchee River Basin. These models were integral todevelopment of the recommendations of the LEC Plan. They provided the initial designand local evaluation to support several recommendations of this plan. Specifications of thevarious models are summarized in Table 4.
The basins most dependent on ground water withdrawals to meet urban andagricultural demands require a higher-resolution model than the SFWMM’s two-mile bytwo-mile grid to more precisely simulate the effects of withdrawals from the surficialaquifer system. The existing and proposed withdrawal facilities, may potentially impactthe environment or aquifer or may not be able to meet the demands during a 1-in-10 yeardrought condition. In locations where potential impacts were most likely to occur, moredetailed analyses were conducted.
35
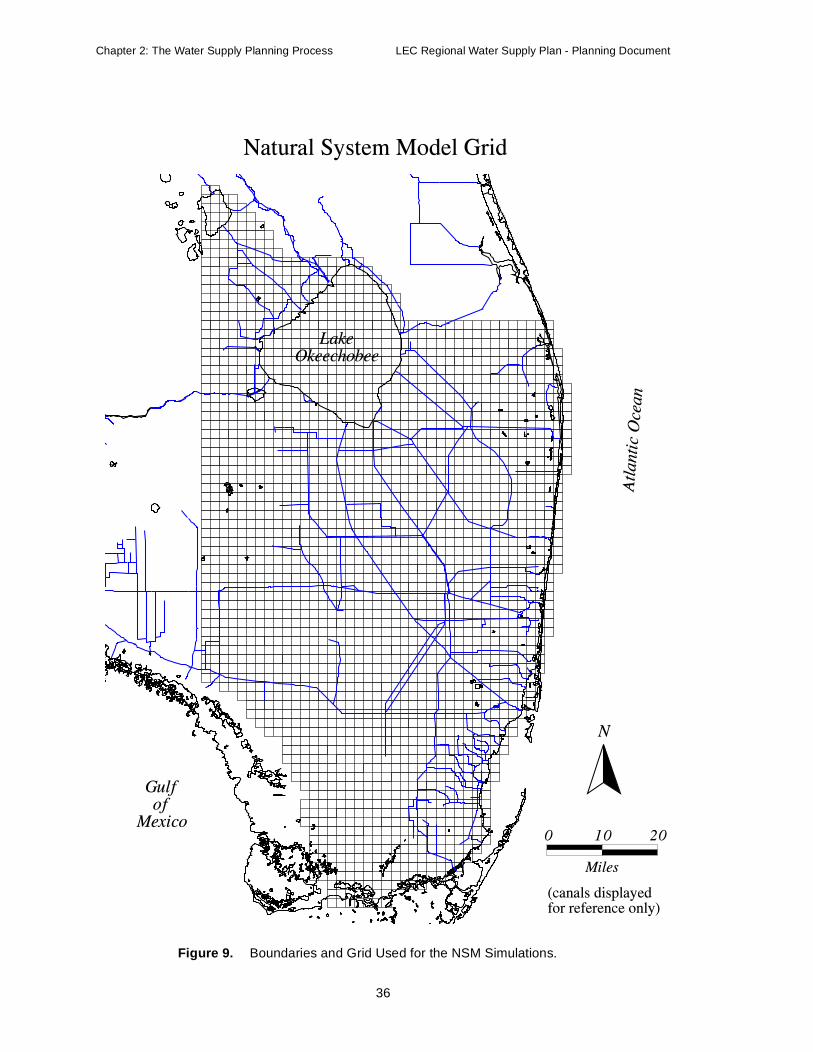
Chapter 2: The Water Supply Planning Process LEC Regional Water Supply Plan - Planning Document
Figure 9. Boundaries and Grid Used for the NSM Simulations.
36
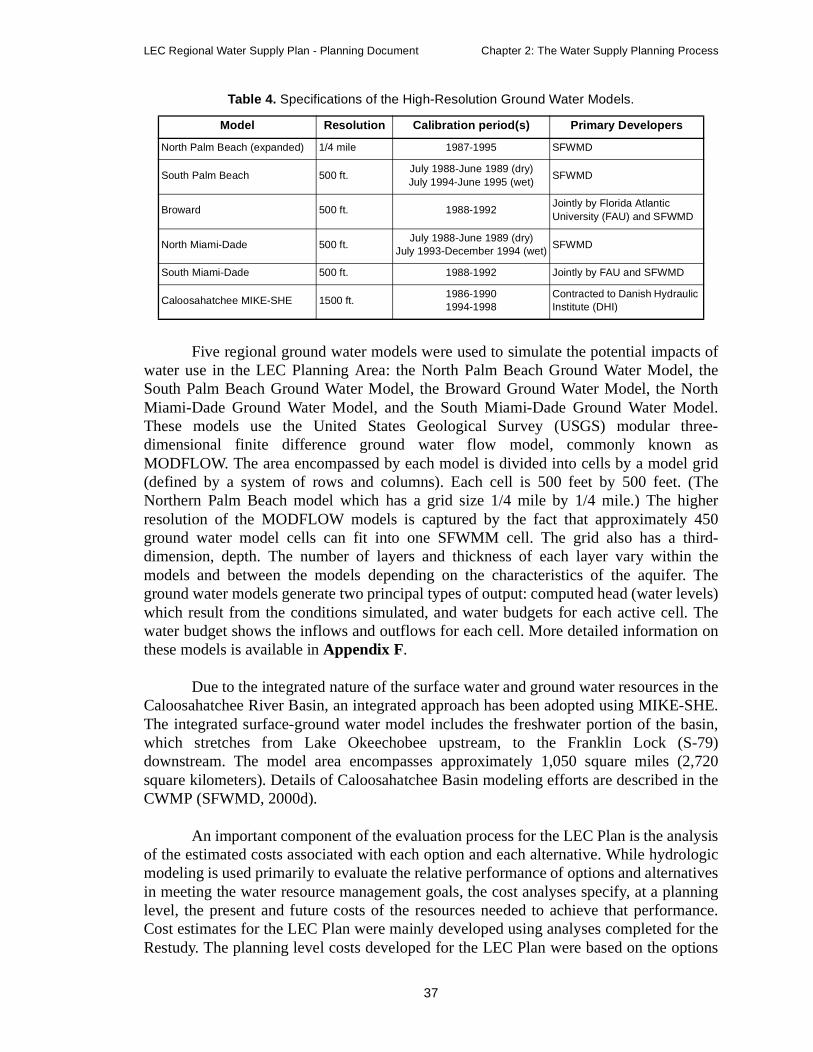
LEC Regional Water Supply Plan - Planning Document Chapter 2: The Water Supply Planning Process
Five regional ground water models were used to simulate the potential impacts ofwater use in the LEC Planning Area: the North Palm Beach Ground Water Model, theSouth Palm Beach Ground Water Model, the Broward Ground Water Model, the NorthMiami-Dade Ground Water Model, and the South Miami-Dade Ground Water Model.These models use the United States Geological Survey (USGS) modular three-dimensional finite difference ground water flow model, commonly known asMODFLOW. The area encompassed by each model is divided into cells by a model grid(defined by a system of rows and columns). Each cell is 500 feet by 500 feet. (TheNorthern Palm Beach model which has a grid size 1/4 mile by 1/4 mile.) The higherresolution of the MODFLOW models is captured by the fact that approximately 450ground water model cells can fit into one SFWMM cell. The grid also has a third-dimension, depth. The number of layers and thickness of each layer vary within themodels and between the models depending on the characteristics of the aquifer. Theground water models generate two principal types of output: computed head (water levels)which result from the conditions simulated, and water budgets for each active cell. Thewater budget shows the inflows and outflows for each cell. More detailed information onthese models is available in Appendix F.
Due to the integrated nature of the surface water and ground water resources in theCaloosahatchee River Basin, an integrated approach has been adopted using MIKE-SHE.The integrated surface-ground water model includes the freshwater portion of the basin,which stretches from Lake Okeechobee upstream, to the Franklin Lock (S-79)downstream. The model area encompasses approximately 1,050 square miles (2,720square kilometers). Details of Caloosahatchee Basin modeling efforts are described in theCWMP (SFWMD, 2000d).
An important component of the evaluation process for the LEC Plan is the analysisof the estimated costs associated with each option and each alternative. While hydrologicmodeling is used primarily to evaluate the relative performance of options and alternativesin meeting the water resource management goals, the cost analyses specify, at a planninglevel, the present and future costs of the resources needed to achieve that performance.Cost estimates for the LEC Plan were mainly developed using analyses completed for theRestudy. The planning level costs developed for the LEC Plan were based on the options
Table 4. Specifications of the High-Resolution Ground Water Models.
Model Resolution Calibration period(s) Primary Developers
North Palm Beach (expanded) 1/4 mile 1987-1995 SFWMD
South Palm Beach 500 ft.July 1988-June 1989 (dry)July 1994-June 1995 (wet)
SFWMD
Broward 500 ft. 1988-1992Jointly by Florida Atlantic University (FAU) and SFWMD
North Miami-Dade 500 ft.July 1988-June 1989 (dry)
July 1993-December 1994 (wet)SFWMD
South Miami-Dade 500 ft. 1988-1992 Jointly by FAU and SFWMD
Caloosahatchee MIKE-SHE 1500 ft.1986-1990 1994-1998
Contracted to Danish Hydraulic Institute (DHI)
37
Chapter 2: The Water Supply Planning Process LEC Regional Water Supply Plan - Planning Document
presented in the appendices to this document that identify major cost components. Thesecomponents, such as acres of land, miles of levees of certain height, pump stations ofcertain capacity, or wells of certain depths and sizes, were then used to estimate the costsof options. These procedures are only designed to provide planning level costs that areuseful to compare relative costs among options or alternatives. More detailed designs andanalyses of site specific factors will be needed before costs suitable for actual constructioncan be developed.
Categories of costs in the analyses include land purchases, construction ofstructures and facilities, and operation and maintenance. The estimated costs and costsavings resulting from the implementation of any option represent differences from thefuture base condition. No costs for existing programs, such as the Everglades ConstructionProject, are included as costs in the LEC Plan.
Performance Measures (Step 3)
Establishing Performance Measures
Once the goals, objectives, and modeling procedures were established for the LECPlan, measures were defined to assess performance of the water supply system. Acomprehensive set of performance measures was developed by District staff with reviewand input from the LEC Regional Water Supply Plan Advisory Committee. Theperformance measures indicate the degree to which the options and alternatives are likelyto meet the goals and objectives of the plan. The performance measures are represented byspecific, selected outputs of the NSM, SFWMM, the ground water models, and theirpostprocessing.
Certain specific performance measures are considered key measures because theybest summarize the overall performance of alternatives. They are presented along with thediscussion of the results in Chapter 4. A more complete description of performancemeasures is provided in Appendix D and results of those measures for the various modelruns are presented in Appendix H.
Categories of Performance Measures and Indicators
The main categories of performance measures and indicators include water budgetsummaries, inflow measures, outflow measures, water level measures, demands met (ornot met) measures, and measures that compare projected water levels with MFLs andNSM predicted hydroperiod (depth, duration, and frequency) targets. A summary of eachof these categories and their importance is provided below.
Water Budget Measures
Water budgets are summaries of the major inflows and outflows of water in abasin. Rainfall, evapotranspiration, and inflows and outflows of surface and ground wateracross basin boundaries are the major components. Water budgets provide an important
38

LEC Regional Water Supply Plan - Planning Document Chapter 2: The Water Supply Planning Process
basis for comparing the sources and uses of water in different water managementalternatives. For instance, the water budgets for Lake Okeechobee provide an importantbasis for evaluating use of lake water.
Inflow Measures
Inflow measures are summaries of the timing (frequency and duration), amount,and location of water flowing into a basin. These measures are important because thetiming, amount, and location of inflows into natural areas affect the degree to whichdesired hydroperiods, MFLs, and restoration can be achieved. For example, the proportionof inflows that enter Everglades National Park through eastern and western portions ofShark River Slough is a major indicator of the ability to restore sheetflow throughEverglades National Park. Inflows are also important performance measures because theycan measure demands. Inflows to the coastal basins during drought periods indicate thedemands of the coastal basins for regional system water.
Outflow Measures
Outflow measures are summaries of the timing (frequency and duration), amount,and location of water flowing out of a basin. Outflow measures from wetland basins areimportant because releases of water affect the ability to meet hydroperiod goals in thosebasins that supply the water. For instance, seepage out of the Everglades to the coastalbasins has a major impact on the ability to achieve desired hydroperiods in the Everglades.Outflows from reservoirs to meet demands are key measures of the performance of thereservoirs.
Water Level Measures
Water level measures are summaries of water elevations. In wetlands, the depth,frequency, and duration of inundation (hydropattern) are particularly importantperformance measures. Stage hydrographs and stage duration curves are two importantmeans that are used to present water level measurements. Water level measures are alsoused to determine how much water is in the system. Such data indicate if problems may beoccurring due to excessively wet or dry conditions.
Measures of Demands Met and Demands Not Met - Level of Certainty
Measures of demands compare the amounts of water supplied to users with theamount of water that is desired or normally used. Measures of demands that are met anddemands that are not met are particularly important as a means to assess the performanceof the option or alternative relative to meeting urban and agricultural water demands. Thepresent water management response to anticipated water supply deficits is to declare watershortages, shift supplies, limit deliveries, and reduce demands. The intent of Districtplanning efforts is to implement long-term water resource development projects that willeventually provide enough additional water to meet demands during a 1-in-10 yeardrought condition. Therefore, the frequency and duration of declared water shortagerestrictions are used as performance measures. The District has the ability to impose
39
Chapter 2: The Water Supply Planning Process LEC Regional Water Supply Plan - Planning Document
several different levels of water restrictions. Phase 1 and Phase 2 shortages are less severeand unlikely to cause economic loss or damages to crops or vegetation. Phase 3 and 4restrictions are more severe and may reduce irrigation to the extent that crop andvegetation damages would be significant if rainfall cannot compensate for the lack ofirrigation water.
The level of certainty planning goal that the districts need to achieve in their watersupply plans is to provide sufficient water to meet the 1-in-10 year level of certaintycriteria (Section 373.0361, F.S.). This criterion was applied as an additional performancemeasure to evaluate the adequacy of water deliveries to utilities and agricultural waterusers.
Measuring MFLs
Specific quantitative targets have been proposed for minimum levels in LakeOkeechobee, the Everglades, and the coastal Biscayne aquifer. Comparison of projectedwater levels for an alternative to these targets is an important performance measure todetermine where and when significant harm may occur.
Natural System Model Hydroperiod Targets
Similarly, the NSM was used in many areas to define restoration and managementgoals. Generally these targets were considered to provide the harm standard that is used toestablish limits for issuing consumptive use permits. Many such comparative performancemeasures are used for evaluation of the LEC Plan options and alternatives.
Estimate Current and Future Base Case Conditions (Step 4)
Current base case conditions consisted of 1995 land use patterns and populations,as well as actual water use data provided by local utilities. This model run was the 1995Base Case. Two future base case conditions were considered.
In the first future condition, projected 2020 land use patterns, populationdistributions, and water use data were developed based on input from local governments,utilities, and the state. Ongoing efforts such as the Everglades Construction Project, C-111Project and Modified Water Deliveries to Everglades National Park are assumed to becomplete. This constituted the 2020 Base Case, which does not include Restudy projects.
In the second future condition, projected 2020 land use, population, and ongoingproject conditions were also used. Water supply and environmental restorationcomponents recommended in the Restudy were then added to the extent that such facilitiesor features would be in operation by 2020 to create the LEC 2020 with Restudy.
This second future condition was also evaluated using the subregional groundwater models. Outputs from the 2-mile by 2-mile grid SFWMM were used to establishboundary conditions for the finer scale subregional models. Outputs from the subregional
40
LEC Regional Water Supply Plan - Planning Document Chapter 2: The Water Supply Planning Process
models were expressed and evaluated in terms of the same performance measures thatwere used for the larger models
Problem and Solution Identification and Evaluating Alternatives (Steps 5 Through 8)
Having identified the problems based on historical experience and the base caseevaluations, the next step was the identification of potential solutions that would providethe water needed to meet the projected demand. In the LEC planning process, individualactions that may contribute to an improvement in water supply are called options. Whenselected options are combined to improve the overall performance of the water supplysystem, they are referred to as an alternative.
Results of the Restudy and input from the LEC Regional Water Supply PlanAdvisory Committee were used as the primary basis to identify options and developalternatives. Options were identified based on performance problems discovered in thebase case analyses or from evaluation of previous or parallel planning efforts. Alsoconsidered was the potential or opportunity that exists for the option to solve the problem,the technical feasibility, ability to obtain permits, and the cost of the option.
The identification of an option within a particular area is based on the recognitionthat there is an opportunity to improve on the management of the regional water system. Itdoes not imply that a problem is or is not caused by water demands in that area or that aspecial funding responsibility will or will not be assigned in the area where a facility islocated. Many of the options included in this plan have been identified as components ofthe Restudy. To the extent possible, the methods and procedures that were used to analyzeoptions for the LEC Plan were the same as were used for the Restudy. Examples of waterresource development opportunities that will improve the regional water managementsystem include the following:
• Facilities or operating procedures to modify storage in LakeOkeechobee
• Facilities to capture and use runoff from the CaloosahatcheeBasin
• Aquifer Storage and Recovery (ASR wells) and reservoirs tocapture and use runoff from the EAA
• Water Preserve Areas (WPAs) to capture and use seepage fromthe Everglades and runoff from coastal basins
• Facilities and operating procedures to improve the timing andlocation of releases into the Everglades and between locationswithin the Everglades
• Operational procedures to improve timing and location ofreleases to estuaries
41
Chapter 2: The Water Supply Planning Process LEC Regional Water Supply Plan - Planning Document
In addition to the regional elements that were considered in the Restudy, a numberof more site-specific features were analyzed to help meet urban and agricultural needs incoastal watersheds and the EAA:
• Wellfield relocation to protect and make better use of waterresources available in the coastal basins
• Local ASR to capture and use excess water
• Alternative sources to meet new water demands in the EAA andcoastal basins
Options considered in the LEC Plan are discussed in Chapter 5 and detailedexplanations are included in the appendices to this report.
Recommendations (Step 9)
Initial draft recommendations were developed by District staff based on all theanalyses conducted in support of the LEC planning process, discussions with the LECRegional Water Supply Plan Advisory Committee, and comments and input provided bythe committee and the public throughout the planning process. The Restudy componentsprimarily address environmental restoration goals, but also provide significant regionalurban and agricultural water supply benefits. The final recommendations were also basedon results of model runs and the findings and insights gained throughout the entire LECplanning process.
Implementation Plans and Funding Analyses (Step 10)
Detailed funding analyses and schedules to implement the recommendations in theLEC Plan were developed as a component of this plan. Planning level implementationsteps and costs were developed in concert with the Restudy and were based on results ofmodel runs and staff analysis. Funding strategies for the LEC Plan are being coordinatedwith other Districtwide activities, efforts of other agencies, local governments, andutilities.
PUBLIC AND GOVERNMENT PARTICIPATION
The LEC Regional Water Supply Plan Advisory Committee was created in January1992 to allow extensive public participation in the plan development process. Thecommittee has played a key role throughout the planning process, especially in assistingwith the development of objectives and design solutions to meet the objectives.Committee participants include representatives from urban, agricultural, environmentalinterest groups, government agencies, Native American tribes, and others. A continuingrole of the LEC Regional Water Supply Plan Advisory Committee is to represent thepublic in the implementation of the regional water supply plan.
42
LEC Regional Water Supply Plan - Planning Document Chapter 2: The Water Supply Planning Process
To encourage and ensure a high level of public participation, the SFWMD has metwith many groups and organizations to discuss this plan. Participants included utility,environmental, and agricultural advisory committees, the Governor’s Commission for aSustainable South Florida, the Southeast Florida Utilities Council, and the Florida Sectionof the American Water Works Association (AWWA). The SFWMD also contributedsignificant support and technical information derived from the LEC planning effort to theGovernor’s Commission for a Sustainable South Florida, the Northwest Dade CountyFreshwater Lake Plan Implementation Committee, the planning effort for the WPAs, andthe Restudy.
43

Chapter 2: The Water Supply Planning Process LEC Regional Water Supply Plan - Planning Document
44

LEC Regional Water Supply Plan - Planning Document Chapter 3: Planning Area Description
Chapter 3PLANNING AREA DESCRIPTION
INTRODUCTION AND OVERVIEW
The Lower East Coast (LEC) Planning Area covers approximately 1,200 squaremiles and includes essentially all of Miami-Dade, Broward, and Palm Beach counties,most of Monroe County, and eastern portions of Hendry and Collier Counties (Figure 1).The entire Lake Okeechobee Service Area, which includes parts of four additionalcounties, Martin, Okeechobee, Glades, and Lee, was incorporated into the analysesbecause of its reliance on Lake Okeechobee for water supply. This area encompasses asprawling, fast-growing urban complex that, according to the 1990 census, providedhomes for 6.3 million people, primarily along the coast. The planning area has extensive,economically significant agricultural lands and world renowned environmental resourcessuch as the Everglades ecosystem and Lake Okeechobee, the largest freshwater lake in thesouthern United States. Highly productive coastal estuaries such as Biscayne Bay andFlorida Bay occur along the shores.
Natural Features
The LEC Planning Area has many significant and unique natural resources andfeatures that make this area especially worthy of protection, as well as desirable for humanuse and settlement. The region has a very suitable climate with mild temperatures andample amounts of rainfall. The topography is low and flat, with numerous, extensivewetlands, and significant lakes and rivers. Many areas are covered with rich organic soilsthat support lush natural plant communities and highly productive farms. Undevelopedareas of the region support a broad diversity of native subtropical plant and animalcommunities, including many threatened and endangered species.
Historically, the watershed of the LEC Planning Area began in Central Florida,south of Orlando. Water from lakes and wetlands in that region overflowed naturaldrainage divides during wet periods and moved slowly southward, through LakeKissimmee and into the Kissimmee River. The Kissimmee River, in turn, then meanderedslowly southward for about 90 miles to flow into Lake Okeechobee. Lake Okeechobeewas much larger than it is today and was bordered by extensive freshwater marshes andforests, especially along its southern border. When the water level in the lake was high,water flowed south into the extensive wetlands of the Everglades, moving slowlysouthward through this “River of Grass” to Florida Bay and the Ten Thousand Islands.
The quality of water that historically existed in South Florida is unknown, butanalyses of remaining areas that are relatively undisturbed, suggest that most naturalsurface waters were extremely pure, containing very low levels of dissolved solids andnutrients.
45
Chapter 3: Planning Area Description LEC Regional Water Supply Plan - Planning Document
Man-Made Features
The Kissimmee River was channelized and degraded, beginning in the late 1800sand culminating with completion of the Kissimmee River Project in the 1970s. LakeOkeechobee is especially important to the LEC Planning Area because it forms theheadwaters of the planning area. The lake has been diked around its borders and structuresand gates have been constructed to regulate the flow of water to and from the lake. Today,Lake Okeechobee provides a multifunctional reservoir from which the South FloridaWater Management District (District, SFWMD) has the ability to move water to theEverglades, to coastal communities, to agricultural interests in the Everglades AgriculturalArea (EAA), and to the St. Lucie Canal and Caloosahatchee River basins. Much of thehistoric Everglades has been developed for urban and agricultural use. These regionalwetlands are crossed by large canals that are designed to provide drainage and conveywater to coastal communities and to tide. Protective levees were constructed around theremaining northern Everglades to create multipurpose Water Conservation Areas (WCAs).Everglades National Park was created at the southern end to protect and restore naturalplant and animal communities
South Florida today is characterized by highly productive agricultural regions andrapidly growing urban areas that lie directly adjacent to extensive aquatic and wetlandecosystems. Many of these natural systems are threatened as a result of water managementactivities that were designed to support agricultural and urban development. Urbanlandscapes occupy most of the higher elevation areas. Extensive agricultural areas covermuch of the interior of the peninsula north and south of Lake Okeechobee and along theinterior margins of the coastal urban areas. Both urban and agricultural land uses requireincreasing levels of water supply and flood control and produce degraded runoff thatneeds to be treated or stored prior to release back into natural systems.
Resource Concerns
The Kissimmee River is currently undergoing ecological restoration. Diking andmanagement of water levels in Lake Okeechobee have reduced the surface area of the lakeand eliminated most of the surrounding littoral wetlands. The lake now requires frequentregulatory water releases to avoid flooding and to maintain lowered water levels. Largeregulatory releases can severely damage the St. Lucie and Caloosahatchee estuaries.
Lake Worth Lagoon and Biscayne Bay are located along the highly urbanized eastcoast in central Palm Beach and Dade counties, respectively. These urban estuarieshistorically received significant freshwater inflows from adjacent rivers and springs, buthave become increasingly saline since the beginning of the twentieth century, when watertables were lowered, major rivers were channelized, salinity control structures wereinstalled, and permanent inlets were opened to the Atlantic Ocean. Today, these largelysaline systems are periodically impacted by excessive freshwater discharges from theprimary drainage canals. In addition, they have been degraded by development activitiessuch as channel dredging, bulkhead construction, industrial and sewage waste disposal,marina and dock development, and storm water runoff. Although these cumulative
46

LEC Regional Water Supply Plan - Planning Document Chapter 3: Planning Area Description
impacts have diminished their value as healthy estuarine ecosystems, both areas stillsupport a number of important natural resource and recreational values that should beprotected. Efforts by local interests and state agencies to restore Biscayne Bay have beenongoing for many years. In January 1997, the Florida Department of EnvironmentalProtection (FDEP) and Palm Beach County became cosponsors for the Lake WorthLagoon restoration efforts. The SFWMD is also contributing funds and staff support torestoration projects in these systems.
The Everglades have been reduced in area by half due to agricultural and urbanexpansion. The remaining Everglades ecosystem is declining largely as a result of alteredwater regimes, drainage, compartmentalization, and degraded water quality. Thisdegradation is evidenced by vegetation change, decreasing wildlife populations, and lossof organic soils. At the downstream end, the Florida Bay ecosystem experiences alteredsalinities due to decreased freshwater heads and inflows from the Everglades. The alteredsalinities have impacted habitats, nursery grounds, plants, and animals.
The environmental problems in South Florida today can be attributed largely to adiminished capacity to retain the huge volumes of water that once pooled and sheetflowedacross the predrainage landscape. Loss of this capacity to store fresh water on the surfaceand underground has led to a decline in ground water levels. This has caused inlandmigration of salt water in coastal aquifers. Today, surface water that comprised anessential feature of South Florida ecosystems is considered a threat to coastal developmentand is either discharged to tide through canal systems or is stored at unnaturally highlevels in remnant diked wetlands of the Everglades. Many of these problems arerecognized to be unanticipated effects of the existing Central and Southern Project forFlood Control and Other Purposes (C&SF Project). They are exacerbated by thecontinually increasing population in South Florida. The result is a currentlynonsustainable system of urban, agricultural, and natural systems that exceeds thecapacity of, or is hampered by, existing water management facilities.
The following discussion is a brief summary of existing physical, ecological, andsocioeconomic conditions within the study area. It does not attempt to providecomprehensive coverage of all resources or concerns. Instead, it summarizes baselineresources that are present in the study area and may be affected by implementation of thiswater supply plan.
TOPOGRAPHY
The surface features of central and southern Florida are largely of marine orcoastal origin with subsequent erosion and modification by nonmarine waters. Thefeatures include flat, gently sloping plains; shallow water-filled depressions; elevated sandridges; and a limestone archipelago. The elevations of the ridges and plains are related toformer higher stands of sea level. Some ridges were formed above the level of these higherseas as beach ridges while the plains developed as submarine shallow sea bottoms.
47

Chapter 3: Planning Area Description LEC Regional Water Supply Plan - Planning Document
The topography of the District has low elevation and wide areas of very low relief.Nearly all of the District is less than 200 feet above sea level and nearly half its area is lessthan 25 feet above sea level. Elevations within the District generally decline from north tosouth.
The bottom of Lake Okeechobee is approximately at sea level. Water levels in thelake generally range from 11 to 18 ft NGVD The land immediately surrounding LakeOkeechobee is at an elevation of about 20 to 25 ft NGVD. The coastal regions and most ofthe peninsula south of the latitude of Lake Okeechobee lie below 25 ft NGVD inelevation. From Lake Okeechobee southward, an axial basin, occupied by the lake and theEverglades, occurs near the longitudinal center of the peninsula with slightly higherground to the east and west. A small area near Immokalee and parts of the Atlantic CoastalRidge are higher than 25 ft NGVD. Except for the coastal and beach ridges, this southernregion is very flat in appearance and slopes vary gradually from approximately 25 ftNGVD in the vicinity of Lake Okeechobee to sea level at the coasts.
Land elevations in the WCAs generally range from about 16 ft NGVD at thenorthern end of WCA-1 to about 9 to 10 ft NGVD at the southern end of WCA-3. WithinEverglades National Park, the land surface generally slopes from 8 to 9 ft NGVD at thenorthern end to below sea level as the freshwater wetlands of the Everglades merge withthe saltwater wetlands of Florida Bay.
Because changes in elevation are very gradual, and because much of South Floridais difficult to access, detailed topographic data are not available for much of the region,especially within the remaining Everglades. Accurate topographic information is anessential requirement for both surface and ground water modeling efforts.
GEOLOGY AND SOILS
The geology and soils of South Florida represent many of the opportunities,constraints, and impacts of regional water management. The high transmissivity of theBiscayne aquifer allows rapid recharge of LEC Planning Area wellfields, increases thetendency for flooding to occur in low-lying lands east of the Everglades, and has set thestage for the issue of seepage control. Loss of peat soils of the Everglades, as a result ofdrainage, has reduced the capacity of the system to retain water and is an indicator ofecosystem change.
Lake Okeechobee and much of the Everglades are underlain by peat and mucksoils that developed in a shallow basin with poor natural drainage under prolongedconditions of flooding. Beneath these surface layers of organic material lies the FortThompson formation of interbedded sand, shell, and limestone. Bedrock in the Evergladesis almost entirely limestone.
The Atlantic Coastal Ridge along the lower east coast is mostly underlain by thinsand and Miami Limestone that are highly permeable and moderately-to-well drained.West of the coastal ridge, soils contain fine sand and loamy material and have poor natural
48
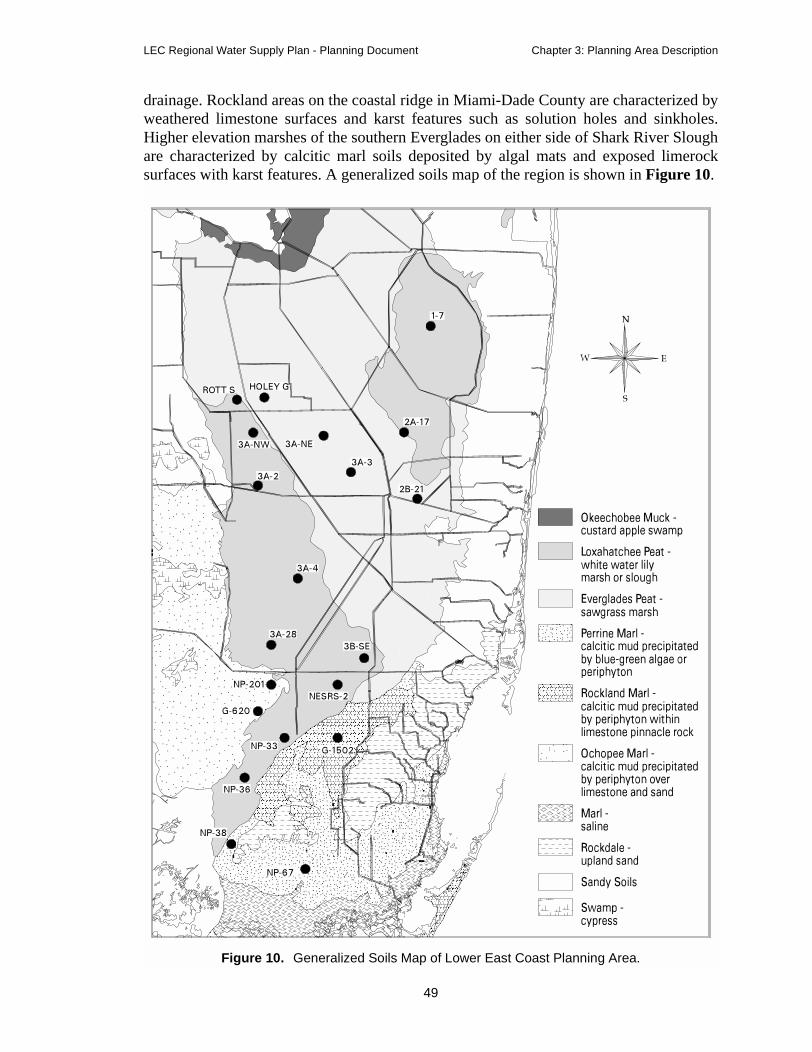
LEC Regional Water Supply Plan - Planning Document Chapter 3: Planning Area Description
drainage. Rockland areas on the coastal ridge in Miami-Dade County are characterized byweathered limestone surfaces and karst features such as solution holes and sinkholes.Higher elevation marshes of the southern Everglades on either side of Shark River Sloughare characterized by calcitic marl soils deposited by algal mats and exposed limerocksurfaces with karst features. A generalized soils map of the region is shown in Figure 10.
Figure 10. Generalized Soils Map of Lower East Coast Planning Area.
49
Chapter 3: Planning Area Description LEC Regional Water Supply Plan - Planning Document
Florida Bay is underlain by Miami Limestone with variable sediment cover ofsand, exposed bedrock, and mudbanks. The Ten Thousand Islands consist of sandy barrierislands underlain primarily by the Tamiami formation. Because of the low relief,numerous marshy back bays or lagoons, such as Whitewater Bay, occupy exposedlimestone surfaces behind the slightly higher buildup of sand and mangrove peat onbeaches along the Gulf of Mexico. The Florida Keys are made up of highly permeableKey Largo Limestone in the Upper Keys and less permeable Miami Oolite on the LowerKeys.
South Florida contains three major carbonate aquifer systems. These systems arethe Surficial Aquifer System, the Intermediate Aquifer System, and the Floridan AquiferSystem.
The Surficial Aquifer System is comprised of rocks and sediments from the landsurface to the top of an intermediate confining unit. The discontinuous and locallyproductive water bearing units of the Surficial Aquifer System include the Biscayneaquifer, the undifferentiated surficial aquifer, the coastal aquifer of Palm Beach andMartin counties, and the shallow aquifer of southwest Florida. Practically all municipaland irrigation water is obtained from the Surficial Aquifer System.
The Intermediate Aquifer System consists of beds of sand, sandy limestone,limestone, and dolostone that dip and thicken to the south and southwest. In much ofSouth Florida, the Intermediate Aquifer System represents a confining unit that separatesthe Surficial Aquifer System from the Floridan Aquifer System.
The Floridan Aquifer System is divided by a middle confining unit into the upperand Lower Floridan aquifers. In the LEC Planning Area, from Jupiter to south Miami, theUpper Floridan aquifer is being considered for storage of potable water in an AquiferStorage and Recovery (ASR) system. In the Lower Floridan aquifer there are zones ofcavernous limestones and dolostones with high transmissivities. However, these zonescontain saline water, and are primarily used for injection of treated effluent wastewater.
CLIMATE
The subtropical climate of South Florida, with distinct wet and dry seasons, highrates of evapotranspiration, and climatic extremes of floods, droughts, and hurricanes,represents a major physical driving force that sustains the Everglades while creating watersupply and flood control issues in the agricultural and urban segments. South Florida’sclimate, in combination with low topographic relief, delayed the development of SouthFlorida until the twentieth century, provided the main motivation for the creation of theC&SF Project 50 years ago, and continues to drive the water management planning of theComprehensive Everglades Restoration Plan (CERP) and the Lower East Coast RegionalWater Supply Plan (LEC Plan) today.
Seasonal rainfall patterns in South Florida resemble the wet and dry seasonpatterns of the humid tropics more than the winter and summer patterns of temperate
50

LEC Regional Water Supply Plan - Planning Document Chapter 3: Planning Area Description
latitudes. Of the 53 inches of rain (average) that South Florida receives annually, 75percent falls during the wet season months of May through October. During the wetseason, thunderstorms that result from easterly trade winds and land-sea convectionpatterns occur almost daily. Wet season rainfall follows a bimodal pattern with peaksduring May-June and September-October. The amount of rainfall varies regionally withinthe District (Figure 11).
Tropical storms and hurricanes also provide major contributions to wet seasonrainfall with a high level of interannual variability and low level of predictability. Duringthe dry season, rainfall is governed by large-scale winter weather fronts that pass throughthe region approximately weekly. High evapotranspiration rates in South Florida roughlyequal annual precipitation. Recorded annual rainfall in South Florida has varied from 37 to106 inches, and interannual extremes in rainfall result in frequent years of flood anddrought. Multiyear high and low rainfall periods often alternate on a timescaleapproximately on the order of decades.
NATURAL SYSTEMS
Vegetation
The location of South Florida between temperate and subtropical latitudes, theproximity to the West Indies, the expansive wetland system of the greater Everglades, andthe low levels of nutrient inputs under which the Everglades evolved, all combine to createa unique and species-rich flora and vegetation mosaic. Today nearly all aspects of SouthFlorida’s native vegetation have been altered or eliminated by the development, alteredhydrology, nutrient inputs, and spread of exotics that have resulted directly or indirectlyfrom a century of water management. Figure 12 indicates the nature and extent of changesin natural systems from 1900 to 1973.
Riparian plant communities of the Kissimmee River and its floodplain arerecovering from channelization and drainage. The macrophyte communities of thediminished littoral zone of Lake Okeechobee are now contained within the Hoover Dike.They remain essential for the ecological health of the lake but are stressed by extreme highand low lake levels and by the spread of exotics.
Below the lake, all of the pond apple swamp forest and most of the sawgrass plainof the northern Everglades have been converted to the EAA. Also, eliminated is the bandof cypress forest along the eastern fringe of the Everglades that was largely converted toagriculture after the eastern levee of the WCAs cut off this community from the remainingEverglades. The mosaic of macrophytes and tree islands within the WCAs and EvergladesNational Park is altered by changes in hydrology, exotic plant invasion, and nutrientinputs.
The problems of the Everglades extend to the mangrove estuary and coastal basinsof Florida Bay, where the forest mosaics and submerged aquatic vegetation show theeffects of diminished freshwater heads and flows upstream that are exacerbated by a rise
51
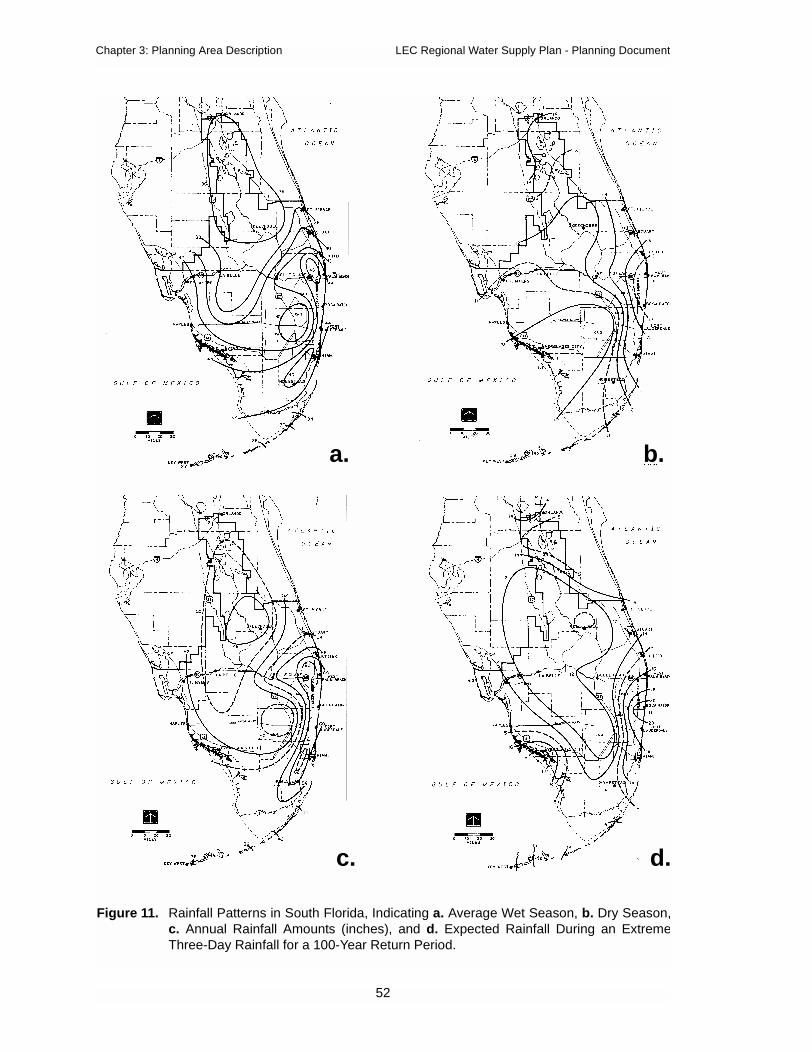
Chapter 3: Planning Area Description LEC Regional Water Supply Plan - Planning Document
Figure 11. Rainfall Patterns in South Florida, Indicating a. Average Wet Season, b. Dry Season,c. Annual Rainfall Amounts (inches), and d. Expected Rainfall During an ExtremeThree-Day Rainfall for a 100-Year Return Period.
a. b.
c. d.
52

LEC Regional Water Supply Plan - Planning Document Chapter 3: Planning Area Description
1900
1953
1973
UrbanAgricultureWaterNatural
Figure 12. Changes in Natural Systems in the Lower East Coast Planning Area, 1900 to 1973.
53

Chapter 3: Planning Area Description LEC Regional Water Supply Plan - Planning Document
in sea level. The upland pine and hardwood hammock communities of the Atlantic coastalridge were historically interspersed with wet prairies and cypress domes and dissected by“finger glades” watercourses that flowed from the Everglades to the coast. These remainonly in small and isolated patches that have been protected from urban development.
More detailed documentation of existing vegetation focuses on wetland systemsthat have been most seriously degraded and that will receive the most benefits from theimplementation of the components recommeded in the Central and Southern FloridaProject Comprehensive Review Study Final Feasibility Report and ProgrammaticEnvironmental Impact Statement (Restudy) (USACE and SFWMD, 1999). Those systemsinclude the Everglades peatland, the Everglades marl prairie and rocky glades, and themangrove estuaries and coastal basins of Florida Bay. Other natural systems in SouthFlorida already have restoration plans and have had lesser impacts from man. Thesesystems include the Kissimmee River, where restoration is already in progress; LakeOkeechobee for which a revised regulation schedule is planned to protect littoral,macrophyte communities; and the Big Cypress National Preserve where vegetationimpacts and fixes are relatively minor compared to the Everglades. The Atlantic coastalridge pinelands and hardwood hammocks, and the hammock and dune communities alongthe beaches are unique subtropical ecosystems that have very little protection and arerapidly disappearing.
Fish And Wildlife
The life cycles, community structures, and population densities of the fauna ofSouth Florida are intricately linked to regional hydrology. The current status of fish andwildlife has been strongly influenced by the cumulative effects of drainage activities earlythis century, the C&SF Project, and the ensuing agricultural and urban development. Themajor emphasis in this section is on those faunal groups that appear to have declined as aresult of hydrologic changes caused by the C&SF Project. The major linkages betweenhydrologic alterations and fauna that are emphasized here include the decline of aquaticfood webs and populations, higher level consumers that depend upon them, shifts inhabitats to those less favorable to faunal communities, and the reduction in the spatialextent of the Everglades wetland system.
A critical link in the aquatic food webs, and one that appears to have beenimpacted by hydrologic alterations, is the intermediate trophic level of the small aquaticfauna. The small marsh fishes, macroinvertebrates, amphibians, and reptiles, which formthe link between the algal and detrital food web bases of the Everglades and the largerfishes, alligators, and wading birds that feed upon them, are currently diminished due toloss of habitat and changes in hydrology.
Included in the freshwater aquatic community of South Florida are the larger sportspecies such as the largemouth bass (Micropterus salmoides), sunfishes, and black crappie(Lepomis nigromaculatus). Lake Okeechobee is renowned for the trophy bass from itslittoral zone and for an abundant black crappie fishery. Largemouth bass also naturally
54
LEC Regional Water Supply Plan - Planning Document Chapter 3: Planning Area Description
inhabit the deep water sloughs and wet prairies of the Everglades, where they grow at arate of one pound per year of uninterrupted flooding.
Shortened hydroperiods in much of the LEC Planning Area presently confinelarger bass mostly to canals, which provide a popular recreational fishery. Unfortunately,Everglades bass contain high body burdens of mercury, which make them unsuitable forfrequent human consumption. Prolongation of hydroperiods that will be provided by anincrease in water supply to the Everglades, should revitalize and expand the fishery for thelargemouth bass to the sloughs and wet prairies and create new fisheries in reservoirs.Bass fisheries in remaining canals should also be substantially improved.
The American alligator (Alligator mississippiensis) is a keystone species in theEverglades. Holes that are created by alligators form ponds where aquatic fauna survivedroughts. Mounds of sediment that are excavated from the holes create higher-elevationhabitat for willow and other swamp forest trees. In addition to modifying topography, theAmerican alligator is the top predator in the Everglades and feeds on every level of thefood chain, from small fishes to wading birds, at various stages in its life.
The most conspicuous indicators of ecosystem health in the Everglades are theplummeting populations of wading birds. At present, nesting birds have declined to onlyten percent of their historical number and they continue to decline. The food bases forthese species are mostly contained in the freshwater marsh fish assemblage of theEverglades and the low salinity mangrove fish assemblage of the estuarine transition zone.
Due to diminished freshwater heads and flows upstream, habitats for the Americancrocodile (Crocodylus acutus) and migratory waterfowl, and nursery grounds of estuarineand marine sport fishes and pink shrimp (Penaeus duorarum) were also degraded.
The deer population has benefited from lower water levels. More white-tailed deer(Odocoileus virginianus) presently live in the Everglades than occurred under predrainageconditions. However, during high water periods, large-scale mortality can occur when thedeer are stranded on overbrowsed tree islands.
Threatened and Endangered Species
The U.S. Fish and Wildlife Service (USFWS), has identified 18 federally-listedplant and animal species that would likely be affected by changes in water managementpractices (Table 5). Of the listed species, critical habitat has been designated for the WestIndian manatee (Trichechus manatus), the snail kite (Rostrhamus sociabilis plumbeus), theCape Sable seaside sparrow (Ammodramus maritimus mirabilis), and the Americancrocodile. For a description of these critical habitat geographic designations and acomplete species description, taxonomy, distribution, habitat requirements, managementobjectives, and current recovery status, see the USFWS web site (http://www.fws.gov). Acomplete listing of all the federally-listed threatened and endangered plant and animalspecies occurring or thought to occur within the study area is also available from this website. The Florida Wildlife Commission (FWC) provides information on state-listed species(Table 5).
55

Chapter 3: Planning Area Description LEC Regional Water Supply Plan - Planning Document
Table 5. Threatened and Endangered Plant and Animal Species Found in the Lower East CoastPlanning Area.
Scientific Name Common Name USFWSa FWCa
Mammals
Trichechus manatus West Indian Manatee Eb Eb
Felis concolor coryi Florida panther E E
Mustela vison evergladensis Everglades mink T
Birds
Rostrhamus Sociabilis plumbeus snail kite Eb E
Mycteria americana wood stork E E
Ammodramus maritimus mirabilis Cape Sable seaside sparrow Eb E
Ammodramus savannarum floridanus Florida grasshopper sparrow E E
Picoides borealis red-cockaded woodpecker E T
Haliaeetus leucocephalus bald eagle T T
Polyborus plancus (borealis) Audubon’s crested caracara T T
Aphelocoma coerulescens Florida scrub jay T T
Grus canadensis pratensis Florida sandhill crane T
Ajaia ajaia roseate spoonbill SSC
Aramus guarauna limpkin SSC
Egretta caerula little blue heron SSC
Egretta thula snowy egret SSC
Egretta tricolor tricolored heron SSC
Eudocimus albus white ibis SSC
Falco peregrinus tundrius Arctic peregrine falcon SSC
Speotyto cunicularia burrowing owl SSC
Reptiles and Amphibians
Crocodylus acutus American crocodile Eb E
Drymarchon corais couperi Eastern indigo snake T T
Gopherus polyphemus gopher tortoise SSC
Pituophis melanoleucus mugitus Florida pine snake SSC
Tantilla oolitica Miami black-headed snake SSC
Rana capito gopher frog SSC
Invertebrates
Liguus fasciatus Florida tree snail SSC
Heraclides aristodemus ponceanus Shaus’ swallowtail butterfly E
Plants
Cucurbita okeechobeensis Okeechobee gourd E
Amorpha crenulata crenulate lead plant E
Euphorbia deltoidea deltoid spurge E
Galactia smallii Small’s milkpea E
Polygala smallii tiny polygala E
Euphorbia garberi Garber’s spurge T
a. E= Endangered; T= Threatened; SSC= Species of special concernb. Designated critical habitat
56

LEC Regional Water Supply Plan - Planning Document Chapter 3: Planning Area Description
WATER QUALITY
Generally, water quality conditions in South Florida are assessed on a biannualbasis by the FDEP. The Florida Water Quality Assessment 1998 305 (b) Report (Paulicand Hand, 1998) provides an overall view of water quality in South Florida, includingmuch of the LEC Planning Area.
Pollutants of Concern
Water quality conditions in the study area are significantly influenced bydevelopment related activities. Hydrologic alterations have led to significant changes inthe landscape by opening large land tracts for urban development and agriculturalpractices, and by the construction of extensive drainage networks. Natural drainagepatterns in the region have been disrupted by the extensive array of levees and canals suchthat nonpoint source (storm water) runoff and point sources of pollution (wastewaterdischarges) are now part of the normal hydrological regime in many areas. Severalpollutants of concern in the study area have been identified, including nutrients,pesticides, mercury, other metals, biologicals (fecal coliforms and pathogens), physicalparameters, and other constituents. Of this list, phosphorus, pesticides, and mercury areconsidered to be the most problematic water quality pollutants of the region and arediscussed below.
Phosphorus
Historically, South Florida waters were low in nutrients (oligotrophic). Due tohuman activities including the ditching and draining of wetlands and the expansion ofagricultural practices, water bodies from the Kissimmee River southward have becomenutrient enriched to various degrees. The nutrient that has the greatest impact on the healthof South Florida ecosystems, is phosphorus. Farming areas surrounding Lake Okeechobeehave contributed to elevated phosphorus levels in the Kissimmee River, LakeOkeechobee, Caloosahatchee River, and the Everglades. Urban storm water runoff isanother source of phosphorus to the Everglades and South Florida coastal systems. Ingeneral, the trend for phosphorus concentrations is a decrease from north (KissimmeeRiver and EAA) to south (Everglades National Park). Nutrient removal occurs naturally inlakes and wetlands, due to the water quality treatment provided by plants and bacterialprocesses. Elevated nutrient levels occur when loading rates exceed the natural removalcapacity. The resulting increased concentration of nutrients is termed eutrophication andmay have various ecological impacts that include increased primary productivity, loss ofwater column dissolved oxygen, algal blooms, and changes in vegetation and biodiversity.Such effects of phosphorus loadings may ultimately reduce or destroy a water body’shabitat and/or recreational value.
57
Chapter 3: Planning Area Description LEC Regional Water Supply Plan - Planning Document
Pesticides
Many types of pesticides are applied to or persist in South Florida waters,sediments and soils. The South Florida region is unique in that large and sensitiveecosystems exist in the midst of intensively developed urban and agricultural areas. Majoramounts of pesticides are used in ground/aerial applications related to agriculturalproduction, mosquito control, control of aquatic plants in local waterways, andmaintenance of golf courses, lawns, and yard vegetation. Pesticides used in these waysthreaten sensitive ecosystems and humans due to the intense year-round use, coupled withthe shallow water tables and large-scale consumption of ground and surface waters.
Mercury
Mercury is a toxic heavy metal. Levels of mercury in water, animal tissue,sediments, periphyton, air, and soil are elevated in certain areas of South Florida.However, the sources, distribution, magnitude, transport, transformations, and pathwaysof mercury through the Everglades ecosystem are poorly understood. Among the possiblemercury sources in South Florida are natural mineral and peat deposits and atmosphericdeposition from global, regional, and local sources. Local sources include generatingplants and waste incinerators. Mercury is now believed to primarily come fromatmospheric deposition. Once elemental mercury is methylated by microbial action, itbecomes biologically available in the food chain and concentrations increase as it movesup the food chain to top carnivores such as the Florida panther.
Surface Water Quality Conditions
Section 303(d) of the Federal Clean Water Act requires states to develop TotalMaximum Daily Loads (TMDLs) for their water bodies that are not meeting designatedstandards. For the study area, FDEP listed over 118 priority water bodies/segments. Thenumber of these priority water bodies/segments occurring in each basin is as follows:
• Lake Okeechobee (12)
• Caloosahatchee River Basin (11)
• Southeast Florida Basin (95)
• Florida Keys (0)
A map summarizing information available for the Southeast Florida Basin andLake Okeechobee is provided in Figure 13.
Lake Okeechobee is at the center of the South Florida drainage system, receivingflow from the Kissimmee River Basin, and, to a lesser extent, from EAA backpumping.The lake may be considered an historically eutrophic water body that is becomingdegraded, due primarily to nutrient inputs from the Kissimmee River and the TaylorCreek/Nubbin Slough basins. Despite extensive pollutant abatement programsimplemented during the past 15 years, recent lake data indicate that nutrientconcentrations and loads have shown no substantive improvement. Further, because the
58

LEC Regional Water Supply Plan - Planning Document Chapter 3: Planning Area Description
lake's phosphorus is internally recycled and large amounts of phosphorus are stored inwatershed canal sediments, phosphorus levels in lake waters may not reach acceptablelevels for many decades.
Water quality in the Caloosahatchee River is degraded in the upper and lower areasof the basin, due to agricultural and urban runoff, respectively. Problems associated withthe degraded areas are typified by low dissolved oxygen levels, elevated conductivity, anddecreased biodiversity. In urban sections of the basin, nonpoint storm water flows areassociated with periodic algal blooms, fish kills, and low dissolved oxygen levels.
Extensive agricultural Best Management Practices (BMPs) have been applied inthe EAA in the past several years to reduce the phosphorus load leaving the EAA.However, this area remains a primary source of pollutants for the WCAs. Drainage ofmuck soils for crop production causes soil oxidation and the release of nutrients into EAArunoff waters. During the wet season, growers commonly pump large volumes of nutrientenriched water off their land to protect crops against flooding. These waters also are
GOOD
FAIR
POOR
N#
#
#
##
#
#
#
#
#
#
#
LAKE
OKEECHOBEE
SOUTHEAST
FLORIDA
BASIN
Jupiter
Hollywood
Palm Beach
Boca Raton
Belle Glade
Miami Beach
Coral Gables
Sewalls Point
Port St. Lucie
West Palm Beach
Fort Lauderdale
Pompano Beach
N
Water Quality StatusGOODFAIRPOOR
30 0 30 60 Miles
Figure 13. Results of FDEP Water Quality Assessment for Portions of the LEC PlanningRegion.
59

Chapter 3: Planning Area Description LEC Regional Water Supply Plan - Planning Document
contaminated with chlorides, dissolved minerals, iron (derived from EAA ground water),nutrients and trace levels of pesticides. The highly altered hydroperiod, resulting from thelevees and pump operations, may exacerbate water quality conditions in the WCAs, asevidenced by a general degradation of water quality in the areas along the canals andadjacent to pump stations. Construction of upstream Stormwater Treatment Areas (STAs)currently under way is expected to improve water quality conditions in the WCAs throughtime.
In the central Everglades, phosphorus concentrations entering the EvergladesNational Park were lower in 1997 than the interim and long-term limits established by the1991 Settlement Agreement (USA v. SFWMD, 1991). No significant trends in annualaverage mercury concentrations in water, sediment, or fish have been observed for the pastfive years. The best water quality conditions in the Everglades National Park were foundin central Shark River Slough and along the coastal regions of the basin.
Some parts of Florida Bay experienced massive seagrass and mangrove die-offsduring the 1980s and 1990s that likely stem from a lack of circulation, high watertemperatures, and increased levels of salinity. Water diverted into the lower east coastcanals has reduced freshwater flows to the bay resulting in recorded salinities as high as70 parts per thousand.
Water bodies in the LEC Planning Area are seriously degraded in the heavilyurbanized areas, including the numerous man-made canals. For example, water quality inLake Worth Lagoon is good near the inlets and poor in the area between the inlets. Canalsand water bodies in and around Fort Lauderdale are degraded by urban runoff andhistorical wastewater discharges, and by agricultural runoff in western portions of thecanals. The New River and Miami River canals are polluted by improperly functioningseptic tanks, discharges from vessels, industrial activities, improper sewer connections,and storm water runoff. Problems associated with these pollutants vary, but may includehigh nutrient concentrations, high bacteria counts, dense growth of undesirable aquaticvegetation, low biological diversity, low dissolved oxygen concentrations, and theoccurrence of exotic plants and animals.
Water quality is good in open water areas of central and southern Biscayne Bay,and degraded in the area north of the Miami River Canal. High concentrations of heavymetals such as tin, copper, zinc, and chromium occur in sediments at marina sites.
Water quality conditions in the Florida Keys are generally good in areas open tothe Atlantic or Gulf of Mexico. However, many man-made canals and marinas have waterquality problems that are exacerbated by storm water runoff, seepage from septic tanks,and poor circulation.
60

LEC Regional Water Supply Plan - Planning Document Chapter 3: Planning Area Description
Ground Water Conditions
The principal ground water resources for the LEC Planning Area are the SurficialAquifer System (SAS), including the Biscayne aquifer, and the Floridan Aquifer System(FAS). Both are critical to the local ecology and economy. A cross-section of the geologyof South Florida, depicting the aquifers, is shown in Figure 14.
Surficial and Biscayne Aquifers
The surficial and Biscayne aquifers provide most of the fresh water for publicwater supply and agriculture within the LEC Planning Area. Both are critical to the localecology and economy. The SAS is unconfined and extends throughout southeast Florida.A portion of the SAS has distinctive geological characteristics, is highly productive, andhas been designated as the Biscayne aquifer. Location, depth, and water levels in theBiscayne aquifer are shown in Figure 15. The SAS provides major sources of water forthe following uses:
• Meeting drinking water requirements for more than four millionpeople living in urban areas along Florida's lower east coast
• Maintaining water levels in local wells, canals, and lakes
• Irrigating agricultural crops
• Replenishing regional wetlands and providing base flow toestuaries such as Biscayne Bay and Florida Bay
Figure 14. Geologic Cross-Section of South Florida Showing the Location of the Aquifers.
Floridan
Intermediate
Surficial
West Palm BeachLake OkeechobeeFt. Myers LaBelle
2300
2100
1900
1700
1500
1300
1100
900
700
500
300
1000
Water Table Aquifer
Lower Confining Unit
Boulder Zone
Lower Floridan Aquifer
Middle Confining Unit
Upper Floridan Aquifer
Hawthorn Confining Zone
Mid-Hawthorn Aquifer
Lower Tamiami Aquifer
Biscayne
Sandstone Aquifer
Aquifer
WEST EAST
61

Chapter 3: Planning Area Description LEC Regional Water Supply Plan - Planning Document
The Biscayne aquifer is composed of units and formations principally depositedduring the Pleistocene Epoch, or Great Ice Age. This interval of geologic time was aperiod of climatic instability where great glaciers would advance and retreat across thecontinents. As the glaciers advanced, sea level declined and large areas of South Floridabecame exposed as dry land. Deposition during this time occurred due to dune buildingand formation of freshwater limestones. As the glaciers melted, sea levels increased andeventually submerged the southern peninsula, creating a highly productive, shallowmarine environment. During this time period, marine deposits dominated the compositionof the Biscayne aquifer. Typical marine deposits from these high sea level stands occurthroughout South Florida and include the coral limestones on Key Largo and the ooliticridge along the coast (Hoffmeister, 1974).
The major geologic deposits that comprise the Biscayne aquifer include MiamiLimestone, the Fort Thompson Formation, the Anastasia Formation, and the Key LargoFormation. The base of the Biscayne aquifer is generally the contact between the FortThompson Formation and the underlying Tamiami Formation of Plio-Miocene Age.However, in places where the upper unit of the Tamiami Formation contains highlypermeable limestones and sandstones, the zones would also be considered part of theBiscayne aquifer if the thickness exceeds 10 feet (Fish and Stewart, 1991).
Figure 15. Location of the Biscayne Aquifer in Eastern Miami-Dade, Broward, and Palm BeachCounties with a. Average Aquifer Depth and b. Elevation of the Surface of theAquifer. Contour lines are ft NGVD.
a. b.
62

LEC Regional Water Supply Plan - Planning Document Chapter 3: Planning Area Description
The Biscayne aquifer is composed of interbedded, unconsolidated sands and shellunits with varying thickness of consolidated, highly solutioned limestones and sandstones(Shine et al. 1989). In general, the Biscayne aquifer contains less sand and moresolutioned limestone than most of the SAS. The Biscayne aquifer is one of the mostpermeable aquifers in the world and has transmissivities in excess of seven million gallonsper day, per foot of drawdown (Parker et al., 1955).
Due to the regional importance of the Biscayne aquifer, it has been designated as asole source aquifer by the U.S. Environmental Protection Agency (USEPA) under the SafeDrinking Water Act and is, therefore, afforded stringent protection. This designation wasmade because it is a principal source of drinking water and is highly susceptible tocontamination due to its high permeability and proximity to land surface in manylocations. Major sources of contamination are saltwater intrusion and infiltration ofcontaminants from canal water. Sources of contamination include surface water runoff(pesticides and fertilizers); leachate from landfills, septic tanks, and sewage planttreatment ponds; and injection wells used to dispose of storm water runoff or industrialwaste. Trichloroethylene and vinyl chloride are examples of ground water contaminants ofconcern. Numerous hazardous waste sites (e.g., Superfund and Resource Conservationand Recovery Act sites) have been identified in the area underlain by the Biscayne aquifer.Action to remove existing contamination is under way at many of these sites. Wastemanagement practices are generally monitored to prevent further contamination.
Floridan Aquifer System
The FAS is a thick sequence of carbonate units. Less permeable carbonate units,referred to as the middle confining unit, separate the system into two major aquifers calledthe Upper and Lower Floridan aquifers. The FAS is one of the most productive aquifers inthe world and is a multiple-use aquifer system. Where it contains fresh water, it is theprincipal source of water supply, especially north of Lake Okeechobee. The UpperFloridan aquifer is used for drinking water supply in parts of Martin and St. Luciecounties.
From Jupiter to southern Miami, water from the FAS is mineralized (totaldissolved solids are greater than 1,000 mg/L). More than 600 feet of low permeabilitysediments confine this aquifer and create artesian conditions. Although the head gradientis upward, the low permeability units prevent significant upward migration of salinewaters into the shallower aquifers. Depth to the Floridan aquifer is approximately 900 feetin coastal Miami-Dade County. In the LEC Planning Area, the Upper Floridan aquifer isbeing considered for storage of potable water within an ASR system. In the LowerFloridan aquifer, there are cavernous zones with extremely high transmissivities.However, because these zones produce saline water, they are not used for drinking watersupply. Because of their depth and salinity, these deeper zones of the Lower Floridanaquifer are used primarily for injection of treated wastewater.
63

Chapter 3: Planning Area Description LEC Regional Water Supply Plan - Planning Document
Saltwater Intrusion
The inland movement of salt water is a major resource concern in the coastal areasof the LEC Planning Area and can significantly affect water availability in areas adjacentto saline water bodies. When water is withdrawn from the surficial aquifer at a rate, thatexceeds its recharge capacity, the amount of freshwater head available to impede themigration of saltwater is reduced, and saltwater intrusion becomes likely. The salineinterface moved significantly inland during the 1940s in southeast Broward County andnorthern Miami-Dade County due to construction of the coastal canals which drained thefreshwater mound behind the coastal ridge. Historical changes in saltwater intrusionboundaries in Miami-Dade County are shown in Figure 16. More recently, several wellsin the cities of Hollywood, Hallandale, and Dania were taken out of service due tosaltwater contamination. The recharge capacity of the aquifer was exceeded.
Figure 16. Historical Extent of Saltwater Intrusion in Coastal Miami-Dade County.
64
LEC Regional Water Supply Plan - Planning Document Chapter 3: Planning Area Description
The District's Consumptive Use Permitting (CUP) criteria includes denial ofpermits that would cause significant saline water intrusion. Section 3.4, Saline WaterIntrusion, of the District's Basis of Review for Water Use Permit Applications (SFWMD,1997d) defines significant saline water intrusion as follows:
• Movement of the saline water interface to a greater distance inland or verticallyupward towards a freshwater source than has historically occurred as aconsequence of seasonal fluctuations.
• A sustained increase from background values of saline monitor wells withregard to dissolved chloride concentration.
Impacts include the potential to permanently move the saline interface inland,reducing the quality and quantity of water available at existing wellfields and impedingfuture withdrawals at favorable locations (near population centers and treatment plants).
Historically, the District's CUP Program has required water users to maintain aminimum of one foot of freshwater head between their wellfields and saline water as aguideline for the prevention of saltwater intrusion. This guideline, in combination with asaltwater intrusion monitoring program, has been largely successful in preventingsaltwater from occurring based on consideration of individual permits and utilityoperations. The LEC Plan is taking a more comprehensive view of the potential forsaltwater intrusion by identifying areas that are most vulnerable and developing proactivemeasures to reduce occurrence of, and better manage, saltwater intrusion.
WATER MANAGEMENT
The LEC Planning Area portion of C&SF Project is divided into threehydrologically related geographical areas consisting of 1) Lake Okeechobee and the EAA;2) the WCAs, and 3) the east coast canals.
Lake Okeechobee and Everglades Agricultural Area
The location of major features of the Lake Okeechobee Service Area (LOSA) andthe EAA are shown in Figure 17. With a surface area of more than 730 square miles, LakeOkeechobee represents the third largest lake in the United States. Lake Okeechobee wasformed approximately 6,000 thousand years ago. Construction of the levee system aroundthe lake during the twentieth century, and the lowering of lake levels to a maximum of 17ft NGVD, effectively isolated thousands of acres of marsh, creating a new littoral zone/marsh community in areas where one had not previously existed. This wetland area nowoccupies more than 20 percent (98,000 acres) of the total surface area of the lake andprovides habitat for a wide variety of plant and animal communities, including a numberof rare, threatened, or endangered species such as the snail kite, wood stork, West Indianmanatee, and the Okeechobee gourd. The littoral zone provides an important nurseryground and habitat for fish and other aquatic organisms. Migratory birds and waterfowlalso use the littoral zone and open water areas of the lake as a resting area along theAtlantic flyway. The lake also supports a nationally renowned sport fishery for largemouth
65

Chapter 3: Planning Area Description LEC Regional Water Supply Plan - Planning Document
bass, black crappie, bluegill, redear sunfish, and catfish. Recreational and commercialfisheries combined have an estimated value of more than 28 million dollars per year. Thelake's littoral zone also supports significant wading bird populations and is an importantwaterfowl hunting area.
The historical Everglades area contains the largest known contiguous body oforganic soils in the world. The EAA, located south of Lake Okeechobee within easternHendry and western Palm Beach counties, encompasses an area of totaling approximately718,400 acres (1,122 square miles) of highly productive agricultural land comprised ofrich organic peat or muck soils. Approximately 77 percent of the EAA (553,00 acres) is inagricultural production. Nitrogen-rich organic (peat) soils and a warm subtropical climatepermit the year-round farming of sugarcane, winter vegetables, and rice with a 1988 totaleconomic impact estimated near $1.3 billion dollars (Mulkey and Clouser, 1988).
Water levels in Lake Okeechobee are regulated by a complex system of pumps andlocks. A regulation schedule has been established for Lake Okeechobee to achievemultiple uses and provide seasonal lake level fluctuations that vary from high stages in thelate fall, winter, and early spring to low stages at the beginning of the wet season. Theregulation schedules contain instructions and guidance on how project pumps, locks, andspillways are to be operated to maintain appropriate water levels. The schedule maintainsa low lake stage to provide both storage capacity and flood protection for surroundingareas during the wet season. During the winter, lake levels may be increased to store water
Figure 17. The Lake Okeechobee Service Area, including the Everglades Agricultural Area.
66

LEC Regional Water Supply Plan - Planning Document Chapter 3: Planning Area Description
for the upcoming dry season. The general plan of operation is based on 1) providing floodprotection from lake waters and hurricane-driven wind tides for lands adjacent to the lake;2) maintaining an eight-foot navigation depth, as part of the Okeechobee Waterway; and3) storing water to meet requirements of agricultural and urban areas south and east of thelake.
Flood control works on Lake Okeechobee consist of a system of about 1,000 milesof encircling levees, designed to withstand severe flood stage and wind conditions, plusregulatory and water supply outlets of the St. Lucie Canal and the Caloosahatchee River.The design discharge of Moore Haven Spillway is 9,300 cubic foot per second (cfs) andthat of St. Lucie Spillway is about 16,000 cfs. Following removal of local runoff from theagricultural areas south of the lake, an additional regulatory capability of several thousandcfs is available through the Miami, North New River, Hillsboro, and West Palm Beachcanals by pumping into the WCAs.
Agriculture within the EAA requires extensive drainage of 553,00 acres of richorganic soil. The primary drainage and irrigation system within the EAA consists of anextensive network of canals, levees, pumps and water control structures constructed by theUSACE as part of the C&SF Project and is currently operated and maintained by theDistrict. Drainage of the EAA is achieved through six primary canals (Hillsboro, NorthNew River, Miami, West Palm Beach, Cross and Bolles canals). Seven major pumpstations and have a total design capacity to remove excess water from each subbasin at amaximum rate of 3/4 of an inch of runoff per day. Nine smaller, Chapter 298 drainagedistricts also maintain secondary drainage systems and operate pump facilities within theEAA to provide local control of water movement within and between subbasins. Inaddition, individual farms operate numerous private pumps, some of which are portable,that move water to and from the main canals.
Everglades Protection Area
The Everglades Protection Area lies south of the EAA, west of the Atlantic CoastalRidge, and east of the Big Cypress Preserve. It is comprised of a number of differentmanagement areas that have different operational needs and priorities, including theWCAs; the Holey Land and Rotenberger Wildlife Management Areas (WMAs); andEverglades National Park, which also includes Florida Bay (Figure 18).
The Everglades is an internationally recognized ecosystem that coversapproximately two million acres in South Florida and represents the largest subtropicalwetland in the United States. Prior to drainage and development, this area consistedlargely of vast sawgrass plains, dotted with tree islands and interspersed with wet prairiesand aquatic sloughs covering most of southeastern Florida (Davis, 1943). EvergladesNational Park and the WCAs are the surviving remnants of the historical Everglades,which extended over an area approximately 40 miles wide by 100 miles long, from thesouth shore of Lake Okeechobee to the mangrove estuaries of Florida Bay. This remainingarea provides significant ecological, water storage, flood control, and recreational benefitsto the region, as well as important habitat for wildlife of national significance. The
67
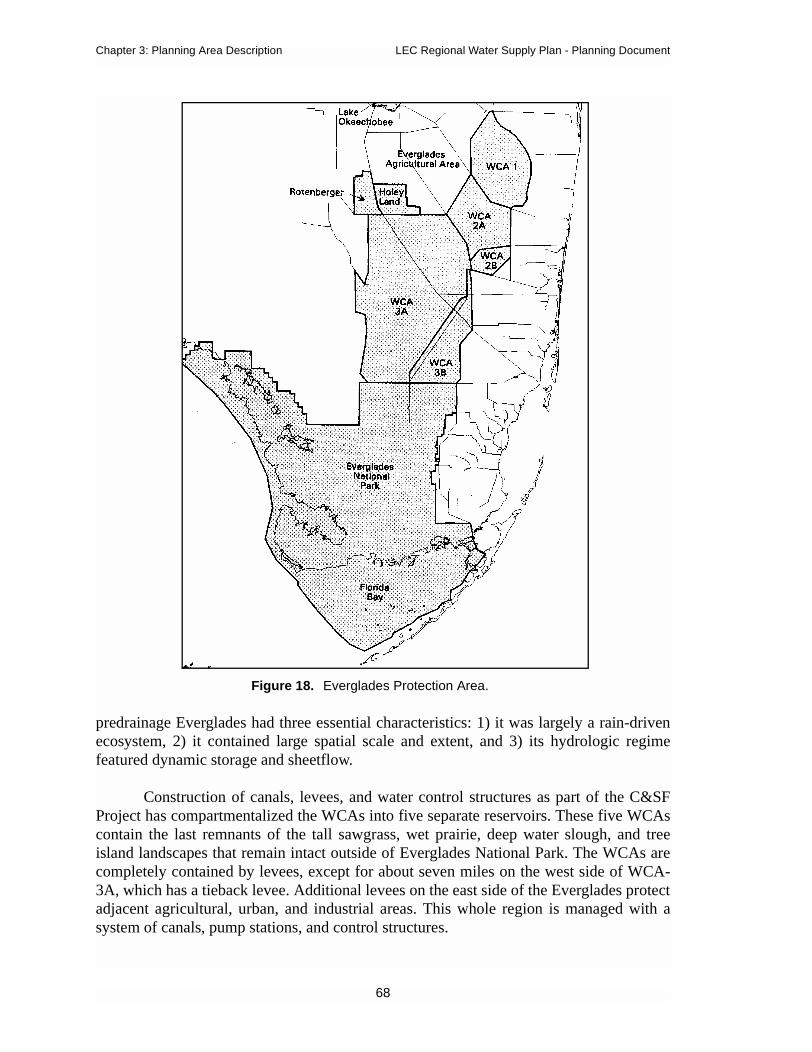
Chapter 3: Planning Area Description LEC Regional Water Supply Plan - Planning Document
predrainage Everglades had three essential characteristics: 1) it was largely a rain-drivenecosystem, 2) it contained large spatial scale and extent, and 3) its hydrologic regimefeatured dynamic storage and sheetflow.
Construction of canals, levees, and water control structures as part of the C&SFProject has compartmentalized the WCAs into five separate reservoirs. These five WCAscontain the last remnants of the tall sawgrass, wet prairie, deep water slough, and treeisland landscapes that remain intact outside of Everglades National Park. The WCAs arecompletely contained by levees, except for about seven miles on the west side of WCA-3A, which has a tieback levee. Additional levees on the east side of the Everglades protectadjacent agricultural, urban, and industrial areas. This whole region is managed with asystem of canals, pump stations, and control structures.
Figure 18. Everglades Protection Area.
68
LEC Regional Water Supply Plan - Planning Document Chapter 3: Planning Area Description
The WCAs provide a detention reservoir for excess water from the EAA and partsof the LEC Planning Area, and for flood discharges from Lake Okeechobee. The WCAlevees prevent Everglades floodwaters from inundating east coast urban areas and holdback water that can later be supplied to east coast areas and Everglades National Park. Inaddition, these levees help maintain higher water levels that provide recharge to surficialaquifers, ameliorate saltwater intrusion in coastal basins, reduce seepage, and benefit fishand wildlife in the Everglades.
The WCA regulation schedules essentially represent seasonal and monthly limitsof storage. This seasonal range permits the storage of runoff during the wet season for useduring the dry season. In addition, it maintains and preserves native plant communities,which are essential to fish and wildlife and the prevention of wind tides. The regulationschedules include a minimum water level, below which water releases are not permittedunless water is supplied from another source. When water levels fall below the minimumlevels, transfers from Lake Okeechobee or the WCAs are thus made to meet waterdemands.
East Coast Canals and Service Areas
Coastal Canals
Flood control and outlet works extend from St. Lucie County southward throughMartin, Palm Beach, and Broward counties to Miami-Dade County, a distance along thecoast of about 170 miles. The South Miami-Dade Conveyance System was added to theexisting flood control system to provide a way to deliver water to areas of south Miami-Dade County. The main design functions of these project canals and structures are toprotect adjacent lands against floods; store water in the WCAs; control water elevations;and provide water for conservation and human uses. These works protect against majorflood damages. However, due to urbanization, the existing surface water managementsystem now has to handle greater peak flows than in the past. Project works consist of 40operating canals, one levee, and 50 operating structures. The operating structures consistof 35 spillways, 14 culverts, and one pump station. Many of these canals are used toremove water from interior areas to tidewater. Damages to agriculture, citrus, andpasturelands have been reduced due to the effective drainage capabilities of the canals.The project works maintain optimum stages for flood control, water supply, ground waterrecharge, and prevention of saltwater intrusion.
Areas become flooded during heavy rainfall events due to antecedent conditionsthat cause saturation and high runoff from both developed and undeveloped areas. Toreduce the threat of flooding, automatic controls have been installed on some controlstructures. Saltwater intrusion has declined considerably at coastal structures since theinstallation of salinity dams downstream and salinity sensors near the structures.
The coastal canals and control structures are designed to permit rapid removal offloodwaters from their immediately adjacent drainage area. The degree of flood protectionprovided by outlet capacity depends on whether the protected area is urban or agricultural.
69

Chapter 3: Planning Area Description LEC Regional Water Supply Plan - Planning Document
Maximum rates of removal vary from 40 to 100 percent of the Standard Project Flood, amathematically derived severe storm event.
The network of canals and control structures also provide capacity for watersupply and salinity control in the area. Wellfields, which are the primary source ofmunicipal water supplies, are significantly recharged by releasing water from the WCAsand conveying this water through coastal canals to the vicinity of the wellfields. Waterstored in the WCAs can also be used to maintain ground water levels and a freshwaterhead for salinity control in the coastal area and to irrigate agricultural areas.
North Palm Beach Service Area
The North Palm Beach Service Area (NPBSA) includes all of the coastal andinland portions of northern Palm Beach County west of the EAA and north of the WestPalm Beach Canal Basin (Figure 19). In presenting the results of the plan, the southernL-8 Basin and the M-Canal/Water Catchment Area Basins are included with the NPBSA.This service area contains extensive urban, agricultural, and natural areas. The majornatural areas within the NPBSA include the DuPuis Reserve, the J.W. Corbett WMA, theWest Palm Beach Water Catchment Area, the Loxahatchee Slough, the LoxahatcheeRiver, and the Pal Mar Wetlands. The urban areas have experienced rapid growth forseveral decades and a continuation of this growth is expected through 2010. Agriculturalland uses occur mostly in the L-8 and C-18 basins. The major utilities in the NPBSAinclude West Palm Beach, Riviera Beach, Seacoast, Jupiter, and Tequesta.
Figure 19. The North Palm Beach Service Area, including the Everglades Agricultural Area.
70
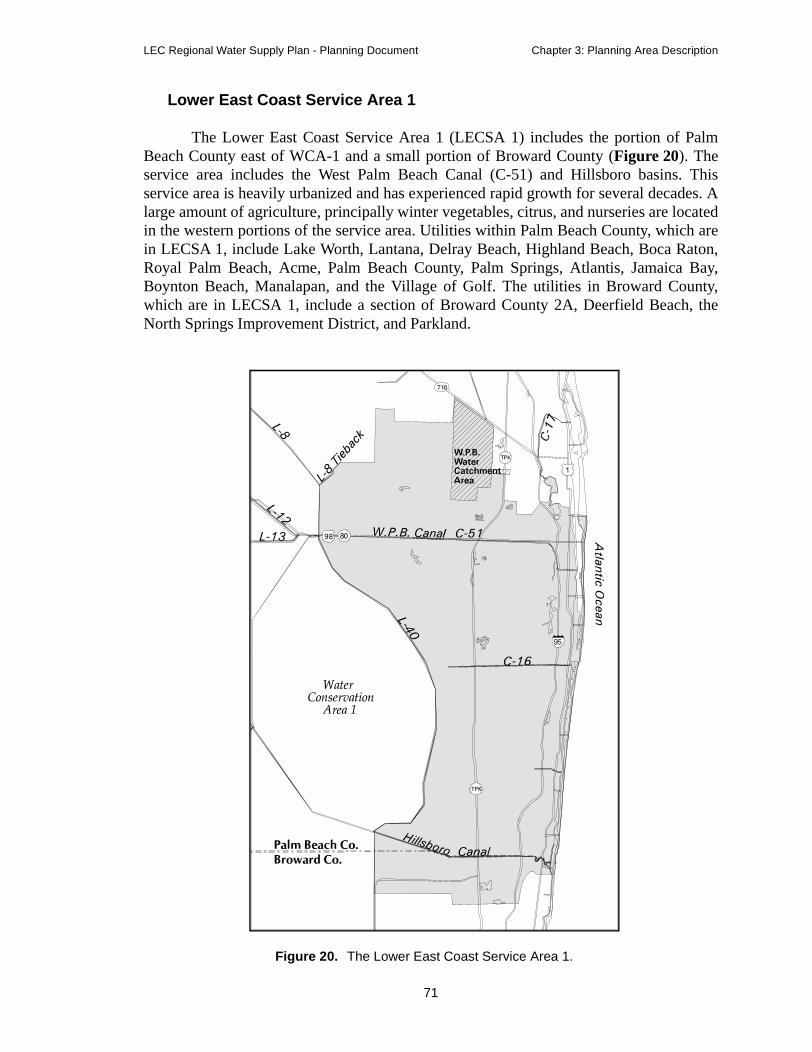
LEC Regional Water Supply Plan - Planning Document Chapter 3: Planning Area Description
Lower East Coast Service Area 1
The Lower East Coast Service Area 1 (LECSA 1) includes the portion of PalmBeach County east of WCA-1 and a small portion of Broward County (Figure 20). Theservice area includes the West Palm Beach Canal (C-51) and Hillsboro basins. Thisservice area is heavily urbanized and has experienced rapid growth for several decades. Alarge amount of agriculture, principally winter vegetables, citrus, and nurseries are locatedin the western portions of the service area. Utilities within Palm Beach County, which arein LECSA 1, include Lake Worth, Lantana, Delray Beach, Highland Beach, Boca Raton,Royal Palm Beach, Acme, Palm Beach County, Palm Springs, Atlantis, Jamaica Bay,Boynton Beach, Manalapan, and the Village of Golf. The utilities in Broward County,which are in LECSA 1, include a section of Broward County 2A, Deerfield Beach, theNorth Springs Improvement District, and Parkland.
Figure 20. The Lower East Coast Service Area 1.
71
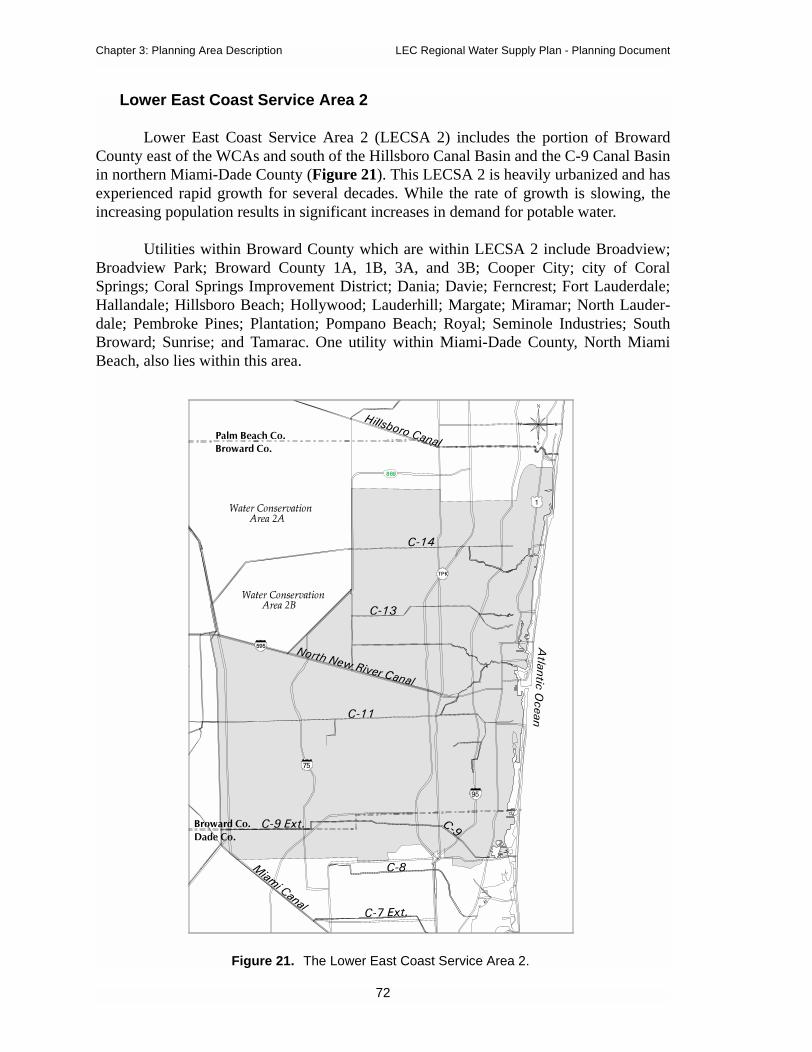
Chapter 3: Planning Area Description LEC Regional Water Supply Plan - Planning Document
Lower East Coast Service Area 2
Lower East Coast Service Area 2 (LECSA 2) includes the portion of BrowardCounty east of the WCAs and south of the Hillsboro Canal Basin and the C-9 Canal Basinin northern Miami-Dade County (Figure 21). This LECSA 2 is heavily urbanized and hasexperienced rapid growth for several decades. While the rate of growth is slowing, theincreasing population results in significant increases in demand for potable water.
Utilities within Broward County which are within LECSA 2 include Broadview;Broadview Park; Broward County 1A, 1B, 3A, and 3B; Cooper City; city of CoralSprings; Coral Springs Improvement District; Dania; Davie; Ferncrest; Fort Lauderdale;Hallandale; Hillsboro Beach; Hollywood; Lauderhill; Margate; Miramar; North Lauder-dale; Pembroke Pines; Plantation; Pompano Beach; Royal; Seminole Industries; SouthBroward; Sunrise; and Tamarac. One utility within Miami-Dade County, North MiamiBeach, also lies within this area.
Figure 21. The Lower East Coast Service Area 2.
72

LEC Regional Water Supply Plan - Planning Document Chapter 3: Planning Area Description
Lower East Coast Service Area 3
Lower East Coast Service Area 3 (LECSA 3) includes that portion of Miami-DadeCounty east of WCA-3B, and Everglades National Park, as well as the Florida Keys(Figure 22). The Florida Keys are included in LECSA 3 because their primary source ofdrinking water is the Florida Keys Aqueduct Authority wellfield located near Florida City.
Other major water suppliers in this service area include Miami-Dade Water andSewer Department, the city of North Miami, the city of Homestead, Florida City, andHomestead Air Force Base.
Figure 22. The Lower East Coast Service Area 3.
73
Chapter 3: Planning Area Description LEC Regional Water Supply Plan - Planning Document
Water demand in LECSA 3 is generated primarily by a mixture of urban andagricultural land uses. Population is expected to grow and displace some of the agriculturecurrently in southern Miami-Dade County. The citrus, winter vegetables, and tropical fruitfarming in southern Miami-Dade County currently represents the second largestagricultural area in South Florida. Early efforts to drain the area caused significantsaltwater intrusion and the abandonment of coastal wellfields in favor of large, regionalwellfields located west of the Atlantic Coastal Ridge. The saltwater intrusion situationalong the coast now appears to have stabilized.
During dry periods, rainfall and seepage are insufficient to maintain the BiscayneAquifer at levels which meet demands and prevent saltwater intrusion. In these times thearea is highly dependent on additional deliveries from regional storage via the C-4 andC-6 canals for the recharge of major public water supply wellfields.
Besides local rainfall, LECSA 3 receives large quantities of regional water due toground water seeping from WCA-3B and Everglades National Park. Due to this seepage,efforts to restore water levels in areas west of the levee system to historic levels impact thedrainage needs of land uses east of the levee system, while helping to recharge majorpublic water supply wellfields.
SOCIOECONOMICS
The economy of South Florida is based on services, agriculture, and tourism.Florida's warm weather and extensive coastline attract vacationers and other visitors andhelps to make the state a significant retirement destination for people from all over thecountry. The 16 South Florida counties that fall within the District had a 1990 populationof 6.3 million, accounting for nearly half (about 49 percent) of Florida's total population.This share has changed very little over the past 20 years and recent U.S Department ofCommerce projections predict it will remain stable over the next 50 years. Over 60 percentof this South Florida population lives in Palm Beach, Broward, and Miami-Dade counties.By 2020, the LEC Planning Area population may exceed 6.9 million.
About one-third of Florida’s employment and earnings occurs in the LEC PlanningArea. Palm Beach, Broward, and Miami-Dade counties account for about 80 percent ofthe District’s regional aggregate socioeconomic activity. Employment and income withinthe District have continued to grow in recent decades faster than the national average.Growth has been significantly greater in the southwest counties of the planning area andthe Florida Keys than elsewhere in the U.S. Department of Commerce’s study area.
LAND USE
Existing use of land within the study boundaries varies from undeveloped to high-density multifamily and industrial urban uses. Much of South Florida remainsundeveloped, although much of this is disturbed land. The dominant natural features areEverglades National Park, Lake Okeechobee, and the WCAs. Generally, urban
74
LEC Regional Water Supply Plan - Planning Document Chapter 3: Planning Area Description
development is concentrated along the lower east coast from Palm Beach to Miami-Dadecounties, with a number of small communities surrounding Lake Okeechobee. Agricultureplays an important role in the region. More than two million acres are being farmed, halfof which is pastureland. Predominant crops are sugarcane and vegetables. Vegetablecrops, especially tropical varieties, also dominate in southern Miami-Dade County. Citrusis grown in every county within the LEC Planning Area, but is concentrated in CollierCounty. The EAA has over 700,000 acres of irrigated farmland, producing sugarcane, rice,row crops, and sod. Extensive pasturelands are located west and north of LakeOkeechobee. Directly south of the EAA, the WCAs cover 1,372 square miles and consistmainly of sawgrass marshes and tree islands.
The urban area extends approximately 100 miles through the coastal portions ofPalm Beach, Broward, and Miami-Dade counties and is the most densely populatedsubregion in the state with more than 4.5 million people. The subregion also containssubstantial agricultural acreage, particularly in southwestern Miami-Dade County (90,000acres) and eastern Palm Beach County (29,000 acres). Rapid population growth and landdevelopment practices have resulted in notable western urban sprawl, with thepredominant land use being single-family residential.
The Florida Keys are made up of over 1,700 islands that encompass approximately100 square miles and contain the largest reef system in the United States. While most ofMonroe County is designated as conservation land within Everglades National Park, BigCypress National Preserve, or the National Key Deer Refuge, use of most of the remainingland is either residential or geared towards supporting tourism, the county’s main industry.
RECREATION RESOURCES
Recreation opportunities abound in the LEC Planning Area. South Florida is richin water resources, with easy access to fresh, estuarine, and marine resources for fishing,boating, swimming, diving, camping, and sightseeing. Lake Okeechobee is a nationallyrecognized bass and pan fishing resource and offers other recreational amenities as well.Airboat and swamp buggy rides, hunting, bike riding, hiking, picnicking, camping, andnature interpretation are popular land-based recreation activities.
The urbanized east coast includes good quality marine-based recreation activitiessuch as underwater diving, fishing, boating, surfing, and, of course, the beach. County andstate parks, scenic rivers, state reserves and forests, and federal refuges provide wildlifeviewing, nature interpretation, hiking, and canoeing opportunities. Arthur R. MarshallLoxahatchee National Wildlife Refuge (WCA-1), Scenic River, DuPuis Reserve StateForest, and the Loxahatchee River–Lake Worth Creek Aquatic Preserve provide highquality opportunities for boating, fishing, and nature interpretation activities. TheIntracoastal Waterway, Lake Worth Lagoon, and northern Biscayne Bay provide excellentfishing and boating, as well as access to marine waters through natural and man-madeinlets. Southern Biscayne Bay offers probably the highest quality recreation within thestudy area. Biscayne National Park provides access and facilities for bird watching,recreational hiking, boating, fishing, snorkeling, diving, and picnicking.
75

Chapter 3: Planning Area Description LEC Regional Water Supply Plan - Planning Document
The LEC Planning Area also has inland water and upland resources that includeWCA-1 and the Rotenberger and Holey Land WMAs. These areas provide high qualityboating, fishing, and nature interpretation activities. The Miccosukee State IndianReservation offers opportunities for hunting, boating, and fishing. Fishing, hunting,boating, and air boating are popular activities in the WCAs and WMAs.
Everglades National Park and Florida Bay support unique and diverse recreationalpursuits. Day use and camping facilities are available. Recreation opportunities includehiking trails, boating, fishing, and nature interpretation. Several roads open up access todiverse ecosystems within the park. Shark River Slough furnishes a lookout tower,tramway, biking, interpretive center, and camping. Florida Bay, Whitewater Bay, and theTen Thousand Islands are characterized primarily by water-based resources and includeexcellent boating, fishing, and nature interpretation. Camping and other day use activitiesare also popular in the region.
The Florida Keys are very popular tourist destinations and offer high qualitywater-based recreation with some upland and shoreline activities. Five wildlife refugesand one of the busiest state parks are located here. John Pennekamp Coral Reef State Parkand the Florida Keys National Marine Sanctuary were created to protect the delicate reefsthat are also popular diving destinations. Diving, boating, fishing, and nature watching arethe most popular recreational activities.
WATER SUPPLY AND FLOOD CONTROL
Management Considerations
One primary function of the C&SF Project is to provide a highly efficient floodcontrol system, which is designed to keep urban and agricultural areas dry in the wetseason. Flood protection is provided by discharging excess water to tide or into the WCAsand Everglades National Park. Rapid wet season flood releases to tide, coupled with thereduced capacity to retain water in Lake Okeechobee, the northern historical sawgrassplains, and the eastern peripheral wetlands and sloughs, have severely reduced the overallability to store water in the regional system.
The sawgrass plains, for example, once stored and slowly released much of thewater that overflowed from Lake Okeechobee. Today, large areas of these sawgrass plainshave been converted to agriculture within the EAA. Water from the lake and excess runoffwater are now quickly passed to the WCAs and the coast during the wet season to preventcrop damage. Water levels in coastal canals are maintained at relatively low levels duringthe wet season to provide additional capacity for storage and conveyance of flood waters,resulting in low ground water levels.
Another impact of the loss of water storage is that, during the dry season, highlevels of demands may exceed the capacity to obtain water from nearby wetlands. Whenthis occurs, water is released from Lake Okeechobee to meet crop and urban demands.Lack of storage, not lack of water, is the problem. During dry periods, minimum levels for
76
LEC Regional Water Supply Plan - Planning Document Chapter 3: Planning Area Description
lower east coast canals are principally maintained to protect the Biscayne aquifer fromsaltwater intrusion. The head created in the canals raises ground water levels, rechargingthe aquifer and the urban wellfields, but also increases the likelihood that localizedflooding will occur during an extreme storm event. During the wet season, wellfields arerecharged by local rainfall and by seepage from the Everglades and the canals. During thedry season, recharge is more dependent on the regional system. Unfortunately, during boththe wet and dry seasons, excess storm water is passed through the canals and out to tidewhen it should be stored. Without sufficient storage, it is difficult to have water availableduring dry periods and avoid flooding during wet periods.
While sufficient water is present to meet local needs during wet seasons andnormal rainfall years, during extremely dry years, urban wellfields depend heavily onseepage and releases from the WCAs and Lake Okeechobee. During drought years, urbanand agricultural areas have additional needs and more water is used for landscapemaintenance, primarily to water lawns.
The amount of water needed to recharge urban wellfields is less than the volumeneeded to prevent saltwater intrusion. However, the cost of replacing damaged wells isvery high. The amount of water needed to prevent saltwater intrusion, in turn, is much lessthan the wet season coastal discharges. If coastal flows were captured and stored, morethan enough water would be available to maintain dry season salinity barriers withoutremoving water from the natural system.
Within the LEC Planning Area, ecological benefits may accrue from maintaininghigher ground water levels. For example, low ground water levels have had significanteffects on Biscayne Bay, including increased salinity, increased turbidity, and lower waterquality. In south Miami-Dade County, lowered ground water levels have caused wetlanddesiccation and shifts in vegetation from freshwater marshes that existed next to the bay inthe early 1900s to saltmarsh and mangrove communities that predominate today.
Present Operation of the Regional System
Sources of Water Supply
Local water supply utilities and individual users obtain water from two primarysources: 1) by withdrawal from a surface water body such as a canal, lake, river, orwetland; or 2) by withdrawal from a ground water well. Virtually all of the LEC publicwater supply is from ground water except for the city of West Palm Beach. Throughoutmuch of the LEC Planning Area, a regional system of canals provides a means to movewater from one location to another. Water is transported generally from north to south,from Lake Okeechobee through water control structures to the EAA canals and into theWCAs. Water flows from the WCAs via structures and canals to Everglades National Parkand the coastal basins. Water in coastal canals provides recharge to surficial aquifers, thusenhancing ground water supplies and helping replenish water in lakes, rivers, andwetlands.
77

Chapter 3: Planning Area Description LEC Regional Water Supply Plan - Planning Document
Management During Wet Periods
During wet years, seepage from the Everglades is generally more than adequate tomaintain water levels in the coastal aquifers and no releases for this purpose are required.However, releases through coastal canals may be required to maintain regulationschedules in natural storage areas, such as Lake Okeechobee and the WCAs, and toprovide flood protection.
In order to promote development of coastal basins for urban and agricultural useduring the past century, water levels along the coastal ridge have been lowered byconstruction of drainage facilities. Over time, drainage has continued further westward toallow replacement of most of the wetlands in the Transverse Glades areas in Miami-Dadeand Broward counties with homes, farms, and nurseries. Large areas have been mined forthe underlying rock that is used for roads and fill.
Due to the high transmissivity of the surficial Biscayne aquifer, lowering of waterlevels to protect one area results in reduction of water levels over large areas. Attempts toprovide drainage and flood protection to coastal areas have thus lowered water tables andshortened hydroperiods of wetlands further west into the Everglades. Large amounts offresh water that would have remained in these wetlands or moved slowly southward toEverglades National Park have been lost as surface water flow through coastal canals toBiscayne Bay.
Analyses conducted for the Restudy and for the development of the LEC Plan haveattempted to compensate for the effects of drainage by establishing long-term restorationgoals and management targets that reflect how the natural systems functioned before thearea was drained. The Natural System Model (NSM) is used to represent predrainageconditions by simulating hydrologic conditions that existed before canals wereconstructed and before water levels and topography were altered by drainage. The waterlevels predicted by the NSM, in conjunction with historical data and expert opinion, wereused during the Restudy as a basis to establish Everglades restoration goals for both lowwater and high water conditions. Consumptive use permits, in turn, consider theserestoration water levels as the no harm standard that should be maintained under allconditions less severe than a 1-in-10 year drought.
Due to the conceptual nature of the Restudy and the modeling tools used for thealternative analyses, detailed flood damage assessment was not performed for the Restudy.However, maintaining levels of flood protection remains an important purpose of theC&SF Project and an objective of the CERP. The U.S. Army Corps of Engineers(USACE) will carefully evaluate any potential flood control impacts before any Restudy/CERP components are built. Project Implementation Reports (PIRs) for individualcomponents, or groups of components, will include a detailed review of flood protectionfor the area affected by the components. Opportunities for enhancing flood protection inconjunction with other design objectives will be investigated. In addition, the Restudyreport includes the provision that, “Flood level protection monitoring will ensure that theexisting level of protection is not compromised as a result of implementation of therecommended plan.” (USACE and SFWMD, 1999).
78

LEC Regional Water Supply Plan - Planning Document Chapter 3: Planning Area Description
Management During Droughts
During dry years, additional water may be released from the regional systemthrough the coastal canals to help recharge surficial aquifers in the coastal basins. Thesewater supply releases are made on an as needed basis, triggered either by a decline inwater levels in the canals below their maintenance levels or a movement of the saltwaterfront in the coastal aquifers as detected in monitoring or production wells. Figures 23 and24 show how regional water conveyance facilities are managed during wet and dryperiods.
Figure 23. Water Conveyance in the Regional Systems During WetPeriods. Arrows Indicate Direction of Pumpage or Flow.
79
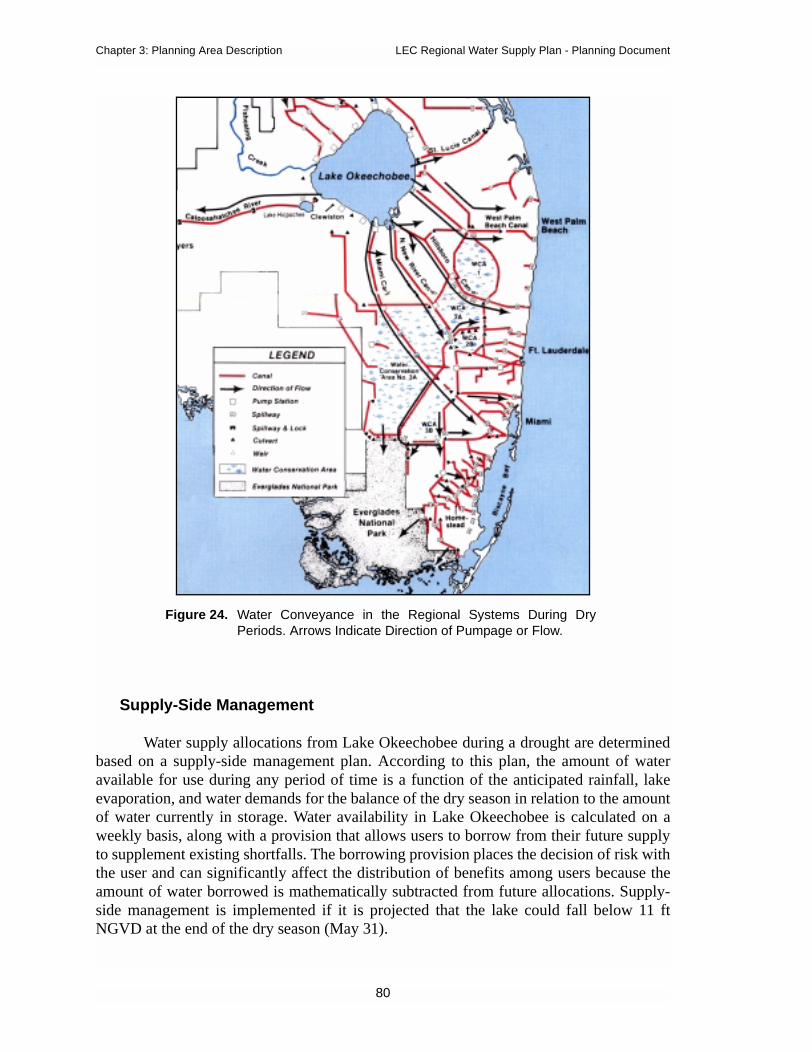
Chapter 3: Planning Area Description LEC Regional Water Supply Plan - Planning Document
Supply-Side Management
Water supply allocations from Lake Okeechobee during a drought are determinedbased on a supply-side management plan. According to this plan, the amount of wateravailable for use during any period of time is a function of the anticipated rainfall, lakeevaporation, and water demands for the balance of the dry season in relation to the amountof water currently in storage. Water availability in Lake Okeechobee is calculated on aweekly basis, along with a provision that allows users to borrow from their future supplyto supplement existing shortfalls. The borrowing provision places the decision of risk withthe user and can significantly affect the distribution of benefits among users because theamount of water borrowed is mathematically subtracted from future allocations. Supply-side management is implemented if it is projected that the lake could fall below 11 ftNGVD at the end of the dry season (May 31).
Figure 24. Water Conveyance in the Regional Systems During DryPeriods. Arrows Indicate Direction of Pumpage or Flow.
80
LEC Regional Water Supply Plan - Planning Document Chapter 3: Planning Area Description
For Lake Okeechobee, the current procedure is based on a calculation of irrigationwater demands in four agricultural basins: the North Shore, the Caloosahatchee, the St.Lucie, and the EAA. Lower east coast urban demands were omitted because they are notgenerally required during a normal rainfall year; however, they can be significant duringdry periods. Another major omission from this calculation is the environmental demand.As part of the LEC Plan, steps will be recommended to improve supply-side managementand water shortage management to better address urban and environmental water needs.
Water Shortage Frequencies
The frequency of water shortages is defined based on statistical analysis of datafrom a particular monitoring station, basin, or region. The numbers represent the estimatedtime period between occurrences of events that have similar magnitude. Drought eventscan be defined for different time periods (monthly, dry season, wet season, annual, andbiannual) based on a number of different criteria, including lack of sufficient rainfall, lackof adequate water levels in the aquifer, or lack of water available in the regional system.
For example, assume that the average rainfall is 54 inches per year in a particularbasin and rainfall of 47 inches occurs this year. Based on statistical analysis of historicaldata from rainfall monitoring stations within this basin, this degree of deficiency wasdetermined to occur once every ten years. Annual rainfall of 47 inches thus corresponds toa 1-in-10 year drought condition for that basin based on rainfall. Different watermanagement actions may be required, depending on the location, nature, and magnitude ofthe drought.
81

Chapter 3: Planning Area Description LEC Regional Water Supply Plan - Planning Document
82

LEC Regional Water Supply Plan - Planning Document Chapter 4: Analysis and Evaluation of Model Results
Chapter 4ANALYSIS AND EVALUATION
OF MODEL RESULTS
ANALYTICAL PROCESS OVERVIEW
Both regional and subregional computer hydrologic simulations were usedextensively by the South Florida Water Management District (District, SFWMD) to helpdevelop the Lower East Coast Regional Water Supply Plan (LEC Plan). The South FloridaWater Management Model version 3.7 (SFWMM) was used as the principal tool toevaluate overall regional performance, while subregional ground water models were usedto simulate impacts at smaller scales, such as effects within service areas and impacts ofindividual wellfields. Data from SFWMM and subregional ground water modelsimulations were analyzed and interpreted to determine how to modify and improve theDistrict’s water management practices, the major features of the Central and SouthernFlorida Project for Flood Control and Other Purposes (C&SF Project), and local watermanagement facilities to meet the future water needs of South Florida. First, present andfuture base case simulations of the regional SFWMM and the subregional ground watermodels were made to determine water requirements. From these model simulations it waspossible to depict the historic and future water distribution to service areas, the frequencyand severity of water shortages, and the ability to achieve environmental goals. Thisinformation was then used to evaluate the regional capacity and future water needs of theLower East Coast (LEC) Planning Area. Second, the effects of the componentsrecommended in the Central and Southern Florida Project Comprehensive Review StudyFinal Feasibility Report and Programmatic Environmental Impact Statement (Restudy)(USACE and SFWMD, 1999) that will be completed by 2020 were determined. Majorfeatures of the Restudy will dramatically affect water use and supply throughout theregion. Analysis of the Restudy components included a similar examination of waterdistribution, water shortages, and the ability to achieve environmental restoration goals by2020.
The LEC planning process then considered other options, either local water supplydevelopment or regional water resource development projects that could be implementedto meet future agricultural, urban, and environmental water supply needs by 2020. Theplanning goal of these efforts is that the local and regional projects combined shouldprovide sufficient water to meet the 1-in-10 year level of certainty criteria for urban andagricultural water users, achieve the proposed minimum water level criteria, andsubstantially achieve long-term environmental restoration goals of the region. The abilityto meet these demands, as identified in various statutes and mandates (meeting MinimumFlows and Levels, providing for public and agricultural water supply needs and achievingEverglades restoration), was evaluated for each model simulation using a comprehensiveset of performance measures.
83

Chapter 4: Analysis and Evaluation of Model Results LEC Regional Water Supply Plan - Planning Document
Data from local land use comprehensive plans, utilities, University of FloridaInstitute of Food and Agricultural Sciences (IFAS), and District permits were used tosupport these analyses and their assumptions. Conservative best professional judgementwas used in circumstances where specific information was not available.
South Florida Water Management Model
The regional South Florida Water Management Model (SFWMM) was used tosimulate the major components of the hydrologic cycle in South Florida including rainfall;evapotranspiration; infiltration; overland, ground water, and canal flow; canal-groundwater and levee seepage; and ground water pumping. This large-scale (two-mile by two-mile grid size) regional model was developed specifically for the South Florida system,and is currently the best available tool that can simulate both the current and futureoperational complexities of the regional water control system and provide adequatetechnical information to make water management decisions (see Chapter 2 andAppendix E for more information on the SFWMM). The base case simulationsincorporated current or proposed water management control structures, operational rules,and water shortage policies. Daily hydrologic conditions were simulated using climatedata for the 1965-1995 period of record, which includes droughts and wet periods.
Subregional Ground Water Models
Although the SFWMM is the principal tool used in the evaluation of the LEC Plan,five higher-resolution, subregional ground water flow models were developed as part ofthe planning process to evaluate potential benefits and impacts of specific options on localresources. Ground water models developed during this planning process include (1) theNorth Palm Beach Ground Water Model; (2) the South Palm Beach Ground Water Model;(3) the Broward Ground Water Model; (4) the North Miami-Dade Ground Water Model;and (5) the South Miami-Dade Ground Water Model. These models use the United StatesGeological Survey (USGS) modular three-dimensional finite difference ground waterflow model, commonly known as MODFLOW. More information concerning thesemodels is provided in Chapter 2 and each model is described in greater detail inAppendix F.
The ground water models were also used to estimate the 1-in-10 year level ofcertainty for public and agricultural water uses. The simulation period of each model wasJanuary 1987 to December 1990. Results are reported only for the last two years to allowthe models to warm up for one year. The simulation period from January 1989 toDecember 1990 contains rainfall deficient conditions that are approximately equivalent toa 1-in-10 year drought.
Other Models
Modeling was also used to analyze water availability and water demands in theCaloosahatchee Basin. These modeling efforts are described in the Caloosahatchee WaterManagement Plan (CWMP) (SFWMD, 2000d). Analytical tools used in this analysis
84
LEC Regional Water Supply Plan - Planning Document Chapter 4: Analysis and Evaluation of Model Results
included the Agricultural Field Scale Irrigation Requirements Simulation (AFSIRS)Model, the Water Management Optimization Model, and the MIKE SHE model. TheAFSIRS is a surface water budget model which was used to approximate surface wateravailability in each of the major surface water subbasins in order to quantify the demandsthat could not be satisfied by surface water. The Water Management Optimization Modelwas used to determine how to best store and release water as needed to meet urban,agricultural, and environmental needs. The MIKE SHE model is an integrated surfacewater/ground water model that was used to identify potential impacts of water use on theenvironment and water resources.
RELATIONSHIP BETWEEN GOALS AND PLANNINGCRITERIA
The model simulations were evaluated based on analysis of the planning criteriarequired by state statute (Section 373.036, F.S.):
• Provide for a 1-in-10 year level of certainty for users, withoutcausing harm
• Protect water resources from significant harm
• Restore hydropatterns to water resources
The performance measures indicate the degree to which the water resourcedevelopment projects and water supply options are likely to help meet these planningcriteria and the goals and objectives of the LEC Plan. Performance measures are specific,selected, hydrologic targets that are outputs of the Natural System Model (NSM),SFWMM, and subregional ground water models. Results based on key performancemeasures that best summarize the performance of the simulations are presented later inthis chapter.
PLANNING CRITERIA AND PERFORMANCE MEASURES
1-in-10 Year Level of Certainty
Each model requires a different approach to determine if a 1-in-10 year level ofcertainty can be met for urban and agricultural water users. In the Restudy, the 1-in-10year level of certainty for water supply was determined based on a performance measurethat considered the probability that water shortages would be declared during the 31-yearperiod simulated by the SFWMM. An additional performance measure for 1-in-10 yearlevel of certainty was developed for the LEC Plan analysis using the subregional models.Since the subregional ground water models were used to simulate a time period thatincluded a 1-in-10 year, rainfall-deficit, drought condition, performance measures basedon simulated ground water stages were used to determine how well local water demandswere met during this drought period without causing harm to the environment.
85
Chapter 4: Analysis and Evaluation of Model Results LEC Regional Water Supply Plan - Planning Document
Meeting 1-in-10 Year Level of Certainty for Water Supply During the31-Year Period of Record
One measure of the ability to meet water supply demands for the LakeOkeechobee Service Area (LOSA) and Lower East Coast Service Areas (LECSAs) is ifwater supply restrictions can be avoided during the 31-year period of record except duringthe most severe droughts. State law enables the District to impose water restrictions duringdroughts to conserve regional water resources. The SFWMM mimics this policy byimposing restrictions on consumptive users when regional water supplies are diminished.Water demands are cut back when low ground water stages occur in selected trigger cells(based on historical monitoring well locations) located along the lower east coast ofFlorida, low stages in Lake Okeechobee or Water Conservation Area (WCA) canals, ordue to continuation of the restriction in the dry season. The SFWMM restricts watersupplies in each LEC service area if the LOSA is in Supply-Side Management for sevendays consecutively during the dry season (October-May). The LOSA is placed on Supply-Side Management restrictions (or cutbacks) when Lake Okeechobee levels are expected tobe lower than 11 ft NGVD at the end of the dry season (May 31). The Supply-SideManagement criteria conserve water in the lake to meet crucial events in the future and,thereby, reduce the risk of serious or significant harm.
Results from the SFWMM are displayed for the LOSA and each LEC service areain a table format. The table displays the type, severity, and duration of cutbacks by wateryear (October-September). Types of cutbacks include those caused by Lake Okeechobeelevels, low ground water levels along the coast, and dry season criteria. Water years areused, because counting water demand cutbacks by calendar year would, in some areas,double count events that extend throughout the dry season. The graphic summarizingthese SFWMM results is entitled Frequency of Water Restrictions for the 1965-1995Simulation Period (see Figure D-1 in Appendix D).
The target for the LOSA and the LECSAs is to meet a 1-in-10 year level ofcertainty for water supply, as determined by counting the number of water years whensignificant water supply cutbacks occur due to exceeding Supply-Side Managementcriteria on the lake. A significant water supply cutback event occurs when the total volumeof water not supplied to the LOSA exceeds approximately 100,000 acre-feet (ac-ft). Tomeet the 1-in-10 year level of certainly criterion in the LOSA and the LECSAs, significantwater supply cutbacks should occur due to Lake Okeechobee stages in no more than threewater years during the 31-year period of record.
For the LECSAs, additional information from the subregional ground watermodels is needed to assess local ground water conditions. The SFWMM's large cell sizeand emphasis on surface water hydrology limits its ability to simulate ground water levelsand withdrawals along the coast near the model boundary. The ability of the SFWMM todistinguish between water stages at the trigger well and nearby withdrawal wells is limitedbecause the trigger well and withdrawal wells can occur within the same model grid cell.More precise results can be achieved with the subregional ground water models.
86
LEC Regional Water Supply Plan - Planning Document Chapter 4: Analysis and Evaluation of Model Results
Meeting the Level of Certainty for Water Supply During a 1-in-10 YearDrought Event
The second measure of the ability to meet water supply demands is to avoid watersupply restrictions during a 1-in-10 year drought event due to low ground water stagesalong the coast. The subregional models approximate District water shortage policy bysimulating restrictions on consumptive users. The ground water models simulate localconditions more accurately than the SFWMM, due to the smaller grid cell size. Inaddition, they can simulate ground water conditions including stratification of the aquifer.
In the subregional ground water models, the LECSAs are divided into WaterRestriction Areas to more accurately reflect how the District's water shortage policy maybe implemented. Results from ground water models are displayed spatially for eachservice area and as a table showing locations of trigger cells and the severity and durationof cutbacks by cause: Lake Okeechobee levels, low ground water levels along the coast, ordry season criteria. Information on cutbacks due to Lake Okeechobee stage is importedfrom the SFWMM to the subregional ground water models.
Due to the size and complexity of the subregional ground water models, theysimulate a shorter period of record that includes a 1-in-10 year drought event. It beginsJune 1989 and ends May 1990 for North Palm Beach Service Area, LEC Service Area 1(LECSA 1), and LEC Service Area 2 (LECSA 2). The rainfall drought for LEC ServiceArea 3 (LECSA 3) begins and ends one month earlier. Regional conditions are from thesame historical period and are considered to be within the range of average regional flowsfrom ground and surface water sources (see Appendix I for more information). To meet a1-in-10 year level of certainty in LECSA, no water restrictions should occur during the 1-in-10 year drought event due to low ground water stages in selected trigger cells assimulated by the ground water models. The graphic summarizing these results is entitledFrequency and Severity of Water Restrictions by Water Restriction Area (see Figure D-2in Appendix D).
Saltwater Intrusion Analysis
Areas within the LEC Planning Area that have the highest potential for saltwaterintrusion were determined using the following criteria:
• Water restriction frequency and duration
• Ground water stages as indicated by water shortage trigger wells
• Net westward ground water flow along the saline water interface
The application of water restrictions was discussed above. The two remainingfactors are discussed below.
87

Chapter 4: Analysis and Evaluation of Model Results LEC Regional Water Supply Plan - Planning Document
Water Levels as Indicated by Water Shortage Trigger Wells
Information about ground water stages at trigger wells is obtained as an outputfrom the subregional ground water models. Ground water stages along the coast areindicative of changes elsewhere in the LEC Planning Area. Water shortage triggers, orwater levels at which phased restrictions will be declared under the District’s watershortage program, are used to curtail withdrawals by water use types. Such curtailment isimposed to avoid water levels declining to and below levels where serious or significantharm (i.e., saltwater intrusion) could potentially impact water resources (such as theBiscayne aquifer).
Saline Water Intrusion Criterion
The saline water intrusion criterion for the LEC Plan is defined as follows: wateruse withdrawals should not cause water flows towards the east in the Surficial AquiferSystem to be less than the flows west near the saline water interface during a 12-monthdrought condition that occurs as frequently as once every 10 years. If ground water floweast towards the coast is less than the flow west, the saline interface has the potential tomove. Ground water flows east were subtracted from the westward flows to calculate thenet westward flow. Only positive flows (to the west) are shown in the performancemeasure graphic. The net flow is calculated for all layers of the models based on results ofthe subregional ground water models for the LECSAs.
This protection criterion is established to protect the quality and sustainability ofthe Surficial Aquifer System and to avoid impacts to existing users. The subregionalground water models used for the LEC Plan were not configured as chemical transportmodels and, therefore, cannot be used directly to simulated saline water intrusion. Instead,staff assumed that a net westward flow of water across the freshwater-saltwater interfaceis an indicator of potential intrusion. In general, proximity of a water use to the salinewater interface necessitates a detailed evaluation prior to implementing an alternative orissuing a consumptive use permit. Given the regional nature of the plan, the ground waterflow, water level, and water restriction analyses method were used to screen for thepotential of coastal wellfields to induce westerly flow of saline water over large areas.Additional criteria or refinement of these methods will be applied during the ConsumptiveUse Permitting (CUP) process. See Figure D-11 in Appendix D for an example of theoutput for this performance measure.
Isolated Wetland Protection Criteria
Criteria have also been defined for isolated wetlands which lie outside of theEverglades Protection Area in the LOSA and the LECSAs and are protected from harmdue to water use permits up to 1-in-10 year droughts. The following criteria was applied toresults from the subregional ground water models: ground water stage drawdownsinduced by cumulative pumping withdrawals beneath wetlands should not exceed one footat the edge of the wetland for more than one month during a 12-month drought conditionthat occurs as frequently as once every 10 years. For planning purposes, this criterion was
88
LEC Regional Water Supply Plan - Planning Document Chapter 4: Analysis and Evaluation of Model Results
applied to surficial aquifer drawdowns in areas that have been classified as wetlandsaccording to the National Wetlands Inventory (NWI). The NWI cover was partiallyupdated to reflect land use changes, primarily urban development, near wellfields. SeeFigure D-10 in Appendix D for an example of the output from this performance measure.
Because of variations in methods used to identify and characterize wetlands, aswell as temporal changes that occur in wetland characterization resulting fromenvironmental resource mitigation activities, maintaining a detailed regional geographicinventory of local wetland conditions is difficult and beyond the scope of this plan.Instead, the best available geographic data was compiled and processed to provide areasonable representation of wetland locations. In practice, implementation of the LECPlan will require an inventory of potentially affected wetlands for protection or mitigation.Further, the criteria used for the LEC regional water supply planning analysis are not thesame as the criteria used in the CUP Program. The CUP criteria will undergo rulemakingas part of the implementation of the District's regional water supply plans. The LEC Plan'scriteria are used as a screening tool to alert future permittees of the need to evaluatewetlands in the vicinity of proposed withdrawals. More information regarding futurerulemaking is included in Chapter 5 and Chapter 6.
Minimum Flows and Levels
Minimum Flows and Levels (MFL) are the point at which further withdrawalswould cause significant harm to water resources. The LEC Plan is statutorily required toachieve MFLs that have been established for priority surface water bodies and aquifers orto develop a recovery and prevention strategy for those water bodies that are expected toexceed the proposed criteria. In the LEC Planning Area, MFLs have been proposed forthree priority water bodies: Lake Okeechobee, the Everglades, and the Biscayne aquifer.The criteria defined in the Minimum Flows and Levels for Lake Okeechobee, theEverglades, and the Biscayne Aquifer Final Draft Report dated February 29, 2000,(SFWMD, 2000e) are described below and were incorporated into the modeling targetsfor the LEC Plan. In addition, MFLs are scheduled to be established for theCaloosahatchee River. These criteria were addressed in the CWMP and incorporated intothe LEC Plan.
The ability to meet the proposed MFL criteria was determined by examining flowrates, water depth, duration of low water conditions, and return frequencies in LakeOkeechobee, coastal canals, and at various locations in Everglades’ peat soil and marl soilenvironments. The ability to achieve MFLs was assessed using the SFWMM for the 31-year simulation period. The subregional models were not used for such analyses becauseof the relatively short time period (two years) evaluated in these models and because theydo not simulate Lake Okeechobee water levels; coastal canal stages, that are part of theBiscayne aquifer criteria; or many of the Everglades MFL gage locations.
89

Chapter 4: Analysis and Evaluation of Model Results LEC Regional Water Supply Plan - Planning Document
Meeting MFL Criteria for Lake Okeechobee
Significant harm criteria developed for Lake Okeechobee were based on therelationship between water levels in the lake and the ability to a) protect the coastalaquifer against saltwater intrusion, b) supply water to Everglades National Park,c) provide littoral zone habitat for fish and wildlife, and d) ensure navigational andrecreational access. Consideration was also given to the lake's function as a storage areafor supplying water to adjacent areas such as the Everglades Agricultural Area (EAA), theSeminole Indian Tribe Reservervations, the Caloosahatchee and St. Lucie basins, and theLOSA.
Water Supply Planning MFL Criteria
Water levels should not fall below 11 ft NGVD for more than 80 days duration,more often than once every six years, on average (SFWMD, 2000e).
Meeting MFL Criteria for the Everglades
Technical relationships considered for developing MFL criteria for the Evergladesincluded the effects of water levels on hydric soils and plant and wildlife communities,and frequency and severity of fires. Impacts associated with significant harm includeincreased peat oxidation, frequency of severe fires, soil subsidence, loss of aquaticrefugia, loss of tree islands, and long-term changes in vegetation or wildlife habitat. Theproposed minimum water level criteria for the Everglades were based on protecting thetwo dominant soil types found within the ecosystem as follows:
MFL Criteria for Peat-Forming Wetlands
Water levels within wetlands overlying organic peat soils within the WCAs,Rotenberger and Holey Land wildlife management areas, and Shark River Slough(Everglades National Park) shall not fall below ground surface for more than 30 days andshall not fall below 1.0 foot below ground for one day or more of that 30-day period, atspecific return frequencies for different areas, as identified in Table 44 later in thischapter.
MFL Criteria for Marl-Forming Wetlands
Water levels within marl-forming wetlands that are located east and west of SharkRiver Slough, the Rocky Glades, and Taylor Slough within Everglades National Park,shall not fall below ground surface for more than 90 days and shall not fall below 1.5 feetbelow ground for one day or more of that 90-day period at specific return frequencies fordifferent areas, as identified in Table 44 later in this chapter.
Meeting MFL Criteria for the Biscayne Aquifer
Criterion for the Biscayne aquifer were developed based on analysis of technicalrelationships among ground water levels and canal water levels, and the potential for
90
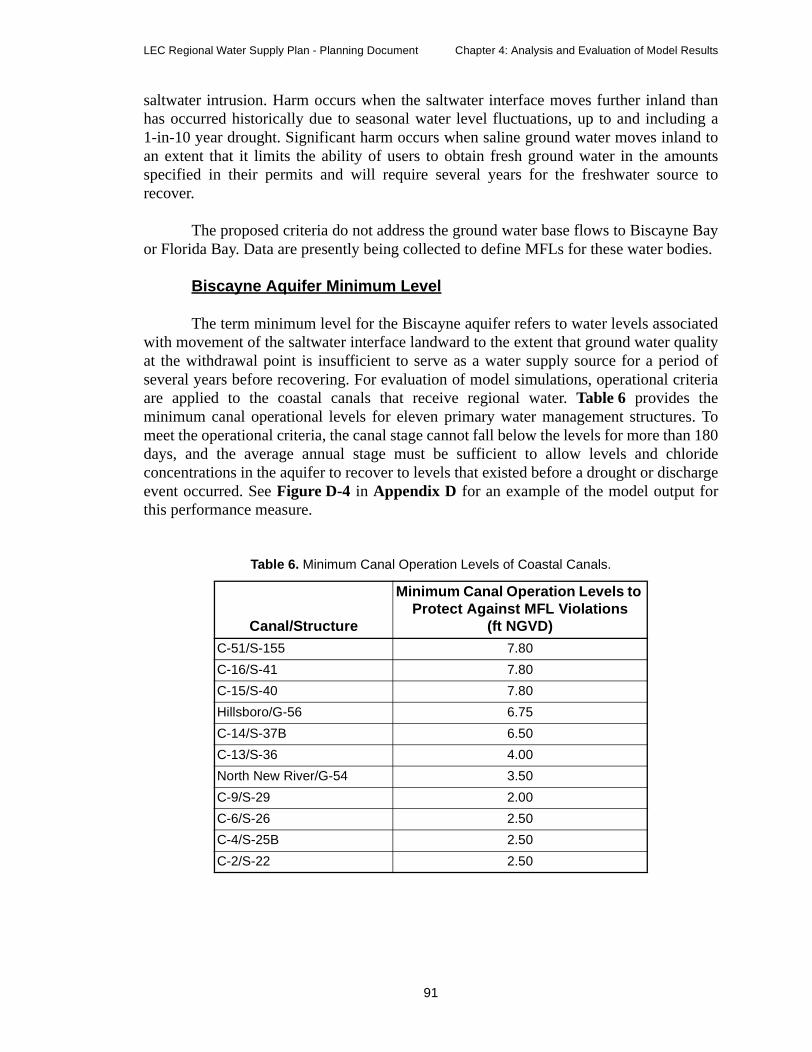
LEC Regional Water Supply Plan - Planning Document Chapter 4: Analysis and Evaluation of Model Results
saltwater intrusion. Harm occurs when the saltwater interface moves further inland thanhas occurred historically due to seasonal water level fluctuations, up to and including a1-in-10 year drought. Significant harm occurs when saline ground water moves inland toan extent that it limits the ability of users to obtain fresh ground water in the amountsspecified in their permits and will require several years for the freshwater source torecover.
The proposed criteria do not address the ground water base flows to Biscayne Bayor Florida Bay. Data are presently being collected to define MFLs for these water bodies.
Biscayne Aquifer Minimum Level
The term minimum level for the Biscayne aquifer refers to water levels associatedwith movement of the saltwater interface landward to the extent that ground water qualityat the withdrawal point is insufficient to serve as a water supply source for a period ofseveral years before recovering. For evaluation of model simulations, operational criteriaare applied to the coastal canals that receive regional water. Table 6 provides theminimum canal operational levels for eleven primary water management structures. Tomeet the operational criteria, the canal stage cannot fall below the levels for more than 180days, and the average annual stage must be sufficient to allow levels and chlorideconcentrations in the aquifer to recover to levels that existed before a drought or dischargeevent occurred. See Figure D-4 in Appendix D for an example of the model output forthis performance measure.
Table 6. Minimum Canal Operation Levels of Coastal Canals.
Canal/Structure
Minimum Canal Operation Levels toProtect Against MFL Violations
(ft NGVD)
C-51/S-155 7.80
C-16/S-41 7.80
C-15/S-40 7.80
Hillsboro/G-56 6.75
C-14/S-37B 6.50
C-13/S-36 4.00
North New River/G-54 3.50
C-9/S-29 2.00
C-6/S-26 2.50
C-4/S-25B 2.50
C-2/S-22 2.50
91

Chapter 4: Analysis and Evaluation of Model Results LEC Regional Water Supply Plan - Planning Document
Meeting MFL Criteria for the Caloosahatchee Estuary
The proposed Caloosahatchee Estuary MFL criteria is based on maintainingfreshwater base flows to the upper reaches of the Caloosahatchee Estuary, which willprevent excessive salinity levels in the estuary from causing significant harm tosubmerged aquatic vegetation and fish and invertebrate communities. Research data wereused to relate freshwater flow rates to salinity distributions along the CaloosahatcheeRiver and to correlate biologic community responses to varying salinity conditions. Theserelationships were established for submerged aquatic vegetation, fish, and invertebrateswith major emphasis on the salinity requirements of the freshwater grass Vallisneria(commonly known as tape grass or eel grass). It was determined that the distribution andabundance of Vallisneria at a location 30 kilometers upstream of Shell Point is the bestbiological indicator for addressing freshwater flow needs for the restoration of theCaloosahatchee Estuary. The magnitude of die-off, combined with the frequencies of die-off events, and the resulting impact to fisheries resulting from the loss of Vallisneriahabitat formed the basis of the proposed MFL criteria.
Proposed Estuary Minimum Flow Criteria
Low freshwater flows, when sustained, cause an increase in salinity, that result indie off of Vallisneria to less than 20 shoots per square meter as measured at a monitoringstation located 30 kilometers upstream of Shell Point during the months of Februarythrough April. Significant harm to the Caloosahatchee Estuary is considered to occurwhen these freshwater grasses die back due to high salinity from low freshwater inflowsfor three years in succession. Harm to the Caloosahatchee Estuary is considered to occurwhen freshwater grasses die back due to high salinity from low freshwater inflows, fortwo consecutive years. The freshwater inflow needed to prevent harm or significant harmis an average of 300 cubic feet per second (cfs) per day at the S-79 structure during themonths of February through April.
Environmental Resource Management Performance Indicators
Restoration Criteria from the Restudy
A number of resource protection criteria and performance measures that relate tohydropattern restoration of wetland systems and mimic the performance targets andevaluation criteria were used in the Restudy. The recommendations made within theRestudy will be refined and implemented in the Comprehensive Everglades RestorationPlan (CERP) currently being developed. District staff reviewed the Restudy natural areaperformance measures and indicators and incorporated them or revised versions of theminto the LEC Plan as appropriate. Review of performance criteria showed that the modelsimulation for the 2020 with Restudy features completed by 2020 did not match theperformance of model simulation for 2050 with CERP (Alternative D13R), because not allrestoration components will be in place by 2020 (e.g., the Lake Belt projects are onlyabout 50 percent complete by 2020). It was also recognized that the Alternative D13Rsimulation did not meet every target in 2050, hence the 2020 LEC Plan does not meet all
92

LEC Regional Water Supply Plan - Planning Document Chapter 4: Analysis and Evaluation of Model Results
of the performance measure targets identified in the CERP. Performance measures used inthe LEC Plan were developed to evaluate the potential for the LEC Plan to achieve thefollowing:
• Meet MFL criteria
• Promote protection and accretion of peat and marl soils
• Protect tree island communities
• Reestablish inundation patterns that will maintain Evergladessawgrass or ridge and slough marsh communities
In many areas, historic water conditions as predicted from results of the NaturalSystem Model (NSM), were considered to be appropriate targets. For WCA-1 and WCA-3A, other targets were developed by the Restudy evaluation process that are moreappropriate than NSM-like targets. Model results for each alternative were evaluated atthe level of individual indicator regions (Figure 25). An indicator region is a group ofmodel grid cells with similar vegetation and soil type.
2 = West Perrine Marl Marsh 3 = Mid-Perrine Marl Marsh 4 = C-11 Perrine Marl Marsh 5 = Model Lands South 6 = Model Lands North 7 = Ochopee Marl Marsh 8 = Rockland Marl Marsh 9 = SW Shark River Slough10 = Central Shark River Slough11 = NE Shark River Slough12 = New Shark River Slough13 = West Slough14 = Southern WCA-3A15 = Western WCA-3B16 = Eastern WCA-3B17 = South Central WCA-3A18 = North Central WCA-3A19 = Eastern WCA-3A20 = NW WCA-3A21 = NE WCA-3A22 = NW Corner WCA-3A23 = WCA-2B24 = Southern WCA-2A25 = Northern WCA-2A26 = Southern WCA-127 = Northern WCA-128 = Rotenberger WMA29 = Holey Land WMA
Figure 25. Locations of Indicator Regions Within the Everglades That Were Evaluated for theLEC Plan.
93
Chapter 4: Analysis and Evaluation of Model Results LEC Regional Water Supply Plan - Planning Document
Performance of the model simulation was evaluated by considering the followingperformance measures, which are further described in Appendix D:
• The ability to meet MFL criteria for selected indicator regions
• The ability to meet NSM-defined patterns of surface waterflooding inundation/duration where appropriate
• The number and duration of extreme high and low water events
• Interannual depth variation
• Temporal variation in mean weekly stage
Extreme High and Low Water Criteria
The following performance measures were initially developed by the SouthernEverglades Restoration Alliance Natural Systems Team. These performance measureswere used to evaluate SFWMM output and identify those areas of the Everglades that maysuffer from either extreme high water or extreme low water events that impact thestructure and function of existing wetland communities. These same performancemeasures were also used to screen proposed alternatives as outlined in the Restudy. Inimplementing the plan, it will be necessary to recognize that these performance measures,which are intended for comparison among model simulations, are not likely to translatedirectly into management criteria. Instead, further work will be needed to develop theinformation base from which to establish actual high and low water level targets formanagement purposes. It needs to be clearly recognized that the high and low watercriteria contained in Appendix D were used primarily to identify extreme high or lowwater events that may impact Everglades tree islands, soils, plants, and/or wildlifecommunities. These criteria should not be interpreted as desired Everglades managementobjectives, but rather as screening tools to identify undesirable high or low water levelsthat should occur infrequently or be avoided.
Low Water Criterion. For extreme low water events, a criterion of 1.0 footbelow ground surface was used for all indicator regions in the northern Everglades wherepeat-forming wetlands occur. A criterion of 1.5 feet below ground surface was applied tomarl-forming soils located within the southern Everglades. These criteria are similar to theMFL water depth criteria proposed for the Everglades (SFWMD, 2000e).
High Water Criterion. For extreme high water events, a criterion of 2.5 feetabove the ground surface was used in the northern Everglades (WCA-1, WCA-2, andWCA-3, except for northeastern WCA-3A [Indicator Region 21]). These regions are partof the historic Everglades predrainage ridge and slough landscape (McVoy, et al., inreview), and include a variety of tree island types ranging from low stature peat islandsthat rise less than 1.0 foot above marsh ground elevation to tropical hardwood hammocksthat exceed marsh ground elevation by more than 4.0 feet at their summits. The 2.5 feetcriterion was based on several sources of information: 1) best professional judgementderived from federal and state agency scientists who have conducted research in theWCAs; 2) analysis of data collected from recent (1994 - 1995) high water events in
94
LEC Regional Water Supply Plan - Planning Document Chapter 4: Analysis and Evaluation of Model Results
WCA-3A (Guerra, 1996); and 3) recent tree island and slough water level informationcollected from WCA-3A and WCA-3B by the Florida Wildlife Commission (FWC),formerly known as the Florida Fish and Wildlife Conservation Commission (FFWCC)(Heisler and Towles, 1999). For Indicator Region 21 in northeastern WCA-3A, a highwater criterion of 2.0 feet was used, based on the rationale that this area of the Evergladeswas originally part of the remnant sawgrass plains and overall depth targets should belower than for the ridge and slough landscape.
Based on the recommendations of FWC staff, a high water criterion of 1.5 feet wasused for the Rotenberger WMA (Indicator Region 28), based on observations that treeislands in this area have reduced elevations as a result of peat loss from wildfires. For theHoley Land WMA (Indicator Region 29), a criterion of 1.5 feet was initially set, based onFWC observations that tree island wildlife refuges in the Holey Land WMA areeliminated once water depths exceed 1.5 feet. This criterion was later revised to 1.75 feetfollowing further discussion with the FWC staff. As a result, a value of 1.5 feet appears inSFWMM output tables for the Holey Land WMA, although District staff actually used1.75 feet as a minimum target for interpreting model output.
Interim Management Targets for Other Areas
For the St. Lucie River, the low flow, high flow, and estuary protection flow ratesas defined by ongoing research and management studies, were used as performancemeasures. For Lake Worth Lagoon, only a high flow criterion has been defined. Theperformance measures for Biscayne Bay are composed of mean annual wet and dry seasonsurface flows from various tributary canals. For the purposes of this study, theperformance target for Biscayne Bay is that future flows delivered to the estuary should besimilar to the flows provided in the 1995 Base Case. For western Florida Bay andWhitewater Bay, performance is based on surface flow at key gages and total flowsdelivered to the estuaries across selected transects located in central Shark River Slough.Flow targets are based on the ability to sustain the aquatic resources in the bays. Theseprovisional criteria are subject to change as additional studies are completed and theDistrict completes the actions needed to develop technical criteria, define MFLs, andimplement associated rules that affect these estuaries (See Recommendations 35 through37 in Chapter 6 and Appendix J).
Additional Performance Indicators
Water Supply Performance Indicators
A number of additional performance measures are routinely evaluated todetermine the ability of the regional water supply system to provide water to individualutilities. These measures are used to identify specific areas where problems may occur,possible causes, and potential solutions. Measures used include the following (seeAppendix D for more information):
• Daily hydrographs for each trigger cell in water restriction areas
95

Chapter 4: Analysis and Evaluation of Model Results LEC Regional Water Supply Plan - Planning Document
• Monthly volumes of simulated water supply cutbacks forrestriction areas
• Percentage of annual demand not met, by use type, for restrictionareas
• Frequency and severity of water supply restrictions
Hydrologic Performance Indicators
A number of additional measures were used in the evaluation that did not havespecific targets, but provided an overall indication of the relative behavior of each watersupply alternative. Measures used include the following (see Appendix D for moreinformation):
• Weekly stage hydrographs and stage-duration curves for selectedindicator regions
• Normalized stage duration curves and hydrographs for selectedindicator regions
• Hydroperiod distributions and hydroperiod matches
• Ground water flows, ground water heads, and overland flows
MODEL SIMULATIONS
Overview of Model Simulations
In the SFWMM and subregional ground water models, base case modelsimulations were conducted to determine current and future conditions of the LECPlanning Area. The 1995 estimated public water supply demand (1995 Base Case) and the2020 projected public water supply demand (2020 Base Case) were used for thesesimulations. The 2020 base case assumed that a) water withdrawals for Public WaterSupply reflect LEC utilities' preferred sources, b) future water users would withdrawwater in the quantities indicated by public water suppliers, and c) existing agricultural andirrigation water users would use the same sources for both their current and futuredemands, unless information was made available indicating a change. The existing andprojected uses of reclaimed water and Aquifer Storage and Recovery (ASR) systems(where information was available) were incorporated into the simulations.
In addition, the future base case assumes that other currently ongoing or proposedconstruction and planning efforts have been completed, including the EvergladesConstruction Project, Modified Water Deliveries to Everglades National Park, and theC-111 Basin project. Base case simulations represent the no action approach to waterresource and supply development and are not a likely scenario.
Next, SFWMM and subregional ground water model simulations that includeRestudy components were completed. It is anticipated that components of the Restudy
96
LEC Regional Water Supply Plan - Planning Document Chapter 4: Analysis and Evaluation of Model Results
will be substantially completed by 2020, with one notable exception: the Central andNorth Lake Belt storage areas. These projects are expected to be only 50 percent completeby 2020. These model simulations are referred to as 2020 with Restudy.
Additional simulations were also made to determine the cumulative effects ofwater supply withdrawals by utilities. In these simulations, referred to as LEC-1A, publicwater supplies and supplemental irrigation uses for golf courses, nurseries, agriculturalcrops, and landscaping were eliminated from the subregional ground water models. In theSFWMM simulations, only public water supply withdrawals were eliminated. ASRfacilities associated with the Restudy remained active.
SFWMM simulations were also made to determine incremental benefits ofproposed operational and structural changes over time, to simulate conditions that mayexist in 2005, 2010, and 2015, as features of the Restudy, the LEC Plan, and otheractivities are completed. Additional improvements to water resource and water supplydevelopment projects that were identified in LEC-1 simulation were incorporated into theLEC-1 Revised simulation. An additional incremental modeling scenario, the 2005 SSMScenario was also completed. The 2005 SSM Scenario was exactly the same as the 2005incremental simulation, except that in the 2005 SSM Scenario Lake Okeechobee stages atwhich supply-side management restrictions are triggered (indicated by the supply-sidemanagement line) were lowered by 0.5 feet from the beginning of October through the endof May. The Lake Okeechobee target for May 31 was also reduced from 11.0 to 10.5 ftNGVD in the 2005 SSM Scenario.
Even though both types of models, the SFWMM and the subregional ground watermodels, simulate the LEC service areas, and its associated public water supplywithdrawals, comparison of results between these two types of models is not appropriatedue to differences in how features are simulated. Each model should be used to evaluatethe areas and features for which it is best suited. The SFWMM, with its ability to simulateoverland flow in wetlands, Lake Okeechobee, and the coastal canals, and its longsimulated period of record, is best suited to analyze long-term regional trends inperformance of those features. The ground water models with their small cells,stratification of the aquifer, and short time periods are adept at simulating small-scalefeatures such as changes in wellfield locations, effects of ASR withdrawals, and groundwater stages along the coast. The SFWMM with its large cells tends to lump these featuresand limit its sensitivity to small changes in assumptions and performance.
Both types of models, the regional SFWMM and subregional ground watermodels, initially performed five simulations: the 1995 Base Case, the 2020 Base Case, the2020 with Restudy features, the LEC-1, and LEC-1A (no public water supply). Acronymsfor these simulations are provided in Table 7. These same acronyms are used on theperformance measure graphics compiled in Appendix H.
97

Chapter 4: Analysis and Evaluation of Model Results LEC Regional Water Supply Plan - Planning Document
Assumptions for Base Cases and Alternatives
The regional and subregional models simulate the hydrology of South Florida on adaily basis including major components of the hydrologic cycle: rainfall,evapotranspiration, infiltration, ground water flow, canal flow, canal-ground waterseepage, levee seepage, and ground water withdrawals. The SFWMM uses the climaticconditions from the 1965-1995 period, which includes both droughts and wet periods,while the subregional ground water models simulate the dry period from January 1988 toDecember 1990. The 1995 Base Case provides an understanding of the how the 1995water management system with 1995 land use and demands responds to historic (1965-1995) climatic conditions. The 2020 Base Case provides information of how the systemwould respond to anticipated future operations and demands under the same historicclimatic conditions with currently authorized restoration projects implemented, butwithout Restudy features. Comparison of the 1995 and 2020 base cases shows systemperformance with increased demands and inclusion of new projects and operating criteria.
The 2020 with Restudy simulations provide information on how the systemperforms with the implementation of the Restudy projects that would be completed by2020 along with 2020 demands and operating criteria. The LEC-1 simulation providesinformation on how additional changes to water resource and water supply developmentprojects may alter hydrologic performance.
The LEC-1A simulation was undertaken to understand the impact that permittedconsumptive uses might have on the regional system. Using the subregional ground watermodels, effects on wetlands can be evaluated by comparing ground water stages in theLEC-1 simulation to the LEC-1A simulation. The manner in which the SFWMM andsubregional ground water models simulate this varies. The SFWMM does not includepublic water withdrawals in Palm Beach, Broward, Miami-Dade, and Monroe counties,but includes agricultural and landscape irrigation demands. The subregional ground watermodels more closely mimic the permit review process by eliminating all consumptive uses(public water demands, agriculture, and landscape irrigation) within the models'boundaries from this simulation. In both simulations, ASR systems recommended in theRestudy operate as designed.
Table 7. Acronyms for SFWMM and Subregional Ground Water Model Base Case andAlternatives Simulations.
Simulation SFWMM AcronymGround Water ModelSimulation Acronym
1995 Base Case 95BSR 95Base
2020 Base Case 20BSR 20Base
2020 with Restudy 2020WR 20wres
LEC-1 LEC-1 LEC-1
LEC-1A LEC-1A LEC-1A
98

LEC Regional Water Supply Plan - Planning Document Chapter 4: Analysis and Evaluation of Model Results
Primary Differences Between Base Cases and Alternatives
The major differences between the different types of model simulations are1) changes in public water supply demands and locations of withdrawals, 2) inclusion offuture projects and components, 3) modifications to Lake Okeechobee and WCAoperation schedules, and 4) changes in land use between 1995 and 2020 and the resultingeffect on agriculture and landscape irrigation demands. Table 8 provides a summary of thethe assumptions used in the 1995 and 2020 base cases, the 2020 with Restudy, and theLEC-1 simulations.
Table 8. Comparison of Assumptions in the 1995 and 2020 Base Cases, 2020 with Restudy, andLEC-1 Simulations.
Feature 1995 Base Case 2020 Base Case2020 withRestudy LEC-1 LEC-1A
Land Use for Urbanand Agricultural Areas
Best availableinformation for1995
Projections basedon countycomprehensiveplans; adjusted toreflect constructionof StormwaterTreatment Areas(STAs)
Projections basedon countycomprehensiveplans; adjusted toreflect constructionof STAs andreservoirs as perRestudy
Projections basedon countycomprehensiveplans; adjusted toreflect constructionof STAs andreservoirs as perRestudy
Projections basedon countycomprehensiveplans; adjusted toreflect constructionof STAs andreservoirs as perRestudy
Vegetation Cover forNatural Areas
Best availableinformation;generally reflectconditions between1990-1995
Best availableinformation;generally reflectconditions between1990-1995
Best availableinformation;generally reflectconditions between1990-1995
Best availableinformation;generally reflectconditions between1990-1995
Best availableinformation;generally reflectconditions between1990-1995
LOSA Mean AnnualSupplementalIrrigation Demands
170,000 ac-ft 191,000 ac-ft 239,000 ac-ft 227,000 ac-ft 227,000 ac-ft
EAA Mean AnnualSupplementalIrrigation Demands
372,000 ac-ft 335,000 ac-ft 327,000 ac-ft 328,000 ac-ft 328,000 ac-ft
Lake OkeechobeeRegulation Schedule
Run 25 Schedule Water Supply andEnvironmental(WSE) Schedule
Modified Run 25Schedule
Modified WSESchedule
Modified WSESchedule
Lake OkeechobeeSupply-SideManagement forLOSA
Yes Yes Yes Yes Yes
Caloosahatchee RiverBasin Demands(including municipaldemands)
Demands based onhistorical records
25 percent increaseover 1995 averageannual demands
25 percent increaseover 1995 averageannual demands
25 percent increaseover 1995 averageannual demands
25 percent increaseover 1995 averageannual demands
CaloosahatcheeBackpumping
N/A N/A As per Restudy Reduced to zero asper CWMP
Reduced to zero asper CWMP
St. Lucie River BasinDemands
Demands based onhistorical records
Same as 1995 Same as 1995 Same as 1995 Same as 1995
C-44 Basin StorageReservoir
N/A N/A As per Restudy Modified as perIndian RiverLagoon Feasibilitya
Study
Modified as perIndian RiverLagoon Feasibilitya
Study
Brighton SeminoleIndian ReservationDemands
28,500 ac-ft annualaverage; maximum44,000 ac-ft/yr
28,500 ac-ft annualaverage; maximum44,000 ac-ft/yr
52,000 ac-ft peryear
28,500 ac-ft annualaverage; maximum44,000 ac-ft/yr
28,500 ac-ft annualaverage; maximum44,000 ac-ft/yr
99

Chapter 4: Analysis and Evaluation of Model Results LEC Regional Water Supply Plan - Planning Document
STAs Associated withthe EAA
No Yes Yes Yes Yes
EAA RunoffReduction and Make-Up Water BMPs
No runoff reductionor make-up waterdelivered
No runoff reductionor make-up waterdelivered
20 percent EAArunoff reductionand make-up waterdelivered
No runoff reductionor make-up waterdelivered
No runoff reductionor make-up waterdelivered
Make-Up WaterAssociated with BMPsfrom LakeOkeechobee
No No No No No
WCA-1 Schedule C&SF InterimRegulationSchedule
C&SF InterimRegulationSchedule
C&SF InterimRegulationSchedule
C&SF InterimRegulationSchedule
C&SF InterimRegulationSchedule
WCA-2 and WCA-3Schedules
Current regulationschedule
Rain-drivenoperations andModified WaterDeliveries Project
Rain-drivenoperations
Rain-drivenoperations
Rain-drivenoperations
Everglades NationalPark Operations
ExperimentalRainfall DeliveryPlan via S-12s andS-333
As per ModifiedWater DeliveriesProject
As per Restudy As per Restudy As per Restudy
LECSAs Populationfor Utilities
4,755,776 persons 6,951,998 personsas per LEC utilitysurvey
6,951,998 personsas per LEC utilitysurvey
6,951,998 persons,as per LEC utilitysurvey
6,951,998 persons,as per LEC utilitysurvey
LECSAs Public WaterSupply Demands onSurficial AquiferSystem and SurfaceWater
Actual 1995demands: 286,429MGY (784.1 MGD)
Projected demandsbased on LECutility survey:443,411 MGY(1,214.8 MGD)
Projected demandsbased on LECutility survey:443,411 MGY(1,214.8 MGD)
Projected demandsbased on LECutility survey:443,411 MGY(1,214.8 MGD)
No public watersupply demand
LECSAs Public WaterSupply WellfieldDistribution
Actual 1995locations
Utility preferredwellfield locations,as per LEC utilitysurvey
As per Restudy Modifications toeleven utilitiespreferred wellfieldlocations as perLEC utility survey
Not applicable
LECSAs WaterShortage Policy
Yes Yes Yes Yes Yes
LEC IrrigationDemands on SurficialAquifer System
Based on 1995land use andclimatic variation
Based on projected2020 land use andclimatic variation
Based on projected2020 land use andclimatic variation
Based on projected2020 land use andclimatic variation
Based on projected2020 land use andclimatic variation
OperationalAdjustments to MeetMFLs for BiscayneAquifer
No Canal operationcriteria (Table 23)
Canal operationcriteria (Table 23)
Canal operationcriteria (Table 23)
Canal operationcriteria (Table 23)
L-8 Projectb No Yes, as per the LECInterim Plan
Yes, as perRestudy
Yes, as perRestudy
Yes, as perRestudy
Northern BrowardCounty SecondaryCanal Networkb
No Yes, as per the LECInterim Plan
Yes, as perRestudy
Yes, as perRestudy
Yes, as perRestudy
Miami-Dade UtilityASRb
No 150 MGD 150 MGD 75 MGD 75 MGD
Miami-Dade CountyReuseb
No No 100 MGD at westfacility
50 MGD at westfacility
50 MGD at westfacility
a. USACE, 1996b. Ongoing project from the Interim Plan for Lower East Coast Regional Water Supply (SFWMD, 1998b)
Table 8. Comparison of Assumptions in the 1995 and 2020 Base Cases, 2020 with Restudy, andLEC-1 Simulations. (Continued)
Feature 1995 Base Case 2020 Base Case2020 withRestudy LEC-1 LEC-1A
100
LEC Regional Water Supply Plan - Planning Document Chapter 4: Analysis and Evaluation of Model Results
Public Water Supply Demands
The simulations used two demand sets (allocation sets) for public water supply inthe LEC Planning Area: 1995 and 2020. The 1995 demands represent estimated averageannual demands for that year (286,429 MGY). The 2020 demands (443,411 MGY) are aprojection of future demands provided by public water suppliers to District staff inJanuary 1999. Appendix B contains a detailed discussion of estimated and projectedpublic water supply demands. These projected 2020 average annual demands are used inthe 2020 simulations (2020 Base Case, 2020 with Restudy, and LEC-1).
The District also developed 2020 public water supply projections in theDistrictwide Water Supply Assessment (DWSA) (SFWMD, 1998c). The DWSA projectedtotal demands in the LEC Planning Area as 389,440 MGY. The utility projectionsanticipated a 14 percent higher demand in 2020 than the estimates in the DWSA. Theaverage public water supply per capita rate for the LECSAs fairly constant for the utility(176 gallons per capita daily [gpcd]) and District projections (179 gpcd). Most utilitiescontinued their current per capita water consumption rate, while some anticipate a lowerper capita rate coupled with higher population projections or vice versa. These twoprojections were considered to represent low and high values that bracket a range of futureprojections. Conservation of water may increase in the future as a greater percentage ofhouses use low flow fixtures, have smaller yards, or depend on reuse for irrigation. Thus,the lower projection may prove accurate. On the other hand, the population may grow ator above the rates the utilities anticipate and the higher demand projections may bereached. Using the higher demand in the LEC Plan is the more conservative approach. Inthis case, water resource development projects are needed immediately to meetenvironmental demands. The population and demand projections will be reassessed foreach utility during the CUP process and future updates of LEC Plan.
The physical locations of public water withdrawals also vary between the 1995and 2020 simulations (see Appendix B for maps). In the 1995 Base Case, withdrawals aresimilar to historic conditions in 1995, i.e., only wells existing in 1995 and thecorresponding wellfield distribution were included. In the future 2020 model simulations,locations of withdrawals include new wells built since 1995 and proposed locationsprovided by public water supply utilities to the District in January 1999. Data provided bythe utilities consist of their initial or preferred locations and the resulting distribution ofwithdrawals among the wellfields. To view how the SFWMM simulates these demands atthe utilities preferred locations, refer to the Spatial Distribution of Public Water SupplyDemands section in Appendix B. Some utilities proposed many new wells to meet futuredemands while others foresee constructing no new wells by 2020.
The physical locations of public water withdrawals also vary between the 2020with Restudy and the LEC-1 model simulations. In the 2020 with Restudy, withdrawallocations are similar to those used in the Restudy's Alternate D13R simulation (USACEand SFWMD, 1999). The Restudy relied upon the SFWMM and its four square mile gridto simulate LEC urbanized areas. The primary method to alleviate low ground water levelsalong the coast and anticipate future well locations was to move public water supplydemands inland. The large grid cells do not enable the degree of refinement of well
101

Chapter 4: Analysis and Evaluation of Model Results LEC Regional Water Supply Plan - Planning Document
distributions or locations that is possible with the subregional ground water models. In theLEC-1 simulations, most withdrawal locations are the same as in the 2020 Base Case. TheLEC-1 incorporates the utility preferred locations for future wells. In addition, elevenutilities had at least a portion, if not all, of their withdrawals relocated to existing wellfieldlocations further inland to reduce the threat of saltwater intrusion and/or reduce thefrequency water supply restrictions. These locations are assumed only for modeling andplanning purposes and are not meant to imply that permits are obtainable.
Agricultural Water Supply Demands
In the SFWMM, the 1995 demand level represents estimated agricultural waterdemands for acreage that was permitted by the District through the end of 1995. Forirrigation uses, demands for permitted acreage were calculated based on crop type andsimulated rainfall events. The 2020 demand level is based on projected 2020 agriculturalacreage, as indicated in on local county comprehensive plans. All irrigation demands werecalculated using the modified Blaney-Criddle method for each rainfall condition. Adetailed discussion of this method can be found in the District’s Management of Water UsePermitting Information Manual, Volume III (SFWMD, 1997d). Blaney-Criddle iscurrently used to estimate supplemental crop requirements in the District’s CUP program.Details of demand assumptions are described in Appendix B.
In the base cases and alternatives, agricultural demands in the CaloosahatcheeBasin were projected using the same method applied in the Restudy. The projecteddemands in 2020 are 25 percent greater than in 1995. While in the Restudy the 2050projection was 40 percent greater than 1995. Refer to the CWMP for more informationregarding the assumptions that were used in the integrated surface and ground watermodel.
Inclusion of Restudy Components
The second primary difference between the base case and alternative simulations isinclusion of future projects and components. The 2020 with Restudy simulation onlyincludes those Restudy components that are expected to be completed by 2020. Accordingto the Restudy Implementation Plan (USACE and SFWMD, 1999), all components are tobe completed by 2020 except that only half of the total volume of the North and CentralLake Belt projects will be available. Table 9 identifies the Restudy components includedin the 2020 with Restudy simulation performed by the SFWMM and subregional groundwater models.
102
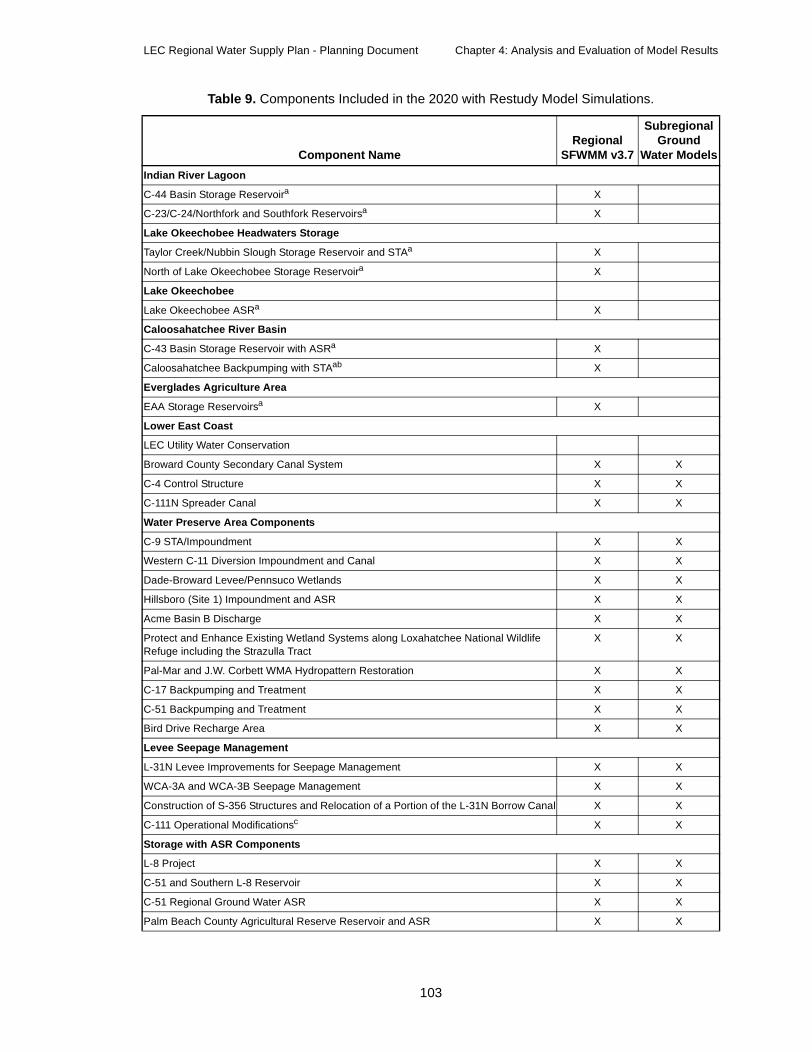
LEC Regional Water Supply Plan - Planning Document Chapter 4: Analysis and Evaluation of Model Results
Table 9. Components Included in the 2020 with Restudy Model Simulations.
Component NameRegional
SFWMM v3.7
SubregionalGround
Water Models
Indian River Lagoon
C-44 Basin Storage Reservoira X
C-23/C-24/Northfork and Southfork Reservoirsa X
Lake Okeechobee Headwaters Storage
Taylor Creek/Nubbin Slough Storage Reservoir and STAa X
North of Lake Okeechobee Storage Reservoira X
Lake Okeechobee
Lake Okeechobee ASRa X
Caloosahatchee River Basin
C-43 Basin Storage Reservoir with ASRa X
Caloosahatchee Backpumping with STAab X
Everglades Agriculture Area
EAA Storage Reservoirsa X
Lower East Coast
LEC Utility Water Conservation
Broward County Secondary Canal System X X
C-4 Control Structure X X
C-111N Spreader Canal X X
Water Preserve Area Components
C-9 STA/Impoundment X X
Western C-11 Diversion Impoundment and Canal X X
Dade-Broward Levee/Pennsuco Wetlands X X
Hillsboro (Site 1) Impoundment and ASR X X
Acme Basin B Discharge X X
Protect and Enhance Existing Wetland Systems along Loxahatchee National WildlifeRefuge including the Strazulla Tract
X X
Pal-Mar and J.W. Corbett WMA Hydropattern Restoration X X
C-17 Backpumping and Treatment X X
C-51 Backpumping and Treatment X X
Bird Drive Recharge Area X X
Levee Seepage Management
L-31N Levee Improvements for Seepage Management X X
WCA-3A and WCA-3B Seepage Management X X
Construction of S-356 Structures and Relocation of a Portion of the L-31N Borrow Canal X X
C-111 Operational Modificationsc X X
Storage with ASR Components
L-8 Project X X
C-51 and Southern L-8 Reservoir X X
C-51 Regional Ground Water ASR X X
Palm Beach County Agricultural Reserve Reservoir and ASR X X
103

Chapter 4: Analysis and Evaluation of Model Results LEC Regional Water Supply Plan - Planning Document
Lake Belt Storage and Conveyance
Central Lake Belt Storage Area, Phase 1d X X
Divert flows from Central Lake Belt Storage Area to WCA-3B X X
Divert Flows from WCA-3 to Central Lake Belt Storage Area X X
Divert Flows from WCA-2 to Central Lake Belt Storage Area X X
North Lake Belt Storage Area, Phase 1d X X
Water Conservation Areas and Everglades National Park
Revised Holey Land WMA Operation Plana X
Revised Rotenberger WMA Operation Plana X
Loxahatchee National Wildlife Refuge Internal Structures X X
Reroute Miami-Dade Water Supply Deliveries X X
Additional S-345 Structures X X
Decompartmentalize WCA-3 X X
G-404 Pump Station Modification X X
Biscayne Bay
Biscayne Bay Coastal Wetlands X X
West Miami-Dade County Reuse X X
South Miami-Dade County Reuse X X
Western Basin
Miccosukee Tribe Water Management Plana X
Flow to Northwest and Central WCA-3Aa X
Big Cypress/L-28 Interceptor Modificationsa X
Seminole Tribe Big Cypress Basin Water Conservation Plana
Stand Alone Other Project Elements (OPEs)
Lake Okeechobee Watershed Water Quality Treatment Facilitiese
Lake Okeechobee Tributary Sediment Dredginge
Lake Worth Lagoon Restoratione
Pineland and Hardwood Hammocks Restoratione
Melaleuca Eradication Project and Other Exoticse
Florida Keys Tidal Restoratione
Winsburg Farms Wetlandse
a. Outside of the subregional ground water models' boundariesb. Modeled in the CWMPc. The C-111 Operational Modifications are part of the Modification to South Dade Conveyance System in Southern
Portion of L-31N and C-111 Canals component.d. 50 percent completed by 2021e. Cannot be simulated with these types of hydrologic models
Table 9. Components Included in the 2020 with Restudy Model Simulations. (Continued)
Component NameRegional
SFWMM v3.7
SubregionalGround
Water Models
104
LEC Regional Water Supply Plan - Planning Document Chapter 4: Analysis and Evaluation of Model Results
Lake Okeechobee and Water Conservation Area Schedules
Changes in the Lake Okeechobee and WCAs schedules can have significantimpacts on how outflows from the lake are managed to meet multiple purposes. The LEC1995 Base Case relies upon the current U.S. Army Corps of Engineers (USACE)approved schedules to manage water in the lake and WCAs, while the all futuresimulations (2020 Base Case, LEC-1, and LEC-1A) anticipates implementation of theWater Supply and Environmental (WSE) schedule on the lake and rain-driven schedulesfor the WCAs and Everglades National Park. The 2020 with Restudy simulation followsthis precedent, relies upon rain-driven schedules for the WCAs, but uses a modified Run25 schedule for the lake. When comparing results, the changes in operations and scheduleshave significant effects on the ability to meet performance targets.
Current and Future Land Use
One of the primary model assumptions is how land is used, whether it is coveredwith houses and roads or is a natural wetland. The type of land use applied in the modelmost directly affects how the models handle evapotranspiration and overland flow orrecharge. Three land use databases were developed for the LEC Plan analysis: 1) 1995land use, which is based on interpretation of aerial surveys; 2) 2020 land use, which is aninterpretation of the county comprehensive land use plans; and 3) 2020 with Restudy landuse, which is the same as the 2020 land use except that it has been modified to reflectconstruction of the Restudy features.
Incremental Simulations
The purpose of this analysis was to understand how the system performs in theinterim period between now and 2020. Incremental years, 2005, 2010, and 2015, wereselected to provide snapshots of how the system performs with partial completion of theRestudy projects and how the ability to meet the 1-in-10 year level of certainty criteriaimproves over time. Also, improvements to the performance of LEC-1 were incorporatedinto the LEC-1 Revised, which is the now the new 2020 end point for comparingsimulations.
This analysis consisted of identifying the components that were scheduled to becomplete and fully operational by the end of each year selected (Table 10). Thesecomponents were then modeled to evaluate whether the partial or sequential completion ofprojects would cause ecological or water supply conditions that are worse than the 1995Base Case or would result in progressive improvement in performance during the interimperiod. The modeling analysis and evaluation of the components utilized the sameperformance measures as the base cases and LEC-1 analyses. This analysis was used toidentify problem areas and confirm that the original implementation schedule developedfor Restudy was sequenced in a logical order that furthered the goals and objectives of theLEC Plan.
105
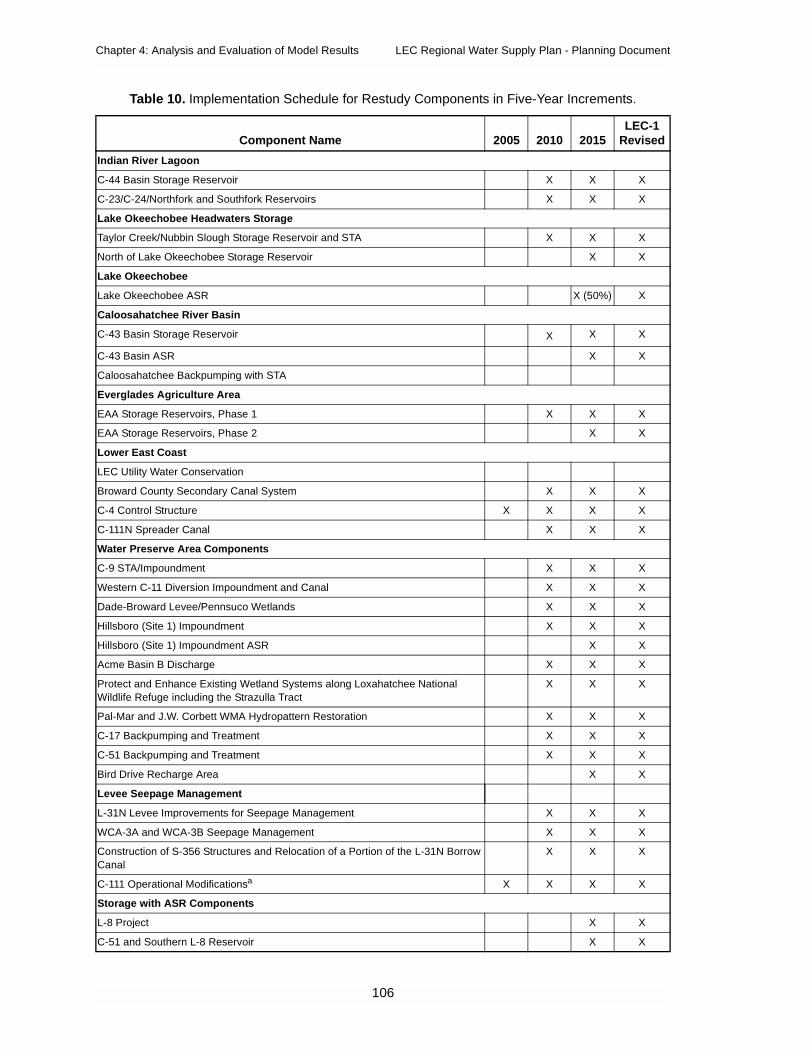
Chapter 4: Analysis and Evaluation of Model Results LEC Regional Water Supply Plan - Planning Document
Table 10. Implementation Schedule for Restudy Components in Five-Year Increments.
Component Name 2005 2010 2015LEC-1
Revised
Indian River Lagoon
C-44 Basin Storage Reservoir X X X
C-23/C-24/Northfork and Southfork Reservoirs X X X
Lake Okeechobee Headwaters Storage
Taylor Creek/Nubbin Slough Storage Reservoir and STA X X X
North of Lake Okeechobee Storage Reservoir X X
Lake Okeechobee
Lake Okeechobee ASR X (50%) X
Caloosahatchee River Basin
C-43 Basin Storage Reservoir X X X
C-43 Basin ASR X X
Caloosahatchee Backpumping with STA
Everglades Agriculture Area
EAA Storage Reservoirs, Phase 1 X X X
EAA Storage Reservoirs, Phase 2 X X
Lower East Coast
LEC Utility Water Conservation
Broward County Secondary Canal System X X X
C-4 Control Structure X X X X
C-111N Spreader Canal X X X
Water Preserve Area Components
C-9 STA/Impoundment X X X
Western C-11 Diversion Impoundment and Canal X X X
Dade-Broward Levee/Pennsuco Wetlands X X X
Hillsboro (Site 1) Impoundment X X X
Hillsboro (Site 1) Impoundment ASR X X
Acme Basin B Discharge X X X
Protect and Enhance Existing Wetland Systems along Loxahatchee NationalWildlife Refuge including the Strazulla Tract
X X X
Pal-Mar and J.W. Corbett WMA Hydropattern Restoration X X X
C-17 Backpumping and Treatment X X X
C-51 Backpumping and Treatment X X X
Bird Drive Recharge Area X X
Levee Seepage Management
L-31N Levee Improvements for Seepage Management X X X
WCA-3A and WCA-3B Seepage Management X X X
Construction of S-356 Structures and Relocation of a Portion of the L-31N BorrowCanal
X X X
C-111 Operational Modificationsa X X X X
Storage with ASR Components
L-8 Project X X
C-51 and Southern L-8 Reservoir X X
106
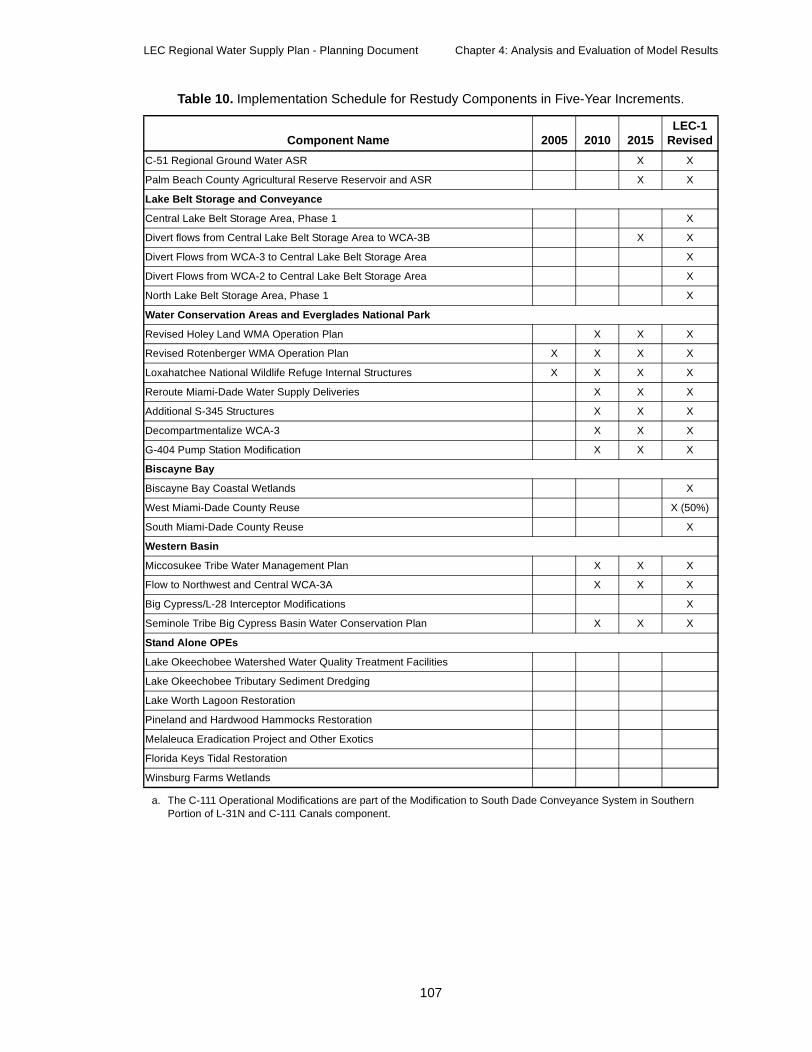
LEC Regional Water Supply Plan - Planning Document Chapter 4: Analysis and Evaluation of Model Results
C-51 Regional Ground Water ASR X X
Palm Beach County Agricultural Reserve Reservoir and ASR X X
Lake Belt Storage and Conveyance
Central Lake Belt Storage Area, Phase 1 X
Divert flows from Central Lake Belt Storage Area to WCA-3B X X
Divert Flows from WCA-3 to Central Lake Belt Storage Area X
Divert Flows from WCA-2 to Central Lake Belt Storage Area X
North Lake Belt Storage Area, Phase 1 X
Water Conservation Areas and Everglades National Park
Revised Holey Land WMA Operation Plan X X X
Revised Rotenberger WMA Operation Plan X X X X
Loxahatchee National Wildlife Refuge Internal Structures X X X X
Reroute Miami-Dade Water Supply Deliveries X X X
Additional S-345 Structures X X X
Decompartmentalize WCA-3 X X X
G-404 Pump Station Modification X X X
Biscayne Bay
Biscayne Bay Coastal Wetlands X
West Miami-Dade County Reuse X (50%)
South Miami-Dade County Reuse X
Western Basin
Miccosukee Tribe Water Management Plan X X X
Flow to Northwest and Central WCA-3A X X X
Big Cypress/L-28 Interceptor Modifications X
Seminole Tribe Big Cypress Basin Water Conservation Plan X X X
Stand Alone OPEs
Lake Okeechobee Watershed Water Quality Treatment Facilities
Lake Okeechobee Tributary Sediment Dredging
Lake Worth Lagoon Restoration
Pineland and Hardwood Hammocks Restoration
Melaleuca Eradication Project and Other Exotics
Florida Keys Tidal Restoration
Winsburg Farms Wetlands
a. The C-111 Operational Modifications are part of the Modification to South Dade Conveyance System in SouthernPortion of L-31N and C-111 Canals component.
Table 10. Implementation Schedule for Restudy Components in Five-Year Increments.
Component Name 2005 2010 2015LEC-1
Revised
107

Chapter 4: Analysis and Evaluation of Model Results LEC Regional Water Supply Plan - Planning Document
Assumptions for Incremental Simulations
Incremental simulations were performed with the SFWMM to understand how thesystem behaves as features of the plan are constructed or implemented. The 1995 BaseCase and LEC-1 provide beginning and end points to evaluate progress over time ascomponents are implemented. The beginning and end points were revised to makecomparisons to the incremental simulations valid, i.e. incorporate similar modelassumptions so the only variables were the Restudy projects themselves. Thesesimulations are referred to as the 1995 Revised Base Case and the LEC-1 Revised,respectively. Table 11 references the acronyms used in the model results graphics found inAppendix H. Agricultural, urban, and environmental demands increased over time asdemands and water supplies increased. A summary of the modeling assumptions for theincremental simulations can be found in Table 12.
Assumptions for 2005 SSM Scenario
A 2005 Supply-Side Scenario (SSM) was also simulated with the SFWMM as partof the incremental simulation analysis. The purpose of this scenario was to determine howsensitive the modifications to the regional system were to Lake Okeechobee's operationsand its ability to meet water supply demands. In the 2005 SSM Scenario, the LakeOkeechobee supply-side management criteria were modified. Other alternatives toachieve this goal will also be considered in solution development.
The Supply-Side Management restrictions were designed to be conservative andretain water in the regional system to meet unforeseen demands later in the drought or dryseason. The conservative approach may be too restrictive for future conditions, especiallyconsidering additional demands placed on the lake since the supply-side managementcriteria was developed. By 2005, several new demands are placed on Lake Okeechobee,but no regional storage features are available to meet some of these new demands. Theincreased demands in 2005 include the Everglades Construction Project, the rain-drivenschedules for the WCAs, and Caloosahatchee Basin and lower Lake Istokpogasupplemental irrigation demands. To meet the existing and future demands on LakeOkeechobee, the stage that triggers supply-side management was lowered byapproximately one-half of a foot. The end of dry season (May 31) stage target was alsoreduced from 11.0 to 10.5 ft NGVD.
Table 11. Acronyms for SFWMM Incremental Simulations.
Simulation Acronym1995 Revised Base Case 95BSRR
2005 2005R
2005 SSM Scenario 2005 SSM
2010 2010R
2015 2015R
LEC-1 Revised LEC-1R or 2020R
108
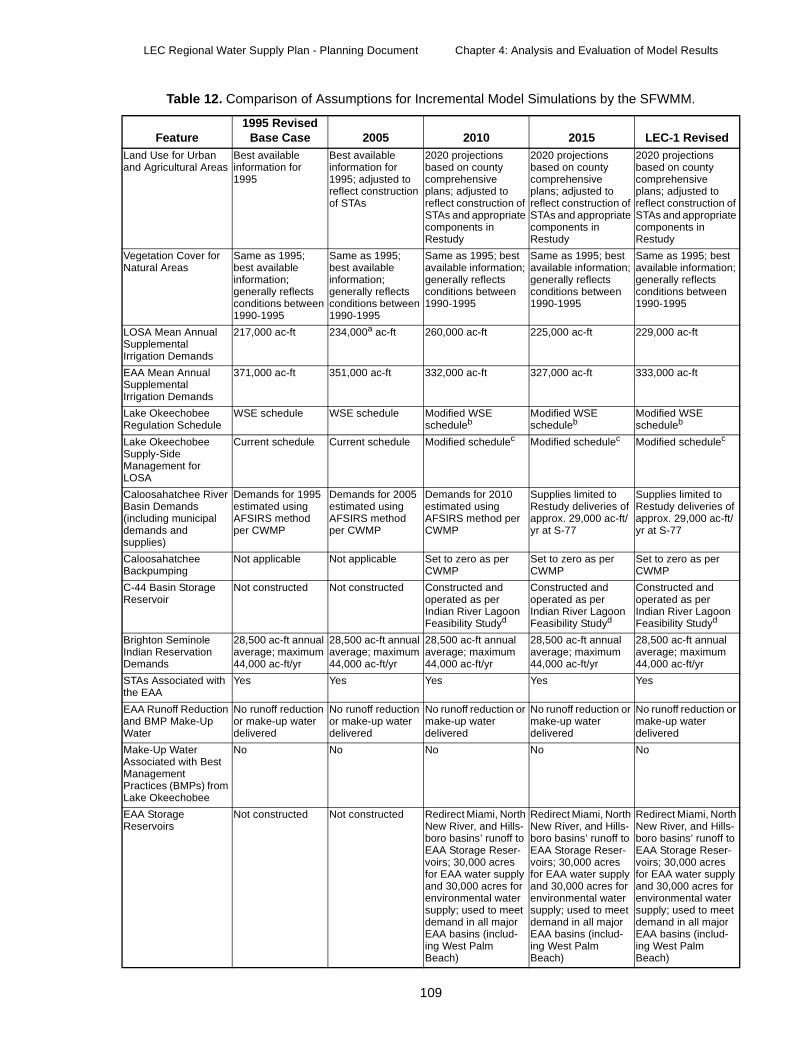
LEC Regional Water Supply Plan - Planning Document Chapter 4: Analysis and Evaluation of Model Results
Laan
fe
VeNa ;
LOSuIrr
EASuIrr
LaRe
LaSuMLO
CaBa(indesu
f/
CaBa
C-Re
BrInDe
STth
EAanW
r
MAsMPrLa
EARe
h-
t
Table 12. Comparison of Assumptions for Incremental Model Simulations by the SFWMM.
Feature1995 Revised
Base Case 2005 2010 2015 LEC-1 Revisednd Use for Urband Agricultural Areas
Best availableinformation for1995
Best availableinformation for1995; adjusted toreflect constructionof STAs
2020 projectionsbased on countycomprehensiveplans; adjusted toreflect construction ofSTAs and appropriatecomponents inRestudy
2020 projectionsbased on countycomprehensiveplans; adjusted toreflect construction ofSTAs and appropriatecomponents inRestudy
2020 projectionsbased on countycomprehensiveplans; adjusted toreflect construction oSTAs and appropriatcomponents inRestudy
getation Cover fortural Areas
Same as 1995;best availableinformation;generally reflectsconditions between1990-1995
Same as 1995;best availableinformation;generally reflectsconditions between1990-1995
Same as 1995; bestavailable information;generally reflectsconditions between1990-1995
Same as 1995; bestavailable information;generally reflectsconditions between1990-1995
Same as 1995; bestavailable informationgenerally reflectsconditions between1990-1995
SA Mean Annualpplemental
igation Demands
217,000 ac-ft 234,000a ac-ft 260,000 ac-ft 225,000 ac-ft 229,000 ac-ft
A Mean Annualpplemental
igation Demands
371,000 ac-ft 351,000 ac-ft 332,000 ac-ft 327,000 ac-ft 333,000 ac-ft
ke Okeechobeegulation Schedule
WSE schedule WSE schedule Modified WSEscheduleb
Modified WSEscheduleb
Modified WSEscheduleb
ke Okeechobeepply-Side
anagement forSA
Current schedule Current schedule Modified schedulec Modified schedulec Modified schedulec
loosahatchee Riversin Demandscluding municipalmands andpplies)
Demands for 1995estimated usingAFSIRS methodper CWMP
Demands for 2005estimated usingAFSIRS methodper CWMP
Demands for 2010estimated usingAFSIRS method perCWMP
Supplies limited toRestudy deliveries ofapprox. 29,000 ac-ft/yr at S-77
Supplies limited toRestudy deliveries oapprox. 29,000 ac-ftyr at S-77
loosahatcheeckpumping
Not applicable Not applicable Set to zero as perCWMP
Set to zero as perCWMP
Set to zero as perCWMP
44 Basin Storageservoir
Not constructed Not constructed Constructed andoperated as perIndian River LagoonFeasibility Studyd
Constructed andoperated as perIndian River LagoonFeasibility Studyd
Constructed andoperated as perIndian River LagoonFeasibility Studyd
ighton Seminoledian Reservationmands
28,500 ac-ft annualaverage; maximum44,000 ac-ft/yr
28,500 ac-ft annualaverage; maximum44,000 ac-ft/yr
28,500 ac-ft annualaverage; maximum44,000 ac-ft/yr
28,500 ac-ft annualaverage; maximum44,000 ac-ft/yr
28,500 ac-ft annualaverage; maximum44,000 ac-ft/yr
As Associated withe EAA
Yes Yes Yes Yes Yes
A Runoff Reductiond BMP Make-Upater
No runoff reductionor make-up waterdelivered
No runoff reductionor make-up waterdelivered
No runoff reduction ormake-up waterdelivered
No runoff reduction ormake-up waterdelivered
No runoff reduction omake-up waterdelivered
ake-Up Watersociated with Best
anagementactices (BMPs) fromke Okeechobee
No No No No No
A Storageservoirs
Not constructed Not constructed Redirect Miami, NorthNew River, and Hills-boro basins’ runoff toEAA Storage Reser-voirs; 30,000 acresfor EAA water supplyand 30,000 acres forenvironmental watersupply; used to meetdemand in all majorEAA basins (includ-ing West PalmBeach)
Redirect Miami, NorthNew River, and Hills-boro basins’ runoff toEAA Storage Reser-voirs; 30,000 acresfor EAA water supplyand 30,000 acres forenvironmental watersupply; used to meetdemand in all majorEAA basins (includ-ing West PalmBeach)
Redirect Miami, NortNew River, and Hillsboro basins’ runoff toEAA Storage Reser-voirs; 30,000 acresfor EAA water supplyand 30,000 acres forenvironmental watersupply; used to meedemand in all majorEAA basins (includ-ing West PalmBeach)
109
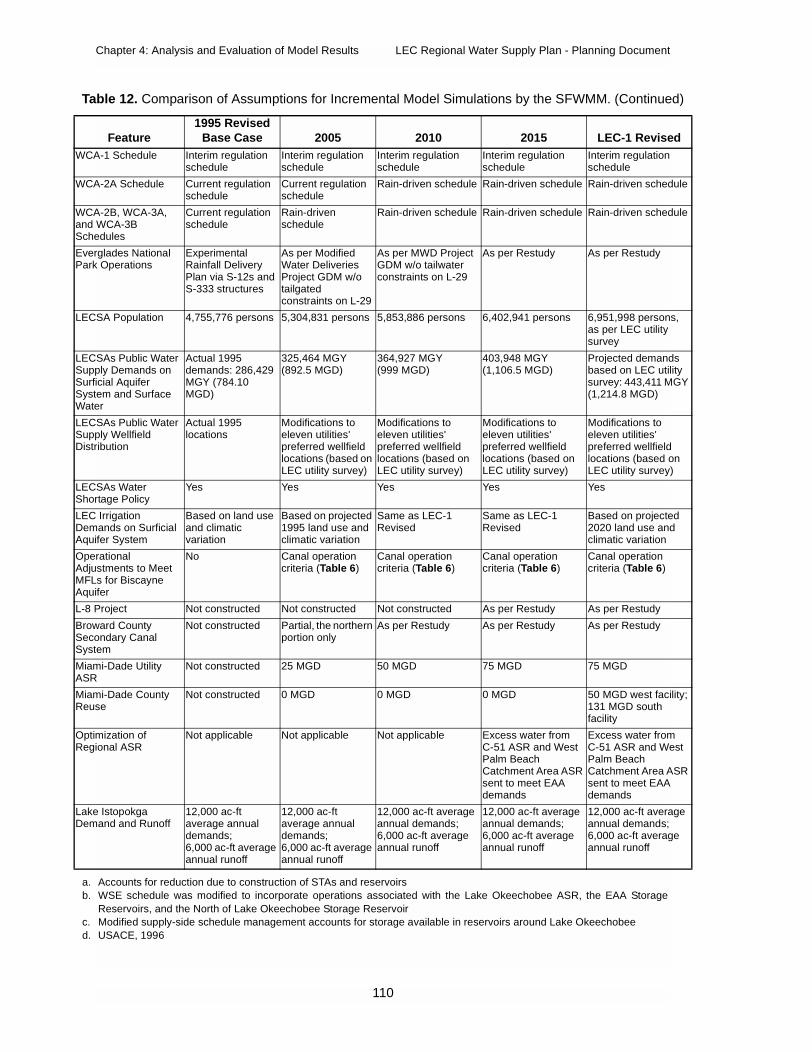
Chapter 4: Analysis and Evaluation of Model Results LEC Regional Water Supply Plan - Planning Document
W
W
WanSc
EvPa
LE
LESuSuSyW
LESuDi
LESh
LEDeAq
OpAdMAq
L-
BrSeSy
MAS
MRe
;
OpRe
LaDe
ab
cd
T
CA-1 Schedule Interim regulationschedule
Interim regulationschedule
Interim regulationschedule
Interim regulationschedule
Interim regulationschedule
CA-2A Schedule Current regulationschedule
Current regulationschedule
Rain-driven schedule Rain-driven schedule Rain-driven schedule
CA-2B, WCA-3A,d WCA-3Bhedules
Current regulationschedule
Rain-drivenschedule
Rain-driven schedule Rain-driven schedule Rain-driven schedule
erglades Nationalrk Operations
ExperimentalRainfall DeliveryPlan via S-12s andS-333 structures
As per ModifiedWater DeliveriesProject GDM w/otailgatedconstraints on L-29
As per MWD ProjectGDM w/o tailwaterconstraints on L-29
As per Restudy As per Restudy
CSA Population 4,755,776 persons 5,304,831 persons 5,853,886 persons 6,402,941 persons 6,951,998 persons,as per LEC utilitysurvey
CSAs Public Waterpply Demands onrficial Aquiferstem and Surfaceater
Actual 1995demands: 286,429MGY (784.10MGD)
325,464 MGY(892.5 MGD)
364,927 MGY(999 MGD)
403,948 MGY(1,106.5 MGD)
Projected demandsbased on LEC utilitysurvey: 443,411 MGY(1,214.8 MGD)
CSAs Public Waterpply Wellfield
stribution
Actual 1995locations
Modifications toeleven utilities'preferred wellfieldlocations (based onLEC utility survey)
Modifications toeleven utilities'preferred wellfieldlocations (based onLEC utility survey)
Modifications toeleven utilities'preferred wellfieldlocations (based onLEC utility survey)
Modifications toeleven utilities'preferred wellfieldlocations (based onLEC utility survey)
CSAs Waterortage Policy
Yes Yes Yes Yes Yes
C Irrigationmands on Surficialuifer System
Based on land useand climaticvariation
Based on projected1995 land use andclimatic variation
Same as LEC-1Revised
Same as LEC-1Revised
Based on projected2020 land use andclimatic variation
erationaljustments to Meet
FLs for Biscayneuifer
No Canal operationcriteria (Table 6)
Canal operationcriteria (Table 6)
Canal operationcriteria (Table 6)
Canal operationcriteria (Table 6)
8 Project Not constructed Not constructed Not constructed As per Restudy As per Restudy
oward Countycondary Canalstem
Not constructed Partial, the northernportion only
As per Restudy As per Restudy As per Restudy
iami-Dade UtilityR
Not constructed 25 MGD 50 MGD 75 MGD 75 MGD
iami-Dade Countyuse
Not constructed 0 MGD 0 MGD 0 MGD 50 MGD west facility131 MGD southfacility
timization ofgional ASR
Not applicable Not applicable Not applicable Excess water fromC-51 ASR and WestPalm BeachCatchment Area ASRsent to meet EAAdemands
Excess water fromC-51 ASR and WestPalm BeachCatchment Area ASRsent to meet EAAdemands
ke Istopokgamand and Runoff
12,000 ac-ftaverage annualdemands;6,000 ac-ft averageannual runoff
12,000 ac-ftaverage annualdemands;6,000 ac-ft averageannual runoff
12,000 ac-ft averageannual demands;6,000 ac-ft averageannual runoff
12,000 ac-ft averageannual demands;6,000 ac-ft averageannual runoff
12,000 ac-ft averageannual demands;6,000 ac-ft averageannual runoff
. Accounts for reduction due to construction of STAs and reservoirs
. WSE schedule was modified to incorporate operations associated with the Lake Okeechobee ASR, the EAA StorageReservoirs, and the North of Lake Okeechobee Storage Reservoir
. Modified supply-side schedule management accounts for storage available in reservoirs around Lake Okeechobee
. USACE, 1996
able 12. Comparison of Assumptions for Incremental Model Simulations by the SFWMM. (Continued)
Feature1995 Revised
Base Case 2005 2010 2015 LEC-1 Revised
110

LEC Regional Water Supply Plan - Planning Document Chapter 4: Analysis and Evaluation of Model Results
Additional Assumptions of Base Cases, Alternatives, andIncremental Simulations
Modifications to assumptions in the SFWMM were made to improve performanceand meet hydrologic targets. Additional assumptions were also made to updateinformation included in the SFWMM to reflect best available information. These changesare discussed below. To identify which simulations incorporated these assumptions, referto Tables 8 and 12.
Best Management Practice Make-Up Water
In previous analyses, it had been assumed that the implementation of BestManagement Practices (BMPs) in the EAA would reduce the volume of runoff from theEAA to the Everglades by 20 percent. According to the Everglades Forever Act, andsubsequent SFWMD rules, this reduction of flow must be offset by additional releasesfrom Lake Okeechobee. Now that the BMPs have been in place for five full years, actualrunoff data have been analyzed to quantify the change in runoff attributable to the BMPProgram. An extensive review of the available data conducted under the auspices of theEAA Environmental Protection District indicates that no measurable reduction in runoffhas occurred due to implementation of BMPs. Therefore, for the purposes of computermodeling to support the LEC Plan, no reduction in runoff and, consequently, no make-upwater deliveries were simulated. Ongoing rulemaking by the District on the make-upwater requirements will assess the quantity of runoff from the EAA, which will then beincorporated into future regional analyses.
Brighton Seminole Indian Reservation Demands
The Seminole Tribe has an existing compact1 with the SFWMD for waterdeliveries from Lake Okeechobee to meet supplemental irrigation demands of theBrighton Reservation. In the LEC Plan, the demand varies seasonally and annually with amaximum annual demand of 44,000 ac-ft and an average annual demand of 28,500 ac-ft.These demands differ from what was assumed during the Restudy.
Miccosukee Tribe of Indians Demands
The demands of the Miccosukee Tribe of Indians assumed in the regional watersupply planning process are based on representations of the Miccosukee Tribe as to theirwater needs for the next 20 years. No attempt was made in this planning process todetermine whether the Miccosukee Tribe of Indians has any federal legal right to therequested water quantities. As a result, the findings and the conclusions of the LEC Planare not intended to create or alter any rights to water the Miccosukee Tribe may currentlyhave or intend to perfect in the future under federal or state law. The Governing Boardencourages the Miccosukee Tribe to engage in negotiations with the District and the State
1. Water Rights Compact in 1987 which was enacted by Pub. L. No. 100-228, 101 Stat. 1556, and Chapter87-292, Laws of Florida, and codified in Section 285.165, Florida Administrative Code (F.A.C.)
111
Chapter 4: Analysis and Evaluation of Model Results LEC Regional Water Supply Plan - Planning Document
of Florida to achieve a mechanism for recognition of tribal water rights. The District willparticipate in any processes conducted to achieve this goal.
Caloosahatchee Basin Demands
The Caloosahatchee Basin demand projections used in the 1995 and 2020 basecases, 2020 with Restudy, and LEC-1 simulations were derived in the same fashion asthose assumed in the Restudy modeling. The 1995 Base Case is based on historicaldemands and the 2020 demand projection is 25 percent greater than in 1995. The Restudyassumed a 40 percent increase in demands in 2050 compared to 1995. The futuresupplemental irrigation demands are met from Lake Okeechobee in the 2020 Base Case.In the 2020 with Restudy and LEC-1 simulations, the future demands are met partiallyfrom the C-43 Reservoir and ASR facilities.
The demand projections that were developed for the CWMP form the basis for theevaluation of demands in the Caloosahatchee Basin in the incremental simulationsperformed for the LEC Plan. These demands were met from Lake Okeechobee in the 1995Revised Base Case and the 2005 and 2010 incremental simulations. In the 2015 and LEC-1 Revised regional model simulations, the demands were met from the C-43 Reservoir andASR system and a portion was met from Lake Okeechobee. In the incrementalsimulations, the demands in 2010, 2015, and LEC-1 Revised are capped at the sameaverage annual volume that can be provided in the 2020 with Restudy model simulation.In other words, the demands in the incremental simulations use the revised demands asprojected by the CWMP, but they are met from within the Caloosahatchee Basin once theC-43 Reservoir is constructed.
Caloosahatchee Basin Backpumping to Lake Okeechobee
One major difference between the 2020 with Restudy and LEC-1 modelsimulations is that in the LEC-1 simulation, no backpumping occurs from theCaloosahatchee Basin. This source of water to the lake is no longer considered available.This is also true for all incremental model simulations. This assumption will need furtherevaluation as the demand and runoff estimates developed by AFSIRS are part of theRestoration, Coordination, and Verification (RECOVER) process for the CERP.
Minimum Flows and Levels for the Biscayne Aquifer
The minimum water levels for coastal canals that are needed to protect thenorthern portion of the Biscayne aquifer were recently developed (SFWMD, 2000e).These minimum levels correlate to operation levels for eleven coastal canals as indicatedin Tables 8 and 12. These levels vary slightly from what was assumed during the Restudy.
Lake Istopokga Demands
Additional pasture land in the lower Lake Istopokga Basin is expected to beconverted to sugarcane in the near future, resulting in new demands and runoff. Seasonallyand annually varied demands and runoff from the lower Lake Istopokga Basin were used
112
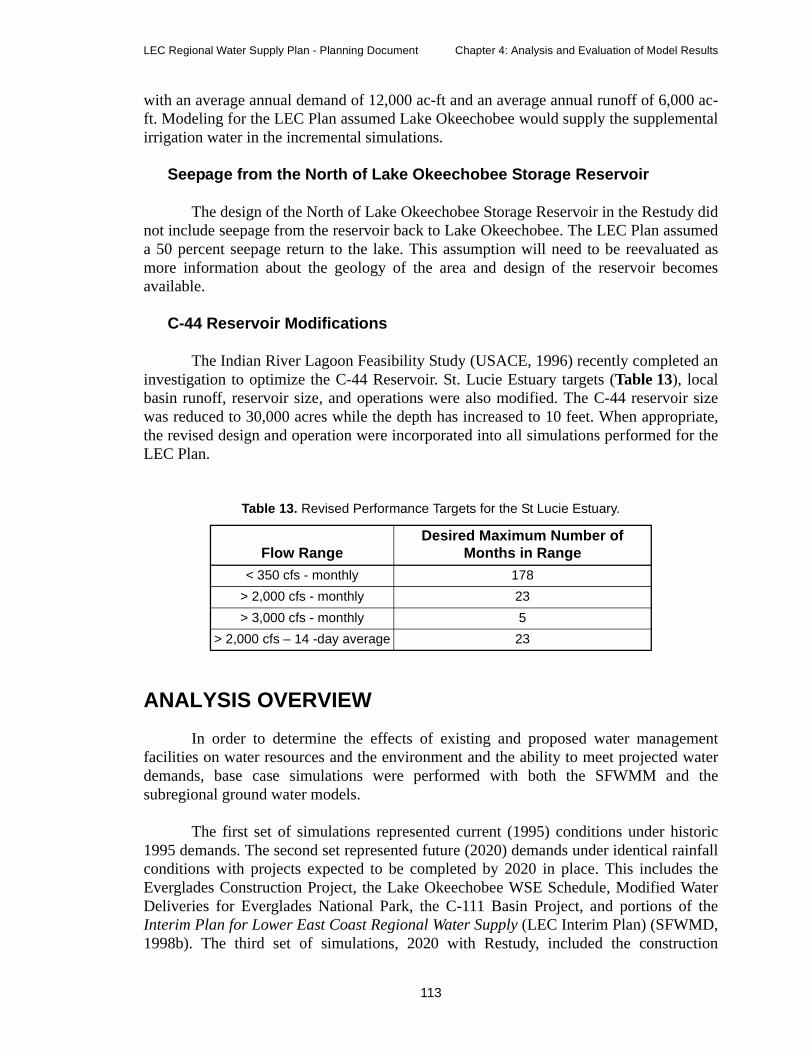
LEC Regional Water Supply Plan - Planning Document Chapter 4: Analysis and Evaluation of Model Results
with an average annual demand of 12,000 ac-ft and an average annual runoff of 6,000 ac-ft. Modeling for the LEC Plan assumed Lake Okeechobee would supply the supplementalirrigation water in the incremental simulations.
Seepage from the North of Lake Okeechobee Storage Reservoir
The design of the North of Lake Okeechobee Storage Reservoir in the Restudy didnot include seepage from the reservoir back to Lake Okeechobee. The LEC Plan assumeda 50 percent seepage return to the lake. This assumption will need to be reevaluated asmore information about the geology of the area and design of the reservoir becomesavailable.
C-44 Reservoir Modifications
The Indian River Lagoon Feasibility Study (USACE, 1996) recently completed aninvestigation to optimize the C-44 Reservoir. St. Lucie Estuary targets (Table 13), localbasin runoff, reservoir size, and operations were also modified. The C-44 reservoir sizewas reduced to 30,000 acres while the depth has increased to 10 feet. When appropriate,the revised design and operation were incorporated into all simulations performed for theLEC Plan.
ANALYSIS OVERVIEW
In order to determine the effects of existing and proposed water managementfacilities on water resources and the environment and the ability to meet projected waterdemands, base case simulations were performed with both the SFWMM and thesubregional ground water models.
The first set of simulations represented current (1995) conditions under historic1995 demands. The second set represented future (2020) demands under identical rainfallconditions with projects expected to be completed by 2020 in place. This includes theEverglades Construction Project, the Lake Okeechobee WSE Schedule, Modified WaterDeliveries for Everglades National Park, the C-111 Basin Project, and portions of theInterim Plan for Lower East Coast Regional Water Supply (LEC Interim Plan) (SFWMD,1998b). The third set of simulations, 2020 with Restudy, included the construction
Table 13. Revised Performance Targets for the St Lucie Estuary.
Flow RangeDesired Maximum Number of
Months in Range
< 350 cfs - monthly 178
> 2,000 cfs - monthly 23
> 3,000 cfs - monthly 5
> 2,000 cfs – 14 -day average 23
113

Chapter 4: Analysis and Evaluation of Model Results LEC Regional Water Supply Plan - Planning Document
projects and operational features of the Restudy that are expected to be in place by 2020.The fourth set, LEC-1, includes all features of the previous simulation plus additionalfeatures and operational changes that are specific to this plan, such as redistribution ofwellfields, implementation of selected water supply development options, and refinementsconcerning implementation of the water resource development projects which are beingmade in the CERP. Areas that performed well were identified by applying the planningcriteria and performance measure targets such as MFLs, 1-in-10 year level of certainty,and resource protection criteria.
Given the large number of criteria applied and the large number of areas evaluatedin the LEC Planning Area, a simplified approach was used to display evaluations. Theperformance of a model simulation is summarized as green, yellow, or red for eachevaluation criterion, based on the ability to meet an environmental criterion/target. Thecolor provides an assessment of the ability of the plan to achieve the resource protection,recovery, and/or long-term sustainability objectives defined by the performancemeasure(s) and best professional judgement. Green means that the combination of featuresin the model simulation is likely to meet the management objective described by theperformance measure. Yellow means that achievement of the objective is marginal oruncertain and that improvement is needed or that the hydrologic target is not defined. Redmeans that the objective may not be met. The color coding scheme is similar to that usedin the Restudy to assess the overall performance of the recommended components whencompared to the no action alternative.
The Caloosahatchee Basin performance was analyzed in the CWMP. Therecommendations made in the CWMP that are pertinent to the LEC planning process canbe found in Chapter 6 of this plan (Recommendations 28, 29, 30, and 35).
URBAN AND AGRICULTURAL WATER SUPPLYRESULTS
This section presents and discusses the results of LEC Plan base cases,alternatives, and incremental evaluations with regard to urban and agricultural watersupply. Results are first presented for the Lake Okeechobee Service Area (LOSA) andthen for the LEC Service Areas (LECSAs): North Palm Beach Service Area, Lower EastCoast Service Area 1 (LECSA 1), Lower East Coast Service Area 2 (LECSA 2), andLower East Coast Service Area (LECSA 3). For each service area, discussion of theresults is followed by a summary. The service areas themselves are delineated anddescribed in Chapter 3. The results are evaluated in terms of water supply performancegoals, which have been described in Chapter 2 and previously in this chapter.Descriptions of the key assumptions of the base cases, alternatives, and incrementalsimulations have been presented in the water and land use assumptions section of thischapter.
114

LEC Regional Water Supply Plan - Planning Document Chapter 4: Analysis and Evaluation of Model Results
Lake Okeechobee Service Area
The Lake Okeechobee Service Area (LOSA) includes those areas for which LakeOkeechobee is the primary direct storage source. The major subbasins within the LOSAinclude the EAA, the Caloosahatchee Basin (C-43 Basin), the St. Lucie Canal Basin (C-44Basin), the Brighton Seminole Indian Reservation, the Lower Lake Istokpoga Basin, andthe Big Cypress Seminole Reservation (see Figure 17 in Chapter 3).
In the LOSA, water supply evaluations were made using the SFWMM whichperforms simulations for the 31-year period from 1965 through 1995. For the purpose ofwater supply evaluations in this largely agricultural area, a water year (from October toSeptember), rather than a calendar year, has been used. Thirty complete water years arecovered by the simulation period.
Performance Measures Applied
The key water supply performance goal for the LOSA is that no more than threewater years with significant water shortages occur during the simulation period. A watershortage is generally considered significant when greater than 100,000 ac-ft of demandsare not met. This performance measure is obtained from a frequency of water restrictionsperformance graphic (see Figure D-1 in Appendix D for an example and Appendix H foractual model results), combined with analysis of the total volume of water restricted froma supply-side management report (see Appendix H). During the simulations, a watershortage is recorded when the SFWMM recognizes that regional water storage conditionsoccur which meet the conditions under which the District will impose supply-sidemanagement restrictions on the LOSA. Supply-side management procedures and theirapplication within the LEC Plan evaluations are more completely explained in Chapter 3.
If there are significant supply-side management cutbacks during more than threeof the water years in the simulation period, the goal of providing a 1-in-10 year level ofcertainty is not met. One way to look at the significance of these events is to consider thesupply-side management cutback volumes for the fourth and fifth worst drought years in asimulation. This information is provided in the last row of the information tables in theresults sections below. In considering the supply-side management volumes, it isimportant to remember that the LOSA contains 600,000 to 700,000 acres of irrigatedlands, so that 100,000 ac-ft of supply-side cutbacks implies a delivery deficit of about twoinches spread over the irrigated lands in the service area during a 12-month crop year.
Base Cases and Alternatives Results
Information regarding the water supply performance under the base cases andalternatives is presented in Table 14. The first row in Table 14 provides the number ofwater years with significant water shortage events while the second row provides the totalnumber of water years in which any water shortage event occurs. The remaininginformation in Table 14 further clarifies the significance of the water restrictions and theperformance pattern that may be achieved through 2020.
115

Chapter 4: Analysis and Evaluation of Model Results LEC Regional Water Supply Plan - Planning Document
1995 Base Case. Water restrictions occur for eight of the 30 water yearssimulated in the 1995 Base Case and the total number of months of water shortages are 32.The supply-side management cutback volumes were high (over 300,000 ac-ft) for all ofthe three worst drought years. The supply-side management volumes in the fourth andfifth worst cutback years were 125,000 and 64,000 ac-ft, respectively. The 125,000 ac-ftof restrictions in 1990 indicated an inability to meet the 1-in-10 year level of certaintygoal.
2020 Base Case. Water restrictions occurred for 16 of the 30 water yearssimulated in the 2020 Base Case and the total number of months of water shortages were79. As with the 1995 Base Case, the supply-side management cutback volumes were high(over 300,000 ac-ft) for all of the three worst drought years. The supply-side managementcutback volumes for the fourth and fifth worst years were close to 400,000 acre feet,which could easily lead to significant crop losses. In fact, cutbacks over 100,000 ac-ftoccurred in nine of the years.
2020 with Restudy. The 2020 with Restudy simulation had five years withwater restrictions and the total number of months of water shortages for the 2020 withRestudy were 23. The second and third worst years were significantly lower (212,000 and135,000 ac-ft, respectively) for the 2020 with Restudy than for the base cases. The fourthand fifth worst years had restrictions of 20,000 and 16,000 ac-ft, respectively. Thevolumes of these cutbacks would not lead to significant crop losses. Based on the supply-side management cutbacks, the 2020 with Restudy alternative met the 1-in-10 year levelof certainty goal for the LOSA.
LEC-1. The LEC-1 simulation also had five years with water restrictions. Thetotal months of water shortages for this simulation were 18. The supply-side managementcutback volumes were lower than those for the 2020 with Restudy and would not lead tosignificant crop losses. Based on the supply-side management cutbacks, the LEC-1 met
Table 14. Information on All Water Restrictions in the SFWMM Simulations for the Base Casesand Alternatives for the Lake Okeechobee Service Area.
1995 BaseCase
2020 BaseCase
2020 withRestudy LEC-1
Number of water years with significantshortages
4 9 3 2
Number of water years with shortages inone or more months
8 16 5 5
Total months of water shortages 32 79 23 18
Total supply-side management cutbackvolume (ac-ft) for 31-year period
1,419,000 3,894,000 859,000 709,000
Supply-side management cutback volumesfor the three worst drought years
198119741982
---
509,000355,000318,000
197419901981
---
491,000490,000435,000
198119821990
---
464,000212,000135,000
198119821990
---
381,000182,000
81,000
Supply-side management cutback volumesfor the fourth and fifth worst drought years
19901973
--
125,00064,000
19821989
--
396,000388,000
19741991
--
20,00016,000
19761978
--
30,00018,000
116

LEC Regional Water Supply Plan - Planning Document Chapter 4: Analysis and Evaluation of Model Results
the 1-in-10 year level of certainty goal for the LOSA. Supply-side management cutbackswere greater than 100,000 ac-ft and would be considered significant in only two of theyears simulated.
Incremental Results
Information regarding the water supply performance in the incrementalsimulations is presented in Table 15. The first row in Table 15 shows the number of wateryears with significant water shortage events while the second row provides the number ofwater years in which any water shortage event occurs. The remaining information inTable 15 further clarifies the significance of the water restrictions and the performancepattern that may be achieved through 2020.
1995 Revised Base Case. The number of water years with water restrictionsfor the 1995 Revised Base Case simulations were nine and the total number of months ofwater shortages were 37. These were worse than the original 1995 Base Case dueprimarily to the inclusion of revised Caloosahatchee hydrology and agricultural demandsand the inclusion of the Seminole Big Cypress Reservation demands in the revised
Table 15. Information on Water Restrictions in the SFWMM Incremental Simulations for the LOSA.
1995 RevisedBase Case 2005
2005 SSMScenario 2010 2015
LEC-1Revised
Number of wateryears withsignificantshortages
5 7 5 6a
a. Performance could be improved by continuing supply-side flexibility or other option applied to 2005 SSM Scenariothrough 2010.
3 1
Number of wateryears withshortages in oneor more months
9 11 7 9 6 4
Total months ofshortages
37 47 35 36 21 12
Total supply-sidemanagementcutback volume(ac-ft) for 31-yearperiod
1,878,000 2,571,000 1,693,000 1,496,000 860,000 432,000
Supply-sidemanagementcutback volumesfor three worstdrought years
198219741981
---
461,000417,000339,000
198119741982
---
472,000463,000462,000
198219741981
---
445,000403,000312,000
197419811982
---
390,000379,000201,000
198119741976
---
305,000233,000145,000
198119821990
---
294,00095,00031,000
Supply-sidemanagementcutback volumesfor fourth and fifthworst droughtyears
19731990
--
228,000197,000
19731990
--
351,000320,000
19731990
--
213,000171,000
19761973
--
148,000129,000
19821990
--
102,00056,000
1978 - 5,000
117

Chapter 4: Analysis and Evaluation of Model Results LEC Regional Water Supply Plan - Planning Document
simulation. The supply-side cutback volumes were high (over 300,000 ac-ft) for the threeworst drought years in the 1995 Revised Base Case simulation. The supply-sidemanagement cutback volumes for the fourth and fifth worst years were 228,000 and197,000 ac-ft, respectively, which represented significant delivery deficits.
2005. The total number of years with water shortages (11) and total number ofmonths of water shortages (47) increased during the 2005 incremental simulation. Thesupply-side cutback volumes were over 400,000 ac-ft for all of the three worst droughtyears and the fourth and fifth worst drought years still had significant shortages withsupply-side management cutback volumes over 300,000 ac-ft. The increase in shortagesbetween the 1995 Base Case and 2005 simulations can be attributed to a number offactors: 1) the implementation of the Everglades Construction Project in combination withthe Lake Okeechobee WSE regulation schedule allowed more lake water to be transferredto the WCAs, which resulted in a lower lake level going into some drought years; 2) theincorporation of rain-driven schedules for the WCAs and Everglades National Parkresulted in more urban area demand being satisfied by Lake Okeechobee and less relianceon the WCAs for urban water supply; 3) an increase in agricultural demand in the LakeIstokpoga Service Area was satisfied by Lake Okeechobee in order to achieveenvironmental objectives in Lake Istokpoga; and 4) land taken out of production for theEverglades Construction Project resulted in an increase in agricultural demand in theCaloosahatchee Basin. These additional demands were expected to occur prior tocompletion of any significant storage features recommended by the Restudy.
2005 SSM Scenario. With the operational flexibility of the supply-sidemanagement criteria, the total number of years with shortages was reduced to seven in the2005 SSM Scenario. The total number of months of water shortages (35) was also reducedin this simulation. Two of the worst shortages in the 2005 SSM Scenario were over400,000 ac-ft and the third was just over 300,000 ac-ft. This performance was better thanboth the original 2005 incremental simulation and the 1995 Revised Base Case. Thevolumes of cutbacks were 213,000 and 171,000 ac-ft for the fourth and fifth worstdroughts, respectively, which represent improvements over the volumes of cutbacks in the1995 Revised Base Case. Modification of the supply-side management criteria, or anequivalent operational schedule change, would improve upon the ability to achieve a 1-in-10 year level of certainty in the LOSA.
2010. The total number of years with shortages in the 2010 incrementalsimulation was nine and the total number of months of water shortages was 36. In thissimulation, the volume of cutbacks was significantly less than that of the 1995 RevisedBase Case, even though the years and months of shortages were about the same. For the2010 incremental simulation, the worst two years had close to 400,000 ac-ft of supply-sideshortages while the third worst year had significantly less cutbacks at 201,000 ac-ft. Thecutbacks for the fourth and fifth worst drought years were 148,000 and 129,000 ac-ft,respectively, which were substantially less than previous simulations. This was the firstsign that Restudy infrastructure is making water supply conditions better than the 1995Revised Base Case. The 2010 performance could be improved further by implementing aninterim operational change such as modification of the supply-side management criteria.
118

LEC Regional Water Supply Plan - Planning Document Chapter 4: Analysis and Evaluation of Model Results
2015. The total number of years with shortages (six) and the total number ofmonths of water shortages (21) for the 2015 incremental simulation were reduced whencompared to previous simulations. The improvement in supply-side cutback volumeswhich began in the 2010 simulation continued in the 2015 simulation. The third worstsupply-side management event shows only 145,000 ac-ft of supply-side managementcutbacks. The fourth and fifth worst years had supply-side management cutbacks of102,000 and 56,000 ac-ft, respectively, and it is unlikely that they would cause significantreductions in crop yields. The 1-in-10 year level of certainty was met during the 2015simulation.
LEC-1 Revised. The LEC-1 Revised simulation's performance improved whencompared to the original LEC-1 simulation. The chief reasons for this appear to be thechanged configuration and operations of the EAA Storage Reservoirs, capture and storageof runoff from the Hillsboro Basin, and use of water from the C-51 and West Palm BeachASR systems to meet demands in the EAA. The total number of months of watershortages and the volumes of cutbacks were reduced when compared to previousincremental simulations. The third worst supply-side management event had only 31,000ac-ft of cutbacks and the fourth worst year of cutbacks was only 5,000 ac-ft, which isclearly insignificant. The results indicate that the LEC-1 Revised alternative met the1-in-10 year level of certainty.
Summary of Results for the Lake Okeechobee Service Area
• The poor water supply performance of the 1995 and 2020 basecases indicated that significant water resource developmentefforts will be needed to achieve a 1-in-10 year level of certaintyfor water users in the LOSA.
• The 2020 with Restudy, LEC-1, and LEC-1 Revised modelsimulations, which contain the projects recommended in theRestudy as their primary water resource developmentcomponents, were capable of meeting 1-in-10 year level ofcertainty performance within the LOSA.
• The incremental simulations indicate improvements to the abilityto meet the LOSA's demands will occur as Restudy projects areimplemented and performance improves between 1995 and 2020.
• The incremental simulations indicate that the 1-in-10 year levelof certainty water supply performance can be met by 2015 in theLOSA.
• The incremental simulations indicate that optimization in thedesign and operation of the Restudy projects can significantlyimprove the performance that was originally estimated in theRestudy. These refinements to the Restudy projects will beincluded in the recommendations to the CERP.
• Actions such as CERP acceleration, changes to supply-sidemanagement criteria, or other operational improvements are
119

Chapter 4: Analysis and Evaluation of Model Results LEC Regional Water Supply Plan - Planning Document
needed to reduce the risk of water shortage losses in the interimperiod. The 2005 SSM Scenario demonstrated that flexibility inthe application of supply-side management is one tool that couldbe used to meet water demands during droughts in the interimperiod until water resource development projects werecompleted. Other operational options should also be investigated.
Specific Analyses Related to the Seminole Tribe of Florida
In 1996, the Agreement Between the South Florida Water Management Districtand the Seminole Tribe of Florida Providing for Water Quality, Water Supply, and FloodControl Plans for the Big Cypress Seminole Indian Reservation and the Brighton SeminoleIndian Reservation, Implementing Section V.C. and VI.D. of the Water Rights Compact(Seminole Agreement) was executed. The Seminole Agreement obligated the District toconduct several studies related to the quantity of surface water supply for the Big CypressSeminole Indian Reservation. Additional studies related to water supply for the BrightonSeminole Indian Reservation were also agreed upon. As required, the studies are includedas integral parts of the District's LEC regional water supply planning effort. Whileanalyses of these issues are included in this plan, the Seminole Agreement obligates theDistrict to give ongoing consideration of impacts to the Seminole Tribe's rights as plansand/or changes are reviewed in the future. The Seminole Agreement states the BigCypress Seminole Indian Reservation studies will determine the following:
• The amount and timing of deliveries needed for hydroperiodrestoration in the northwest corner of WCA-3A, as a part ofEverglades Forever Act implementation
• The potential effect of the Everglades Program on the tribe'sability to use the alternative water supply delivery system(contemplated in Subsection 6) on the Big Cypress SeminoleIndian Reservation resulting from diversion of the C-139 Basinand, if diverted, the C-139 Annex
• The potential effect of revising Lake Okeechobee's regulationschedule on available water supply for the Big Cypress SeminoleIndian Reservation, if water from Lake Okeechobee is part of thewater supply for the reservation
• The potential effect of District water supply plans and Evergladeshydropattern changes, which may be developed and adopted inthe future, on available surface water supplies from LakeOkeechobee for the Brighton Seminole Indian Reservation
• The potential effect of changes to Lake Okeechobee's regulationschedule, which may be developed and adopted in the future, onavailable surface water supplies from Lake Okeechobee for theBrighton Seminole Indian Reservation
120
LEC Regional Water Supply Plan - Planning Document Chapter 4: Analysis and Evaluation of Model Results
• The potential effect, if any, of implementation of the EvergladesProgram on the available surface water supplies from LakeOkeechobee for the Brighton Seminole Indian Reservation
A summary of the District’s efforts in regard to these studies is summarized below.
Northwestern Corner of WCA-3A Hydroperiod Restoration. As part ofthe LEC regional water supply planning process, District staff utilized measures ofhydroperiod (inundation duration), and the number of times high water criteria wereexceeded, and the number of times water fell below the low water criteria to evaluatesimulated performance in northwestern corner of WCA-3A under various modeledalternatives. These performance measures and the results of the evaluations are describedin detail in the Environmental Resources Results section of this chapter. In summary,under current conditions (simulated by the 1995 Base Case) hydroperiod performance inthe northwestern corner of WCA-3A failed to achieve desired targets, while in the 2020with Restudy simulation, hydroperiods in the same area either met or exceeded theperformance targets established in the planning process for hydroperiod restoration.
Effect of the Everglades Program. The Everglades Program's projects areincluded in the assumptions for alternatives modeled for the LEC Plan. The effect on theSeminole Tribe of Florida of these assumptions is evident by comparison of the 1995 BaseCase (without Everglades Program projects) with results of alternative model simulations,that include the Everglades Program projects. Historically, the Big Cypress SeminoleIndian Reservation did not rely upon surface water deliveries from the L-4 Canal. Becausethe Everglades Program and the Seminole Agreement contemplate surface waterdeliveries to Big Cypress Seminole Indian Reservation via pump station G-409, theSeminole Tribe's water demands are included as input files in the model simulationsperformed for the LEC water supply planning process. The amount and timing of thesewater deliveries were determined using demand estimates based on land use projections inthe 2010 incremental simulation and calculated over the 31-year simulation period usingthe Blaney-Criddle method. These deliveries exceed the Seminole Tribe's surface waterentitlement as established in the Final Order 98-115 DAO, except in wet months whendemands were less than the entitlement (Figure 25). In summary, the Seminole Tribe'ssurface water demands are satisfied most of the time from a variety of sources. As projectsassociated with the CERP and the LEC regional water supply planning effort becomeoperational, modeling indicates the Seminole Tribe's unmet demands decrease from 15percent in the 1995 Base Case to less than two percent of the time by 2020. Due to BigCypress Seminole Indian Reservation reliance on Lake Okeechobee supplies, the effectsof regulation schedule changes on the Big Cypress Seminole Indian Reservation areintegrated in these results, as described below.
Effects of Lake Okeechobee Regulation Schedule Changes. LakeOkeechobee's regulation schedule is an integral component of each alternative modelsimulation. Since various Lake Okeechobee regulation schedules were considered, severalmodel simulations were completed to assess the effects of Lake Okeechobee's regulationschedule, as well as other C&SF Project modifications. As noted above, the SeminoleTribe's surface water demands for both the Big Cypress Seminole Indian Reservation and
121

Chapter 4: Analysis and Evaluation of Model Results LEC Regional Water Supply Plan - Planning Document
the Brighton Seminole Indian Reservation were included in input files, where applicable,for these model simulations. Tables 16 and 17 specify the Lake Okeechobee regulationschedule used for each simulation.
Table 16. Comparison of Assumptions for the Base Case and Alternative Simulations.
Simulation Lake Okeechobee Schedule
1995 Base Case Run 25
2020 Base Case WSE
2020 with Restudy Run 25 modified for Restudy components
LEC-1 WSE modified for Restudy components
Table 17. Assumptions for the Incremental Model Simulations by SFWMM.
Simulation Lake Okeechobee Schedule
1995 Revised Base Case Run 25
2005 WSE
2005 SSM Scenario WSE modified for supply-side management
2010 WSE modified for Restudy components
2015 WSE modified for Restudy components
LEC-1 Revised WSE modified for Restudy components
1995 Revised 2005 2010 2015 LEC-10 0
16 16
32 32
48 48
64 64
80 80
Supplie
s/S
hort
ages (
1,0
00 a
c-f
t) Supplies/S
hortages (1,000 ac-ft)from local sourcesfrom STA 6from Rotenberger WMAfrom Lake Okeechobee
20
29
9
20
1
8
22
7
20
1
9
25
2
20
1
9
26
1
20
2
9
26
1
15.1% 11.8% 3.4% 2.3% 1.6%
unmet demand
Base Case Revised
Figure 26. Average Annual (1965-1995) Irrigation Supplies and Shortages for the SeminoleTribe Big Cypress Reservation. The data on top of each bar represents thepercentage of unmet demands.
122
LEC Regional Water Supply Plan - Planning Document Chapter 4: Analysis and Evaluation of Model Results
Given the operational components and agreements between the District and theSeminole Tribe, additional matters related to the Brighton Seminole Indian Reservationmust be considered. The Seminole Agreement reserves a volume of water from LakeOkeechobee for the Seminole Tribe, integrates supply from Lake Okeechobee to meet theSeminole Tribe's entitlement, and establishes operational criteria for water shortages.Generally, the operational criteria are based upon canal water elevations. Pump stationsG-207 and G-208 have intake elevations at 10 feet, which are also integral to the ability ofthe pumps to provide Lake Okeechobee water to the Brighton Seminole IndianReservation. Analysis of Lake Okeechobee stage duration curves indicates that LakeOkeechobee levels drop below 11 feet (where pump efficiency is reduced) four to fivepercent of the time in the LEC-1 simulation compared to three percent of the time thatobserved lake stages dropped below 11 feet during the 1952 to 1977 period (Marban andTrimble, 1988).
Lower East Coast Service Areas
For planning purposes, the coastal areas east of the Everglades has been dividedinto four service areas: North Palm Beach Service Area, LEC Service Area 1 (LECSA 1),LEC Service Area 2 (LECSA 2), and LEC Service Area 3 (LECSA 3). The service areasgenerally reflect the historical sources of water delivered from the regional system.LECSA 1 includes coastal basins, which receive water from WCA-1. Likewise LECSA 2and LECSA 3 include coastal basins which receive water from WCA-2 and WCA-3,respectively. The North Palm Beach Service Area has historically received water fromLake Okeechobee via the L-8 and the M canals. More complete descriptions of these areasand figures showing their extent (Figures 19, 20, 21, and 22) are provided in Chapter 3.
Two situations will cause declarations of water shortages to be simulated in thethese service areas. The first situation occurs when supply-side management is imposed inthe LOSA for longer than seven days. This indicates that water from regional storagemight not be available and cutbacks in usage and deliveries at this time may be needed tosave water for more crucial times later in the dry season. The other situation occurs whenground water levels at coastal saltwater intrusion monitoring locations indicate that waterrestrictions are necessary to minimize saltwater intrusion. Note that the SFWMM can onlyprovide generalized indications regarding water levels at coastal saltwater intrusionmonitoring locations because of the large (two-mile by two-mile) grid cell size used in thismodel. Because of this limitation, performance at the coastal ground water monitoringlocations is also analyzed in the subregional ground water models. The incrementalsimulations do not include results from the subregional ground water models for the LECservice areas and, therefore, the incremental analyses should be considered preliminaryand are not indicative of future performance.
SFWMM Base Cases and Alternatives Results
During the 30 water years simulated, the numbers of years water restrictionsoccurred within the LEC service areas due to Lake Okeechobee supply-side managementwere five for the 1995 Base Case, 11 for the 2020 Base Case, three for the 2020 with
123
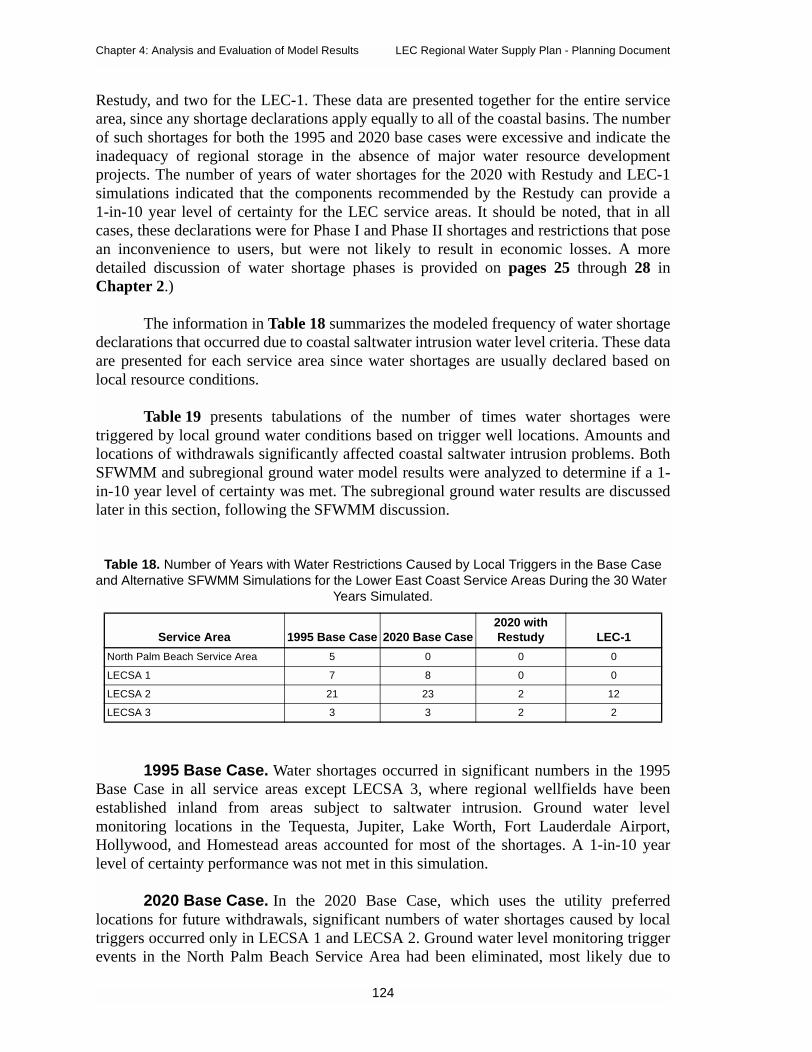
Chapter 4: Analysis and Evaluation of Model Results LEC Regional Water Supply Plan - Planning Document
Restudy, and two for the LEC-1. These data are presented together for the entire servicearea, since any shortage declarations apply equally to all of the coastal basins. The numberof such shortages for both the 1995 and 2020 base cases were excessive and indicate theinadequacy of regional storage in the absence of major water resource developmentprojects. The number of years of water shortages for the 2020 with Restudy and LEC-1simulations indicated that the components recommended by the Restudy can provide a1-in-10 year level of certainty for the LEC service areas. It should be noted, that in allcases, these declarations were for Phase I and Phase II shortages and restrictions that posean inconvenience to users, but were not likely to result in economic losses. A moredetailed discussion of water shortage phases is provided on pages 25 through 28 inChapter 2.)
The information in Table 18 summarizes the modeled frequency of water shortagedeclarations that occurred due to coastal saltwater intrusion water level criteria. These dataare presented for each service area since water shortages are usually declared based onlocal resource conditions.
Table 19 presents tabulations of the number of times water shortages weretriggered by local ground water conditions based on trigger well locations. Amounts andlocations of withdrawals significantly affected coastal saltwater intrusion problems. BothSFWMM and subregional ground water model results were analyzed to determine if a 1-in-10 year level of certainty was met. The subregional ground water results are discussedlater in this section, following the SFWMM discussion.
1995 Base Case. Water shortages occurred in significant numbers in the 1995Base Case in all service areas except LECSA 3, where regional wellfields have beenestablished inland from areas subject to saltwater intrusion. Ground water levelmonitoring locations in the Tequesta, Jupiter, Lake Worth, Fort Lauderdale Airport,Hollywood, and Homestead areas accounted for most of the shortages. A 1-in-10 yearlevel of certainty performance was not met in this simulation.
2020 Base Case. In the 2020 Base Case, which uses the utility preferredlocations for future withdrawals, significant numbers of water shortages caused by localtriggers occurred only in LECSA 1 and LECSA 2. Ground water level monitoring triggerevents in the North Palm Beach Service Area had been eliminated, most likely due to
Table 18. Number of Years with Water Restrictions Caused by Local Triggers in the Base Caseand Alternative SFWMM Simulations for the Lower East Coast Service Areas During the 30 Water
Years Simulated.
Service Area 1995 Base Case 2020 Base Case2020 withRestudy LEC-1
North Palm Beach Service Area 5 0 0 0
LECSA 1 7 8 0 0
LECSA 2 21 23 2 12
LECSA 3 3 3 2 2
124

LEC Regional Water Supply Plan - Planning Document Chapter 4: Analysis and Evaluation of Model Results
assuming that a recharge canal exists and the use of Floridan aquifer water was increased.Lake Worth, Fort Lauderdale Airport, and Hollywood areas continued to indicate lowground water levels. Trigger events increased in Lauderdale and Cutler Ridge compared tothe 1995 Base Case. A 1-in-10 year level of certainty performance was not met in thissimulation.
2020 with Restudy. In the 2020 with Restudy model simulation, not only wasthe Restudy infrastructure through 2020 modeled as having been completed, butsignificant public water supply demands were redistributed within the service area as well.Eastern wellfields at Miramar, Hollywood, Broward County 3A/3B/3C, Dania, andHallandale were assumed to be placed on standby, with their entire demands met fromwestern facilities. The following utilities had a portion of their demands shifted inland:Riviera, Lake Worth, Manalapan, Lantana, Boca Raton, and Florida City. Theseassumptions were consistent with the Restudy's recommendations. Based on coastalground water levels, all four service areas met the 1-in-10 year level of certainty. Noground water level triggering occurred in the North Palm Beach Service Area or LECSA 1during the 2020 with Restudy simulation (Table 18). In LECSA 3, the two years of locallytriggered water shortages can be discounted because they were caused exclusively by theTaylor monitoring location, which triggered even when public water supply withdrawalswere eliminated (see results for the LEC-1A simulation). The two cutback events thatoccurred in LECSA 2 were caused by coastal ground water level monitoring locations inthe Hollywood, North Lauderdale, and Fort Lauderdale Airport areas. These eventsoccurred during 1971 and 1975 and not during the 1-in-10 drought year identified andused for the ground water model simulations discussed below. The 2020 with Restudysimulation solved the low ground water level in this area, as seen in the 2020 Base Case,by placing the coastal wellfields in southeast Broward County on standby.
Table 19. Number of Times Water Restriction Triggers in the SFWMM Base Case and Alternativesfor the Lower East Coast Service Area Were Triggered.a
Trigger Well1995
Base Case2020
Base Case 2020 with Restudy LEC-1 LEC-1ATequesta 5
Jupiter 4
Gardens
Lake Worth 11 13
Pompano 1
North Lauderdale 3 3 3 3
Lauderdale 4 19 + (4)
Fort Lauderdale Airport 27 + (1) 31 + (2) 1 2
Hollywood 54 + (2) 61 + (6) 4 17
North Miami Beach 1 1
Miami 1
Cutler Ridge 1 6
Homestead 5 5
Florida City 2 3
Taylor 3 4 5 5 5
a. Phase 2 in parentheses, all others are Phase 1
125

Chapter 4: Analysis and Evaluation of Model Results LEC Regional Water Supply Plan - Planning Document
LEC-1. In the LEC-1 model simulation, not only was the Restudy infrastructurethrough 2020 modeled as complete, but different wellfield withdrawals and distributionswere modeled compared to the 2020 with Restudy. In the LEC-1 model simulation, NorthPalm Beach Service Area, LECSA 1, and LECSA 3 met the 1-in-10 year level of certaintybased on coastal ground water conditions. No ground water level triggering occurred inthe North Palm Beach Service Area or LECSA 1 during the LEC-1 simulation. In LECSA3, only the same nonwithdrawal related triggers occurred at Taylor. However, twelve yearsof coastal saltwater intrusion triggers occurred in LECSA 2 (Table 18). They primarilyoccurred at the coastal ground water level monitoring location in the Hollywood area. Afew triggers also occurred in the North Lauderdale and Fort Lauderdale Airport areas(Table 19). In this case, restrictions did occur during the 1-in-10 drought year that wasidentified and used for the subregional ground water model simulations discussed below.Because the utility preferred locations for withdrawals were the basis for the LEC-1simulations, a greater volume of public water supply withdrawals remained at the currentlocations along the coast near the saline interface than in the 2020 with Restudysimulation, especially in southeast Broward County. The potential for saltwater intrusiondue to public water supply withdrawals was high and this area was very sensitive to publicwater supply withdrawal amounts and locations simulated in LEC-1. The utility preferredlocations as modified in LEC-1 indicated that a smaller volume of withdrawals may needto be moved away from the coast than was moved during the 2020 with Restudysimulation. The higher number of water restrictions in LEC-1 in the Hollywood area couldbe reduced to meet a 1-in-10 year level of certainty as seen in the 2020 with Restudysimulation. Model iterations with different wellfield distributions would demonstrate this.
The SFWMM simulations indicated that with the planned water resourcedevelopment projects and appropriate water supply development (in the form of locationsof demands that meet existing permit criteria), water shortages will occur only about oneyear in ten. It is important, however, to look at the ability to meet demands during a 1-in-10 year drought event with the high resolution ground water models. This is the focus ofevaluation of subregional ground water model results.
Subregional Ground Water Models Base Case and Alternatives
The numbers of years when water restrictions within the LEC service areas werecaused by Lake Okeechobee supply-side management during the 30 water years simulatedwere five for the 1995 Base Case, 11 for the 2020 Base Case, three for the 2020 withRestudy, and two for the LEC-1. These data are presented together for all of the serviceareas since any shortage declarations apply equally to all of the coastal basins. Thenumber of such shortages for the 1995 and 2020 base cases were excessive and indicatedthe inadequacy of regional storage in the absence of major water resource developmentprojects. The number of years of water shortages for the 2020 with Restudy and LEC-1simulations indicated that the components recommended by the Restudy can provide a1-in-10 year level of certainty for the LEC service areas.
126
LEC Regional Water Supply Plan - Planning Document Chapter 4: Analysis and Evaluation of Model Results
Five subregional ground water models were used to evaluate the ability to meet a1-in-10 year level of certainty in the LEC service areas. They provided a more detailedlook at water conditions compared to the SFWMM, because of their fine grid cell size,generally 500-feet by 500-feet, compared to the two-mile by two-mile cell for theSFWMM. Because of the detail involved in simulations of these models, they were theprimary tool used to evaluate performance during a historic period that closely matches a1-in-10 year drought event. This detail allowed performance to be evaluated in terms ofthree water resource conditions during that 1-in-10 year drought event:
• The triggering of water shortages was evaluated based on waterlevels at selected monitoring locations. This measure paralleledthe water shortage triggering evaluated in the SFWMM, butprovided much more location specificity, because of the fine gridcell size.
• Potential movement of the saltwater interface was evaluated byconsidering the net westward flow across the present location ofthe saltwater interface for the year that represented the 1-in-10year drought condition.
• Potential impacts on wetlands were evaluated by consideringground water level drawdown events of one foot or more underidentified wetland areas. An event occurred when the 30-dayaverage head differed, between the simulation and the noconsumptive use withdrawals simulation, by one foot or more.
Despite the detail of the ground water models, the model results are not predictive.They are not necessarily representative of actual local conditions, either now or in thefuture. Thus, failure to identify problems in the model simulations in this plan does notensure issuance, reissuance, or modification of water use permits, nor does it ensure that aproblem does not exist.
Results of the evaluations of the ground water model results for the 2020 withRestudy and LEC-1 alternatives, with respect to the three performance areas, arepresented in Table 20.
127

Chapter 4: Analysis and Evaluation of Model Results LEC Regional Water Supply Plan - Planning Document
Table 20. Water Supply Results for Ground Water Model Simulations of the 2020 with Restudyand the LEC-1 Alternatives.a
WaterRestriction
Area
Coastal Water ShortageTriggers During LEC 1-in-10
Year Drought Conditions
Net Westward Ground WaterFlow at the Saltwater Interface
During LEC 1-in-10 YearDrought Conditions
Impacts on IsolatedWetlands During LEC1-in-10 Year Drought
ConditionsNorth Palm Beach
Jupiter No indicated problems Tequesta: Locally, west flowsintersected the interface. Probablyrelated in part to individual wellwithdrawal distribution and model cellsize.
Seacoast, Jupiter, and RivieraBeach: Numerous wetlandsaffected by drawdown events.Need to verify location andcondition of wetlands inside one-foot drawdown.
Clear Lake Riviera Beach: Results for PB-632 trigger well appeared to bevery sensitive to how muchpumpage was east of C-17. LEC-1 has limited pumpage to the eastand shows no triggering. 2020with Restudy has all withdrawalseast of C-17 and triggers Phase 2shortages. Results for PB-809show some triggering in LEC-1associated with operations ofASR wells during dry periods.This problem does not appear inthe 2020 with Restudy simulation.
Riviera Beach: Westward groundwater flows intersected the interfacein both LEC-1 and 2020 with Restudy.
No indicated problems
Palm BeachGardens
No indicated problems No indicated problems No indicated problems
LEC Service Area 1
Lake Worth No indicated problems No indicated problems Lake Osborne ASR wells showedwetlands affected by drawdownevents. Some wetlands areconnected to and controlled bythe lake, others are not.
Royal PalmBeach/Wellington
No indicated problems No indicated problems No indicated problems
DelrayBeach
No indicated problems No indicated problems Palm Beach County Utilities andDelray Beach: Few scatteredwetlands affected by drawdownevents from wellfields along andeast of the Turnpike. The locationand condition of wetlands need tobe verified.
Boca Raton No indicated problems Boca East Wellfield: Westward flow atthe interface
No indicated problems
Boca RatonWest
No indicated problems No indicated problems Boca’s west wellfield: Wetland tothe east affected by drawdownevents. Configuration suggeststhis may be excavated and notnatural wetland.
LEC Service Area 2
PompanoBeach
No indicated problems Pompano: Westward flow across theinterface in LEC-1 and 2020 withRestudy.
Pompano’s east wellfield: Awetland east of the wellfield wasaffected by drawdown events.Need to verify location andcondition of wetland.
128

LEC Regional Water Supply Plan - Planning Document Chapter 4: Analysis and Evaluation of Model Results
FortLauderdaleAirport
Potential saltwater intrusionproblems triggers were sensitiveto location of withdrawals.Geographic distribution ofwellfield withdrawals in 2020 withRestudy did not trigger shortages,while the distribution in LEC-1 did.
Dixie: Slight west flow across theinterface in LEC-1.
Fort Lauderdale Airport: Awetland southeast of wellfield wasaffected by drawdown events andshould be verified.
Hollywood No indicated problem, but thetrigger well is east of C-10 andmay not reflect problems causedby withdrawals at Hollywood’swellfields in LEC-1.
Hollywood: Westward flow across theinterface in LEC-1
No indicated problems
WesternBrowardCounty
No indicated problems No indicated problems Sunrise: Wetlands near BrowardCounty South Regional Wellfieldand Miramar were affected bydrawdown events. Size andshape of wetlands suggestexcavations, not natural.City of Coral Springs and NorthSprings Improvement District:Scattered wetland was affectedby drawdown events.Coral Springs ImprovementDistrict: Wetlands at the edge ofthe one-foot contour.
North MiamiBeach
No indicated problems North Miami: Westward flow acrossinterface in LEC-1 and 2020 withRestudy, based on 4.45 MGD withbalance of demands from WASDNorthwest wellfield in LEC-1.North Miami Beach: OK at 15 MGDwith balance of demands from WASDNorthwest wellfield in LEC-1.
No indicated problems
LEC Service Area 3
Miami No indicated problems Hialeah-Preston: Westward flowacross the interface which may havebeen due to surface drainage features
Northwest wellfield: Extensivewetlands affected by drawdownevents in the area are likely tohave been mitigated underexisting permit.
Kendall No indicated problems No indicated problems No indicated problems
KendallLakes
No indicated problems No indicated problems No indicated problems
Homestead No indicated problems Rex-Homestead area: Significantwestward flow across interface in2020 with Restudy
West wellfield: Wetlands affectedby drawdown events in Bird Drivemitigation areas
a. This table generally summarizes conditions observed in ground water models of the LEC Planning Area. Modelresults are not predictive, are regional and generalized in nature, and not necessarily representative of actuallocal conditions, either now or in the future. Please note that a determination of no problems from a modelsimulation does not ensure issuance, reissuance, or modification of water use permits, nor does determinationof a problem preclude it.
Table 20. Water Supply Results for Ground Water Model Simulations of the 2020 with Restudyand the LEC-1 Alternatives.a (Continued)
WaterRestriction
Area
Coastal Water ShortageTriggers During LEC 1-in-10
Year Drought Conditions
Net Westward Ground WaterFlow at the Saltwater Interface
During LEC 1-in-10 YearDrought Conditions
Impacts on IsolatedWetlands During LEC1-in-10 Year Drought
Conditions
129

Chapter 4: Analysis and Evaluation of Model Results LEC Regional Water Supply Plan - Planning Document
The 1-in-10 year level of certainty was met in the 2020 with Restudy and LEC-1simulations. A summary of water restrictions due to coastal ground water levels in all ofthe base cases and alternatives from the ground water models is presented in Table 21. Inmost areas, the coastal water shortage triggers did not trigger a water restriction during an1-in-10 year drought event. In the isolated cases where model results indicated problems,changing withdrawal locations or other operations enabled the water shortage criteria forcoastal ground water levels to be met. These isolated events are discussed below:
• Results for the LEC-1 simulation indicated that low ground waterlevels at PB-632 in the Riviera Beach Area, which were evidenced inthe 2020 with Restudy simulation, can be avoided by shifting publicwater supply withdrawals to Riviera Beach's proposed wellfieldslocated farther west, but within the constraints of the landfill.
• The restrictions associated with the PB-809 trigger in the Clear Lakearea in the 2020 with Restudy simulation appeared to result from theassumption that ASR wells in the area would be injecting during dryperiods. An appropriate response would be to stop injecting duringthis period in the model simulation. This assumption wasincorporated into LEC-1.
• In the Fort Lauderdale Airport area (LECSA 2), the trigger well issensitive to wellfield withdrawal distributions. The 2020 withRestudy simulation did not trigger shortages in this area, but theLEC-1 simulation did. A slight change in distribution within theDixie Wellfield would prevent these low ground water levels andresulting restrictions in LEC-1. It is important to note that, whilethere were no restrictions in the Hollywood area in LEC-1, thelocation of the trigger well, east of the C-10 Canal, may haveprecluded it from accurately assessing saltwater intrusion effects ofthe Hollywood withdrawal. The aquifer recharge provided by theBroward County Secondary Canal System from the C-9 created amound that effectively protects the trigger cell (F-219) from effectsof withdrawals in the Hollywood’s south wellfield. The effectivenessof the recharge facility, timing of construction, and public watersupply demands need to be assessed during the CUP process.
• Most wellfields in LECSA 3 avoided water restrictions due to lowground water levels along the coast, because they are centralizedinland in Miami-Dade County.
Generally, the distribution of public water supply withdrawals in the 2020 withRestudy simulation did not perform well due to the wellfield distribution assumed. Thewater supply demands simulated in the LEC-1, which was based primarily on the utility-preferred withdrawal locations and sources, were met.
Indications of net westward ground water flows at the saltwater interface werenoted in about half of the water restriction areas under the 1-in-10 year drought conditions.In several cases, the westward ground water flow across the saltwater interface occurred in
130
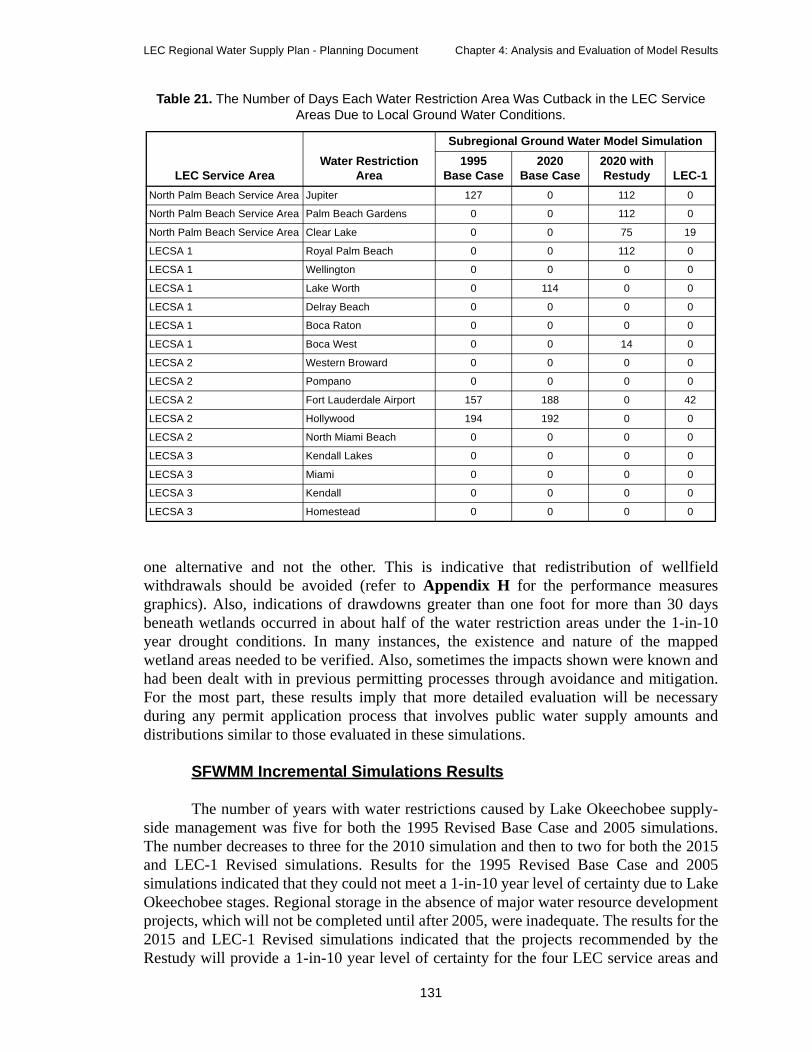
LEC Regional Water Supply Plan - Planning Document Chapter 4: Analysis and Evaluation of Model Results
one alternative and not the other. This is indicative that redistribution of wellfieldwithdrawals should be avoided (refer to Appendix H for the performance measuresgraphics). Also, indications of drawdowns greater than one foot for more than 30 daysbeneath wetlands occurred in about half of the water restriction areas under the 1-in-10year drought conditions. In many instances, the existence and nature of the mappedwetland areas needed to be verified. Also, sometimes the impacts shown were known andhad been dealt with in previous permitting processes through avoidance and mitigation.For the most part, these results imply that more detailed evaluation will be necessaryduring any permit application process that involves public water supply amounts anddistributions similar to those evaluated in these simulations.
SFWMM Incremental Simulations Results
The number of years with water restrictions caused by Lake Okeechobee supply-side management was five for both the 1995 Revised Base Case and 2005 simulations.The number decreases to three for the 2010 simulation and then to two for both the 2015and LEC-1 Revised simulations. Results for the 1995 Revised Base Case and 2005simulations indicated that they could not meet a 1-in-10 year level of certainty due to LakeOkeechobee stages. Regional storage in the absence of major water resource developmentprojects, which will not be completed until after 2005, were inadequate. The results for the2015 and LEC-1 Revised simulations indicated that the projects recommended by theRestudy will provide a 1-in-10 year level of certainty for the four LEC service areas and
Table 21. The Number of Days Each Water Restriction Area Was Cutback in the LEC ServiceAreas Due to Local Ground Water Conditions.
LEC Service AreaWater Restriction
Area
Subregional Ground Water Model Simulation
1995Base Case
2020Base Case
2020 withRestudy LEC-1
North Palm Beach Service Area Jupiter 127 0 112 0
North Palm Beach Service Area Palm Beach Gardens 0 0 112 0
North Palm Beach Service Area Clear Lake 0 0 75 19
LECSA 1 Royal Palm Beach 0 0 112 0
LECSA 1 Wellington 0 0 0 0
LECSA 1 Lake Worth 0 114 0 0
LECSA 1 Delray Beach 0 0 0 0
LECSA 1 Boca Raton 0 0 0 0
LECSA 1 Boca West 0 0 14 0
LECSA 2 Western Broward 0 0 0 0
LECSA 2 Pompano 0 0 0 0
LECSA 2 Fort Lauderdale Airport 157 188 0 42
LECSA 2 Hollywood 194 192 0 0
LECSA 2 North Miami Beach 0 0 0 0
LECSA 3 Kendall Lakes 0 0 0 0
LECSA 3 Miami 0 0 0 0
LECSA 3 Kendall 0 0 0 0
LECSA 3 Homestead 0 0 0 0
131

Chapter 4: Analysis and Evaluation of Model Results LEC Regional Water Supply Plan - Planning Document
LOSA. In the 2005 SSM Scenario, the performance remained the same as the original2005 simulation. Changes to the supply-side management criteria did not affect the abilityto provide regional water to the LEC service areas during a 1-in-10 year drought event.
The information in Table 22 summarizes the frequency of water shortagedeclarations due to coastal saltwater intrusion water level criteria. These data arepresented for each service area, since water shortage declarations are usually based onlocal resource conditions.
Table 23 presents tabulations of the number of times water shortages weretriggered by local ground water conditions by trigger well locations during each of thesimulations. It should be noted, that in all cases, these declarations were for Phase I andPhase II shortages and restrictions that pose an inconvenience to users, but were not likelyto result in economic losses. A more detailed discussion of water shortage phases isprovided on pages 25 through 28 in Chapter 2.) In all of the simulations, amounts andlocations of pumpage significantly affected coastal saltwater intrusion problems. Suchproblems were solved as soon as the appropriate wellfield distributions or water supplydevelopment options were implemented.
1995 Revised Base Case. Water shortage problems were significant in the1995 Revised Base Case in all service areas except LECSA 3, where regional wellfieldshave been established inland from areas subject to saltwater intrusion (Table 23). Groundwater stage monitoring locations in the Tequesta, Jupiter, Lake Worth, Fort LauderdaleAirport, Hollywood, and Homestead areas accounted for most of the shortages. Thissimulation did not meet the 1-in-10 year level of certainty.
2005. In the 2005 simulation and subsequent incremental simulations, the utility-preferred wellfield distribution, as modified in LEC-1, is applied. In the 2005 simulation,water shortages caused by local triggers were eliminated in LECSA 1 and were greatlyreduced in the North Palm Beach Service Area. The number of cutbacks in LECSA 2 wasprimarily a result of the sensitivity to the assumed location of public water supplywithdrawals from the Surficial Aquifer System (SAS). The number of restrictions inLECSA 3 increased slightly when compared to the 1995 Revised Base Case. This mayhave been due to demand growth, changes in pumpage distribution from the 1995 RevisedBase Case, or other factors that affect water levels in areas near the Miami and CutlerRidge monitoring locations.
Table 22. Number of Years with Water Restrictions Caused by Local Triggers in the SFWMMIncremental Simulations for the Lower East Coast Service Areas during the 30 Water Years
Simulated.
Service Area1995Revised
Base Case 2005 2010 2015LEC-1
RevisedNorth Palm Beach Service Area 5 1 0 0 0
LECSA 1 7 0 0 0 0
LECSA 2 21 13 8 11 12
LECSA 3 4 5 3 3 2
132
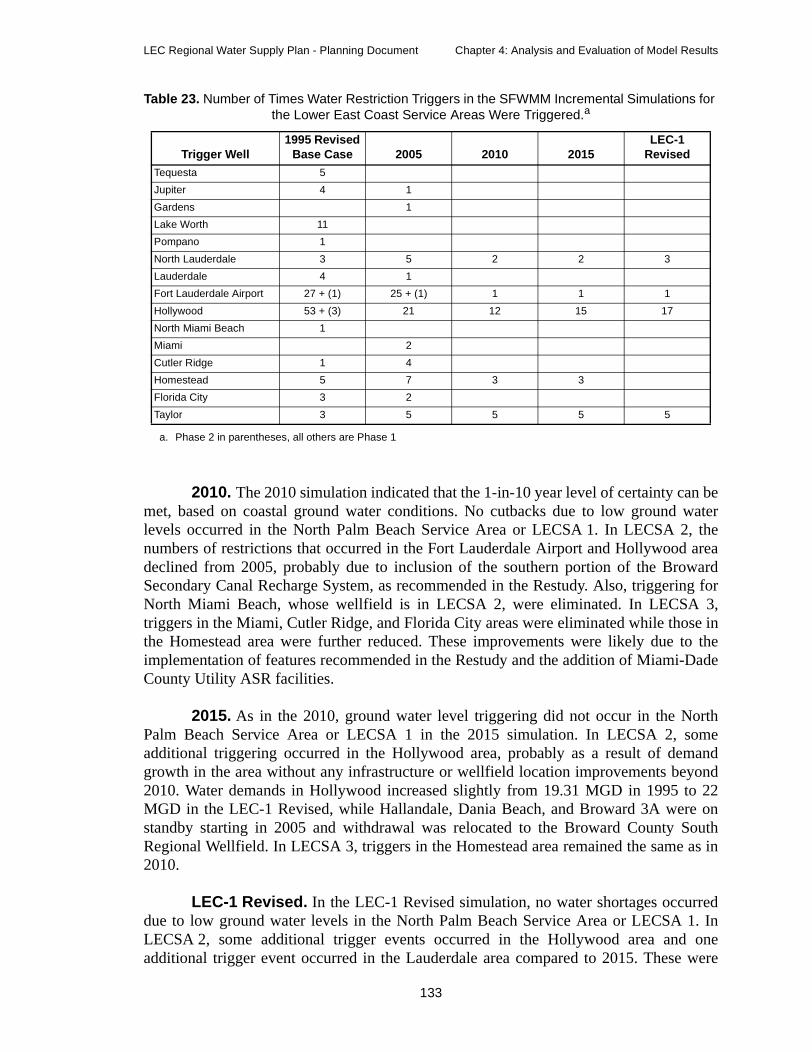
LEC Regional Water Supply Plan - Planning Document Chapter 4: Analysis and Evaluation of Model Results
2010. The 2010 simulation indicated that the 1-in-10 year level of certainty can bemet, based on coastal ground water conditions. No cutbacks due to low ground waterlevels occurred in the North Palm Beach Service Area or LECSA 1. In LECSA 2, thenumbers of restrictions that occurred in the Fort Lauderdale Airport and Hollywood areadeclined from 2005, probably due to inclusion of the southern portion of the BrowardSecondary Canal Recharge System, as recommended in the Restudy. Also, triggering forNorth Miami Beach, whose wellfield is in LECSA 2, were eliminated. In LECSA 3,triggers in the Miami, Cutler Ridge, and Florida City areas were eliminated while those inthe Homestead area were further reduced. These improvements were likely due to theimplementation of features recommended in the Restudy and the addition of Miami-DadeCounty Utility ASR facilities.
2015. As in the 2010, ground water level triggering did not occur in the NorthPalm Beach Service Area or LECSA 1 in the 2015 simulation. In LECSA 2, someadditional triggering occurred in the Hollywood area, probably as a result of demandgrowth in the area without any infrastructure or wellfield location improvements beyond2010. Water demands in Hollywood increased slightly from 19.31 MGD in 1995 to 22MGD in the LEC-1 Revised, while Hallandale, Dania Beach, and Broward 3A were onstandby starting in 2005 and withdrawal was relocated to the Broward County SouthRegional Wellfield. In LECSA 3, triggers in the Homestead area remained the same as in2010.
LEC-1 Revised. In the LEC-1 Revised simulation, no water shortages occurreddue to low ground water levels in the North Palm Beach Service Area or LECSA 1. InLECSA 2, some additional trigger events occurred in the Hollywood area and oneadditional trigger event occurred in the Lauderdale area compared to 2015. These were
Table 23. Number of Times Water Restriction Triggers in the SFWMM Incremental Simulations forthe Lower East Coast Service Areas Were Triggered.a
Trigger Well1995 Revised
Base Case 2005 2010 2015LEC-1
RevisedTequesta 5
Jupiter 4 1
Gardens 1
Lake Worth 11
Pompano 1
North Lauderdale 3 5 2 2 3
Lauderdale 4 1
Fort Lauderdale Airport 27 + (1) 25 + (1) 1 1 1
Hollywood 53 + (3) 21 12 15 17
North Miami Beach 1
Miami 2
Cutler Ridge 1 4
Homestead 5 7 3 3
Florida City 3 2
Taylor 3 5 5 5 5
a. Phase 2 in parentheses, all others are Phase 1
133

Chapter 4: Analysis and Evaluation of Model Results LEC Regional Water Supply Plan - Planning Document
also the likely result of demand growth without any additional infrastructure or wellfieldlocation improvements beyond 2010 refinement of the wellfield distribution. In LECSA 3,trigger events in the Homestead area were eliminated and only those in the Taylor area,which are insensitive to public water supply withdrawals remained.
The incremental simulation results indicated that the ability to meet a 1-in-10 yearlevel of certainty improved over time as the Restudy and other water resourcedevelopment projects were implemented. The volume and location of public water supplywithdrawals significantly affected coastal saltwater intrusion. Saltwater intrusion waslargely be avoided, and the associated restrictions diminished, when appropriate watersupply options such as wellfield relocation, distribution, and operational changes wereimplemented. In 2005, use of the utility-preferred wellfield distribution (same as LEC-1)solved coastal trigger problems in the North Palm Beach Service Area, LECSA 1, andLECSA 3. The low coastal ground water stages in LECSA 2 were avoided by altering thedistribution or allocation of public water supplies year-round or conditionally, dependingon the severity and location of low ground water stages. The LEC-1 Revised simulationdemonstrated the ability to avoid saltwater intrusion and water restrictions with minoradjustments to public water supply distribution.
Hollywood Seminole Indian Reservation
The Seminole Tribe of Florida is currently reviewing its options to self-supply itsHollywood Seminole Indian Reservation by shifting supply of its public water supplydemands to its own utility system. The average and maximum daily demands associatedwith this facility during the planning horizon are expected to be approximately 1.5 MGDand 2.0 MGD, respectively. The modeling analyses performed to support the LECregional water supply planning process did not include these demands in the modelassumptions, but did evaluate withdrawals on the Hollywood Seminole IndianReservation at a rate of 0.88 MGD on average. It is staff's opinion that averagewithdrawals of 1.5 MGD and a maximum daily withdrawal of 2.0 MGD on theHollywood Reservation are attainable. In addition, the Seminole Tribe has agreed toparticipate in the Southeast Broward County Interconnected Water Supply Systemdiscussions (Recommendation 8 in Chapter 6). These discussions will deal withdeveloping water supply solutions for the water supply utilities of southeast BrowardCounty, while protecting the water rights of the Seminole Tribe.
Summary of Results for the Lower East Coast Service Areas
• The 1995 and 2020 base cases did not meet a 1-in-10 year levelof certainty performance.
• The 2020 with Restudy, LEC-1, and LEC-1 Revised modelsimulations were capable of meeting 2020 water supplyprojections in the LEC service areas.
• The SFWMM results demonstrated that the frequency of supply-side management restrictions in the 2020 with Restudy, the
134

LEC Regional Water Supply Plan - Planning Document Chapter 4: Analysis and Evaluation of Model Results
LEC-1, and the LEC-1 Revised simulations met the 1-in-10 yearlevel of certainty planning criteria for the LEC service areas.
• The redistribution of wellfield withdrawals in the 2020 withRestudy and the LEC-1 simulations demonstrated the significanteffect that wellfield withdrawals had on local ground waterconditions and on the ability to meet the 1-in-10 year level ofcertainty. This is evidenced in southeast and central BrowardCounty, where redistribution of wellfield withdrawals in themodel simulations was the determining factor for meeting the1-in-10 year level of certainty based on local conditions.
• A 1-in-10 year level of certainty for public water supply was notmet in the LEC service areas. The subregional ground watermodel simulations indicated that water shortage restrictioncriteria were met and harm to wetlands and the Biscayne aquiferwere avoided. Implementation of Restudy projects, refinement ofutility preferred wellfield distributions and operations, andimplementation of water supply development options werenecessary to meet the 1-in-10 year level of certainty.
• Assuming the utility-preferred withdrawal locations areimplemented as proposed, several public water suppliers mayneed to implement water supply development options and/orfurther refine their preferred wellfield locations in order to meetthe 1-in-10 year level of certainty. These utilities include LakeWorth, Manalapan, Lantana, Fort Lauderdale, Hallandale,Hollywood, Dania Beach, and Broward County 3A, 3B, and 3C.
• A few utilities may meet a 1-in-10 year level of certainty, butmay not meet CUP criteria for wetland drawdowns, and/or avoidsaltwater intrusion, unless their wellfield distribution andseasonal operations are refined. These utilities include Seacoast,Jupiter, Riviera Beach, Pompano Beach, Boca Raton's easternwellfield, Coral Springs, North Springs Improvement District,the proposed Miami-Dade WASD’s proposed south regionalwellfield and existing west wellfield, North Miami, North MiamiBeach, and Homestead.
ENVIRONMENTAL RESOURCES RESULTS
As with the evaluations of urban areas, two different sets of simulations wereperformed using the SFWMM. The first set of simulations compares current (1995) andfuture (2020) base case conditions. A second set of model simulations was created tovisualize the incremental changes that occur to the overall system at five-year intervals(2005, 2010, and 2015) as Restudy and other water resource development componentscome on-line. Detailed descriptions of the parameters, conditions, and rationales used ineach model simulation can be found in the Model Simulations section of this chapter. An
135
Chapter 4: Analysis and Evaluation of Model Results LEC Regional Water Supply Plan - Planning Document
overview of results for each set of simulations is presented first, then performancemeasures and results for both sets of simulations are discussed by natural area.
District staff have recently developed proposed MFL criteria for three prioritywater bodies included within the LEC Planning Area (SFWMD, 2000e). These waterbodies include Lake Okeechobee, the Biscayne aquifer, and the Everglades. TheEverglades includes the WCAs, the Holey Land and Rotenberger WMAs, and thefreshwater regions of Everglades National Park. The final draft document proposesminimum water level depths, durations, and frequencies of occurrence that will guide theoperation of the C&SF Project and future management of Lake Okeechobee, theEverglades, and the Biscayne aquifer. The ability to achieve these proposed MFL criteriais assessed for each natural area and each set of model simulations.
Overview of Results
Overview of Base Cases and Alternatives Results
Results for the current (1995) and future (2020) base cases were obtained frommodel simulations for the same conditions that were obtained for the urban areas: 1995Base Case, 2020 Base Case, 2020 with Restudy, and LEC-1. These conditions wereanalyzed and the results are displayed in formats similar to the methods that were used forthe Restudy, with the addition of the MFL criteria, which were subsequently developed forLake Okeechobee, the Everglades, and the Biscayne aquifer (SFWMD, 2000e).
Table 24 provides a color-coded evaluation of the overall results of each base caseand alternative simulation. The color codes (green, yellow, or red) represent a scoringsystem to evaluate model output, based on review of key environmental performancemeasures discussed later in this chapter and in Appendix D and use of best professionaljudgement by District scientists. Similar color-coding schemes and definitions were usedin the Restudy to provide a qualitative assessment of the ability of particular water supplyactions or features to meet environmental management objectives of this plan.
1995 Base Case. A majority of the natural areas (14 out of 21 areas evaluated)in the 1995 Base Case were scored as red, indicating they did not currently meet LECenvironmental planning criteria (Table 24). These areas were Lake Okeechobee, theCaloosahatchee and St. Lucie estuaries, Lake Worth Lagoon, Rotenberger WMA,WCA-2B, all of WCA-3 except Indicator Region 17, Shark River Slough, the Rocklandmarl marsh, western Florida Bay, and Whitewater Bay. Ecosystems will not recover inthese areas unless major hydrologic improvements occur. Five areas were scored yellow(Table 24), indicating marginal or uncertain ability to meet environmental targets andachieve recovery. These areas were the Holey Land WMA, northern WCA-2A (IndicatorRegion 25), central WCA-3A (Indicator Region 17), WCA-3B, and central and southernBiscayne Bay. Only three areas were scored green (Table 24), indicating that theycurrently met environmental performance measure targets and will likely result in long-term sustainability of the ecosystem, providing water quality standards are met. These
136

LEC Regional Water Supply Plan - Planning Document Chapter 4: Analysis and Evaluation of Model Results
areas were the Arthur R. Marshall Loxahatchee National Wildlife Refuge (WCA-1),southern WCA-2A (Indicator Region 24), and northern Biscayne Bay.
2020 Base Case. Fewer areas scored red in the 2020 Base Case compared to the1995 Base Case, but most of the region still did not meet the environmental planningtargets (Table 24). The 2020 Base Case showed improvement in some areas over the 1995Base Case. These areas were Lake Worth Lagoon, the Rotenberger WMA, andnortheastern, northwestern, and eastern WCA-3A. Lake Worth Lagoon improved due tothe capability to store water in STA-1 East, which reduced the amount of water dischargedto the lagoon. The Rotenberger WMA and northern WCA-3A improved due to completionof the Everglades Construction Project in 2003. Two areas became worse under the 2020Base Case, the Arthur R. Marshall Loxahatchee National Wildlife Refuge (WCA-1) andnorthern Biscayne Bay, changing from green to yellow.
2020 with Restudy and LEC-1. Results show that the 2020 with Restudy andLEC-1 simulations performed very similar to each other (Table 24) and provided
Table 24. South Florida Water Management Model Results for Base Cases and Alternatives forNatural Areas within the Lower East Coast Planning Area.a
AreaIndicator
Region(s)b1995
Base Case2020
Base Case2020 withRestudy LEC-1
Lake Okeechobee NA R R G G
Caloosahatchee Estuary NA R R G G
St. Lucie Estuary NA R R G G
Lake Worth Lagoon NA R Y Y Y
Loxahatchee National Wildlife Refuge (WCA 1) 27 and 26 G Y G G
WCA-2A 24 and 25 Y/G Y/G Y/G Y/G
WCA-2B 23 R R R R
Holey Land WMA 29 Y Y G G
Rotenberger WMA 28 R G G G
Northwestern WCA-3A 20 and 22 R G G G
Northeastern WCA-3A 21 R Y G G
Eastern WCA-3A 19 R Y Y Y
Central WCA-3A 17 and 18 Y/R Y/R G/Y G/Y
Southern WCA-3A 14 R R G G
WCA-3B 15 and 16 Y Y Y Y
Shark River Slough 9, 10, and 11 R R G/Y G/Y
Rockland Marl Marsh 8 R R Y Y
Northern Biscayne Bay NA G Y Y Y
Central Biscayne Bay NA Y Y Y Y
Southern Biscayne Bay NA Y Y Y G
Western Florida and Whitewater Bays NA R R G G
a. G (green) = planning targets metY (yellow) = ability to meet targets was marginal or uncertain, or goal was not definedR (red) = planning targets not met
b. An indicator region is a grouping of model grid cells within the SFWMM that consists of similar vegetation coverand soil type. Indicator regions were used only in simulations for the Everglades.
137
Chapter 4: Analysis and Evaluation of Model Results LEC Regional Water Supply Plan - Planning Document
significant hydrological improvements to the regional ecosystem. Significant andsubstantial progress was made in these alternatives toward meeting environmentalrestoration targets for the Everglades and the estuaries. Overall, 14 out of 21 sites scoredgreen under the LEC-1 and 2020 with Restudy alternatives, indicating they met LECwater supply planning targets and will likely result in recovery and long-termsustainability of the ecosystem, providing water quality standards are met. These areaswere Lake Okeechobee, the St. Lucie and Caloosahatchee estuaries, the Holey Land andRotenberger WMAs, Arthur R. Marshall Loxahatchee National Wildlife Refuge (WCA-1), northern WCA-2A (Indicator Region 25), northeastern and northwestern WCA-3A, aportion of central WCA-3A (Indicator Region 17), southern WCA-3A, western FloridaBay, and Whitewater Bay. These alternatives show great improvement relative to the 1995and 2020 base cases. Shark River Slough scored green/yellow, which was an improvementrelative to the base cases, but did not perform quite as well as Alternative D13R in 2050,when all of the Restudy projects were completed (USACE and SFWMD, 1999).
Areas that indicated marginal or uncertain ability to meet the environmentalobjectives of the LEC Plan (scored yellow) and need further improvement, or where thetarget was not yet defined, include Lake Worth Lagoon, southern WCA-2A (IndicatorRegion 24), eastern WCA-3A (Indicator Region 19), a portion of central WCA-3A(Indicator Region 18), WCA-3B, the Rockland marl marsh located within EvergladesNational Park, and northern and central Biscayne Bay (Table 24). These results were verysimilar to those achieved under Alternative D13R, with the Restudy projects completed by2050 (USACE and SFWMD, 1999).
Only one area, WCA-2B, was scored red for the 2020 with Restudy and LEC-1alternatives (Table 24). These results indicated that environmental planning targets willnot be met, ecosystem recovery will not likely occur, and WCA-2B will needimprovements. Again, these results were similar to results from the Restudy modelsimulations for this area. However, LEC-1 showed improved performance as compared toAlternative D13R (USACE and SFWMD, 1999).
Overview of Incremental Modeling Results for Natural Areas
Table 25 provides a color-coded evaluation of the overall results of eachincremental simulation based on a review of key performance measures discussed later inthis chapter and in Appendix D. Lake Okeechobee and the St. Lucie and Caloosahatcheeestuaries showed improvements by 2010, and met their respective planning targets by2015. These improvements were due in part to the construction of regional reservoirswithin the C-43 and C-44 basins. Similar improvements occurred over time in the ArthurR. Marshall Loxahatchee National Wildlife Refuge, northern WCA-3A, and the HoleyLand and Rotenberger WMAs. These areas met proposed planning targets during the 2010simulation as a result of completion of the Everglades Construction Project and the EAAStorage Reservoirs, and implementation of rain-driven water deliveries for the WCAs. Incontrast, performance measure targets were not met in central and southern WCA-3A andWCA-3B until the LEC-1 Revised simulation (2020).
138
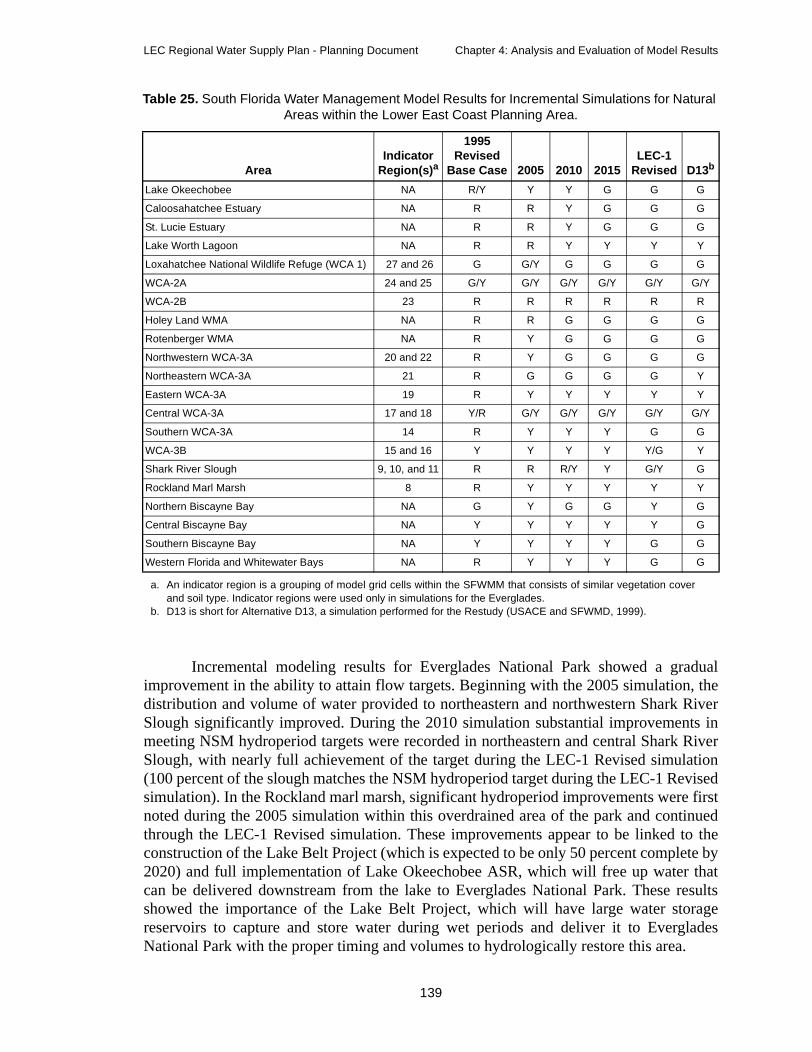
LEC Regional Water Supply Plan - Planning Document Chapter 4: Analysis and Evaluation of Model Results
Incremental modeling results for Everglades National Park showed a gradualimprovement in the ability to attain flow targets. Beginning with the 2005 simulation, thedistribution and volume of water provided to northeastern and northwestern Shark RiverSlough significantly improved. During the 2010 simulation substantial improvements inmeeting NSM hydroperiod targets were recorded in northeastern and central Shark RiverSlough, with nearly full achievement of the target during the LEC-1 Revised simulation(100 percent of the slough matches the NSM hydroperiod target during the LEC-1 Revisedsimulation). In the Rockland marl marsh, significant hydroperiod improvements were firstnoted during the 2005 simulation within this overdrained area of the park and continuedthrough the LEC-1 Revised simulation. These improvements appear to be linked to theconstruction of the Lake Belt Project (which is expected to be only 50 percent complete by2020) and full implementation of Lake Okeechobee ASR, which will free up water thatcan be delivered downstream from the lake to Everglades National Park. These resultsshowed the importance of the Lake Belt Project, which will have large water storagereservoirs to capture and store water during wet periods and deliver it to EvergladesNational Park with the proper timing and volumes to hydrologically restore this area.
Table 25. South Florida Water Management Model Results for Incremental Simulations for NaturalAreas within the Lower East Coast Planning Area.
AreaIndicator
Region(s)a
1995Revised
Base Case 2005 2010 2015LEC-1
Revised D13b
Lake Okeechobee NA R/Y Y Y G G G
Caloosahatchee Estuary NA R R Y G G G
St. Lucie Estuary NA R R Y G G G
Lake Worth Lagoon NA R R Y Y Y Y
Loxahatchee National Wildlife Refuge (WCA 1) 27 and 26 G G/Y G G G G
WCA-2A 24 and 25 G/Y G/Y G/Y G/Y G/Y G/Y
WCA-2B 23 R R R R R R
Holey Land WMA NA R R G G G G
Rotenberger WMA NA R Y G G G G
Northwestern WCA-3A 20 and 22 R Y G G G G
Northeastern WCA-3A 21 R G G G G Y
Eastern WCA-3A 19 R Y Y Y Y Y
Central WCA-3A 17 and 18 Y/R G/Y G/Y G/Y G/Y G/Y
Southern WCA-3A 14 R Y Y Y G G
WCA-3B 15 and 16 Y Y Y Y Y/G Y
Shark River Slough 9, 10, and 11 R R R/Y Y G/Y G
Rockland Marl Marsh 8 R Y Y Y Y Y
Northern Biscayne Bay NA G Y G G Y G
Central Biscayne Bay NA Y Y Y Y Y G
Southern Biscayne Bay NA Y Y Y Y G G
Western Florida and Whitewater Bays NA R Y Y Y G G
a. An indicator region is a grouping of model grid cells within the SFWMM that consists of similar vegetation coverand soil type. Indicator regions were used only in simulations for the Everglades.
b. D13 is short for Alternative D13, a simulation performed for the Restudy (USACE and SFWMD, 1999).
139
Chapter 4: Analysis and Evaluation of Model Results LEC Regional Water Supply Plan - Planning Document
A number of areas did not fully meet the planning targets and were scored asyellow or red (Table 25). One area, WCA-2B, was scored red in the LEC-1 RevisedSimulation, indicating that it did not meet planning targets and was in need of majorimprovement. Areas that scored yellow (exhibited marginal or uncertain performance) inLEC-1 Revised Simulation included the Lake Worth Lagoon, southern WCA-2A(Indicator Region 24), northeastern (Indicator Region 21) and eastern (Indicator Region19) WCA-3A, a portion of central WCA-3A (Indicator Region 18), a portion of SharkRiver Slough (Indicator Region), the Rockland marl marsh located within EvergladesNational Park, and northern and central Biscayne Bay. These results were similar to thefindings presented by the Restudy, which identified problems in meeting proposedenvironmental targets for these areas by 2050 (USACE and SFWMD, 1999).
Lake Okeechobee
Extreme fluctuations of both high and low water levels within Lake Okeechobeeover the past two decades have had major adverse impacts on water quality, thedistribution of littoral zone vegetation communities that support fish and wildlife habitat,and downstream estuaries which receive regulatory releases from the lake. The followingset of performance measures were developed to judge how well each water supplyalternative reduces the frequency of these extreme high and low water events andimproves the overall ability of the regional ecosystem to meet the environmentalobjectives of the LEC Plan.
Performance Measures Applied
Performance measures and hydrologic targets developed for Lake Okeechobee arelisted below. These performance measures are similar to those used in the Restudy andthat were developed by Havens and Rosen (1995). These two references provide thebackground information and rationale for development of the following five priorityperformance measures for Lake Okeechobee, which were used to evaluate the lake:
• Number of times lake stages exceeded 17 ft NGVD for more than50 days
• Number of times lake stages exceeded 15 ft NGVD for more thanone year
• Number of times lake stages fell below 12 ft NGVD for morethan one year
• Number of times lake stages fell below 11 ft NGVD
• Number of spring water level recessions, i.e., the number oftimes between the months of January and March that lake stagesdeclined from near 15 to 12 ft NGVD (these conditions arejudged as favorable for wading bird foraging and nesting andother water-dependent wildlife present within the littoral zone)
140

LEC Regional Water Supply Plan - Planning Document Chapter 4: Analysis and Evaluation of Model Results
Base Cases and Alternatives Results
Table 26 provides an evaluation of the lake under the 1995 and 2020 base cases ascompared to the 2020 with Restudy and LEC-1 simulations.
1995 Base Case. The 1995 Base Case had the largest number of extreme highwater events (number of times stages exceeded 17 ft NGVD for more than a 50-dayduration) that impacted the littoral zone, increased the frequency that large volumes ofwater were discharged to downstream estuaries, and increased the risk of flooding oflakeside communities. In addition, the number of times that the littoral zone was floodedfor long periods of time (number of times lake stages exceeded 15.0 ft NGVD for morethan one year) was greater than the numbers that occurred during the future water supplysimulations. In contrast, fewer extreme low water events (number of times lake stages fellbelow 11 and 12 ft NGVD) that dried out the marsh and impacted the ability of the lake toprovide water supply for the LEC Planning Area occurred under the 1995 Base Case thanunder the future simulations (Table 26). The lake also had relatively fewer occurrences offavorable spring water level recessions that benefit wading bird and snail kite foraging andnesting as compared to the 2020 with Restudy and the LEC-1 (Table 26).
2020 Base Case. Increased water demands under the 2020 Base Case led to asignificant increase in the number of times lake levels fell below 11 ft NGVD as comparedto the 1995 Base Case (19 times versus four times). This increase in low water periods hadthe potential to dry out the marsh more often and impact water supplies. The 2020 BaseCase showed an improvement in reducing the number of times that extreme high waterconditions occurred during the 31-year simulation period when compared to the 1995Base Case (Table 26). Although lake dry downs occurred more often under the 2020 BaseCase than under the 1995 Base Case, they did not appear to coincide with the spring waterlevel recessions preferred by wading birds and other water-dependent species.
Table 26. Summary of Base Case and Alternative Modeling Results for Lake Okeechobee PriorityPerformance Measures.
Priority Performance Measures
1995BaseCase
2020BaseCase
2020 withRestudy LEC-1
Number of times stages exceeded 17 ft NGVD for more than 50 days 4 2 2 2
Number of times stages exceeded 15 ft NGVD for more than one year 4 1 1 1
Number of times stages fell below 12 ft NGVD for more than one year 1 2 1 1
Number of times stages fell below 11 ft NGVD 4 19 4 4
Number of spring water level recessionsa
a. Number of years during the months of January-May that lake levels declined from near 15 to 12 ft NGVD (without awater level reversal greater than 0.5 feet). These conditions are judged as favorable for wading bird foraging andnesting and also benefit other wildlife species present within the marsh. These water level recessions are alsobeneficial for reestablishment of willow stands and also allow fire to burn away cattail thatch (Havens et al., 1998).
5 4 9 8
141
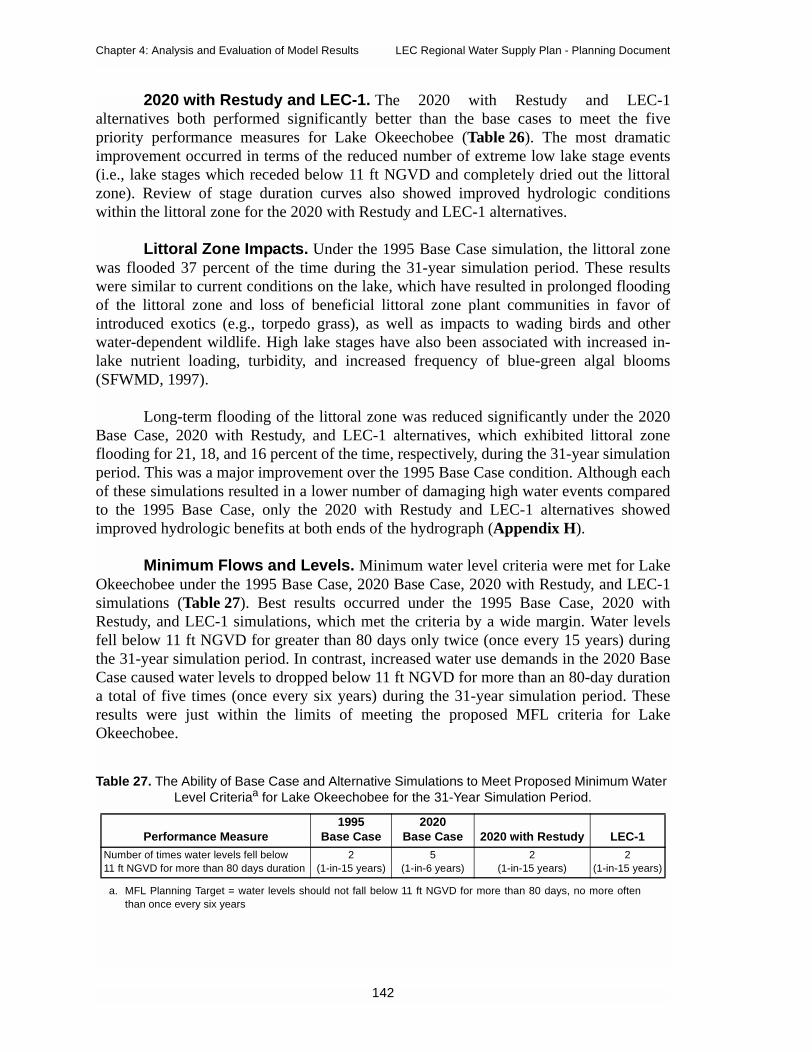
Chapter 4: Analysis and Evaluation of Model Results LEC Regional Water Supply Plan - Planning Document
2020 with Restudy and LEC-1. The 2020 with Restudy and LEC-1alternatives both performed significantly better than the base cases to meet the fivepriority performance measures for Lake Okeechobee (Table 26). The most dramaticimprovement occurred in terms of the reduced number of extreme low lake stage events(i.e., lake stages which receded below 11 ft NGVD and completely dried out the littoralzone). Review of stage duration curves also showed improved hydrologic conditionswithin the littoral zone for the 2020 with Restudy and LEC-1 alternatives.
Littoral Zone Impacts. Under the 1995 Base Case simulation, the littoral zonewas flooded 37 percent of the time during the 31-year simulation period. These resultswere similar to current conditions on the lake, which have resulted in prolonged floodingof the littoral zone and loss of beneficial littoral zone plant communities in favor ofintroduced exotics (e.g., torpedo grass), as well as impacts to wading birds and otherwater-dependent wildlife. High lake stages have also been associated with increased in-lake nutrient loading, turbidity, and increased frequency of blue-green algal blooms(SFWMD, 1997).
Long-term flooding of the littoral zone was reduced significantly under the 2020Base Case, 2020 with Restudy, and LEC-1 alternatives, which exhibited littoral zoneflooding for 21, 18, and 16 percent of the time, respectively, during the 31-year simulationperiod. This was a major improvement over the 1995 Base Case condition. Although eachof these simulations resulted in a lower number of damaging high water events comparedto the 1995 Base Case, only the 2020 with Restudy and LEC-1 alternatives showedimproved hydrologic benefits at both ends of the hydrograph (Appendix H).
Minimum Flows and Levels. Minimum water level criteria were met for LakeOkeechobee under the 1995 Base Case, 2020 Base Case, 2020 with Restudy, and LEC-1simulations (Table 27). Best results occurred under the 1995 Base Case, 2020 withRestudy, and LEC-1 simulations, which met the criteria by a wide margin. Water levelsfell below 11 ft NGVD for greater than 80 days only twice (once every 15 years) duringthe 31-year simulation period. In contrast, increased water use demands in the 2020 BaseCase caused water levels to dropped below 11 ft NGVD for more than an 80-day durationa total of five times (once every six years) during the 31-year simulation period. Theseresults were just within the limits of meeting the proposed MFL criteria for LakeOkeechobee.
Table 27. The Ability of Base Case and Alternative Simulations to Meet Proposed Minimum WaterLevel Criteriaa for Lake Okeechobee for the 31-Year Simulation Period.
a. MFL Planning Target = water levels should not fall below 11 ft NGVD for more than 80 days, no more oftenthan once every six years
Performance Measure1995
Base Case2020
Base Case 2020 with Restudy LEC-1Number of times water levels fell below11 ft NGVD for more than 80 days duration
2(1-in-15 years)
5(1-in-6 years)
2(1-in-15 years)
2(1-in-15 years)
142

LEC Regional Water Supply Plan - Planning Document Chapter 4: Analysis and Evaluation of Model Results
Incremental Simulations Results
Hydrologic Performance. Table 28 provides a summary of the ability of theincremental simulations to meet the five priority performance measures developed forLake Okeechobee. The incremental modeling simulations shown in Table 28 included theWSE schedule for Lake Okeechobee. Implementation of the WSE under the 1995 RevisedBase Case showed an improvement in reducing the number of times lake stages exceeded17 ft NGVD when compared to the 1995 Base Case (Table 26). This reduction in thenumber of extreme high water events should help protect the ecosystem from the effects ofdamaging high water levels that impact the littoral zone and increase the risk of flooding.
In the incremental simulations, the number of times water levels fell below 11 ftNGVD were reduced (Table 28), which helped protect the littoral zone and increased theDistrict’s ability to protect the Biscayne aquifer against saltwater intrusion during dryperiods. This was the result of new regional reservoirs coming on-line in 2010, 2015, and2020, and implementation of the Lake Okeechobee ASR, which helped decrease demandson the lake during dry periods.
The number of spring water level recessions increased during the LEC-1 Revisedsimulation. The timing of these water level recessions was favorable for wading birdforaging and nesting and also provided benefits to other water-dependent wildlife presentwithin the littoral zone.
Comparison of the 2005 incremental simulation versus the 2005 SSM Scenarioshowed only minor differences in performance for Lake Okeechobee. The primarydifference was that under the 2005 SSM Scenario, slightly less water was available in the
Table 28. Summary of Incremental Modeling Results for Lake Okeechobee Priority PerformanceMeasures.
Priority Performance Measure
1995Revised
BaseCase 2005
2005 SSMScenario 2010 2015
LEC-1Revised
Number of times stages exceeded 17 ftNGVD for more than 50 days
2 2 2 1 2 2
Number of times stages exceeded 15 ftNGVD for more than one year
3 3 3 2 2 1
Number of times stages fell below 12 ftNGVD for more than one year
1 1 1 1 1 1
Number of times stages fell below 11 ftNGVD
8 12 11 9 5 3
Number of spring water levelrecessionsa
a. Number of years during the months of January-May that lake levels declined from near 15 to 12 ft NGVD(without a water level reversal greater than 0.5 feet). These conditions are judged as favorable for wading birdforaging and nesting and also benefit other wildlife species present within the marsh. These water levelrecessions are also beneficial for reestablishment of willow stands and also allow fire to burn away cattail thatch(Havens et al., 1998).
5 5 5 5 6 10
143
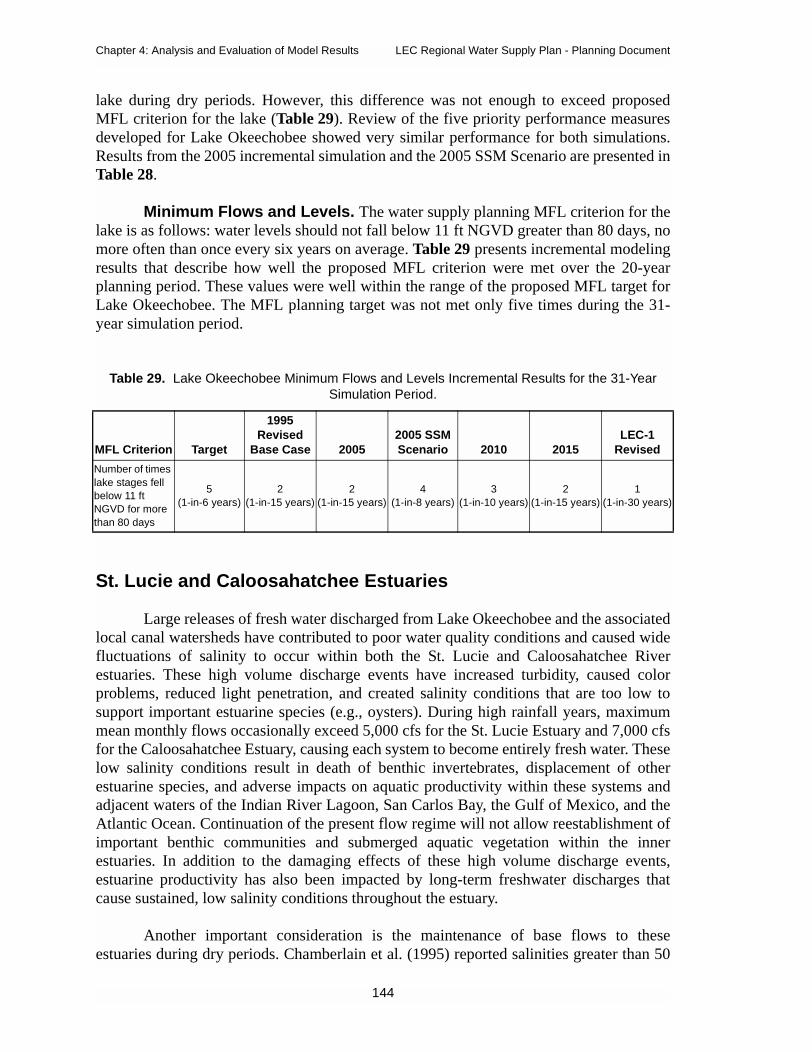
Chapter 4: Analysis and Evaluation of Model Results LEC Regional Water Supply Plan - Planning Document
lake during dry periods. However, this difference was not enough to exceed proposedMFL criterion for the lake (Table 29). Review of the five priority performance measuresdeveloped for Lake Okeechobee showed very similar performance for both simulations.Results from the 2005 incremental simulation and the 2005 SSM Scenario are presented inTable 28.
Minimum Flows and Levels. The water supply planning MFL criterion for thelake is as follows: water levels should not fall below 11 ft NGVD greater than 80 days, nomore often than once every six years on average. Table 29 presents incremental modelingresults that describe how well the proposed MFL criterion were met over the 20-yearplanning period. These values were well within the range of the proposed MFL target forLake Okeechobee. The MFL planning target was not met only five times during the 31-year simulation period.
St. Lucie and Caloosahatchee Estuaries
Large releases of fresh water discharged from Lake Okeechobee and the associatedlocal canal watersheds have contributed to poor water quality conditions and caused widefluctuations of salinity to occur within both the St. Lucie and Caloosahatchee Riverestuaries. These high volume discharge events have increased turbidity, caused colorproblems, reduced light penetration, and created salinity conditions that are too low tosupport important estuarine species (e.g., oysters). During high rainfall years, maximummean monthly flows occasionally exceed 5,000 cfs for the St. Lucie Estuary and 7,000 cfsfor the Caloosahatchee Estuary, causing each system to become entirely fresh water. Theselow salinity conditions result in death of benthic invertebrates, displacement of otherestuarine species, and adverse impacts on aquatic productivity within these systems andadjacent waters of the Indian River Lagoon, San Carlos Bay, the Gulf of Mexico, and theAtlantic Ocean. Continuation of the present flow regime will not allow reestablishment ofimportant benthic communities and submerged aquatic vegetation within the innerestuaries. In addition to the damaging effects of these high volume discharge events,estuarine productivity has also been impacted by long-term freshwater discharges thatcause sustained, low salinity conditions throughout the estuary.
Another important consideration is the maintenance of base flows to theseestuaries during dry periods. Chamberlain et al. (1995) reported salinities greater than 50
Table 29. Lake Okeechobee Minimum Flows and Levels Incremental Results for the 31-YearSimulation Period.
MFL Criterion Target
1995Revised
Base Case 20052005 SSMScenario 2010 2015
LEC-1Revised
Number of timeslake stages fellbelow 11 ftNGVD for morethan 80 days
5(1-in-6 years)
2(1-in-15 years)
2(1-in-15 years)
4(1-in-8 years)
3(1-in-10 years)
2(1-in-15 years)
1(1-in-30 years)
144
LEC Regional Water Supply Plan - Planning Document Chapter 4: Analysis and Evaluation of Model Results
percent seawater (17 ppt) within the upper Caloosahatchee Estuary during prolonged lowflow conditions. Similarly, relatively high salinity conditions, up to 80 percent of seawater(28 ppt), periodically occur in the St. Lucie Estuary. These relatively high salinityconditions (for an estuary) result in stress to estuarine organisms and reduction of theirpopulations due to increased predation and parasites. The dry season, low flow criteriaused in this analyses for the St. Lucie and Caloosahatchee estuaries represent preliminaryattempts to establish MFL criteria and performance measures for these systems. Districtstaff are continuing efforts to develop science-based minimum flow criteria for theCaloosahatchee and St. Lucie estuaries that are expected to be completed in 2000 and2001, respectively.
St. Lucie Estuary
Performance Measures Applied
Three performances measures were developed to help evaluate SFWMM modelresults for the St. Lucie Estuary:
• Number of times mean monthly flow exceeds 3,000 cfs (highdischarge criteria) as compared to target flow criteria
• Number of times mean monthly flow exceeds 2,000 cfs(recommended estuary protection criteria) as compared to targetflow
• Number of months that low flow criteria were not met (flows lessthan 350 cfs from Lake Okeechobee and the C-44 Basin)
Base Cases and Alternatives Results
1995 Base Case. High lake stages and runoff from local basins result in anincreased number of times that large volumes of fresh water are discharged to the St. LucieEstuary. Under the 1995 Base Case, the estuary experienced a high discharge event (meanmonthly flows greater than 3,000 cfs) approximately once every year on average duringthe 31-year simulation (Table 30). Fresh water releases of this magnitude resulted in theentire inner estuary becoming fresh water for one month or longer. These types of highvolume releases have a major impact on maintaining the estuary’s salinity regime, producepoor water quality, and significantly impact estuarine biota.
2020 Base Case. Increased water demands on Lake Okeechobee in 2020resulted in reduced numbers of high volume releases to the estuary, but did notsignificantly improve the number of times estuarine protection criteria (mean monthlyflow greater than 2,000 cfs) were exceeded (Table 30). This was an improvement over the1995 Base Case, but was still far from the preferred management target.
2020 with Restudy and LEC-1. The number of high volume discharge events(mean monthly flows greater than 3,000 cfs) which impact the estuary was reduced bymore than two-thirds compared to the 1995 Base Case and represents a major
145

Chapter 4: Analysis and Evaluation of Model Results LEC Regional Water Supply Plan - Planning Document
improvement in hydrologic performance. Both the 2020 with Restudy and LEC-1 modelsimulations almost met proposed performance targets for the St. Lucie Estuary (Table 30).Under these two simulations, mean monthly flows greater than 3,000 cfs (maximumdischarge volumes) were exceeded only eight times during the 31-year simulation period,compared to 30 times for the 1995 Base Case and 19 times for the 2020 Base Case.
The 2020 with Restudy and LEC-1 alternatives had fewer times when therecommended salinity envelope was exceeded (i.e., mean monthly flow volumes greaterthan 2,000 cfs). The 2020 with Restudy and LEC-1 model simulations showed only 27and 28 instances of the criteria being exceeded, respectively, during the 31-year simulationas compared to 60 events for the 1995 Base Case and 56 events for the 2020 Base Case.The recommended low flow criteria were met for the estuary during all simulations(Table 30).
Incremental Results
The number of high discharge events and the number of times proposed estuaryprotection criteria were exceeded for the St. Lucie Estuary were gradually reduced overtime (Table 31). Significant reductions in these performance measures first appeared inthe 2010 simulation, as a result of construction of regional storage reservoirs within theC-44 (St. Lucie) Basin, and showed continued improvement in the 2015 and LEC-1Revised simulations. Likewise, the number of times proposed estuary protection criteriawere exceeded for the estuary also showed improvement by 2010 for the same reasons.Incremental results also showed that estuary low flow targets were met for all years asshown in Table 31. Overall, these values were close enough to meeting the environmentalperformance measure targets developed for the estuary to be scored as green in Table 25.
Caloosahatchee Estuary
Performance Measures Applied
Three performances measures were developed to help evaluate SFWMM modelresults for the Caloosahatchee Estuary:
Table 30. Number of Times Discharge Criteria Were Exceeded for the St. Lucie Estuary During the31-Year Simulation Period.
Performance Measure Target1995
Base Case2020
Base Case2020 withRestudy LEC-1
Number of times mean monthly flow exceeded3,000 cfs (high discharge criteria)
5 30 19 8 8
Number of times mean monthly flows exceeded2,000 cfs (recommended salinity envelopcriteria)
23 60 56 27 28
Number of months that low flow criteria werenot met (flows less than 350 cfs)
178 150 158 51 127
146

LEC Regional Water Supply Plan - Planning Document Chapter 4: Analysis and Evaluation of Model Results
• Number of times mean monthly flow exceeded 4,500 cfs (highdischarge criteria) as compared to target flow criteria
• Number of times mean monthly flow exceeded 2,800 cfs(recommended estuary protection criteria) as compared to targetflow
• Number of months that low flow criteria were not met (flows lessthan 300 cfs from Lake Okeechobee and the C-43 Basin)
Base Cases and Alternatives Results
1995 Base Case. Results for the 1995 Base Case were similar to those observedfor the St. Lucie Estuary. High lake stages and runoff from local basins resulted in anincreased number of times that large volumes of fresh water were discharged to theCaloosahatchee Estuary. For the 1995 Base Case, the estuary experienced 36 highdischarge events (mean monthly flows greater than 4,500 cfs) as compared to the target ofonly six events during the 31-year simulation period (Table 32). Freshwater releases ofthis magnitude resulted in the entire inner estuary becoming fresh water for one month orlonger. These high volume releases had a major impact on maintaining the estuary’ssalinity regime, resulted in poor water quality, and impacted estuarine biota.
2020 Base Case. Increased water demands on Lake Okeechobee in 2020reduced the number of high volume releases to the Caloosahatchee Estuary (28 events)and slightly reduced the number of times estuarine protection criteria (mean monthly flowgreater than 2,800 cfs) were exceeded as compared to the 1995 Base Case (Table 32).This was an improvement over the 1995 Base Case, but was still far from therecommended target.
2020 with Restudy and LEC-1. Under these two water supply alternatives,mean monthly flows greater than 4,500 cfs (maximum discharge volumes) were exceededonly four times for the 2020 with Restudy and eight times for the LEC-1, as compared to36 times for the 1995 Base Case and 28 times for the 2020 Base Case. This represented amajor improvement in hydrologic performance for the Caloosahatchee Estuary. The 2020
Table 31. Number of Times Discharge Criteria Were Exceeded for the 31-Year Simulation Period inthe Incremental Simulations for the St. Lucie Estuary.
Performance measure Target
1995Revised
Base Case 2005 2010 2015LEC-1
Revised
Number of times mean monthly flowsexceeded 3,000 cfs (high dischargecriteria)
5 22 21 12 8 8
Number of times mean monthly flowsexceeded 2,000 cfs (estuaryprotection criteria)
23 61 56 38 28 29
Number of times low flow criteria werenot met (flows less than 350 cfs)
178 146 156 127 128 127
147
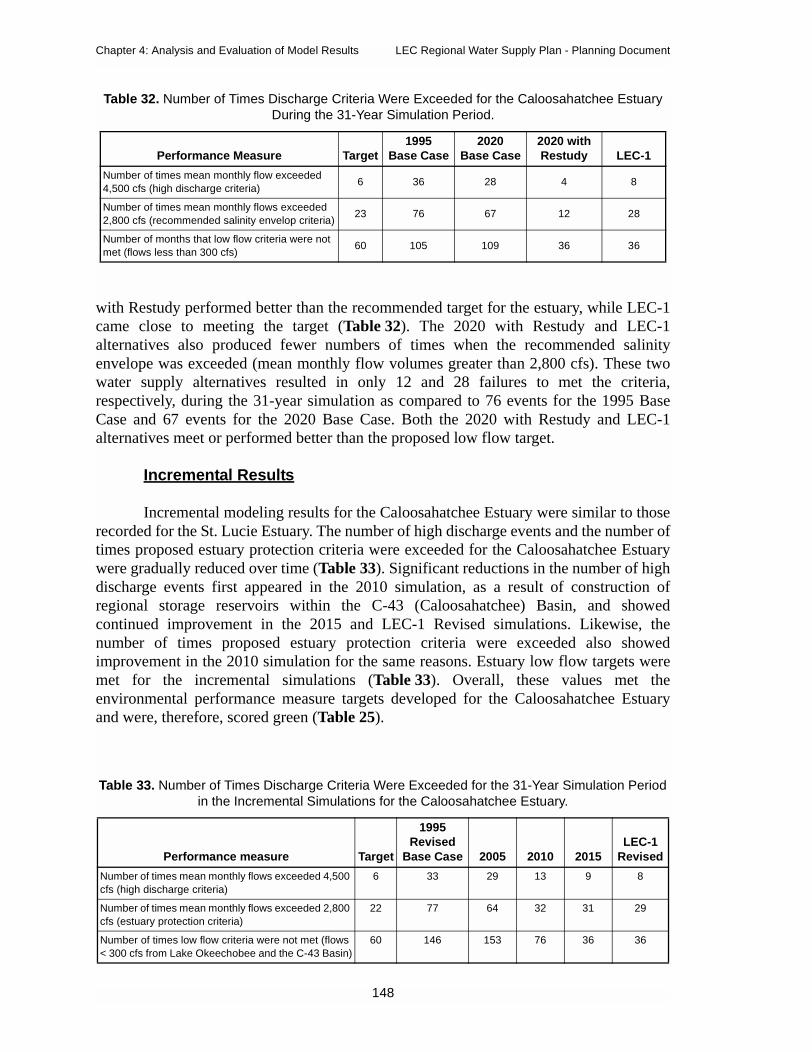
Chapter 4: Analysis and Evaluation of Model Results LEC Regional Water Supply Plan - Planning Document
with Restudy performed better than the recommended target for the estuary, while LEC-1came close to meeting the target (Table 32). The 2020 with Restudy and LEC-1alternatives also produced fewer numbers of times when the recommended salinityenvelope was exceeded (mean monthly flow volumes greater than 2,800 cfs). These twowater supply alternatives resulted in only 12 and 28 failures to met the criteria,respectively, during the 31-year simulation as compared to 76 events for the 1995 BaseCase and 67 events for the 2020 Base Case. Both the 2020 with Restudy and LEC-1alternatives meet or performed better than the proposed low flow target.
Incremental Results
Incremental modeling results for the Caloosahatchee Estuary were similar to thoserecorded for the St. Lucie Estuary. The number of high discharge events and the number oftimes proposed estuary protection criteria were exceeded for the Caloosahatchee Estuarywere gradually reduced over time (Table 33). Significant reductions in the number of highdischarge events first appeared in the 2010 simulation, as a result of construction ofregional storage reservoirs within the C-43 (Caloosahatchee) Basin, and showedcontinued improvement in the 2015 and LEC-1 Revised simulations. Likewise, thenumber of times proposed estuary protection criteria were exceeded also showedimprovement in the 2010 simulation for the same reasons. Estuary low flow targets weremet for the incremental simulations (Table 33). Overall, these values met theenvironmental performance measure targets developed for the Caloosahatchee Estuaryand were, therefore, scored green (Table 25).
Table 32. Number of Times Discharge Criteria Were Exceeded for the Caloosahatchee EstuaryDuring the 31-Year Simulation Period.
Performance Measure Target1995
Base Case2020
Base Case2020 withRestudy LEC-1
Number of times mean monthly flow exceeded4,500 cfs (high discharge criteria)
6 36 28 4 8
Number of times mean monthly flows exceeded2,800 cfs (recommended salinity envelop criteria)
23 76 67 12 28
Number of months that low flow criteria were notmet (flows less than 300 cfs)
60 105 109 36 36
Table 33. Number of Times Discharge Criteria Were Exceeded for the 31-Year Simulation Periodin the Incremental Simulations for the Caloosahatchee Estuary.
Performance measure Target
1995Revised
Base Case 2005 2010 2015LEC-1
Revised
Number of times mean monthly flows exceeded 4,500cfs (high discharge criteria)
6 33 29 13 9 8
Number of times mean monthly flows exceeded 2,800cfs (estuary protection criteria)
22 77 64 32 31 29
Number of times low flow criteria were not met (flows< 300 cfs from Lake Okeechobee and the C-43 Basin)
60 146 153 76 36 36
148
LEC Regional Water Supply Plan - Planning Document Chapter 4: Analysis and Evaluation of Model Results
Lake Worth Lagoon
The Lake Worth Lagoon is located along one of the most heavily urbanized areasof the LEC Planning Area. Historically, the lagoon has been subject to inlet and channeldredging, shoreline bulkhead construction, draining and filling of adjacent wetlands,causeway and bridge construction, dock and marina development, industrial and sewagewaste disposal, power plant operations, and storm water runoff from three major SouthFlorida drainage canals (C-51/S-155, C-15/S-40, and C-16/S-41). In general terms,problems associated with Lake Worth Lagoon are similar to those experienced in otherestuaries within the planning area. During high rainfall periods, large volumes of poorquality water are discharged into the lagoon from drainage basins located more than 20miles west of the lagoon (e.g. C-51 Basin). These high discharge periods deposit largeamounts of suspended solids and produce major impacts to both water quality and thesalinity regime of the inner lagoon. While the cumulative impacts of these activities havesignificantly altered the character of the lagoon and diminished its value as a healthyestuarine ecosystem, it still supports a number of important natural resources andrecreational values that should be protected.
Performance Measures Applied
Two performances measures were developed to help evaluate SFWMM modelresults for the Lake Worth Lagoon:
• The number of times a 14-day moving average discharges fromC-15, C-16, and C-51 canals exceeds 500 cfs during the 31-yearsimulation period was calculated. Preliminary modeling resultsobtained from Palm Beach County Department of ResourceManagement (DERM) indicates that flow discharges from theC-51 Canals within the range of 500 cfs was roughly equivalentto a salinity of about 23 ppt within the lagoon under steady stateconditions.
• The average annual wet and dry season flows delivered to theLake Worth Lagoon via C-51/S-155, C-15/S-40 and C-16/S-41during the 31-year simulation period was calculated.
Base Cases and Alternatives Results
1995 and 2020 Base Cases. Under current (1995 Base Case) conditions thelagoon experienced a high number of high volume discharge events with 308 monthsduring the 31-year simulation period exceeding 500 cfs (Table 34). Large volumes of poorquality water were discharged to the lagoon from upstream basins that drain urban andresidential developments. These high volume discharge events impacted both waterquality and the salinity regime of the inner lagoon. Under the 2020 Base Case, thenumbers of high discharge events were reduced by approximately 26 percent due, in part,to increased regional water supply demands and completion of STA-1 East as part of theEverglades Construction Project. The STA-1 East Project includes facilities to divide theC-51 Basin and pump water to the west from developed areas within western Palm Beach
149
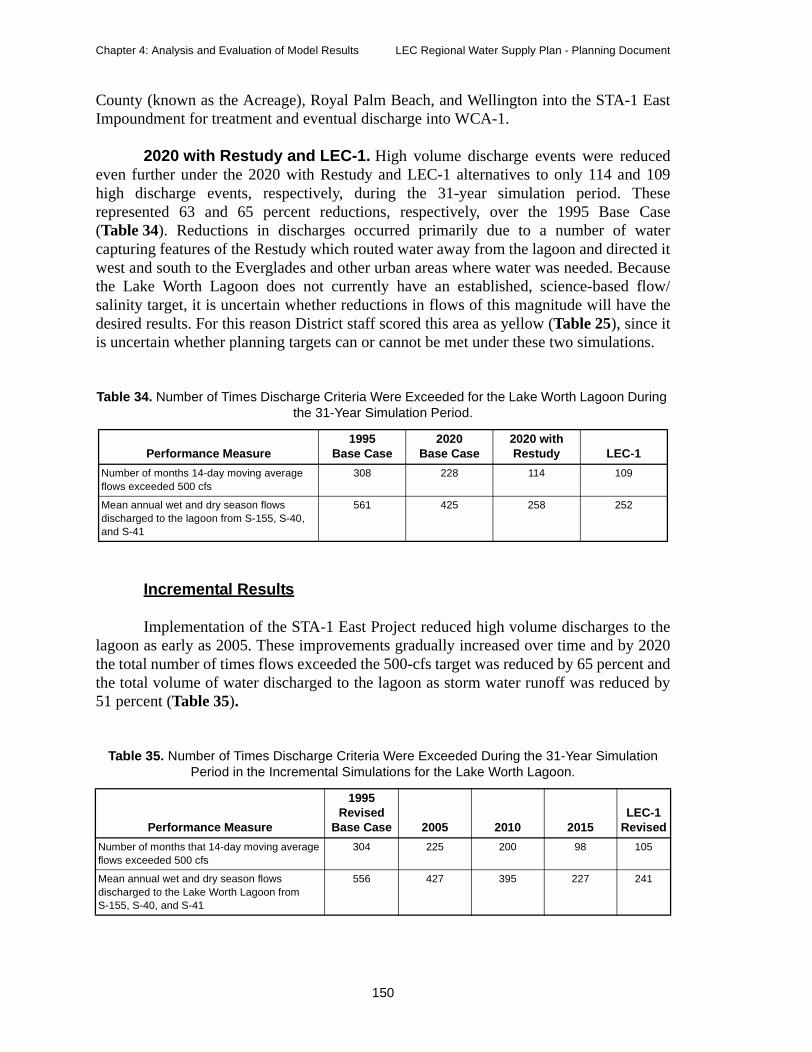
Chapter 4: Analysis and Evaluation of Model Results LEC Regional Water Supply Plan - Planning Document
County (known as the Acreage), Royal Palm Beach, and Wellington into the STA-1 EastImpoundment for treatment and eventual discharge into WCA-1.
2020 with Restudy and LEC-1. High volume discharge events were reducedeven further under the 2020 with Restudy and LEC-1 alternatives to only 114 and 109high discharge events, respectively, during the 31-year simulation period. Theserepresented 63 and 65 percent reductions, respectively, over the 1995 Base Case(Table 34). Reductions in discharges occurred primarily due to a number of watercapturing features of the Restudy which routed water away from the lagoon and directed itwest and south to the Everglades and other urban areas where water was needed. Becausethe Lake Worth Lagoon does not currently have an established, science-based flow/salinity target, it is uncertain whether reductions in flows of this magnitude will have thedesired results. For this reason District staff scored this area as yellow (Table 25), since itis uncertain whether planning targets can or cannot be met under these two simulations.
Incremental Results
Implementation of the STA-1 East Project reduced high volume discharges to thelagoon as early as 2005. These improvements gradually increased over time and by 2020the total number of times flows exceeded the 500-cfs target was reduced by 65 percent andthe total volume of water discharged to the lagoon as storm water runoff was reduced by51 percent (Table 35).
Table 34. Number of Times Discharge Criteria Were Exceeded for the Lake Worth Lagoon Duringthe 31-Year Simulation Period.
Performance Measure1995
Base Case2020
Base Case2020 withRestudy LEC-1
Number of months 14-day moving averageflows exceeded 500 cfs
308 228 114 109
Mean annual wet and dry season flowsdischarged to the lagoon from S-155, S-40,and S-41
561 425 258 252
Table 35. Number of Times Discharge Criteria Were Exceeded During the 31-Year SimulationPeriod in the Incremental Simulations for the Lake Worth Lagoon.
Performance Measure
1995Revised
Base Case 2005 2010 2015LEC-1
Revised
Number of months that 14-day moving averageflows exceeded 500 cfs
304 225 200 98 105
Mean annual wet and dry season flowsdischarged to the Lake Worth Lagoon fromS-155, S-40, and S-41
556 427 395 227 241
150
LEC Regional Water Supply Plan - Planning Document Chapter 4: Analysis and Evaluation of Model Results
Because a clearly defined environmental target has not yet been developed for theLake Worth Lagoon, this area was scored yellow, indicating that it is uncertain whetherflow reductions of these magnitudes will benefit the ecosystem. As part of the LECInterim Plan, a contract has been funded to work with Palm Beach County DERM todetermine both minimum and maximum flow targets for the major canals that dischargeinto the lagoon. This work is currently under way and should be completed within the nexttwo years.
Results for the Lake Worth Lagoon may need to be reevaluated in future planningefforts. The physical location of the S-155A structure varies from its location in theSFWMM. It was modeled further east than its actual location, and therefore, the modelmay underestimate flows to the lagoon. In addition, flows from C-17/S-44 need to beconsidered in the evaluation.
The Everglades
Performance Measures Applied
Performance measures for the Everglades were created with the intent of restoringthe essential hydrological features of the natural system that existed prior to drainage anddevelopment of the region. Most of the performance measures used in this evaluation aresimilar to those used by the Restudy, with addition of MFL criteria for Lake Okeechobee,the Everglades, and the Biscayne aquifer. These performance measures were used toevaluate each model simulation’s potential to (1) protect and support accretion of peat andmarl soils, (2) protect tree island communities, and (3) maintain Everglades sawgrass orridge and slough communities. The majority of performance measure targets for theEverglades were based on restoring the hydrological pattern predicted by the NaturalSystem Model version 4.5 Final (NSM), with a few exceptions. The performancemeasures applied are as follows:
• Ability to meet the Everglades minimum water level criteriapresented in Table 44 (SFWMD, 2000e)
• Ability to meet NSM-defined surface water inundation/durationpatterns, where appropriate
• Number and duration of extreme high and low water events
• Interannual depth variation (average and standard deviation ofwater depths for the months of May and October for the 31-yearsimulation period)
• Temporal variation in mean weekly stage
• Review of stage hydrographs and stage duration curves
More detailed descriptions of these performance measures and their associatedtargets can be found in Appendix D of this document.
151

Chapter 4: Analysis and Evaluation of Model Results LEC Regional Water Supply Plan - Planning Document
Overview of Everglades Results
Model results for each alternative were evaluated at the level of individual indica-tor regions. An indicator region is a grouping of model grid cells within the SFWMM thatconsists of similar vegetation cover and soil type. These larger groupings of cells weredeveloped to reduce the uncertainty of evaluating results from a single two-by-two squaremile grid cell that represents a single water management gage or area. Figure 27 showsthe location of each indicator region evaluated in this study.
For final analyses, indicator regions that fell within areas of similar hydrologicalconditions or within the same impoundment system were grouped together. The final eval-uation classified the indicator regions into 11 hydrological subregions of the Everglades:
• Arthur R. Marshall Loxahatchee National Wildlife Refuge(WCA-1): Indicator Regions 26 and 27
• Holey Land and Rotenberger WMAs: Indicator Regions 29 and28
Figure 27. Everglades Indicator Regions used inthe Analysis of Model Run Alternatives.
152
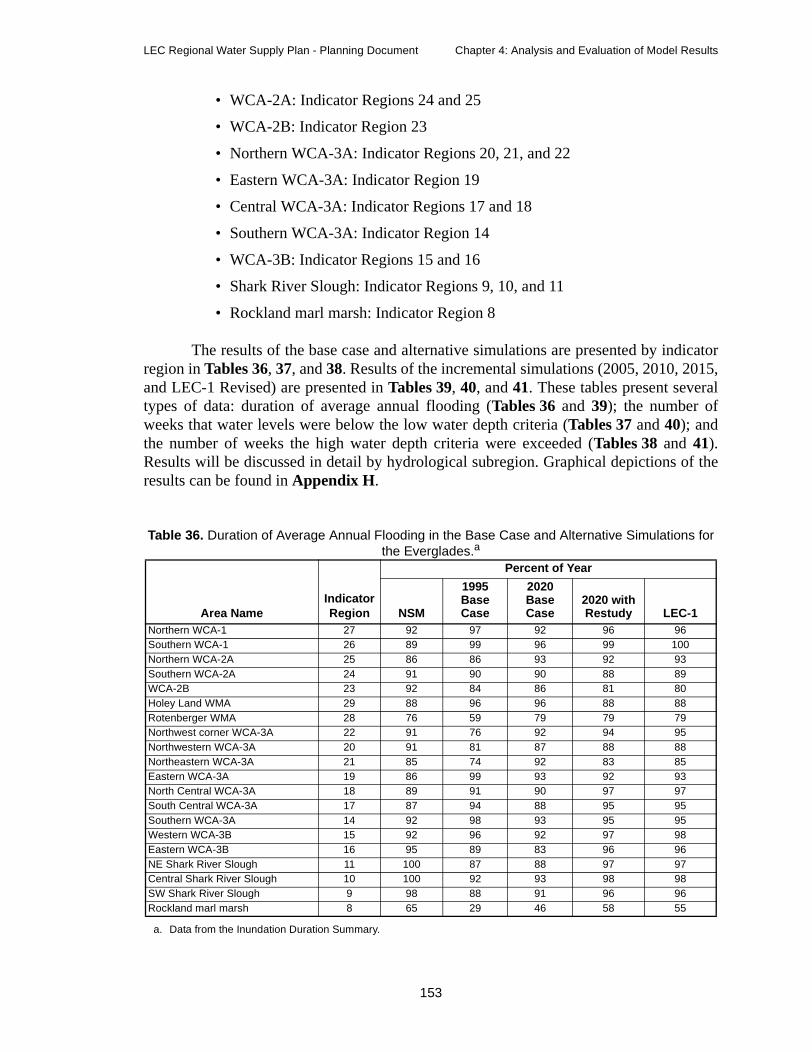
LEC Regional Water Supply Plan - Planning Document Chapter 4: Analysis and Evaluation of Model Results
• WCA-2A: Indicator Regions 24 and 25
• WCA-2B: Indicator Region 23
• Northern WCA-3A: Indicator Regions 20, 21, and 22
• Eastern WCA-3A: Indicator Region 19
• Central WCA-3A: Indicator Regions 17 and 18
• Southern WCA-3A: Indicator Region 14
• WCA-3B: Indicator Regions 15 and 16
• Shark River Slough: Indicator Regions 9, 10, and 11
• Rockland marl marsh: Indicator Region 8
The results of the base case and alternative simulations are presented by indicatorregion in Tables 36, 37, and 38. Results of the incremental simulations (2005, 2010, 2015,and LEC-1 Revised) are presented in Tables 39, 40, and 41. These tables present severaltypes of data: duration of average annual flooding (Tables 36 and 39); the number ofweeks that water levels were below the low water depth criteria (Tables 37 and 40); andthe number of weeks the high water depth criteria were exceeded (Tables 38 and 41).Results will be discussed in detail by hydrological subregion. Graphical depictions of theresults can be found in Appendix H.
Table 36. Duration of Average Annual Flooding in the Base Case and Alternative Simulations forthe Everglades.a
a. Data from the Inundation Duration Summary.
Area NameIndicatorRegion
Percent of Year
NSM
1995BaseCase
2020BaseCase
2020 withRestudy LEC-1
Northern WCA-1 27 92 97 92 96 96Southern WCA-1 26 89 99 96 99 100Northern WCA-2A 25 86 86 93 92 93Southern WCA-2A 24 91 90 90 88 89WCA-2B 23 92 84 86 81 80Holey Land WMA 29 88 96 96 88 88Rotenberger WMA 28 76 59 79 79 79Northwest corner WCA-3A 22 91 76 92 94 95Northwestern WCA-3A 20 91 81 87 88 88Northeastern WCA-3A 21 85 74 92 83 85Eastern WCA-3A 19 86 99 93 92 93North Central WCA-3A 18 89 91 90 97 97South Central WCA-3A 17 87 94 88 95 95Southern WCA-3A 14 92 98 93 95 95Western WCA-3B 15 92 96 92 97 98Eastern WCA-3B 16 95 89 83 96 96NE Shark River Slough 11 100 87 88 97 97Central Shark River Slough 10 100 92 93 98 98SW Shark River Slough 9 98 88 91 96 96Rockland marl marsh 8 65 29 46 58 55
153
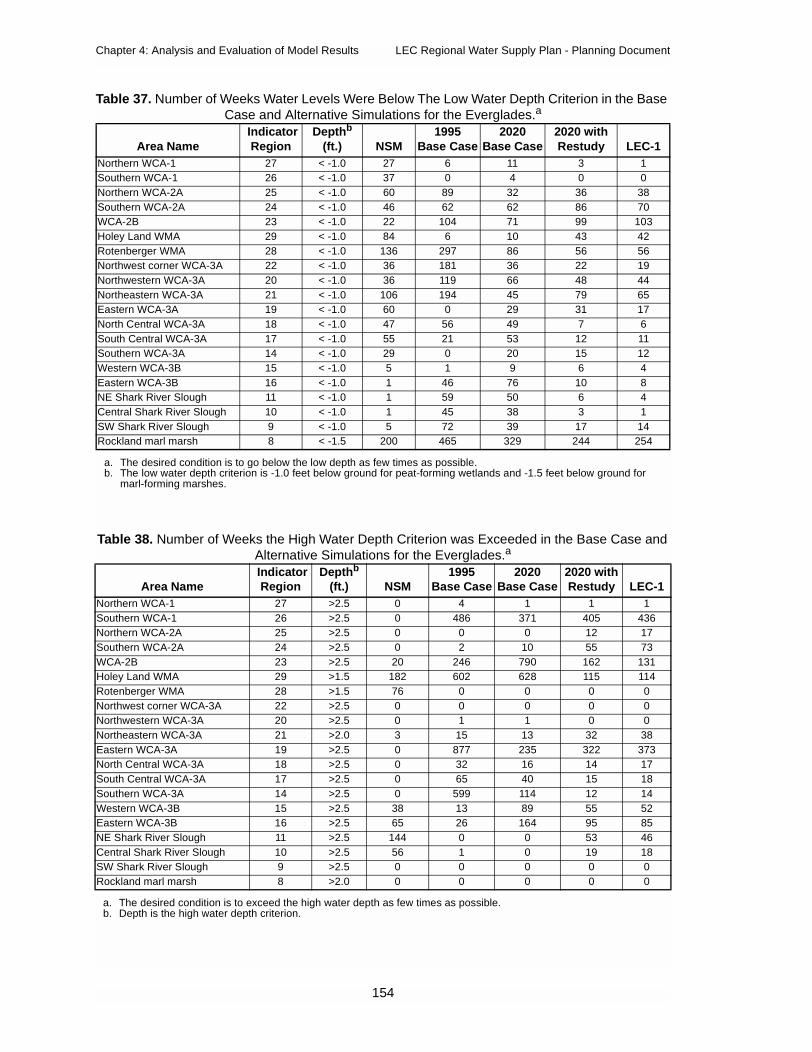
Chapter 4: Analysis and Evaluation of Model Results LEC Regional Water Supply Plan - Planning Document
Table 37. Number of Weeks Water Levels Were Below The Low Water Depth Criterion in the BaseCase and Alternative Simulations for the Everglades.a
Area NameIndicatorRegion
Depthb
(ft.) NSM1995
Base Case2020
Base Case2020 withRestudy LEC-1
Northern WCA-1 27 < -1.0 27 6 11 3 1Southern WCA-1 26 < -1.0 37 0 4 0 0Northern WCA-2A 25 < -1.0 60 89 32 36 38Southern WCA-2A 24 < -1.0 46 62 62 86 70WCA-2B 23 < -1.0 22 104 71 99 103Holey Land WMA 29 < -1.0 84 6 10 43 42Rotenberger WMA 28 < -1.0 136 297 86 56 56Northwest corner WCA-3A 22 < -1.0 36 181 36 22 19Northwestern WCA-3A 20 < -1.0 36 119 66 48 44Northeastern WCA-3A 21 < -1.0 106 194 45 79 65Eastern WCA-3A 19 < -1.0 60 0 29 31 17North Central WCA-3A 18 < -1.0 47 56 49 7 6South Central WCA-3A 17 < -1.0 55 21 53 12 11Southern WCA-3A 14 < -1.0 29 0 20 15 12Western WCA-3B 15 < -1.0 5 1 9 6 4Eastern WCA-3B 16 < -1.0 1 46 76 10 8NE Shark River Slough 11 < -1.0 1 59 50 6 4Central Shark River Slough 10 < -1.0 1 45 38 3 1SW Shark River Slough 9 < -1.0 5 72 39 17 14Rockland marl marsh 8 < -1.5 200 465 329 244 254
a. The desired condition is to go below the low depth as few times as possible.b. The low water depth criterion is -1.0 feet below ground for peat-forming wetlands and -1.5 feet below ground for
marl-forming marshes.
Table 38. Number of Weeks the High Water Depth Criterion was Exceeded in the Base Case andAlternative Simulations for the Everglades.a
a. The desired condition is to exceed the high water depth as few times as possible.
Area NameIndicatorRegion
Depthb
(ft.)
b. Depth is the high water depth criterion.
NSM1995
Base Case2020
Base Case2020 withRestudy LEC-1
Northern WCA-1 27 >2.5 0 4 1 1 1Southern WCA-1 26 >2.5 0 486 371 405 436Northern WCA-2A 25 >2.5 0 0 0 12 17Southern WCA-2A 24 >2.5 0 2 10 55 73WCA-2B 23 >2.5 20 246 790 162 131Holey Land WMA 29 >1.5 182 602 628 115 114Rotenberger WMA 28 >1.5 76 0 0 0 0Northwest corner WCA-3A 22 >2.5 0 0 0 0 0Northwestern WCA-3A 20 >2.5 0 1 1 0 0Northeastern WCA-3A 21 >2.0 3 15 13 32 38Eastern WCA-3A 19 >2.5 0 877 235 322 373North Central WCA-3A 18 >2.5 0 32 16 14 17South Central WCA-3A 17 >2.5 0 65 40 15 18Southern WCA-3A 14 >2.5 0 599 114 12 14Western WCA-3B 15 >2.5 38 13 89 55 52Eastern WCA-3B 16 >2.5 65 26 164 95 85NE Shark River Slough 11 >2.5 144 0 0 53 46Central Shark River Slough 10 >2.5 56 1 0 19 18SW Shark River Slough 9 >2.5 0 0 0 0 0Rockland marl marsh 8 >2.0 0 0 0 0 0
154

LEC Regional Water Supply Plan - Planning Document Chapter 4: Analysis and Evaluation of Model Results
Table 39. Duration of Average Annual Flooding in the Incremental Simulations for theEverglades.a
Area NameIndicatorRegion
Percent of the Year
NSMb1995 Revised
Base Case 2005 2010 2015LEC-1
RevisedNorthern WCA-1 27 92 96 92 94 95 96Southern WCA-1 26 89 99 96 97 98 99Northern WCA-2A 25 86 86 92 89 92 93Southern WCA-2A 24 91 90 86 89 91 91WCA-2B 23 92 84 74 78 82 83Holey Land WMA 29 88 96 96 87 88 88Rotenberger WMA 28 76 59 74 79 79 79Northwest corner WCA-3A 22 91 76 85 91 94 94Northwestern WCA-3A 20 91 80 81 87 91 88Northeastern WCA-3A 21 85 74 87 85 84 83Eastern WCA-3A 19 86 98 99 91 91 93North Central WCA-3A 18 89 91 89 94 98 97South Central WCA-3A 17 87 94 93 90 93 95Southern WCA-3A 14 92 98 98 92 91 95Western WCA-3B 15 92 96 96 93 93 98Eastern WCA-3B 16 95 89 88 90 90 96NE Shark River Slough 11 100 87 87 86 91 97Central Shark River Slough 10 100 92 90 92 94 98SW Shark River Slough 9 98 88 89 91 92 96Rockland marl marsh 8 65 29 58 51 53 55
a. Data from Inundation Duration Summary for the incremental simulationb. NSM = Natural System Model version 4.5 Final
Table 40. Number of Weeks Water Levels Were Below the Low Water Depth Criterion in theIncremental Simulations for the Everglades.a
a. The desired condition is to go below the low water depth as few times as possible.
Area NameIndicatorRegion
Depthb
(ft)
b. The low water depth criterion is -1.0 feet below ground for peat-forming wetlands and -1.5 feet below ground formarl-forming marshes.
NSMc
c. NSM = Natural System Model version 4.5 Final
1995 RevisedBase Case 2005 2010 2015
LEC-1Revised
Northern WCA-1 27 < -1.0 27 6 13 6 4 1Southern WCA-1 26 < -1.0 37 0 2 2 1 0Northern WCA-2A 25 < -1.0 60 87 43 65 34 33Southern WCA-2A 24 < -1.0 46 64 81 70 56 60WCA-2B 23 < -1.0 22 110 184 142 105 89Holey Land WMA 29 < -1.0 84 6 9 44 43 41Rotenberger WMA 28 < -1.0 136 297 163 57 57 56Northwest corner WCA-3A 22 < -1.0 36 185 92 35 22 14Northwestern WCA-3A 20 < -1.0 36 123 121 63 28 43Northeastern WCA-3A 21 < -1.0 106 195 97 104 85 91Eastern WCA-3A 19 < -1.0 60 1 0 47 35 25North Central WCA-3A 18 < -1.0 47 56 55 31 5 6South Central WCA-3A 17 < -1.0 55 21 28 40 24 13Southern WCA-3A 14 < -1.0 29 0 1 36 32 13Western WCA-3B 15 < -1.0 5 1 2 27 29 5Eastern WCA-3B 16 < -1.0 1 47 46 60 55 9NE Shark River Slough 11 < -1.0 1 60 67 61 30 6Central Shark River Slough 10 < -1.0 1 45 60 46 31 5SW Shark River Slough 9 < -1.0 5 71 64 51 44 12Rockland marl marsh 8 < -1.5 200 470 321 336 309 263
155
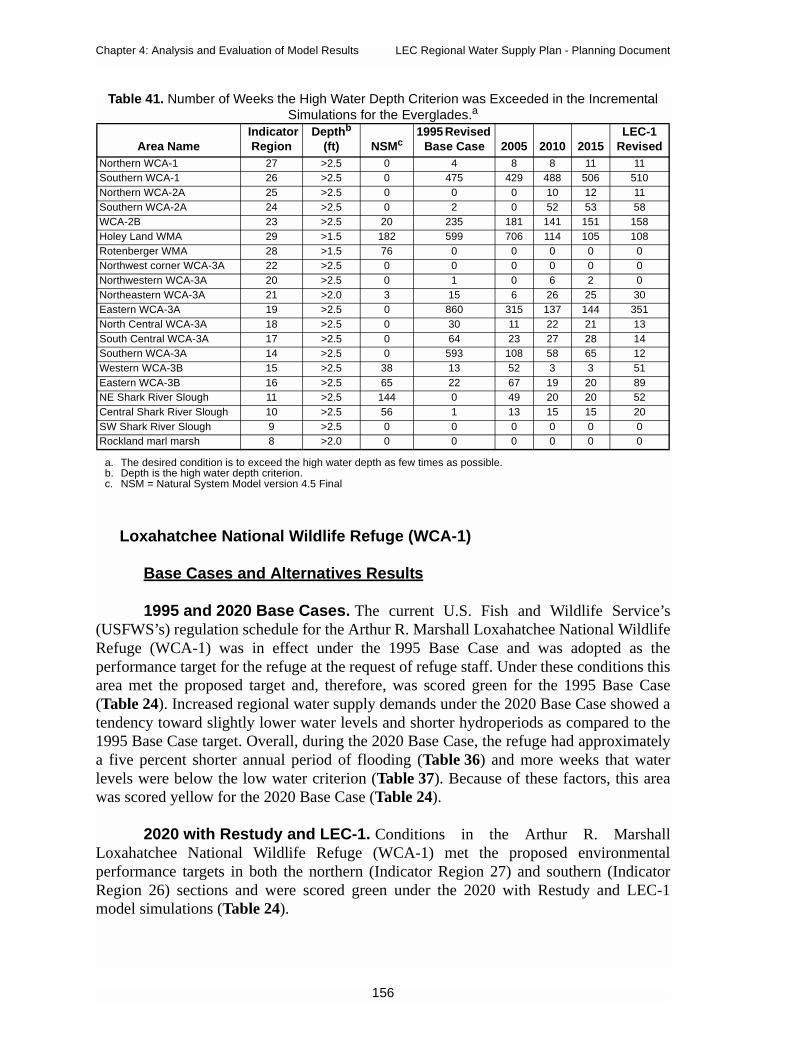
Chapter 4: Analysis and Evaluation of Model Results LEC Regional Water Supply Plan - Planning Document
Loxahatchee National Wildlife Refuge (WCA-1)
Base Cases and Alternatives Results
1995 and 2020 Base Cases. The current U.S. Fish and Wildlife Service’s(USFWS’s) regulation schedule for the Arthur R. Marshall Loxahatchee National WildlifeRefuge (WCA-1) was in effect under the 1995 Base Case and was adopted as theperformance target for the refuge at the request of refuge staff. Under these conditions thisarea met the proposed target and, therefore, was scored green for the 1995 Base Case(Table 24). Increased regional water supply demands under the 2020 Base Case showed atendency toward slightly lower water levels and shorter hydroperiods as compared to the1995 Base Case target. Overall, during the 2020 Base Case, the refuge had approximatelya five percent shorter annual period of flooding (Table 36) and more weeks that waterlevels were below the low water criterion (Table 37). Because of these factors, this areawas scored yellow for the 2020 Base Case (Table 24).
2020 with Restudy and LEC-1. Conditions in the Arthur R. MarshallLoxahatchee National Wildlife Refuge (WCA-1) met the proposed environmentalperformance targets in both the northern (Indicator Region 27) and southern (IndicatorRegion 26) sections and were scored green under the 2020 with Restudy and LEC-1model simulations (Table 24).
Table 41. Number of Weeks the High Water Depth Criterion was Exceeded in the IncrementalSimulations for the Everglades.a
Area NameIndicatorRegion
Depthb
(ft) NSMc1995 Revised
Base Case 2005 2010 2015LEC-1
RevisedNorthern WCA-1 27 >2.5 0 4 8 8 11 11Southern WCA-1 26 >2.5 0 475 429 488 506 510Northern WCA-2A 25 >2.5 0 0 0 10 12 11Southern WCA-2A 24 >2.5 0 2 0 52 53 58WCA-2B 23 >2.5 20 235 181 141 151 158Holey Land WMA 29 >1.5 182 599 706 114 105 108Rotenberger WMA 28 >1.5 76 0 0 0 0 0Northwest corner WCA-3A 22 >2.5 0 0 0 0 0 0Northwestern WCA-3A 20 >2.5 0 1 0 6 2 0Northeastern WCA-3A 21 >2.0 3 15 6 26 25 30Eastern WCA-3A 19 >2.5 0 860 315 137 144 351North Central WCA-3A 18 >2.5 0 30 11 22 21 13South Central WCA-3A 17 >2.5 0 64 23 27 28 14Southern WCA-3A 14 >2.5 0 593 108 58 65 12Western WCA-3B 15 >2.5 38 13 52 3 3 51Eastern WCA-3B 16 >2.5 65 22 67 19 20 89NE Shark River Slough 11 >2.5 144 0 49 20 20 52Central Shark River Slough 10 >2.5 56 1 13 15 15 20SW Shark River Slough 9 >2.5 0 0 0 0 0 0Rockland marl marsh 8 >2.0 0 0 0 0 0 0
a. The desired condition is to exceed the high water depth as few times as possible.b. Depth is the high water depth criterion.c. NSM = Natural System Model version 4.5 Final
156

LEC Regional Water Supply Plan - Planning Document Chapter 4: Analysis and Evaluation of Model Results
Incremental Results
The current USFWS’s regulation schedule for the Arthur R. Marshall LoxahatcheeNational Wildlife Refuge (WCA-1) was in effect under the 1995 Revised Base Case andwas adopted as the performance target for the area. Under these conditions this area metthe proposed target and, therefore, was scored green for the 1995 Revised Base Case(Table 25). Increased regional water supply demands under the 2005 simulation showed atendency toward slightly lower water levels as compared to the 1995 Revised Base Case.Overall, the 2005 simulation had a shorter annual period of flooding (Table 39) and asmall increase in the number of weeks that water levels were below the low water criterion(Table 40). Because of these factors, this area was scored green/yellow for the 2005simulation (Table 25). However, conditions in the Arthur R. Marshall LoxahatcheeNational Wildlife Refuge (WCA-1) closely match the 1995 Revised Base Case for the2010, 2015, and the LEC-1 Revised simulations (Tables 39, 40, and 41) and was scoredgreen (Table 25).
Water Conservation Area 2A
Base Cases and Alternatives Results
1995 and 2020 Base Cases. Water levels were consistently higher andfluctuated over a wider range of water depths as compared to the NSM target in the 1995and 2020 base cases for WCA-2A. In particular, northern WCA-2A (Indicator Region 25)exhibited wet and dry season water depth ranges in excess of NSM targets (Tables 37 and38). These deeper water levels are presumed to be undesirable for the recovery andmaintenance of the remaining tree islands. Under the base cases, the water levels in WCA-2A were below the low water depth criterion (number of times that water levels fell morethan one foot below ground) more often than the NSM target (Table 37). These events areundesirable for the protection and accretion of peat soils. Although southern WCA-2A(Indicator Region 24) performed better, wet season surface water ponding generallyelevated water levels above the NSM target range. WCA-2A was scored green/yellow forboth simulations to account for differences in performance between northern and southernWCA-2A (Table 24).
2020 with Restudy and LEC-1. WCA-2A did not perform better in the 2020with Restudy or LEC-1 alternatives, and was scored green/yellow (Table 24).Performance during the base case and alternative simulations was very similar. The maindifference was that the high water criterion (number of weeks water depths exceeded 2.5feet) was exceeded during more weeks under the 2020 with Restudy and LEC-1simulations than during the 1995 and 2020 base cases (Table 38). It appears that watermanagement in this area creates trade-offs between flooding and drying that are difficultto balance. Operational parameters or physical features can be further refined to bring theperformance of this area closer to the NSM target.
157
Chapter 4: Analysis and Evaluation of Model Results LEC Regional Water Supply Plan - Planning Document
Incremental Results
Overall, the northern and southern portions of WCA-2A contrasted in performancefor the incremental simulations. Water levels and hydroperiods within northern WCA-2A(Indicator Region 25) came close to meeting NSM-defined targets (Tables 39 and 41). Forthis reason, northern WCA-2A was scored green for generally meeting the target. Incontrast, under the 2010, 2015, and LEC-1 Revised simulations, southern WCA-2A(Indicator Region 24) exhibited water depths in excess of NSM-defined targets during wetyears (Tables 39 and 41). These deep water conditions may be undesirable for therecovery and maintenance of remaining tree islands. For this reason, southern WCA-2Awas scored yellow for these incremental simulations. Because of the large difference inperformance between southern and northern WCA-2A, this area was given an overallscored of green/yellow for all of the incremental simulations (Table 25).
Water Conservation Area 2B
Base Cases and Alternatives Results
1995 and 2020 Base Cases. WCA-2B (Indicator Region 23) performedpoorly in both the 1995 and 2020 base cases. Water levels were much higher and muchmore variable as compared to the NSM target (Table 38). Inundation patterns were ofmuch longer duration (Table 36), with more frequent and more extreme high and lowwater periods (Tables 37 and 38). The high water criterion (number of weeks that surfacewater depth was greater than 2.5 feet) was exceeded 50 percent of the time in the 2020Base Case. These sustained inundation depths would be detrimental to tree island andsawgrass communities within this WCA. Annual ranges of depth between wet and dryseasons were larger than the target. Many of the problems in this area are due to itsrelatively small size; its location above the Biscayne aquifer, which results in largeseepage losses; its unusual shape that promotes ponding in its southern end; and itsposition in the landscape. Because of the magnitude of difference between the NSM targetand the 1995 Base Case, this area was scored red (Table 24).
2020 with Restudy and LEC-1. Although a number of different managementstrategies (e.g., rain-driven system, regulation schedule) have been tried within theRestudy and LEC regional water supply planning efforts, few have been successful inmeeting NSM targets for this area. The 2020 with Restudy and LEC-1 alternatives alsohad problems meeting both high water and low water criteria (Tables 37 and 38).However, the LEC-1 simulation performed better than the 2020 with Restudy. Althoughthese events were not as severe as those in the base cases, sufficient deviations from theNSM target occurred to warrant a red score for this area (Table 24).
Incremental Results
WCA-2B (Indicator Region 23) performed poorly in both the 1995 Revised BaseCase and throughout the incremental simulations. In the 1995 Revised Base Case, waterlevels were much higher and much more variable as compared to the NSM targets(Tables 40 and 41). Inundation patterns were of much longer duration (Table 39), with
158

LEC Regional Water Supply Plan - Planning Document Chapter 4: Analysis and Evaluation of Model Results
more frequent and more extreme high water and low water periods (Tables 40 and 41).The high water criterion was often exceeded. Sustained inundation depths near or greaterthan 2.5 feet would be detrimental to tree island and sawgrass communities within thisWCA. Annual ranges of water depths between wet and dry seasons were larger than thetarget. Although problems with high water improved somewhat through time, this camewith a trade-off of significant increases in the occurrence of drying events. For allincremental simulations, WCA-2B was scored red (Table 25). Alternate D13R of theRestudy recognized this problem and arrived at the same conclusions (USACE andSFWMD, 1999). Many of the problems in this area are due to its relatively small size; itslocation above the Biscayne aquifer, which results in large seepage losses; its unusualshape that promotes ponding in its southern end; and its position in the landscape.
Holey Land and Rotenberger Wildlife Management Areas
Base Cases and Alternatives Results
1995 and 2020 Base Cases. For the 1995 and 2020 base cases, the HoleyLand WMA (Indicator Region 29) had higher water levels than the NSM target(Table 38). The high water depth criterion was exceeded during more than 600 weeks,which was more than three times the target (Table 38). This was due to the fact that theFWC’s regulation schedule was in effect. Water levels exceeded the high water criterionfor approximately 35 percent of the year and low water periods were infrequent. For thisreason, the Holey Land WMA was scored yellow for the 1995 and 2020 base cases. Incontrast, in the 1995 Base Case, the Rotenberger WMA (Indicator Region 28) had a muchshorter average annual inundation period than the target (Table 36). In the 1995 BaseCase, this area had more than double the number of weeks that water levels were belowthe low water depth criterion (one foot below the soil surface) (Table 37), and for thisreason, the Rotenberger WMA was scored red for the 1995 Base Case (Table 24). In the2020 Base Case, conditions improved greatly in this WMA due to the operation ofupstream STAs and the Rotenberger WMA was scored green for this simulation(Table 24).
2020 with Restudy and LEC-1. Conditions in the Holey Land andRotenberger WMAs were much improved in both the 2020 with Restudy and LEC-1alternatives. Water levels were maintained near that of the NSM targets (Table 37 and 38)and, for this reason, both WMAs were scored green for these alternatives (Table 24).
Incremental Results
Generally, the Holey Land and Rotenberger WMAs showed incrementalimprovements over the base case conditions and NSM-defined targets were met during the2010 simulation (Tables 39, 40, and 41). For the 1995 Revised Base Case and 2005simulations, the Holey Land WMA (Indicator Region 29) had higher water levels than theNSM target (Table 41). This was due to the fact that the FWC’s regulation schedule wasin effect. The number of weeks that the high water depth criterion was exceeded was morethan three times the target for these two simulations (Table 41). Water levels exceeded thehigh water criterion for more than 30 percent of the year and low water periods were
159
Chapter 4: Analysis and Evaluation of Model Results LEC Regional Water Supply Plan - Planning Document
infrequent (Table 40). For this reason, the Holey Land WMA was scored red for the 1995Revised Base Case and the 2005 simulations. In contrast, the Rotenberger WMA(Indicator Region 28) had a much shorter average annual inundation period in the 1995Revised Base Case than the target (Table 39). This area had more than double the numberof weeks that water levels were below the low water depth criterion (one foot below thesoil surface) compared to the NSM target (Table 40). As a result, the Rotenberger WMAwas scored red for the 1995 Revised Base Case. During the 2005 simulation, conditionsimproved greatly in this WMA due to the operation of upstream STAs and the area wasscored yellow. Performance was near that of the NSM targets in both the Holey Land andRotenberger WMAs during the 2010, 2015, and LEC-1 Revised simulations and theWMAs were scored green for these simulations (Table 25).
Northern Water Conservation Area 3A
Base Cases and Alternatives Results
1995 and 2020 Base Cases. Northeastern WCA-3A (Indicator Region 21)performed poorly in the 1995 Base Case. In general, this area had a problem with bothhigh and low water extremes (Tables 37 and 38). This area had 11 percent less averageannual duration of flooding (Table 36), indicating that more severe drying eventsoccurred. Performance improved somewhat in the 2020 Base Case, prompting a changefrom a red score in the 1995 Base Case to yellow in the 2020 Base Case (Table 24).
In the 1995 Base Case, northwestern WCA-3A (Indicator Regions 20 and 22)suffered from chronic low water conditions and overdrained conditions in most years(Table 37). As compared to the NSM target, the average period of annual flooding wasmore than 10 percent shorter (Table 36), resulting in extended periods of more severedrying increasing the frequency of muck fires, which impact tree islands and wildlife.Because of these problems, northwestern WCA-3A was scored red in the 1995 Base Case(Table 24). Under the 2020 Base Case, conditions improved significantly with theoperation of the STAs to the north of WCA-3A (Tables 36, 37, and 38). This increasedhydroperiod gave this area more NSM-like hydrology. Therefore, northwestern WCA-3Awas scored green for the 2020 Base Case (Table 24).
2020 with Restudy and LEC-1. In both the 2020 with Restudy and LEC-1alternatives, northern WCA-3A performed well and showed much improvement over the1995 and 2020 base cases (Tables 36, 37, and 38). The hydropatterns were NSM-like,aided by the operation of the EAA Storage Reservoirs, the completed STAs to the north,and other Restudy components. This area was scored green in both alternatives(Table 24).
Incremental Results
Generally, northern WCA-3A showed incremental improvements over the basecase conditions and NSM-defined targets were met by 2010. Northern WCA-3A(Indicator Regions 20, 21, and 22) performed poorly in the 1995 Revised Base Case. Ingeneral, this area had a problem with drying and water levels often fell below the low
160
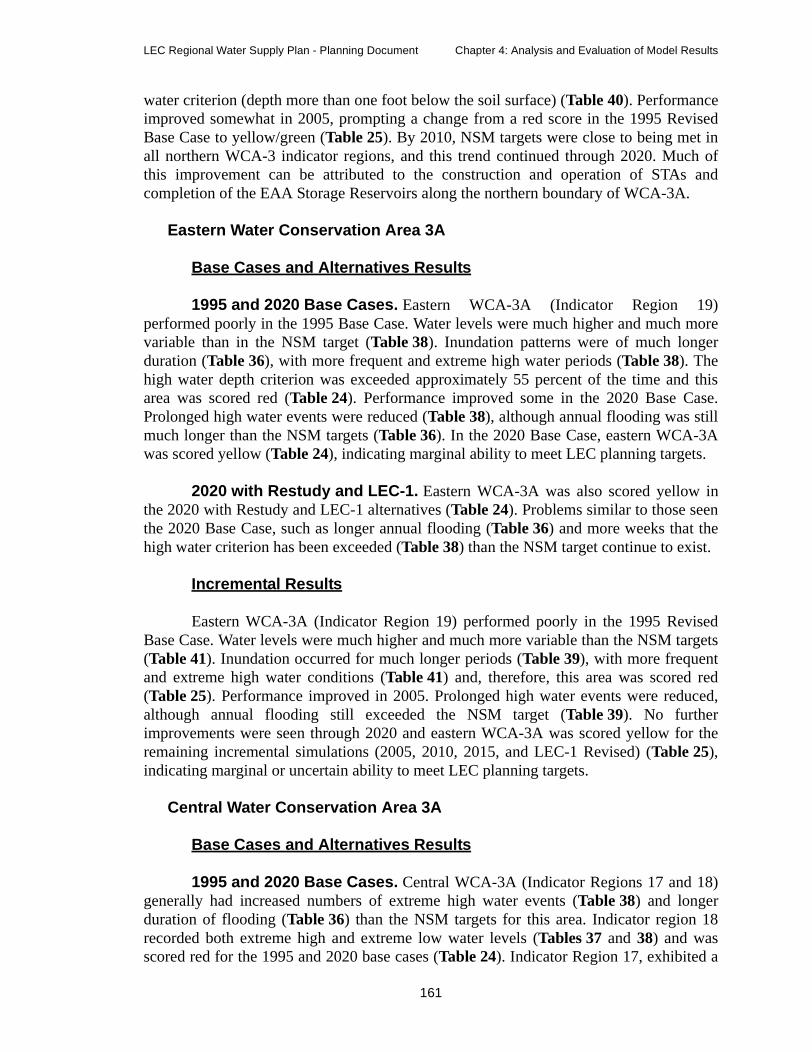
LEC Regional Water Supply Plan - Planning Document Chapter 4: Analysis and Evaluation of Model Results
water criterion (depth more than one foot below the soil surface) (Table 40). Performanceimproved somewhat in 2005, prompting a change from a red score in the 1995 RevisedBase Case to yellow/green (Table 25). By 2010, NSM targets were close to being met inall northern WCA-3 indicator regions, and this trend continued through 2020. Much ofthis improvement can be attributed to the construction and operation of STAs andcompletion of the EAA Storage Reservoirs along the northern boundary of WCA-3A.
Eastern Water Conservation Area 3A
Base Cases and Alternatives Results
1995 and 2020 Base Cases. Eastern WCA-3A (Indicator Region 19)performed poorly in the 1995 Base Case. Water levels were much higher and much morevariable than in the NSM target (Table 38). Inundation patterns were of much longerduration (Table 36), with more frequent and extreme high water periods (Table 38). Thehigh water depth criterion was exceeded approximately 55 percent of the time and thisarea was scored red (Table 24). Performance improved some in the 2020 Base Case.Prolonged high water events were reduced (Table 38), although annual flooding was stillmuch longer than the NSM targets (Table 36). In the 2020 Base Case, eastern WCA-3Awas scored yellow (Table 24), indicating marginal ability to meet LEC planning targets.
2020 with Restudy and LEC-1. Eastern WCA-3A was also scored yellow inthe 2020 with Restudy and LEC-1 alternatives (Table 24). Problems similar to those seenthe 2020 Base Case, such as longer annual flooding (Table 36) and more weeks that thehigh water criterion has been exceeded (Table 38) than the NSM target continue to exist.
Incremental Results
Eastern WCA-3A (Indicator Region 19) performed poorly in the 1995 RevisedBase Case. Water levels were much higher and much more variable than the NSM targets(Table 41). Inundation occurred for much longer periods (Table 39), with more frequentand extreme high water conditions (Table 41) and, therefore, this area was scored red(Table 25). Performance improved in 2005. Prolonged high water events were reduced,although annual flooding still exceeded the NSM target (Table 39). No furtherimprovements were seen through 2020 and eastern WCA-3A was scored yellow for theremaining incremental simulations (2005, 2010, 2015, and LEC-1 Revised) (Table 25),indicating marginal or uncertain ability to meet LEC planning targets.
Central Water Conservation Area 3A
Base Cases and Alternatives Results
1995 and 2020 Base Cases. Central WCA-3A (Indicator Regions 17 and 18)generally had increased numbers of extreme high water events (Table 38) and longerduration of flooding (Table 36) than the NSM targets for this area. Indicator region 18recorded both extreme high and extreme low water levels (Tables 37 and 38) and wasscored red for the 1995 and 2020 base cases (Table 24). Indicator Region 17, exhibited a
161
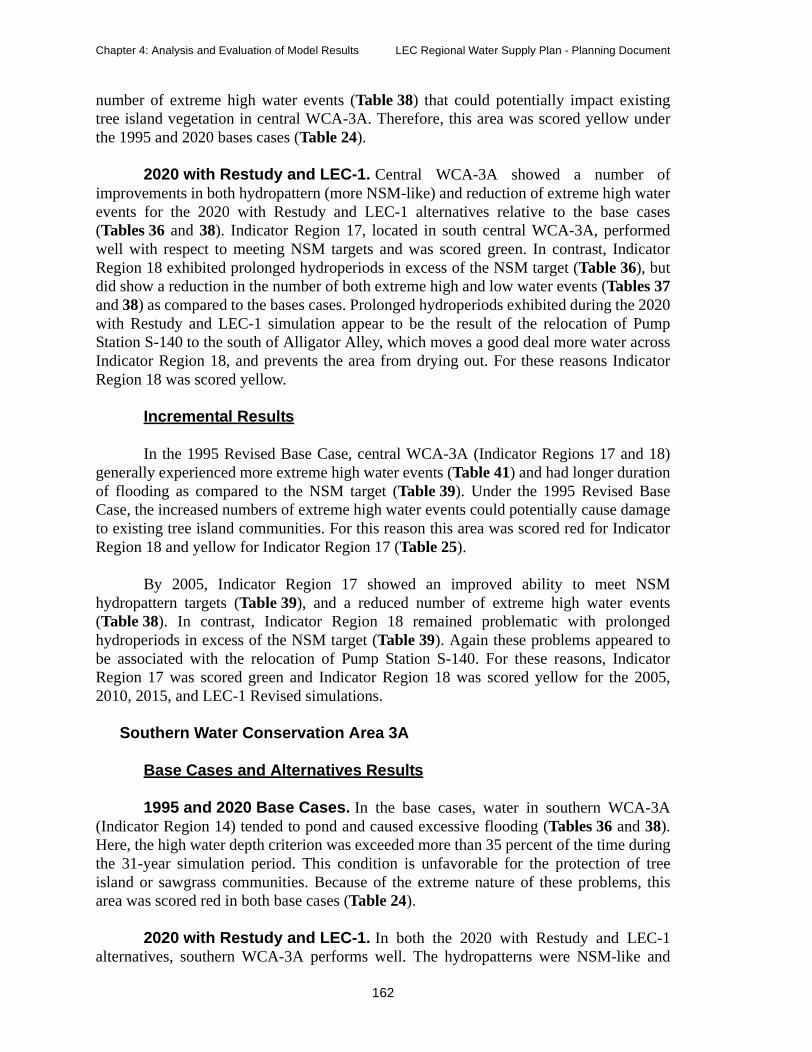
Chapter 4: Analysis and Evaluation of Model Results LEC Regional Water Supply Plan - Planning Document
number of extreme high water events (Table 38) that could potentially impact existingtree island vegetation in central WCA-3A. Therefore, this area was scored yellow underthe 1995 and 2020 bases cases (Table 24).
2020 with Restudy and LEC-1. Central WCA-3A showed a number ofimprovements in both hydropattern (more NSM-like) and reduction of extreme high waterevents for the 2020 with Restudy and LEC-1 alternatives relative to the base cases(Tables 36 and 38). Indicator Region 17, located in south central WCA-3A, performedwell with respect to meeting NSM targets and was scored green. In contrast, IndicatorRegion 18 exhibited prolonged hydroperiods in excess of the NSM target (Table 36), butdid show a reduction in the number of both extreme high and low water events (Tables 37and 38) as compared to the bases cases. Prolonged hydroperiods exhibited during the 2020with Restudy and LEC-1 simulation appear to be the result of the relocation of PumpStation S-140 to the south of Alligator Alley, which moves a good deal more water acrossIndicator Region 18, and prevents the area from drying out. For these reasons IndicatorRegion 18 was scored yellow.
Incremental Results
In the 1995 Revised Base Case, central WCA-3A (Indicator Regions 17 and 18)generally experienced more extreme high water events (Table 41) and had longer durationof flooding as compared to the NSM target (Table 39). Under the 1995 Revised BaseCase, the increased numbers of extreme high water events could potentially cause damageto existing tree island communities. For this reason this area was scored red for IndicatorRegion 18 and yellow for Indicator Region 17 (Table 25).
By 2005, Indicator Region 17 showed an improved ability to meet NSMhydropattern targets (Table 39), and a reduced number of extreme high water events(Table 38). In contrast, Indicator Region 18 remained problematic with prolongedhydroperiods in excess of the NSM target (Table 39). Again these problems appeared tobe associated with the relocation of Pump Station S-140. For these reasons, IndicatorRegion 17 was scored green and Indicator Region 18 was scored yellow for the 2005,2010, 2015, and LEC-1 Revised simulations.
Southern Water Conservation Area 3A
Base Cases and Alternatives Results
1995 and 2020 Base Cases. In the base cases, water in southern WCA-3A(Indicator Region 14) tended to pond and caused excessive flooding (Tables 36 and 38).Here, the high water depth criterion was exceeded more than 35 percent of the time duringthe 31-year simulation period. This condition is unfavorable for the protection of treeisland or sawgrass communities. Because of the extreme nature of these problems, thisarea was scored red in both base cases (Table 24).
2020 with Restudy and LEC-1. In both the 2020 with Restudy and LEC-1alternatives, southern WCA-3A performs well. The hydropatterns were NSM-like and
162
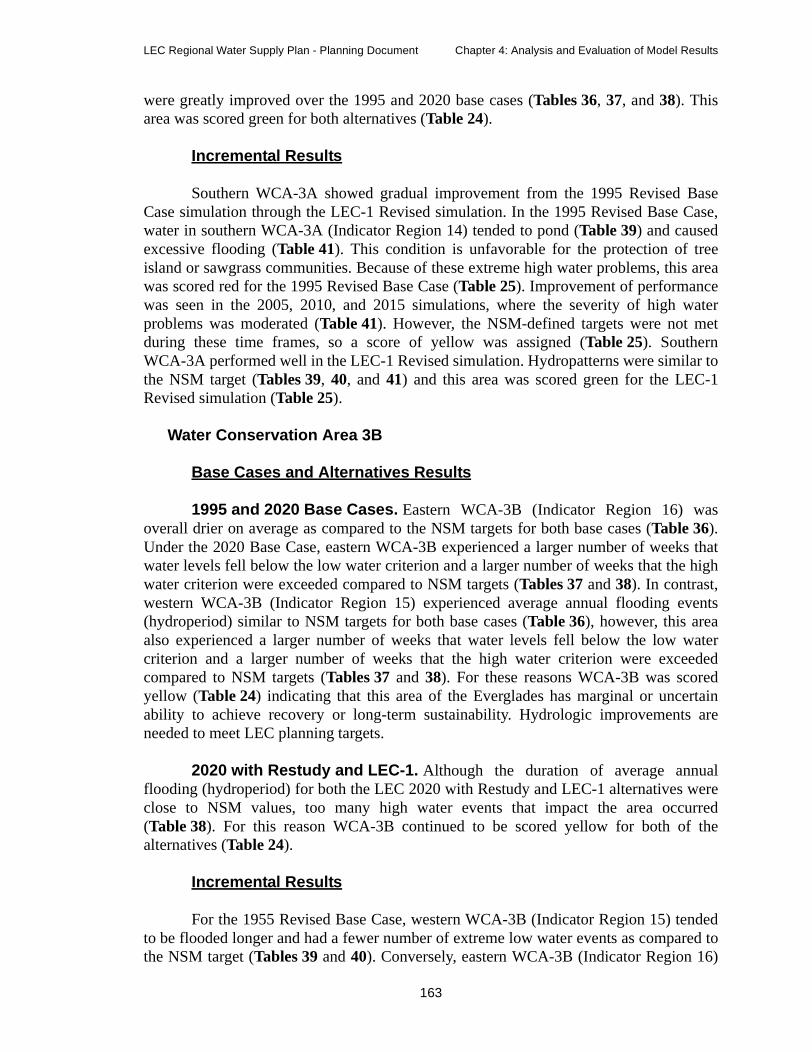
LEC Regional Water Supply Plan - Planning Document Chapter 4: Analysis and Evaluation of Model Results
were greatly improved over the 1995 and 2020 base cases (Tables 36, 37, and 38). Thisarea was scored green for both alternatives (Table 24).
Incremental Results
Southern WCA-3A showed gradual improvement from the 1995 Revised BaseCase simulation through the LEC-1 Revised simulation. In the 1995 Revised Base Case,water in southern WCA-3A (Indicator Region 14) tended to pond (Table 39) and causedexcessive flooding (Table 41). This condition is unfavorable for the protection of treeisland or sawgrass communities. Because of these extreme high water problems, this areawas scored red for the 1995 Revised Base Case (Table 25). Improvement of performancewas seen in the 2005, 2010, and 2015 simulations, where the severity of high waterproblems was moderated (Table 41). However, the NSM-defined targets were not metduring these time frames, so a score of yellow was assigned (Table 25). SouthernWCA-3A performed well in the LEC-1 Revised simulation. Hydropatterns were similar tothe NSM target (Tables 39, 40, and 41) and this area was scored green for the LEC-1Revised simulation (Table 25).
Water Conservation Area 3B
Base Cases and Alternatives Results
1995 and 2020 Base Cases. Eastern WCA-3B (Indicator Region 16) wasoverall drier on average as compared to the NSM targets for both base cases (Table 36).Under the 2020 Base Case, eastern WCA-3B experienced a larger number of weeks thatwater levels fell below the low water criterion and a larger number of weeks that the highwater criterion were exceeded compared to NSM targets (Tables 37 and 38). In contrast,western WCA-3B (Indicator Region 15) experienced average annual flooding events(hydroperiod) similar to NSM targets for both base cases (Table 36), however, this areaalso experienced a larger number of weeks that water levels fell below the low watercriterion and a larger number of weeks that the high water criterion were exceededcompared to NSM targets (Tables 37 and 38). For these reasons WCA-3B was scoredyellow (Table 24) indicating that this area of the Everglades has marginal or uncertainability to achieve recovery or long-term sustainability. Hydrologic improvements areneeded to meet LEC planning targets.
2020 with Restudy and LEC-1. Although the duration of average annualflooding (hydroperiod) for both the LEC 2020 with Restudy and LEC-1 alternatives wereclose to NSM values, too many high water events that impact the area occurred(Table 38). For this reason WCA-3B continued to be scored yellow for both of thealternatives (Table 24).
Incremental Results
For the 1955 Revised Base Case, western WCA-3B (Indicator Region 15) tendedto be flooded longer and had a fewer number of extreme low water events as compared tothe NSM target (Tables 39 and 40). Conversely, eastern WCA-3B (Indicator Region 16)
163

Chapter 4: Analysis and Evaluation of Model Results LEC Regional Water Supply Plan - Planning Document
was overall drier than the target leading to a larger number of weeks that water levels fellbelow the low water depth criterion (Table 40). These conditions did not improvesignificantly until the LEC-1 Revised simulation, when additional operational andstructural features were in place to resolve some of these problems. As a result, botheastern and western WCA-3B were scored intermediate between yellow and green(yellow/green) for the LEC-1 Revised simulation indicating that hydrologic restoration ofthe area appears close to the NSM target. However, there is still room for improvement inthese areas (Table 25).
Shark River Slough
Base Cases and Alternatives Results
1995 and 2020 Base Cases. Under both base cases, water levels innortheastern Shark River Slough (Indicator Region 11) were below the low water depthcriterion more often (Table 37) and the duration of annual flooding (hydroperiod) in thearea was significantly less (Table 36) when compared to the NSM targets. Similarproblems with low water levels and increased number of dry downs occurred in centraland southwestern Shark River Slough (Indicator Regions 9 and 10) under the base cases(Tables 36 and 37). This excessive drying is unfavorable for development or preservationof peat soils and protection of wetland plant and animal communities. For this reason, thisarea was scored red for both the 1995 and 2020 base cases (Table 24).
2020 with Restudy and LEC-1. The performance of the 2020 with Restudyand LEC-1 alternatives for Shark River Slough was much improved compared to the basecases (Tables 36, 37, and 38). Significantly more water was delivered to the system,which increased the duration of annual flooding and reduced the number of times this areadried out as compared to the base cases. Improvements both in the quantity and timing ofwater delivered to Shark River Slough occurred primarily because a number of Restudyprojects came on-line by 2020. These components included the completion of 50 percentof the Lake Belt Storage Area components, decompartmentalization of WCA-3, andenhanced flows under Tamiami Trail. Because performance was significantly improvedover the base cases, but still did not quite meet the NSM target, this area was scored asintermediate between green and yellow (green/yellow) (Table 24).
Incremental Results
In the 1995 Revised Base Case and 2005 simulations, water levels throughoutShark River Slough (Indicator Regions 9, 10, and 11) were below the low water depthcriterion more often (Table 40) and the duration of annual flooding in the area wassignificantly less (Table 39) compared to the NSM targets. This excessive drying isunfavorable for development or preservation of peat soils and protection of wetland plantand animal communities. Furthermore, Shark River Slough had a tendency toward earlydry season recession of the surface water during these simulations. This can beproblematic for wildlife species that rely on timing of the dry season dry downs forforaging or reproduction cycles. For this reason, Shark River Slough was scored red forboth the 1995 Revised Base Case and 2005 simulations (Table 25).
164

LEC Regional Water Supply Plan - Planning Document Chapter 4: Analysis and Evaluation of Model Results
Modeling results showed a gradual improvement over time to provide increasedflows to Everglades National Park. Beginning with the 2005 simulation, a significantimprovement in both the distribution and volume of water delivered to northeastern andnorthwestern Shark River Slough occurred (Table 42).In the 2010 simulation, significantimprovements in meeting NSM hydroperiod targets were recorded within northeasternand central Shark River Slough (Tables 39, 40, and 41). One hundred percent of theslough matched the NSM hydroperiod target in the LEC-1 Revised simulation (Table 43).However, because performance was still short of the target, this area was scoredintermediate between green and yellow (green/yellow) for the LEC-1 Revised simulation(Table 25).
Rockland Marl Marsh
Base Cases and Alternatives Results
1995 and 2020 Base Cases. The Rockland marl marsh area of EvergladesNational Park (Indicator Region 8) performed poorly in both the 1995 and 2020 basecases. This area had problems with extremely low water levels. Water levels were oftenbelow the low water depth criterion (Table 37). This excessive drying is unfavorable fordevelopment or preservation of marl soils. This area was scored red for both base cases(Table 24).
2020 with Restudy and LEC-1. Performance of the Rockland Marl Marshimproved significantly in the 2020 with Restudy and LEC-1 alternatives. More water was
Table 42. Total Average Annual Flows Discharged into Northern Everglades National Park, East andWest of L-67A (1000 ac-ft).
Area
Average Annual Flow (ac-ft x 1,000)
1995 Revised Base Case 2005 2010 2015 LEC-1 Revised
NW Shark River Slough 461 568 397 434 579
NE Shark River Slough 88 402 524 596 685
Total 549 970 921 1,030 1,264
Table 43. Mean NSM Hydroperiod Matches with Respect to NSM.a
a. Match corresponds to a match with the NSM target +/- 30 hydroperiod days
Area 1995 Revised Base Case 2005 2010 2015 LEC-1 Revised
Evergladesb
b. Includes WCAs, Holey Land and Rotenberger WMAs, and Everglades National Park
58% 64% 74% 77% 78%
WCAsc
c. Includes WCA-1, 2A, 2B, 3A, and 3B
64% 69% 80% 79% 75%
Everglades National Park 54% 60% 66% 75% 87%
Shark River Sloughd
d. Within Everglades National Park
53% 44% 71% 95% 100%
Rockland Marl Marshd 49% 70% 65% 67% 75%
165

Chapter 4: Analysis and Evaluation of Model Results LEC Regional Water Supply Plan - Planning Document
delivered to the system and the hydroperiod was much closer to the NSM target than forthe base cases (Tables 36 and 37). Because performance was still short of the target, thisarea was scored yellow (Table 24).
Incremental Results
The Rockland marl marsh area of Everglades National Park (Indicator Region 8)performed poorly in the 1995 Revised Base Case. Water levels in this area were below thelow water depth criterion more often than the NSM target (Table 40). Excessive drying isunfavorable for development or preservation of marl soils, and, therefore, a score of redwas assigned to the 1995 Revised Base Case (Table 25).
The incremental simulations showed improved performance through time. By2005, more water was delivered to the system and the hydroperiod was much closer to theNSM target than for the base cases (Tables 39 and 40). Performance continued to improvefrom 2005 through 2020, as shown by sequential decreases in the number of weeks thatwater levels were below the low water depth criterion (Table 40) and closer hydroperiodmatches to the NSM-defined target (Table 43). Although significant hydroperiodimprovements were noted, this area was scored yellow to indicate for the LEC-1 Revisedthat performance was still short of the NSM target in 2020 (Table 25). Alternative D13Rfrom the Restudy indicated similar problems with lowered water levels for the Rocklandmarl marsh (USACE and SFWMD, 1999).
Minimum Flows and Levels
Model results for MFLs were evaluated at the level of key gage stations. Thelocations of the key gages are shown in Figure 28. Table 44 provides a summary of theproposed MFL criteria for the Everglades. These MFL criteria were proposed in theMinimum Flows and Levels for Lake Okeechobee, the Everglades, and the BiscayneAquifer (SFWMD, 2000e).
Base Cases and Alternatives Results
1995 Base Case. Under the 1995 Base Case, proposed minimum water levelcriteria were not met for 12 out of 19 indicator regions located within the northernEverglades and Everglades National Park (Table 45). This was due largely toimpoundment of these marshes and the construction of major canals throughout thenorthern Everglades as part of the C&SF Project. During dry periods, these canals lowerground water levels and over drain these wetlands, causing extensive peat fires, soilsubsidence, changes in Everglades vegetation communities, and impacts to wildlifespecies. MFLs were not met in the Rotenberger WMA, northern WCA-3A, and WCA-3B.In Everglades National Park, MFLs were not met within Shark River Slough, theRockland marl marsh, and marl wetlands located east and west of Shark River Slough.Areas that did meet the proposed criteria included the Arthur R. Marshall LoxahatcheeNational Wildlife Refuge (WCA-1); WCA-2A; WCA-2B; Holey Land WMA; central andsouthern WCA-3A; and Taylor Slough (Table 45).
166
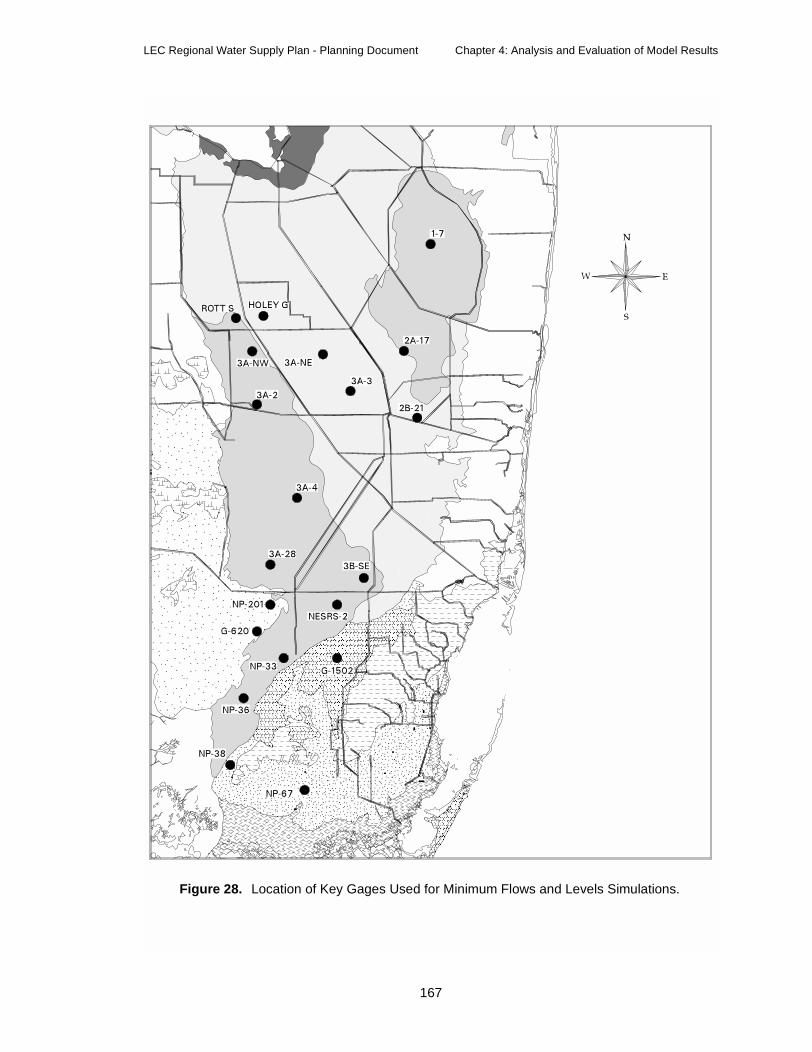
LEC Regional Water Supply Plan - Planning Document Chapter 4: Analysis and Evaluation of Model Results
Figure 28. Location of Key Gages Used for Minimum Flows and Levels Simulations.
167
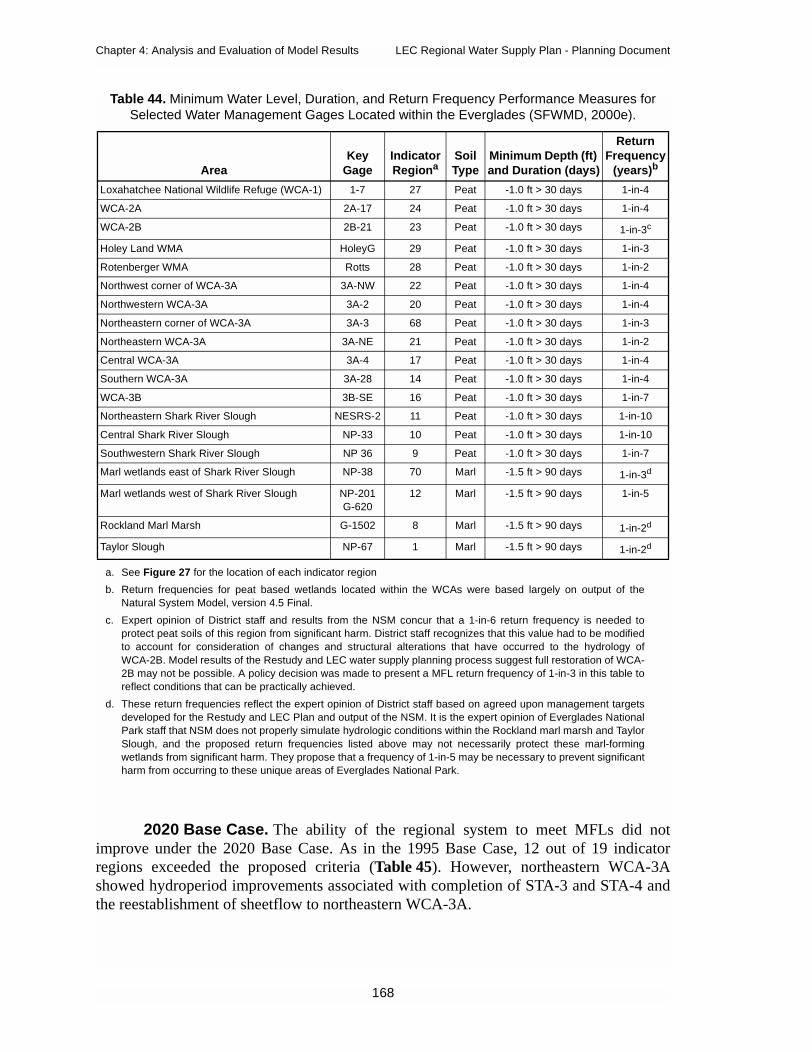
Chapter 4: Analysis and Evaluation of Model Results LEC Regional Water Supply Plan - Planning Document
2020 Base Case. The ability of the regional system to meet MFLs did notimprove under the 2020 Base Case. As in the 1995 Base Case, 12 out of 19 indicatorregions exceeded the proposed criteria (Table 45). However, northeastern WCA-3Ashowed hydroperiod improvements associated with completion of STA-3 and STA-4 andthe reestablishment of sheetflow to northeastern WCA-3A.
Table 44. Minimum Water Level, Duration, and Return Frequency Performance Measures forSelected Water Management Gages Located within the Everglades (SFWMD, 2000e).
AreaKey
GageIndicatorRegiona
SoilType
Minimum Depth (ft)and Duration (days)
ReturnFrequency
(years)b
Loxahatchee National Wildlife Refuge (WCA-1) 1-7 27 Peat -1.0 ft > 30 days 1-in-4
WCA-2A 2A-17 24 Peat -1.0 ft > 30 days 1-in-4
WCA-2B 2B-21 23 Peat -1.0 ft > 30 days 1-in-3c
Holey Land WMA HoleyG 29 Peat -1.0 ft > 30 days 1-in-3
Rotenberger WMA Rotts 28 Peat -1.0 ft > 30 days 1-in-2
Northwest corner of WCA-3A 3A-NW 22 Peat -1.0 ft > 30 days 1-in-4
Northwestern WCA-3A 3A-2 20 Peat -1.0 ft > 30 days 1-in-4
Northeastern corner of WCA-3A 3A-3 68 Peat -1.0 ft > 30 days 1-in-3
Northeastern WCA-3A 3A-NE 21 Peat -1.0 ft > 30 days 1-in-2
Central WCA-3A 3A-4 17 Peat -1.0 ft > 30 days 1-in-4
Southern WCA-3A 3A-28 14 Peat -1.0 ft > 30 days 1-in-4
WCA-3B 3B-SE 16 Peat -1.0 ft > 30 days 1-in-7
Northeastern Shark River Slough NESRS-2 11 Peat -1.0 ft > 30 days 1-in-10
Central Shark River Slough NP-33 10 Peat -1.0 ft > 30 days 1-in-10
Southwestern Shark River Slough NP 36 9 Peat -1.0 ft > 30 days 1-in-7
Marl wetlands east of Shark River Slough NP-38 70 Marl -1.5 ft > 90 days 1-in-3d
Marl wetlands west of Shark River Slough NP-201G-620
12 Marl -1.5 ft > 90 days 1-in-5
Rockland Marl Marsh G-1502 8 Marl -1.5 ft > 90 days 1-in-2d
Taylor Slough NP-67 1 Marl -1.5 ft > 90 days 1-in-2d
a. See Figure 27 for the location of each indicator region
b. Return frequencies for peat based wetlands located within the WCAs were based largely on output of theNatural System Model, version 4.5 Final.
c. Expert opinion of District staff and results from the NSM concur that a 1-in-6 return frequency is needed toprotect peat soils of this region from significant harm. District staff recognizes that this value had to be modifiedto account for consideration of changes and structural alterations that have occurred to the hydrology ofWCA-2B. Model results of the Restudy and LEC water supply planning process suggest full restoration of WCA-2B may not be possible. A policy decision was made to present a MFL return frequency of 1-in-3 in this table toreflect conditions that can be practically achieved.
d. These return frequencies reflect the expert opinion of District staff based on agreed upon management targetsdeveloped for the Restudy and LEC Plan and output of the NSM. It is the expert opinion of Everglades NationalPark staff that NSM does not properly simulate hydrologic conditions within the Rockland marl marsh and TaylorSlough, and the proposed return frequencies listed above may not necessarily protect these marl-formingwetlands from significant harm. They propose that a frequency of 1-in-5 may be necessary to prevent significantharm from occurring to these unique areas of Everglades National Park.
168
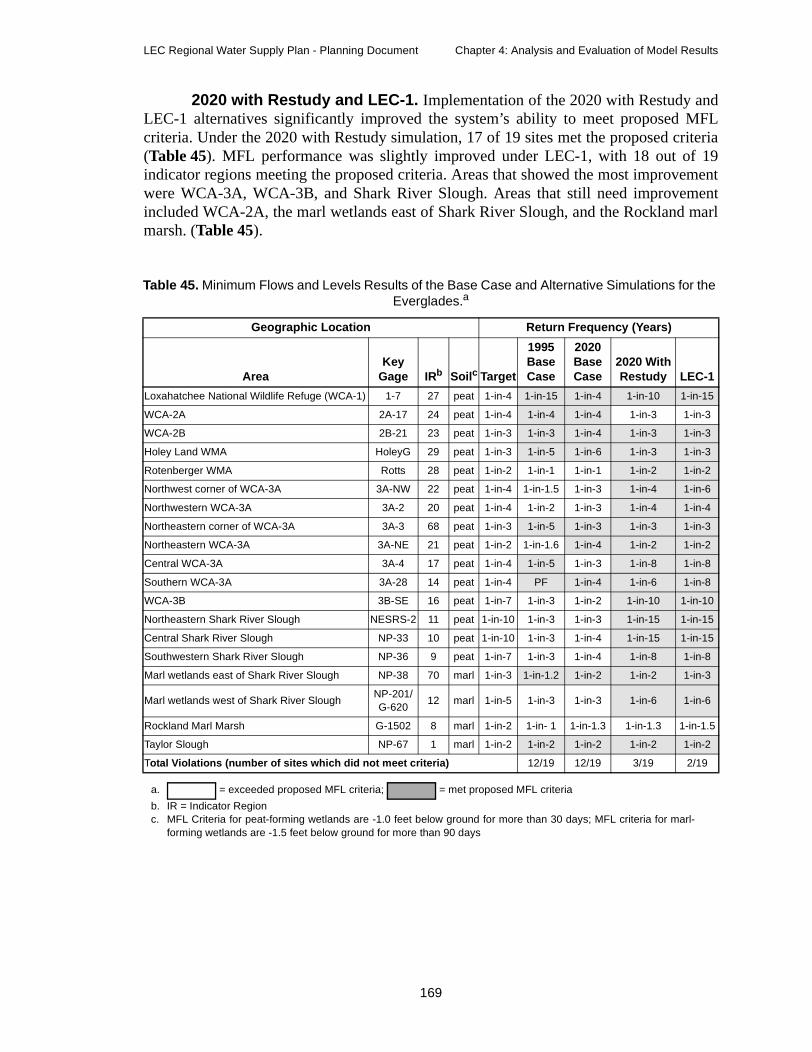
LEC Regional Water Supply Plan - Planning Document Chapter 4: Analysis and Evaluation of Model Results
2020 with Restudy and LEC-1. Implementation of the 2020 with Restudy andLEC-1 alternatives significantly improved the system’s ability to meet proposed MFLcriteria. Under the 2020 with Restudy simulation, 17 of 19 sites met the proposed criteria(Table 45). MFL performance was slightly improved under LEC-1, with 18 out of 19indicator regions meeting the proposed criteria. Areas that showed the most improvementwere WCA-3A, WCA-3B, and Shark River Slough. Areas that still need improvementincluded WCA-2A, the marl wetlands east of Shark River Slough, and the Rockland marlmarsh. (Table 45).
Table 45. Minimum Flows and Levels Results of the Base Case and Alternative Simulations for theEverglades.a
a. = exceeded proposed MFL criteria; = met proposed MFL criteria
Geographic Location Return Frequency (Years)
AreaKey
Gage IRb
b. IR = Indicator Region
Soilc
c. MFL Criteria for peat-forming wetlands are -1.0 feet below ground for more than 30 days; MFL criteria for marl-forming wetlands are -1.5 feet below ground for more than 90 days
Target
1995BaseCase
2020BaseCase
2020 WithRestudy LEC-1
Loxahatchee National Wildlife Refuge (WCA-1) 1-7 27 peat 1-in-4 1-in-15 1-in-4 1-in-10 1-in-15
WCA-2A 2A-17 24 peat 1-in-4 1-in-4 1-in-4 1-in-3 1-in-3
WCA-2B 2B-21 23 peat 1-in-3 1-in-3 1-in-4 1-in-3 1-in-3
Holey Land WMA HoleyG 29 peat 1-in-3 1-in-5 1-in-6 1-in-3 1-in-3
Rotenberger WMA Rotts 28 peat 1-in-2 1-in-1 1-in-1 1-in-2 1-in-2
Northwest corner of WCA-3A 3A-NW 22 peat 1-in-4 1-in-1.5 1-in-3 1-in-4 1-in-6
Northwestern WCA-3A 3A-2 20 peat 1-in-4 1-in-2 1-in-3 1-in-4 1-in-4
Northeastern corner of WCA-3A 3A-3 68 peat 1-in-3 1-in-5 1-in-3 1-in-3 1-in-3
Northeastern WCA-3A 3A-NE 21 peat 1-in-2 1-in-1.6 1-in-4 1-in-2 1-in-2
Central WCA-3A 3A-4 17 peat 1-in-4 1-in-5 1-in-3 1-in-8 1-in-8
Southern WCA-3A 3A-28 14 peat 1-in-4 PF 1-in-4 1-in-6 1-in-8
WCA-3B 3B-SE 16 peat 1-in-7 1-in-3 1-in-2 1-in-10 1-in-10
Northeastern Shark River Slough NESRS-2 11 peat 1-in-10 1-in-3 1-in-3 1-in-15 1-in-15
Central Shark River Slough NP-33 10 peat 1-in-10 1-in-3 1-in-4 1-in-15 1-in-15
Southwestern Shark River Slough NP-36 9 peat 1-in-7 1-in-3 1-in-4 1-in-8 1-in-8
Marl wetlands east of Shark River Slough NP-38 70 marl 1-in-3 1-in-1.2 1-in-2 1-in-2 1-in-3
Marl wetlands west of Shark River SloughNP-201/G-620
12 marl 1-in-5 1-in-3 1-in-3 1-in-6 1-in-6
Rockland Marl Marsh G-1502 8 marl 1-in-2 1-in- 1 1-in-1.3 1-in-1.3 1-in-1.5
Taylor Slough NP-67 1 marl 1-in-2 1-in-2 1-in-2 1-in-2 1-in-2
Total Violations (number of sites which did not meet criteria) 12/19 12/19 3/19 2/19
169
Chapter 4: Analysis and Evaluation of Model Results LEC Regional Water Supply Plan - Planning Document
Incremental Results
1995 Revised Base Case. Model simulations showed that under the 1995Revised Base Case, proposed minimum water level criteria were not met for 11 out of 19indicator regions (Table 46). MFLs were not met in the Rotenberger WMA, most ofnorthern WCA-3A, WCA-3B, Shark River Slough, marl wetlands located east and west ofShark River Slough, and the Rockland marl marsh. Areas that met the proposed criteriawere the Arthur R. Marshall Loxahatchee National Wildlife Refuge (WCA-1), WCA-2A,WCA-2B, the Holey Land WMA, the northeastern corner of WCA-3A (Indicator Region68), central and southern WCA-3A, and Taylor Slough.
2010, 2015, and LEC-1 Revised. Conditions did not begin to improve in thenorthern Everglades until the 2010 simulation, and improvements continued incrementallythrough 2020 (LEC-1 Revised) when almost all areas met MFL criteria. In EvergladesNational Park, performance did not improve until the LEC-1 Revised simulation. This wasprimarily due to Lake Belt Project components not being implemented until 2020.Proposed Everglades MFL criteria were met at 17 out of the 19 indicator regions duringthe LEC-1 Revised simulation (Table 46). The two areas where MFLs were not met wereWCA-2B and the Rockland marl marsh located in Everglades National Park.
2005 and 2005 SSM Scenario. Review of MFL performance for theEverglades showed no major differences between the 2005 incremental simulation and the2005 SSM Scenario results (Table 46). After review of stage hydrographs, stage durationcurves, inundation summary tables, and high and low water criteria (Appendix H) it wasconcluded that differences, if any, between the 2005 incremental simulation and the 2005SSM Scenario were insignificant. All performance measures, including meeting MFLs,for the Everglades showed virtually identical behavior under both simulations.
Biscayne Bay
Performance Measures Applied
For purposes of this study, the performance measure for Biscayne Bay was thatfuture flows delivered to the estuary should not be less than those currently discharged tothe bay under the 1995 Base Case. Mean annual wet and dry season flows were based onSFWMM output for the primary water management structures which discharge into thenorthern, central, and southern portions of Biscayne Bay. These structures included thefollowing:
• Northern Biscayne Bay: Snake Creek (S-29), G-58, S-28, andS-27
• Central Biscayne Bay: Miami River (S-25, S-25B, and S-26),G-97, S-22, and S-123
• Southern Biscayne Bay: S-21, S-21A, S-20F, and S-206
170
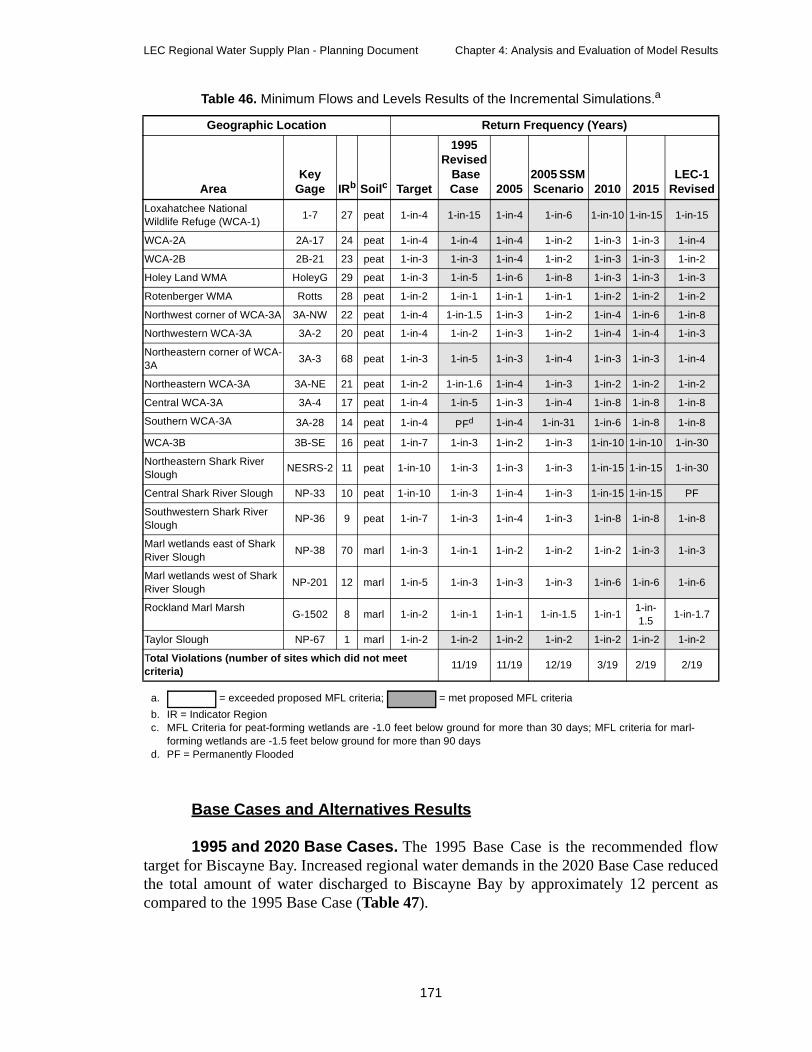
LEC Regional Water Supply Plan - Planning Document Chapter 4: Analysis and Evaluation of Model Results
Base Cases and Alternatives Results
1995 and 2020 Base Cases. The 1995 Base Case is the recommended flowtarget for Biscayne Bay. Increased regional water demands in the 2020 Base Case reducedthe total amount of water discharged to Biscayne Bay by approximately 12 percent ascompared to the 1995 Base Case (Table 47).
Table 46. Minimum Flows and Levels Results of the Incremental Simulations.a
Geographic Location Return Frequency (Years)
AreaKey
Gage IRb Soilc Target
1995Revised
BaseCase 2005
2005 SSMScenario 2010 2015
LEC-1Revised
Loxahatchee NationalWildlife Refuge (WCA-1)
1-7 27 peat 1-in-4 1-in-15 1-in-4 1-in-6 1-in-10 1-in-15 1-in-15
WCA-2A 2A-17 24 peat 1-in-4 1-in-4 1-in-4 1-in-2 1-in-3 1-in-3 1-in-4
WCA-2B 2B-21 23 peat 1-in-3 1-in-3 1-in-4 1-in-2 1-in-3 1-in-3 1-in-2
Holey Land WMA HoleyG 29 peat 1-in-3 1-in-5 1-in-6 1-in-8 1-in-3 1-in-3 1-in-3
Rotenberger WMA Rotts 28 peat 1-in-2 1-in-1 1-in-1 1-in-1 1-in-2 1-in-2 1-in-2
Northwest corner of WCA-3A 3A-NW 22 peat 1-in-4 1-in-1.5 1-in-3 1-in-2 1-in-4 1-in-6 1-in-8
Northwestern WCA-3A 3A-2 20 peat 1-in-4 1-in-2 1-in-3 1-in-2 1-in-4 1-in-4 1-in-3
Northeastern corner of WCA-3A
3A-3 68 peat 1-in-3 1-in-5 1-in-3 1-in-4 1-in-3 1-in-3 1-in-4
Northeastern WCA-3A 3A-NE 21 peat 1-in-2 1-in-1.6 1-in-4 1-in-3 1-in-2 1-in-2 1-in-2
Central WCA-3A 3A-4 17 peat 1-in-4 1-in-5 1-in-3 1-in-4 1-in-8 1-in-8 1-in-8
Southern WCA-3A 3A-28 14 peat 1-in-4 PFd 1-in-4 1-in-31 1-in-6 1-in-8 1-in-8
WCA-3B 3B-SE 16 peat 1-in-7 1-in-3 1-in-2 1-in-3 1-in-10 1-in-10 1-in-30
Northeastern Shark RiverSlough
NESRS-2 11 peat 1-in-10 1-in-3 1-in-3 1-in-3 1-in-15 1-in-15 1-in-30
Central Shark River Slough NP-33 10 peat 1-in-10 1-in-3 1-in-4 1-in-3 1-in-15 1-in-15 PF
Southwestern Shark RiverSlough
NP-36 9 peat 1-in-7 1-in-3 1-in-4 1-in-3 1-in-8 1-in-8 1-in-8
Marl wetlands east of SharkRiver Slough
NP-38 70 marl 1-in-3 1-in-1 1-in-2 1-in-2 1-in-2 1-in-3 1-in-3
Marl wetlands west of SharkRiver Slough
NP-201 12 marl 1-in-5 1-in-3 1-in-3 1-in-3 1-in-6 1-in-6 1-in-6
Rockland Marl MarshG-1502 8 marl 1-in-2 1-in-1 1-in-1 1-in-1.5 1-in-1
1-in-1.5
1-in-1.7
Taylor Slough NP-67 1 marl 1-in-2 1-in-2 1-in-2 1-in-2 1-in-2 1-in-2 1-in-2
Total Violations (number of sites which did not meetcriteria)
11/19 11/19 12/19 3/19 2/19 2/19
a. = exceeded proposed MFL criteria; = met proposed MFL criteria
b. IR = Indicator Regionc. MFL Criteria for peat-forming wetlands are -1.0 feet below ground for more than 30 days; MFL criteria for marl-
forming wetlands are -1.5 feet below ground for more than 90 daysd. PF = Permanently Flooded
171
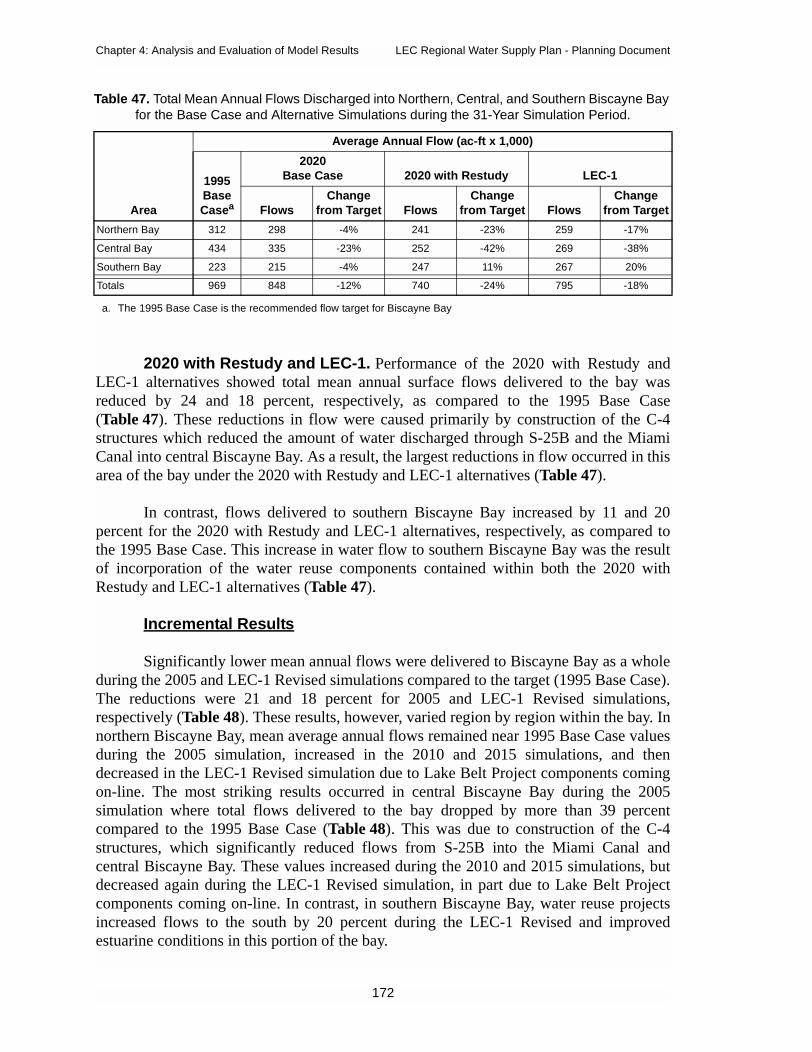
Chapter 4: Analysis and Evaluation of Model Results LEC Regional Water Supply Plan - Planning Document
2020 with Restudy and LEC-1. Performance of the 2020 with Restudy andLEC-1 alternatives showed total mean annual surface flows delivered to the bay wasreduced by 24 and 18 percent, respectively, as compared to the 1995 Base Case(Table 47). These reductions in flow were caused primarily by construction of the C-4structures which reduced the amount of water discharged through S-25B and the MiamiCanal into central Biscayne Bay. As a result, the largest reductions in flow occurred in thisarea of the bay under the 2020 with Restudy and LEC-1 alternatives (Table 47).
In contrast, flows delivered to southern Biscayne Bay increased by 11 and 20percent for the 2020 with Restudy and LEC-1 alternatives, respectively, as compared tothe 1995 Base Case. This increase in water flow to southern Biscayne Bay was the resultof incorporation of the water reuse components contained within both the 2020 withRestudy and LEC-1 alternatives (Table 47).
Incremental Results
Significantly lower mean annual flows were delivered to Biscayne Bay as a wholeduring the 2005 and LEC-1 Revised simulations compared to the target (1995 Base Case).The reductions were 21 and 18 percent for 2005 and LEC-1 Revised simulations,respectively (Table 48). These results, however, varied region by region within the bay. Innorthern Biscayne Bay, mean average annual flows remained near 1995 Base Case valuesduring the 2005 simulation, increased in the 2010 and 2015 simulations, and thendecreased in the LEC-1 Revised simulation due to Lake Belt Project components comingon-line. The most striking results occurred in central Biscayne Bay during the 2005simulation where total flows delivered to the bay dropped by more than 39 percentcompared to the 1995 Base Case (Table 48). This was due to construction of the C-4structures, which significantly reduced flows from S-25B into the Miami Canal andcentral Biscayne Bay. These values increased during the 2010 and 2015 simulations, butdecreased again during the LEC-1 Revised simulation, in part due to Lake Belt Projectcomponents coming on-line. In contrast, in southern Biscayne Bay, water reuse projectsincreased flows to the south by 20 percent during the LEC-1 Revised and improvedestuarine conditions in this portion of the bay.
Table 47. Total Mean Annual Flows Discharged into Northern, Central, and Southern Biscayne Bayfor the Base Case and Alternative Simulations during the 31-Year Simulation Period.
Area
Average Annual Flow (ac-ft x 1,000)
1995BaseCasea
2020Base Case 2020 with Restudy LEC-1
FlowsChange
from Target FlowsChange
from Target FlowsChange
from Target
Northern Bay 312 298 -4% 241 -23% 259 -17%
Central Bay 434 335 -23% 252 -42% 269 -38%
Southern Bay 223 215 -4% 247 11% 267 20%
Totals 969 848 -12% 740 -24% 795 -18%
a. The 1995 Base Case is the recommended flow target for Biscayne Bay
172

LEC Regional Water Supply Plan - Planning Document Chapter 4: Analysis and Evaluation of Model Results
Biscayne Aquifer Minimum Flows and Levels
Base Cases and Alternatives Results
All of the base cases and alternatives showed the ability to meet the proposedminimum canal operational levels for the Biscayne aquifer MFLs for the 31-yearsimulation period (Table 49). These results indicated that the Biscayne aquifer was notthreatened by saltwater intrusion in any of these simulations.
Table 48. Total Mean Annual Flows Discharged into Northern, Central, and Southern Biscayne Bayfor the Incremental Simulations during the 31-Year Simulation Period.
Area
Average Annual Flow (ac-ft x 1,000)
1995BaseCasea
1995 RevisedBase Case 2005 2010 2015 LEC-1 Revised
Flows
Changefrom
Target Flows
Changefrom
Target Flows
Changefrom
Target Flows
Changefrom
Target Flows
Changefrom
Target
Northern Bay 312 312 0% 300 -4% 347 11% 340 9% 259 -17%
Central Bay 434 430 -1% 263 -39% 341 -21% 321 -26% 263 -39%
Southern Bay 223 222 0% 203 -9% 219 -2% 217 -3% 268 20%
Totals 969 964 0% 766 -21% 907 -6% 878 -9% 790 -18%
a. The 1995 Base Case is the recommended flow target for Biscayne Bay
Table 49. Number of Times Minimal Minimum Flows and Levels Operational Criteria Were Not Metfor the Biscayne Aquifer.
Canal/Structure
Minimum Canal OperationLevels to Protect Against
MFL Violationsa
a. Duration criteria: water levels within the above canals may fall below the proposed minimum operational level fora period of no more than 180 days per year
Number of Times MFL Criteria Not Met
1995Base Case
2020Base Case
2020 withRestudy LEC-1
C-51/S-155 7.80 0 0 0 0
C-16/S-41 7.80 0 0 0 0
C-15/S-40 7.80 0 0 0 0
Hillsboro/G-56 6.75 0 0 0 0
C-14/S-37B 6.50 0 0 0 0
C-13/S-36 4.00 0 0 0 0
North New River/G-54 3.50 0 0 0 0
C-9/S-29 2.00 0 0 0 0
C-6/S-26 2.00 0 0 0 0
C-4/S-25B 2.20 0 0 0 0
C-2/S-22 2.20 0 0 0 0
173

Chapter 4: Analysis and Evaluation of Model Results LEC Regional Water Supply Plan - Planning Document
Summary of Minimum Flows and Levels
Lake Okeechobee
MFLs were met in Lake Okeechobee for the 1995 and 2020 Base Cases, the 2020with Restudy, and the LEC-1 alternatives, as well as the 2005 through 2020 incrementalsimulations. As a result, the MFL criteria are not expected to be exceeded even if the LECPlan were not implemented. Therefore, neither a MFL recovery plan nor a preventionstrategy is required for Lake Okeechobee.
The Everglades
In contrast, MFL criteria were not met for 12 of 19 selected monitoring siteslocated within the Everglades for both the 1995 and 2020 Base Cases. A MFL recoveryplan will be needed for these areas. Features of this plan are presented in Appendix J.
Analyses of the 2020 with Restudy and LEC-1 simulations showed majorimprovements in the ability to meet the proposed MFL criteria by 2020. Incrementalmodeling results showed improvements in meeting MFLs within the northern Evergladesby 2010 and 2015 as a result of construction of the Everglades Construction Project andthe EAA Storage Reservoirs. MFLs were met for the majority of sites located withinEverglades National Park by 2020 as a result of construction and operation of 50 percentof the Lake Belt Storage Area projects. By 2020, only two Everglades monitoring sites outof 19 did not meet the proposed MFL criteria.
Biscayne Aquifer
All of the base case and alternative simulations met the proposed minimum canaloperational levels for the Biscayne aquifer for the 31-year simulation period. TheBiscayne aquifer was not threatened by saltwater intrusion due to the inability to maintaincoastal canals levels in any of these simulations. As a result, the proposed minimum canaloperational levels are not expected to be exceeded even if the LEC Plan is notimplemented. Therefore, neither a MFL recovery plan nor a prevention strategy isrequired for the Biscayne aquifer at this time.
Summary of Modeling Results for Natural Areas
Lake Okeechobee. Implementation of the WSE schedule in Lake Okeechobeeresulted in a number of hydrologic improvements that should benefit the overall ecologyof the ecosystem. These improvements began in 2005 and LEC planning targets were metby 2015.
St. Lucie and Caloosahatchee Estuaries. Construction of regional reser-voirs combined with water management improvements in Lake Okeechobee by 2010resulted in significant reductions in the number of high volume discharge events thatimpact both the St. Lucie and Caloosahatchee estuaries. These hydrologic improvements
174
LEC Regional Water Supply Plan - Planning Document Chapter 4: Analysis and Evaluation of Model Results
should help to maintain salinity regimes that will provide significant ecological benefits toboth ecosystems.
Lake Worth Lagoon. Construction of STA-1E and other improvements to theregional system resulted in a significant reduction in the number of high volume dischargeevents that impact the Lake Worth Lagoon.
Holey Land and Rotenberger Wildlife Management Areas. In the EAA,completion of the Everglades Construction Project and EAA Storage Reservoirs, andimplementation of rain-driven water delivery schedules for the Holey Land andRotenberger WMAs provided significant ecological benefits to these overdrained areas by2010.
WCA-3A and WCA-3B. Completion of the Everglades Construction Project,construction of the EAA Storage Reservoirs, and implementation of rain-driven waterdelivery schedules within northern WCA-3A reintroduced sheetflow to the northernEverglades system and met NSM-defined hydrologic targets in northern WCA-3A by2010. These improvements should provide significant ecological benefits to thishistorically overdrained area of the Everglades system. In addition, WCA-3B and southernWCA-3A showed gradual improvements over time and came close to meeting NSM-defined targets by 2020.
Everglades National Park. Modeling results showed gradual improvementover time in providing increased flows to Everglades National Park. Beginning in 2005, asignificant improvements in both the distribution and volume of water delivered tonortheast and northwest Shark River Slough occurred. By 2010, the ability to meet NSMhydroperiod targets was significantly improved within northeast and central Shark RiverSlough, with near full recovery by 2020 (100 percent of the slough matched the NSMhydroperiod target by 2020). In the Rockland marl marsh, significant hydroperiodimprovements were noted beginning in 2005 within this overdrained area. Theseimprovements continued through 2020.
Florida Bay. Results also showed that major improvements occurred over time inthe ability to provide increased flows toward western Florida Bay and Whitewater Bay.These increased flows should provide significant ecological benefits to areas that havebeen subject to reduced flows as a result of construction of the C&SF Project.
SYSTEMWIDE PERFORMANCE
Regional water budgets provide a useful means of comparing results of differentmodel simulations. Primary water budget component maps are shown for the 1995Revised Base Case (95BSRR); the 2005 (2005R), 2010 (2010R), and 2015 (2015R)incremental; and the LEC-1 Revised (2020R) simulations in Figures 30 through 34.Table 50 provides a description for flow arrows depicted on the water budget componentmaps. The number next to each description refers to the numbered arrow on the primarywater budget components key (Figure 29). The key reflects all the flow arrows on the
175
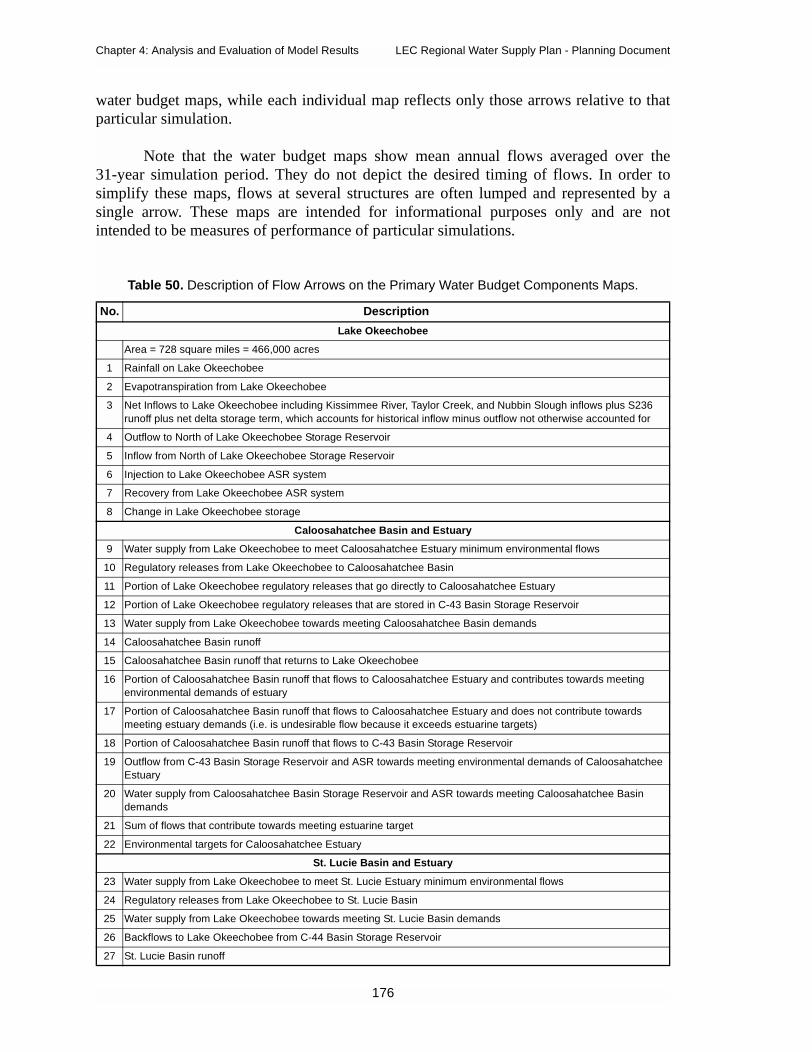
Chapter 4: Analysis and Evaluation of Model Results LEC Regional Water Supply Plan - Planning Document
water budget maps, while each individual map reflects only those arrows relative to thatparticular simulation.
Note that the water budget maps show mean annual flows averaged over the31-year simulation period. They do not depict the desired timing of flows. In order tosimplify these maps, flows at several structures are often lumped and represented by asingle arrow. These maps are intended for informational purposes only and are notintended to be measures of performance of particular simulations.
Table 50. Description of Flow Arrows on the Primary Water Budget Components Maps.
No. Description
Lake Okeechobee
Area = 728 square miles = 466,000 acres
1 Rainfall on Lake Okeechobee
2 Evapotranspiration from Lake Okeechobee
3 Net Inflows to Lake Okeechobee including Kissimmee River, Taylor Creek, and Nubbin Slough inflows plus S236runoff plus net delta storage term, which accounts for historical inflow minus outflow not otherwise accounted for
4 Outflow to North of Lake Okeechobee Storage Reservoir
5 Inflow from North of Lake Okeechobee Storage Reservoir
6 Injection to Lake Okeechobee ASR system
7 Recovery from Lake Okeechobee ASR system
8 Change in Lake Okeechobee storage
Caloosahatchee Basin and Estuary
9 Water supply from Lake Okeechobee to meet Caloosahatchee Estuary minimum environmental flows
10 Regulatory releases from Lake Okeechobee to Caloosahatchee Basin
11 Portion of Lake Okeechobee regulatory releases that go directly to Caloosahatchee Estuary
12 Portion of Lake Okeechobee regulatory releases that are stored in C-43 Basin Storage Reservoir
13 Water supply from Lake Okeechobee towards meeting Caloosahatchee Basin demands
14 Caloosahatchee Basin runoff
15 Caloosahatchee Basin runoff that returns to Lake Okeechobee
16 Portion of Caloosahatchee Basin runoff that flows to Caloosahatchee Estuary and contributes towards meetingenvironmental demands of estuary
17 Portion of Caloosahatchee Basin runoff that flows to Caloosahatchee Estuary and does not contribute towardsmeeting estuary demands (i.e. is undesirable flow because it exceeds estuarine targets)
18 Portion of Caloosahatchee Basin runoff that flows to C-43 Basin Storage Reservoir
19 Outflow from C-43 Basin Storage Reservoir and ASR towards meeting environmental demands of CaloosahatcheeEstuary
20 Water supply from Caloosahatchee Basin Storage Reservoir and ASR towards meeting Caloosahatchee Basindemands
21 Sum of flows that contribute towards meeting estuarine target
22 Environmental targets for Caloosahatchee Estuary
St. Lucie Basin and Estuary
23 Water supply from Lake Okeechobee to meet St. Lucie Estuary minimum environmental flows
24 Regulatory releases from Lake Okeechobee to St. Lucie Basin
25 Water supply from Lake Okeechobee towards meeting St. Lucie Basin demands
26 Backflows to Lake Okeechobee from C-44 Basin Storage Reservoir
27 St. Lucie Basin runoff
176

LEC Regional Water Supply Plan - Planning Document Chapter 4: Analysis and Evaluation of Model Results
28 St. Lucie Basin runoff that returns to Lake Okeechobee
29 Portion of St. Lucie Basin runoff that flows to St. Lucie Estuary and contributes towards meeting environmentaldemands of estuary
30 Portion of St. Lucie Basin runoff that flows to St. Lucie Estuary and does not contribute towards meeting estuarydemands (i.e. is undesirable flow because it exceeds estuarine targets)
31 Portion of St. Lucie Basin runoff that flows to C-44 Basin Storage Reservoir
32 Outflow from C-44 Basin Storage Reservoir towards meeting environmental demands of St. Lucie Estuary
33 Water supply from C-44 Basin Reservoir towards meeting St. Lucie Basin demands
34 Non-C-44 Basin runoff that contributes towards meeting estuarine targets
35 Sum of flows that contribute towards meeting estuarine target
36 Environmental targets for St. Lucie Estuary
Everglades Agricultural Area
Area = 948 square miles = 606,720 acres(Includes Holey Land and Rotenberger WMAs and STAs)
37 Rainfall on EAA
38 Evapotranspiration from EAA
39 Releases from Lake Okeechobee for Big Cypress Seminole’s demands
40 Releases from STA-6 and Rotenberger WMA for Big Cypress Seminole Reservation demands
41 Inflow to EAA from Western Basins
42 Water supply from Lake Okeechobee that contributes towards meeting environmental needs in Rotenberger WMAand the Everglades Protection Area
43 Water supply from Lake Okeechobee that contributes towards meeting environmental needs in Rotenberger WMA
44 Water supply from Lake Okeechobee, through EAA, that contributes towards meeting environmental needs in theEverglades Protection Area
45 Regulatory releases from Lake Okeechobee to EAA Storage Reservoir, Compartment 2
46 Water supply from Lake Okeechobee, through EAA, that contributes towards meeting LEC Service Areas’ waterneeds
47 Regulatory releases from Lake Okeechobee, through EAA, to the WCAs (through the STAs where applicable, but isundesirable flow because it exceeds WCA environmental targets)
48 Agricultural water supply to EAA from Lake Okeechobee
49 Runoff from EAA to Lake Okeechobee
50 Ground water flow from the LEC Service Areas to EAA
51 Water supply from EAA to LEC Service Areas (including STA-1E)
52 Inflows to EAA from C-51 Regional Ground Water ASR and West Palm Beach Catchment ASR
53 Inflows to EAA from C-51 Regional Ground Water ASR and West Palm Beach Catchment ASR to meet agriculturaldemands
54 Inflows to EAA Storage Reservoirs from C-51 Regional Ground Water ASR and West Palm Beach Catchment ASR
55 Ground water flow from WCAs back to EAA
56 Runoff from EAA to WCAs (through STAs where applicable) - excluding L4 wraparound flows through S-140
57 Water supply from EAA Storage Reservoirs that contributes towards meeting environmental needs
58 Runoff from EAA to WCAs (through STAs where applicable) through L4 wraparound and S-140
59 Ground water flow from EAA to Big Cypress National Preserve
60 Runoff from EAA to EAA Storage Reservoirs, Compartment 1
61 Agricultural water supply from EAA Storage Reservoirs, Compartment 1
62 Change in EAA water storage
Table 50. Description of Flow Arrows on the Primary Water Budget Components Maps.
No. Description
177
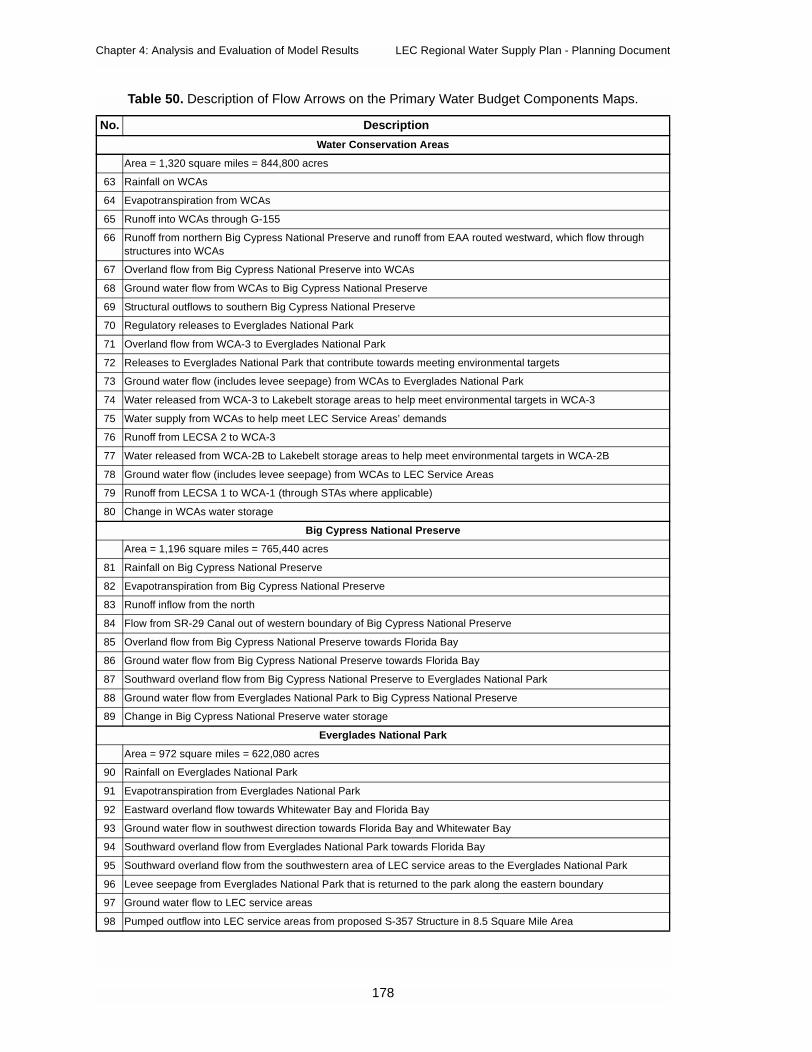
Chapter 4: Analysis and Evaluation of Model Results LEC Regional Water Supply Plan - Planning Document
Water Conservation Areas
Area = 1,320 square miles = 844,800 acres
63 Rainfall on WCAs
64 Evapotranspiration from WCAs
65 Runoff into WCAs through G-155
66 Runoff from northern Big Cypress National Preserve and runoff from EAA routed westward, which flow throughstructures into WCAs
67 Overland flow from Big Cypress National Preserve into WCAs
68 Ground water flow from WCAs to Big Cypress National Preserve
69 Structural outflows to southern Big Cypress National Preserve
70 Regulatory releases to Everglades National Park
71 Overland flow from WCA-3 to Everglades National Park
72 Releases to Everglades National Park that contribute towards meeting environmental targets
73 Ground water flow (includes levee seepage) from WCAs to Everglades National Park
74 Water released from WCA-3 to Lakebelt storage areas to help meet environmental targets in WCA-3
75 Water supply from WCAs to help meet LEC Service Areas’ demands
76 Runoff from LECSA 2 to WCA-3
77 Water released from WCA-2B to Lakebelt storage areas to help meet environmental targets in WCA-2B
78 Ground water flow (includes levee seepage) from WCAs to LEC Service Areas
79 Runoff from LECSA 1 to WCA-1 (through STAs where applicable)
80 Change in WCAs water storage
Big Cypress National Preserve
Area = 1,196 square miles = 765,440 acres
81 Rainfall on Big Cypress National Preserve
82 Evapotranspiration from Big Cypress National Preserve
83 Runoff inflow from the north
84 Flow from SR-29 Canal out of western boundary of Big Cypress National Preserve
85 Overland flow from Big Cypress National Preserve towards Florida Bay
86 Ground water flow from Big Cypress National Preserve towards Florida Bay
87 Southward overland flow from Big Cypress National Preserve to Everglades National Park
88 Ground water flow from Everglades National Park to Big Cypress National Preserve
89 Change in Big Cypress National Preserve water storage
Everglades National Park
Area = 972 square miles = 622,080 acres
90 Rainfall on Everglades National Park
91 Evapotranspiration from Everglades National Park
92 Eastward overland flow towards Whitewater Bay and Florida Bay
93 Ground water flow in southwest direction towards Florida Bay and Whitewater Bay
94 Southward overland flow from Everglades National Park towards Florida Bay
95 Southward overland flow from the southwestern area of LEC service areas to the Everglades National Park
96 Levee seepage from Everglades National Park that is returned to the park along the eastern boundary
97 Ground water flow to LEC service areas
98 Pumped outflow into LEC service areas from proposed S-357 Structure in 8.5 Square Mile Area
Table 50. Description of Flow Arrows on the Primary Water Budget Components Maps.
No. Description
178

LEC Regional Water Supply Plan - Planning Document Chapter 4: Analysis and Evaluation of Model Results
99 Inflow of new water to Everglades National Park from the Lakebelt storage areas, seepage collection, and WCA-3and WCA-2B excess through structures and overland flow buffer zones along the eastern boundary of the park(S-174; S-332 A,B,D; S-356 A,B), excluding levee seepage from the park that is pumped back into the park
100 Change in Everglades National Park water storage
Lower East Coast Service Areas
Area = 2,088 square miles = 1,336,320 acres(Includes L-8 Basin)
101 Rainfall on LEC service areas
102 Evapotranspiration from LEC service areas
103 Net pumpage for water supply
104 Water provided from the reuse of reclaimed water
105 Overland flow to Biscayne Bay
106 Ground water flow to Biscayne Bay
107 Structural flow to Biscayne Bay
108 Ground water flow from Broward County to tide
109 Structural flow from Broward County to tide
110 Overland flow from Broward County to tide
111 Overland flow from Palm Beach County to Lake Worth Lagoon
112 Ground water flow from Palm Beach County to Lake Worth Lagoon
113 Structural flow from Palm Beach County to Lake Worth Lagoon
114 Ground water flow from Northern Palm Beach County to tide
115 Structural flow from Northern Palm Beach County to Loxahatchee River
116 Overland flow from Northern Palm Beach County to Loxahatchee River
117 Overland inflow from the north
118 Runoff from LEC service areas to Lake Okeechobee
119 Injection into ASR systems
120 Recovery from ASR systems
121 Change in LEC service areas water storage
Table 50. Description of Flow Arrows on the Primary Water Budget Components Maps.
No. Description
179

Chapter 4: Analysis and Evaluation of Model Results LEC Regional Water Supply Plan - Planning Document
LegendEnvironmental
Water Supply
Water Supply
Urban + Agric.
Flood Control
Discharges
Lake Okeechobee
Inflow
Agricultural
Water Supply
Canal Flow
to Tide
Runoff
Overland
Flow
R
Ground Water
Flow + Seepage
Reservoir
Reuse of
Reclaimed Water
Net Pumpage
for Water Supply
PRIMARY WATER BUDGET COMPONENTS: KEY
Units = 1,000 ac-ft and represent
means over a 31-year simulation
using the SFWMM v 3.7
CaloosahatcheeBasin
LakeOkeechobee
Big CypressNational Preserve
EvergladesAgriculturalArea
St. Lucie Basin
LowerEastCoast
WaterConservationAreas
EvergladesNational Park
Change in Storage
Aquifer
Storage and
Recovery
TO FROM
ASR
Rain
ET Evapotranspiration
Rainfall
8
6 7
ASR
3 RNorth of Lake OkeechobeeStorage Reservoir
4
5 Target
3635
34
R
R27
31
2829
23
24
2532
30
3326
Target
2221
910
11
12
20
13
19 15
14
1817
16
86
83
84
68
88
87
67
89
59
71 73
92
94
95
93
97
96
99
100
49
48
47R
R
45
46
62
55
57
41
60
61
44
56
42
ToSeminoles
39
43
40
50
66
58
76
78
75
77
74
80
104
106
107
105
109
121
103
119
120ASR
113
115
Fro
m B
row
ard
Cou
nty
Lak
e W
ort
h L
ago
on
Lo
xah
atch
ee R
iver
53
85
30 May 2000
52
54
69
51
79
2
1
38
37
64
63
82
81
91
90
102
101
108
110
112
111
114
116117118
65
70 72
98
Bis
cay
ne
Bay
ServiceArea
Figure 29. Key for the Water Budget Components Figures.
180
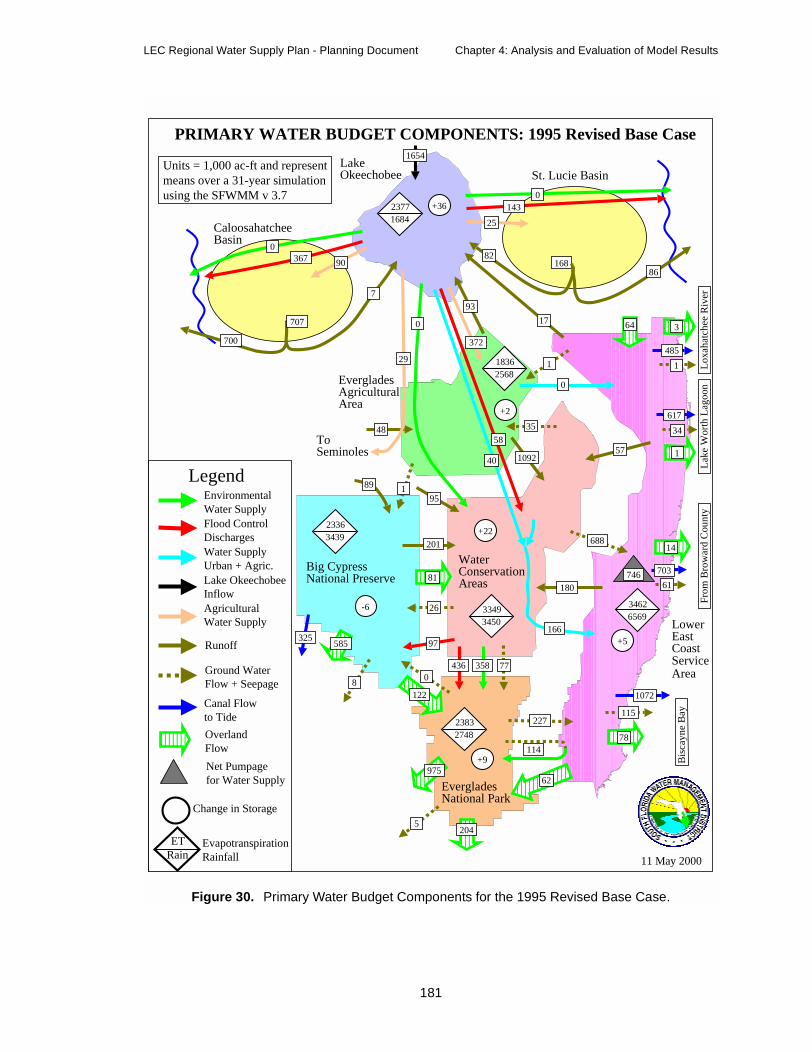
LEC Regional Water Supply Plan - Planning Document Chapter 4: Analysis and Evaluation of Model Results
LegendEnvironmental
Water Supply
Water Supply
Urban + Agric.
Flood Control
Discharges
Lake Okeechobee
Inflow
Agricultural
Water Supply
Canal Flow
to Tide
Runoff
Overland
Flow
Ground Water
Flow + Seepage
Net Pumpage
for Water Supply
PRIMARY WATER BUDGET COMPONENTS: 1995 Revised Base Case
Units = 1,000 ac-ft and represent
means over a 31-year simulation
using the SFWMM v 3.7
CaloosahatcheeBasin
LakeOkeechobee
Big CypressNational Preserve
EvergladesAgriculturalArea
St. Lucie Basin
LowerEastCoast
WaterConservationAreas
EvergladesNational Park
Change in Storage
Rain
ET Evapotranspiration
Rainfall
+36
1654
16882
25
8690
7
707
700
8
89
325
0
-6
1
204
62
5
227
114+9
17
93
58
40
+2
35
ToSeminoles
291
688
166
64 3
+22
115
78
14
703
61
+5
617
34
485
Fro
m B
row
ard
Cou
nty
Lak
e W
ort
h L
ago
on
Lo
xah
atch
ee R
iver
1
1
585
2377
1684
367
143
0
0
48
372
0
1836
2568
2336
3439
122
975
2383
2748
97
201
3349
3450
77436 358
180
95
3462
6569
1072
746
11 May 2000
109257
26
81
0
Bis
cay
ne
Bay
ServiceArea
Figure 30. Primary Water Budget Components for the 1995 Revised Base Case.
181

Chapter 4: Analysis and Evaluation of Model Results LEC Regional Water Supply Plan - Planning Document
LegendEnvironmental
Water Supply
Water Supply
Urban + Agric.
Flood Control
Discharges
Lake Okeechobee
Inflow
Agricultural
Water Supply
Canal Flow
to Tide
Runoff
Overland
Flow
Ground Water
Flow + Seepage
Net Pumpage
for Water Supply
PRIMARY WATER BUDGET COMPONENTS: 2005
Units = 1,000 ac-ft and represent
means over a 31-year simulation
using the SFWMM v 3.7
CaloosahatcheeBasin
LakeOkeechobee
Big CypressNational Preserve
EvergladesAgriculturalArea
St. Lucie Basin
LowerEastCoast
WaterConservationAreas
EvergladesNational Park
Change in Storage
Rain
ET Evapotranspiration
Rainfall
+31
1647
16880
24
88
703
690
8
89
324
1
86
-2
4
1265
145
66
5
244
289
137
+14
58
77
72
+2
19153
ToSeminoles
222
284633
226
64 3
+18
107
866
72
13
702
66
+6
871
492
36
499
Fro
m B
row
ard
Cou
nty
Lak
e W
ort
h L
ago
on
Lo
xah
atch
ee R
iver
1
1
581
2368
1684
0
0
275
111
114
13
9
1908
2568
85
9
352
181
2340
3439
71
64
304 812 25
2440
2748
3303
3450
3464
6569
186
1
1008153
22
90
15 June 2000
Bis
cay
ne
Bay
ServiceArea
Figure 31. Primary Water Budget Components for the 2005 Incremental Simulation.
182
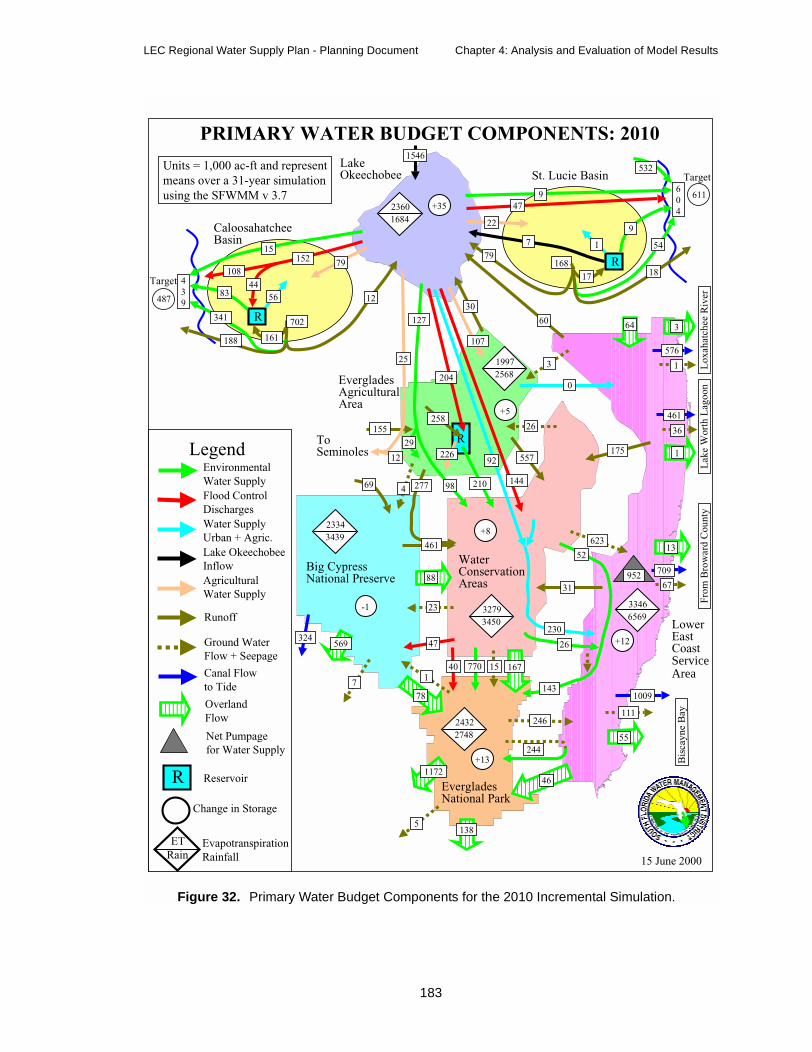
LEC Regional Water Supply Plan - Planning Document Chapter 4: Analysis and Evaluation of Model Results
LegendEnvironmentalWater Supply
Water SupplyUrban + Agric.
Flood ControlDischarges
Lake OkeechobeeInflowAgriculturalWater Supply
Canal Flowto Tide
Runoff
OverlandFlow
R
Ground WaterFlow + Seepage
Reservoir
Net Pumpagefor Water Supply
PRIMARY WATER BUDGET COMPONENTS: 2010
Units = 1,000 ac-ft and representmeans over a 31-year simulationusing the SFWMM v 3.7
CaloosahatcheeBasin
LakeOkeechobee
Big CypressNational Preserve
EvergladesAgriculturalArea
St. Lucie Basin
LowerEastCoast
WaterConservationAreas
EvergladesNational Park
Change in Storage
RainET Evapotranspiration
Rainfall
+35
1546
Target
611604
532
R
R168
17
7954
47
229
18
1
Target
487
439
15
4456
79
83
702
161188
341
7
69
324
1
78
-1
4
1172
138
46
5
246
244
143
+13
60
30
R
204
92
+5
26
210
155258
226 557
127
ToSeminoles
25
29
12
3
461
277
31
623
230
52
64 3
+8
111
1009
55
13
709
67
+12
461
36
576
From
Bro
war
d C
ount
yL
ake
Wor
th L
agoo
nL
oxah
atch
ee R
iver
1
1
569
23601684
9
7
107
14498
152
12
108
19972568
23343439
47
24322748
16715
26
770
33466569
952
32793450
23
88
0
175
40
15 June 2000
Bis
cayn
e B
ay
ServiceArea
Figure 32. Primary Water Budget Components for the 2010 Incremental Simulation.
183
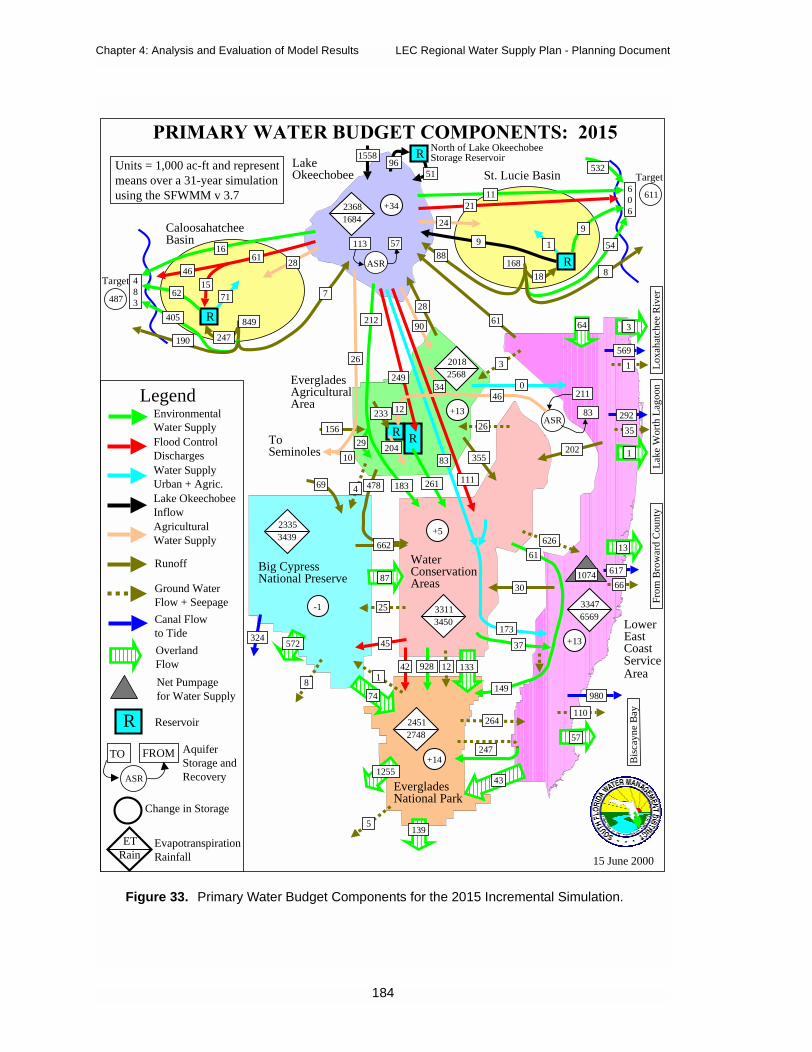
Chapter 4: Analysis and Evaluation of Model Results LEC Regional Water Supply Plan - Planning Document
LegendEnvironmental
Water Supply
Water Supply
Urban + Agric.
Flood Control
Discharges
Lake Okeechobee
Inflow
Agricultural
Water Supply
Canal Flow
to Tide
Runoff
Overland
Flow
R
Ground Water
Flow + Seepage
Reservoir
Net Pumpage
for Water Supply
PRIMARY WATER BUDGET COMPONENTS: 2015
Units = 1,000 ac-ft and represent
means over a 31-year simulation
using the SFWMM v 3.7
CaloosahatcheeBasin
LakeOkeechobee
Big CypressNational Preserve
EvergladesAgriculturalArea
St. Lucie Basin
LowerEastCoast
WaterConservationAreas
EvergladesNational Park
Change in Storage
Aquifer
Storage and
Recovery
TO FROM
ASR
Rain
ET Evapotranspiration
Rainfall
+34
113
ASR
1558 RNorth of Lake OkeechobeeStorage Reservoir
96
51 Target
6116
0
6
532
R
R168
18
8854
11
21
249
8
19
Target
487
4
8
3
1661
46
15
71
28
62 7
849
247190
405
8
69
324
1
74
-1
4
1255
139
43
5
264
247
149
+14
61
28
90
RR
249
83
+13
26
261
156
233
204
183
355
212
ToSeminoles
26
29
10
3
662
478
30
626
173
61
64 3
+5
110
980
57
13
617
66
+13
1074
211
83 292
35
569
Fro
m B
row
ard
Cou
nty
Lak
e W
ort
h L
ago
on
Lo
xah
atch
ee R
iver
34
1
1
572
2368
1684
2018
2568
57
111
2335
3439
45
2451
2748
13312928
3347
6569
37
3311
3450
87
25
0
202
ASR
46
12
42
15 June 2000
Bis
cay
ne
Bay
ServiceArea
Figure 33. Primary Water Budget Components for the 2015 Incremental Simulation.
184

LEC Regional Water Supply Plan - Planning Document Chapter 4: Analysis and Evaluation of Model Results
LegendEnvironmental
Water Supply
Water Supply
Urban + Agric.
Flood Control
Discharges
Lake Okeechobee
Inflow
Agricultural
Water Supply
Canal Flow
to Tide
Runoff
Overland
Flow
R
Ground Water
Flow + Seepage
Reservoir
Reuse of
Reclaimed Water
Net Pumpage
for Water Supply
PRIMARY WATER BUDGET COMPONENTS: LEC-1 Revised
Units = 1,000 ac-ft and represent
means over a 31-year simulation
using the SFWMM v 3.7
CaloosahatcheeBasin
LakeOkeechobee
Big CypressNational Preserve
EvergladesAgriculturalArea
St. Lucie Basin
LowerEastCoast
WaterConservationAreas
EvergladesNational Park
Change in Storage
Aquifer
Storage and
Recovery
TO FROM
ASR
Rain
ET Evapotranspiration
Rainfall
2380
1684
+31
233 115
ASR
1553 RNorth of Lake OkeechobeeStorage Reservoir
98
49 Target
6116
0
8
532
R
R168
18
8654
14
12
258
10
110
Target
487
4
8
4
1641
28
13
71
29
62 5
852
252189
406
8
69
325
1
37
117
2357
3439
-2
4
1028 8
1314
120
22
5
2489
2748
229
184
331
+16
63
28
85
96R
R
222
89
2018
2568
+10
26
233
156
237
210
167
436
196
ToSeminoles
26
29
11
3
3343
3450
508
404
26
472
179
67
155
64 3
+20
203
114
895
89
Bis
cay
ne
Bay
3341
6569
13
594
65
+7
1195
304
35
499
Fro
m B
row
ard
Cou
nty
Lak
e W
ort
h L
ago
on
Lo
xah
atch
ee R
iver
37
1
1
595
223
ASR
55
18
204
90
28
0
15 June 2000
ServiceArea
Figure 34. Primary Water Budget Components for the 2020 Incremental Simulation.
185

Chapter 4: Analysis and Evaluation of Model Results LEC Regional Water Supply Plan - Planning Document
186
LEC Regional Water Supply Plan - Planning Document Chapter 5: Implementation Strategies
Chapter 5IMPLEMENTATION STRATEGIES AND BASIS FOR
RECOMMENDATIONS
INTRODUCTION
This chapter identifies and provides key information about the projects and actionsthat will be undertaken to implement the Lower East Coast Regional Water Supply Plan(LEC Plan). Specific recommendations are presented in Chapter 6. The first section ofChapter 5 provides an overview of regional water supply plan implementation strategies.It also provides definitions of water resource development and water supply developmentprojects. The remaining two sections of this chapter present and discuss the water resourcedevelopment projects and water supply development options proposed under this plan.
REGIONAL WATER SUPPLY PLAN IMPLEMENTATION STRATEGIES
Regional Water Supply Plan Implementation Assurances
Background
During the next 20 years, the South Florida Water Management District (District,SFWMD), the State of Florida, and consumptive users will be partners in implementingregional water supply plans per a directive of Section 373.0361, F.S. The regional watersupply plans provide a guide map for meeting consumptive user demands and naturalsystem demands projected for 2020. Economic, technical and political uncertainties areassociated with implementing water resource development projects of the complexity andscope recommended in the regional water supply plans. These uncertainties will beparticularly evident during the interim period when the various elements will beimplemented and become operational. Reasonable certainty is needed for the protection ofexisting legal users and the water resources during the interim period.
Water resource development projects, operational changes, consumptive usepermitting, and rulemaking associated with the regional water supply plans are proposedto occur in phases. The increasing demands of consumptive users and the environmentmust, to the extent practicable, correspond with the timing of increased water availability.Where shifts from existing sources of water are required for environmental enhancement,it is crucial that replacement sources are available when such shifts occur. Also, resourcesmust be protected from harm, significant harm, and serious harm.
Existing Florida law provides the framework and includes several tools toaccomplish these goals. These tools include water reservations, consumptive use permits,Minimum Flows and Levels (MFL) recovery strategies, and water shortage declarations.
187
Chapter 5: Implementation Strategies LEC Regional Water Supply Plan - Planning Document
A composite schedule for implementation of these water resource tools in concert withwater resource development projects must be proposed in the regional water supply plans.This schedule will be further refined in five-year water resource development work plans,five-year water supply plan updates, annual budget reviews, periodic rule updates, andconsumptive use permit renewals. Processes for contingency planning will also bedeveloped to address uncertainties in the fulfillment of the water supply plans with thegoal of complying with state requirements for the protection of existing legal users andenvironmental resources.
Water User and Natural System Assurances
The level of assurances to protect existing legal water users and the naturalsystems (assurances) while implementing the regional water supply plans must beconsistent with Chapter 373, F.S. In this implementation process, the District’s GoverningBoard will be faced with many policy decisions regarding the application andinterpretation of law. The unique legal, technical, economical, and political implications ofthe regional water supply plans will all be considered in making these policy decisions.The District will be facing many of these issues for the first time in terms of their scale andsignificance.
The subject of assurances has been addressed in other forums, particularly in theCentral and Southern Florida Project Comprehensive Review Study Final IntegratedFeasibility Report and Programmatic Environmental Impact Statement (Restudy)(USACE and SFWMD, 1999). Although these assurances were developed in the contextof the Restudy implementation, such assurances are applicable to implementation ofregional water supply plan recommendations under state law and have been approved bythe District’s Governing Board. The Governing Board directs staff to implement the LECPlan in accordance with the following assurances:
10.2.9. Assurances To Water Users
The concept of “assurances” is key to the successful implementation of theComprehensive Plan. Assurances can be defined in part as protecting, during theimplementation phases of the Comprehensive Plan, the current level(s) of servicefor water supply and flood protection that exist within the current applicableFlorida permitting statutes. Assurances also involve protection of the naturalsystem.
The current C&SF Project1 has generally provided most urban andagricultural water users with a level of water supply and flood protection adequateto satisfy their needs. Florida law requires that all reasonable beneficial water usesand natural system demands be met. However, the C&SF Project, or regionalsystem, is just one source of water for south Florida to be used in concert withother traditional and alternative water supplies.
1. C&SF Project refers to the Central and Southern Florida Project for Flood Control and Other Purposes.
188
LEC Regional Water Supply Plan - Planning Document Chapter 5: Implementation Strategies
The Governor’s Commission for a Sustainable South Florida developed aconsensus-based set of recommendations concerning assurances to existing users,including the natural system (GCFSSF, 1999). The following text is taken fromthe Commission’s Restudy Plan Report, which was adopted on January 20, 1999:
“Assurances are needed for existing legal users during the period of planimplementation. It is an important principle that has helped gain consensusfor the Restudy that human users will not suffer from the environmentalrestoration provided by the Restudy. At the same time, assurances are neededthat, once restored, South Florida’s natural environment will not again benegatively impacted by water management activities. Getting ‘from here tothere’ is a challenge. The implementation plan will be the key to assuringpredictability and fairness in the process.
Protecting Current Levels of Service (Water Supply and Flood Protection)during the Transition from the Old to the New C&SF Project.
The goal of a sustainable South Florida is to have a healthy Evergladesecosystem that can coexist with a vibrant economy and quality communities.The current C&SF Project has generally provided most urban andagricultural water users with a level of water supply and flood protectionadequate to satisfy their needs. In fact, if properly managed, enough waterexists within the South Florida system to meet restoration and future watersupply needs for the region. However, past water management activities inSouth Florida, geared predominantly toward satisfying urban andagricultural demands, have often ignored the many needs of the naturalsystem (GCSSF, 1995; transmittal letter to Governor Chiles, p. 2).Specifically, water managers of the C&SF Project historically dischargedvast amounts of water to tide to satisfy their mandate to provide floodprotection for South Florida residents, oftentimes adversely impacting theregion’s estuarine communities.
The Commission recommended that in the Restudy, the SFWMD and theCorps1 should ensure that the redesign of the system allows for a resilientand healthy natural system (GCSSF, 1995; p. 51) and ensure an adequatewater supply and flood protection for urban, natural, and agricultural needs(GCSSF, 1996a; p.14). In response to the need to restore South Florida’secosystem, and in light of the expected future increase of urban andagricultural water demands, the Restudy aims to capture a large percentageof water wasted to tide or lost through evapotranspiration for use by both thebuilt and natural systems. In order to maximize water storage, the Restudyintends to use a variety of technologies located throughout the South Floridaregion so that no one single area bears a disproportionate share of thestorage burden. This direction reinforces the Commission’s recommendationthat water storage must be achieved in all areas of the South Florida systemusing every practical option (GCSSF, 1996a; p. 25).
However, concerns have been expressed that a water user would be forced torely on a new water storage technology before that technology is capable of
1. U.S. Army Corps of Engineers
189

Chapter 5: Implementation Strategies LEC Regional Water Supply Plan - Planning Document
fully providing a water supply source or that existing supplies wouldotherwise be transferred or limited, and that the user would therebyexperience a loss of their current legal water supply level of service. Anywidespread use of a new technology certainly has potential limitations;however, the Restudy should address technical uncertainties prior to projectauthorization and resolve them before implementation in the new C&SFProject. With the addition of increased water storage capabilities, watermanagers will likely shift many current water users to different watersources.
Additionally, stakeholders are concerned that a preservation of the currentlevel of service for legal uses would not encompass all the urban uses, someof which are not incorporated in the term ‘legal’ and covered by permit.Specifically, an adequate water supply is needed to address urbanenvironmental preservation efforts as well as water level maintenance toreduce the impact of salt water intrusion.
The Commission believes that in connection with the Restudy, the SFWMDshould not transfer existing legal water users from their present sources ofsupply of water to alternative sources until the new sources can reliablysupply the existing legal uses. The SFWMD should implement full use of thecapabilities of the new sources, as they become available, while continuing toprovide legal water users as needed from current sources. It is theCommission’s intent that existing legal water users be protected from thepotential loss of existing levels of service resulting from the implementationof the Restudy, to the extent permitted by law.
The Commission also recognizes that the SFWMD cannot transfer theSeminole Tribe of Florida from its current sources of water supply withoutfirst obtaining the Tribe’s consent. This condition exists pursuant to theSeminole Tribe’s Water Rights Compact, authorized by Federal (P.L1. 100-228) and State Law (Section 285.165, F.S.).
However, the issues surrounding the development of specific assurances towater users are exceedingly complex and will require substantial additionaleffort to resolve.
RECOMMENDATION
• The SFWMD and the Corps should work with all stakeholders to developappropriate water user assurances to be incorporated as part of theRestudy authorizations. These water user assurances should be based onthe following principles:
A. Physical or operational modifications to the C&SF Project by thefederal government or the SFWMD will not interfere with existing legaluses and will not adversely impact existing levels of service for floodmanagement or water use, consistent with State and federal law.
1. P.L. refers to Public Law
190
LEC Regional Water Supply Plan - Planning Document Chapter 5: Implementation Strategies
B. Environmental and other water supply initiatives contained in theRestudy shall be implemented through appropriate State (Chapter 373 F.S.)processes.
C. In its role as local sponsor for the Restudy, the SFWMD will complywith its responsibilities under State water law (Chapter 373 F.S.).
D. Existing Chapter 373 F.S. authority for the SFWMD to manage andprotect the water resources shall be preserved.
Water Supply for Natural Systems
Concerns have been raised about long term protection of the Evergladesecosystem. According to WRDA 19961, the C&SF Project is to be rebuilt ‘forthe purpose of restoring, preserving, and protecting the South Floridaecosystem’ and ‘to provide for all the water-related needs of the region,including flood control, the enhancement of water supplies, and otherobjectives served by the C&SF Project.’
Environmental benefits achieved by the Restudy must not be lost to futurewater demands. When project implementation is complete, there must beways to protect the natural environment so that the gains of the Restudy arenot lost and the natural systems, on which South Florida depends, remainsustainable.
A proactive approach which includes early identification of futureenvironmental water supplies and ways to protect those supplies underChapter 373 F.S. will minimize future conflict. Reservations for protection offish and wildlife or public health and safety can be adopted early in theprocess and conditioned on completion and testing of components to assurethat replacement sources for existing users are on line and dependable. TheSFWMD should use all available tools, consistent with Florida Statutes, toplan for a fair and predictable transition and long term protection of waterresources for the natural and human systems.
Apart from the more general goals of the Restudy, there are specificexpectations on the part of the joint sponsors - the State and the federalgovernment. The more discussion that goes into an early agreement onexpected outcomes, the less conflict there will be throughout the projectconstruction and operation.
RECOMMENDATIONS
• The SFWMD should use the tools in Chapter 373 F.S. to protect watersupplies necessary for a sustainable Everglades ecosystem. This shouldinclude early planning and adoption of reservations. These reservations forthe natural system should be conditioned on providing a replacement watersource for existing legal users which are consistent with the public interest.Such replacement sources should be determined to be on line anddependable before users are required to transfer.
1. The Water Resource Development Act of 1996 (WRDA 1996) is legislation passed by the U.S. Congressthat authorized the Restudy, the Water Preserve Area Feasibility Study, etc.
191
Chapter 5: Implementation Strategies LEC Regional Water Supply Plan - Planning Document
• The SFWMD should expeditiously develop a ‘recovery plan’ that identifiestimely alternative water supply sources for existing legal water users. Therecovery plan should consist of water supply sources that can reliablysupply existing uses and whose development will not result in a loss ofcurrent levels of service, to the extent permitted by law. To assure that longterm goals are met, the State and federal governments should agree onspecific benefits to water users, including the natural system, that will bemaintained during the recovery.
• In the short term, the Restudy should minimize adverse effects ofimplementation on critical and/or imperiled habitats and populations ofState and federally listed threatened and/or endangered species. In the longterm, the Restudy should contribute to the recovery of threatened speciesand their habitats.
Protecting Urban Natural Systems and Water Levels
Water supply for the urban environment is connected to water supply for theEverglades and other natural areas targeted for restoration and preservationunder the Restudy.
It is essential that the Restudy projects proposed to restore and preserve theenvironment of the Everglades do not reduce the availability of water to suchan extent in urban areas that the maintenance of water levels and thepreservation of natural areas becomes physically or economically infeasible.
The successful restoration of Everglades functions is dependent not onlyupon the establishment of correct hydropatterns within the remainingEverglades, but also upon the preservation and expansion of wetlands,including those within urban natural areas that once formed the easternEverglades. Some of the westernmost of these areas have been incorporatedin the Restudy as components of the WPAs1. However, the on-goingpreservation efforts of local governments have acquired hundreds of millionsof dollars worth of additional natural areas for protection both inside andoutside of the WPA footprint.
Water supplies for these urban wetlands are not covered by existing permitsor reservations and are therefore, not adequately protected. Efforts areunderway at both the SFWMD and the local level to preserve these vitalareas and assure their continuing function as natural areas and in ecosystemrestoration.
Detailed design for the Restudy, in particular the detailed modelingassociated with the WPA Feasibility Study2, will make possible plans toprotect these urban wetlands from damage and to assure maximumintegration with Restudy components.
1. Water Preserve Areas
2. The Water Preserve Areas Feasibility Study, scheduled for completion in 2001, is investigating methodsto capture and store excess surface waters that are normally released to tide via the C&SF Project canalsystem.
192
LEC Regional Water Supply Plan - Planning Document Chapter 5: Implementation Strategies
RECOMMENDATIONS
• The SFWMD and the Corps should acknowledge the important role ofurban natural areas as an integral part in the restoration of a functionalEverglades system. As a part of the implementation plan, the SFWMD andthe Corps should develop an assurance methodology in conjunction withthe detailed design and modeling processes, such as the WPA FeasibilityStudy, to provide the availability of a water supply adequate for urbannatural systems and water level maintenance during both implementationand long term operations.
• Expand and accelerate implementation of the WPAs. Accelerate theacquisition of all lands within the WPA footprint to restore hydrologicfunctions in the Everglades ecosystem, and ensure hydrologic connectivitywithin the WPA footprint. The WPA Feasibility Study process should begiven a high priority. The WPA concept should be expanded into otherSFWMD planning areas such as the Upper East Coast.
• The Restudy should assure that the ecological functions of the Pennsucowetlands are preserved and enhanced.”
There is a substantial body of law that relates to the operation of Federal floodcontrol projects, both at the state and Federal level. Much of the Governor’sCommission language is directed to the South Florida Water Management Districtand matters of state law. To the extent that the Governor’s Commission’s guidanceapplies to the Corps’ actions, the Corps will give it the highest consideration asRestudy planning proceeds and as plan components are constructed and broughton-line consistent with state and Federal law. The recommended ComprehensivePlan does not address or recommend the creation or restriction of new legalentitlements to water supplies or flood control benefits.
Regulatory Implementation
Introduction
The purpose of this discussion is to outline the relationship and distinctionbetween the planning process and the regulatory implementation of the LEC Plan. In orderto understand how these two water management components work together, it is helpful toknow the limits and scope of each. This section describes the planning level vision of theregulatory component. It is essential that the regulatory component described below beviewed as a flexible framework for implementing actions. During development of therules and other agency actions necessary to implement the regulatory component, publicinput and District Governing Board direction will be incorporated to further refine thisframework.
The water supply plan contains descriptions of structural, regulatory, andoperational elements, along with procedures by which the elements will be implemented.Planning evaluations are conducted with a set of assumptions and approximations thatmay change over time with variations in social and economic factors of the region. While
193
Chapter 5: Implementation Strategies LEC Regional Water Supply Plan - Planning Document
a plan does evaluate cumulative impacts of existing and potential water withdrawals, theplan is not a master permit, nor does it predetermine decisions to be made in the permitreview process.
The relatively local variations occurring on a project-by-project basis are notanticipated to have regional, or otherwise significant, implications on the implementationof the regional water supply plan objectives. In order to address the local and regionalimpacts of water uses on a day-to-day basis, the District utilizes its statutory authorities inregulating the consumptive use of water. When used in conjunction with a regional watersupply plan, the Consumptive Use Permitting (CUP) regulatory process is able to preventover allocation of regional and localized water resources and to assure a level of certaintyfor permitted users, exempt users, and the environment.
The LEC Plan contains projections for both the water supply and demandestimates over the next twenty years and time frames for expansion of water supplies tomeet urban, agricultural, and environmental needs. In addition, protocols for the deliveryof water to the natural system and consumptive uses have also been evaluated in the plan.In order to ensure water supplies are used for their intended purposes, or to protect againstwater supplies being taken away from such intended uses, the District will use itsregulatory authority to implement water shortage cutbacks during drought, reserve waterfrom CUP allocation for the natural system and public health and safety, and protect watersupplies designated for permit holders.
In order to achieve the regulatory goals of the regional water supply plan, theDistrict will develop rules and implement the rules consistent with state law. However,this raises the following question: If the rule development and implementation process isseparate from the plan, how can the public be assured that the resulting rules will beconsistent with the plan? This assurance is provided through the administrative proceduresoutlined in state law under Chapter 120, F.S. Both rulemaking and formal agency actionsof the District must comply with requirements affording substantially affected parties theopportunity to participate in the rule development process and to challenge proposed rules,existing rules, and final and proposed agency action.
Should the rulemaking and its intended and unintended effects deviate fromperformance measures used in the plan, the Governing Board may direct staff to conductadditional evaluations to supplement the planning level evaluations that support theproposed rule, or revise the draft rule consistent with the planned performance measures.In addition, opportunities for public involvement in identifying contingency actionsnecessary to implement additional water resource development projects by proposed rulesare outlined in the Contingency Planning section on page 203 of this chapter.
It has been determined that the existing system used to deliver water throughoutthe region presents significant constraints on environmental restoration. As a result,significant structural changes, to be completed over time, are necessary to restorehydropatterns in regional natural systems. Therefore, the amounts of water to be deliveredand protected, and the timing and sources of supply to be incorporated under reservationrules and other resource protection standards described below will evolve with the
194

LEC Regional Water Supply Plan - Planning Document Chapter 5: Implementation Strategies
implementation of water resource development projects. Florida law is well suited to dealwith the changing water supply situation in South Florida that occurs as the water resourcedevelopment projects outlined in the Comprehensive Everglades Restoration Plan (CERP)and LEC plans are implemented.
The need for flexibility in implementing a phased restoration project raises thefollowing question: What assurances are there that the identified future sources ofenvironmental water supply, including reservations, will not be permitted away? Severalfactors associated with the implementation of this plan address this concern. First, the planincludes water resource development projects that provide adequate supplies of waterthrough a 1-in-10 year drought condition, to meet the needs of both the environmentalrestoration and permitted water uses by 2020 to the greatest extent possible. Theenvironment and consumptive uses will not need to compete for water. Secondly, theproposed CUP rules contain provisions to limit new demands on the regional system asthe water resource development/CERP projects are being constructed. These includelimiting the amounts of regional water that can be allocated to each service area in five-year increments based on the results of the planning analysis. If cumulative regulatoryevaluations indicate that the five-year limitations on regional water allocations have beenreached, new or increased demands will be met through alternative and local (independentof the regional system) supplies until additional water is available. Also, existing suppliescan be more efficiently utilized to meet increasing demands until additional regionalsupplies are made available. As part of this process, it is envisioned that both CUP watersupplies and environmental water reservations will be updated every five years asnecessary to reflect changed water supply availability as the projects associated with thisplan are completed.
Should the water supply needs of the natural system or consumptive uses exceedthe projections in the LEC Plan, the District will utilize the planning process to developalternative water resources and avoid competition to the greatest degree possible.Assurances set forth in this plan and the contingency planning efforts will be applied toprotect both consumptive uses and the natural system while alternative sources as beingdeveloped.
As one of the tools for plan implementation, rulemaking to implement theregulatory recommendations of the LEC Plan will constitute a significant effort during thenext several years. Rulemaking will include water reservations and numerous CUPcriteria, which are interrelated and cumulatively define the availability of water forconsumptive uses and water resource protection. As a result, it is recommended in theLEC Plan that certain rulemaking efforts be grouped in phases to allow for the cumulativeanalysis of the water resource and consumptive use implications of the regulatoryprogram.
Another goal of the rulemaking schedule is to adopt rules as the technicalinformation becomes available. As a result, it is recommended in this plan that initialrulemaking proceed for concepts that were sufficiently identified and evaluated in theplanning process. These include establishment of MFLs for the Everglades, LakeOkeechobee, the Biscayne Aquifer, and the Caloosahatchee River.
195
Chapter 5: Implementation Strategies LEC Regional Water Supply Plan - Planning Document
In addition, uncertainties in the rulemaking process, such as delays fordevelopment of supporting technical data or rule challenges, may conflict with theproposed schedule for rule development provided in this plan. The proposed schedule willbe adapted to account for such delays, while considering the need to develop associatedrules through a coordinated rulemaking process. The contingency process identified in theplan, along with input from the LEC Regional Water Supply Plan Advisory Committee,other members of the public, and the Governing Board may be used to identify necessarychanges to the rulemaking schedule.
The following sections give a brief overview of the legal and policy issuesassociated with the major tools for implementing the regulatory component of the regionalwater supply plan discussed above. This discussion should be read in context of the LECPlan as a whole, and is not intended to be inclusive of all of the relevant legal and policyfactors considered in development and implementation of the plan.
Water Reservations
Legal Description
Section 373.223(4), F.S., provides the following in relevant part:
The governing board or the department, by regulation, may reserve fromuse by permit applicants, water in such locations and quantities, and forsuch seasons of the year, as in its judgment may be required for theprotection of fish and wildlife or the public health and safety.
The statute also provides that reservations are subject to periodic review based onchanged conditions. This provides flexibility to account for changes in implementationstrategies and contingency plans during the next 20 years. A specific level of protection isalso provided to existing legal users when establishing reservations. Existing legal usersare protected insofar as they are “not contrary to the public interest” (Section 373.223(4),F.S.).
Reservation Implementation Policies
Reservations will reflect environmental enhancement and protection goals andobjectives consistent with the Restudy hydropattern achievable by 2020, based on thedegree of CERP implementation expected within that time frame. When appropriate, rain-driven formulas will be used to determine reservation quantities. Reservations willincrementally delineate and protect the volume and timing of necessary environmentalwater supply deliveries. Likewise, consumptive use demands under conditions up to andincluding a 1-in-10 year drought event are estimated and will be incrementally protectedthrough consumptive use permits. Water shortage provisions (see below) will govern theactions of the District in providing shared adversity to both the natural system under rain-driven formulas and consumptive users for conditions beyond the 1-in-10 drought yearlevel of certainty.
196
LEC Regional Water Supply Plan - Planning Document Chapter 5: Implementation Strategies
Water availability and its delivery for environmental purposes will increase aswater resource development projects are constructed. Initial and incremental increases inwater reservations to provide increased water deliveries to the natural system shall becontingent upon availability of water from water resource development projects providedto augment existing supplies or create new supplies to meet such demands.
The reservation rule will include a description of the ultimate 2020 restorationdeliveries to the natural system. The rule will also account for potential changes to reflectrefinement of the project designs or restoration targets. The rule will incorporate the listand description of the water resource development projects and amounts of waterpotentially to be made available for the reservation upon deployment. Finally, the rule willinclude water supply formulae and protocols to define the amount and timing of watersupply deliveries based on the remaining constraints on the regional system. As new waterresource development projects are constructed, the rule will be revised to include theresulting improvements in deliveries. A series of water resource development projects thatwill provide water to meet MFL targets and reservations are listed in Table 51. Theanticipated completion date of each of these options is also included.
Water reservations rules will be drafted for Everglades National Park, the WaterConservation Areas (WCAs), and the Holey Land and Rotenberger Wildlife ManagementAreas (WMAs) by 2003. Everglades National Park staff requested that the rain-drivenschedules currently being developed by the District be utilized for the initial reservationinstead of the existing rain-driven formula that is being used to deliver water to the park.Additional reservation rules for Florida Bay, Biscayne Bay, Loxahatchee Slough andRiver, the Caloosahatchee and St. Lucie estuaries, and subregional wetlands (in PalmBeach, Broward, and Miami-Dade counties including the Model Lands and south Miami-Dade wetlands) will be undertaken as supporting technical research is concluded andwater supplies to meet the natural system demands are made available. In the interim(2000-2004), until reservations can be defined or the CERP implemented, the above waterbodies will receive, to the greatest extent practicable, similar water deliveries through timeas generally reflected in the incremental performance of the LEC Plan. The systemwideoperational protocols, as developed under Recommendation 31 of this plan, will include,to the greatest extent practicable, the operational assumptions reflected in the SouthFlorida Water Management Model (SFWMM) for the recommended alternative and timehorizon.
Consumptive Use Permitting
Legal Description
Under Section 373.219, F.S., the yield of the source, or amount of water which canbe permitted for use, is limited, in part, by the resource protection criteria which definewhen harm will occur to the resource. Resource protection criteria have been adopted bythe water management districts pursuant to Section 373.223, F.S. This section requires thatall consumptive uses must be reasonable-beneficial. For consumptive uses to beconsidered reasonable-beneficial they must be efficient, consistent with the public interest,and not interfere with other presently existing legal uses. The aim of the reasonable-
197
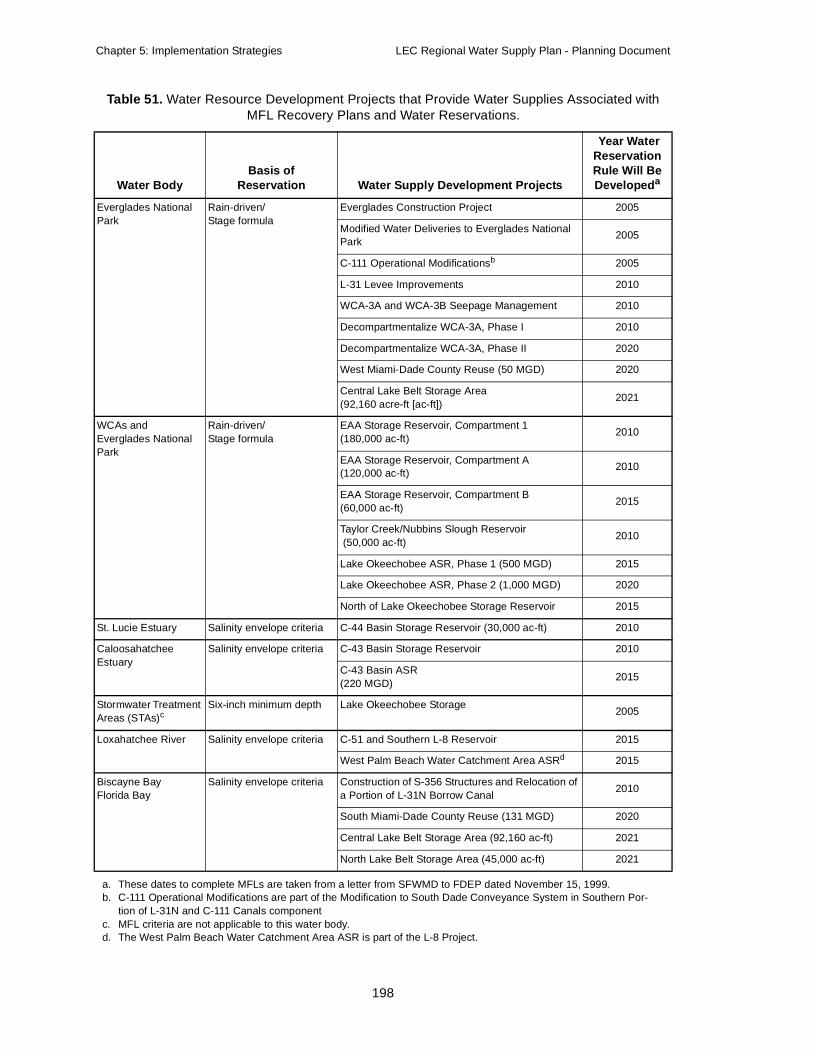
Chapter 5: Implementation Strategies LEC Regional Water Supply Plan - Planning Document
Table 51. Water Resource Development Projects that Provide Water Supplies Associated with MFL Recovery Plans and Water Reservations.
Water BodyBasis of
Reservation Water Supply Development Projects
Year Water Reservation Rule Will Be Developeda
Everglades National Park
Rain-driven/Stage formula
Everglades Construction Project 2005
Modified Water Deliveries to Everglades National Park
2005
C-111 Operational Modificationsb 2005
L-31 Levee Improvements 2010
WCA-3A and WCA-3B Seepage Management 2010
Decompartmentalize WCA-3A, Phase I 2010
Decompartmentalize WCA-3A, Phase II 2020
West Miami-Dade County Reuse (50 MGD) 2020
Central Lake Belt Storage Area(92,160 acre-ft [ac-ft])
2021
WCAs and Everglades National Park
Rain-driven/Stage formula
EAA Storage Reservoir, Compartment 1 (180,000 ac-ft)
2010
EAA Storage Reservoir, Compartment A (120,000 ac-ft)
2010
EAA Storage Reservoir, Compartment B (60,000 ac-ft)
2015
Taylor Creek/Nubbins Slough Reservoir (50,000 ac-ft)
2010
Lake Okeechobee ASR, Phase 1 (500 MGD) 2015
Lake Okeechobee ASR, Phase 2 (1,000 MGD) 2020
North of Lake Okeechobee Storage Reservoir 2015
St. Lucie Estuary Salinity envelope criteria C-44 Basin Storage Reservoir (30,000 ac-ft) 2010
Caloosahatchee Estuary
Salinity envelope criteria C-43 Basin Storage Reservoir 2010
C-43 Basin ASR(220 MGD)
2015
Stormwater Treatment Areas (STAs)c
Six-inch minimum depth Lake Okeechobee Storage2005
Loxahatchee River Salinity envelope criteria C-51 and Southern L-8 Reservoir 2015
West Palm Beach Water Catchment Area ASRd 2015
Biscayne BayFlorida Bay
Salinity envelope criteria Construction of S-356 Structures and Relocation of a Portion of L-31N Borrow Canal
2010
South Miami-Dade County Reuse (131 MGD) 2020
Central Lake Belt Storage Area (92,160 ac-ft) 2021
North Lake Belt Storage Area (45,000 ac-ft) 2021
a. These dates to complete MFLs are taken from a letter from SFWMD to FDEP dated November 15, 1999. b. C-111 Operational Modifications are part of the Modification to South Dade Conveyance System in Southern Por-
tion of L-31N and C-111 Canals componentc. MFL criteria are not applicable to this water body. d. The West Palm Beach Water Catchment Area ASR is part of the L-8 Project.
198

LEC Regional Water Supply Plan - Planning Document Chapter 5: Implementation Strategies
beneficial requirement is to prevent saltwater intrusion and saline water upconing, harm towetlands and other surface waters, aquifer mining, and pollution.
Harm in the resource protection framework proposed in this plan refers to adverseimpacts that require one to two years of average rainfall to recover. Within this document,harm, for purposes of allocating water, occurs when adverse impacts to water resourcesthat occur during dry conditions are sufficiently severe that they cannot be restored withina period of one to two years of average rainfall conditions. These short-term adverseimpacts will be addressed under the CUP Program, which calculates allocations to meetdemands for use during relatively mild, dry season conditions. The harm criteria will notbe exceeded for hydrologic conditions through a 1-in-10 year drought event and permittedallocations will be based on demands up to and including the 1-in-10 year level ofcertainty.
Consumptive Use Permitting Implementation Policies
The following excerpts from Chapter 373, F.S., provide the basic level ofprotection given to existing legal users under the law:
The governing board shall act with a view to full protection of the existingrights to water insofar as is consistent with the purpose of this law[Section 373.171(2), F.S.].
No rule, regulation or order shall require any modification of existing useor disposition of water in the district unless it is shown that the use ordisposition proposed to be modified is detrimental to other water users orto the water resources of the state [Section 373.171(3), F.S.].
Projects to supply water to benefit consumptive users shall be prioritized to firstmeet existing reasonable-beneficial water demands with a 1-in-10 year level of certainty,and then to meet increasing future demands.
Water supplies necessary to meet increasing reasonable-beneficial demands will becontingent upon the demonstrated availability of the water resources to supply requiredvolumes, the performance of water resource development projects identified to augmentor create supplies to meet such demands, and the applicant’s water supply developmentstrategy for meeting the specified demands. Water availability for future permit allocationwill be defined by many factors, including the following:
• Extent to which the resource has been successfully used by theapplicant in the past
• Extent to which the particular source is expected to be developedfor use and the timing of such demand increases
• Extent to which the water supply source derives water from theregional system versus local storage
• Extent to which the source is being diverted for nonconsumptiveuses (e.g., reservations) and the timing of such diversions
199
Chapter 5: Implementation Strategies LEC Regional Water Supply Plan - Planning Document
• Extent to which a particular use was considered in the regionalwater supply planning process, the short-term and long-termdemand projections for such use, and conservation of watersupplies
• Identified water resource development projects and timing ofimplementation
Once the 1-in-10 year level of certainty criteria is established by rule, permits willbe issued based on the applicant's ability to provide reasonable assurances that demandsare reasonable, water resources will be protected, and that issuance of the permit will notinterfere with existing legal users. For existing projects that have been operational duringa 1-in-10 year drought without water resource harm or existing legal user interference, thehistorical performance of the project will be considered in providing reasonableassurances that the conditions for permit issuance are met upon permit renewal.
Implementation of Minimum Flows and Levels Recovery and Prevention Strategies
Legal Description
MFLs are established pursuant to Section 373.042, F.S., A detailed description ofthe process and factors for establishing MFLs is included in the document entitledMinimum Flows and Levels for Lake Okeechobee, the Everglades, and Biscayne Aquifer(SFWMD, 2000e).
Section 373.0421, F.S., requires that once the MFL technical criteria have beenestablished, the Districts must develop and expeditiously implement a recovery andprevention strategy for those water bodies that are currently exceeding, or are expected toexceed, the MFL criteria. Section 373.0421(2), F.S., provides the following in relevantpart:
The recovery or prevention strategy shall include phasing or a timetablewhich will allow for the provision of sufficient water supplies for allexisting and projected reasonable-beneficial uses, including developmentof additional water supplies and implementation of conservation andother efficiency measures concurrent with to the extent practical, and tooffset, reductions in permitted withdrawals, consistent with the provisionsof this chapter.
Minimum Flows and Levels Strategy Implementation Policies
It is possible that the proposed MFL criteria cannot be achieved immediately,because of the lack of adequate regional storage and/or ineffective water distributioninfrastructure. These storage and infrastructure shortfalls will be resolved through waterresource development and water supply development projects, construction of facilities,and improved operational strategies that will increase the region's storage capacity andimprove the existing delivery system. Planning and regulatory efforts will, therefore,
200
LEC Regional Water Supply Plan - Planning Document Chapter 5: Implementation Strategies
include a programmed recovery process that will be implemented over time to improvewater supply and distribution to protect water resources and functions. The recoveryprocess includes the following:
• Necessary structural solutions for the recovery and prevention plan willbe provided in the form of a list of projects. The list will include thetiming and funding requirements for each project. Table 51 provides alist of the various water resource development projects identified in theLEC Plan that will provide water to meet the proposed MFL targets andwater reservations. Table 51 also includes anticipated completion datesof these projects. In addition, Tables 53, 54, and 55 provide theamounts of water projected to be delivered to each area by componentsto meet the proposed MFLs.
• If necessary to prevent the MFL criteria from being exceeded, demandmanagement cutbacks for recovery during drought conditions will alsobe identified (e.g., phased water shortage restrictions to preventsignificant or serious harm). The LEC Plan does not propose the use ofthe Water Shortage Plan as a MFL recovery strategy. However, when adrought occurs, the District will rely upon the Water Shortage Plan, asnecessary, to address regional water availability. This strategy isdiscussed below.
• To the extent practicable, the District shall implement water deliveriesto reduce or prevent the MFL criteria from being exceeded. Operationalguidelines necessary for implementation of water supply deliveries toachieve MFLs, in concert with meeting other required water demands,will be identified. However, water deliveries to prevent the MFLcriteria from being exceeded will be given priority consideration overdeliveries for other purposes.
• Before considering reduction in permitted withdrawals in a recoveryand prevention strategy, all practical means to prevent reductions inavailable water supplies for consumptive use shall be explored andimplemented. When determining whether reductions in existing legaluses are required, the following factors shall be considered:
- The extent of MFL shortfall directly caused by existinglegal uses
- The practicality of avoiding the need for reductions inpermitted supplies, including structural and operationalmeasures, by maximizing the beneficial uses of theexisting water source
- The risk of significant harm resulting from the existinglegal use in the interim period before the recovery strategyis fully implemented
201

Chapter 5: Implementation Strategies LEC Regional Water Supply Plan - Planning Document
Water Shortage Implementation
Legal Description
Pursuant to Section 373.246, F.S., water shortage declarations are designed toprevent serious harm from occurring to water resources. Serious harm, the ultimate harmto the water resources that was contemplated under Chapter 373, F.S., can be interpretedas long-term, irreversible, or permanent impacts. The District will develop and adoptwater shortage triggers to avoid causing harm, significant harm, and serious harm to waterresources, in conjunction with the implementation of the District’s Water Shortage Plan(Chapter 40E-21, F.A.C.). Water resource triggers will be identified for the imposition ofwater shortage restrictions, taking into consideration climatic events, continued decline inwater levels, and a need to curtail human demand to correspond to decreasing supplies.These restrictions act to apportion among uses, including the environment, a sharedadversity resulting from a drought event. Adoption of the resource protection criteria aswater shortage trigger indicators also serves the purpose of notifying users of the risks ofwater shortage restrictions and potential for loss associated with these restrictions.
Water Shortage Implementation Policies
When evaluating options for users and the natural system during droughts, theDistrict will consider the extent to which consumptive use withdrawals influence waterlevels in the natural system and the extent to which natural system water levels aredeviating from rain-driven formula targets for the associated level of drought. Adversity toexisting legal users is measured in terms of projected economic losses.
Water supply demands defined by rain-driven formulas, naturally decrease withincreased drought levels, while consumptive use demands increase. For this reason, waterdelivery cutbacks to the natural systems during droughts should not be necessary. Anexception to this could occur if the delivery of rainfall-based supplies causes greaterenvironmental harm elsewhere in the natural system. Under this scenario, the GoverningBoard, after considering all of the specific facts, and in consultation with the public, mayorder temporary reductions in natural system deliveries in order to protect morevulnerable portions of the natural system from further harm.
Even though water shortage triggers were established and met in the modelsimulations performed during the LEC regional water supply planning process, actualwater restrictions will be determined on a case-by-case analysis for a given drought event.Thus, prior to declaring a water shortage, the District will also analyze the factors listed inthe Water Shortage Plan concerning such issues as 1) whether or not sufficient water willbe available to meet the estimated and anticipated user demands, and 2) whether seriousharm will occur to the water resource. Another exception could occur if severe fires areburning in the Everglades Protection Area, especially in peat wetlands, and delivery ofadditional water may be needed to help stop the fires.
202
LEC Regional Water Supply Plan - Planning Document Chapter 5: Implementation Strategies
Contingency Planning
The timing of physical, regulatory, or operational modifications required toimplement the regional water supply plan will be coordinated, to the extent practicable, toavoid reductions in water supplies for environmental restoration and consumptive usedemands. If, however, practicable measures are not available, the District will provide acontingency plan that is designed to optimize the use of available water supplies, until thelong-term source augmentation is implemented.
The regional water supply plans will be updated at least every five years toincorporate contingency methods, as required by law. If significant changes in planningassumptions occur during the five-year intervals and require the plan to be revisited,updates may occur, as appropriate, more often. This determination will be, in part, basedon annual status updates to the Florida Department of Environmental Protection (FDEP)and the Florida Legislature and CERP annual status updates.
If the determination is made that contingencies need to be implemented, theprocess to accommodate these changes will include meetings of the LEC Regional WaterSupply Advisory Committee and redirection of staff and resources through the five-yearwater resource development work plans and the annual budget process.
The District will establish a process for identifying opportunities to provide watersupply benefits to natural systems on an annual or seasonal basis when surplus watersupplies exist, after considering the permitted demands of consumptive uses.Opportunities to deliver such water supplies through operational flexibility will beexamined and implemented, after consideration by the District’s Governing Board, asappropriate. The operational flexibility recommendations are discussed further inChapter 6 on pages 307 through 312.
Public Involvement in the CERP Implementation Process
The Restudy was developed through an inclusive and open process that engagedmany stakeholders. All applicable federal, tribal, state, and local agencies were fullpartners and their views were fully considered. The implementation process for the CERPwill continue this effort and facilitate project modifications that are needed to takeadvantage of what is learned from system responses and as future restoration targetsbecome more refined.
For construction features, work will be conducted in planning, engineering anddesign, real estate acquisition, and construction. Where appropriate, pilot projects will beconducted to resolve uncertainties before additional planning efforts are undertaken.Operations, maintenance, repair, replacement, and rehabilitation costs will be assessed todetermine the continuing costs of each feature once it is constructed. Operationalstrategies and criteria, such as rain-driven water delivery schedules, will be implementedto achieve maximum benefits from the features in place at any given time. In addition, acomprehensive monitoring and adaptive assessment program (REstoration, COordination
203

Chapter 5: Implementation Strategies LEC Regional Water Supply Plan - Planning Document
and VERification [RECOVER]) will be undertaken to assess systemwide conditions andresponses and to provide guidance in the design and operation of components.1
The RECOVER team will be particularly important to the LEC Regional WaterSupply Plan Advisory Committee, since they will be tracking both systemwideperformance and regional water contributions that will be realized from specific projects.The committee will request that the RECOVER team consult with them regardingcontingency provisions that may alter assumptions used in the LEC Plan, as well as seektheir input regarding other CERP directions and efforts.
Project Implementation Reports (PIRs) will be developed for each CERPcomponent. These will include evaluations to ensure the maintenance or improvement offlood protection and evaluations of the potential for recreational development. BecausePIRs will require the approval of the District’s Governing Board, the LEC Regional WaterSupply Plan Advisory Committee can provide comments regarding the PIRs. Public inputto the PIR process will help in the determination of the locations, capabilities, and generaldesign features of the components. In addition, public input to the PIR process will besought and provided through the required completion of the National EnvironmentalPolicy Act documentation.
In addition, the LEC Regional Water Supply Plan Advisory Committee canprovide recommendations to the District regarding feasibility studies. Two feasibilitystudies (the Water Preserve Areas Feasibility Study and the Indian River LagoonFeasibility Study) are currently being completed. Also, the Comprehensive IntegratedWater Quality Plan and three new feasibility studies (the Florida Bay Feasibility Study, theFlorida Keys Feasibility Study, the Southwest Florida Study) are being undertaken.Extensive outreach and public involvement, which have been essential parts of theRestudy and the CERP, will continue during the completion of these feasibility studies.
STATUTORY DEFINITION OF WATER RESOURCE DEVELOPMENT AND WATER SUPPLY DEVELOPMENT
The projects and actions proposed for implementation consist of projects from twocategories: water resource development projects and water supply development options.This is in concert with amendments to Chapter 373, F.S., that were passed in 1997, whichrequire that water supply plans include a water resource development component and a listor menu of water source options for water supply development that can be chosen by localwater users. The statute defines water resource development and water supplydevelopment as follows:
‘Water resource development’ means the formulation and implementation ofregional water resource management strategies, including the collection andevaluation of surface water and ground water data; structural and nonstructural
1. A more detailed discussion of the CERP implementation process is provided in Chapter 10 of theRestudy (USACE and SFWMD, 1999).
204

LEC Regional Water Supply Plan - Planning Document Chapter 5: Implementation Strategies
programs to protect and manage water resources; the development of regionalwater resource implementation programs; the construction, operation, andmaintenance of major public works facilities to provide for flood control, surfaceand underground water storage, and ground water recharge augmentation; andrelated technical assistance to local governments and to government-owned andprivately owned water utilities.
‘Water supply development’ means the planning, design, construction, operation,and maintenance of public or private facilities for water collection, production,treatment, transmission, or distribution for sale, resale, or end use.
Structural and nonstructural water resource development components areidentified below. These include actions necessary to implement the LEC Plan, such asMFL recovery and prevention strategies, water reservations, water shortage provisions,operational strategies, and contingency planning.
Chapter 373, F.S., requires that water supply plans include a list or menu of watersource options for water supply development that can be chosen by local water users. Foreach source option listed, the estimated amount of water available for use, cost, potentialsources of funding, and a list of projects that meet applicable funding criteria are required.In addition, water supply plans must also include a list of water resource developmentprojects that support water supply development. For each water resource developmentproject, estimates of the amount of water produced, timetables, funding requirements, andparticipants who will implement the project must also be provided.
The District is primarily responsible for the implementation of the water resourcedevelopment components. Local users have primary responsibility for water supplydevelopment by choosing the water source options that will best meet their needs.
In addition to the legislative definitions described above, the designation of acomponent as a water resource development project was based on it having the followingcharacteristics:
• Has the opportunity to address more than one resource issue
• Addresses a variety of use classes (e.g., environment, publicwater supply)
• Protects/enhances resources available for allocation
• Moves water from water surplus areas to water deficit areas
• Has a broad application of technology
The equivalent characteristics that led to designations of projects as water supplydevelopment options are as follows:
• Requires localized implementation of technology
• Delivers resources to consumers
• Has regionalized interconnects to consumer
205
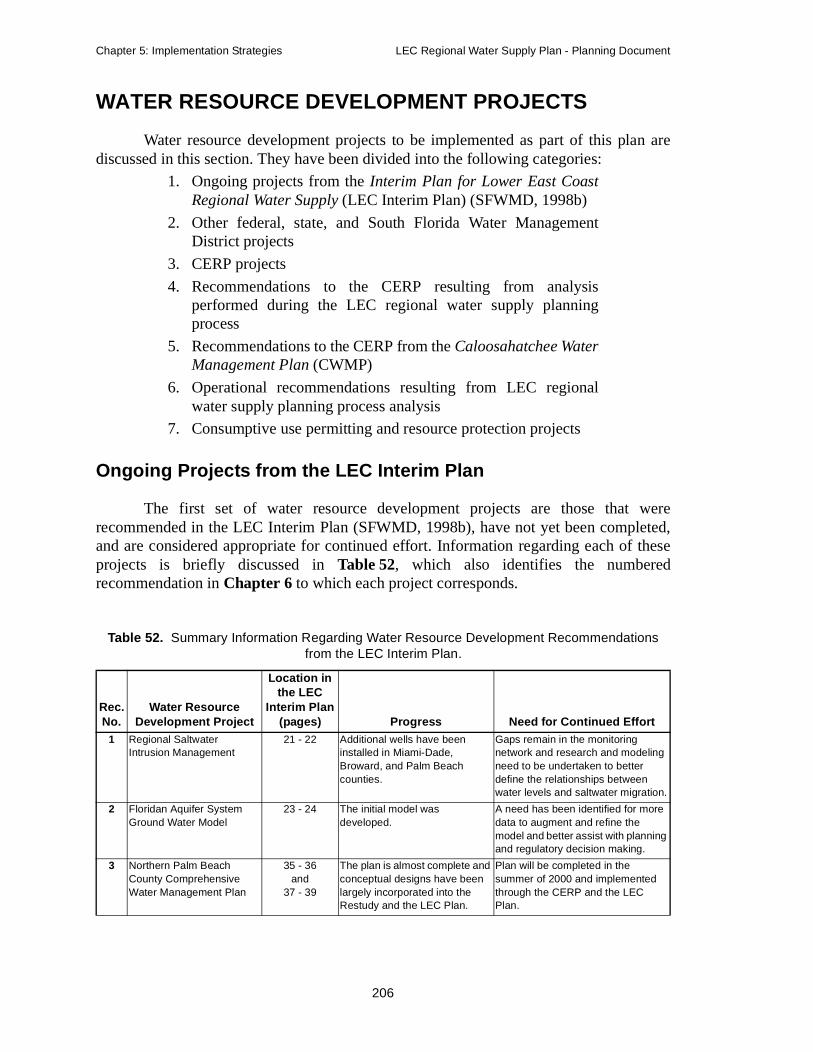
Chapter 5: Implementation Strategies LEC Regional Water Supply Plan - Planning Document
WATER RESOURCE DEVELOPMENT PROJECTS
Water resource development projects to be implemented as part of this plan arediscussed in this section. They have been divided into the following categories:
1. Ongoing projects from the Interim Plan for Lower East CoastRegional Water Supply (LEC Interim Plan) (SFWMD, 1998b)
2. Other federal, state, and South Florida Water ManagementDistrict projects
3. CERP projects
4. Recommendations to the CERP resulting from analysisperformed during the LEC regional water supply planningprocess
5. Recommendations to the CERP from the Caloosahatchee WaterManagement Plan (CWMP)
6. Operational recommendations resulting from LEC regionalwater supply planning process analysis
7. Consumptive use permitting and resource protection projects
Ongoing Projects from the LEC Interim Plan
The first set of water resource development projects are those that wererecommended in the LEC Interim Plan (SFWMD, 1998b), have not yet been completed,and are considered appropriate for continued effort. Information regarding each of theseprojects is briefly discussed in Table 52, which also identifies the numberedrecommendation in Chapter 6 to which each project corresponds.
Table 52. Summary Information Regarding Water Resource Development Recommendations from the LEC Interim Plan.
Rec. No.
Water Resource Development Project
Location in the LEC
Interim Plan(pages) Progress Need for Continued Effort
1 Regional Saltwater Intrusion Management
21 - 22 Additional wells have been installed in Miami-Dade, Broward, and Palm Beach counties.
Gaps remain in the monitoring network and research and modeling need to be undertaken to better define the relationships between water levels and saltwater migration.
2 Floridan Aquifer System Ground Water Model
23 - 24 The initial model was developed.
A need has been identified for more data to augment and refine the model and better assist with planning and regulatory decision making.
3 Northern Palm Beach County Comprehensive Water Management Plan
35 - 36and
37 - 39
The plan is almost complete and conceptual designs have been largely incorporated into the Restudy and the LEC Plan.
Plan will be completed in the summer of 2000 and implemented through the CERP and the LEC Plan.
206

LEC Regional Water Supply Plan - Planning Document Chapter 5: Implementation Strategies
4 Eastern Hillsboro Regional ASR Pilot Project
47 - 49 Biscayne aquifer wells to support the first ASR well are under construction.
The initial Floridan ASR well needs to be completed, its performance evaluated, and a decision made regarding completion of a second ASR well.
5 Hillsboro (Site 1) Impoundment Pilot Project
45-46 The proposed Hillsboro reservoir has been incorporated into the CERP.
The pilot project will proceed in advance of the CERP project. A small-scale reservoir will be constructed and seepage rates and collection systems evaluated.
6 Lake Worth Lagoon Minimum/Maximum Flow Targets
109 - 111 A preliminary hydrodynamic model has been completed.
Additional tidal amplitude and salinity data for dry and wet periods need to be collected. The effort will cover a larger area and be completed for shorter time steps than the original effort. The model needs to be updated and extended using these data. Evaluations need to be conducted to determine the impacts of inflows on biological (sea grass) communities.
7 Northern Broward County Secondary Canals Recharge Network
63 - 64 Three projects (two pump stations and one canal connector) have been funded.
The remainder of the network needs to be designed and constructed.
8 Southeast Broward County Interconnected Water Supply System
65 - 66 Facilitated sessions to achieve agreement on an integrated water supply system for southeastern Broward County are under way.
A final agreement acceptable to all parties needs to be developed and implemented.
9 Broward County Urban Environmental Enhancement
59 - 61 The recommendation to evaluate sources and methods to use surface water to benefit wetlands in coastal Broward County was developed through the Broward County Integrated Water Resource Plan.
This project proposes to implement the recommendation by first identifying wetland systems with needs and then evaluating the advisability of structural and regulatory programs to support the proposed environmental enhancements.
10 Miami-Dade Water and Sewer Department Utility ASR
79 - 80 Some of the ASR wells have been built and are undergoing testing.
Remaining proposed wells need to be constructed.
11 Biscayne Bay Minimum and Maximum Flow Targets
113 - 114 USACE, as part of the Biscayne Bay Feasibility Study, has been developed and is validating a hydrodynamic model. The model is a key tool in determining these targets. The USGS completed a regional ground water model. Ecological response evaluation tools may need to be developed.
To complete this work, additional hydrologic data needs to be collected, performance measures determined, and scenarios simulated and evaluated in terms of ecological responses. Work needs to be completed in close cooperation with CERP RECOVER efforts.
Table 52. Summary Information Regarding Water Resource Development Recommendations from the LEC Interim Plan.
Rec. No.
Water Resource Development Project
Location in the LEC
Interim Plan(pages) Progress Need for Continued Effort
207
Chapter 5: Implementation Strategies LEC Regional Water Supply Plan - Planning Document
Other Federal, State, and District Projects
Two groups of projects have been included in this category. The first are thosecritical projects in the LEC Planning Area for which the SFWMD is local sponsor. Thecritical project program was authorized by congress under the Water ResourcesDevelopment Act of 1996 to expeditiously implement restoration projects that are deemedcritical to the restoration of the South Florida ecosystem. The federal participation incritical projects is for 50 percent of total project costs, with a maximum federalcontribution on any project of $25,000,000. The three critical projects (Recommendation12) included are the West Canal Structure (C-4), the Western C-11 Water TreatmentProject, and the Lake Okeechobee Water Retention/Phosphorus Removal Project. Thesecond group are three District-initiated projects (Recommendations 13 through 15) thateffect recommendations developed in the CWMP and Recommendation 16 regardingMobile Irrigation Labs (MILs).
Critical Projects (Recommendation 12)
West Canal Structure (C-4)
This project is being implemented as a critical project and is part of the withoutplan condition (2020 Base Case) used in the modeling performed for the LEC regionalwater supply planning process. It consists of a new structure in the C-4 Canal,immediately southeast of the Pennsuco Wetlands. It will keep higher surface and groundwater levels to the west, which will reduce drainage from the Pennsuco Wetlands and theEverglades and help reestablish natural hydroperiods in these areas.
Western C-11 Water Treatment
This project is also being implemented as a critical project and is also part of thewithout plan condition (2020 Base Case) used in the modeling performed for the LECregional water supply planning process. The purpose is to improve the quality and timingof discharges to the Everglades from the Western C-11 Basin. A gated control structure onthe C-11 Canal will be used to keep seepage water from mixing with lower quality runoffwater from the basin. An additional pump station will be constructed to return seepagewater to the Everglades Protection Area.
Lake Okeechobee Water Retention/Phosphorus Removal
This critical project will restore the hydrology of wetlands in four key basins northof Lake Okeechobee using two approaches. First, it will plug drainage ditches that connectwetlands with canals and drain land to create improved pasture. This will help retain waterin the wetlands and improve water quality treatment functions of the wetlands. Second, itwill divert canal flows into adjacent wetlands, which will also attenuate flows and retainphosphorus.
208

LEC Regional Water Supply Plan - Planning Document Chapter 5: Implementation Strategies
Well Abandonment Program (Recommendation from the CWMP) (Recommendation 13)
The CWMP has identified a problem with free-flowing, brackish aquifer wells thatwas not adequately addressed by the Well Abandonment Program that was administeredby the District and ended in 1991. In the CWMP, it is recommended that additional effortsshould be made to locate and properly abandon the free-flowing wells in theCaloosahatchee Basin. It is further recommended that the District should work with localand state officials to locate uncontrolled abandoned wells and identify strategies andapplicable funding sources for proper plugging of these wells.
Saltwater Influence at S-79 (Recommendation from the CWMP) (Recommendation 14)
The need for this project was identified in the CWMP. Historically, the upstreammigration of saline water (in excess of 250 milligrams per liter) has been a recurringproblem during extended periods of low flow in the Caloosahatchee River. Saline waterreaches the potable water intakes in the Caloosahatchee River, which are locatedapproximately one mile upstream of the S-79 structure. While, freshwater releases fromLake Okeechobee for environmental purposes may minimize occurrences of this problemin the future, a number of alternatives warrant further investigation. They include movingthe intakes farther upstream, modifications to the structure, limiting lockages during lowflow periods, and improved maintenance and operation of the bubble curtain. Theproposed project would conduct additional analyses of the saline water problem andpotential solutions.
Permitting Issues Associated with ASR Systems and Reuse of Reclaimed Water (Recommendation 15)
Both the CERP and the LEC Plan recognize that the District will need to continueworking with the legislature, FDEP, and the U.S. Environmental Protection Agency(USEPA) to develop and update rules and permitting procedures that will facilitatedevelopment of Aquifer Storage and Recovery (ASR) systems and application ofreclaimed water while providing appropriate protection for potential users. This projectprovides for staff participation to handle LEC Plan implementation issues that arise as partof this larger process.
Mobile Irrigation Labs (Recommendation 17)
This recommendation continues support for Mobile Irrigation Labs as an effectiveconservation support program. However, recent decisions by the Governing Board relatedto CERP funding have indicated that this is not a core program for funding by the District.As a result, District participation in funding will be limited to providing staff to garnersupport from other agencies such as FDEP, Florida Department of Agriculture andConsumer Services (FDACS), and soil and water conservation districts, as well ascustomers.
209
Chapter 5: Implementation Strategies LEC Regional Water Supply Plan - Planning Document
Comprehensive Everglades Restoration Plan Projects (Recommendation 17)
The Central and Southern Florida Project for Flood Control and Other Purposes(C&SF Project) provides water supply and flood protection for the District. The region’shydrology is now largely governed by a man-made system superimposed on the naturalone. Although it has provided for urban and agricultural uses since its inception in 1948,the C&SF Project and the greater-than-expected growth and development that haveensued have unintentionally resulted in extensive damage to the South Floridaenvironment. Over half of the original Everglades have been destroyed and the damagecontinues. Water is sent to tide through events such as the very wet spring of 1998,involving over 1.4 million acre-feet (ac-ft) of emergency Lake Okeechobee flood controlreleases to the Caloosahatchee and St. Lucie estuaries. These releases caused majorenvironmental, economic, and human impacts in those estuaries and later resulted in asubsequent need for the lost water as the region headed into drought conditions. Without achange to the current design and operation of the C&SF Project, forecasts project thecontinued loss of uplands; degradation of wetlands, estuaries, and aquatic life; increasedwater shortages for agricultural and urban uses; increased flooding; and the loss or forcedmovement of wellfields.
The keys to Everglades restoration as determined in the C&SF ProjectComprehensive Review Study (Restudy) (USACE and SFWMD, 1999), are to increasethe amount of water available, ensure adequate water quality, and reconnect the parts ofthe system. A key aim is to annually regain, for beneficial use, about two million ac-ft ofexcess water that is currently being discharged to tide for flood control.
The recommendations made within the Restudy (i.e. structural and operationalmodifications to the C&SF Project) are being further refined and will be implemented inthe CERP. The CERP will be implemented by a joint federal/state/District process. TheCERP includes components that will change the functioning of the C&SF Project to meetecosystem restoration and improvement goals and provide regional system features,including water resource development capabilities, needed to meet urban and agriculturalwater demands through 2050. Many of these water resource development projects hadbeen previously evaluated for the LEC Interim Plan and were further evaluated for theRestudy. Major features of the CERP include the following:
Surface Water Storage Reservoirs. A number of water storage facilities areplanned north of Lake Okeechobee, in the Caloosahatchee and St. Lucie basins, in theEverglades Agricultural Area (EAA), and in the Water Preserve Areas of Palm Beach,Broward, and Miami-Dade counties. These areas will encompass approximately 181,300acres and will have the capacity to store 1.5 million ac-ft of water.
Water Preserve Areas. Multipurpose water management areas are planned inPalm Beach, Broward, and Miami-Dade counties between the urban areas and the easternEverglades. The Water Preserve Areas will have the ability to treat urban runoff, storewater, reduce seepage, and improve existing wetland areas.
210

LEC Regional Water Supply Plan - Planning Document Chapter 5: Implementation Strategies
Manage Lake Okeechobee as an Ecological Resource. LakeOkeechobee is currently managed for many, often conflicting, uses. The lake’s regulationschedule will be modified and plan features constructed to reduce the extreme high andlow levels that damage the lake and its shoreline. Management of intermediate waterlevels will be improved, while allowing the lake to continue to serve as an importantsource for water supply. Several projects to improve water quality conditions in the lakeare included. A study is recommended to evaluate in detail the dredging of nutrient-enriched lake sediments to help achieve water quality restoration targets, important notonly for the lake, but also for downstream receiving bodies.
Improve Water Deliveries to Estuaries. Excess storm water that isdischarged to the ocean and the gulf through the Caloosahatchee and St. Lucie rivers isvery damaging to their respective estuaries. Excess runoff will be stored in surface andunderground water storage areas to reduce these discharges. During times of low rainfall,the stored water can be used to augment flow to the estuaries. Damaging high flows willalso be reduced to the Lake Worth Lagoon.
Aquifer Storage and Recovery. Wells and associated infrastructure will bebuilt to store water in the upper Floridan aquifer. As much as 1.6 billion gallons a day maybe pumped down the wells into underground storage zones. The injected fresh water,which does not mix with the saline aquifer water, is stored in a bubble and can be pumpedout during dry periods. This approach, known as Aquifer Storage and Recovery (ASR),has been used for years on a smaller scale to augment municipal water supplies. Sincewater does not evaporate when stored underground, and less land is required for storage,ASR has some advantages over surface storage. ASR wells will be constructed aroundLake Okeechobee, in the Water Preserve Areas, and in the Caloosahatchee Basin.
Stormwater Treatment Areas. Approximately 35,600 acres of man-madewetlands, known as Stormwater Treatment Areas (STAs), will be built to treat urban andagricultural runoff water before it is discharged to the natural areas throughout the system.STAs are included in the Restudy for basins draining to Lake Okeechobee, theCaloosahatchee River Basin, the St. Lucie Estuary Basin, the Everglades, and the LowerEast Coast urban areas. These are in addition to the over 44,000 acres of STAs alreadybeing constructed pursuant to the Everglades Forever Act to treat water discharged fromthe EAA.
Improve Water Deliveries to the Everglades. The volume, timing, andquality of water delivered to the South Florida ecosystem will be greatly improved.Compared to current conditions, an average of 26 percent more water will be delivered toNortheast Shark River Slough. This translates into nearly a half million ac-ft of additionalwater reaching the slough, which is especially critical in the dry season. More naturalrefinements will be made to the rain-driven operational plan to enhance the timing ofwater sent to the WCAs, Everglades National Park, and the Holey Land and RotenbergerWildlife Management Areas (WMAs).
Remove Barriers to Sheetflow. More than 240 miles of project canals andinternal levees within the Everglades will be removed to reestablish the natural sheetflow
211

Chapter 5: Implementation Strategies LEC Regional Water Supply Plan - Planning Document
of water through the Everglades. Most of the Miami Canal in WCA-3 will be removed and20 miles of the Tamiami Trail (U.S. 41) will be rebuilt with bridges and culverts, allowingwater to flow more naturally into Everglades National Park, as it once did. In the BigCypress National Preserve, a north-south levee will be removed to restore more naturaloverland water flow.
Store Water in Existing Quarries. Two limestone quarries in northern Miami-Dade County will be converted to water storage reservoirs to supply Florida Bay, theEverglades, Biscayne Bay, and Miami-Dade County residents with water. The 11,000-acrearea, which is referred to as the Lake Belt, will be ringed with seepage barriers to ensurethat stored water does not leak or adjacent ground water does not seep into the area. Asimilar facility will be constructed in northern Palm Beach County.
Reuse Wastewater. Two advanced wastewater treatment plants are planned forMiami-Dade County. These plants will be capable of making more than 220 milliongallons a day (MGD) of the county’s treated wastewater clean enough to discharge intowetlands along Biscayne Bay and for recharging the Biscayne Aquifer. This reuse of waterwill improve water supplies to south Miami-Dade County and reduce seepage fromNortheast Shark River Slough. Given the high cost associated with using reuse to meet theecological goals and objectives for Biscayne Bay, other potential sources of water toprovide freshwater flows to the central and southern bay will be also investigated.
Pilot Projects. A number of technologies proposed in the Restudy haveuncertainties associated with them. Uncertainties exist in either the technology itself, itsapplication, or the scale of implementation. While none of the proposed technologies areuntested, what is not known is whether actual performance will measure up to thatanticipated in the Restudy. The pilot projects, which include reuse of reclaimed water,seepage management, Lake Belt technology, and three ASR projects are recommended toaddress uncertainties prior to full implementation of these components.
Improve Freshwater Flows to Florida Bay. Improved water deliveries toShark River Slough, Taylor Slough, and wetlands to the east of Everglades National Parkwill in turn provide improved deliveries of freshwater flows to Florida Bay. A feasibilitystudy is also recommended to evaluate additional environmental restoration needs inFlorida Bay and the Florida Keys.
Southwest Florida Feasibility Study. Additional water resource problems inSouthwest Florida require studies beyond the scope of the CERP. In this regard, afeasibility study for Southwest Florida is being recommended to investigate the region’shydrologic and ecological restoration needs.
Comprehensive Integrated Water Quality Plan. A comprehensive waterquality plan needs to be developed to ensure that the implementation of the CERP leads toecosystem restoration throughout South Florida. The water quality feasibility study needsto be conducted to develop this plan. The feasibility study would include evaluating waterquality standards and criteria from an ecosystem restoration perspective and developingrecommendations to integrate existing and future water quality restoration targets for
212

LEC Regional Water Supply Plan - Planning Document Chapter 5: Implementation Strategies
South Florida water bodies into future planning, design, and construction activities tofacilitate implementation of the CERP. Further, water quality in the Florida Keys is criticalto ecosystem restoration. The Florida Keys Water Quality Protection Plan includesmeasures for improving wastewater and storm water treatment within the Florida Keys.
A summary of CERP components, areas they benefit, total cost, and timelines forthe projects are presented in Figure 35. Specific details for each component, includingtheir location, can be found in Appendix C.
When looking at alternatives beyond the 2020 Base Case, the LEC Plan includedthe planned implementation of the CERP. In the simulation of the alternatives, the initialalternative incorporated the CERP components and was called the LEC 2020 withRestudy. The other alternatives, LEC-1 and LEC-1 Revised, also included the CERPcomponents. One of the goals of the alternatives’ evaluations was to determine the extentto which the expected CERP projects will provide the water resource development neededto meet the goals of the LEC Plan. The conclusion reached in Chapter 4 was that theCERP projects scheduled to be completed by 2020, along with the assumed level ofwellfield development, provide the needed water resources to achieve the LEC Planplanning goal of providing users with adequate water supplies during a 1-in-10 yeardrought. Thus, implementation of the CERP is the major water resource developmentcomponent proposed by the LEC Plan.
The major focus of evaluations of CERP components within the LEC Plan wastheir aggregate performance in meeting water supply and environmental performancegoals. These results were discussed in Chapter 4. The amount of water provided by eachof the components will be identified. This amount of water can be considered at twolevels, the overall water capacity the component and the amount delivered under specificwater supply conditions. Table 53 presents information on those CERP components forwhich a specific water supply capacity can be attributed. Table 54 presents results fromthe SFWMM simulation with the best performance, the LEC-1 Revised simulation,showing the amounts of water provided by key CERP features on an average annual basisduring the 31-year simulation and during five drought years. Table 55 presents similarinformation from the viewpoint of the demand area, listing the amounts of water deliveredto each demand area from each relevant component.
During the modeling and evaluations performed for the LEC regional water supplyplanning process, further improvements to the CERP performance and cost-effectivenesshave been identified. These recommendations are discussed later in this chapter (see theRecommendations to the CERP from the LEC Plan section) and in Chapter 6.
213

214
Chapter 5: Im
plementation S
trategiesLE
C R
egional Water S
upply Plan - P
lanning Docum
ent
10 12 14 16 18 20 22 24 26 28 30 32 34 36 38
and Timelines for the Projects.
Task Name Rec Benefit Start FinishLake Okeechobee ASR Pilot 17 Feasibility Thu 7/1/99 Wed 6/23/04
Caloosahatchee River ASR Pilot 17,28 Feasibility Wed 11/1/00 Tue 10/25/05
Lakebelt Technology Pilot 17 Feasibility Thu 7/1/99 Wed 12/14/11
Reuse Technology Pilot 17 Feasibility Fri 10/1/99 Thu 9/20/07
Seepage Management Pilot 17 Feasibility Wed 11/1/00 Tue 10/28/03
Hillsboro (Site 1) ASR Pilot 5,17 Feasibility Thu 7/1/99 Fri 11/1/02
Lake Okeechobee ASR 17 Quantity, Timing Thu 6/24/04 Wed 6/17/20
Lake Okee Water Quality Treatment 17 Qnty,Qlty,Tmg,Spat Ext Mon 10/1/01 Fri 9/17/10
North of Lake Okeechobee Storage 17 Quantity, Quality, Timing Mon 10/3/05 Fri 9/18/15
C-43 Basin Storage Reservoir and ASR 17,29 Quantity, Quality, Timing Thu 6/1/00 Thu 3/22/12
Caloosahatchee Backpumping/STA 17 Quantity, Quality, Timing Mon 10/3/05 Fri 9/18/15
L-8 Project 17,21 Quantity, Quality, Timing Mon 9/27/04 Fri 9/16/11
Lake Okee Tributary Sediment Dred 17 Quality Tue 10/2/01 Mon 9/26/05
Taylor Ck/Nubbin Slough Storage/STA 17 Quantity, Quality, Timing Mon 1/31/00 Fri 1/16/09
EAA Storage Reservoirs 17,20 Quantity, Quality, Timing Thu 7/1/99 Fri 12/25/15
C-17 Backpumping and Treatment 17 Quantity, Quality, Timing Mon 11/4/02 Fri 10/24/08
Pal Mar/Corbett Hydropattern Rest 17 Distribution, Spatial Extent Mon 10/1/01 Fri 9/22/06
C-51 and Southern L-8 Reservoir 17 Quantity, Quality, Timing Mon 9/27/04 Fri 9/12/14
Hillsboro (Site 1) Impoundment/ASR 17 Quantity, Quality, Timing Fri 9/28/01 Fri 10/17/14
Acme Basin B Discharge 17 Quantity, Quality, Timing Mon 10/1/01 Fri 9/22/06
C-51 Backpumping and Treatment 17, 18 Quantity, Quality, Timing Mon 11/4/02 Fri 10/24/08
C-51 Regional Ground Water ASR 17, 22 Quantity, Timing Mon 9/27/04 Fri 9/13/13
Lake Worth Lagoon Restoration 17 Quality Tue 10/4/05 Mon 3/28/11
Winsburg Farms Wetlands 17 Quantity, Quality, Timing Mon 1/3/00 Fri 12/23/05
Prot. Wetlands Near WCA-1 (Strazulla) 17 Spatial Extent Fri 9/28/01 Fri 10/26/07
88 90 92 94 96 98 00 02 04 06 08
Figure 35. A Summary of CERP Components, Total Costs, Areas They Benefit

LEC
Regional W
ater Supply P
lan - Planning D
ocument
Chapter 5: Im
plementation S
trategies
215
Task NamePBC Ag Rese
Western C-11
C-9 STA/Impo
Broward Seco
North Lake Be
Central Lakeb
C-4 Control St
Pineland/Hard
Bird Drive Rec
L-31N Levee I
Dade-Broward
C-111 Operati
Reroute Miam
C-111N Sprea
South Miami-D
West Miami-D
WCA-1 Interna
Divert WCA-2
WCA 3A and 3
Additional S-3
Construction o
Decompartme
Flows to NW/C
Divert WCA-3
Divert Flows fr
4 16 18 20 22 24 26 28 30 32 34 36 38
imelines for the Projects.
Rec Benefit Start Finishrve Reservoir/STA 17 Quantity, Quality, Timing Thu 9/1/05 Wed 8/21/13
Diversion 17 Quantity, Quality, Timing Mon 10/1/01 Fri 9/19/08
undment 17 Quantity, Quality, Timing Mon 10/1/01 Fri 9/21/07
ndary Canals 17 Distribution Mon 7/2/01 Fri 6/12/09
lt Storage Area (NLBSA) 17,25 Quantity, Quality, Timing Mon 2/27/12 Fri 6/20/36
elt Storage Area (CLBSA) 17,25 Quantity, Quality, Timing Mon 2/27/12 Fri 12/19/36
ructures 17 Quantity, Distribution Mon 1/31/00 Fri 7/22/05
wood Restoration 17 Spatial Extent Mon 10/2/00 Fri 3/24/06
harge Area 17 Quantity, Quality, Timing Thu 1/1/04 Wed 12/18/13
mprovement 17 Quantity, Distribution Wed 10/30/02 Tue 10/19/10
Levee/Pennsuco 17 Quantity, Distribution Mon 10/1/01 Fri 9/19/08
ons Mod 17 Timing Wed 5/1/02 Thu 4/1/04
i Canal Wat Sup Deliv 17 Distribution Mon 1/28/02 Fri 1/16/09
der Canal 17 Distribution Mon 1/31/00 Fri 7/18/08
ade County Reuse 17 Quantity, Quality, Distrib Mon 7/4/11 Fri 6/19/20
ade County Reuse 17,23 Quantity, Quality, Distrib Mon 7/4/11 Fri 6/19/20
l Structures 17 Distribution Mon 1/31/00 Fri 7/25/03
Flows to CLBSA 17 Distribution Mon 4/1/02 Fri 9/17/10
B Seepage Mgmt 17 Quantity, Distribution Tue 10/2/01 Mon 9/22/08
45 Structures 17 Distribution Mon 1/28/02 Fri 1/16/09
f S-356 Structures 17 Distribution Mon 11/4/02 Fri 10/26/07
ntalize WCA-3 17 Distribution Mon 1/28/02 Fri 1/4/19
entral WCA-3A 17 Distribution Thu 11/2/00 Wed 4/22/09
Flows to CLBSA 17 Distribution Mon 4/1/02 Fri 9/19/08
om CLBSA to WCA-3B 17 Distribution Mon 2/27/12 Fri 2/17/17
88 90 92 94 96 98 00 02 04 06 08 10 12 1
Figure 35. (Continued) Summary of CERP Components, Total Costs, Areas They Benefit and T

216
Chapter 5: Im
plementation S
trategiesLE
C R
egional Water S
upply Plan - P
lanning Docum
ent
10 12 14 16 18 20 22 24 26 28 30 32 34 36 38
fit and Timelines for the Projects.
Task Name Rec Benefit Start FinishG-404 Pump Station Modifications 17 Distribution Wed 10/1/03 Tue 3/24/09
Biscayne Bay Coastal Wetlands 17 Distribution Thu 4/20/00 Wed 2/27/19
Florida Keys Tidal Restoration 17 Distribution Mon 3/6/00 Fri 8/26/05
Big Cypress/L-28 Interceptor 17 Quan, Qual, Timing, Distr Mon 10/2/06 Fri 9/16/16
Miccosukee Water Mgmt Plan 17 Quantity, Quality, Timing Mon 7/3/00 Fri 12/19/08
Seminole Water Conservation Plan 17 Quantity, Quality, Timing Mon 1/1/01 Fri 6/20/08
Melaleuca/Exotic Plant Eradication 17 Exotic Plant Control Mon 10/2/06 Fri 9/23/11
SW Florida Study 17,30 Feasibility Thu 4/1/99 Wed 3/24/04
Comprehensive Water Quality Plan 17 Feasibility Fri 10/1/99 Fri 12/22/06
Florida Bay/Keys Feasibility Study 17 Feasibility Fri 10/29/99 Fri 10/22/04
RECOVER 17,20 Adaptive Assessment Thu 7/1/99 Wed 12/22/38
Dummy row Thu 4/20/00 Thu 4/20/00
88 90 92 94 96 98 00 02 04 06 08
Figure 35. (Continued) Summary of CERP Components, Total Costs, Areas They Bene

LEC Regional Water Supply Plan - Planning Document Chapter 5: Implementation Strategies
Table 53. Minimum and Maximum Water Capacity of Major CERP Components.
Component
Water Capacity
Minimum Maximum
Lake Okeechobee ASR 1K MGD ASR 1K MGD ASR
North of Lake Okeechobee Storage Reservoir 100K ac-ft 200K ac-ft
C-44 Basin Storage Reservoir 20K ac-ft 40K ac-ft
C-43 Basin Storage Reservoir with ASR 80K ac-ft 160K ac-ft reservoir220 MGD ASR
L-8 Project 25 MGD ASR 50 MGD ASR48K ac-ft reservoir
Taylor Creek/Nubbin Slough Storage Reservoir and STA 50K ac-ft reservoir20K ac-ft STA
50K ac-ft reservoir20K ac-ft STA
C-23/C-24/Northfork/Southfork Storage Reservoirs 165K ac-ft 192K ac-ft
EAA Storage Reservoirs 240K ac-ft 360K ac-ft
C-51 and Southern L-8 Reservoir 120K ac-ft 120K ac-ft
Hillsboro (Site 1) Impoundment 10K ac-ft 14.8K ac-ft
Hillsboro (Site 1) ASR 220 MGD ASR 370 MGD ASR
C-51 Regional Ground Water ASR 340 MGD ASR 540 MGD ASR
Palm Beach County Agricultural Reserve Reservoir and ASR 10K ac-ft 19.9K ac-ft reservoir75 MGD ASR
Western C-11 Diversion Impoundment and Canal 6.4K ac-ft 6.4K ac-ft
C-9 STA and Impoundment 10K ac-ft 10K ac-ft
North Lake Belt Storage Area 70K ac-ft 90K ac-ft
Central Lake Belt Storage Area 80K ac-ft 187.2K ac-ft
Bird Drive Recharge Area 11.5K ac-ft 11.5K ac-ft
L-31N Levee Improvements for Seepage Management 100 percent levee;100 percent ground water
100 percent levee; 100 percent wet season ground water
South Miami-Dade County Reuse 131 MGD 131 MGD
West Miami-Dade County Reuse 100 MGD 100 MGD
217

Chapter 5: Implementation Strategies LEC Regional Water Supply Plan - Planning Document
Table 54. Average Annual Amounts of Water Provided by CERP Components.
Component Beneficiary
Average Annual Water Provided (1,000 ac-ft)
LEC-1 Revised During the Simulation
Period
During Drought Yearsa
C-44 Basin Storage Reservoir C-44 Basin water supply 1 1
St. Lucie Estuary 8 0
Lake Okeechobee 10 8
North of Lake Okeechobee Storage Reservoir (recovery)
Entire system (via Lake Okeechobee)49 40
Lake Okeechobee ASR (recovery) Entire system (via Lake Okeechobee) 115 256
EAA Storage Reservoirs, Compartment 1 EAA agricultural water supply 204 168
EAA Storage Reservoirs, Compartment 2A
20 26
EAA Storage Reservoirs, Compartment 2A EAA agricultural water supply 6 2
WCAs and Everglades National Park 122 42
EAA Storage Reservoirs, Compartment 2B WCAs and Everglades National Park 110 8
LEC Service Area (LECSA) 1 and North Palm Beach Service Area Reservoirs
LECSA 1 and North Palm Beach Service Area users
10 13
LECSA 1 and North Palm Beach Service Area ASR
LECSA 1 and North Palm Beach Service Area users
51 76
EAA 37 30
LECSA 2 ASR LECSA 2 users 32 42
North Lake Belt Storage Area LECSA 3 water supply 25 27
Biscayne Bay 109 70
Central Lake Belt Storage Area WCAs and Everglades National Park 59 75
Biscayne Bay 27 8
Bird Drive Recharge Area LECSA 3 water supply 15 19
South Miami-Dade County Reuse Biscayne Bay 147 147
West Miami-Dade County Reuse Bird Drive Recharge Area 56 56
Construction of S-356 Structures and Relocation of a Portion of L-31N Borrow Canal
Biscayne Bay8 6
a. 1971, 1975, 1981, 1986, 1989
218

LEC Regional Water Supply Plan - Planning Document Chapter 5: Implementation Strategies
Table 55. Average Annual Basin-by-Basin Demands for the 31-Year Simulation Period and for Drought Years and How They Are Met.
Demand Basin/Water Body Total Demand/Sources of Supply
Average Annual Water Provided(1,000 ac-ft)
LEC-1 Revised During the Simulation Period
During Drought Yearsa
Caloosahatchee Basin(surface water demand)
Lake Okeechobee 29 57
Local reservoir
Addressed by the CWMPCaloosahatchee Basin ASR
Local sources and rainfall
Demand not met
St. Lucie Basin(surface water demand)
Lake Okeechobee 25 48
St. Lucie Reservoir 1 1
Demand not met 1 5
EAA Lake Okeechobee 85 205
EAA Storage Reservoirs 209 170
LECSA 1 Regional ASR 37 30
Local sources and rainfall 905 832
Demand not met 8 40
LECSA 1(to maintain coastal canals)
Lake Okeechobee 3 11
WCAs 32 75
LECSA 1 Reservoirs 10 13
LECSA 1 Regional ASR 51 76
LECSA 2(to maintain canals)
Lake Okeechobee 9 27
WCAs 8 15
LECSA 1 Regional ASR 32 42
LECSA 3(to maintain canals)
Lake Okeechobee 77 212
WCAs 24 29
LECSA 3 Reservoirs 40 46
Caloosahatchee Estuary
Caloosahatchee Basin ReservoirAddressed by the CWMP
Local basin runoff
Lake Okeechobee (environmental) 16 31
Lake Okeechobee (regulatory) 28 0
St. Lucie Estuary C-44 Basin Storage Reservoir 8 0
Local basin runoffb 587 313
Lake Okeechobee (environmental) 14 1
Lake Okeechobee (regulatory) 12 0
WCAs and Everglades National Park Rain-Driven Demands
Lake Okeechobeec 193 222
EAA Storage Reservoirs 232 50
EAA drainage to the southd 662 536
Regulatory from Lake Okeechobee 96 0
Everglades National Park
NW Shark River Slough 451 183
NE Shark River Slough 685 306
Biscayne Bay Snake Creek (S29) 114 81
Northern bay (G58, S28, and S27) 145 111
Miami River (S26, S25B, and S25) 60 33
Central bay (G97, S22, and S123) 203 135
Southern bay (S21, S21A, S20, S20G, and S197) 268 210
a. 1971, 1975, 1981, 1986, and 1989b. Includes all contributing basins to the St. Lucie Estuary (C-23, C-24, North Fork, South Fork, and C-44)c. Environmental releases from Lake Okeechobee to meet rain-driven demandsd. Includes flows from Holey Land and Rotenberger WMAs
219
Chapter 5: Implementation Strategies LEC Regional Water Supply Plan - Planning Document
Recommendations to the CERP from the LEC Plan
As a result of the evaluations conducted in the development of both the LEC Planand the CWMP, valuable insights have been developed regarding the potential design andoperation of CERP projects. These insights should be incorporated into CERP planningand implementation efforts. The consideration of these insights is treated as a formalrecommendation of the LEC Plan to the CERP.
The individual recommendations are further described and discussed in Chapter6. They include the following:
• Additional analyses related to the implications of the plannedlocation of S-155A on other CERP components need to beperformed (Recommendation 18).
• The importance of identifying additional improvements forWCA-2B in CERP planning and RECOVER efforts wasreiterated. WCA-2B was the only area of the northern Evergladesthat received an unacceptable score in LEC regional water supplyplanning and Restudy efforts to date (Recommendation 19).
• Changes are needed in the compartments proposed for the EAAreservoir to increase storage available to meet EAA demands andto increase utilization of the reservoir to meet demands in theWest Palm Beach Canal Area of the EAA (Recommendation20).
• The utilization of ASR water in the C-51 Canal, West PalmBeach Catchment Area, and Hillsboro systems needs to beincreased above the uses achieved in Restudy evaluations. Use ofthe C-51 Canal and West Palm Beach Catchment Area water tomeet demands in the EAA is suggested. Use of Hillsboro ASRwater to meet demands in LECSA 2 is recommended(Recommendations 21 and 22).
• Consideration of different capacities and uses of the West Miami-Dade Reuse system is recommended (Recommendation 23).
• Modifications of Lake Okeechobee Regulation schedules arerecommended to achieve the best performance, given thestructural improvements that may be in place at various timesduring the plan implementation (Recommendation 24).
• Implementation of the Lakebelt Storage Areas should begin assoon as possible (Recommendation 25).
• Early implementation of rain-driven schedules for the WCAs andEverglades National Park is recommended (Recommendation26).
• Future CERP planning efforts need to consider wellfieldconfigurations and performance evaluated in the LEC Plan, as
220

LEC Regional Water Supply Plan - Planning Document Chapter 5: Implementation Strategies
well as subsequent consumptive use permitting actions(Recommendation 27).
Recommendations to the CERP from the CWMP
The following recommendations from the CWMP are included here because theywill provide insight into the implementation of the CERP:
• Confirmation of the advisability of completing theCaloosahatchee ASR Pilot Project (Recommendation 28)
• The C-43 Storage Project (Recommendation 29)
• The Southwest Florida Study (Recommendation 30).
Operational Recommendations
Operational improvements and reevaluations are included in the CERP which callfor the development of rain-driven environmental delivery formulas and the revision ofoperating procedures and protocols to reflect the completion of new facilities. The LECPlan has identified three additional areas for improvements to operations that are neededfor the next five to 10 years until the CERP features begin to come on-line.
Systemwide Operational Protocols (Recommendation 31)
The incremental simulations completed as part of the LEC Plan indicated that thefrequency and severity of low lake levels under the 1965 to 1995 climatic conditionswould cause water supply problems for users dependent on Lake Okeechobee through2010. In this period, it is especially important that supply-side management policies beimplemented in a flexible way to assure that the water in storage for each dry season ismanaged in the best way.
Lake Okeechobee supply-side management policy needs to be reevaluated toincorporate operational flexibility to improve water supply performance while taking intoaccount environmental goals and conditions. One example would be the fact that over thelast six years, extreme wet periods have kept the lake abnormally high for long periods oftime. Under such conditions, a drawdown of the lake would provide ecological benefits.
Periodic Operational Flexibility (Recommendation 32)
Operational priorities and protocols should be reevaluated on an annual basis and aspecific strategy presented for Governing Board approval.
Lake Okeechobee Vegetation Management Plan (Recommendation 33)
A Lake Okeechobee Vegetation Management Plan needs to be developed so thatdetrimental environmental effects from lower lake levels, primarily the spread of torpedo
221
Chapter 5: Implementation Strategies LEC Regional Water Supply Plan - Planning Document
grass and melaleuca, can be effectively managed. The program would then beimplemented whenever lower lake levels dry the littoral zone.
Consumptive Use Permitting and Resource Protection Projects
In this section, descriptions of the general implementation legal and policyguidances are provided for implementing reservations, MFL recovery and preventionstrategies, consumptive use permitting, water shortage program, and operationalstrategies.
As one of the tools for plan implementation, rulemaking to implement theregulatory recommendations of the LEC Plan will constitute a significant effort during thenext several years. Rulemaking will include water reservations and numerousConsumptive Use Permitting (CUP) criteria, which are interrelated and cumulativelydefine the availability of water for consumptive uses and water resource protection. As aresult, it is recommended in the LEC Plan that certain rulemaking efforts be grouped inphases to allow for the cumulative analysis of the water resource and consumptive useimplications of the regulatory program.
Another goal of the rulemaking schedule is to adopt rules as the technicalinformation becomes available. As a result, it is recommended in this plan that initialrulemaking proceed for concepts that were sufficiently identified and evaluated in theplanning process. These include establishment of MFLs for the Everglades, LakeOkeechobee, the Biscayne Aquifer, and the Caloosahatchee River.
In addition, uncertainties in the rulemaking process, such as delays fordevelopment of supporting technical data or rule challenges, may conflict with theproposed schedule for rule development provided in this plan. The proposed schedule willbe adapted to account for such delays, while considering the need to develop associatedrules through a coordinated rulemaking process. The contingency process identified in theplan, along with input from the LEC Regional Water Supply Plan Advisory Committee,other members of the public, and the Governing Board may be used to identify necessarychanges to the rulemaking schedule.
Water Reservations (Recommendation 34)
Table 51 identifies the water bodies where reservations will be adopted, the basisupon which the reservations of water will be derived, and the targeted operation dates forwater resource development projects that can provide the reservation water supplies. Thebasis upon which the reservations will be derived are rain-driven formulas, stageformulae, salinity envelope criteria, or Stormwater Treatment Area (STA) minimum depthof water.
These factors will be further refined through the reservation rulemaking andimplementation process, including detailed design and feasibility analyses of associatedwater resource development projects. In addition to rule adoption of the reservations to set
222

LEC Regional Water Supply Plan - Planning Document Chapter 5: Implementation Strategies
aside water quantities from allocation, operational protocols will be developed to providefor phased increases in water quantities through 2020. Establishment of reservations arerecommended for the following areas:
Caloosahatchee and St. Lucie Estuaries. Reservations for these waterbodies will be established for the purpose of providing freshwater inflows to preventharm. Optimal salinity profiles and corresponding quantities of freshwater inflows,particularly during the dry season, have been identified in technical publications andintegrated into the LEC regional model targets. Water reservations will identify waterquantities for meeting these targets, and will be applied when associated water resourcedevelopment projects are constructed. Until the water resource development projects thatwill make water available for meeting these reservations are operational, the District willutilize an annual process to identify operational actions to optimize water deliveries basedon the projected annual conditions to meet these targets. Final rule adoption is projectedfor the Caloosahatchee Estuary by 2000 and for the St. Lucie Estuary by 2001.
Stormwater Treatment Areas. Reservations for STAs will be adopted for thepurpose of protecting fish and wildlife by maintaining water quality functions of the filtermarsh and reducing the potential for nutrient releases associated with dry times. Thereservation will include water quantities estimated to maintain at least 0.5 feet of water inthe STAs to prevent dry out. Conditions on providing this water during droughts will alsobe identified, including conditions for making water deliveries from Lake Okeechobeewith consideration given to other water supply needs of the regional system, consistentwith operations in the Everglades Construction Project Conceptual Design Document.Final rule adoption is projected for 2001.
Everglades National Park, the WCAs, and the Holey Land andRotenberger WMAs. Reservations will be adopted for the purposes of protecting fishand wildlife through restoration of hydropatterns as defined by the CERP for 2020. Modelresults in the LEC Plan indicate the water quantities that should be delivered to these areasbased on the incremental increased water availability during the next 20 years throughwater resource development. The reservation rule will account for these interimincremental increases through time during the next 20 years. Estimates on water quantitiesto be made available under the reservation, water resource development projects, andoperational protocol for providing these water quantities will be identified in the rule.Final rule adoption is projected for 2003.
Subregional Wetland Restorations. Reservations will be adopted, whereappropriate, for the purpose of protecting fish and wildlife in urban wetland systems slatedfor enhancement (Loxahatchee Slough, Pond Apple Slough, Fern Forest, Trade WindsPark, Model Lands, Pennsuco Wetlands, South Dade Wetlands, etc.). The District willwork with Palm Beach, Broward, and Miami-Dade counties to quantify the reservationsand identify the sources of water, when appropriate. Final rule adoption is projected for2003.
Biscayne Bay, Florida Bay, and the Loxahatchee River. Reservationswill be adopted for the purpose of protecting fish and wildlife through providing
223

Chapter 5: Implementation Strategies LEC Regional Water Supply Plan - Planning Document
freshwater inflows that prevent harm. The Loxahatchee River Reservation Rule will beadopted by December 2001. Research on the freshwater inflows to Florida Bay isscheduled to be completed by December 2002. Final rule adoption is projected for FloridaBay by 2003 and for Biscayne Bay by 2004.
Lake Okeechobee. Lake Okeechobee provides water storage for multiplepurposes including consumptive uses of water and a number of water resource protectionpurposes. It will store and provide water for several reservations including the Everglades,the STAs, the Biscayne aquifer, and the St. Lucie and Caloosahatchee estuaries. However,the lake has its own demand for water supplies to protect fish and wildlife. Therefore, themanagement of the lake must address its function as a natural system, as well as a watersupply source. At the time of completion of this plan, a reservation proposed for the lakehad not yet been quantified. It is recommended that the protection of the lake’s fish andwildlife be considered and the lake reservation developed in concert with the reservationsfor the water bodies that rely on the lake.
Following required research to support adoption of reservations for these areas, theDistrict will proceed with identification of operational, regulatory, and water resourcedevelopment projects necessary to implement the reservations. This will also includeintegration of the reservations and implementation actions into regional water supply planupdates, five-year water resource development plans, and annual budgets.
Establish MFLs (Recommendation 35)
Eight water bodies located within the LEC planning area have been identified aspriority water bodies within the DWMP for the establishment of MFLs. The establishmentof MFLs for four of these water bodies (Lake Okeechobee, the Everglades and the WCAs,Biscayne aquifer, and the Caloosahatchee River) is scheduled for completion in 2000. Fordetailed descriptions of the basis for Lake Okeechobee, the Everglades, and BiscayneAquifer MFLs refer to Minimum Flows and Levels for Lake Okeechobee, the Everglades,and the Biscayne Aquifer (SFWMD, 2000e). The documentation of the CaloosahatcheeRiver MFLs is not yet complete. The recommended MFL criteria for each of these fourwater bodies used in the evaluation phase of the LEC Plan are listed below. Theserecommended MFLs will undergo rulemaking later this year.
Lake Okeechobee
Water levels should not fall below 11 ft NGVD for more than 80 days duration,more often than once every six years, on average (SFWMD, 2000e).
Peat-Forming Wetlands in the Everglades and the WCAs
Water levels within wetlands overlying organic peat soils within the WCAs,Rotenberger and Holey Land WMAs, and Shark River Slough (Everglades National Park)shall not fall below ground surface for more than 30 days and shall not fall below 1.0 footbelow ground for one day or more of that 30-day period, at specific return frequencies fordifferent areas, as identified in Table 44 in Chapter 4.
224
LEC Regional Water Supply Plan - Planning Document Chapter 5: Implementation Strategies
Marl-Forming Wetlands in the Everglades and the WCAs
Water levels within marl-forming wetlands that are located east and west of SharkRiver Slough, the Rocky Glades, and Taylor Slough within Everglades National Park,shall not fall below ground surface for more than 90 days and shall not fall below 1.5 feetbelow ground for one day or more of that 90-day period at specific return frequencies fordifferent areas, as identified in Table 44 in Chapter 4.
Biscayne Aquifer
The term minimum water level for the Biscayne aquifer refers to water levelsassociated with movement of the saltwater interface landward to the extent that groundwater quality at the withdrawal point is insufficient to serve as a water supply source for aperiod of several years before recovering. For evaluation of model simulations,operational criteria are applied to the coastal canals that receive regional water. Table 6 inChapter 4 provides the minimum canal operational levels for eleven primary watermanagement structures. To meet the operational criteria, the canal stage cannot fall belowthe criteria for more than 180 days, and the average annual stage must be sufficient torecover after a drought or discharge event.
Caloosahatchee Estuary
The freshwater inflow associated with preventing harm or significant harm is anaverage of 300 cfs per day at the S-79 structure during the months of November throughMarch. The determination of this inflow is discussed in Chapter 4 on page 92.
Additional MFLs
MFLs will be established for five additional water bodies: the Loxahatchee River,the St. Lucie Estuary, Florida Bay, Biscayne Bay, and the southern Biscayne aquifer in2001, 2001, 2003, 2004, and 2003, respectively. Since the research necessary to define theMFLs and restoration targets for each of these water bodies has not been completed,estimates were used as discussed below for evaluating performance measures for this plan.These estimates will be replaced with the actual MFLs during the next five-year LEC Planupdate. Options for recovery and prevention strategies will be explored and incorporatedinto future plan updates.
MFL Criteria for the Rockland Marl Marsh (Recommendation 36)
The majority of plant and animal communities that exist within the remainingRockland marl marsh, located within and adjacent to Everglades National Park, have beenseverely impacted by overdrainage and development east of the park. Studies of remainingcommunities have provided some limited information concerning the appropriate depthand duration of water levels needed to sustain their characteristic vegetation and wildlifecommunities. Current MFL targets proposed for this area are based on managementtargets developed as part of the Restudy/CERP and LEC regional water supply planningprocesses which are based on output of the Natural System Model (NSM).
225

Chapter 5: Implementation Strategies LEC Regional Water Supply Plan - Planning Document
It is the expert opinion of Everglades National Park staff that the NSM does notproperly simulate hydrologic conditions within the Rockland marl marsh and that theinterim MFL criteria may not sufficiently protect these wetlands from significant harm.Additional research is required to determine an appropriate return frequency for droughtconditions that can be tolerated by both plant and animal populations without causingsignificant harm to their structure and function. Research on short hydroperiod, marl-forming wetland plant and animal communities is needed to determine the following: thedistribution, extent, and structure of these communities within the historic Everglades;their historic and potential future role and significance as sources of food for wading birdsand other vertebrates; and the seasonal dynamics of fish and macroinvertebratepopulations, especially the amount of time that sustained high water levels are required tomaintain ecosystem aquatic productivity.
As part of the LEC water supply planning process, staff from the District,Everglades National Park, and U.S. Geological Survey (USGS) should jointly develop awork plan to conduct the necessary research needed to validate and/or refine the proposedMFL criteria, especially the return frequency component, for the Rockland marl marsh.
MFLs for Florida Bay (Recommendation 37)
Findings of the MFL Scientific Peer Review Panel (Jordan, et al., 1998)recommended that a sufficiency review be conducted to examine existing surface andground water data, especially data that illustrates the relationship between upstream waterlevels and flows and their impact on downstream estuary and bay salinity levels. Based onthis review, the District and other stakeholders should determine appropriate time framesand mechanisms for the establishment of MFL criteria for Florida Bay.
In response to the above recommendation, and to requests made by EvergladesNational Park staff, Florida Bay was placed on the District’s MFL Priority Water BodyList for establishment in 2003. In addition, a formal MFL sufficiency review has beencompleted for Florida Bay and is currently under review by the Interagency Florida BayScience Program and Everglades National Park staff. This sufficiency review presents anassessment of currently available technical information needed to develop MFLguidelines for Florida Bay. Florida Bay MFLs are defined as the minimum inputs offreshwater from the southern Everglades required to prevent significant harm to theFlorida Bay ecosystem. Significant harm is defined as the loss of specific water resourcefunctions that take multiple years to recover, which result from a change in surface wateror ground water hydrology (SFWMD, 2000e).
Establishment of MFLs for Florida Bay is a challenging task because of the size,the spatial complexity of the estuary, and the diffuse nature of freshwater flow to the bay.The task requires an understanding of the physical and ecological characteristics of thebay and their sensitivity to fresh water inputs from the Everglades. By targeting a specificresponse variable (seagrass) that is critical to many other parts of the ecosystem (nutrientcycling, animals, other plants, water quality, etc.), the District expects to develop initialMFL technical criteria for Florida Bay by 2003. Conceptual models of Florida Bay arecurrently being developed by the CERP RECOVER team to identify some of the more
226

LEC Regional Water Supply Plan - Planning Document Chapter 5: Implementation Strategies
complex interactions within the ecosystem and may be used as a starting point to developMFL criteria.
As future research efforts provide additional information on some of these morecomplex ecological processes, subsequent refinement of the initial MFL criteria may benecessary. A number of research efforts are already under way with a second phase to becompleted by 2006. An integrated Interagency Florida Bay Science Program, in which theDistrict participates, has been collecting ecological information on the bay for the pastthree years. The databases and computer models that are products of this ongoing programwill provide a foundation for developing MFL technical criteria.
An ecologically based MFL determination should include the followingconsiderations:
• Salinity is the dominant factor that is affected by changingfreshwater flows and levels.
• Salinity is a naturally varying characteristic of estuaries andMFLs must have criteria that incorporate seasonal andinterannual variability.
• Water quality components other than salinity are also affected bychanges in freshwater flow.
• The effects of salinity are not only direct, such as physiologicalstress on plants and animals, but also indirect, such as changingnutrient cycles, plant community structure, habitat availability,reproduction, and food webs.
• MFL determination depends on both bay and upstream watershedresponses to these changing conditions as these subsystems areinterconnected.
• Defining significant harm to the Florida Bay ecosystem requiresidentification of the main processes that sustain the bayecosystem and determination of the sensitivity of these processesto the establishment of MFL criteria.
A number of key data collection projects are currently underway, representingcollaborations among federal, state, and university scientists. However, most of theinteragency projects were not specifically designed for determination of MFL.Modifications of these projects, plus some additional research, will be needed to addressspecific MFL issues.
MFL Recovery Strategies (Recommendation 38)
Pursuant to the requirements of the MFL statute, analyses of current and futureconditions were conducted for each of the priority water bodies where MFLs weredefined. When the evaluation showed MFLs are not or will not be met in the future,recovery or prevention strategies, as appropriate, were developed. Following are the MFL
227
Chapter 5: Implementation Strategies LEC Regional Water Supply Plan - Planning Document
recovery/prevention strategies for Lake Okeechobee and the Everglades. The evaluationsshowed that MFLs for the Biscayne aquifer are expected to be met and, therefore, arecovery/prevention strategy was not required.
Lake Okeechobee
Analysis of the results of the 1995 and 2020 base cases show MFL criteria weremet. As a result, the MFL criteria would probably not be exceeded even if the LEC Planwere not implemented. Therefore, a recovery plan is not required for Lake Okeechobee.The prevention strategy consists of implementation of the Water Shortage Plan, includingsupply-side management, as simulated in the LEC Plan.
Caloosahatchee River and Estuary
Analyses of both the 1995 and 2020 base cases show the proposed MFL criteriafor the Caloosahatchee Estuary would be exceeded. Therefore, a recovery plan isnecessary. Evaluation of the model results show that while the Caloosahatchee EstuaryMFL criteria was exceeded, sufficient quantities of water remained left in LakeOkeechobee to avoid significant harm to the Caloosahatchee Estuary until the proposedlong-term regional storage facilities that comprise the recovery plan have been built.These regional storage facilities are recommended in LEC Plan and CWMP, includingASR and regional surface water reservoirs.
Long-term evaluations conducted for both the Restudy and the CWMP indicatethat both MFL and minimum restoration flows (300 cfs during the fall and spring) can bemet through a combination of the construction of reservoirs and limited deliveries fromLake Okeechobee and ASR systems located within the basin. Over the next five years,activities for construction of regional facilities include 1) implementation of the ASR pilotproject, 2) development of the Project Implementation Report (PIR) for the C-43 RegionalSurface Water Reservoir, and 3) completion of the Southwest Florida Study. The reservoirand ASR projects are scheduled for completion in 2010 and 2015, respectively (Table 51).
In the period of time prior to construction of these facilities, the District will utilizewater in Lake Okeechobee, when available, for releases to the Caloosahatchee River toprevent MFL violations, which are projected to occur only during extreme droughts. Inimplementing this interim recovery and prevention strategy, releases to prevent significantharm will occur as follows: if a die back of Vallisneria grass beds occurs in the areaidentified in the MFL criteria during one year, for at least one of the following two years,an average of 300 cfs of water will be delivered at the S-79 structure during the months ofFebruary through April.
The Everglades and Water Conservation Areas
Direct and indirect impacts can occur within the Everglades and WCAs that canbe attributed to consumptive use withdrawals. Indirect impacts occur as a result of makingregional water deliveries to areas other than the Everglades. Direct impacts result from thepumping of adjacent wellfields that lower the water table along the eastern edge of the
228
LEC Regional Water Supply Plan - Planning Document Chapter 5: Implementation Strategies
Everglades system, affecting wetlands located directly west of the north-south perimeterlevee.
In an effort to define which areas of the Everglades may potentially be affected byexisting and projected future water demands, District staff utilized the SFWMM toidentify where the proposed MFL criteria were not met for the 1995 and 2020 base cases.Review of the 1995 Base Case showed the proposed Everglades MFL criteria wereexceeded at 12 out of 19 locations (indicator regions) within the remaining Evergladessystem (Table 45 in Chapter 4). Evaluation of the 2020 base case showed similar results(Table 45 in Chapter 4), with no overall increase in the number of sites that exceededproposed MFL criteria compared to the 1995 Base Case. These results indicate two things.First, a MFL recovery plan will be necessary for the 12 indicator regions identified in thismodeling effort. Second, the instances in which the MFL criteria were exceeded were, forthe most part, caused by drainage impacts associated with construction and operation ofthe Central and Southern Florida (C&SF) Project, while some areas may be influenced bya consumptive use withdrawal.
The next step taken was to conduct additional modeling to determine which areasof the Everglades may be affected by consumptive use withdrawals. The followingpreliminary screening analysis was conducted to identify these areas. The SFWMMsimulated two scenarios using the assumptions in the LEC-1 simulation: 1) all LEC publicwater supply wellfields were turned on in the model, versus 2) all LEC public watersupply wellfields were turned off in the model. These are referred to as the Pumps On andPumps Off scenarios. Modeling results were evaluated using the set of environmentalperformance measures described in Chapter 4 and Appendix D of this report and aresimilar to those used in the CERP evaluation process.
Results of the Pumps On and Pumps Off scenarios revealed five indicator regionswithin the Everglades system that were potentially susceptible to impacts from publicwater supply withdrawals, as shown in Table 56. With the wellfields turned off,improvements were observed in the number of times the MFL criteria were exceeded andthe duration of the flooding, and a reduction was observed in the number of extreme lowwater events. These areas included 1) the Rockland marl marsh (11 percent difference inannual flooding); 2) eastern WCA-3B (six percent difference in annual flooding);3) WCA-2B (five percent difference in annual flooding); 4) Northeast Shark River Slough(three percent difference in annual flooding), and 5) WCA-1, which showed animprovement in annual flooding (two percent), as well as significant reduction in thenumber of times the MFL criteria were exceeded. These preliminary results suggest thatthese five areas of the Everglades system have the potential to be impacted by watersupply withdrawals to a limited degree.
Cutting off all public water supply wellfields was not considered practicable, dueto the limited benefits to the regional system as projected in the model results balancedagainst 1) the cost of source replacement, 2) the potential water resource impact of large-scale Floridan aquifer development necessary to replace surficial supplies, and 3) longtime frames required to develop such sources. These factors were also considered againstthe fact that the CERP planning process has already provided consensus based alternatives
229

Chapter 5: Implementation Strategies LEC Regional Water Supply Plan - Planning Document
to meet the recovery goals of South Florida’s natural systems. For these reasons, staffproceeded to model a more realistic consumptive use withdrawal scenario thatincorporates assumptions based on the District’s current water shortage policy.
This modeling effort was basically a sensitivity analysis to identify the relativemagnitude of impact that a 30 percent cutback in public water supply might have on thefive areas identified above. The sensitivity analysis was conducted with the SFWMMsimulating 1) all LEC public water utilities pumps turned on; and 2) all LEC utilitiesturned on, with Miami-Dade County’s wellfields reduced by 30 percent (the level ofcutback associated with Phase II water shortage restrictions).
Table 56. Summary of the LEC Water Utility Pumps On and Pumps Off Scenarios for Selected Everglades Sitesa for the 2020 Base Case.
Area Gage IRb
Number of Times MFL
Criteria Were
Exceededc
Inundation/Duration Summaryc
Number of Extreme
Low Water Eventsc
Number of
Flooding Eventsc
Duration (weeks)c
Percent Increase in
Annual Floodingc
Loxahatchee National Wildlife Refuge (WCA-1)
1-7 27 7/1 20/18 74/84 92/94 (2%) 5/1
WCA-2A 2A-17 24 8/7 18/16 80/92 90/92 (2%) 8/9
WCA-2B central 23 7/6 15/14 93/104 86/91 (5%) 8/6
Holey Land WMA HoleyG 29 5/5 11/11 140/140 96/96 5/5
Rotenberger WMA Rotts 28 22/22 38/38 34/34 79/79 20/20
Northwest corner of WCA-3A 3A-NW 22 10/8 22/21 68/72 92/94 (2%) 8/6
Northwestern WCA-3A 3A-2 20 11/11 27/25 52/57 87/88 (1%) 10/8
Northeastern corner of WCA-3A
3A-3 68 10/8 19/17 76/85 90/90 8/8
Northeastern WCA-3A 3A-NE 21 8/7 17/15 88/101 92/94 (2%) 9/8
Central WCA-3A 3A-4 17 10/10 25/24 57/59 88/88 9/9
Southern WCA-3A 3A-28 14 8/7 17/18 88/83 93/93 5/7
WCA-3B 3B-SE 16 15/11 29/20 46/72 83/89 (6%) 19/12
Northeastern Shark River Slough
NESRS-2 11 9/7 20/18 71/82 88/91 (3%) 9/10
Central Shark River Slough NP-33 10 7/7 15/13 100/117 93/94 (1) 7/8
Southwestern Shark River Slough
NP-36 9 8/6 15/15 98/100 91/93 (2) 11/9
Marl wetlands east of Shark River Slough
NP-38 70 15/13 61/61 15/16 58/59 (1%) NAd
Marl wetlands west of Shark River Slough
NP-201 12 9/8 36/31 36/43 80/82 (2) 20/20
Rockland Marl Marsh G-1502 8 24/19 40/40 19/23 46/57 (11%) 31/25
Taylor Slough NP-67 1 16/16 38/36 30/32 71/72 28/28
a. Sites selected based on their potential for impact by a LEC wellfield withdrawalb. IR = Indicator Regionc. First number in each box represents utility Pumps On (full water use); second number represents Pumps Off
(a 30% cutback in water use by Miami-Dade County)d. NA = Not applicable
230

LEC Regional Water Supply Plan - Planning Document Chapter 5: Implementation Strategies
The purpose of this analysis was to see if simply implementing a water shortagecutback could reduce the number of times the MFL criteria was exceeded prior to theconstruction of the CERP projects. Modeling results were evaluated using the standard setof environmental performance measures developed for the LEC Plan (Chapter 4 andAppendix D). These included review of 1) the number of times the MFL criteria wereexceeded during the 31-year simulation period, 2) stage hydrographs and stage durationcurves, 3) the number of flooding events and their duration, 4) the percent reduction orincrease in annual flooding, and 5) the number of extreme high and low water events.
2005 Incremental Simulation with a 30 Percent Cutback. For the 2005incremental simulation, three areas were identified that showed hydrologic differencesbetween the two modeling scenarios. These areas were 1) the Rockland marl marshlocated with Everglades National Park (Indicator Region 8), 2) Northeast Shark RiverSlough (Indicator Region 11), also located in Everglades National Park, and 3) southeastWCA-3B (Indicator Region 16). All three of these sites are located within the extremewestern portion of urbanized Miami-Dade County (Table 57). The impacts of the 30percent cutback to the other two areas were not measurable.
Table 57. Results of the Model Simulation for Selected Everglades Sitesa: 2005 versus 2005 with a 30 Percent Cutback in Public Water Supply Withdrawals for Miami-Dade County.
a. Sites selected based on their potential for impact by a LEC wellfield withdrawal
Area IRb
b. IR = Indicator Region
Number of Times MFL Criterion
Was Exceededc
c. First number in each box represents utility Pumps On (full water use); second number represents Pumps Off (a30% cutback in water use by Miami-Dade County)
Inundation/Duration Summaryc
Number of High Water
Eventsc
Number of Low Water
Eventsc
Average Duration of Low Water
Eventsc (weeks)
Number of Flood Eventsc
Average Duration(weeks)c
Percent Change in
Annual Floodingc
Loxahatchee National Wildlife Refuge (WCA-1)
27 5/5 21/21 (3) 71/71 92/92 5/5 4/4 3/3
WCA-2A 24 14/14 23/23 60/60 86/86 0/0 16/16 5/5
WCA-2B 23 16/16 25/24 48/50 74/74 23/22 21/21 9/9
Northwestern WCA-3A 22 14/14 34/33 40/42 85/85 0/0 16/15 6/6
Northeastern WCA-3A 21 12/12 17/17 83/83 87/87 3/3 12/12 6/6
Central WCA-3A 17 8/8 17/17 88/88 93/93 5/5 8/7 4/4
Southern WCA-3A 14 1/2 10/8 158/198 98/98 19/17 1/0 1/0
WCA 3-B 16 10/10 21/19 68/76 88/90 (2%) 5/5 13/12 4/3
Northeastern Shark River Slough
11 11/11 23/20 61/72 87/89 (2%) 14/13 12/11 6/6
Central Shark River Slough 10 11/11 22/22 66/66 90/90 2/2 12/13 5/5
Southwestern Shark River Slough
9 10/10 20/21 71/68 89/89 0/0 16/16 4/4
Rockland Marl Marsh 8 21/20 35/37 27/26 58/60 (2%) 0/0 26/27 13/12
C-111 Perrine Marl Marsh 4 NAd
d. NA = Not applicable
81/79 10/10 49/50 (1%) 0/0 43/48 34/30
Mid-Perrine Marl Marsh 3 NAd 48/48 18/18 52/53 (1%) 0/0 31/28 4/4
Taylor Slough 1 16/16 38/38 30/30 71/72 (1%) 1/1 27/27 4/4
231

Chapter 5: Implementation Strategies LEC Regional Water Supply Plan - Planning Document
Review of stage hydrographs and stage duration curves for each of these three sitesshowed very minor differences in performance between the Pumps On and the 30 PercentCutback modeling scenarios. Differences in performance between the two modelsimulations were small and included 1) a two percent improvement in hydroperiod(annual flooding), 2) a small increase in the number of continuous flooding events, and 3)a decrease in the number of times the MFL criteria were exceeded for the Rockland marlmarsh recorded under the 30 Percent Cutback scenario (Table 57). The improvementsidentified under the 30 Percent Cutback scenario are very close to or within the assumedconfidence limits of the SFWMM and, therefore, may not be significant.
It should also be noted that this modeling scenario implements a 30 percent, year-round cutback for Miami-Dade County for the 31-year simulation. It is unlikely theDistrict would impose a 30 percent cutback in public water supply for Miami-DadeCounty during wet periods or under normal rainfall conditions. The only time a 30 percentcutback would actually be in effect would be during a major drought period. Therefore,impacts or improvements to Everglades wetland hydrology observed under an actual 30percent cutback scenario may be considerably less than those shown in Table 57.
LEC-1 Revised Simulation with a 30 Percent Cutback. By 2020, most ofthe CERP water supply and natural system restoration projects will be built and operating.Comparison of the Pumps On and the 30 Percent Cutback scenarios showed that only twoareas have experienced hydrologic differences by 2020. These areas were 1) the Rocklandmarl marsh (Indicator Region 8) and mid-Perrine marl marsh (Indicator Region 3), eachlocated within eastern portion of Everglades National Park (Table 58).
The largest difference recorded was within the Rockland marl marsh where a threepercent improvement in hydroperiod (average annual flooding) was observed under the 30Percent Cutback scenario (Table 58). In addition, a small decrease in the number of MFLcriteria violations for the Rockland marl marsh was observed under the 30 PercentCutback scenario. In the mid-Perrine marl marsh, a two percent improvement inhydroperiod and a small increase in the number of continuous flooding events wasobserved when the 30 percent cutback was imposed (Table 58). Again, these results areclose to the confidence limits of the SFWMM. It is unlikely the District would impose a30 percent year-round cutback in public water supply for Miami-Dade County. Therefore,the observed differences between model simulations would more than likely be less thanthose presented in Table 58.
These cutbacks did not show a significant reduction in the number of times theMFL criteria were exceeded, suggesting that a 30 percent cutback would not be effectivein improving the MFL performance in the Everglades. As a result, the recommended MFLrecovery program for the Everglades does not incorporate cutbacks of consumptive usepermits.
The District’s current CUP criteria prohibits the issuance of permits that wouldcause harm to the water resources. As a result, in areas where the MFL criteria are beingexceeded (significant harm occurring), no consumptive use permits could be issued thatwould cause an additional drawdown under the 1-in-10 year level of certainty.
232
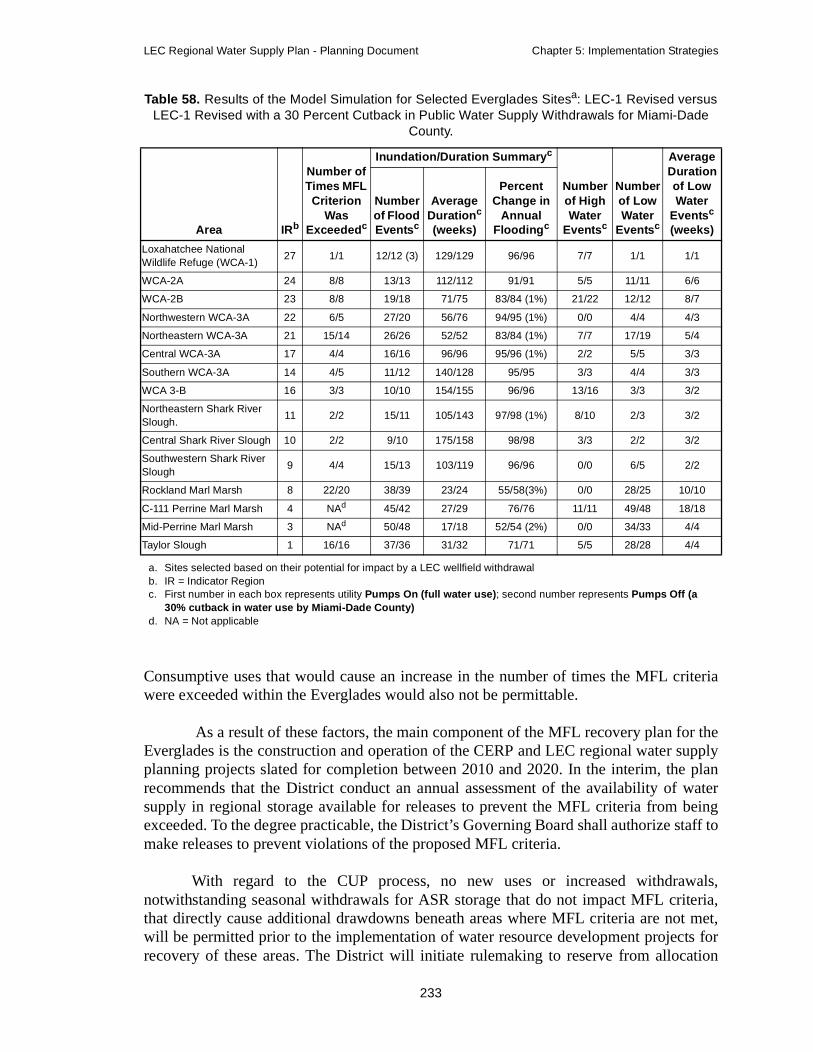
LEC Regional Water Supply Plan - Planning Document Chapter 5: Implementation Strategies
Consumptive uses that would cause an increase in the number of times the MFL criteriawere exceeded within the Everglades would also not be permittable.
As a result of these factors, the main component of the MFL recovery plan for theEverglades is the construction and operation of the CERP and LEC regional water supplyplanning projects slated for completion between 2010 and 2020. In the interim, the planrecommends that the District conduct an annual assessment of the availability of watersupply in regional storage available for releases to prevent the MFL criteria from beingexceeded. To the degree practicable, the District’s Governing Board shall authorize staff tomake releases to prevent violations of the proposed MFL criteria.
With regard to the CUP process, no new uses or increased withdrawals,notwithstanding seasonal withdrawals for ASR storage that do not impact MFL criteria,that directly cause additional drawdowns beneath areas where MFL criteria are not met,will be permitted prior to the implementation of water resource development projects forrecovery of these areas. The District will initiate rulemaking to reserve from allocation
Table 58. Results of the Model Simulation for Selected Everglades Sitesa: LEC-1 Revised versus LEC-1 Revised with a 30 Percent Cutback in Public Water Supply Withdrawals for Miami-Dade
County.
Area IRb
Number of Times MFL Criterion
Was Exceededc
Inundation/Duration Summaryc
Number of High Water
Eventsc
Number of Low Water
Eventsc
Average Duration of Low Water
Eventsc (weeks)
Number of Flood Eventsc
Average Durationc
(weeks)
Percent Change in
Annual Floodingc
Loxahatchee National Wildlife Refuge (WCA-1)
27 1/1 12/12 (3) 129/129 96/96 7/7 1/1 1/1
WCA-2A 24 8/8 13/13 112/112 91/91 5/5 11/11 6/6
WCA-2B 23 8/8 19/18 71/75 83/84 (1%) 21/22 12/12 8/7
Northwestern WCA-3A 22 6/5 27/20 56/76 94/95 (1%) 0/0 4/4 4/3
Northeastern WCA-3A 21 15/14 26/26 52/52 83/84 (1%) 7/7 17/19 5/4
Central WCA-3A 17 4/4 16/16 96/96 95/96 (1%) 2/2 5/5 3/3
Southern WCA-3A 14 4/5 11/12 140/128 95/95 3/3 4/4 3/3
WCA 3-B 16 3/3 10/10 154/155 96/96 13/16 3/3 3/2
Northeastern Shark River Slough.
11 2/2 15/11 105/143 97/98 (1%) 8/10 2/3 3/2
Central Shark River Slough 10 2/2 9/10 175/158 98/98 3/3 2/2 3/2
Southwestern Shark River Slough
9 4/4 15/13 103/119 96/96 0/0 6/5 2/2
Rockland Marl Marsh 8 22/20 38/39 23/24 55/58(3%) 0/0 28/25 10/10
C-111 Perrine Marl Marsh 4 NAd 45/42 27/29 76/76 11/11 49/48 18/18
Mid-Perrine Marl Marsh 3 NAd 50/48 17/18 52/54 (2%) 0/0 34/33 4/4
Taylor Slough 1 16/16 37/36 31/32 71/71 5/5 28/28 4/4
a. Sites selected based on their potential for impact by a LEC wellfield withdrawalb. IR = Indicator Regionc. First number in each box represents utility Pumps On (full water use); second number represents Pumps Off (a
30% cutback in water use by Miami-Dade County)d. NA = Not applicable
233

Chapter 5: Implementation Strategies LEC Regional Water Supply Plan - Planning Document
water intended for meeting hydropattern goals in the Everglades. These reservations willreflect initial limits on water availability in the regional system due to lack of storage, andwill be revised or upgraded every five years, as needed, as CERP projects come on line.Finally, all CUP applicants will be required under District rule to demonstrate that theiruses are efficient and consistent with the increase in water supplies as projects areimplemented. To achieve this, the District will establish rules to further implementefficiency measures for use of water from the regional system, including criteria forcapture of ASR water, and to limit by rule water allocations for new or increasedcumulative demands from regional water supplies to five-year periods.
Biscayne Aquifer
Identified measures to prevent the MFL criteria from being exceeded for theBiscayne aquifer are as follows: 1) maintain coastal canal stages at the minimumoperation levels shown in the MFL report; 2) implement CUP conditions for issuance toprevent harmful movement of saltwater intrusion up to a 1-in-10 year level of certainty; 3)maintain a ground water monitoring network and utilize data to initiate water shortagecutbacks should the threat of saline water movement become imminent; and 4) conductresearch in high risk areas to identify where the position of the saltwater front is adjacentto existing and future potable water sources.
MFL Monitoring Systems (Recommendations 39)
Monitoring systems must be established in order to implement MFL recovery andprevention strategies and conduct research necessary to further refine the ability to projectwhen significant harm could occur. The monitoring systems will collect water flow, waterlevel, and water quality data. Monitoring data is necessary to affect interim operationalstrategies and to gage the success of MFL long-term recovery and prevention strategies.
Consumptive Use Permitting, Rulemaking, and Resource Protection Projects (Recommendations 40)
Specific rule provisions are necessary for implementation of the regulatoryprogram, to be consistent with both the LEC Plan and localized resource protectionstandards. These are discussed below.
Level of Certainty
The level of assurance provided to consumptive users and the environment thatwater will be available to meet the reasonable demands up to specific hydrologicconditions must be defined by rule. The allocation methodologies and impact evaluationswill be modified to reflect the 1-in-10 year level of certainty planning goal used in thewater supply plan. For the purposes of determining allocation and evaluating the impactsof an allocation, the proposed rules will define 1-in-10 rainfall conditions across the entiredistrict utilizing statistical methods and historic rainfall data (See Proposed Methodologyfor Defining and Assessing the 1-in-10 Year Level of Certainty for the Lower EastCoast Planning Area in Appendix I).
234
LEC Regional Water Supply Plan - Planning Document Chapter 5: Implementation Strategies
Permit Duration
Section 373.236 (1), F.S., Duration of Permits, states the following in relevant part:
Permits shall be granted for a period of 20 years, if requested for thatperiod of time, if there is sufficient data to provide reasonable assurancethat the conditions for permit issuance will be met for the duration of thepermit; otherwise permits may be issued for shorter durations whichreflect the period for which such reasonable assurances can be provided.
The District will define by rule the conditions for issuance of 20-year permits andpermits for lesser durations when sufficient information exists to provide reasonableassurances that the use will continue to meet the initial conditions for issuance, pursuant toSection 373.239, F.S., This will incorporate phased increases in allocations to meetincreasing reasonable-beneficial uses incrementally, with implementation of waterresource development projects as recommended in the LEC Plan.
A conceptual framework for implementing the permit duration statute has been setforth by District staff, and will be further refined in the rule development and rule makingprocesses. Within this framework, two basic permit duration scenarios have beendeveloped. The first scenario applies to permits for use of a source that will continue to beavailable for the planning horizon (20 years). The second scenario is for permits for use ofsources where water availability depends upon future water resource development,including augmentation to meet current and increased user demands. Issuance of permitswhich fall into the second scenario will be determined as follows: a) the water quantityinitially available (from 2000 through 2005) to meet initial demands of consumptive useswill be allocated for a 20-year period; and b) when additional water allocations from thesource are requested to meet increasing demands, water that may become availablethrough water resource development projects and other measures will be allocated in five-year increments. Permit modification will be required to receive allocation for theseincreased demands. These permits will extend for 20-year periods.
Saltwater Intrusion Criteria
Hydrologic conditions under which harmful saline water intrusion will not occuras a result of cumulative existing and proposed consumptive use withdrawals during a1-in-10 year drought need to be defined by rule. Existing water resource protection criteriafor saltwater intrusion will remain and an additional method of analysis (flow vectoranalysis for net inflow during a 1-in-10 year drought) will be added. The vector analysiswill be reflective of the evaluation conducted under the LEC Plan. In this process, therules will be amended to require the applicant to measure the magnitude of ground waterflow across the 250 milligrams per liter (mg/L) isochlor (saltwater-freshwater interface),assuming the maximum annual allocation withdrawal simulated during a 1-in-10 yeardrought event. For uses in which the net flow across the interface is either eastward or iszero for the drought event, the saltwater criteria will be met. Projects that produce a netwestward flow of saline water will be denied.
235
Chapter 5: Implementation Strategies LEC Regional Water Supply Plan - Planning Document
Wetlands and Other Surface Waters Protection
Numeric drawdown criteria for defining hydrologic conditions under which harmto the water resource functions to wetlands and other surface waters is projected to occurhave been under development for the last several years. These criteria will be finalized forevaluation of the potential drawdown impacts of cumulative existing and proposedconsumptive use withdrawals during a 1-in-10 year drought. Criteria differentiatingwetland types according to hydrologic characteristics will also be proposed. Specialfactors for consideration in the hydrologic impact analysis, such as listed speciesutilization in wetland areas, will be incorporated into the rule. Requirements for avoidanceand minimization of harmful consumptive use impacts will be identified. In addition,circumstances for use of mitigation to offset projected harmful impacts will be exploredfor inclusion in the rule, consistent with FDEP policy direction on this issue. Finally,public interest considerations for identifying circumstances when application of proposedwetland drawdown parameters would cause undue hardship, inconsistent with Section373.223, F.S, Conditions for Permit Issuance, will be explored and considered foradoption, as appropriate.
Permit Renewal Process
The timing of, and process for, the renewal of consumptive use permits must beidentified. Staff contemplates that four years will be required to review all permitsthroughout the District, in the following order of planning areas: Upper East Coast, LowerWest Coast, Lower East Coast, and Kissimmee Basin. In the interim period, public watersupply permit durations will be linked to the date identified for renewal of irrigationpermits.
Regional Water Availability Criteria
The CUP program contains water resource rules must protect against harmfulwithdrawals, but does not analyze the regional cumulative impact of allocating water fromthe C&SF Project, as a source of either surface or ground water (induced seepage underthe levees). Up to now, this approach was considered adequate for protecting the waterresources from harm. However, now that MFL criteria and Everglades Protection Arearestoration projects are being implemented, along with the potential for increasing humandemands from the regional system, regional criteria must be developed to assess howmuch water is available for allocation and to meet environmental demands from theregional system.
The LEC preferred alternative (LEC-1 Revised) estimates the amounts of wateravailable for each service area upon implementation of the LEC Plan over the next 20years. The model evaluations conducted for the interim periods (2005, 2010, and 2015)define the incremental availability of water to each county (Palm Beach, Broward, andMiami-Dade) and for the upper and lower Indian Prairie/Istakpoga Basin from theregional system during 1-in-10 drought conditions (from ground water seepage andsurface water flows, as appropriate).
236
LEC Regional Water Supply Plan - Planning Document Chapter 5: Implementation Strategies
Improved Pasture Irrigation
Current allocation criteria for improved pasture irrigation are based on a volume ofwater needed to irrigate turf grass using a seepage irrigation method. The supplementalirrigation requirement in the existing Basis of Review for Consumptive Use PermitApplications (SFWMD, 1997d), is based on demands during a moderate droughtcondition, which would not be expected to occur once every five years. It is projected thatthe actual use of water for improved pasture is considerably below what this currentallocation criteria allows. As a result, it is recommended that such criteria be revised tomore accurately reflect actual irrigation practices and the amount of water necessary forpasture irrigation.
Water Shortage Plan
The District will develop and adopt water shortage triggers to avoid causingsignificant harm to water resources, in conjunction with the implementation of the WaterShortage Plan (Chapter 40E-21, F.A.C.). Water shortage triggers to implement naturalsystem protection and water supply source protection have been identified in the planningprocess and integrated into the LEC-1 and LEC-1 Revised simulations.
Resource protection criteria are designed to prevent harm to the resources up to an1-in-10 year drought event. For drought conditions greater than an 1-in-10 year event, itmay be necessary to decrease water withdrawals to avoid causing significant or seriousharm to the resource. Water shortage triggers, or water levels at which phased restrictionswill be declared, are used to curtail withdrawals by water use types and avoid water levelsdeclining to a minimum level where significant harm to the resource could potentiallyoccur.
Water shortage rule revisions will include language which addresses the conditionsby which cutbacks to rainfall-based water reservations would be required during Phase Ior Phase II water shortage restrictions. During Phase III or greater conditions, norestrictions to the rainfall delivery schedule in the reservation rule will be imposed, unlessspecifically ordered by the Governing Board, after consideration of the conditions on acase-by-case basis, in consultation with the public, and upon a finding of an overridingpublic interest.
Even though water shortage triggers will be established, a case-by-case analysisfor a given drought circumstance will continue to exist. Thus, prior to declaring a watershortage, the District will also analyze the factors listed in the Water Shortage Planconcerning such issues as 1) whether or not sufficient water will be available to meet theestimated and anticipated user demands and 2) whether serious harm to the water resourcewill occur.
237
Chapter 5: Implementation Strategies LEC Regional Water Supply Plan - Planning Document
Special Areas Designations
Two special area designations contained in the Water Use Permitting Programwere reviewed based on the findings of this planning effort. Definitions of thedesignations and recommended changes, if any, are provided below.
Reduced Threshold Areas. Reduced Threshold Areas (RTAs) are areas of theDistrict where the volume of usage delineating a general permit from an individual permithas been reduced from 100,000 gallons per day (GPD) to 10,000 GPD for average dailydemand. RTAs have typically been designated in resource depleted areas that have anestablished history of substandard water quality, saline water movement, or the lack ofwater availability to meet the projected needs of a region. Results of the LEC Plan andincreased impact analysis capabilities did not indicate significant potential problems.Assessment determinations are conducted for all consumptive use applications. Forwithdrawals less than 100,000 GPD, qualifying for a general permit versus an individualpermit will be based on the potential cumulative impacts of the use.
Water Resource Caution Areas. Water Resource Caution Areas (WRCAs)were formerly referred to as Critical Water Supply Problem Areas and are described inChapter 40E-23, F.A.C. WRCAs are defined as areas that have existing water resourceproblems or areas in which water resource problems are projected to develop over the next20 years. Diversification of supply sources is currently occurring within some of theseareas and it is anticipated these areas will change designation in the future once sufficientdiversification has been realized. Water resource caution area boundaries will be redefinedin the Lower West Coast (LWC) Planning Area pursuant to the results of the water supplyplan analyses and evaluation. No changes in the boundaries in the LEC or Kissimmeeplanning areas are contemplated.
Reuse of Reclaimed Water
Legislation enacted in 1994 requires all water management districts to adoptreclaimed water rules that address use of water from other sources in emergency situationsor when reclaimed water is unavailable. These rules are to be adopted for theimplementation in the upcoming permit renewal process. In addition, existing rulesregarding reuse feasibility will be considered for adoption.
Diversion and Impoundment
Allocation criteria for diversion and impoundment uses need to be identified.Criteria developed for allocation will consider efficiency in surface water delivery systemsand recycling of water between crops. The allocation criteria will be primarily applicableto agricultural related systems.
CUP Model Applications
Ground water computer models used for the LWC and LEC regional water supplyplanning processes need to be modified for application in determining individual impacts
238

LEC Regional Water Supply Plan - Planning Document Chapter 5: Implementation Strategies
of CUP applications. Rule changes identifying application of models in the CUP reviewprocess will be adopted, as appropriate.
Aquifer Storage and Recovery Permitting
Projects that involve diverting surface or ground water for storage underground inthe Floridan Aquifer System must address the potential impacts of the use with regard towater resource protection and existing legal user protection. Prior to injecting the freshwater underground for storage, the applicant will be required to demonstrate that the freshwater stored will be protected from other users. Other users of the Floridan AquiferSystem will seek assurances that the storage of fresh water and the resulting changes in thewater chemistry and hydrostatic pressure within the aquifer will not be harmful to theirproposed use. The ASR rule will address the impacts of initial diversion of water, thereasonable quantities necessary for the project, the impacts of injection on other existinglegal users, the impacts of the withdrawals of water from storage in other existing legaluser ASR projects, and interference caused by intermingling of water of differing waterqualities on other uses. Criteria for the capture of water for storage during the wet timesshould be incorporated into the ASR allocation process through rulemaking.
BMP Makeup Water Rule Revisions
Previously, it had been estimated that the implementation of Best ManagementPractices (BMPs) in the EAA would reduce the volume of runoff available to be sent southinto the Everglades by 20 percent. Since this rule was implemented in 1995, data collectedand evaluated suggests that there is minimal reduction in runoff from the EAA due toBMP implementation. Therefore, it is recommended that the current BMP makeup waterrule be revisited through a public rulemaking process to incorporate this new information
Other Water Resource Projects
This section includes a water conservation program. Also, through the planningprocess, several evaluation and feasibility projects have been identified which will becompleted and used in the formulation of the next update of the LEC Plan.
Comprehensive Water Conservation Program (Recommendation 41)
Implementation of conservation measures by individual users is a water supplydevelopment activity, but these efforts need to be evaluated and supported as a waterresource development project. Therefore, staff recommends establishing a comprehensivewater conservation program. The program will both evaluate the implementation ofexisting conservation regulations and programs and conduct outreach to assure that allconservation opportunities are being implemented.
239
Chapter 5: Implementation Strategies LEC Regional Water Supply Plan - Planning Document
Seawater Reverse Osmosis Treatment Facilities (Recommendation 42)
Recently, Tampa Bay Water approved a plant to obtain water from seawater bydirect osmosis treatment. Proposed costs were significantly lower than other seawaterdesalination costs to date, and apparently reflect energy and disposal cost reductions dueto the colocation of the plant with an existing coastal power plant. This project willevaluate the feasibility of colocating similarly designed plants at existing power plants inthe LEC Planning Area. The feasibility studies will seek to determine the likelihood thatthe large cost reductions estimated for the Tampa plant are achievable. The District isinitiating the feasibility study during the present fiscal year (2000).
Obtaining treated seawater much more cheaply than has previously beenexperienced has significant water resource development implications. Taking into accountthe savings in conventional water treatment costs, the use of seawater reverse osmosistreatment facilities may provide significant net savings compared to proposed CERPprojects, such as the wastewater reuse facilities in Miami-Dade County, as a means tocapture or provide additional water.
Reclaimed Water System in Northern Palm Beach County (Recommendation 43)
This project will evaluate the feasibility of developing a regional irrigation watersystem for northern Palm Beach County and Martin County, utilizing reclaimed waterfrom central Palm Beach County. Not only would this help meet future needs for irrigationwater, but it would help recharge coastal aquifers, lessening saltwater intrusion threats,potential impacts on wetlands, and movement of existing pollutant plumes. It would alsolessen the dependency of wastewater utilities on deep well disposal. The evaluation of thissystem will have to be coordinated with the CERP projects planned for this area.
Indirect Aquifer Recharge (Recommendation 44)
Large amounts of secondarily treated wastewater are generated by wastewaterutilities. While programs to promote and encourage reuse have been in effect for manyyears, the amount of reuse has remained small relative to the water potentially available.This project will examine ways in which reuse of reclaimed water can be increased whileassuring that the reuse systems contribute to meeting water supply and environmentalrestoration goals that are commensurate with the additional costs that will be incurred.
Four facilities, which will produce reclaimed water (wastewater reuse) areincluded in the CERP process. The two largest projects are located in Miami-Dade Countyand together are expected to provide by 2020 about 200,000 ac-ft (230 MGD) of advancedtreated water to recharge the coastal canals and aquifer in Miami-Dade County. Theremaining two projects are located in Palm Beach County. The Palm Beach CountyWetlands-Based Water Reclamation Project will take advanced treated water which willbe further treated in a series of rehydrated marshes and eventually used to rechargewellfields and other areas. The Winsburg Farm Constructed Wetland, will use reclaimed
240

LEC Regional Water Supply Plan - Planning Document Chapter 5: Implementation Strategies
water to hydrate 175 acres of constructed wetlands. The efforts of the indirect aquiferrecharge project will need to focus on issues not covered in these related CERP projects.
High Volume Surface Water ASR Testing in Taylor Creek (Recommendation 45)
An opportunity may exist to utilize the District-owned ASR well located by TaylorCreek in Okeechobee County to test the practicality of using injection/recovery rates of 20MGD into a prolific zone of the Floridan aquifer. Permit and well repair issues need to beresolved as part of this effort.
WATER SUPPLY DEVELOPMENT OPTIONS
Water supply development options are discussed below in terms of the watersources on which they will rely. These sources are as follows:
• Conservation
• Ground Water (including the Biscayne/Surficial and the Floridanaquifer systems)
• Reclaimed Water
• Seawater Desalination
• Storage (including ASR and Reservoirs)
• Surface Water Sources
Water supply options which utilize each water source are discussed below withregard to their potential for use in the LEC Planning Area. For each option, the followinginformation is presented: definition and discussion, estimated costs to develop that optionand the quantity of water potentially available from that option, and conclusions regardingthe potential of the water supply options which use each water source. This information isprovided so that individual water users can better evaluate alternative water supplysources and select the alternative, or combination of alternatives, which best suit localconditions. That the water users conduct such an evaluation is the substance ofRecommendation 46 in Chapter 6.
Conservation
Definition and Discussion
This water supply option incorporates water conservation measures that addresswater demand reduction and capture of water that would otherwise be discharged to tide,including practices that achieve long-term permanent reductions in water use. Establishinga water conservation goal or conservation ethic was discussed by the LEC Regional WaterSupply Plan Advisory Committee when goals and objectives were first considered for thisplan. The following LEC Plan objectives were formed based on these discussions:
241
Chapter 5: Implementation Strategies LEC Regional Water Supply Plan - Planning Document
• Protect and conserve the water resources of South Florida toensure their availability for future generations
• Provide for the equitable, orderly, cost-effective, and economicaldevelopment of water supplies to meet South Florida'senvironmental, agricultural, urban, and industrial needs
The committee further discussed whether advanced levels of water conservationshould be implemented beyond current mandatory requirements regardless of the cost, orwhether advanced levels should be considered as a tool or source option to be evaluatedwith other source options to meet the water needs of a particular area.
Mandatory Requirements
In 1988, The District began working with utilities to implement a conservationprogram through the CUP process. In 1991, the program was incorporated by rule andbecame part of the permitting process. The water conservation plans must incorporatespecific elements depending on the type of use. For public water suppliers, the elementsare an irrigation hours ordinance, a Xeriscape™ landscape ordinance, an ultra-low volumefixture ordinance, a rain sensor device ordinance, a water conservation-based ratestructure, a leak detection and repair program, a public education program, and areclaimed water feasibility evaluation. For commercial and industrial users therequirements include a water use audit, an employee water conservation awarenessprogram, and implementation of cost-effective conservation measures. For landscape andgolf course users the requirements are Xeriscape™ landscaping, the use of rain sensordevices, and irrigation hour limitations. For agricultural users, the requirement is thatmicro irrigation systems be used for new citrus and container nursery projects. In additionto these CUP requirements, conservation requirements are also incorporated inRecommended Orders for Developments of Regional Impact (DRI).
Depending on the demographics and location of the service area, utilities canchoose to demonstrate which water conservation activities are more cost-effective for theirsituation and emphasize implementation of those activities in their conservation plan. Fourof the mandatory water conservation elements require adoption of an ordinance by localgovernments. Generally, because of the home rule autonomy of local governments, eachordinance has to be adopted by each unit of local government for the measure to be fullyimplemented. Investor-owned utilities (private) do not have the authority to passordinances, so they must request the adoption of appropriate ordinances by localgovernments who have jurisdiction in that utility's service area. Utilities are not requiredto have a leak detection program if their unaccounted for water is less than 10 percent. Anintegrated program between the CUP Program and local ordinances is created when localgovernments have adopted the ordinances and established a compliance program.
In the period from 1988, when these requirements were first implemented, to 1995,substantial reductions in per capita consumption of about 13 percent were achieved bywater utilities and their customers. This reduction in per capita use translates to a savingsof approximately 118 MGD for the utilities listed in Table 59. This evaluation compares
242
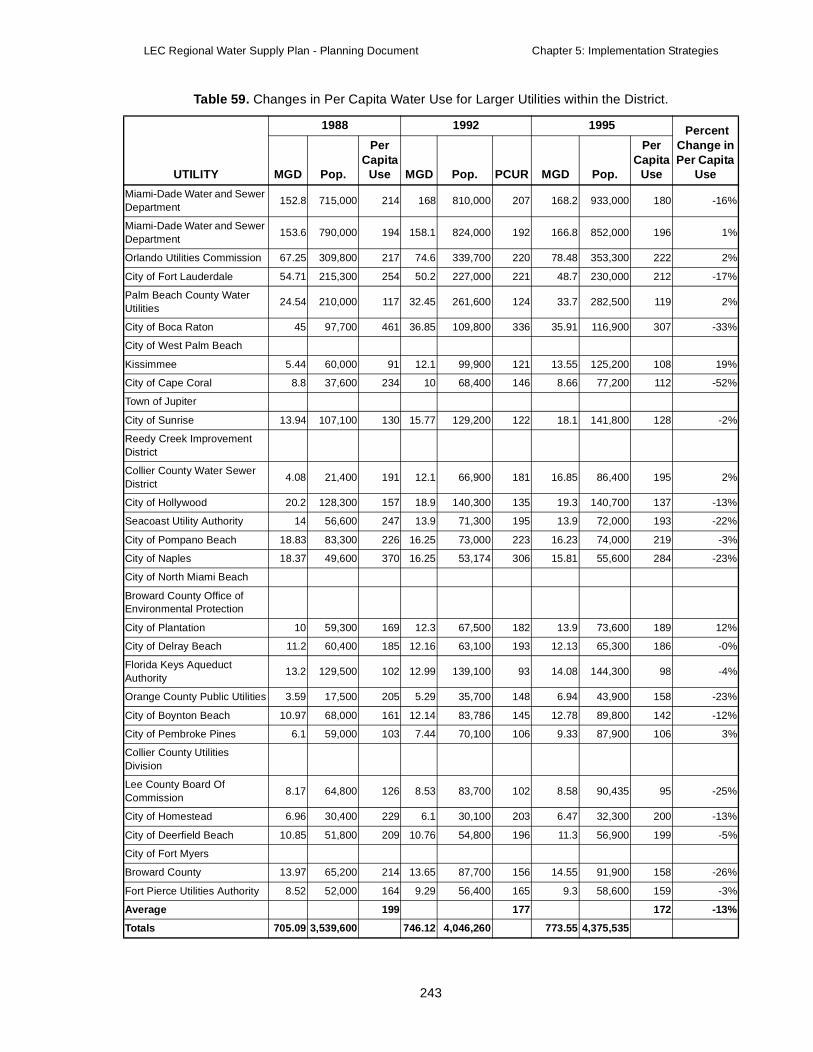
LEC Regional Water Supply Plan - Planning Document Chapter 5: Implementation Strategies
MD
MD
O
C
PU
C
C
K
C
To
C
RD
CD
C
S
C
C
C
BE
C
C
FlA
O
C
C
CD
LeC
C
C
C
B
Fo
A
To
Table 59. Changes in Per Capita Water Use for Larger Utilities within the District.
UTILITY
1988 1992 1995 Percent Change inPer Capita
UseMGD Pop.
Per Capita
Use MGD Pop. PCUR MGD Pop.
Per Capita
Use
iami-Dade Water and Sewer epartment
152.8 715,000 214 168 810,000 207 168.2 933,000 180 -16%
iami-Dade Water and Sewer epartment
153.6 790,000 194 158.1 824,000 192 166.8 852,000 196 1%
rlando Utilities Commission 67.25 309,800 217 74.6 339,700 220 78.48 353,300 222 2%
ity of Fort Lauderdale 54.71 215,300 254 50.2 227,000 221 48.7 230,000 212 -17%
alm Beach County Water tilities
24.54 210,000 117 32.45 261,600 124 33.7 282,500 119 2%
ity of Boca Raton 45 97,700 461 36.85 109,800 336 35.91 116,900 307 -33%
ity of West Palm Beach
issimmee 5.44 60,000 91 12.1 99,900 121 13.55 125,200 108 19%
ity of Cape Coral 8.8 37,600 234 10 68,400 146 8.66 77,200 112 -52%
wn of Jupiter
ity of Sunrise 13.94 107,100 130 15.77 129,200 122 18.1 141,800 128 -2%
eedy Creek Improvement istrict
ollier County Water Sewer istrict
4.08 21,400 191 12.1 66,900 181 16.85 86,400 195 2%
ity of Hollywood 20.2 128,300 157 18.9 140,300 135 19.3 140,700 137 -13%
eacoast Utility Authority 14 56,600 247 13.9 71,300 195 13.9 72,000 193 -22%
ity of Pompano Beach 18.83 83,300 226 16.25 73,000 223 16.23 74,000 219 -3%
ity of Naples 18.37 49,600 370 16.25 53,174 306 15.81 55,600 284 -23%
ity of North Miami Beach
roward County Office of nvironmental Protection
ity of Plantation 10 59,300 169 12.3 67,500 182 13.9 73,600 189 12%
ity of Delray Beach 11.2 60,400 185 12.16 63,100 193 12.13 65,300 186 -0%
orida Keys Aqueduct uthority
13.2 129,500 102 12.99 139,100 93 14.08 144,300 98 -4%
range County Public Utilities 3.59 17,500 205 5.29 35,700 148 6.94 43,900 158 -23%
ity of Boynton Beach 10.97 68,000 161 12.14 83,786 145 12.78 89,800 142 -12%
ity of Pembroke Pines 6.1 59,000 103 7.44 70,100 106 9.33 87,900 106 3%
ollier County Utilities ivision
e County Board Of ommission
8.17 64,800 126 8.53 83,700 102 8.58 90,435 95 -25%
ity of Homestead 6.96 30,400 229 6.1 30,100 203 6.47 32,300 200 -13%
ity of Deerfield Beach 10.85 51,800 209 10.76 54,800 196 11.3 56,900 199 -5%
ity of Fort Myers
roward County 13.97 65,200 214 13.65 87,700 156 14.55 91,900 158 -26%
rt Pierce Utilities Authority 8.52 52,000 164 9.29 56,400 165 9.3 58,600 159 -3%
verage 199 177 172 -13%
tals 705.09 3,539,600 746.12 4,046,260 773.55 4,375,535
243

Chapter 5: Implementation Strategies LEC Regional Water Supply Plan - Planning Document
the actual water use against permanent populations of the service areas for utilities whichuse over four billion gallons per year. Some utilities were excluded from the evaluationbecause of changes in treatment efficiency and for other statistical and data availabilityreasons. Since these reductions are incorporated in the 1995 Base Case, the relevant issuefor the LEC Plan is the additional conservation that can be achieved.
Supplemental Measures
There are also several supplemental water conservation measures that local userscould implement if they deem any of the measures to be cost-effective. Measures forurban users include indoor and outdoor retrofits and landscape audit and retrofit; publicwater supply utilities include filter backwash recycling and distribution pressure control;and agricultural users include irrigation audits and improved scheduling, and retrofittingwith a micro irrigation system.
Mobile Irrigation Labs
A conservation program implemented in several areas of the District, with Districtfinancial support, is deployment of Mobile Irrigation Labs (MILs). Labs are usuallyidentified as agricultural MIL or urban MIL. Urban labs typically serve landowners withless than 10 acres of irrigated lands. These labs conduct performance evaluations for bothagricultural and urban irrigation systems free of charge as a public service. The MILprogram helps to develop a conservation ethic among water users while providingpractical advice on how to achieve significant water savings.
Two MILs are currently serving the LEC Planning Area. An agricultural lab isheadquartered at the South Dade Soil and Water Conservation District (SWCD) office inHomestead and serves Miami-Dade County. This lab also performs some urbanevaluations. The other lab is headquartered at the SWCD office in West Palm Beach andperforms urban evaluations in Palm Beach County. Funding for these labs has beenprovided by the District and the Natural Resource Conservation Service (NRCS).However, recent decisions by the Governing Board have indicated that this is not a coreprogram for funding by the District. As a result, District participation in funding will belimited to providing staff to garner support from other agencies such as FDEP, FloridaDepartment of Agriculture and Consumer Services (FDACS), and SWCDs, as well asusers.
The annual operating cost for an urban MIL is approximately $70,000 and annualoperating costs are $130,000 for an agriculture MIL. Both of these labs are working neartheir capacity in terms of the number of evaluations that can be performed in a year. As aresult, it is recommended that an additional urban MIL should be established at theBroward County SWCD to serve the Fort Lauderdale area. Dedicated sources of fundingneed to be established for the existing, as well as the recommended MILs.
Cost-Effectiveness Analysis from the FY 1998 MIL Program. Typicalcosts and savings for urban and agricultural MILs such as those in Palm Beach andMiami-Dade counties are presented in Table 60. These costs are from the 1998 Annual
244

LEC Regional Water Supply Plan - Planning Document Chapter 5: Implementation Strategies
MIL Report (South Dade SWCD, 1998). The costs per 1,000 gallons saved comparefavorably with alternative source development. This cost-effectiveness will be magnifiedto the degree that cost-savings from a single mobile lab visit extend over several years.Another environmental benefit of the urban and agricultural mobile lab program is thereduction of pollution from fertilizers and pesticides applied to urban landscapes andcropland. One of the key components of the MIL program, education, is not illustrated inthis table.
Conservation Estimated Costs
The estimated conservation costs are broken down into urban and agriculturalmeasures. The information in this section should not be interpreted as a benefit-costanalysis of these conservation measures.
Urban Conservation Measures. Cost and water savings for several indoorand outdoor urban retrofit water conservation measures are provided in Tables 61 and 62.For urban water conservation methods, the analysis indicated the value of the savings isgreater than the costs of the methods. The savings per unit of cost associated with outdoorconservation measures are generally greater than those for indoor conservation measures,primarily because of the larger volumes of water involved. Water savings associated withimplementation of retrofit programs can be significant. For example, retrofitting 10,000
Table 60. 1998 Mobile Irrigation Lab Costs and Estimated Water Savings.
LabAnnual
CostPotential Savings
(1,000 gallons per year)Total Cost
(per 1,000 gallons saved)
Urban $70,000 79,500 $0.88
Agriculture $130,000 1,470,000 $0.09
Total $200,000 1,549,500 $0.13
Table 61. Representative Water Use and Cost Analysis for Retrofit Indoor Water Conservation Measures.
Toilet Showerhead
Cost/unit $200 $20
Flushes/day/person 5 --
Gallons saved/flush 1.9 --
Minutes/day/person -- 10
Gallons saved/minute -- 2
Persons/unit 2.5 2.5
Life 40 years 10 years
Savings/year/unit 8,670 gallons 9,125 gallons
Savings/unit over life 346,800 gallons 91,250 gallons
Cost/1,000 gallons saved $0.58 $0.22
Gallons saved/dollar invested 1,730 gallons 4,560 gallons
245
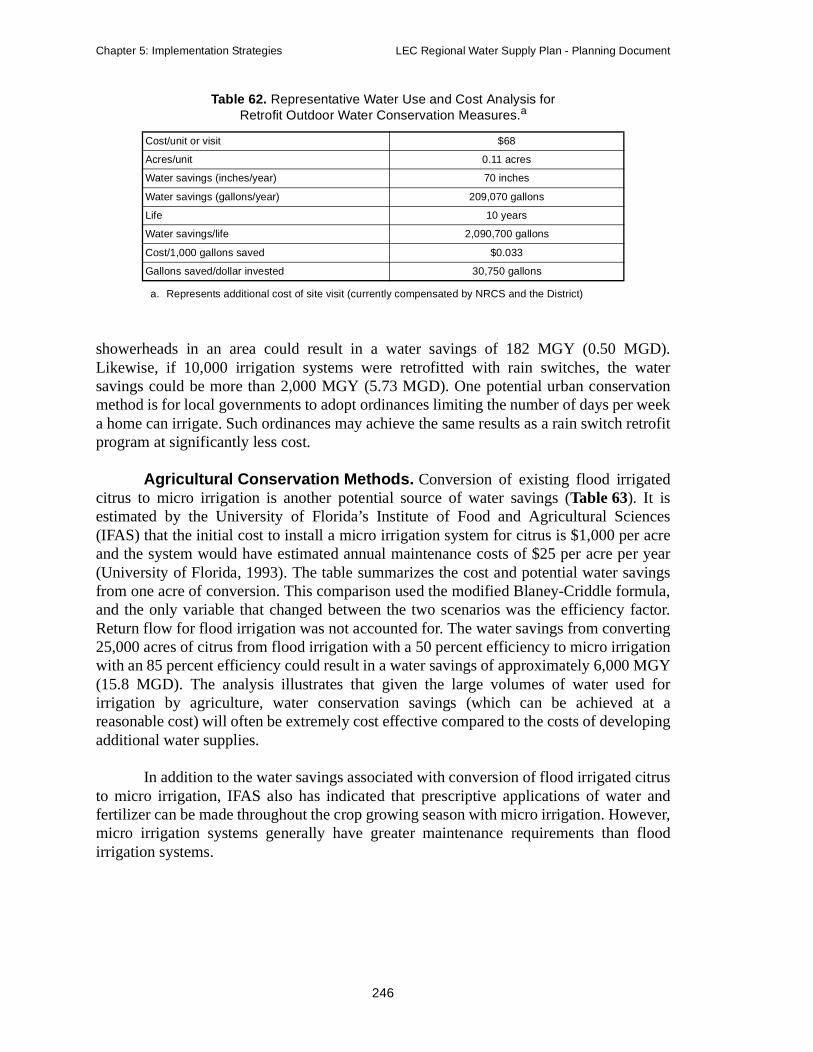
Chapter 5: Implementation Strategies LEC Regional Water Supply Plan - Planning Document
showerheads in an area could result in a water savings of 182 MGY (0.50 MGD).Likewise, if 10,000 irrigation systems were retrofitted with rain switches, the watersavings could be more than 2,000 MGY (5.73 MGD). One potential urban conservationmethod is for local governments to adopt ordinances limiting the number of days per weeka home can irrigate. Such ordinances may achieve the same results as a rain switch retrofitprogram at significantly less cost.
Agricultural Conservation Methods. Conversion of existing flood irrigatedcitrus to micro irrigation is another potential source of water savings (Table 63). It isestimated by the University of Florida’s Institute of Food and Agricultural Sciences(IFAS) that the initial cost to install a micro irrigation system for citrus is $1,000 per acreand the system would have estimated annual maintenance costs of $25 per acre per year(University of Florida, 1993). The table summarizes the cost and potential water savingsfrom one acre of conversion. This comparison used the modified Blaney-Criddle formula,and the only variable that changed between the two scenarios was the efficiency factor.Return flow for flood irrigation was not accounted for. The water savings from converting25,000 acres of citrus from flood irrigation with a 50 percent efficiency to micro irrigationwith an 85 percent efficiency could result in a water savings of approximately 6,000 MGY(15.8 MGD). The analysis illustrates that given the large volumes of water used forirrigation by agriculture, water conservation savings (which can be achieved at areasonable cost) will often be extremely cost effective compared to the costs of developingadditional water supplies.
In addition to the water savings associated with conversion of flood irrigated citrusto micro irrigation, IFAS also has indicated that prescriptive applications of water andfertilizer can be made throughout the crop growing season with micro irrigation. However,micro irrigation systems generally have greater maintenance requirements than floodirrigation systems.
Table 62. Representative Water Use and Cost Analysis for Retrofit Outdoor Water Conservation Measures.a
Cost/unit or visit $68
Acres/unit 0.11 acres
Water savings (inches/year) 70 inches
Water savings (gallons/year) 209,070 gallons
Life 10 years
Water savings/life 2,090,700 gallons
Cost/1,000 gallons saved $0.033
Gallons saved/dollar invested 30,750 gallons
a. Represents additional cost of site visit (currently compensated by NRCS and the District)
246

LEC Regional Water Supply Plan - Planning Document Chapter 5: Implementation Strategies
Estimates of the Quantity of Water Potentially Available from Conservation
Estimates of the amount of water that could be saved (or made available) throughthe use of water conservation practices in the LEC Planning Area were developed as partof the Restudy, using a model developed by the Institute of Water Resources (IWR-MAIN) to simulate municipal and industrial use (USACE and SFWMD, 1999). Themodel was used to estimate water use to 2050, based on land use, economic, anddemographic projections. Projections were made with and without the implementation ofconservation practices. The projections without conservation are called Projection A. Theonly conservation practice they incorporate is the effect of increasing block rate structures.Conservation practices included in Projection B, the conservation projection, are that allnew construction would incorporate water-conserving faucets, showerheads, and toilets,that local governments would implement ordinances to restrict lawn irrigation to theperiod from 9 p.m. to 5 a.m. and that irrigation systems would be equipped with rainsensors. All of these efforts represent the continued implementation of existing federal,state, and District regulations and programs. The resulting per capita consumptions arepresented in Table 64.
Table 63. Irrigation Costs and Water Use Savingsa Associated with Conversion from Flood Irrigation to Micro Irrigation.b
Initial cost/acre $1,000
Operating cost/acre $25
Water savings (inches per year) 8.519 inches
Water savings (gallons/year) 230,805 gallons
Life 20 years
Cost over life $1,500
Water savings over life 4,616,100 gallons
Cost/1,000 gallons saved $0.33
a. Addresses reductions in pumpage only and does not include return flowb. Source: IFAS and SFWMD
Table 64. Average Per Capita Water Use Resulting From Projections A and B.a
a. Source: USACE and SFWMD, 1999
Year
Gallons/Capita/Day
Projection A Projection B
2000 226 214
2010 228 207
2030 220 189
2050 215 178
247
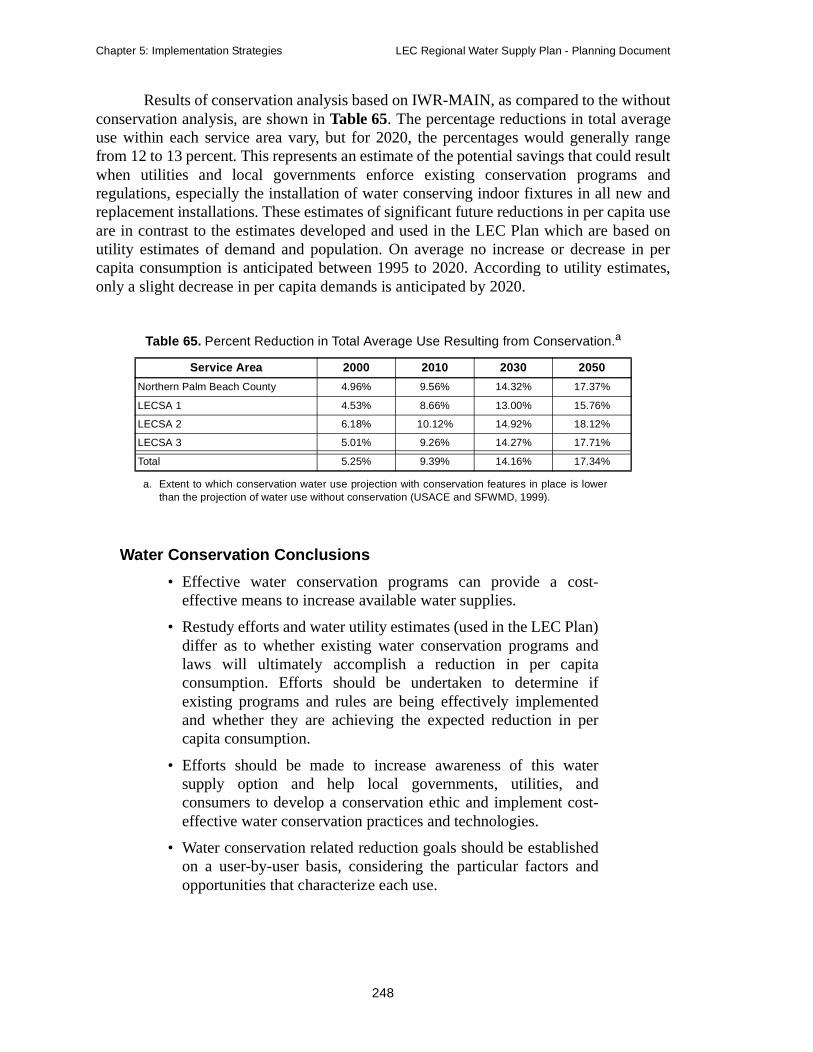
Chapter 5: Implementation Strategies LEC Regional Water Supply Plan - Planning Document
Results of conservation analysis based on IWR-MAIN, as compared to the withoutconservation analysis, are shown in Table 65. The percentage reductions in total averageuse within each service area vary, but for 2020, the percentages would generally rangefrom 12 to 13 percent. This represents an estimate of the potential savings that could resultwhen utilities and local governments enforce existing conservation programs andregulations, especially the installation of water conserving indoor fixtures in all new andreplacement installations. These estimates of significant future reductions in per capita useare in contrast to the estimates developed and used in the LEC Plan which are based onutility estimates of demand and population. On average no increase or decrease in percapita consumption is anticipated between 1995 to 2020. According to utility estimates,only a slight decrease in per capita demands is anticipated by 2020.
Water Conservation Conclusions
• Effective water conservation programs can provide a cost-effective means to increase available water supplies.
• Restudy efforts and water utility estimates (used in the LEC Plan)differ as to whether existing water conservation programs andlaws will ultimately accomplish a reduction in per capitaconsumption. Efforts should be undertaken to determine ifexisting programs and rules are being effectively implementedand whether they are achieving the expected reduction in percapita consumption.
• Efforts should be made to increase awareness of this watersupply option and help local governments, utilities, andconsumers to develop a conservation ethic and implement cost-effective water conservation practices and technologies.
• Water conservation related reduction goals should be establishedon a user-by-user basis, considering the particular factors andopportunities that characterize each use.
Table 65. Percent Reduction in Total Average Use Resulting from Conservation.a
a. Extent to which conservation water use projection with conservation features in place is lowerthan the projection of water use without conservation (USACE and SFWMD, 1999).
Service Area 2000 2010 2030 2050
Northern Palm Beach County 4.96% 9.56% 14.32% 17.37%
LECSA 1 4.53% 8.66% 13.00% 15.76%
LECSA 2 6.18% 10.12% 14.92% 18.12%
LECSA 3 5.01% 9.26% 14.27% 17.71%
Total 5.25% 9.39% 14.16% 17.34%
248

LEC Regional Water Supply Plan - Planning Document Chapter 5: Implementation Strategies
Surficial Aquifer Resources
Definition and Discussion
The surficial aquifers are the major source of water in the LEC Planning Area. TheSurficial Aquifer System (SAS) includes two major aquifers in the LEC Planning Area.The Biscayne aquifer is located within Miami-Dade, Broward, and southern Palm Beachcounties. An undifferentiated surficial aquifer is found in the remainder of Palm BeachCounty. The entire SAS is unconfined, consisting of varying amounts of limestone andsediments that extend from the land surface to the top of an intermediate confining unit.This intermediate confining unit consists of several hundred feet of low-permeabilityclays and marls and effectively separates the SAS from the underlying Floridan AquiferSystem (FAS) in much of the planning area. Almost all municipal and irrigation water isobtained from the SAS in South Florida.
The second aquifer system, the FAS, is divided into the upper and the lowerFloridan aquifers by a middle confining layer. The Floridan aquifer is a source of freshwater north of Lake Okeechobee (e.g., Orlando area), but moving south of LakeOkeechobee and into South Florida, the aquifer deepens and becomes more mineralized.The upper Floridan aquifer along the lower east coast, from Jupiter to south Miami, iscomprised of brackish water and in some cases is used as a source of water for reverseosmosis systems and for storage of potable water using ASR technology.
The lower Floridan is isolated from the upper Floridan by several hundreds of feetof confining units. The lower Floridan aquifer contains a highly transmissive, cavernouszone of limestone locally known as the boulder zone. Because this zone contains highlysaline water, it is not used as a source of drinking water and is not considered as a potentialsource of water in this plan.
Alter Secondary Canal Operations to Capture, Store, and Utilize Additional Local Water
This water supply option includes structural and operational changes that allowcapturing of additional runoff water which will be held in the secondary canal systems. Aportion of the water captured in the secondary canal systems will come from excess waterin the primary canal system, while some will be water captured within the secondarysystem itself. This option will also foster the utilization of this water by allowingappropriate reductions in water levels before water is obtained from regional sources toreplenish water in the secondary canal systems. One objective of this option is to stabilizethe salt front by holding higher surface and ground water levels in coastal areas. Higherground water levels should also help to recharge wellfields and decrease the frequency ofwater shortages. Modifying secondary canal operations will improve local water use andrecharge, and will help to reduce the need to bring water in from regional sources. Ifhigher water levels will be held, the potential impacts on flood protection must beconsidered.
249
Chapter 5: Implementation Strategies LEC Regional Water Supply Plan - Planning Document
This Broward County Secondary Canal Network is currently being implementedas part of the LEC Interim Plan and this plan recommends continuation and completion ofthat effort. A similar component is recommended under the CERP to enhance secondarycanal delivery capability in central and southeast coastal Broward County.
Utility Aquifer Storage and Recovery Systems
This water supply option involves the storage of surface water or surficial groundwater in the upper Floridan aquifer during periods of abundant water, and recovery of thatwater during dry periods. Utility ASR systems, in most cases, involve the storage oftreated water. Storage of water takes place during periods of low utility demands whenexcess treatment capacity is available. Recovery of the stored water takes place duringperiods of high demands to supplement treatment plant production.
Within the LEC Planning Area, this water supply option has been in use for severalyears by the City of Boynton Beach’s water utility. In addition, the Miami-Dade Water andSewer Department (WASD) has constructed several large ASR facilities which operateutilizing untreated ground water prior to treatment by the water plants. The LEC InterimPlan provided financial support for development of the Miami-Dade WASD ASRfacilities because of their positive impact on the regional water resources of the area.
Relocation or Expansion of Surficial Wellfields
This water supply option involves the development of surficial wellfields, anoption which is traditionally undertaken when developing or expanding surficial watertreatment facilities Locations of surficial water withdrawals are permittable if they meetthe reasonable-beneficial use test and will not cause saltwater intrusion or harm wetlandsor adjacent legal water users.
Information provided to the District by water utilities in the LEC Planning Area,indicates that many utilities are planning for additional surficial aquifer wellfieldexpansion. Twenty utilities reported that they expected additional production only fromexisting wellfields, while five reported that they will be developing wellfield capacity atnew locations. In addition, LEC planning efforts have identified a number of opportunitiesfor wellfield relocation. Moving existing demands to new locations could reduce oreliminate potential saltwater intrusion problems during dry periods and greatly increasethe ability to access water from the regional canal distribution system
Interconnections with Other Utilities
This water supply option makes use of interconnects between water utilities todeliver either raw or treated water from one utility to another. Interconnects are useful inmoving raw water from an area with adequate water resources to one where waterresources are limited. Utilities may also use treated water interconnections when oneutility has inadequate treatment capacity to meet its demands. Forty-five utilities in theLEC Planning Area have some form of interconnection with other utilities to providetransfer of water.
250
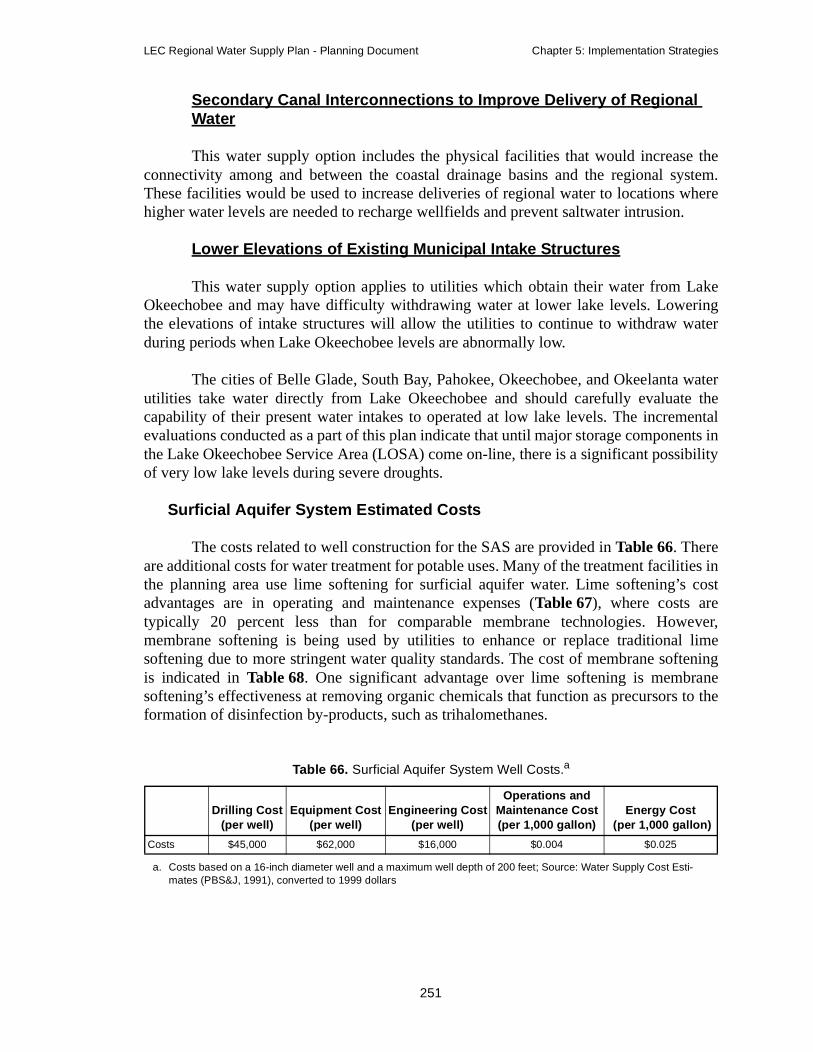
LEC Regional Water Supply Plan - Planning Document Chapter 5: Implementation Strategies
Secondary Canal Interconnections to Improve Delivery of Regional Water
This water supply option includes the physical facilities that would increase theconnectivity among and between the coastal drainage basins and the regional system.These facilities would be used to increase deliveries of regional water to locations wherehigher water levels are needed to recharge wellfields and prevent saltwater intrusion.
Lower Elevations of Existing Municipal Intake Structures
This water supply option applies to utilities which obtain their water from LakeOkeechobee and may have difficulty withdrawing water at lower lake levels. Loweringthe elevations of intake structures will allow the utilities to continue to withdraw waterduring periods when Lake Okeechobee levels are abnormally low.
The cities of Belle Glade, South Bay, Pahokee, Okeechobee, and Okeelanta waterutilities take water directly from Lake Okeechobee and should carefully evaluate thecapability of their present water intakes to operated at low lake levels. The incrementalevaluations conducted as a part of this plan indicate that until major storage components inthe Lake Okeechobee Service Area (LOSA) come on-line, there is a significant possibilityof very low lake levels during severe droughts.
Surficial Aquifer System Estimated Costs
The costs related to well construction for the SAS are provided in Table 66. Thereare additional costs for water treatment for potable uses. Many of the treatment facilities inthe planning area use lime softening for surficial aquifer water. Lime softening’s costadvantages are in operating and maintenance expenses (Table 67), where costs aretypically 20 percent less than for comparable membrane technologies. However,membrane softening is being used by utilities to enhance or replace traditional limesoftening due to more stringent water quality standards. The cost of membrane softeningis indicated in Table 68. One significant advantage over lime softening is membranesoftening’s effectiveness at removing organic chemicals that function as precursors to theformation of disinfection by-products, such as trihalomethanes.
Table 66. Surficial Aquifer System Well Costs.a
a. Costs based on a 16-inch diameter well and a maximum well depth of 200 feet; Source: Water Supply Cost Esti-mates (PBS&J, 1991), converted to 1999 dollars
Drilling Cost(per well)
Equipment Cost(per well)
Engineering Cost(per well)
Operations and Maintenance Cost(per 1,000 gallon)
Energy Cost (per 1,000 gallon)
Costs $45,000 $62,000 $16,000 $0.004 $0.025
251

Chapter 5: Implementation Strategies LEC Regional Water Supply Plan - Planning Document
Quantity of Water Potentially Available from the Surficial Aquifer System
From a regional perspective, increases in production from the Biscayne aquiferalong the coast beyond existing demands appears limited due to potential saltwaterintrusion. Based on this assessment, it was concluded the Biscayne aquifer is,nevertheless, sufficient to meet urban and agriculture demand through 2020. Some furtherdevelopment of the aquifer can be accomplished at the local level through modificationsto wellfield locations, configurations, and pumping regimes, and by increasing storage,such as through the use of reservoirs or ASR. Developing wellfield configurations andpumping regimes has been successfully used in most CUP activities to maximize use ofthe resource and avoid causing harm to natural systems. As a result, water availability willhave to be evaluated on a project-by-project basis in some areas. The volume of water thatcould be withdrawn by any specific user must be determined through the District’s CUPprogram.
Surficial Aquifer System Conclusions
• The SAS, including the Biscayne aquifer, is the primary source ofwater in the LEC Planning Area existing. Existing and newwellfields being developed are anticipated to provide most of thewater needed in the future so that approximately 1,200 MGD canbe consumed from this source for public water supply by 2020.
Table 67. Lime Softening Treatment Costs.a
Facility Size
(MGD)
Capital Cost(per gallon/
day capacity)
Engineering Cost(per gallon/
day capacity)
Land Requirements
(acres)
Operations and Maintenance Cost(per 1,000 gallon)
Energy Cost(per 1,000 gallons)
3 $1.63 $0.25 1.5 $0.60 $0.023
5 $1.57 $0.24 2.5 $0.56 $0.023
10 $1.53 $0.23 4.0 $0.50 $0.021
15 $1.26 $0.19 6.0 $0.41 $0.020
20 $1.13 $0.16 8.0 $0.38 $0.020
a. Source: Water Supply Cost Estimates (PBS&J, 1991), converted to 1999 dollars
Table 68. Membrane Softening Costs.a
Facility Size
(MGD)
Capital Cost(per gallon/
day capacity)
Engineering Cost(per gallon/
day capacity)
Land Requirements
(acres)
Operations and Maintenance Cost(per 1,000 gallon)
Energy Cost(per 1,000 gallons)
3 $1.67 $0.25 0.40 $0.55 $0.200
5 $1.52 $0.23 0.40 $0.53 $0.200
10 $1.41 $0.21 0.50 $0.50 $0.200
15 $1.38 $0.21 0.63 $0.48 $0.200
20 $1.33 $0.20 0.78 $0.46 $0.200
a. Source: Water Supply Cost Estimates (PBS&J, 1991), converted to 1999 dollars
252
LEC Regional Water Supply Plan - Planning Document Chapter 5: Implementation Strategies
• This water is generally of excellent quality, wells have excellentyields, and treatment costs are low.
• In some areas, withdrawals from the SAS are periodicallythreatened by saltwater intrusion and there is limited or no accessto water from the regional system. In areas where yields arelimited by low production rates, aquifer contamination, orsaltwater intrusion, alternative sources may be considered,including the need to relocate wellfields to safer and moreproductive locations.
Floridan Aquifer System
Definition and Discussion
The Floridan Aquifer System (FAS) underlies all of Florida and portions ofsouthern Georgia and Alabama. It is the principal source of water in Central Florida, butyields only nonpotable water throughout most of the LEC Planning Area. The quality ofwater in the FAS deteriorates southward, increasing in hardness and salinity. With depth,the salinity increases, making the deeper producing zones less suitable for the watersupply development than the shallower zones near the top of the aquifer. Within theplanning area, the FAS is not influenced by variations in rainfall.
Water from the shallow zones must be treated by desalination to produce a potableproduct. The most productive zones in the FAS are the lower Hawthorn and Suwanneeaquifers. Several utilities in the planning area are considering use of water from the FAS tomeet their needs. Elsewhere in the planning area, these aquifers supply only a fewagricultural irrigation wells. With continued growth and development in the LEC PlanningArea, these aquifers may become a significant source of water to meet the demand.Although desalination of the water will be necessary for potable use, blending of the rawwater with higher quality water could produce a product suitable for irrigation purposes.
In the deeper zone of the FAS, areas of extremely high transmissivity exist, termedboulder zones. These zones are not used for supply sources within the planning area due tohigh salinity and mineral content of the water. However, treated wastewater effluent andconcentrate or residual brines from the desalination process are injected into this zone as ameans of disposal. In addition, zones within the upper portion of the FAS are also used forASR. Utilities in Palm Beach, Broward, and Miami-Dade counties are currently testingthe feasibility of ASR.
Limited information, data, and experience are available regarding the use of theFAS within the LEC Planning Area. Some utilities are considering the use of the FAS tomeet existing and future demands. While water quality and the long-term sustainability ofthe FAS are concerns, significant changes in water quality are not anticipated.Development of a comprehensive FAS ground water model by the District for PalmBeach, Broward, and Miami-Dade counties to be used for predictive analysis in the future
253
Chapter 5: Implementation Strategies LEC Regional Water Supply Plan - Planning Document
is recommended. Currently, some local FAS models are being used. However, thesemodels have very limited capabilities based on the available hydraulic information.
Currently, utilities are drilling into the FAS in the LEC Planning Area for watersupply and wastewater disposal. The District should work in conjunction with water usersand utilities to gain water quality and hydraulic information related to these FAS welldrilling programs. Information could be gained via packer tests, coring/testing of specificintervals plus geophysical logging (e.g. permeability logs), and aquifer performancetesting. In most cases, these activities would be nominal compared to the actual welldrilling cost. The District should consider budgeting with utilities for this these items andcost-share for additional testing and data acquisition. It is also recommended that a FASmonitoring network be established to collect the data necessary to establish therelationships among water use, water levels, and water quality.
Recent improvements in low pressure membranes have reduced the electrical costsassociated with reverse osmosis systems. Because reverse osmosis pump powerconsumption is directly proportional to pressure, the low pressure systems can requiresignificantly less power. The reverse osmosis treatment costs presented herein do notreflect the recent improvements in membrane technology.
Floridan Aquifer System Blending
Under this water supply option, water utilities would blend brackish water fromthe FAS with Biscayne or surficial fresh water. Sodium concentration and other qualityconsiderations would limit the amount of Floridan water used in blending. The FAS in theLower East Coast Planning Area is a brackish aquifer that lies below the Biscayne aquiferand is separated from the Biscayne by approximately 700 feet of low permeabilitysediments. The ground water of the FAS is independent of the LEC Planning Area’ssurface water and SAS. The upper Floridan aquifer is preferred as a potential source ofwater for blending given its relatively low salinity.
Brackish Water Desalination
Under this water supply option, water utilities would use reverse osmosis or otherappropriate treatment process (electrodialysis or ion exchange) to recover fresh water thatmeets drinking water standards from the brackish water of the FAS that underlies the LECPlanning Area. The FAS lies below the Biscayne aquifer and is separated from theBiscayne by approximately 700 feet of low permeability sediments. The ground water ofthe deeper FAS is independent of the planning area’s surface water and the SAS. Theupper Floridan is preferred as a potential source for reverse osmosis treatment because ofits relatively low salinity levels. Reverse osmosis and distillation take the water out of thesalt solution. Electrodialysis and ion exchange take the salt out of the salt solution.Reverse osmosis is presently being used by a number of utilities in the planning area andmay become more common as it provides very good water and helps utilities meetdrinking water standards that are sometimes difficult to meet using conventional treatmenttechnologies.
254

LEC Regional Water Supply Plan - Planning Document Chapter 5: Implementation Strategies
Floridan Aquifer System Estimated Costs
The costs related to wellfield development of the FAS are provided in Table 69.Desalination treatment for potable water use, such as reverse osmosis (Table 70) andconcentrate disposal, incur additional costs (Table 71). Site-specific costs associated withreverse osmosis can vary significantly as a result of source water quality, concentratedisposal requirements, land costs, and use of existing water treatment plant infrastructure.As a general rule, reverse osmosis costs are 10 to 50 percent higher than lime softeningdepending on the water quality of the source water. For brackish water with total dissolvedsolids up to 10,000 mg/L, electrodialysis and electrodialysis reversal are generallyeffective, but cost about 5 to 10 percent higher than reverse osmosis treatment (BoyleEngineering, 1989).
Quantity of Water Potentially Available from the Floridan Aquifer System
Several utilities have recently considered use of the FAS. Limited information,data, and experience are available regarding the use of the FAS in the LEC Planning Area.Regional FAS ground water models do not exist for the LEC Planning Area. Theassessments within this plan did not incorporate a water quality component nor doessufficient data exist to conduct such an analysis. However, based on the limited data,knowledge, and experience in the LEC Planning Area, as well as FAS experience in otherareas, it was concluded that the FAS could support all of the existing and projecteddemands for the potable water utilities without causing significant changes in waterquality in the FAS. As stated previously, development of a FAS ground water model andmonitoring program are recommended for conducting predictive analyses in the future.
Table 69. Floridan Aquifer System Well Costs.a
a. Costs based on a 16-inch diameter well and a maximum well depth of 200 feet; Source: Water Supply Cost Esti-mates (PBS&J, 1991), converted to 1999 dollars
Drilling Cost(per well)
Equipment Cost(per well)
Engineering Cost(per well)
Operations and Maintenance Cost(per 1,000 gallon)
Energy Cost (per 1,000 gallon)
Costs $115,000 $65,000 $18,000 $.004 $.040
Table 70. Reverse Osmosis Costs to Treat Water from the Floridan Aquifer System.a
a. Costs based on 2,000 mg/L TDS, 400 PSI; Source: Water Supply Cost Estimates (PBS&J, 1991), converted to1999 dollars
Facility Size
(MGD)
Capital Cost(per gallon/
day capacity)
Engineering Cost(per gallon/
day capacity)
Land Requirements
(acres)
Operations and Maintenance Cost(per 1,000 gallon)
Energy Cost(per 1,000 gallons)
3 $1.76 $.26 .40 $.58 $.29
5 $1.59 $.24 .40 $.54 $.29
10 $1.47 $.23 .50 $.51 $.29
15 $1.43 $.21 .63 $.50 $.29
20 $1.46 $.20 .78 $.38 $.29
255
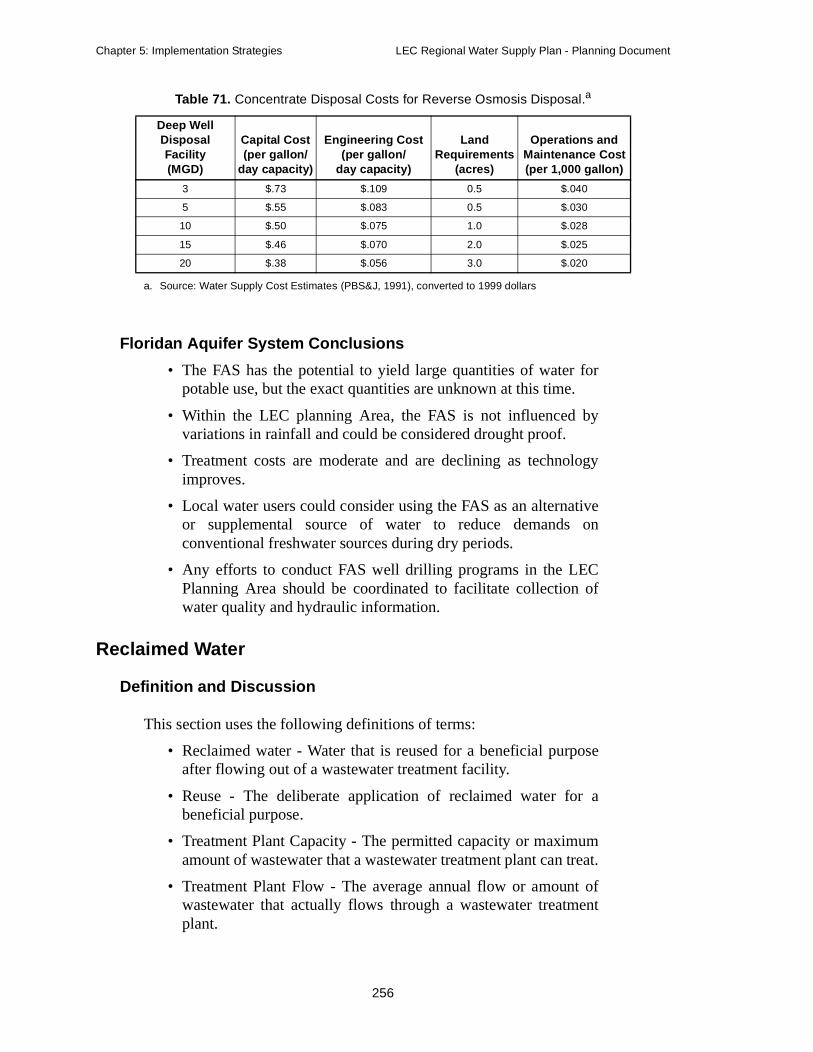
Chapter 5: Implementation Strategies LEC Regional Water Supply Plan - Planning Document
Floridan Aquifer System Conclusions
• The FAS has the potential to yield large quantities of water forpotable use, but the exact quantities are unknown at this time.
• Within the LEC planning Area, the FAS is not influenced byvariations in rainfall and could be considered drought proof.
• Treatment costs are moderate and are declining as technologyimproves.
• Local water users could consider using the FAS as an alternativeor supplemental source of water to reduce demands onconventional freshwater sources during dry periods.
• Any efforts to conduct FAS well drilling programs in the LECPlanning Area should be coordinated to facilitate collection ofwater quality and hydraulic information.
Reclaimed Water
Definition and Discussion
This section uses the following definitions of terms:
• Reclaimed water - Water that is reused for a beneficial purposeafter flowing out of a wastewater treatment facility.
• Reuse - The deliberate application of reclaimed water for abeneficial purpose.
• Treatment Plant Capacity - The permitted capacity or maximumamount of wastewater that a wastewater treatment plant can treat.
• Treatment Plant Flow - The average annual flow or amount ofwastewater that actually flows through a wastewater treatmentplant.
Table 71. Concentrate Disposal Costs for Reverse Osmosis Disposal.a
Deep Well Disposal Facility(MGD)
Capital Cost(per gallon/
day capacity)
Engineering Cost(per gallon/
day capacity)
Land Requirements
(acres)
Operations and Maintenance Cost(per 1,000 gallon)
3 $.73 $.109 0.5 $.040
5 $.55 $.083 0.5 $.030
10 $.50 $.075 1.0 $.028
15 $.46 $.070 2.0 $.025
20 $.38 $.056 3.0 $.020
a. Source: Water Supply Cost Estimates (PBS&J, 1991), converted to 1999 dollars
256

LEC Regional Water Supply Plan - Planning Document Chapter 5: Implementation Strategies
• Reuse Capacity - The permitted capacity or maximum amount ofreclaimed water that a reuse system can accommodate ordistribute.
• Reuse Flow - The average annual flow or amount of reclaimedwater actually being allocated or distributed to a reuse system oractivity.
In 1997, wastewater facilities in Palm Beach, Broward, Miami-Dade, and Monroecounties treated an average of 673 MGD of wastewater, of which 48 MGD (about sevenpercent) was reused. The treatment capacities and flows for facilities that provided reusewater during 1997 are listed in Table 72. Reuse of reclaimed water takes place when
Table 72. Domestic Wastewater Treatment Facilities Providing Reuse.
Facility Facility IDCapacity
(MGD)Flow
(MGD)
Palm Beach County
A Garden Walk FLA013735 0.10 0.08
Belle Glade Wastewater Treatment Plant (WWTP) FLA027740 3.00 2.70
Bryant Village/US Sugar Corporation FLA013704 0.17 0.07
City Of Boca Raton WWTP FL0026344 17.50 13.89
East Central Regional Wastewater Treatment Facility (WWTF) FLA013674 55.00 40.00
Loxahatchee Environmental Control District FL0034649 8.00 4.96
Okeelanta Corporation FLA013706 0.23 0.03
Palm Beach County Southern Regional Facility FLA041424 30.00 18.81
Royal Palm Beach Village WWTF FLA013749 2.20 1.73
Seacoast Utilities PGA FL0038768 8.00 6.55
South Central Regional WWTF FL0035980 24.00 16.50
Palm Beach County Total 148.20 105.32
Broward County
Broward County North Regional FL0031771 80.00 65.95
City of Hollywood FL0026255 42.00 35.00
City of Sunrise SW WWTF FLA013580 0.99 0.48
Plantation Regional WWTP FL0040401 15.00 12.58
Pompano Beach FLA013581 2.50 1.35
Broward County Total 140.49 115.36
Miami-Dade County
Homestead FLA013609 2.25 2.25
Krome Service Processing Center FLA013605 2.25 2.47
Miami-Dade WASD Southern District WWTF FL0042137 88.73 85.14
Miami-Dade Central District WWTF FLA024805 150.84 132.24
Miami-Dade Northern District WWTP FL0032182 116.94 98.77
Miami-Dade County Total 361.01 320.87
Monroe County
Duck Key WWTF FLA014772 0.10 0.10
Key West Resort Utility FLA014951 0.50 0.19
Monroe County Total 0.60 0.29
LEC Planning Area Total 650.30 541.84
257
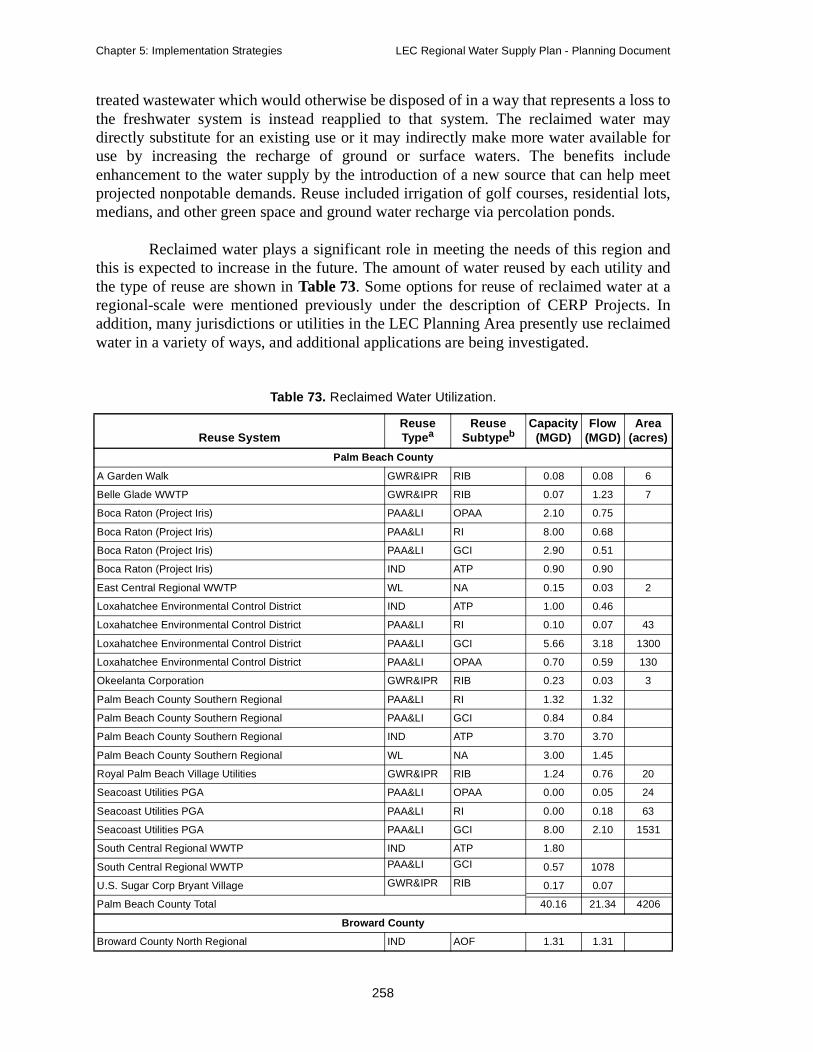
Chapter 5: Implementation Strategies LEC Regional Water Supply Plan - Planning Document
treated wastewater which would otherwise be disposed of in a way that represents a loss tothe freshwater system is instead reapplied to that system. The reclaimed water maydirectly substitute for an existing use or it may indirectly make more water available foruse by increasing the recharge of ground or surface waters. The benefits includeenhancement to the water supply by the introduction of a new source that can help meetprojected nonpotable demands. Reuse included irrigation of golf courses, residential lots,medians, and other green space and ground water recharge via percolation ponds.
Reclaimed water plays a significant role in meeting the needs of this region andthis is expected to increase in the future. The amount of water reused by each utility andthe type of reuse are shown in Table 73. Some options for reuse of reclaimed water at aregional-scale were mentioned previously under the description of CERP Projects. Inaddition, many jurisdictions or utilities in the LEC Planning Area presently use reclaimedwater in a variety of ways, and additional applications are being investigated.
Table 73. Reclaimed Water Utilization.
Reuse SystemReuse Typea
ReuseSubtypeb
Capacity (MGD)
Flow (MGD)
Area (acres)
Palm Beach County
A Garden Walk GWR&IPR RIB 0.08 0.08 6
Belle Glade WWTP GWR&IPR RIB 0.07 1.23 7
Boca Raton (Project Iris) PAA&LI OPAA 2.10 0.75
Boca Raton (Project Iris) PAA&LI RI 8.00 0.68
Boca Raton (Project Iris) PAA&LI GCI 2.90 0.51
Boca Raton (Project Iris) IND ATP 0.90 0.90
East Central Regional WWTP WL NA 0.15 0.03 2
Loxahatchee Environmental Control District IND ATP 1.00 0.46
Loxahatchee Environmental Control District PAA&LI RI 0.10 0.07 43
Loxahatchee Environmental Control District PAA&LI GCI 5.66 3.18 1300
Loxahatchee Environmental Control District PAA&LI OPAA 0.70 0.59 130
Okeelanta Corporation GWR&IPR RIB 0.23 0.03 3
Palm Beach County Southern Regional PAA&LI RI 1.32 1.32
Palm Beach County Southern Regional PAA&LI GCI 0.84 0.84
Palm Beach County Southern Regional IND ATP 3.70 3.70
Palm Beach County Southern Regional WL NA 3.00 1.45
Royal Palm Beach Village Utilities GWR&IPR RIB 1.24 0.76 20
Seacoast Utilities PGA PAA&LI OPAA 0.00 0.05 24
Seacoast Utilities PGA PAA&LI RI 0.00 0.18 63
Seacoast Utilities PGA PAA&LI GCI 8.00 2.10 1531
South Central Regional WWTP IND ATP 1.80
South Central Regional WWTP PAA&LI GCI 0.57 1078
U.S. Sugar Corp Bryant Village GWR&IPR RIB 0.17 0.07
Palm Beach County Total 40.16 21.34 4206
Broward County
Broward County North Regional IND AOF 1.31 1.31
258
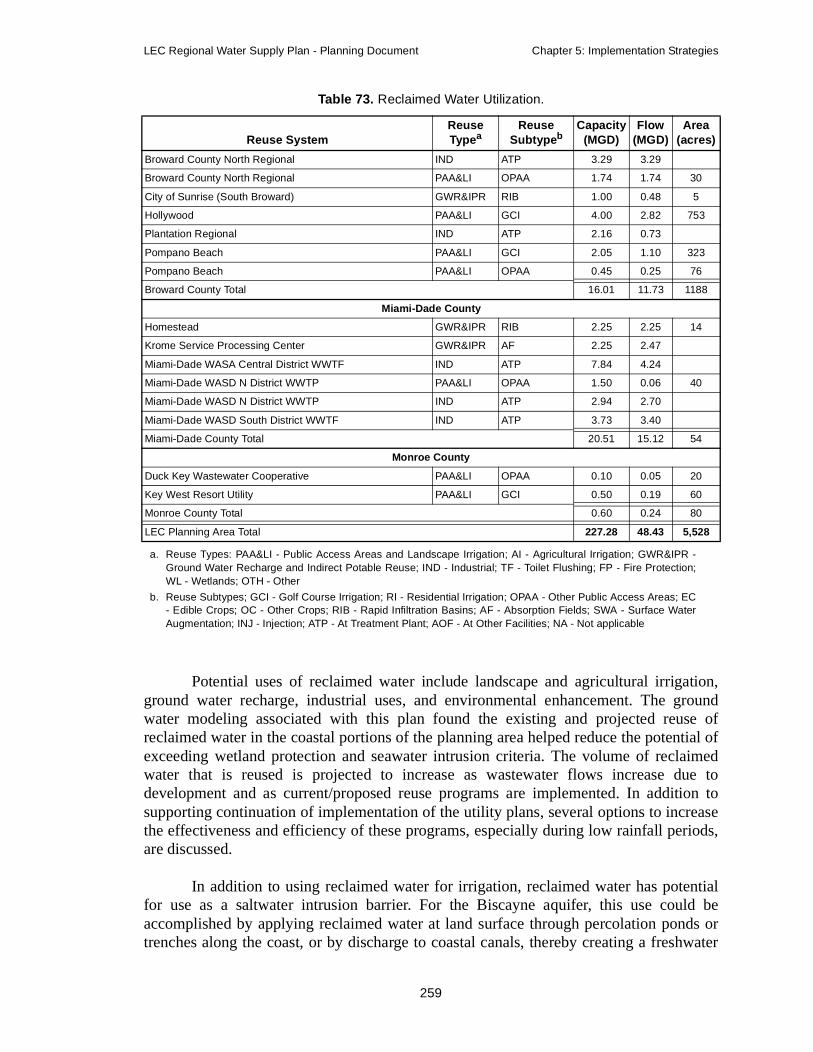
LEC Regional Water Supply Plan - Planning Document Chapter 5: Implementation Strategies
Potential uses of reclaimed water include landscape and agricultural irrigation,ground water recharge, industrial uses, and environmental enhancement. The groundwater modeling associated with this plan found the existing and projected reuse ofreclaimed water in the coastal portions of the planning area helped reduce the potential ofexceeding wetland protection and seawater intrusion criteria. The volume of reclaimedwater that is reused is projected to increase as wastewater flows increase due todevelopment and as current/proposed reuse programs are implemented. In addition tosupporting continuation of implementation of the utility plans, several options to increasethe effectiveness and efficiency of these programs, especially during low rainfall periods,are discussed.
In addition to using reclaimed water for irrigation, reclaimed water has potentialfor use as a saltwater intrusion barrier. For the Biscayne aquifer, this use could beaccomplished by applying reclaimed water at land surface through percolation ponds ortrenches along the coast, or by discharge to coastal canals, thereby creating a freshwater
Broward County North Regional IND ATP 3.29 3.29
Broward County North Regional PAA&LI OPAA 1.74 1.74 30
City of Sunrise (South Broward) GWR&IPR RIB 1.00 0.48 5
Hollywood PAA&LI GCI 4.00 2.82 753
Plantation Regional IND ATP 2.16 0.73
Pompano Beach PAA&LI GCI 2.05 1.10 323
Pompano Beach PAA&LI OPAA 0.45 0.25 76
Broward County Total 16.01 11.73 1188
Miami-Dade County
Homestead GWR&IPR RIB 2.25 2.25 14
Krome Service Processing Center GWR&IPR AF 2.25 2.47
Miami-Dade WASA Central District WWTF IND ATP 7.84 4.24
Miami-Dade WASD N District WWTP PAA&LI OPAA 1.50 0.06 40
Miami-Dade WASD N District WWTP IND ATP 2.94 2.70
Miami-Dade WASD South District WWTF IND ATP 3.73 3.40
Miami-Dade County Total 20.51 15.12 54
Monroe County
Duck Key Wastewater Cooperative PAA&LI OPAA 0.10 0.05 20
Key West Resort Utility PAA&LI GCI 0.50 0.19 60
Monroe County Total 0.60 0.24 80
LEC Planning Area Total 227.28 48.43 5,528
a. Reuse Types: PAA&LI - Public Access Areas and Landscape Irrigation; AI - Agricultural Irrigation; GWR&IPR -Ground Water Recharge and Indirect Potable Reuse; IND - Industrial; TF - Toilet Flushing; FP - Fire Protection;WL - Wetlands; OTH - Other
b. Reuse Subtypes; GCI - Golf Course Irrigation; RI - Residential Irrigation; OPAA - Other Public Access Areas; EC- Edible Crops; OC - Other Crops; RIB - Rapid Infiltration Basins; AF - Absorption Fields; SWA - Surface WaterAugmentation; INJ - Injection; ATP - At Treatment Plant; AOF - At Other Facilities; NA - Not applicable
Table 73. Reclaimed Water Utilization.
Reuse SystemReuse Typea
ReuseSubtypeb
Capacity (MGD)
Flow (MGD)
Area (acres)
259

Chapter 5: Implementation Strategies LEC Regional Water Supply Plan - Planning Document
mound that would impede the movement of salt water inland. Alternatively, a series ofinjection wells could be constructed along the coast to accomplish the same result.However, these methods would have to comply with federal and state undergroundinjection requirements.
Reclaimed Water Estimated Costs
The costs associated with implementation of a reclaimed water program can varysignificantly depending on the type of reuse system (i.e., ground water recharge, publicaccess irrigation, etc.), the capacity of the reclamation facility, treatment components, theextent of the reclaimed water distribution system, and regulatory requirements. Costsavings include negating the need for, or reducing the use of, alternative disposal systems;reducing the demand on ground water systems; and reducing the volume of potable waterused for irrigation.
For a reuse system that utilizes reclaimed water for public access irrigation, utilityrepresentatives indicated infrastructure cost would be approximately $1.00 per 1,000gallons, while the operation and maintenance of the system would be approximately $0.21per 1,000 gallons. For public access irrigation systems using reclaimed water, theinfrastructure cost would include the costs associated with construction of advancedsecondary treatment components including filtration, high level disinfection, onlinecontinuous water quality monitoring, storage, pumps, transmission, and distributionfacilities. Operation and maintenance costs would include chemical, pumping, andmaintenance for the treatment and distribution system.
Quantity of Water Potentially Available from Reclaimed Water
Table 73 indicates current wastewater facilities that are reusing wastewater have areuse capacity of 227 MGD and a current reuse flow of 48 MGD. An additional 23 utilitiesin the LEC Planning Area, with 177 MGD capacity and average flow of 131 MGD,presently do not reclaim water for reuse (Table 74). Hence, a capacity for development ofapproximately 356 MGD presently exists within the region. Water use within the regionwas about 784 MGD in 1995 and is projected to increase to 1,213 MGD by 2020, which isan increase of about 55 percent. If wastewater flow increases proportionally, thiscorresponds to about 1,050 MGD of wastewater flow. If the proportion of wastewater thatis reused remains the same, this translates to about 70 MGD. Present reuse capacity isabout 34 percent of total wastewater flow. If this proportion remains the same in thefuture, wastewater treatment would represent a capacity of about 357 MGD by 2020.
The potential need in the future to integrate water conservation and reclaimedwater systems has been considered. The concept is that reuse systems should be designedto apply reclaimed water to meet water supply needs and provide aquifer recharge, ratherthan as a system to make this water inaccessible.
260

LEC Regional Water Supply Plan - Planning Document Chapter 5: Implementation Strategies
Reclaimed Water Conclusions
• Only about 48 MGD of reclaimed water is used in the LECPlanning Area today, although the existing reuse capacity isabout 227 MGD.
• Reclaimed water has the potential to help meet irrigationdemands and to enhance regional resources, including wetlandsand aquifer systems and to help meet the freshwater flowrequirements of estuaries.
• If current trends continue, reuse capacity in the region couldincrease to 357 MGD by 2020.
Table 74. Disposal Facilitiesa with No Reuse.
Facility Facility IDCapacity
(MGD)Flow
(MGD)
Palm Beach County
Acme Improvement District FLA042595 3.00 2.40
East Central Regional WWTP FL0041360 55.00 40.00
Pahokee WWTP FLA136778 1.20 1.08
Pratt and Whitney FLA013693 0.22 0.09
South Bay WWTP FLA021300 1.42 0.78
Palm Beach County Total 60.84 44.35
Broward County
City of Margate East Plant FL0169617 2.20 0.00
City of Margate WWTP FL0041289 8.00 8.23
City of Miramar WWTF FLA017025 8.90 0.00
City of Pembroke Pines FLA013575 7.69 4.22
Cooper City West WWTP FL0040398 2.50 2.90
Coral Springs Improvement District WWTF FLA041301 5.50 5.00
Ferncrest FLA013583 0.60 0.30
Fort Lauderdale - G.T. Lohmeyer FL0041378 43.00 38.31
Sunrise No. 1 WWTF FLA041947 9.00 7.07
Sunrise No. 2 WWTP FLA042633 3.00 1.81
Sunrise No. 3 WWTP FLA042641 13.75 9.05
Town of Davie WWTP FL0040541 3.00 2.28
Broward County Total 107.14 79.17
Miami-Dade County
American Village MHP FLA013641 0.20 0.13
Cricket Club, The FLA013637 0.10 0.07
Miami-Dade County Total 0.30 0.20
Monroe County
Key Haven Utility FLA014867 0.20 0.19
North Key Largo WWTP FLA015009 0.55 0.29
Richard A. Heyman WWTP-Key FL0025976 7.20 7.20
Monroe County Total 7.95 7.68
LEC Planning Area Total 176.23 131.40
a. Domestic Wastewater Treatment Facilities
261
Chapter 5: Implementation Strategies LEC Regional Water Supply Plan - Planning Document
• Supplemental sources and interconnection with other utilitiesmay provide an effective means to improve the volume ofreclaimed water reused.
• The cost of using reclaimed water for irrigation greatly exceedsthe cost of available conventional supplies. However, in areaswhere conventional supplies are not available, reclaimed wateruse is cost-effective.
• Large-scale reclaimed water projects involving environmentalhydropattern enhancement and/or aquifer recharge haveregulatory issues which need to be carefully addressed for suchprojects to be cost-effective.
Seawater Desalination
Definition and Discussion
This water supply option involves using seawater from the Atlantic Ocean as a rawwater source. The Atlantic Ocean appears to be an unlimited source of water from aquantity perspective; however, removal of the salts is required before that water can beused for potable or irrigation purposes. A desalination treatment technology would have tobe used, such as distillation, reverse osmosis, or electrodialysis.
Seawater Estimated Costs
The cost of desalination of seawater is estimated to be significant, up to eight timesthe cost of reverse osmosis water from the FAS. In addition, reverse osmosis and facilitiestreating seawater would be expected to have an efficiency of 25 percent, resulting inincreased concentrate/reject water disposal needs compared to desalination of the brackishwater of the upper Floridan aquifer.
Tampa Bay Water, located in the Southwest Florida Water Management District, ismoving ahead to construct a seawater desalination treatment facility initially capable ofproducing 25 MGD of drinking water with estimated first year costs as low as $1.71 perthousand gallons, significantly lower than originally assumed and significantly below thecosts for water at similar plants under construction elsewhere. For example, in Singapore,a 36 MGD desalination plant is estimated to produce water that will cost between $7.52and $8.77 per thousand gallons.
Some of the factors reducing the cost of this facility include colocating the watertreatment plant with a power plant, using the power plant’s existing cooling waterdischarge system for concentrate disposal, and using the power plant’s existing facilitiesfor the intake to the water treatment plant. The District is in the process of solicitingproposals to conduct a feasibility study of colocating seawater reverse osmosis watertreatment facilities with coastal electrical power plants in the District's area of jurisdiction.
262
LEC Regional Water Supply Plan - Planning Document Chapter 5: Implementation Strategies
Seawater Desalination Conclusions
• Seawater desalination can provide an unlimited amount of highquality water for potable use.
• The costs of seawater desalination are generally high, dependingon the quality of source water, due primarily to high energy costsassociated with reverse osmosis. These costs are declining asreverse osmosis technology improves.
• Utilities considering seawater desalination should considercoordinating with the District and other agencies to examine theneed for this alternative, current trends in technology, and optionsto combine this approach with other methods.
Aquifer Storage and Recovery
Definition and Discussion
Aquifer Storage and Recovery (ASR) can be treated as either a regional waterresource project or as a local water supply option, depending on the project location, scale,and population served. Regional-scale applications of this technology were discussedpreviously. The following information provides general information that may be useful forplanning efforts by local utilities.
ASR is the underground storage of high quality water in an acceptable aquifer(typically the upper Floridan aquifer in the LEC Planning Area) through a well duringtimes when water is available, and the subsequent recovery of that water from that samewell during high demand periods. In other words, the aquifer acts as an undergroundreservoir for the injected water, reducing water loss due to evaporation.
Current regulations require injected water to meet drinking water standards whenthe receiving aquifer is classified as an Underground Source of Drinking Water (USDW)aquifer, unless an aquifer exemption is obtained from the U.S. Environmental ProtectionAgency (USEPA). Obtaining an aquifer exemption is a rigorous process and few havebeen approved. However, the USEPA has indicated a willingness to utilize a more flexiblepermitting approach for proposed ASR systems that can meet all drinking water standardswith the exception of coliform bacteria. This additional flexibility should assist inpermitting raw water ASR facilities in the LEC Planning Area.
Treated Water ASR
Treated water ASR involves using potable water as injection water. Since potablewater meets the drinking water standards, this type of ASR application is more easilypermitted. There are many examples in Florida, including several in the LEC PlanningArea, of utilities using treated water ASR. These include the city of Boynton Beach ASRfacility which has been in successful operation for several years.
263

Chapter 5: Implementation Strategies LEC Regional Water Supply Plan - Planning Document
Raw Water ASR
The development of raw water as a source for ASR systems is under way by someutilities in the LEC Planning Area. The Miami-Dade WASD has constructed several ASRwells in their wellfields, which will store untreated surficial aquifer water until it is neededby the system’s water treatment facilities. Currently, no operating, untreated, surface waterASR projects are located in Florida.
Reclaimed Water ASR
Reclaimed water ASR would involve using reclaimed water as the injection water.Currently, there are no operating, reclaimed water ASR projects in Florida. Severalcommunities in Florida are interested in reclaimed water ASR and are investigating thefeasibility of such a system.
Aquifer Storage and Recovery Estimated Costs
Estimated costs for an ASR system largely depend on whether the system requirespumping equipment. In Table 75, one system uses pressurized water from a utility,whereas the second ASR system uses unpressurized treated water, thus requiring pumpingequipment as part of the system cost. The latter system with its associated pumping costsis more indicative of an ASR system in combination with surface water storage. Screeningand filtering untreated surface water to remove floating and suspended matter may requireadditional costs.
Quantity of Water Potentially Available from Aquifer Storage and Recovery
The volume of water that could be made available through ASR wells dependsupon several local factors, such as well yield, water availability, variability in watersupply, and variability in demand. Without additional information, it is not possible toaccurately estimate the water that could be available through ASR in the LEC PlanningArea. Typical storage volumes for individual wells range from 10 to 500 million gallons
Table 75. Aquifer Storage and Recovery System Costs.a
a. Costs based on a 900-foot, 16-inch well, with two monitoring wells using treated water; Source: Water SupplyCost Estimates (PBS&J, 1991), converted to 1999 dollars
System
Cost
Well Drilling(per well)
Equipment(per well)
Engineering(per well)
Operations and Maintenance
(per 1,000 gallon)Energy
(per 1,000 gallon)
Treated Water at System Pressure
$250,000 $40,000 $450,000 $.005 $.08
Treated Water Requiring Pumping
$250,000 $125,000 $500,000 $.008 $.08
264
LEC Regional Water Supply Plan - Planning Document Chapter 5: Implementation Strategies
(31 to 1,535 ac-ft) (Pyne, 1995). Where appropriate, multiple ASR wells could beoperated as a wellfield, with the capacity determined from the recharge and/or recoveryperiods. All of the many applications of ASR store sufficient volumes (adequate volumesto meet the desired need) during times when water is available and recover it from thesame well(s) when needed. The storage time is usually seasonal, but can also be diurnal,long-term, or for emergencies. The volume of water that could be made available by anyspecific user must be determined through the District’s CUP program.
Aquifer Storage and Recovery Conclusions
• The primary options are underground (ASR) and aboveground(reservoir) facilities. Both options have significant costs forcapital facilities. Exact costs and yields for these systems dependon site-specific conditions.
• ASR has the advantage of providing (at least theoretically) alarger proportion of carryover storage capacity from one year tothe next. They have the disadvantage of only being able to handlea limited volume of flow.
• Combined systems that use ASR for long-term storage combinedwith reservoirs to capture large volume flows during storm eventsprovide maximum flexibility.
Reservoirs
Construction of reservoirs can also be treated as either a regional water resourceproject or as a local water supply option, depending on the project location, scale, andpopulation served. Regional scale applications of this technology were discussedpreviously. The following information provides general information that may be useful forplanning efforts by local utilities.
Definition and Discussion
This water supply option involves the capture and storage of excess surface waterduring rainy periods and subsequent release during drier periods for environmental andhuman uses. Regionally, surface water storage could be used to attenuate freshwater flowsto the St. Lucie or Caloosahatchee estuaries during rainy periods and meet minimum flowsduring drier periods. Similar facilities could also be used in the EAA to regulate the flowof water south into the Everglades. Such facilities, on a smaller scale, could increasesurface water availability for current and projected uses, and decrease the demand onaquifer and regional systems. However, evaporative and seepage losses could significantlyaffect water availability and need to be considered.
Strategically located surface water storage (primarily storage in combination withimproved storm water management systems) could recharge SAS wellfields, reduce thepotential for saltwater intrusion, and reduce drawdowns under wetlands. On-site storage inagricultural areas may reduce the need for water from the regional canal system and
265
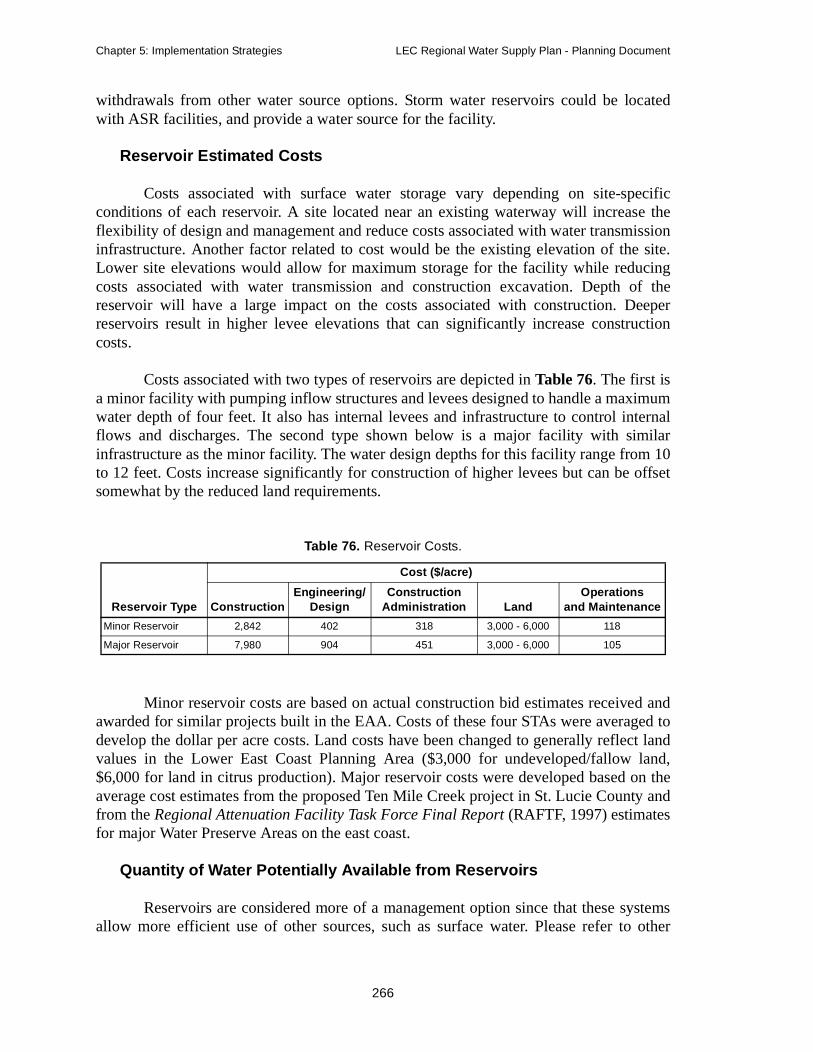
Chapter 5: Implementation Strategies LEC Regional Water Supply Plan - Planning Document
withdrawals from other water source options. Storm water reservoirs could be locatedwith ASR facilities, and provide a water source for the facility.
Reservoir Estimated Costs
Costs associated with surface water storage vary depending on site-specificconditions of each reservoir. A site located near an existing waterway will increase theflexibility of design and management and reduce costs associated with water transmissioninfrastructure. Another factor related to cost would be the existing elevation of the site.Lower site elevations would allow for maximum storage for the facility while reducingcosts associated with water transmission and construction excavation. Depth of thereservoir will have a large impact on the costs associated with construction. Deeperreservoirs result in higher levee elevations that can significantly increase constructioncosts.
Costs associated with two types of reservoirs are depicted in Table 76. The first isa minor facility with pumping inflow structures and levees designed to handle a maximumwater depth of four feet. It also has internal levees and infrastructure to control internalflows and discharges. The second type shown below is a major facility with similarinfrastructure as the minor facility. The water design depths for this facility range from 10to 12 feet. Costs increase significantly for construction of higher levees but can be offsetsomewhat by the reduced land requirements.
Minor reservoir costs are based on actual construction bid estimates received andawarded for similar projects built in the EAA. Costs of these four STAs were averaged todevelop the dollar per acre costs. Land costs have been changed to generally reflect landvalues in the Lower East Coast Planning Area ($3,000 for undeveloped/fallow land,$6,000 for land in citrus production). Major reservoir costs were developed based on theaverage cost estimates from the proposed Ten Mile Creek project in St. Lucie County andfrom the Regional Attenuation Facility Task Force Final Report (RAFTF, 1997) estimatesfor major Water Preserve Areas on the east coast.
Quantity of Water Potentially Available from Reservoirs
Reservoirs are considered more of a management option since that these systemsallow more efficient use of other sources, such as surface water. Please refer to other
Table 76. Reservoir Costs.
Reservoir Type
Cost ($/acre)
ConstructionEngineering/
DesignConstruction
Administration LandOperations
and Maintenance
Minor Reservoir 2,842 402 318 3,000 - 6,000 118
Major Reservoir 7,980 904 451 3,000 - 6,000 105
266
LEC Regional Water Supply Plan - Planning Document Chapter 5: Implementation Strategies
source option descriptions for an estimate regarding the quantity of water that potentiallycould be made available.
Reservoir Conclusions
• Storage is used to provide carryover capacity so that excess waterthat falls on South Florida during the rainy season can be laterused to meet water demands during the dry season.
• The primary options are underground (ASR) and aboveground(reservoir) facilities. Both options have significant costs forcapital facilities. Exact costs and yields for these systems dependon site-specific conditions.
• ASR has the advantage of providing (at least theoretically) alarger proportion of carryover storage capacity from one year tothe next. They have the disadvantage of only being able to handlea limited volume of flow.
• Surface water reservoirs can handle larger volumes of flow, butlose water over time to seepage and evaporation.
• Combined systems that use ASR for long-term storage combinedwith reservoirs to capture large volume flows during storm eventsprovide maximum flexibility.
Surface Water
Definition and Discussion
This water supply option involves the use of surface water as a supply source.Surface water bodies in the LEC Planning Area include lakes, rivers, and canals. LakeOkeechobee is the largest lake within the planning area, and a primary source of watersupply throughout South Florida, including the direct use by local utilities surrounding thelake and as a reservoir to supply the LEC Planning Area. Surface water is also used by theCity of West Palm Beach through a system of lakes and wetlands that ultimately connectsto the L-8 Canal and Lake Okeechobee. Surface water from Lake Okeechobee and theWCAs can be transported via the regional canal system to provide recharge for localwellfields.
No additional potential natural sources of surface water were identified in theregion that should be considered to meet future demands. The LEC Planning Area hasbeen impacted significantly by development of land for agricultural and urban uses. Thisdevelopment has changed the volume and timing of surface water runoff and had negativeimpacts on estuarine systems. This excess runoff is being evaluated throughout theplanning area to increase water availability to meet current and future needs by capturingexcess surface water that would otherwise harm South Florida's coastal resources.
267
Chapter 5: Implementation Strategies LEC Regional Water Supply Plan - Planning Document
In the future, extensive construction of reservoirs and man-made lakes has beenproposed within the region in conjunction with the Everglades Construction Project, theCERP, and the Water Preserve Areas Feasibility Study. All of these systems have somepotential capability to provide water supply benefits that will be evaluated and optimizedduring their design and construction. In addition, opportunities may exist for localgovernments and private interests to create surface water impoundments or reservoirs tomeet localized water needs.
Other Potential Surface Water Sources
Another potential use for surface water systems in the LEC Planning Area is toprovide supplemental sources to reclaimed water systems, when water is available, and aspotential sources to capture and store (primarily through ASR) excess surface waterduring the wet season for use during the dry season.
Several considerations need to be addressed in evaluating surface wateravailability, including seasonal fluctuations, environmental needs both upstream anddownstream, storage options, restoration efforts, and treatment costs. Several restorationprojects are under way or proposed in the region that use natural or artificial lakes orwetlands as components of local water supply and treatment systems, or that use treatedwastewater to supplement natural water flows.
Surface Water Conclusions
• No suitable natural surface water sources for water supplydevelopment have been identified in the region.
• MFLs are being developed that will greatly affect the amount andtiming of water deliveries that can be obtained from naturalsystems.
• In the future, regional surface water man-made lakes,impoundments, and reservoirs may be constructed. The watersupply capabilities of such systems will be evaluated in theprocess of their design and construction.
• Construction of smaller facilities may also be appropriate to meetlocalized needs.
• Utilities should consider using excess surface water as a means tosupplement existing reclaimed water sources and maximizereclaimed water use.
CONCLUSIONS
The assessments presented in Chapter 4 indicated that the proposed waterresource development projects included in the alternatives, along with appropriate watersupply development and operational assumptions would provide the target 1-in-10 yearlevel of certainty. In this chapter, the water resource development projects were identified
268
LEC Regional Water Supply Plan - Planning Document Chapter 5: Implementation Strategies
and described. It is these projects which will be recommended in Chapter 6. Additionalinformation on a large set of water supply options is also provided. Water users can selectfrom among the permittable implementations of these options in determining theirpreferred water supply development actions.
Water Resource Development Projects
LEC Interim Plan. The projects begun as part of the LEC Interim Plan need tobe completed. In addition there are several projects which were developed based on thesubregional, integrated, water supply planning processes undertaken as part of the LECInterim Plan implementation.
Other Federal, State, or District Projects. The West Canal C-4 CanalStructure and the Western C-11 Water Treatment projects are critical projects which arebeing implemented in partnership with the federal government. Two other projectsproposed in the CWMP address uncontrolled flows from abandoned wells and saltwaterproblems in the Caloosahatchee River. Permitting issues associated with ASR systems andreclaimed water and a specific water conservation effort, Mobile Irrigation Labs (MILs),suitable for implementation regionwide, are also included.
CERP Projects. These projects form the backbone of the water resourcedevelopment projects included as part of the LEC Plan.
Recommendations to the CERP Program from the LEC Plan and theCWMP. Based on the modeling analyses performed for the LEC Plan and the CWMP,recommendations have been made regarding directions and approaches that should beincluded in the planning and design of CERP projects.
Operational Strategies. These projects will improve the water shortagepolicies and supply-side management to reduce the impacts of droughts on water userswithout compromising performance in meeting environmental goals. Theserecommendations are particularly important given the difficulties expected in meetingwater supply performance goals until structural improvements included in this plan begincoming on-line after 2005. These difficulties are evidenced by the results of theincremental simulations (Chapter 4).
Consumptive Use Permitting and Resource Protection. These projectsprovide for reservations of water, develop MFLs, and specify MFL recovery andprevention strategies, as needed to meet legislative requirements and support theimplementation of the LEC Plan.
Other Projects. These projects will provide key information to support theadditional planning that will be undertaken for the update of the LEC Plan. The firstproject will evaluate the success of existing conservation programs, requirements, andregulations, as well as further promote implementation of conservation opportunities. Theother three projects will provide key information regarding the feasibility of additional
269

Chapter 5: Implementation Strategies LEC Regional Water Supply Plan - Planning Document
innovative reuse systems and saltwater reverse osmosis systems and their potential role infurther water resource development.
Water Supply Development Options
Water supply development options presented in this chapter should serve as amenu that local water users can consider in determining their preferred water supplydevelopment actions. Information is provided on water supply development options thatutilize conservation, SAS and FAS resources, reclaimed water, seawater desalination,storage, and surface water.
270

LEC Regional Water Supply Plan - Planning Document Chapter 6: Recommendations
Chapter 6RECOMMENDATIONS
INTRODUCTION
This chapter presents 46 recommendations that have been developed to implementthe Lower East Coast Regional Water Supply Plan (LEC Plan). The preceding chapteridentified water source options that form a basis for water resource development projects.Water resource development projects are generally those projects that are beyond thescope of traditional local water supply development efforts. Chapter 5 described waterresource development projects for the region and estimated the quantities of water thatwould be made available. The purpose of this chapter is to provide additional informationregarding the resources needed to implement these projects and their expected outputsduring the next five years.
Chapter 5 also described a number of water source options that can form a basisfor water supply development projects. These options are available to water users to helpmeet their existing and future water supply needs. This chapter recommends thatindividual water users in locations where local water supplies are constrained evaluatethese water source options for applicability to their local conditions.
Water Resource Development Projects
Water resource development projects for the Lower East Coast (LEC) PlanningArea are grouped by the scope and nature of the recommended project as follows:
1. Ongoing projects from the Interim Plan for Lower East CoastRegional Water Supply (LEC Interim Plan) (SFWMD, 1998b)
2. Other federal, state, and South Florida Water ManagementDistrict (District, SFWMD) projects
3. Comprehensive Everglades Restoration Plan (CERP) projects
4. Recommendations to the CERP resulting from analysisperformed during the LEC regional water supply planningprocess
5. Recommendations to the CERP from the Caloosahatchee WaterManagement Plan (CWMP) (SFWMD, 2000d)
6. Operational recommendations resulting from LEC water supplyplanning process analysis
7. Consumptive use permitting and resource protection projects
8. Other water resource development projects
271

Chapter 6: Recommendations LEC Regional Water Supply Plan - Planning Document
Potential funding sources for these projects were discussed and a funding strategywas proposed. The Florida Legislature passed the Everglades Restoration Investment Actof 2000, enacting the Governor’s proposal for CERP funding. Funding will be consistentwith the Governor’s plan for CERP funding and will be approved by the District’sGoverning Board
At the District level, the recommendations of the final LEC Plan were approved bythe Governing Board and incorporated into the Five-Year Water Resource DevelopmentWork Program, which documents the District’s progress in water supply planimplementation. It must be submitted to the Florida Department of EnvironmentalProtection (FDEP) annually (before October 1) for review and approval.
The Five-Year Water Resource Development Work Program will also be subject toDistrict Governing Board approval and budgetary appropriation each Fiscal Year (FY)1.At this time, the implementation schedule for each recommendation has not taken intoaccount other District financial and human resource commitments, as well ascommitments that will be generated through approval of the other regional water supplyplans currently under development. Thus, schedules identified in the LEC Plan are subjectto change based on future District resource and budgetary constraints.
Water Supply Development Projects
Water supply development recommendations, or water source options, areprovided for consideration by local governments, water users, and utilities, and areprincipally the responsibility of users. Water supply development projects may be eligiblefor District funding assistance, if they meet appropriate criteria explained in Section373.0831, F.S., and the funding section of this chapter. Funding for water supplydevelopment projects is contingent upon the priorities of the Governing Board in light ofall other resource or budgetary constraints.
WATER RESOURCE DEVELOPMENT PROJECTS
The water resource development projects are presented in the form ofrecommendations. Each recommendation, or project, contains a discussion; a list ofsubtasks (if applicable); the cost to nonfederal entities, which will primarily be borne bythe District; total District FTEs2; funding sources, and implementing agencies. The costsand FTEs are also broken down by fiscal year and presented in a table.
Ongoing Projects from the LEC Interim Plan
Significant water supply planning projects were initiated with the completion ofthe LEC Interim Plan, approved by the Governing Board in March 1998. A number of
1. The District’s fiscal year begins on October 1 and ends on September 30.2. FTE = Full Time Equivalent, which is a worker who works 40 hours each week
272

LEC Regional Water Supply Plan - Planning Document Chapter 6: Recommendations
these projects involve capital expenditures on the part of the District or its partners, andmust be continued to completion. The majority of these projects will be concluding priorto the next update of the LEC Plan and the five-year projections reflect this fact.
Recommendation 1: Regional Saltwater Intrusion Management
Discussion
The water supply planning process requires that the position of the saltwaterinterface be monitored and the factors causing its movement to be understood.Historically, the District’s objective for monitoring has been more to support thedevelopment of ground water flow models than to monitor inland saltwater intrusion. TheLEC Interim Plan recommended the existing saltwater intrusion monitoring program beevaluated to ensure its reliability in detecting the movement of the saltwater interface anda sampling plan and maintenance schedule be proposed. As a result, six new wells wereadded to fill data gaps in Palm Beach County. Additional wells and other improvements,plus subsequent data collection, have been undertaken cooperatively with Broward andMiami-Dade counties. These improvements should continue and the data should beincorporated into the future LEC planning analyses, including additional ground watermodeling for the future updates of the LEC Plan. The status of the monitoring networkwill be reassessed during the LEC Plan update and further improvements may beconsidered at that time.
The minimum Biscayne aquifer ground water levels which can be sustainedwithout causing significant harm to the aquifer through saltwater intrusion are difficult topredict. Therefore, as recommended in the Draft Minimum Flows and Levels for LakeOkeechobee, the Everglades, and the Biscayne Aquifer (SFWMD, 2000e), further researchwill be conducted to refine the relationship between saltwater migration and stageelevations in the Biscayne aquifer. Additionally, a detailed model will be developed thatcan adequately simulate movement of the saline interface under transient conditions.
In addition, CERP’s REstoration, COordination and VERification (RECOVER)team may develop updated surface and ground water flows for Biscayne Bay and FloridaBay that relate to ground water levels and saltwater intrusion. Aquifer monitoringassociated with CERP may be eligible for federal cost sharing in future years.
Subtasks
Task 1a. Monitor new network
Task 1b. Develop model to simulate the movement of the saline interface
Summary Information
Cost: $973,000 over the first five years; $2,280,000 over the next 15 years
FTEs: 2.0 for the first five years
273
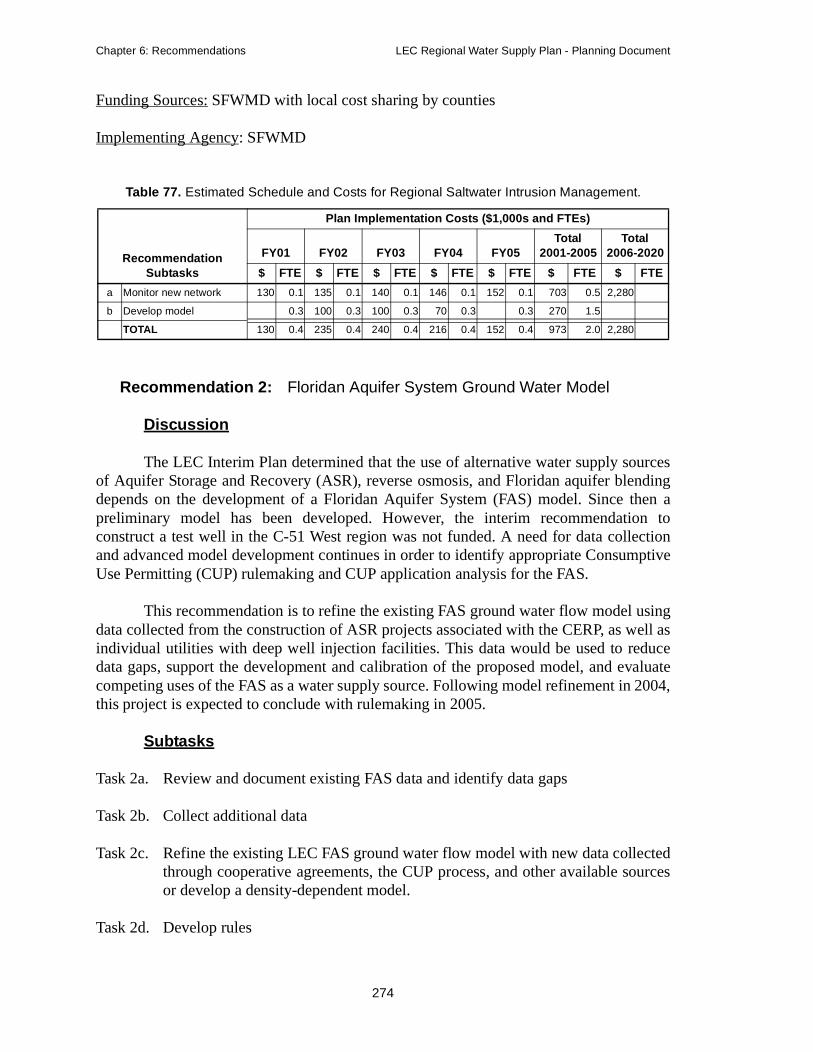
Chapter 6: Recommendations LEC Regional Water Supply Plan - Planning Document
Funding Sources: SFWMD with local cost sharing by counties
Implementing Agency: SFWMD
Recommendation 2: Floridan Aquifer System Ground Water Model
Discussion
The LEC Interim Plan determined that the use of alternative water supply sourcesof Aquifer Storage and Recovery (ASR), reverse osmosis, and Floridan aquifer blendingdepends on the development of a Floridan Aquifer System (FAS) model. Since then apreliminary model has been developed. However, the interim recommendation toconstruct a test well in the C-51 West region was not funded. A need for data collectionand advanced model development continues in order to identify appropriate ConsumptiveUse Permitting (CUP) rulemaking and CUP application analysis for the FAS.
This recommendation is to refine the existing FAS ground water flow model usingdata collected from the construction of ASR projects associated with the CERP, as well asindividual utilities with deep well injection facilities. This data would be used to reducedata gaps, support the development and calibration of the proposed model, and evaluatecompeting uses of the FAS as a water supply source. Following model refinement in 2004,this project is expected to conclude with rulemaking in 2005.
Subtasks
Task 2a. Review and document existing FAS data and identify data gaps
Task 2b. Collect additional data
Task 2c. Refine the existing LEC FAS ground water flow model with new data collectedthrough cooperative agreements, the CUP process, and other available sourcesor develop a density-dependent model.
Task 2d. Develop rules
Table 77. Estimated Schedule and Costs for Regional Saltwater Intrusion Management.
Recommendation Subtasks
Plan Implementation Costs ($1,000s and FTEs)
FY01 FY02 FY03 FY04 FY05Total
2001-2005Total
2006-2020
$ FTE $ FTE $ FTE $ FTE $ FTE $ FTE $ FTE
a Monitor new network 130 0.1 135 0.1 140 0.1 146 0.1 152 0.1 703 0.5 2,280
b Develop model 0.3 100 0.3 100 0.3 70 0.3 0.3 270 1.5
TOTAL 130 0.4 235 0.4 240 0.4 216 0.4 152 0.4 973 2.0 2,280
274

LEC Regional Water Supply Plan - Planning Document Chapter 6: Recommendations
Summary Information
Cost: $555,000 over five years
FTEs: 8.5
Funding Sources: CERP (data collection from regional ASR facilities), SFWMD, waterusers, and utilities
Implementing Agency: SFWMD
Recommendation 3: Northern Palm Beach County Comprehensive Water Management Plan
Discussion
Since 1995, the city of West Palm Beach and the District have cofunded acooperative planning effort to develop a comprehensive water management plan for muchof northern Palm Beach County. The plan focuses primarily on land areas located withinthe Southern L-8 Basin, the city of West Palm Beach Water Catchment Area/water supplylake system, Loxahatchee Slough, and associated tributary areas (known collectively asthe C-18 Basin). The theme of the plan is consistent with the LEC Plan and the CERP, butit also addresses concerns specific to the subregion.
The planning effort includes two phases. During Phase I, completed in 1997, acomputer model was developed capable of evaluating the hydrologic, hydraulic, and waterquality effects of conceptual water management options for the study area. Phase II watermanagement options have been developed with input from interested and potentiallyaffected stakeholders using the computer model developed in Phase I. The completion ofthe options analysis is forthcoming once additional modeling simulations have beencompleted.
Table 78. Estimated Schedule and Costs for Refining the FAS Ground Water Model.
Recommendation Subtasks
Plan Implementation Costs ($1,000s and FTEs)
FY01 FY02 FY03 FY04 FY05Total
2001-2005
$ FTE $ FTE $ FTE $ FTE $ FTE $ FTE
a Data review and documentation
0.5 0.5
b Collect additional data 125 1.6 75 0.8 10 0.2 10 0.2 10 0.2 230 3.0
c Refine FAS model 200 2.0 75 1.0 50 0.5 325 3.5
d Rule development 1.5 1.5
TOTAL 125 2.1 75 0.8 210 2.2 85 1.2 60 2.2 555 8.5
275

Chapter 6: Recommendations LEC Regional Water Supply Plan - Planning Document
Since the interim plan document was completed in March 1998, many planningand implementation efforts are moving forward in northern Palm Beach County. Thefollowing is a list of these efforts: continuation of annual water quality monitoring in theL-8 Basin; a contract for the M Canal widening which began in July 1999; surface andground water modeling; discussion of private/public funding for the Loxahatchee Sloughstructure; and a General Reevaluation Report (GRR) for the L-8 Basin. The schedule forthe completion of these are in Table 79. The schedule for the Palm Beach Aggregate GRRis found in Volume 9 of the Central and Southern Florida Project Comprehensive ReviewStudy Final Integrated Feasibility Report and Programmatic Environmental ImpactStatement (Restudy) (USACE and SFWMD, 1999).
The Northern Palm Beach County Comprehensive Water Management Plan willbe completed in 2000. Development of Memorandums of Understanding (MOUs) amongthe northern Palm Beach County partners needs to be completed to aid in solidifying theoperations of this plan. Additional ground water and surface water modeling simulationsare also needed. Components of the Northern Palm Beach County Comprehensive WaterManagement Plan will be implemented through the CERP’s Project ImplementationReports (PIRs), and the LEC Plan, with funding from other appropriate federal processes.The PIRs for features in northern Palm Beach County are scheduled to begin in 2002 andend in 2014.
Subtasks
Task 3a. Complete the Northern Palm Beach County Comprehensive WaterManagement Plan.
Task 3b. Continue the M Canal widening contract and complete the improvements to theControl 2 Structure
Task 3c. Identify private/local funding of the Loxahatchee Slough Structure
Task 3d. Continue annual L-8 Basin water quality monitoring
Task 3e. Develop MOUs between northern Palm Beach County partners to implementportions of the Northern Palm Beach County Comprehensive WaterManagement Plan
Task 3f. Complete construction of the Beeline Water Control Structure with local partner
Summary Information
Cost: $2,591,000 over three years
FTEs: 2.9
Funding Sources: City of West Palm Beach, Indian Trail Improvement District, PalmBeach County, CERP and other federal sources, and SFWMD
276
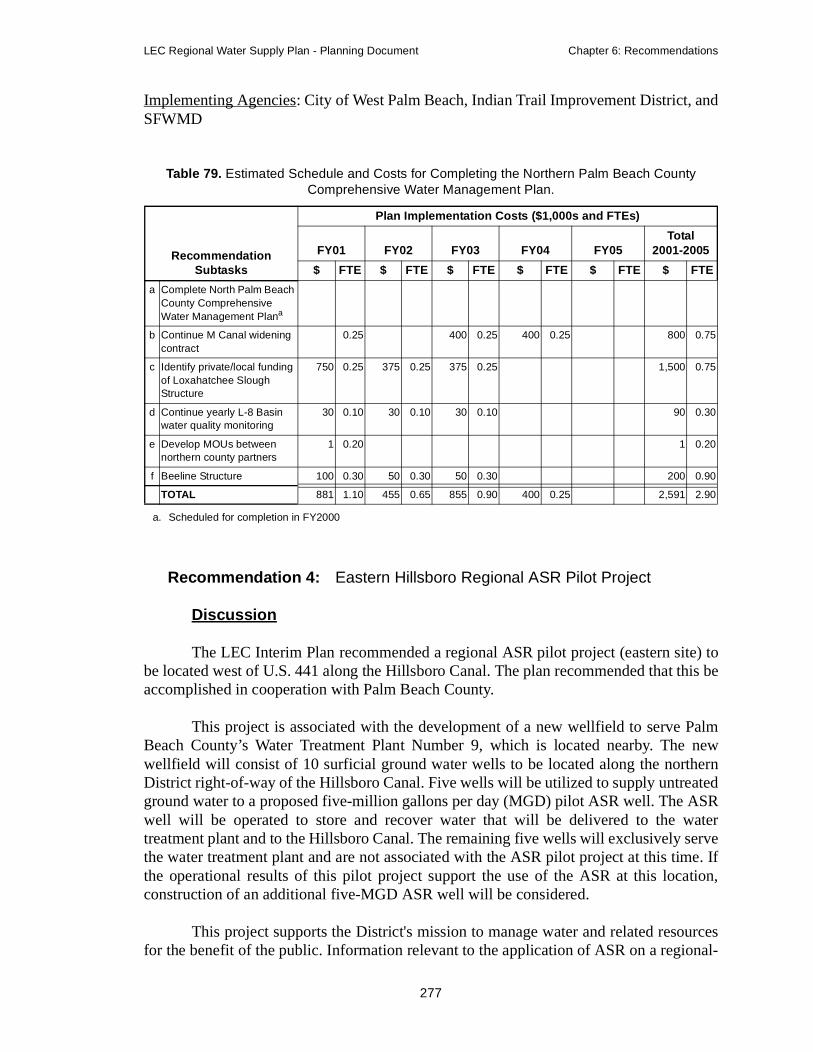
LEC Regional Water Supply Plan - Planning Document Chapter 6: Recommendations
Implementing Agencies: City of West Palm Beach, Indian Trail Improvement District, andSFWMD
Recommendation 4: Eastern Hillsboro Regional ASR Pilot Project
Discussion
The LEC Interim Plan recommended a regional ASR pilot project (eastern site) tobe located west of U.S. 441 along the Hillsboro Canal. The plan recommended that this beaccomplished in cooperation with Palm Beach County.
This project is associated with the development of a new wellfield to serve PalmBeach County’s Water Treatment Plant Number 9, which is located nearby. The newwellfield will consist of 10 surficial ground water wells to be located along the northernDistrict right-of-way of the Hillsboro Canal. Five wells will be utilized to supply untreatedground water to a proposed five-million gallons per day (MGD) pilot ASR well. The ASRwell will be operated to store and recover water that will be delivered to the watertreatment plant and to the Hillsboro Canal. The remaining five wells will exclusively servethe water treatment plant and are not associated with the ASR pilot project at this time. Ifthe operational results of this pilot project support the use of the ASR at this location,construction of an additional five-MGD ASR well will be considered.
This project supports the District's mission to manage water and related resourcesfor the benefit of the public. Information relevant to the application of ASR on a regional-
Table 79. Estimated Schedule and Costs for Completing the Northern Palm Beach County Comprehensive Water Management Plan.
Recommendation Subtasks
Plan Implementation Costs ($1,000s and FTEs)
FY01 FY02 FY03 FY04 FY05Total
2001-2005
$ FTE $ FTE $ FTE $ FTE $ FTE $ FTE
a Complete North Palm Beach County Comprehensive Water Management Plana
a. Scheduled for completion in FY2000
b Continue M Canal widening contract
0.25 400 0.25 400 0.25 800 0.75
c Identify private/local funding of Loxahatchee Slough Structure
750 0.25 375 0.25 375 0.25 1,500 0.75
d Continue yearly L-8 Basin water quality monitoring
30 0.10 30 0.10 30 0.10 90 0.30
e Develop MOUs between northern county partners
1 0.20 1 0.20
f Beeline Structure 100 0.30 50 0.30 50 0.30 200 0.90
TOTAL 881 1.10 455 0.65 855 0.90 400 0.25 2,591 2.90
277
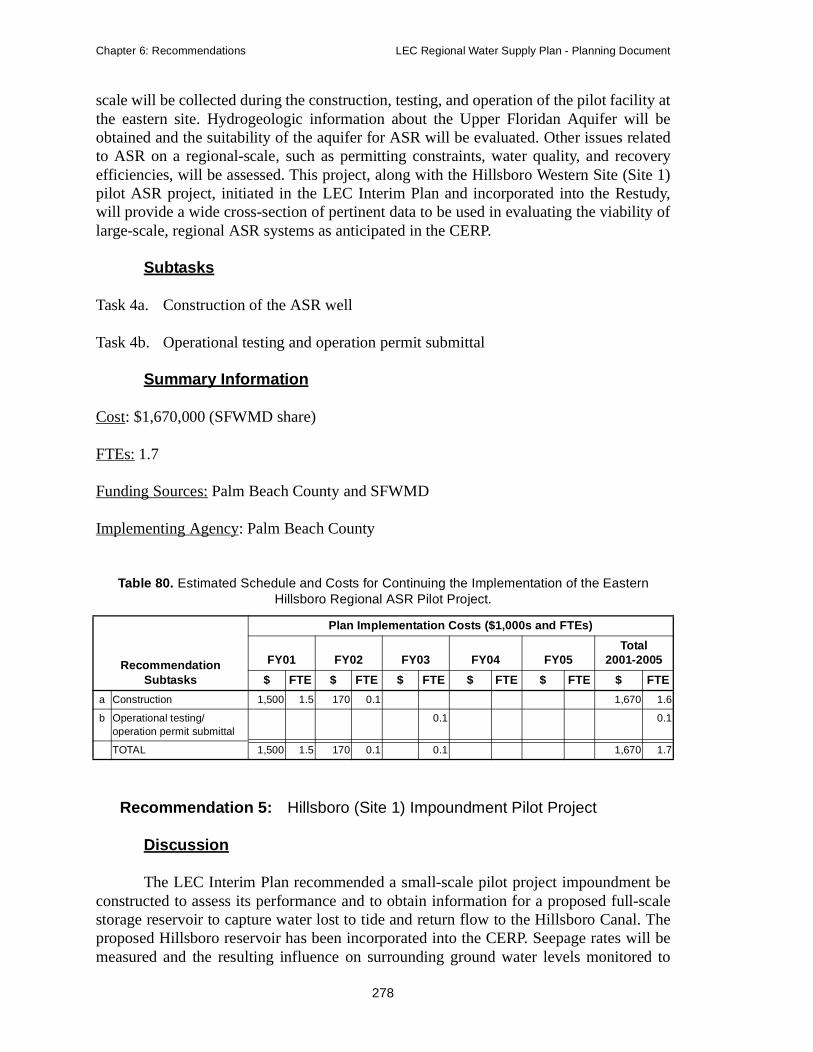
Chapter 6: Recommendations LEC Regional Water Supply Plan - Planning Document
scale will be collected during the construction, testing, and operation of the pilot facility atthe eastern site. Hydrogeologic information about the Upper Floridan Aquifer will beobtained and the suitability of the aquifer for ASR will be evaluated. Other issues relatedto ASR on a regional-scale, such as permitting constraints, water quality, and recoveryefficiencies, will be assessed. This project, along with the Hillsboro Western Site (Site 1)pilot ASR project, initiated in the LEC Interim Plan and incorporated into the Restudy,will provide a wide cross-section of pertinent data to be used in evaluating the viability oflarge-scale, regional ASR systems as anticipated in the CERP.
Subtasks
Task 4a. Construction of the ASR well
Task 4b. Operational testing and operation permit submittal
Summary Information
Cost: $1,670,000 (SFWMD share)
FTEs: 1.7
Funding Sources: Palm Beach County and SFWMD
Implementing Agency: Palm Beach County
Recommendation 5: Hillsboro (Site 1) Impoundment Pilot Project
Discussion
The LEC Interim Plan recommended a small-scale pilot project impoundment beconstructed to assess its performance and to obtain information for a proposed full-scalestorage reservoir to capture water lost to tide and return flow to the Hillsboro Canal. Theproposed Hillsboro reservoir has been incorporated into the CERP. Seepage rates will bemeasured and the resulting influence on surrounding ground water levels monitored to
Table 80. Estimated Schedule and Costs for Continuing the Implementation of the Eastern Hillsboro Regional ASR Pilot Project.
Recommendation Subtasks
Plan Implementation Costs ($1,000s and FTEs)
FY01 FY02 FY03 FY04 FY05Total
2001-2005
$ FTE $ FTE $ FTE $ FTE $ FTE $ FTE
a Construction 1,500 1.5 170 0.1 1,670 1.6
b Operational testing/ operation permit submittal
0.1 0.1
TOTAL 1,500 1.5 170 0.1 0.1 1,670 1.7
278
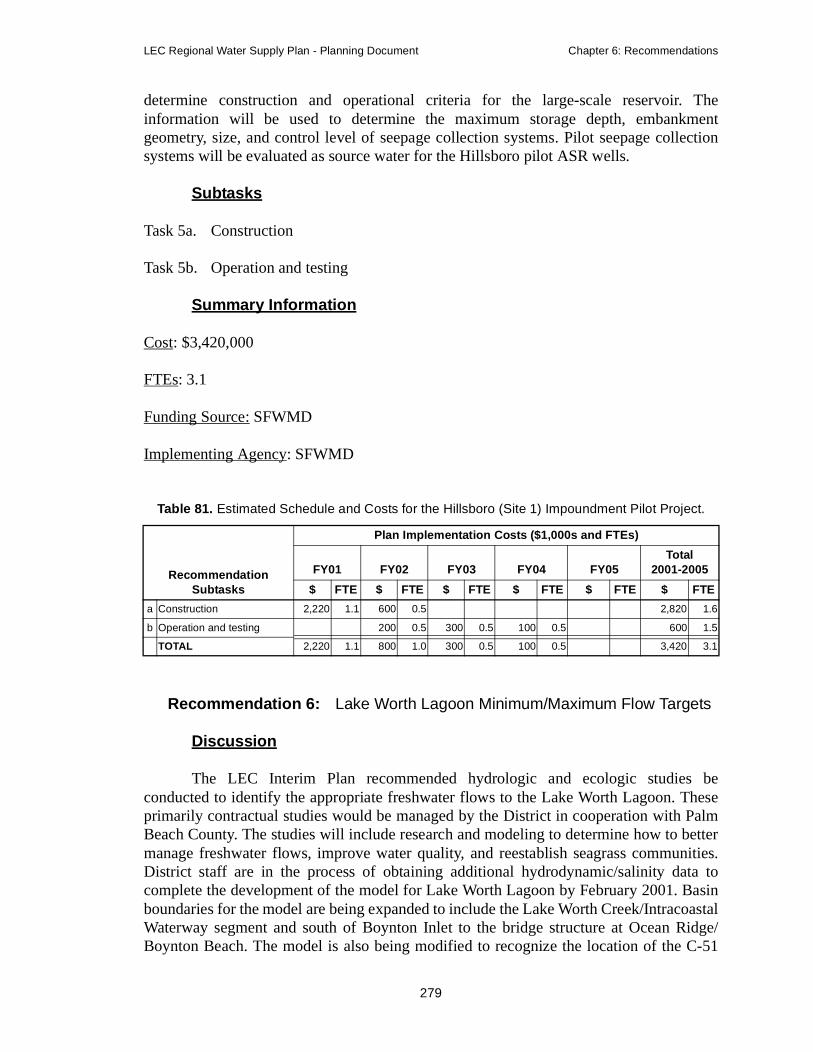
LEC Regional Water Supply Plan - Planning Document Chapter 6: Recommendations
determine construction and operational criteria for the large-scale reservoir. Theinformation will be used to determine the maximum storage depth, embankmentgeometry, size, and control level of seepage collection systems. Pilot seepage collectionsystems will be evaluated as source water for the Hillsboro pilot ASR wells.
Subtasks
Task 5a. Construction
Task 5b. Operation and testing
Summary Information
Cost: $3,420,000
FTEs: 3.1
Funding Source: SFWMD
Implementing Agency: SFWMD
Recommendation 6: Lake Worth Lagoon Minimum/Maximum Flow Targets
Discussion
The LEC Interim Plan recommended hydrologic and ecologic studies beconducted to identify the appropriate freshwater flows to the Lake Worth Lagoon. Theseprimarily contractual studies would be managed by the District in cooperation with PalmBeach County. The studies will include research and modeling to determine how to bettermanage freshwater flows, improve water quality, and reestablish seagrass communities.District staff are in the process of obtaining additional hydrodynamic/salinity data tocomplete the development of the model for Lake Worth Lagoon by February 2001. Basinboundaries for the model are being expanded to include the Lake Worth Creek/IntracoastalWaterway segment and south of Boynton Inlet to the bridge structure at Ocean Ridge/Boynton Beach. The model is also being modified to recognize the location of the C-51
Table 81. Estimated Schedule and Costs for the Hillsboro (Site 1) Impoundment Pilot Project.
Recommendation Subtasks
Plan Implementation Costs ($1,000s and FTEs)
FY01 FY02 FY03 FY04 FY05Total
2001-2005
$ FTE $ FTE $ FTE $ FTE $ FTE $ FTE
a Construction 2,220 1.1 600 0.5 2,820 1.6
b Operation and testing 200 0.5 300 0.5 100 0.5 600 1.5
TOTAL 2,220 1.1 800 1.0 300 0.5 100 0.5 3,420 3.1
279

Chapter 6: Recommendations LEC Regional Water Supply Plan - Planning Document
Divide Structure west of U.S. 441. The model will be used to analyze existing and futurevariable controlled freshwater flows from canal discharge, rainfall, runoff, ground waterinflow, and tides. A major goal of these efforts is to manage freshwater flows to the lagoonin a manner that will improve water quality, reduce the transport and deposition ofsuspended solids in the lagoon, and provide for the reestablishment and sustainability ofthis ecosystem. With the completion of the model development phase, District staff willneed to perform simulations, verify the results of the modeling efforts with currentconditions within the biological communities of the lagoon, and monitor the performanceof the recommended target flows and the effectiveness of implemented Lake WorthLagoon Partnership Grant projects.
Additional studies will be considered after FY 2001 to better define relationshipsamong canal discharges, local drainage, and storm water discharges, water quality,sediment deposition and distribution, and the distribution and composition of importantbiological communities in the lagoon. These studies will provide the background data andunderstanding needed to support the implementation of CERP Lake Worth Lagoonsediment removal efforts that are scheduled to begin in 2005.
Subtasks
Task 6a. Complete model simulations
Task 6b. Complete aerial photography of sea grasses in Lake Worth Lagoon
Task 6c. Digitize mapping of sea grasses based on aerial photography
Task 6d. Establish and monitor fixed transects to verify aerial photography signaturesand monitor the impacts of controlled and noncontrolled releases and theimplementation of storm water improvement projects affecting Lake WorthLagoon
Task 6e. Publish the recommended flow targets in a peer reviewed, scientific journal.
Cost: $100,000 (SFWMD)
FTE: 1.0 (SFMWD)
Funding Sources: Palm Beach County and SFWMD
Implementing Agencies: SFWMD and Palm Beach County Department of EnvironmentalResources Management (DERM)
280

LEC Regional Water Supply Plan - Planning Document Chapter 6: Recommendations
Recommendation 7: Northern Broward County Secondary Canals Recharge Network
Discussion
The LEC Interim Plan recommended the development of a master plan tocomplete the interconnection of surface water infrastructure to allow conveyance of waterto maintain/enhance subregional ground water levels, benefit wellfields, and selectedwetlands, and to prevent saltwater intrusion. The ultimate purpose of this project is tocontrol coastal secondary canals at optimal seasonal levels for maintaining and improvingground water recharge and storage. The source of supply for the secondary canal rechargenetwork is from regional surface water sources including aboveground reservoirs in thevicinity of the Hillsboro Impoundment, Lake Okeechobee, and Water Conservation Areas(WCAs), or ASR return flows into the Hillsboro Canal. The project includes constructionof canal interconnections, conveyance improvements, pump stations, and monitoringstations. As a part of the Broward County Integrated Water Resource Plan, a master planwill be developed for the interconnection of secondary canals from the Hillsboro CanalBasin to the North New River Canal Basin within Broward County. The master plan,when implemented, will work in conjunction with and enhance the functionality ofproposed CERP components. The master plan should be developed in phases and used toincrementally schedule the necessary capital improvements.
A surface water model has been completed. The S-46 Pump Station is scheduledfor completion in July 2000. The S-1 Pump Station is expected to be operational inSeptember 2001. The District has shared the cost of these improvements with BrowardCounty and the city of Fort Lauderdale. The county and the District will develop a masterplan for the interconnection of secondary canals from the Hillsboro Canal Basin to theNorth New River Canal Basin that will work in conjunction with and enhance thefunctionality of proposed CERP components. The master plan should be developed inphases and used to incrementally schedule the necessary capital improvements.
Subtasks
Task 7a. Develop a master plan
Task 7b. Implement the master plan
Table 82. Estimated Schedule and Cost for Developing Lake Worth Lagoon Minimum and Maximum Flow Targets.
Recommendation
Plan Implementation Costs ($1,000s and FTEs)
FY01 FY02 FY03 FY04 FY05Total
2001-2005
$ FTE $ FTE $ FTE $ FTE $ FTE $ FTE
Develop Lake Worth Lagoon minimum and maximum flow targets
100 1 100 1.0
281
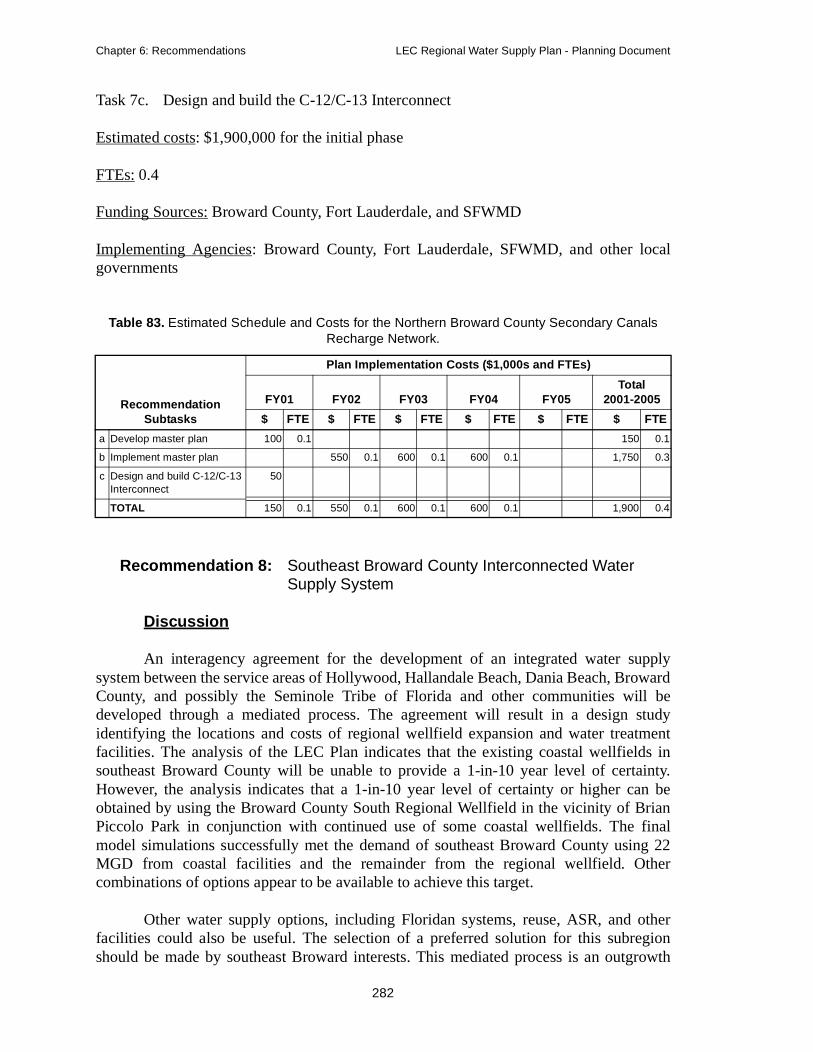
Chapter 6: Recommendations LEC Regional Water Supply Plan - Planning Document
Task 7c. Design and build the C-12/C-13 Interconnect
Estimated costs: $1,900,000 for the initial phase
FTEs: 0.4
Funding Sources: Broward County, Fort Lauderdale, and SFWMD
Implementing Agencies: Broward County, Fort Lauderdale, SFWMD, and other localgovernments
Recommendation 8: Southeast Broward County Interconnected Water Supply System
Discussion
An interagency agreement for the development of an integrated water supplysystem between the service areas of Hollywood, Hallandale Beach, Dania Beach, BrowardCounty, and possibly the Seminole Tribe of Florida and other communities will bedeveloped through a mediated process. The agreement will result in a design studyidentifying the locations and costs of regional wellfield expansion and water treatmentfacilities. The analysis of the LEC Plan indicates that the existing coastal wellfields insoutheast Broward County will be unable to provide a 1-in-10 year level of certainty.However, the analysis indicates that a 1-in-10 year level of certainty or higher can beobtained by using the Broward County South Regional Wellfield in the vicinity of BrianPiccolo Park in conjunction with continued use of some coastal wellfields. The finalmodel simulations successfully met the demand of southeast Broward County using 22MGD from coastal facilities and the remainder from the regional wellfield. Othercombinations of options appear to be available to achieve this target.
Other water supply options, including Floridan systems, reuse, ASR, and otherfacilities could also be useful. The selection of a preferred solution for this subregionshould be made by southeast Broward interests. This mediated process is an outgrowth
Table 83. Estimated Schedule and Costs for the Northern Broward County Secondary Canals Recharge Network.
Recommendation Subtasks
Plan Implementation Costs ($1,000s and FTEs)
FY01 FY02 FY03 FY04 FY05Total
2001-2005
$ FTE $ FTE $ FTE $ FTE $ FTE $ FTE
a Develop master plan 100 0.1 150 0.1
b Implement master plan 550 0.1 600 0.1 600 0.1 1,750 0.3
c Design and build C-12/C-13 Interconnect
50
TOTAL 150 0.1 550 0.1 600 0.1 600 0.1 1,900 0.4
282
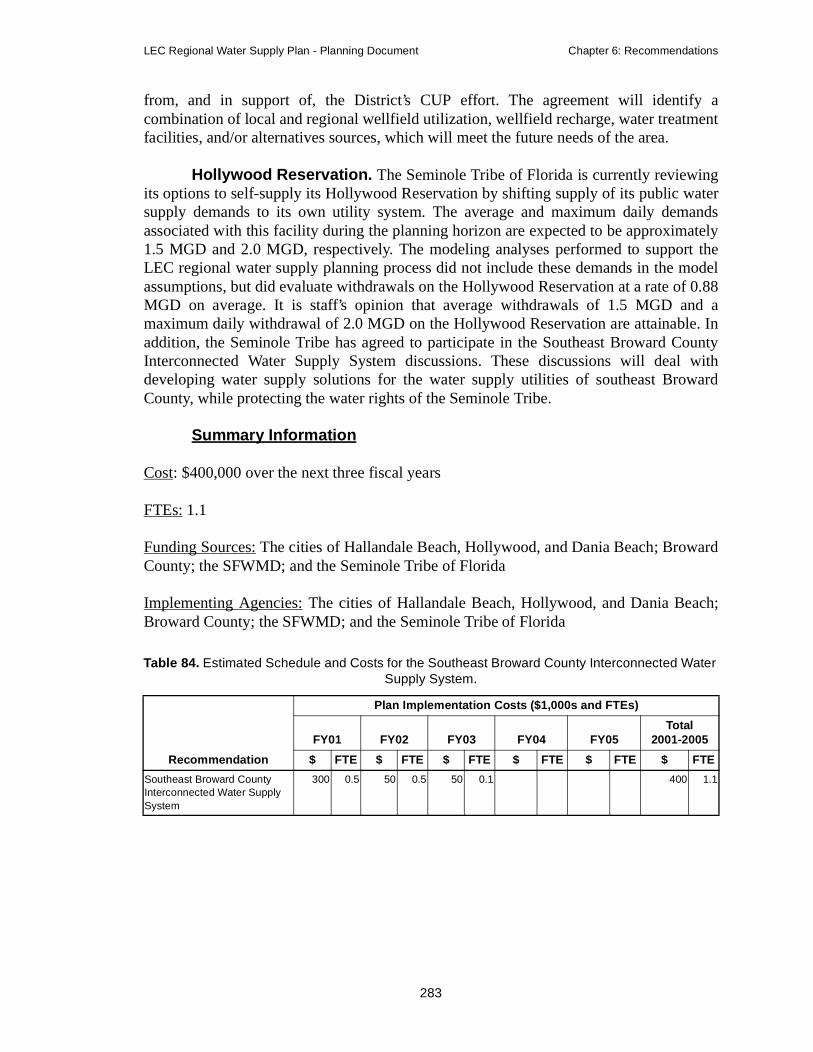
LEC Regional Water Supply Plan - Planning Document Chapter 6: Recommendations
from, and in support of, the District’s CUP effort. The agreement will identify acombination of local and regional wellfield utilization, wellfield recharge, water treatmentfacilities, and/or alternatives sources, which will meet the future needs of the area.
Hollywood Reservation. The Seminole Tribe of Florida is currently reviewingits options to self-supply its Hollywood Reservation by shifting supply of its public watersupply demands to its own utility system. The average and maximum daily demandsassociated with this facility during the planning horizon are expected to be approximately1.5 MGD and 2.0 MGD, respectively. The modeling analyses performed to support theLEC regional water supply planning process did not include these demands in the modelassumptions, but did evaluate withdrawals on the Hollywood Reservation at a rate of 0.88MGD on average. It is staff’s opinion that average withdrawals of 1.5 MGD and amaximum daily withdrawal of 2.0 MGD on the Hollywood Reservation are attainable. Inaddition, the Seminole Tribe has agreed to participate in the Southeast Broward CountyInterconnected Water Supply System discussions. These discussions will deal withdeveloping water supply solutions for the water supply utilities of southeast BrowardCounty, while protecting the water rights of the Seminole Tribe.
Summary Information
Cost: $400,000 over the next three fiscal years
FTEs: 1.1
Funding Sources: The cities of Hallandale Beach, Hollywood, and Dania Beach; BrowardCounty; the SFWMD; and the Seminole Tribe of Florida
Implementing Agencies: The cities of Hallandale Beach, Hollywood, and Dania Beach;Broward County; the SFWMD; and the Seminole Tribe of Florida
Table 84. Estimated Schedule and Costs for the Southeast Broward County Interconnected Water Supply System.
Recommendation
Plan Implementation Costs ($1,000s and FTEs)
FY01 FY02 FY03 FY04 FY05Total
2001-2005
$ FTE $ FTE $ FTE $ FTE $ FTE $ FTE
Southeast Broward County Interconnected Water Supply System
300 0.5 50 0.5 50 0.1 400 1.1
283

Chapter 6: Recommendations LEC Regional Water Supply Plan - Planning Document
Recommendation 9: Broward County Urban Environmental Enhancement
Discussion
The available sources and methods for distributing surface water to benefitspecific wetland restoration systems will be examined in the Broward County IntegratedWater Resource Plan. Local environmental demands will need to be assessed in terms ofquantities and timing of deliveries. Once identified, the county and District are prepared toassess the availability of regional and alternative sources of water to meet this demand.Reservation of water will be addressed by the District, and the District will encouragedevelopment of alternative sources, such as the reuse of reclaimed water.
Subtasks
Task 9a. Work with county staff to identify wetland systems, sources of water supply,and timing of deliveries for augmentation, including reuse of reclaimed water
Task 9b. Conduct evaluation of availability of supplemental water from reuse andregional storage for average and 1-in-10 year drought conditions
Task 9c. Identify strategies to meet water demands where structural alternatives arenecessary
Task 9d. Identify volumes and sources of supply to be covered by a reservation of water
Task 9e. Adopt rules to enact reservation if necessary
Summary Information
Cost: $200,000 within next three years
FTEs: 0.3
Funding Sources: Broward County and SFWMD
Implementing Agencies: Broward County and SFWMD
Table 85. Estimated Schedule and Costs for Broward County Urban Environmental Enhancement.
Recommendation
Plan Implementation Costs ($1,000s and FTEs)
FY01 FY02 FY03 FY04 FY05Total
2001-2005
$ FTE $ FTE $ FTE $ FTE $ FTE $ FTE
Broward County Urban Environmental Enhancement
100 0.1 50 0.1 50 0.1 200 0.3
284
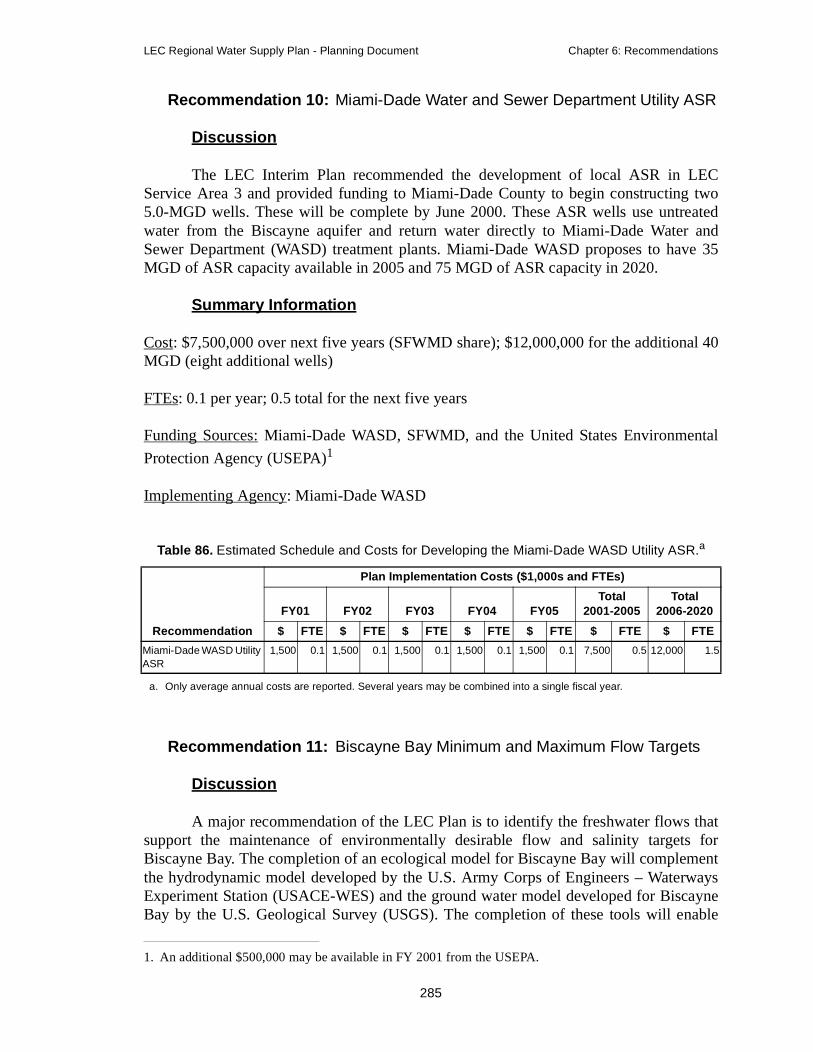
LEC Regional Water Supply Plan - Planning Document Chapter 6: Recommendations
Recommendation 10: Miami-Dade Water and Sewer Department Utility ASR
Discussion
The LEC Interim Plan recommended the development of local ASR in LECService Area 3 and provided funding to Miami-Dade County to begin constructing two5.0-MGD wells. These will be complete by June 2000. These ASR wells use untreatedwater from the Biscayne aquifer and return water directly to Miami-Dade Water andSewer Department (WASD) treatment plants. Miami-Dade WASD proposes to have 35MGD of ASR capacity available in 2005 and 75 MGD of ASR capacity in 2020.
Summary Information
Cost: $7,500,000 over next five years (SFWMD share); $12,000,000 for the additional 40MGD (eight additional wells)
FTEs: 0.1 per year; 0.5 total for the next five years
Funding Sources: Miami-Dade WASD, SFWMD, and the United States Environmental
Protection Agency (USEPA)1
Implementing Agency: Miami-Dade WASD
Recommendation 11: Biscayne Bay Minimum and Maximum Flow Targets
Discussion
A major recommendation of the LEC Plan is to identify the freshwater flows thatsupport the maintenance of environmentally desirable flow and salinity targets forBiscayne Bay. The completion of an ecological model for Biscayne Bay will complementthe hydrodynamic model developed by the U.S. Army Corps of Engineers – WaterwaysExperiment Station (USACE-WES) and the ground water model developed for BiscayneBay by the U.S. Geological Survey (USGS). The completion of these tools will enable
1. An additional $500,000 may be available in FY 2001 from the USEPA.
Table 86. Estimated Schedule and Costs for Developing the Miami-Dade WASD Utility ASR.a
a. Only average annual costs are reported. Several years may be combined into a single fiscal year.
Recommendation
Plan Implementation Costs ($1,000s and FTEs)
FY01 FY02 FY03 FY04 FY05Total
2001-2005Total
2006-2020
$ FTE $ FTE $ FTE $ FTE $ FTE $ FTE $ FTE
Miami-Dade WASD Utility ASR
1,500 0.1 1,500 0.1 1,500 0.1 1,500 0.1 1,500 0.1 7,500 0.5 12,000 1.5
285
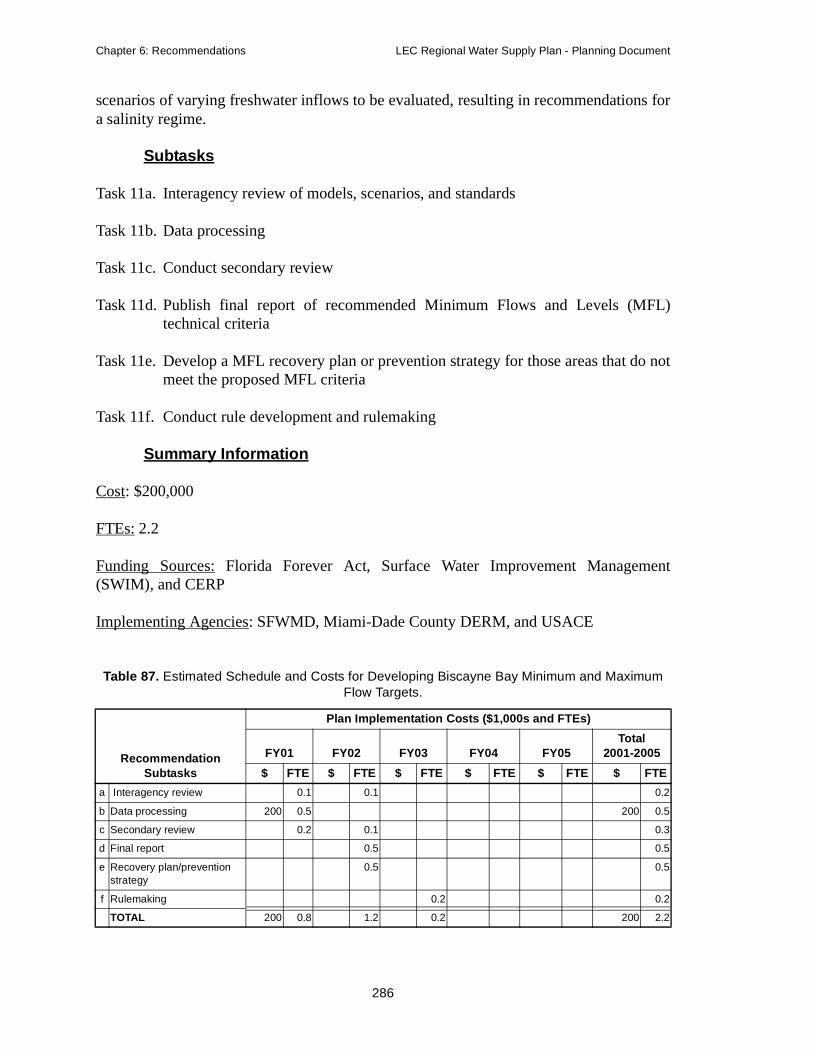
Chapter 6: Recommendations LEC Regional Water Supply Plan - Planning Document
scenarios of varying freshwater inflows to be evaluated, resulting in recommendations fora salinity regime.
Subtasks
Task 11a. Interagency review of models, scenarios, and standards
Task 11b. Data processing
Task 11c. Conduct secondary review
Task 11d. Publish final report of recommended Minimum Flows and Levels (MFL)technical criteria
Task 11e. Develop a MFL recovery plan or prevention strategy for those areas that do notmeet the proposed MFL criteria
Task 11f. Conduct rule development and rulemaking
Summary Information
Cost: $200,000
FTEs: 2.2
Funding Sources: Florida Forever Act, Surface Water Improvement Management(SWIM), and CERP
Implementing Agencies: SFWMD, Miami-Dade County DERM, and USACE
Table 87. Estimated Schedule and Costs for Developing Biscayne Bay Minimum and Maximum Flow Targets.
Recommendation Subtasks
Plan Implementation Costs ($1,000s and FTEs)
FY01 FY02 FY03 FY04 FY05Total
2001-2005
$ FTE $ FTE $ FTE $ FTE $ FTE $ FTE
a Interagency review 0.1 0.1 0.2
b Data processing 200 0.5 200 0.5
c Secondary review 0.2 0.1 0.3
d Final report 0.5 0.5
e Recovery plan/prevention strategy
0.5 0.5
f Rulemaking 0.2 0.2
TOTAL 200 0.8 1.2 0.2 200 2.2
286
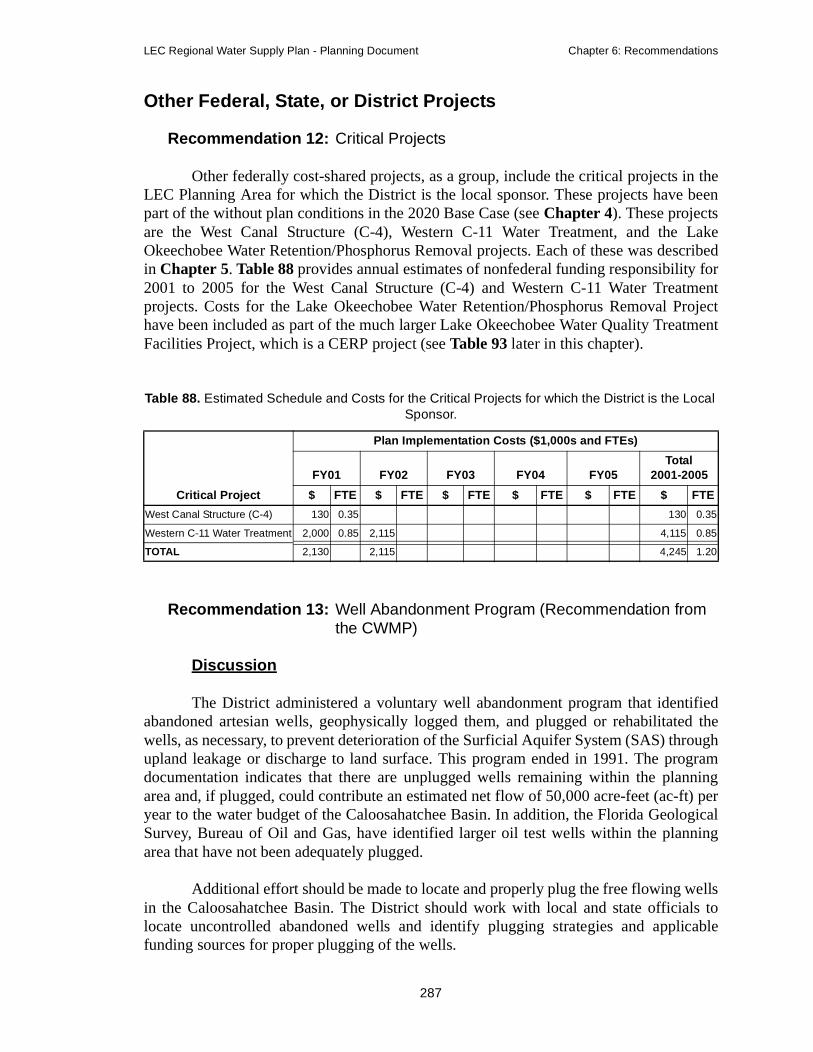
LEC Regional Water Supply Plan - Planning Document Chapter 6: Recommendations
Other Federal, State, or District Projects
Recommendation 12: Critical Projects
Other federally cost-shared projects, as a group, include the critical projects in theLEC Planning Area for which the District is the local sponsor. These projects have beenpart of the without plan conditions in the 2020 Base Case (see Chapter 4). These projectsare the West Canal Structure (C-4), Western C-11 Water Treatment, and the LakeOkeechobee Water Retention/Phosphorus Removal projects. Each of these was describedin Chapter 5. Table 88 provides annual estimates of nonfederal funding responsibility for2001 to 2005 for the West Canal Structure (C-4) and Western C-11 Water Treatmentprojects. Costs for the Lake Okeechobee Water Retention/Phosphorus Removal Projecthave been included as part of the much larger Lake Okeechobee Water Quality TreatmentFacilities Project, which is a CERP project (see Table 93 later in this chapter).
Recommendation 13: Well Abandonment Program (Recommendation from the CWMP)
Discussion
The District administered a voluntary well abandonment program that identifiedabandoned artesian wells, geophysically logged them, and plugged or rehabilitated thewells, as necessary, to prevent deterioration of the Surficial Aquifer System (SAS) throughupland leakage or discharge to land surface. This program ended in 1991. The programdocumentation indicates that there are unplugged wells remaining within the planningarea and, if plugged, could contribute an estimated net flow of 50,000 acre-feet (ac-ft) peryear to the water budget of the Caloosahatchee Basin. In addition, the Florida GeologicalSurvey, Bureau of Oil and Gas, have identified larger oil test wells within the planningarea that have not been adequately plugged.
Additional effort should be made to locate and properly plug the free flowing wellsin the Caloosahatchee Basin. The District should work with local and state officials tolocate uncontrolled abandoned wells and identify plugging strategies and applicablefunding sources for proper plugging of the wells.
Table 88. Estimated Schedule and Costs for the Critical Projects for which the District is the Local Sponsor.
Critical Project
Plan Implementation Costs ($1,000s and FTEs)
FY01 FY02 FY03 FY04 FY05Total
2001-2005
$ FTE $ FTE $ FTE $ FTE $ FTE $ FTE
West Canal Structure (C-4) 130 0.35 130 0.35
Western C-11 Water Treatment 2,000 0.85 2,115 4,115 0.85
TOTAL 2,130 2,115 4,245 1.20
287

Chapter 6: Recommendations LEC Regional Water Supply Plan - Planning Document
The District will coordinate with local and state agencies to identify abandoned,unplugged wells and to identify potential funding sources. This involves staff support andcoordination only.
Summary Information
Cost: No direct cost associated with this recommendation
FTEs: 0.5
Funding Sources: Potential sources include landowners, local government, and waterresource development funds
Implementing Agency: SFWMD
Recommendation 14: Saltwater Influence at S-79 (Recommendation from the CWMP)
Discussion
Saline water has been a recurring problem for the potable water intakes in theCaloosahatchee River. The potable water intakes are located approximately one mileupstream of the S-79 Structure. During extended periods of low flow, the chloride contentof the shallow water increases well beyond the recommended limit of 250 milligrams perliter for drinking water. In response, releases have been made from Lake Okeechobee. Anumber of alternatives to refine these releases warrant further investigation and includemoving the intake farther upstream, modifications to the structure, limiting lockagesduring low flow periods, improved maintenance and operation of the bubble curtain, andseasonal reductions in river withdrawals. Future freshwater releases for environmentalpurposes may also minimize saltwater influence. Additional analysis of the frontmigration should be initiated.
The District will coordinate additional analysis of the saltwater influence problemat the S-79 Structure. This recommendation involves staff support and coordination only.
Table 89. Estimated Schedule and Costs for the CWMP Well Abandonment Program.
Recommendation
Plan Implementation Costs ($1,000s and FTEs)
FY01 FY02 FY03 FY04 FY05Total
2001-2005
$ FTE $ FTE $ FTE $ FTE $ FTE $ FTE
Coordinate identification of unplugged wells
0.25 0.25 0.50
288
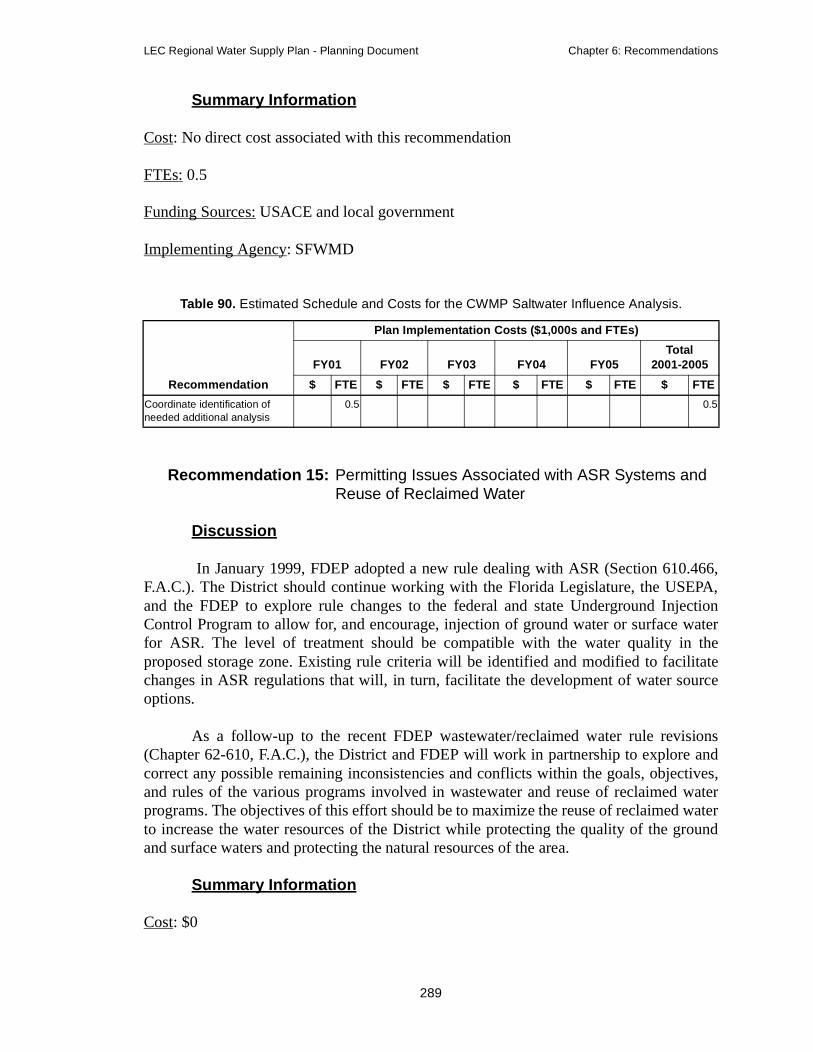
LEC Regional Water Supply Plan - Planning Document Chapter 6: Recommendations
Summary Information
Cost: No direct cost associated with this recommendation
FTEs: 0.5
Funding Sources: USACE and local government
Implementing Agency: SFWMD
Recommendation 15: Permitting Issues Associated with ASR Systems and Reuse of Reclaimed Water
Discussion
In January 1999, FDEP adopted a new rule dealing with ASR (Section 610.466,F.A.C.). The District should continue working with the Florida Legislature, the USEPA,and the FDEP to explore rule changes to the federal and state Underground InjectionControl Program to allow for, and encourage, injection of ground water or surface waterfor ASR. The level of treatment should be compatible with the water quality in theproposed storage zone. Existing rule criteria will be identified and modified to facilitatechanges in ASR regulations that will, in turn, facilitate the development of water sourceoptions.
As a follow-up to the recent FDEP wastewater/reclaimed water rule revisions(Chapter 62-610, F.A.C.), the District and FDEP will work in partnership to explore andcorrect any possible remaining inconsistencies and conflicts within the goals, objectives,and rules of the various programs involved in wastewater and reuse of reclaimed waterprograms. The objectives of this effort should be to maximize the reuse of reclaimed waterto increase the water resources of the District while protecting the quality of the groundand surface waters and protecting the natural resources of the area.
Summary Information
Cost: $0
Table 90. Estimated Schedule and Costs for the CWMP Saltwater Influence Analysis.
Recommendation
Plan Implementation Costs ($1,000s and FTEs)
FY01 FY02 FY03 FY04 FY05Total
2001-2005
$ FTE $ FTE $ FTE $ FTE $ FTE $ FTE
Coordinate identification of needed additional analysis
0.5 0.5
289
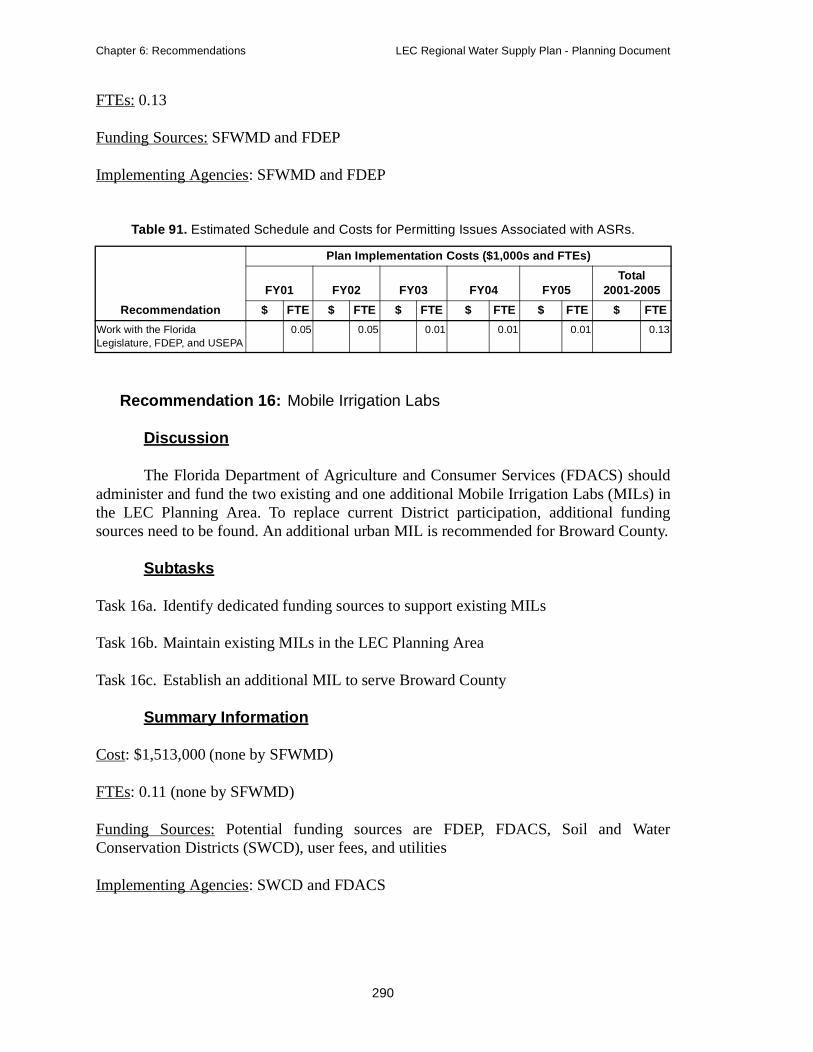
Chapter 6: Recommendations LEC Regional Water Supply Plan - Planning Document
FTEs: 0.13
Funding Sources: SFWMD and FDEP
Implementing Agencies: SFWMD and FDEP
Recommendation 16: Mobile Irrigation Labs
Discussion
The Florida Department of Agriculture and Consumer Services (FDACS) shouldadminister and fund the two existing and one additional Mobile Irrigation Labs (MILs) inthe LEC Planning Area. To replace current District participation, additional fundingsources need to be found. An additional urban MIL is recommended for Broward County.
Subtasks
Task 16a. Identify dedicated funding sources to support existing MILs
Task 16b. Maintain existing MILs in the LEC Planning Area
Task 16c. Establish an additional MIL to serve Broward County
Summary Information
Cost: $1,513,000 (none by SFWMD)
FTEs: 0.11 (none by SFWMD)
Funding Sources: Potential funding sources are FDEP, FDACS, Soil and WaterConservation Districts (SWCD), user fees, and utilities
Implementing Agencies: SWCD and FDACS
Table 91. Estimated Schedule and Costs for Permitting Issues Associated with ASRs.
Recommendation
Plan Implementation Costs ($1,000s and FTEs)
FY01 FY02 FY03 FY04 FY05Total
2001-2005
$ FTE $ FTE $ FTE $ FTE $ FTE $ FTE
Work with the Florida Legislature, FDEP, and USEPA
0.05 0.05 0.01 0.01 0.01 0.13
290

LEC Regional Water Supply Plan - Planning Document Chapter 6: Recommendations
Comprehensive Everglades Restoration Plan Projects
Recommendation 17: CERP Projects that Affect the LEC Planning Area and the Caloosahatchee Basin
The analysis completed as part of the LEC Plan confirms that the Restudy projectsscheduled for completion by 2020 are extremely beneficial for meeting MFLs and naturalsystem restoration targets, including reducing high water flows to estuaries, and providingwater to meet demands in the LEC Planning Area. These projects are being refined andimplemented in the CERP. The water resource development projects, operational changes,and environmental restoration projects listed in Table 93 are CERP projects recommendedfor completion by 2020. These projects are described in detail in Appendix C.Completion of the CERP projects by 2020, and timely implementation according to theschedule in the Restudy (USACE and SFWMD, 1999) is crucial to meeting the objectivesof the LEC Plan.
The CERP is considered in its entirety as one component of the LEC Plan’sprogram of water resource development projects. Many of the proposed projects havesignificant water resource benefits that need to be considered in this plan. Table 93provides a list of all CERP projects in the LEC Planning Area with annual estimates ofnonfederal funding responsibility for fiscal years 2001 to 2005 and the total cost throughFY 2020. Table 94 provides a similar list of all CERP projects in the CaloosahatcheeBasin. Table G-1 in Appendix G breaks down the total nonfederal and federal coststhrough 2050 of these projects into Project Implementation Report (PIR), real estateacquisition, design, plans and specifications, and construction costs. No attempt is made toprovide a further breakdown of costs at this time as the resolution of state and federalagreements on funding is still pending.
Table 92. Estimated Schedule and Costs for Establishing Mobile Irrigation Labs.a
Recommendation Subtasks
Plan Implementation Costs ($1,000s and FTEs)
FY01 FY02 FY03 FY04 FY05Total
2001-2005
$ FTE $ FTE $ FTE $ FTE $ FTE $ FTE
a Identify funding sources 0.01 0.01 0.01 0.01 0.01 0.06
b Maintain existing MILsb 200 200 200 200 200 1,000
c Establish additional urban MILb
70 0.01 70 0.01 70 0.01 70 0.01 70 0.01 350 0.05
TOTAL 270 0.02 270 0.02 270 0.02 270 0.02 270 0.02 1,350 0.11
a. The District is not funding MILs at this time. The costs and FTEs are included for informational purposes only.
b. Costs shown for the MILs include FTEs to operate.
291

Chapter 6: Recommendations LEC Regional Water Supply Plan - Planning Document
T
0LakAS
59
LakPilo
02
ReuPilo
21
SeePilo
01
HillPilo
01
LakAS
01
LakWaQuFac
01
NorOkeRes
01
L-8 00
LakTribDre
01
TaySloResTre
23
EARes
33
EARes
01
C-1and
02
PalWMRes
00
C-5Res
01
HillImpPha
00
Hill 00
AcmDis
00
C-5and
01
C-5Wa
00
LakRes
00
WinWe
01
Proto W
01
able 93. Nonfederal Funding Responsibility of CERP Projects in the Lower East Coast Planning Area.
Project
Cost for Fiscal Year (in 1999 dollars)
2001 2002 2003 2004 2005Total
2001-2005Total
2006-2020Total
2001-202e Okeechobee
R Pilot Project5,066,667 1,532,308 401,539 293,846 7,294,359 7,294,3
ebelt Technology t Project
572,650 2,230,770 2,230,770 2,239,317 2,230,770 9,504,275 995,727 10,500,0
se Technology t Project
514,520 410,158 2,793,843 4,578,736 5,691,534 13,988,790 494,231 14,483,0
page Management t Project
326,282 4,220,193 447,116 6,411 5,000,001 5,000,0
sboro (Site 1) ASR t Project
1,595,193 2,255,962 198,847 4,050,001 4,050,0
e Okeechobee R
1,560,123 5,735,099 7,295,221 541,360,780 548,656,0
e Okeechobee tershed Water ality Treatment ility
494,395 546,680 7,345,724 7,180,656 15,567,455 15,556,046 31,123,5
th of Lake echobee Storage ervoir
142,427,001 142,427,0
Project 37,718 2,461,054 2,498,772 33,159,228 35,658,0
e Okeechobee utary Sediment dging
52,334 487,942 467,726 1,342,000 2,350,001 2,350,0
lor Creek/Nubbin ugh Storage ervoir and
atment Area
766,000 10,310,685 14,918,910 4,920,230 79,598 30,995,423 20,502,500 51,497,9
A Storage ervoir, Phase 1
1,603,500 1,606,585 1,207,376 1,204,286 1,413,124 7,034,870 108,059,463 115,094,3
A Storage ervoir, Phase 2
101,620,001 101,620,0
7 Backpumping Treatment
3,209,550 3,548,110 3,425,414 10,183,074 -88,073a 10,095,0
-Mar/J.W. Corbett A Hydropattern toration
3,953,899 3,923,666 8,435 7,886,000 -2,636,000a 5,250,0
1 and Southern L-8 ervoir
153,330 10,004,740 10,158,070 153,869,931 164,028,0
sboro (Site 1) oundment,se 1
14,948,261 4,271,899 4,239,560 51,104 23,510,825 -4,243,325a 19,267,5
sboro (Site 1) ASR 637,773 705,049 702,358 2,045,179 44,376,821 46,422,0
e Basin B charge
4,339,627 4,306,681 39,693 8,686,000 1,364,000 10,050,0
1 Backpumping Treatment
4,262,012 4,711,592 4,481,069 13,454,673 2,861,327 16,316,0
1 Regional Ground ter ASR
81,054 5,288,784 5,369,838 58,275,662 63,645,5
e Worth Lagoon toration
1,150,000 1,150,0
sburg Farms tlands
792,917 2,770,281 705,443 8,360 2,152,712 6,429,712 537,289 6,967,0
tect Wetlands next CA-1
35,810,775 0 5,494,036 6,073,576 498,813 47,877,201 -21,491,200a 26,386,0
292

LEC Regional Water Supply Plan - Planning Document Chapter 6: Recommendations
PalAgrRes
00
WeDivImpCan
01
C-9 01
BroSecSys
01
NorStoPha
87
CenStoPha
73
C-4 50
PinHarRes
00
BirdAre
01
L-3ImpSee
00
DadPen
00
RerWaDel
01
C-1Can
27
SouCou
02
WeCou
01
WCStru
66
DivWC
01
WCSee
00
AddStru
01
ConStruRelof L
01
DecWC
01
DecWC
00
T
0
m Beach County icultural Reserve ervoir and ASR1,604,874 1,604,874 59,074,626 60,679,5
stern C-11 ersion oundment and al
41,039,740 40,726,379 144,381 81,910,501 -19,492,000a 62,418,5
STA/Impoundment 31,207,331 30,968,887 89,308 62,265,526 -17,692,525a 44,573,0
ward County ondary Canal tem
37,750 151,581 415,662 509,514 1,193,509 2,308,016 4,140,985 6,449,0
th Lake Belt rage Area (NLBSA), se 1
118,837,387 118,837,3
tral Lakebelt rage Area (CLBSA), se 1
163,570,773 163,570,7
Control Structures 64,359 251,777 207,614 5,325 618,875 1,147,950 1,147,9
eland and dwood Hammock toration
8,334 7,190 3,993 73,010 140,288 232,813 67,188 300,0
Drive Recharge a
10,834,465 14,427,528 25,261,993 36,779,508 62,041,5
1N Levee rovements for page Management
217,539 237,480 236,573 691,591 32,199,409 32,891,0
e-Broward Levee/nsuco Wetlands
4,402,418 4,368,948 34,235 0 8,805,600 583,400 9,389,0
oute Miami Canal ter Supply iveries
8,692,877 12,891,141 4,220,652 54,831 25,859,501 11,627,000 37,486,5
11 North Spreader al
3,151,565 15,097,629 15,097,629 12,352,339 134,716 45,833,876 737,150 46,571,0
th Miami-Dade nty Reuse
181,512,002 181,512,0
st Miami-Dade nty Reuse
218,618,501 218,618,5
A-1 Internal Canal ctures
187,412 738,350 2,807,104 3,732,866 3,732,8
erting Flows from A-2 to CLBSA
38,078,001 38,078,0
A-3A and B Levee page Management
27,797,554 27,850,757 27,558,039 83,206,350 -33,352,850a 49,853,5
itional S-345 ctures
112,708 167,141 167,781 167,141 614,770 22,611,731 23,226,5
struction of S-356 ctures and
ocation of a Portion -31N Borrow Canal
28,154,278 31,124,139 30,972,344 90,250,762 -32,877,761a 57,373,0
ompartmentalize A-3, Phase 1
250,301 371,184 180,690 1,507,295 2,309,470 10,618,031 12,927,5
ompartmentalize A-3, Phase 2
29,602,000 29,602,0
able 93. Nonfederal Funding Responsibility of CERP Projects in the Lower East Coast Planning Area.
Project
Cost for Fiscal Year (in 1999 dollars)
2001 2002 2003 2004 2005Total
2001-2005Total
2006-2020Total
2001-202
293

Chapter 6: Recommendations LEC Regional Water Supply Plan - Planning Document
FloCen
00
DivWC
01
DivCLB
00
G-4Mo
00
BisWe
40
FloRes
77
BigInte
01
MicWaPla
18
SemCypCon
01
MeProExo
01
PIRAS
00
PIRStoCon
00
PIRCo
64
PIRMa
88
ComEcoQuStu
41
FloStu
00
RE 16
TotProPla
01
a.
b.
T
0
w to Northwest and tral WCA-3A259,789 212,054 107,161 92,309 1,080,727 1,752,039 8,617,462 10,369,5
ert flows from A-3 to CLBSA
382,501 382,5
ert Flows from SA to WCA-3B
3,272,000 3,272,0
04 Pump Station difications
140,405 95,323 235,728 4,833,272 5,069,0
cayne Bay Coastal tlands
16,667 176,749 630,918 633,335 8,477,416 9,935,084 139,835,456 149,770,5
rida Keys Tidal toration
18,268 41,643 21,391 281,075 253,700 616,077 616,0
Cypress/L-28 rceptor
21,375,501 21,375,5
cosukee Tribe ter Management n
312,334 1,841,522 117,701 88,111 1,238,693 3,598,360 8,553,058 12,151,4
inole Tribe Big ress Water servation Plan
716,750 1,517,397 3,166,194 2,404,712 358,019 8,163,071 29,480,930 37,644,0
laleuca Eradication ject and other tic Plants
2,886,001 2,886,0
for Storage and R Storageb
3,947,458 3,947,458 3,902,085 11,797,000 11,797,0
for Lake Belt rage and veyanceb
17,521,500 17,521,5
for WCA nnectivityb
1,300,500 425,164 1,725,664 1,725,6
for Levee Seepage nagementb
955,251 1,837 957,088 957,0
prehensive system Water
ality Improvement dy
639,607 642,067 642,067 644,527 642,067 3,210,333 787,208 3,997,5
rida Bay Feasibility dy
461,539 501,923 501,923 503,846 30,770 2,000,000 2,000,0
COVER 4,985,060 5,004,233 5,004,233 5,023,407 5,004,233 25,021,166 75,025,151 100,046,3
al for CERP jects in the LEC nning Area
75,111,944 182,510,599 228,399,042 139,279,580 120,926,642 746,227,802 2,335,963,999 3,082,191,8
While overall CERP project costs are shared 50-50 with the USACE, the timing of the payments varies, as do the activitiesfor which the local sponsor is fully responsible. The local sponsor is generally responsible for 100 percent of the landacquisition costs, but the credit, for purposes of calculating the 50-50 share, is not given until the end of the project, resultingin situations where the local sponsor has spent more than the 50 percent requirement at the end of the project, and must getreimbursed by the USACE, hence the apparent negative funding requirement.
In most cases, a PIR will be developed for each project and the cost of the PIR is included in the project costs. This PIR willaddress several related projects (see Table G-1 in Appendix G for more details).
able 93. Nonfederal Funding Responsibility of CERP Projects in the Lower East Coast Planning Area.
Project
Cost for Fiscal Year (in 1999 dollars)
2001 2002 2003 2004 2005Total
2001-2005Total
2006-2020Total
2001-202
294

LEC Regional Water Supply Plan - Planning Document Chapter 6: Recommendations
Recommendations to the CERP from the LEC Plan
LEC Plan analysis indicates refinement of some of the CERP projects mayimprove their performance. These suggestions for further refinement are discussed below.The LEC Plan recommends that these modifications be analyzed in the planning anddesign of CERP projects during the PIR and RECOVER process and in any operationalchanges for these features.
Recommendation 18: S-155A
The LEC Plan recommends that additional analysis in the design phase of CERPdetermine the most effective method to provide water to the C-51 Backpumping andTreatment component, while continuing to provide benefits to the Lake Worth Lagoonwithout affecting the location of S-155A as designed for the Everglades ConstructionProject.
Recommendation 19: Everglades Hydropatterns within WCA-2B
Results of regional modeling efforts performed as part of the LEC Plan identifiedWCA-2B as the only area of the northern Everglades that received an unacceptable scorefor the incremental (2005, 2010, and 2015) and LEC-1 Revised simulations, as well as forthe LEC-1 simulations. These results indicate this area of the Everglades fails to meetLEC regional water supply planning targets, and ecosystem recovery is not likely to occurunless significant hydrologic improvements are made to the area. These results are similar
Table 94. Nonfederal Funding Responsibility of CERP Projects in the Caloosahatchee Basin.
Project
Cost for Fiscal Year (in 1999 dollars)
2001 2002 2003 2004 2005Total
2001-2005Total
2006-2020Total
2001-2020
Caloosahatchee River ASR Pilot Project
250,000 2,298,077 278,846 83,975 83,654 2,994,552 5,448 3,000,000
C-43 Basin Storage Reservoir and ASR
2,154,334 2,162,620 23,925,026 66,386,023 43,465,970 138,093,972 81,282,655 219,376,628
Caloosahatchee Backpumping with STA
41,447,501 41,447,501
Southwest Florida Study
1,000,000 1,800,000 1,800,000 1,000,000 500,000 6,100,000 -6,100,000a
Total for CERP Projects in the Caloosahatchee Basin
3,404,334 6,260,697 26,003,872 67,469,997 44,049,624 147,188,524 116,635,604 263,824,129
a. While overall CERP project costs are shared 50-50 with the USACE, the timing of the payments varies, as do theactivities for which the local sponsor is fully responsible. The local sponsor is generally responsible for 100percent of the land acquisition costs, but the credit, for purposes of calculating the 50-50 share, is not given untilthe end of the project, resulting in situations where the local sponsor has spent more than the 50 percentrequirement at the end of the project, and must get reimbursed by the USACE, hence the apparent negativefunding requirement.
295

Chapter 6: Recommendations LEC Regional Water Supply Plan - Planning Document
to the modeling results recorded in Appendix D of the Restudy (USACE and SFWMD,1999).
It is the intent of the LEC regional water supply planning process to implement therecommendations of the CERP’s RECOVER teams to restore or improve Evergladeshydropatterns within WCA-2B. The RECOVER teams will have the lead responsibilityfor identifying potential improvements in design or operations that will resolve anyremaining performance problems currently predicted for both the CERP and the LEC Planfor this area of the Everglades Basin.
The approach, which will be used by the RECOVER teams to improve WCA-2B,will be to review and refine, where necessary, the performance measures and indicatorregions used to evaluate hydrological performance. An increase in the number of indicatorcells in WCA-2B may be required to better understand the nature of the hydrologicalperformance problem and potential solutions. Once performance measures are reviewed,additional structural improvements and operational features will be suggested andmodeled to determine potential solutions to WCA-2B performance. Once theseimprovements have been identified, they will be presented to the LEC Regional WaterSupply Plan Advisory Committee and the District’s Governing Board for review andapproval and implemented as part of the next update of the LEC Plan.
Recommendation 20: Everglades Agricultural Area Storage Reservoirs
This feature as designed in the Restudy includes aboveground reservoir(s) with atotal storage capacity of approximately 360,000 ac-ft located in the EvergladesAgricultural Area (EAA) in western Palm Beach County and conveyance capacityincreases for the Miami, North New River, Bolles, and Cross canals. The initial design forthe reservoir(s) assumed 60,000 acres, divided into three, equally-sized compartments(1, 2A, and 2B), with the water level fluctuating up to six feet above grade in eachcompartment. The final size, depth, and configuration of this facility will be determinedthrough more detailed planning and design.
The purpose of this CERP feature is to improve the timing of environmentaldeliveries to the WCAs, including reducing damaging flood releases from the EAA to theWCAs, reducing Lake Okeechobee regulatory releases to the estuaries, meeting EAAirrigation and Everglades water demands, and increasing flood protection in the EAA.
Runoff from the EAA, the Miami Canal Basin, and the North New River CanalBasin and regulatory releases from Lake Okeechobee will be pumped into the reservoirs.Compartment 1 discharges will be used to meet EAA irrigation demands. Compartment2A discharges will be used to meet environmental demands as a priority and can be usedto supply a portion of agricultural demands if the environmental demands equal zero.Compartment 2B discharges will be used to meet environmental demands.
The LEC Plan recommends investigating four changes to this feature beconsidered in the future CERP analyses as a means of optimizing EAA water supplywithout adversely impacting water deliveries to the natural system. First, the sizes of the
296
LEC Regional Water Supply Plan - Planning Document Chapter 6: Recommendations
reservoirs would be modified. This change would enable more water supply demands inthe EAA to be met. Compartment 1 could be increased to 30,000 acres to meet EAAirrigation demands; Compartment 2A would remain the same size (20,000 acres), andCompartment 2B would be decreased to 10,000 acres. Second, the runoff from the portionof the Hillsboro Canal Basin within the EAA could be captured and routed to the enlargedCompartment 1. Third, Compartment 1 could be used to meet demands in the West PalmBeach Canal Basin, as well as the other EAA basins. By implementing these changes, agreater percentage of future EAA demands can be met. Fourth, structural and conveyancechanges may be necessary to implement these modifications. Excess water available inASR facilities in LEC Service Area 1 will be diverted, when possible, to partially meet itsdemands to the EAA.
The following discussion compares the flows from the LEC-1 simulation to theflows from the LEC-1 Revised simulation. In the LEC-1 simulation, the compartmentswere all the same size, as recommended in the Restudy. The altered compartment sizeswere incorporated into the LEC-1 Revised simulation. The flows discussed below weregenerated from the standard budget ASCII (American Standard Code for InformationInterchange) files and are the mean values of the 31-year simulation.
EAA runoff into Compartment 1 of the EAA Storage Reservoirs was 45,000 ac-ftper year more in LEC-1 Revised simulation than in the LEC-1 simulation. Furthermore,18,000 ac-ft per year was routed from excess water in regional ASR in LEC ServiceArea 1 to Compartment 1. In the LEC-1 Revised simulation, water supply to the EAA was47,000 ac-ft per year more from Compartment 1 than in the LEC-1 simulation. In theLEC-1, this additional supply was used to meet needs in the West Palm Beach CanalBasin, in addition to meeting the needs in the Miami and North New River canal basins.Total flow from Lake Okeechobee to Compartments 2A and 2B was 11,000 ac-ft per yearmore in the LEC-1 Revised than in the LEC-1. Total supply from Compartments 2A and2B to meet environmental needs was 23,000 ac-ft per year more in the LEC-1 Revisedthan in the LEC-1. Modifications to the EAA Storage Reservoirs had no effect onperformance of the natural system, which were the same in both the LEC-1 and LEC-1Revised simulations under average conditions (31-year mean) and drought conditions(five driest years).
The flows discussed above should not be considered measures of performance. Inthe revised simulations, changes due to the EAA reservoir modifications were notanalyzed independently of other changes made in the revised simulations. Instead,performance of these modifications should be measured in terms of impacts on LakeOkeechobee, hydroperiods in the Everglades, and on water supply performance.
Recommendation 21: L-8 Project
This Restudy component was designed to include a combination of abovegroundand in-ground reservoirs with a total storage capacity of approximately 48,000 ac-ftlocated immediately west of the L-8 Borrow Canal and north of the C-51 Canal in PalmBeach County. Other construction features include ASR wells with a capacity of 50 MGD,a series of pumps, water control structures, and canal capacity improvements in the
297
Chapter 6: Recommendations LEC Regional Water Supply Plan - Planning Document
M Canal. The initial design assumed a 1,800-acre reservoir with 1,200 usable acres withthe water level fluctuating from 10 feet above grade to 30 feet below grade. The initialdesign assumed 50 wells, each with a capacity of five MGD with chlorination forpretreatment and aeration for posttreatment.
The purpose of this feature is to increase water supply availability and floodprotection for northern Palm Beach County areas. It will also provide flows to enhancehydroperiods in the Loxahatchee Slough, increase base flows to the Northwest Fork of theLoxahatchee River, and reduce high discharges to the Lake Worth Lagoon.
In the Restudy it was assumed water will be pumped into the reservoir from theC-51 Canal and Southern L-8 Borrow Canal during the wet season, or periods whenexcess water is available, and returned to the C-51 and Southern L-8 canals during dryperiods. Additional features will also direct excess water into the West Palm Beach WaterCatchment Area. During periods when the West Palm Beach Water Catchment Area isabove desirable stages, 50 MGD will be diverted to Lake Mangonia for storage in the ASRwells. The reservoir portion of this component may be implemented under a previouslyauthorized project.
Modeling completed for the LEC Plan optimized the operation of the ASR portionof this feature by utilizing stored ASR water more often and redirecting where the waterwas distributed. Water stored in excess of a selected threshold could be conveyed to theEAA to meet irrigation demands. Utilizing this water could prevent the volume of waterstored from accumulating in excessive volumes, optimize its beneficial use, and reducedemands on the Lake Okeechobee. The LEC Plan recommends development of anoperating schedule that can optimize the use of the stored ASR water to meet EAAdemands.
Recommendation 22: C-51 Regional Ground Water Projects ASR Facilities
The purpose of this feature is to capture and store excess flows from the C-51Canal currently discharged to the Lake Worth Lagoon for later use during dry periods.This feature was designed to include a series of ASR wells with a capacity of 170 MGD tobe constructed along the C-51 Canal in Palm Beach County. The initial design of the wellsassumed 34 well clusters, each with a capacity of five MGD with chlorination forpretreatment and aeration for posttreatment.
The design includes facilities used to inject and store surficial aquifer groundwater adjacent to the C-51 Canal into the Upper Floridan aquifer instead of dischargingthe canal water to tide. Water will be returned to the C-51 Canal to help maintain canalstages during the dry season. If water is not available in the system, existing rules forwater delivery to this region will be applied.
The analysis performed during the LEC regional water supply planning processoptimized the operation of the ASR features by utilizing stored ASR water more often andredirecting where it is distributed. Water stored in excess of the water requirements tomaintain the C-51 Canal and Lake Worth Drainage District could be conveyed to the EAA
298

LEC Regional Water Supply Plan - Planning Document Chapter 6: Recommendations
to meet irrigation demands. Utilizing this water prevents the volume of water stored fromaccumulating in excessive volumes and optimizes its beneficial use.
Recommendation 23: West Miami-Dade Reuse Feasibility Study
This feature was designed to produce superior, advanced treatment of wastewaterfrom a future wastewater treatment plant in western Miami-Dade County. The plant willbe located in the Bird Drive Basin in Miami-Dade County. The initial design assumed apotential discharge volume of 100 MGD from the wastewater treatment plant. The finalconfiguration of these facilities will be determined through more detailed planning anddesign to be completed in the ongoing West Miami-Dade Water Reuse Feasibility Studyauthorized in Section 413 of the Water Resources Development Act of 1996. Superiorwater quality treatment features would be based on appropriate pollution load reductiontargets necessary to protect downstream receiving surface waters.
The purpose for the feature is to meet the demands for the Bird Drive RechargeArea, the South Dade Conveyance System, and Northeast Shark River Slough. When alldemands have been met, the plant would stop treatment beyond secondary treatmentstandards and will dispose of the secondary treated effluent into deep injection wells.
In the Restudy, it was recognized that further study would look at other options andconsider cost-effective alternatives. In the models used during the LEC regional watersupply planning process, the quantity of reuse being produced was assumed to be only 50MGD. The LEC Plan recommends that, as part of the West Miami-Dade Reuse FeasibilityStudy, the volume of reuse water needed to meet identified demands should bereevaluated, that other beneficial uses of reclaimed water should also be considered, andthat alternative sources of water should be analyzed.
Recommendation 24: Lake Okeechobee Regulation Schedule
Modifications to the Lake Okeechobee regulation schedule, Run 25, wererecommended in the Restudy. These modifications would take advantage of the additionalstorage facilities identified in the construction features. Two additional zones will beadded to the schedule. The first zone will trigger discharges to the North of LakeOkeechobee Storage Reservoir and the EAA Storage Reservoir. The second higher zonewill trigger the Lake Okeechobee ASR facilities to begin injecting water from the lake.Climate-based forecasting will be used to guide management decisions regarding releasesto the storage facilities.
As part of the analysis performed for the LEC Plan, a Water Supply andEnvironmental (WSE) schedule with modifications to accommodate additional storagefeatures, showed superior performance in meeting environmental and water supplydemands on the lake. The WSE schedule was recommended by the LEC Interim Plan andcontinues to perform better than the modified Run 25 schedule used in the Restudy. TheWSE schedule is able to meet a greater percentage of water supply demands in the LECPlanning Area and the Lake Okeechobee Service Area (LOSA), while providingenvironmental deliveries to the estuaries and the Everglades. Increased storage and
299
Chapter 6: Recommendations LEC Regional Water Supply Plan - Planning Document
demands on the lake alters operations. The schedule should be updated as major newstorage features are constructed or at least every five years over the next 20 years.
Recommendation 25: Lake Belt Storage Area Projects
The Lake Belt storage areas are expected to be complete in 2036. They will extendbeyond the 2020 time frame used in the LEC regional water supply planning process.Modeling and analysis for the LEC Plan has shown that completing 50 percent of theplanned reservoir capacity is critical in meeting the multiple water resource objectives inthe region by 2020. The construction of seepage barriers, which are necessary for thisdesign, will require careful coordination with the limestone mining industry in order toobtain a portion of reservoir capacity before mining is complete. Likewise, pilot studies totest the feasibility of some aspects of the concept are critical and will require ongoingcoordination with the mining industry. The LEC Plan recommends the identification ofseepage barrier locations early on and coordination with the mining industry on the timingof mining so that blasting will not cause damage to seepage barriers.
Recommendation 26: Everglades Rain-Driven Operations
Modifications to the regulation schedules for WCAs 2A, 2B, 3A, 3B, and thecurrent rainfall delivery formula for Everglades National Park were recommended in theLEC Interim Plan and in the Restudy to implement rain-driven operations for all of theseareas. These new operational rules are intended to improve timing and range of waterdepths in the WCAs and Everglades National Park to restore more natural hydropatterns,as well as meet MFLs for these areas.
The rain-driven operational concept is a basic shift from the current operationalpractice, which uses calendar-based regulation schedules for the WCAs. Regulationschedules, also referred to as rule curves, or flood control schedules, typically specify therelease rules for a WCA based on the water level at one or more key gages. Regulationschedules do not typically contain rules for importing water from an upstream source. Theregulation schedules also repeat every year and make no allowance for interannualvariability. The rain-driven operational concept includes rules for importing and exportingwater from the WCAs in order to mimic a desired target stage hydrograph at key locationswithin the Everglades system. The target stage hydrographs mimic an estimate of thepredrainage Everglades water level response to rainfall.
Analysis of incremental runs performed as part of the LEC regional water supplyplanning process indicate that rain-driven operations for WCAs 2B, 3A, 3B, andEverglades National Park could be developed and implemented by 2005. The rain-drivenoperations for WCA-2A should be developed and implemented by 2010. The rain-drivenoperations are key to providing additional water when needed prior to construction of themajor storage features recommended in the Restudy. The schedules need to be updated asmajor storage features are constructed or at least every five years. Additionally, amethodology to transform concepts applied during regional model simulations to rainfallformulas that can be applied during daily operation of the Central and Southern FloridaProject for Flood Control and Other Purposes (C&SF Project) should be developed by
300

LEC Regional Water Supply Plan - Planning Document Chapter 6: Recommendations
2003. WCA-1 is recommended to retain its latest regulation schedule until comprehensiveanalysis be undertaken to determine whether a future rain-driven schedule will bebeneficial.
Recommendation 27: Change Coastal Wellfield Operations
Shifting demands from eastern facilities to western facilities, away from thesaltwater interface, was recommended for some coastal public water supply utilities in theLEC Planning Area, which are expected to experience an increased threat of saltwaterintrusion. The Restudy recommended that a portion of demand should be shifted inlandfor the following utilities: Riviera Beach, Lake Worth, Lantana, Manalapan, Boca Raton,and Florida City. The volume shifted depended upon the degree of saltwater intrusion, butis generally proportional to the increase in demands between the 1995 existing conditionsand the projected 2050 future without plan conditions. Eastern wellfields at Miramar,Hollywood, Broward County 3A, 3B, and 3C, Dania Beach, and Hallandale are assumedto be on standby with the entire demand met from western facilities.
The coastal wellfield operations evaluated as part of the LEC Plan indicate thatfewer utilities and less demand may need to be shifted inland or to alternative sources ofwater to avoid an increased threat of saltwater intrusion. The wellfields that continue toindicate an increased threat of saltwater intrusion or that may not be able to meet a 1-in-10year level of certainty in 2020 are Lantana, Lake Worth, Manalapan, Boca Raton, Broward3A, 3B, and 3C, Hollywood, Dania Beach, Hallandale Beach, North Miami, and NorthMiami Beach. Their projected 2020 demands may not be able to be met at their currentwellfield locations. Additionally, the incremental runs of 2005, 2010, and 2015 indicatedsuperior performance when utilizing the same wellfield distribution in LEC-1. To meet the1-in-10 year level of certainty and reduce the threat of saltwater intrusion in the near-term,the identified demands may need to be shifted from coastal wellfields as soon as possible.The individual utilities may consider other water supply options and the District isproposing a water resource development project in which the utilities in southeasternBroward County cooperatively develop additional wellfield and treatment capacity.
Recommendations to the CERP from the CWMP
The Caloosahatchee Water Management Project (CWMP) identified the need forstorage within the basin using a regional optimization approach with underground storageof such amount that the ASR systems will tolerate extended withdrawals of 220 MGD and220,000 ac-ft in aboveground storage (reservoirs plus other storage options). The analysisin the CWMP indicates that more detailed evaluation using more site-specific informationmay result in changes to the sizing and combination of this storage and recommends thatthe detailed evaluation be continued as part of the Southwest Florida Study (SWFS).
Five types of potential storage options or components were identified: regional anddistributed reservoirs, ASR, backpumping to Lake Okeechobee, in-river storage due tostructure S78.5, and water table harvesting. The five storage components were combinedinto nine alternatives that were evaluated utilizing reduced flows from Lake Okeechobee
301
Chapter 6: Recommendations LEC Regional Water Supply Plan - Planning Document
as modeled in the LEC 2020 with Restudy alternative simulation. Of these components,model results indicate that backpumping has limited utility or benefit and, therefore, is notpractical, based on the assumptions in the CWMP. Addition of a structure in theCaloosahatchee River (S78.5) and water table management showed minimal benefit, butmay be considered as part of an overall storage strategy. Regional and distributedreservoirs and ASR systems showed the greatest potential for meeting the storage needs inthe Caloosahatchee Basin and are recommended for additional investigation and pilottesting within the basin.
A detailed assessment of the potential storage components is needed to identify apreferred alternative for meeting the demands in the Caloosahatchee Basin in 2020. It isrecommended that the detailed assessment be completed as a part of the implementationof the SWFS.
The modeling conducted, as part of the CWMP, to evaluate the performance ofvarious storage components utilized revised Caloosahatchee Basin hydrology anddemands from those used in the Restudy. This assessment showed higher demands andlower runoff from the basin, and consequently less water was available to be placed instorage. The CWMP evaluated options that focused on additional storage within the basincoupled with limited water supply deliveries (matching the results of the Restudy) fromLake Okeechobee. Under these assumptions the proposed water supply backpumpingoption performed poorly. It is recommended that the SWFS and the analysis by the CERPRECOVER process further investigate the recommendations of the CWMP concerningin-basin storage and backpumping for storage in Lake Okeechobee (coupled withreasonable assurances of adequate deliveries from the lake to the Caloosahatchee Basin)to confirm the best combination that meets the cost-effectiveness, water supply, andenvironmental goals recommended in the Restudy for the Caloosahatchee Basin.
The SWFS needs to be completed and implemented to address freshwaterdischarges to the Caloosahatchee Estuary and increase surface water availability for wateruse. The recommendations of the CWMP and the Restudy, and associated funding, shouldbe pursued after detailed modeling is performed.
An evaluation of projected flows to the Caloosahatchee River was conducted viathe LEC Plan and the CWMP for 1990 and 2020 base case conditions. The results of theseevaluations indicate that the proposed MFL criteria and the restoration base flow needs ofthe Caloosahatchee Estuary are not being met. Pursuant to the direction provided inSection 373.042, F.S., a recovery plan is provided in the LEC Plan. The recovery planconsists of design and construction of enhanced basin storage capacity using surfacewater, ASR, and reservoirs as described in the Restudy and refined through the CERP andSWFS.
Based on the recommended development of water management and storageinfrastructure to effectively capture and store the surface water flows in theCaloosahatchee Basin, the projected surface water needs of the basin and the estuary canbe met. Supplemental agricultural demands from surface water sources within the basinare estimated to increase from 230,000 ac-ft per year (200 MGD) based on 1995 land use,
302

LEC Regional Water Supply Plan - Planning Document Chapter 6: Recommendations
to approximately 320,000 ac-ft per year (285 MGD) on average based on 2020 projectedland use. Public water supply needs from the Caloosahatchee River are projected toincrease from 13,000 (12 MGD) in 1995 to 18,000 ac-ft per year (16 MGD) on average by2020. The environmental needs of the Caloosahatchee Estuary have been estimated at450,000 ac-ft (400 MGD) while average flows to the estuary are estimated to beapproximately 650,000 ac-ft per year (580 MGD) on average. Flow to the estuary inexcess of needs can, therefore, be as high as 200,000 ac-ft per year (180 MGD) onaverage, that is adequate, to meet increased demand through 2020. It was also concludedthat the evaluated components, once constructed, would be adequate to meet the demandsin the basin during a 1-in-10 year drought event.
The CWMP has identified that the future environmental, agricultural, and publicwater supply needs of the Caloosahatchee Basin and Estuary can be met from acombination of basin storage options with deliveries of water from Lake Okeechobee asidentified in the South Florida Water Management Model (SFWMM) LEC 2020 withRestudy components. The evaluation of storage components conducted as part of thestudy show that components capable of providing short-term and long-term storage arerequired. The finding suggests that regional and distributed reservoirs, as well as ASRsystems, would form an integral part of any successful storage development within thebasin. A pilot testing program should be developed to verify the feasibility andeffectiveness of these storage methods within selected sites in the Caloosahatchee Basinthrough the SWFS.
Recommendation 28: Caloosahatchee River ASR Pilot Project
Discussion
The District should work cooperatively with the USACE to site, design, construct,and operate a pilot regional ASR project. Recovery performance and additionalinformation obtained from the construction of and cycle testing at this facility will guidethe design of the regional ASR wellfield.
Summary Information
Cost: $2,998,000 (SFWMD portion only)
Funding Sources: SFWMD and USACE
Implementing Agencies: SFWMD and USACE
303

Chapter 6: Recommendations LEC Regional Water Supply Plan - Planning Document
Recommendation 29: C-43 Basin Storage Reservoir and ASR Project
Discussion
The District should cooperate with the USACE in development of the ProjectImplementation Report (PIR), design, construction, and operation of a regional reservoirand ASR project within the Caloosahatchee Basin. A comprehensive geologic andgeotechnical investigation should be completed, as a part of the PIR to provide theinformation needed to size and design the reservoir. Development of the PIR, landacquisition, design, and plans and specifications should be completed by 2005 andconstruction should be initiated in 2005.
Summary Information
Cost: $138,094,000 (SFWMD portion only)
Funding Sources: SFWMD and USACE (50/50 cost share)
Implementing Agencies: SFWMD and USACE
Table 95. Estimated Schedule and Costs for the Implementation of the Caloosahatchee River ASR Pilot Project.a
Recommendation
Plan Implementation Costs ($1,000s)
FY01 FY02 FY03 FY04 FY05Total
2005-2020
Caloosahatchee River Pilot ASR Project 250 2,300 280 84 84 2,998
a. Inkind service includes FTEs for design and implementation of the ASR Pilot Project and will be appliedagainst the District’s portion of the 50/50 cost-share requirement.
Table 96. Estimated Schedule and Costs for the C-43 Basin Storage Reservoir and ASR Project.a
a. Inkind service includes FTEs for design and implementation of the PIR and will be applied against the District’sportion of the 50/50 cost share requirement.
Recommendation
Plan Implementation Costs ($1,000s)
FY01 FY02 FY03 FY04 FY05Total
2001-2005
C-43 Basin Storage Reservoir and ASR 2,154 2,163 23,925 66,386 43,466 138,094
304

LEC Regional Water Supply Plan - Planning Document Chapter 6: Recommendations
Recommendation 30: Southwest Florida Study
Discussion
The District should work in cooperation with the USACE to initiate and completethe SWFS by 2005 as recommended in the CERP. The modeling work that has beencompleted as a part of the CWMP should be used as the basis for development of apreferred alternative to meet the demands within the Caloosahatchee Basin in 2020.
The primary purpose of the SWFS should be to provide a framework in which toaddress the health of aquatic ecosystems; water flows; water quality (includingappropriate pollution reduction targets); water supply; flood protection; wildlife andbiological diversity; and natural habitat. Evaluations involving surface water availabilityfor water supply purposes should be based on providing a 1-in-10 year level of certaintyfrom surface water as an optimal goal.
Subtasks
Task 30a. Complete problem identification/Project Study Plan phase by October 2000.
Task 30b. Complete development of a preferred alternative for the Caloosahatchee Basinby 2003.
Task 30c. It is recommended that the demand projections that were developed for theCWMP form the basis for evaluation of demands for the Caloosahatchee Basinin the SWFS.
Task 30d. The Integrated Surface Water Ground Water Model (ISGM) and other modelsthat were developed to model the Caloosahatchee Basin should be incorporatedinto the SWFS and be utilized to evaluate the performance of water supplystorage options, such as a distributed reservoir system. During the SWFSanalysis, the CWMP demands and ISGM should be refined and updated asneeded for evaluation of alternatives for meeting demands in theCaloosahatchee Basin in 2020.
Task 30e. Continue development of the modeling tools that were developed for theCWMP. These tools include the ISGM (MIKE SHE), Agricultural Field-ScaleIrrigation Requirements Simulation (AFSIRS)/Water Balance Component(WATBAL), and optimization models that were developed for theCaloosahatchee Basin.
Task 30f. Continue the seepage study that was initiated during development of theCWMP.
Task 30g. The Plan of Study for the SWFS should include an evaluation of the feasibilityof constructing a distributed reservoir system. In addition, the District should
305

Chapter 6: Recommendations LEC Regional Water Supply Plan - Planning Document
investigate the feasibility of public/private partnerships for funding andimplementing a distributed reservoir system.
Task 30h. In some areas immediately adjacent to the CWMP Planning Area, distributed,small-scale reservoirs could be developed that can offer improved waterresource management through increased environmental and flood protection,and increased surface water resource availability. This should be investigated inthe SWFS.
Summary Information
Cost: $5-6,100,000 (estimated) (SFWMD portion only)
Funding Sources: SFWMD and USACE
Implementing Agencies: SFWMD and USACE (50/50 Cost Share)
Operational Recommendations
Systemwide Operational Protocols and Periodic Operational Deviation Process
In addition to changes in the operation of the C&SF Project necessary toaccommodate the future construction of proposed major water resource developmentfeatures, revised systemwide operational protocols will be required in order to meet theincreasing human and environmental water demands of the region over the next five to 10years. Consistent operation of the C&SF Project in compliance with the revisedsystemwide operational protocols will be a critical factor in assuring projected watersupply plan performance targets are met, and the expected water resource benefits to theregion are provided.
It is also recognized that certain portions of the system may undergo periods ofstress that are either unrelated to system operations or are caused, in part, bymeteorological events which exhibit extreme high or low rainfall conditions that mayexceed the design assumptions in the plan. A process which periodically reviews andrecommends potential short-term deviations to the systemwide operational protocols areprudent. The process would be used to analyze the impacts of variations in weather andhydrologic conditions and identify opportunities for short-term operational deviations
Table 97. Estimated Schedule and Costs for the Southwest Florida Study.
Recommendation
Plan Implementation Costs ($1,000s)
FY01 FY02 FY03 FY04 FY05Total
2001-2005
Complete Southwest Florida Study 1,000 1,800 1,800 1,000 500 6,100
306

LEC Regional Water Supply Plan - Planning Document Chapter 6: Recommendations
which will offset, to some extent, the identified impacts. Therefore, it is desirable toinclude a measure of operational flexibility. This process will include public input andGoverning Board approval prior to implementation. This process will complement thesystemwide operational protocols by determining periodic operational deviations thatcould be applied to avoid or reduce potential impacts associated with extrememeteorological conditions.
District staff should reevaluate systemwide structure operations within the contextof the proposed water supply plan assumptions. These systemwide operations will alsoneed to be modified from time to time to take into account the construction of new waterresource development projects. This reevaluation should incorporate the flexibility tofacilitate short-term operational deviations to address extreme meteorological events orunanticipated negative ecological responses. This reevaluation should also incorporate theuse of a wide range of environmental, water supply (e.g., ASR), flood control and waterquality performance measures that can be used to make real time system operationaldecisions. Furthermore, the implementation of these new criteria should be accompaniedwith the development of statistical risk assessment procedures and other real time decisionsupport tools.
Recommendation 31: Systemwide Operational Protocols
Discussion
The District needs to develop a comprehensive set of revised operational protocolsthat cover all of the existing components of the South Florida Water ResourceManagement System (SFWRMS). The SFWRMS covers the entire District area andincludes the original components of the C&SF Project, as well as supplemental projectstructures constructed by the District and the Everglades Construction Project. Periodicoperational revisions to this protocol through time will also incorporate future structuresproposed by the District’s water supply plans and the CERP. Furthermore, these protocolswill implement recent and proposed programs and policies such as the following:
• MFLs
• Rain-Driven Deliveries to the Everglades
• Water Shortage Plan
• Water Supply Plan Elements
• Modified Water Deliveries Project
• C-111 Project
• Everglades Construction Project
• CERP
• Lake Okeechobee Construction Project
Operational criteria incorporates a number of interrelated elements into acomprehensive set of information that is used to develop real time operational strategies
307

Chapter 6: Recommendations LEC Regional Water Supply Plan - Planning Document
and implement changes in structure operations in response to changing meteorologicalconditions:
Operational Goals and Objectives. To ensure successful operation of theSFWRMS, a set of goals and objectives, which are consistent with the water supplyplanning processes, is required. When exercising any available flexibility containedwithin the operational criteria, it is important to ensure that decisions on specific structureoperations are focused to meet the stated objectives of the system. Therefore, a clear andconcise set of goals and objects are critical to the successful implementation of theSFWRMS operational protocols.
Real Time Performance Measures. Performance measures are a criticalcomponent to the success of the overall water resource planning process. They are used asa means to evaluate and select a preferred water resource plan based on hydrologicsimulations. Likewise, real time operations require a set of performance measures,consistent with the water supply planning processes, that can be used to insure thesuccessful implementation of the selected plan. These real time measures can be used toidentify problem areas and guide staff in the development of real time operationalstrategies that consider existing conditions in the context of changing meteorological andclimatological outlooks. The performance measures should include success criteria for allsignificant environmental components, water shortage implementation, flood controlmanagement, and water quality assessment.
Decision Support. Real time operational decisions are predominantly risk-based assessments that utilize probabilistic estimates of rainfall and other relevanthydrologic and climatological conditions to develop the most prudent set of actionsanticipated to meet the objectives of the water resource system. Therefore, acomprehensive decision support system that includes statistical position analysis tools,and other risk-based assessment protocols is required.
Flexible Operating Criteria. Criteria governing individual structure operationsare the most basic element of any water resource operating system. Generally, thesecriteria are very specific and contain limited flexibility. The criteria developed in supportof the original C&SF Project accepted that there would be few and relatively infrequentmeteorological conditions that would impose serious environmental and socioeconomicimpacts to the region. However, because of the state of technology available in the 1950sand 1960s, little could be done to foresee and react to environmental impacts that havedriven much of today’s efforts to improve the water resource system’s performance.Future development of operational criteria must provide the capability to proactively reactto rapidly changing climatological outlooks and environmental conditions. This flexibilityshould be guided by the goals and objectives of the various system element through theapplication of comprehensive performance measures. Decisions regarding changes inoperations will require concurrence from the Executive Director and Governing Boarddepending on the situation. Public input should be frequently solicited on a periodic basis.
308
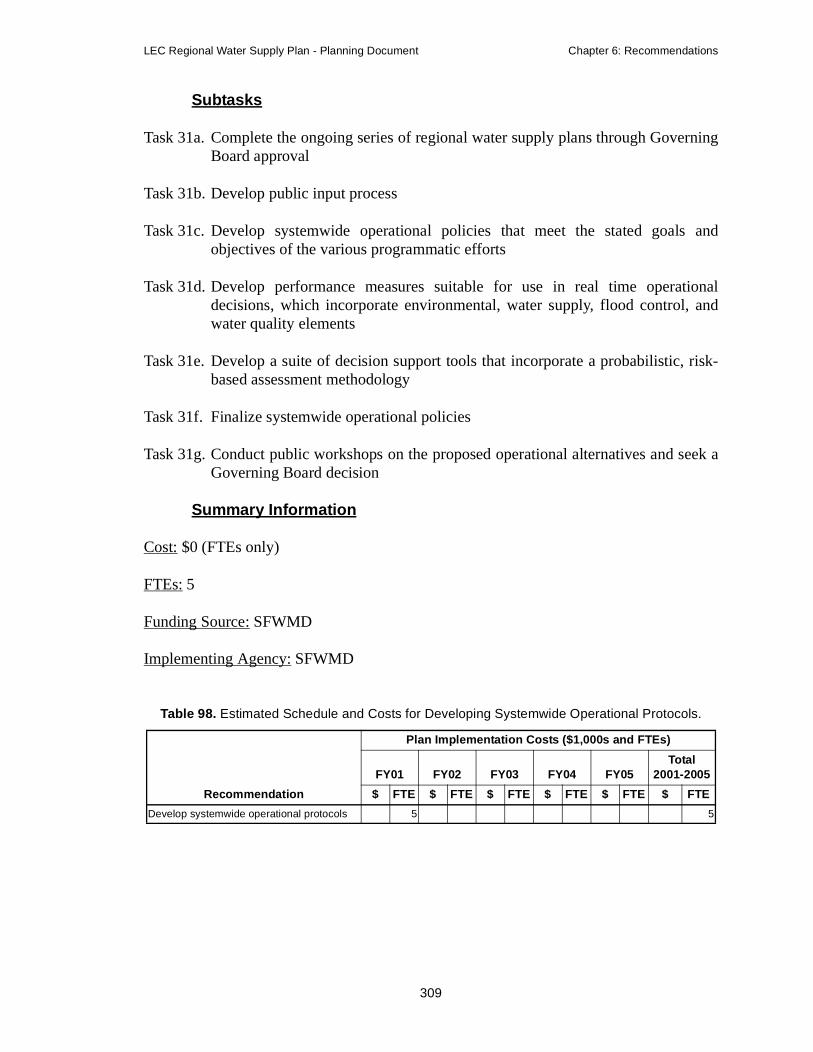
LEC Regional Water Supply Plan - Planning Document Chapter 6: Recommendations
Subtasks
Task 31a. Complete the ongoing series of regional water supply plans through GoverningBoard approval
Task 31b. Develop public input process
Task 31c. Develop systemwide operational policies that meet the stated goals andobjectives of the various programmatic efforts
Task 31d. Develop performance measures suitable for use in real time operationaldecisions, which incorporate environmental, water supply, flood control, andwater quality elements
Task 31e. Develop a suite of decision support tools that incorporate a probabilistic, risk-based assessment methodology
Task 31f. Finalize systemwide operational policies
Task 31g. Conduct public workshops on the proposed operational alternatives and seek aGoverning Board decision
Summary Information
Cost: $0 (FTEs only)
FTEs: 5
Funding Source: SFWMD
Implementing Agency: SFWMD
Table 98. Estimated Schedule and Costs for Developing Systemwide Operational Protocols.
Recommendation
Plan Implementation Costs ($1,000s and FTEs)
FY01 FY02 FY03 FY04 FY05Total
2001-2005
$ FTE $ FTE $ FTE $ FTE $ FTE $ FTE
Develop systemwide operational protocols 5 5
309

Chapter 6: Recommendations LEC Regional Water Supply Plan - Planning Document
Recommendation 32: Periodic Operational Flexibility
Discussion
The District needs to develop a process to identify and implement short-termdeviations to existing operational protocols that consider all of the existing and proposedcomponents of the SFWRMS. These periodic operational deviations in process and reviewwill cover the following geographic subregions:
• Upper Kissimmee Chain of Lakes
• Kissimmee River
• Lake Okeechobee
• Caloosahatchee River/Estuary
• St. Lucie River/Estuary
• Everglades
• Upper East Coast Planning Area
• LEC Planning Area
• Lower West Coast Planning Area
• Lake Okeechobee Service Area (LOSA)
• South Miami-Dade Agricultural Area
• Loxahatchee Slough and River
• Biscayne Bay
• Florida Bay
The regional hydrologic simulations were not structured to accurately considershort-term operational deviations that might be required to offset specific subregionalenvironmental, water supply, flood control, or water quality situations. Therefore, aprocess to develop and implement short-term operational deviations must be initiated toensure that every effort is made to meet the regional water resource goals in the next 20years as the major elements of the LEC Plan and CERP are implemented. Thesedeviations would be applied in a proactive manner utilizing long-range climate forecastsand real time performance measures. This flexibility will consider both high water andlow water conditions, and include temporary modifications to the Supply-SideManagement Plan for Lake Okeechobee. The development, implementation, andeffectiveness of these deviations would be formatted by staff and, prior to implementation,discussed with the public and include periodic public workshops, Executive Office review,and Governing Board approval.
Subtasks
Task 32a. Review target performance measures of the subregion, compare them againstactual performance, and, if stressed, determine probable cause, effect, andseverity
310

LEC Regional Water Supply Plan - Planning Document Chapter 6: Recommendations
Task 32b. Develop alternative short-term operational policies to evaluate the feasibility ofvarious options that might be applied
Task 32c. Finalize a suite of alternatives and short-term operational policies
Task 32d. Coordinate with appropriate state and federal agencies
Task 32e. Conduct a public workshop on the proposed short-term operational alternativesand seek a Governing Board decision
Summary Information
Cost: $0 (FTEs only)
FTEs: 12.5
Funding Source: SFWMD
Implementing Agency: SFWMD
Recommendation 33: Lake Okeechobee Vegetation Management Plan
Over the last six years, extreme wet periods have resulted in abnormally high lakelevels for long periods of time. These extreme high water levels have resulted in impactsto lake water quality, loss of important littoral zone vegetation communities, and havebeen reported to affect its sport fishery. The majority of scientists who have conductedresearch on the lake generally agree that a natural drought period or drawdown of the lakeinduced by man over the next several years would provide a number of ecological benefitsto the ecosystem. These benefits would include improved water quality, reestablishment ofdamaged littoral zone habitat, and improved wildlife utilization of the littoral zone.
The only negative environmental issue associated with a potential drawdown ofthe lake over the next five years is the near certainty of torpedo grass and melaleucaexpansion within upper elevations of the littoral zone. Currently, over 16,000 acres oftorpedo grass infest the western littoral zone of the lake. These plants offer poor habitat forfish and wildlife due to their dense growth form and result in low oxygen levels within thewater column. Researchers have speculated that if Moonshine Bay should become dry
Table 99. Estimated Schedule and Costs for Developing Periodic Operational Flexibility.
Recommendation
Plan Implementation Costs ($1,000s and FTEs)
FY01 FY02 FY03 FY04 FY05Total
2001-2005
$ FTE $ FTE $ FTE $ FTE $ FTE $ FTE
Develop periodic operational flexibility 2.5 2.5 2.5 2.5 2.5 12.5
311
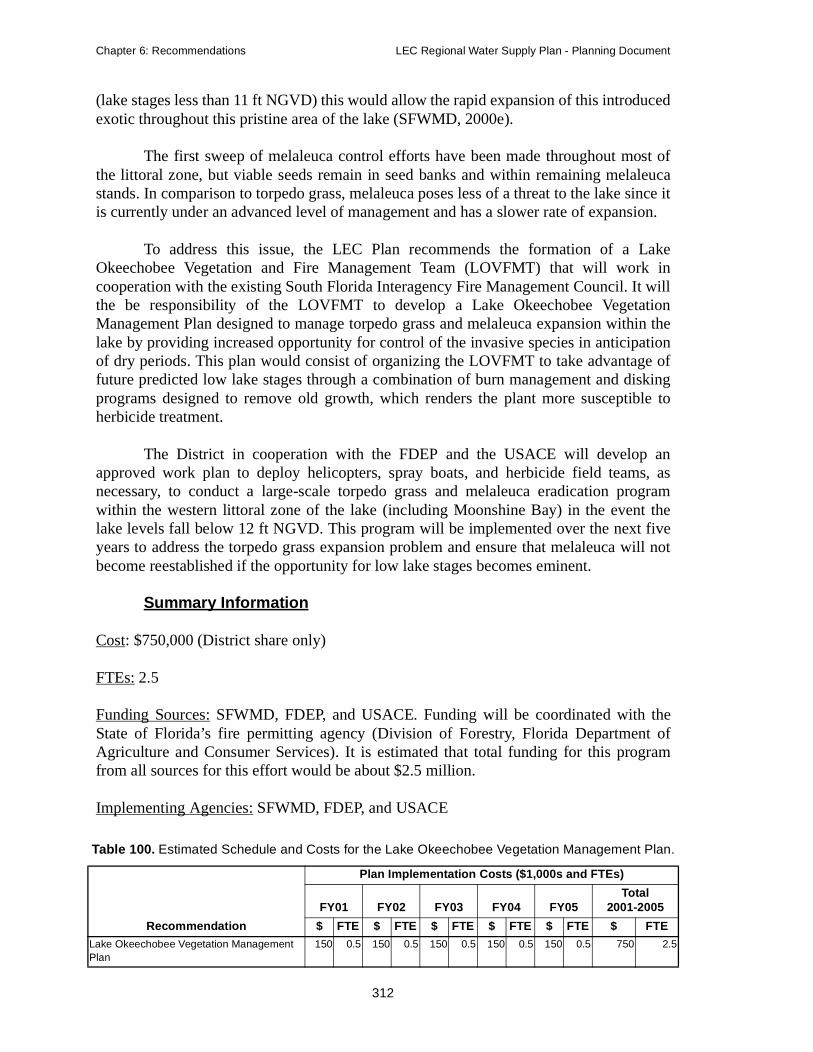
Chapter 6: Recommendations LEC Regional Water Supply Plan - Planning Document
(lake stages less than 11 ft NGVD) this would allow the rapid expansion of this introducedexotic throughout this pristine area of the lake (SFWMD, 2000e).
The first sweep of melaleuca control efforts have been made throughout most ofthe littoral zone, but viable seeds remain in seed banks and within remaining melaleucastands. In comparison to torpedo grass, melaleuca poses less of a threat to the lake since itis currently under an advanced level of management and has a slower rate of expansion.
To address this issue, the LEC Plan recommends the formation of a LakeOkeechobee Vegetation and Fire Management Team (LOVFMT) that will work incooperation with the existing South Florida Interagency Fire Management Council. It willthe be responsibility of the LOVFMT to develop a Lake Okeechobee VegetationManagement Plan designed to manage torpedo grass and melaleuca expansion within thelake by providing increased opportunity for control of the invasive species in anticipationof dry periods. This plan would consist of organizing the LOVFMT to take advantage offuture predicted low lake stages through a combination of burn management and diskingprograms designed to remove old growth, which renders the plant more susceptible toherbicide treatment.
The District in cooperation with the FDEP and the USACE will develop anapproved work plan to deploy helicopters, spray boats, and herbicide field teams, asnecessary, to conduct a large-scale torpedo grass and melaleuca eradication programwithin the western littoral zone of the lake (including Moonshine Bay) in the event thelake levels fall below 12 ft NGVD. This program will be implemented over the next fiveyears to address the torpedo grass expansion problem and ensure that melaleuca will notbecome reestablished if the opportunity for low lake stages becomes eminent.
Summary Information
Cost: $750,000 (District share only)
FTEs: 2.5
Funding Sources: SFWMD, FDEP, and USACE. Funding will be coordinated with theState of Florida’s fire permitting agency (Division of Forestry, Florida Department ofAgriculture and Consumer Services). It is estimated that total funding for this programfrom all sources for this effort would be about $2.5 million.
Implementing Agencies: SFWMD, FDEP, and USACE
Table 100. Estimated Schedule and Costs for the Lake Okeechobee Vegetation Management Plan.
Recommendation
Plan Implementation Costs ($1,000s and FTEs)
FY01 FY02 FY03 FY04 FY05Total
2001-2005
$ FTE $ FTE $ FTE $ FTE $ FTE $ FTELake Okeechobee Vegetation Management Plan
150 0.5 150 0.5 150 0.5 150 0.5 150 0.5 750 2.5
312
LEC Regional Water Supply Plan - Planning Document Chapter 6: Recommendations
Consumptive Use Permitting and Resource Protection Projects
Implementation of the LEC Plan through CUP and resource protection actions willtake place consistent with Florida law, utilizing the assurances framework developed bythe Governor’s Commission for a Sustainable South Florida and included in the CERP.
As one of the tools for plan implementation, rulemaking to implement theregulatory recommendations of the LEC Plan will constitute a significant effort during thenext several years. Rulemaking will include water reservations and numerous CUPcriteria, which are interrelated and cumulatively define the availability of water forconsumptive uses and water resource protection. As a result, it is recommended in theLEC Plan that certain rulemaking efforts be grouped in phases to allow for the cumulativeanalysis of the water resource and consumptive use implications of the regulatoryprogram.
Another goal of the rulemaking schedule is to adopt rules as the technicalinformation becomes available. As a result, it is recommended in this plan that initialrulemaking proceed for concepts that were sufficiently identified and evaluated in theplanning process. These include establishment of MFLs for the Everglades, LakeOkeechobee, the Biscayne Aquifer, and the Caloosahatchee River.
In addition, uncertainties in the rulemaking process, such as delays fordevelopment of supporting technical data or rule challenges, may conflict with theproposed schedule for rule development provided in this plan. The proposed schedule willbe adapted to account for such delays, while considering the need to develop associatedrules through a coordinated rulemaking process. The contingency process identified in theplan, along with input from the LEC Regional Water Supply Plan Advisory Committee,other members of the public, and the Governing Board may be used to identify necessarychanges to the rulemaking schedule.
Recommendation 34: Water Reservations
Discussion
Water reservations need to be established where necessary to assure the public ofthe availability of water specific to locations for the protection of fish and wildlife orprotection of public health and safety based on the discussion in Chapter 5. In Chapter 5,a legal, policy, and technical description of reservations and necessary implementationactions is provided.
Subtasks
Task 34a. For all reservation locations, quantify water for reservation, based onincremental increases in water availability associated with the proposedimplementation of water resource development projects; identify assumptionsused in incremental reservation increases, including water resourcedevelopment projects proposed to augment or create reservation water supplies;
313
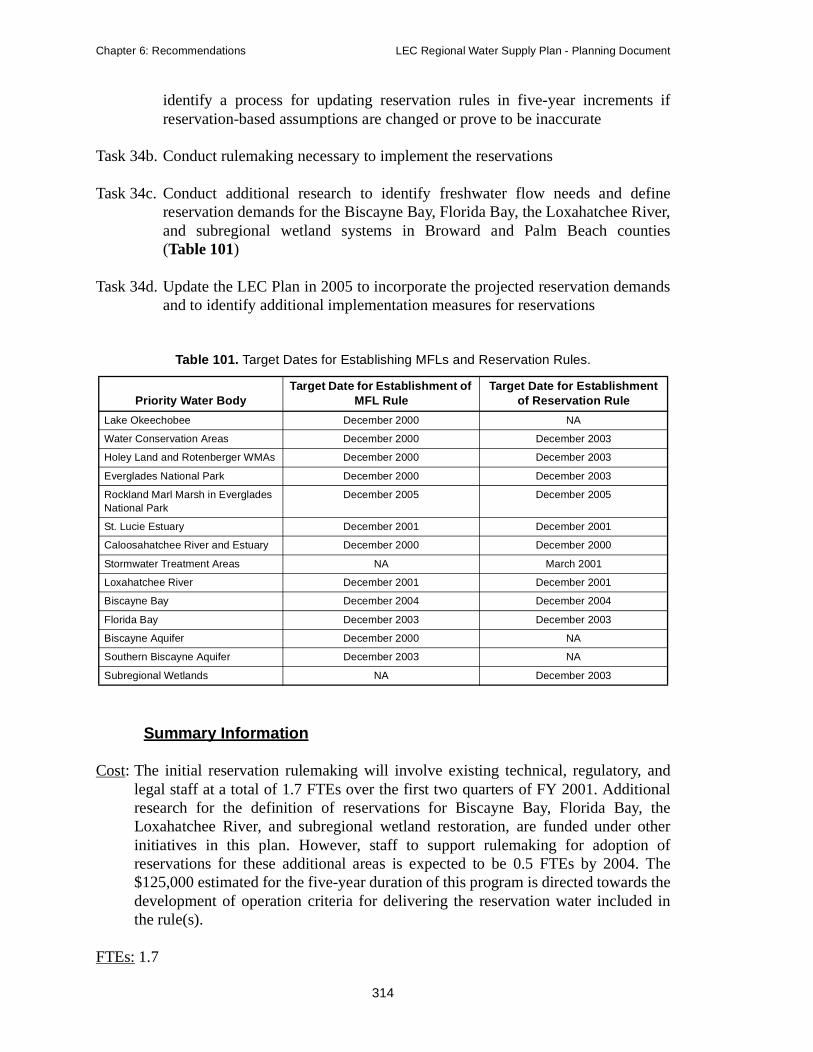
Chapter 6: Recommendations LEC Regional Water Supply Plan - Planning Document
identify a process for updating reservation rules in five-year increments ifreservation-based assumptions are changed or prove to be inaccurate
Task 34b. Conduct rulemaking necessary to implement the reservations
Task 34c. Conduct additional research to identify freshwater flow needs and definereservation demands for the Biscayne Bay, Florida Bay, the Loxahatchee River,and subregional wetland systems in Broward and Palm Beach counties(Table 101)
Task 34d. Update the LEC Plan in 2005 to incorporate the projected reservation demandsand to identify additional implementation measures for reservations
Summary Information
Cost: The initial reservation rulemaking will involve existing technical, regulatory, andlegal staff at a total of 1.7 FTEs over the first two quarters of FY 2001. Additionalresearch for the definition of reservations for Biscayne Bay, Florida Bay, theLoxahatchee River, and subregional wetland restoration, are funded under otherinitiatives in this plan. However, staff to support rulemaking for adoption ofreservations for these additional areas is expected to be 0.5 FTEs by 2004. The$125,000 estimated for the five-year duration of this program is directed towards thedevelopment of operation criteria for delivering the reservation water included inthe rule(s).
FTEs: 1.7
Table 101. Target Dates for Establishing MFLs and Reservation Rules.
Priority Water BodyTarget Date for Establishment of
MFL RuleTarget Date for Establishment
of Reservation Rule
Lake Okeechobee December 2000 NA
Water Conservation Areas December 2000 December 2003
Holey Land and Rotenberger WMAs December 2000 December 2003
Everglades National Park December 2000 December 2003
Rockland Marl Marsh in Everglades National Park
December 2005 December 2005
St. Lucie Estuary December 2001 December 2001
Caloosahatchee River and Estuary December 2000 December 2000
Stormwater Treatment Areas NA March 2001
Loxahatchee River December 2001 December 2001
Biscayne Bay December 2004 December 2004
Florida Bay December 2003 December 2003
Biscayne Aquifer December 2000 NA
Southern Biscayne Aquifer December 2003 NA
Subregional Wetlands NA December 2003
314

LEC Regional Water Supply Plan - Planning Document Chapter 6: Recommendations
Funding Source: SFWMD
Implementing Agency: SFWMD
Recommendation 35: Establish MFLs
Discussion
Establish MFLs by rule by December 2000 for Lake Okeechobee, EvergladesNational Park, and the WCAs, the Biscayne aquifer (north of the C-2 Canal), and theCaloosahatchee River and Estuary. Develop and establish MFLs for the LoxahatcheeRiver and St. Lucie Estuary by 2001, the southern Biscayne aquifer by 2003, and forBiscayne Bay by 2004. Funding and manpower estimates are associated with therulemaking and peer review process only. Funding and manpower associated with datacollection and research are incorporated as separate recommendations.
Subtasks
Task 35a. Complete research on Biscayne Bay, St. Lucie Estuary, and the southern coastalBiscayne aquifer
Task 35b. Finalize the MFL criteria development process
Task 35c. Incorporate proposed MFLs and recovery and prevention strategies into therulemaking process consistent with the dates for establishment identified above(Table 101)
Task 35d. Conduct public workshops on rule language, notice draft rule with FAW, andseek Governing Board authorization of rule
Summary Information
Cost: $80,000 over five years (peer review and rulemaking process only)
FTEs: 1.3
Funding Source: SFWMD
Table 102. Estimated Schedule and Costs for Reservation of Water.
Recommendation
Plan Implementation Costs ($1,000s and FTEs)
FY01 FY02 FY03 FY04 FY05Total
2001-2005
$ FTE $ FTE $ FTE $ FTE $ FTE $ FTE
Water Reservations 50 0.7 0.3 75 0.5 0.2 125 1.7
315
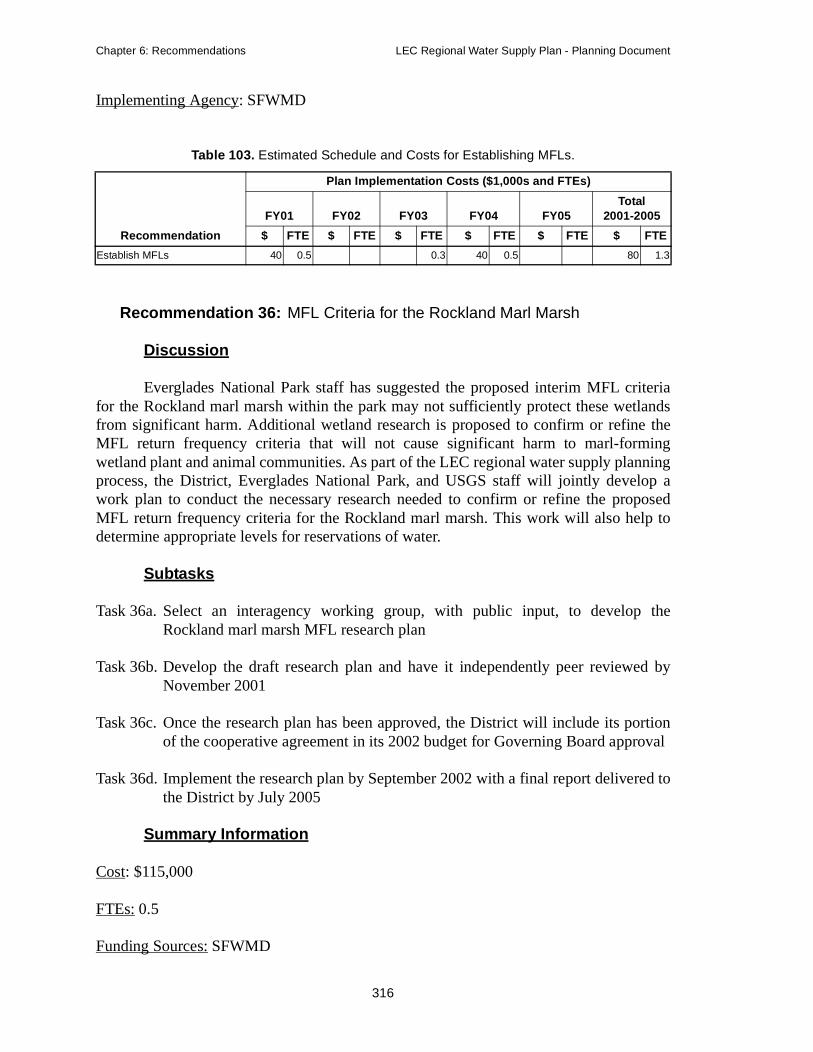
Chapter 6: Recommendations LEC Regional Water Supply Plan - Planning Document
Implementing Agency: SFWMD
Recommendation 36: MFL Criteria for the Rockland Marl Marsh
Discussion
Everglades National Park staff has suggested the proposed interim MFL criteriafor the Rockland marl marsh within the park may not sufficiently protect these wetlandsfrom significant harm. Additional wetland research is proposed to confirm or refine theMFL return frequency criteria that will not cause significant harm to marl-formingwetland plant and animal communities. As part of the LEC regional water supply planningprocess, the District, Everglades National Park, and USGS staff will jointly develop awork plan to conduct the necessary research needed to confirm or refine the proposedMFL return frequency criteria for the Rockland marl marsh. This work will also help todetermine appropriate levels for reservations of water.
Subtasks
Task 36a. Select an interagency working group, with public input, to develop theRockland marl marsh MFL research plan
Task 36b. Develop the draft research plan and have it independently peer reviewed byNovember 2001
Task 36c. Once the research plan has been approved, the District will include its portionof the cooperative agreement in its 2002 budget for Governing Board approval
Task 36d. Implement the research plan by September 2002 with a final report delivered tothe District by July 2005
Summary Information
Cost: $115,000
FTEs: 0.5
Funding Sources: SFWMD
Table 103. Estimated Schedule and Costs for Establishing MFLs.
Recommendation
Plan Implementation Costs ($1,000s and FTEs)
FY01 FY02 FY03 FY04 FY05Total
2001-2005
$ FTE $ FTE $ FTE $ FTE $ FTE $ FTE
Establish MFLs 40 0.5 0.3 40 0.5 80 1.3
316
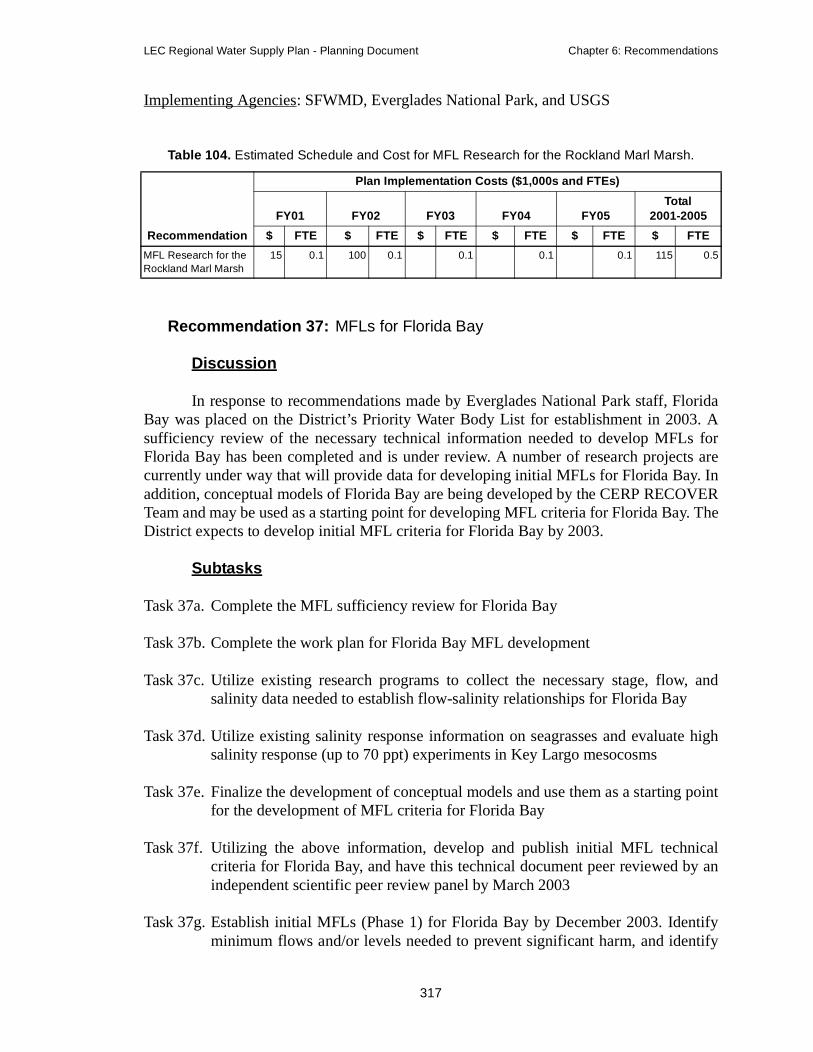
LEC Regional Water Supply Plan - Planning Document Chapter 6: Recommendations
Implementing Agencies: SFWMD, Everglades National Park, and USGS
Recommendation 37: MFLs for Florida Bay
Discussion
In response to recommendations made by Everglades National Park staff, FloridaBay was placed on the District’s Priority Water Body List for establishment in 2003. Asufficiency review of the necessary technical information needed to develop MFLs forFlorida Bay has been completed and is under review. A number of research projects arecurrently under way that will provide data for developing initial MFLs for Florida Bay. Inaddition, conceptual models of Florida Bay are being developed by the CERP RECOVERTeam and may be used as a starting point for developing MFL criteria for Florida Bay. TheDistrict expects to develop initial MFL criteria for Florida Bay by 2003.
Subtasks
Task 37a. Complete the MFL sufficiency review for Florida Bay
Task 37b. Complete the work plan for Florida Bay MFL development
Task 37c. Utilize existing research programs to collect the necessary stage, flow, andsalinity data needed to establish flow-salinity relationships for Florida Bay
Task 37d. Utilize existing salinity response information on seagrasses and evaluate highsalinity response (up to 70 ppt) experiments in Key Largo mesocosms
Task 37e. Finalize the development of conceptual models and use them as a starting pointfor the development of MFL criteria for Florida Bay
Task 37f. Utilizing the above information, develop and publish initial MFL technicalcriteria for Florida Bay, and have this technical document peer reviewed by anindependent scientific peer review panel by March 2003
Task 37g. Establish initial MFLs (Phase 1) for Florida Bay by December 2003. Identifyminimum flows and/or levels needed to prevent significant harm, and identify
Table 104. Estimated Schedule and Cost for MFL Research for the Rockland Marl Marsh.
Recommendation
Plan Implementation Costs ($1,000s and FTEs)
FY01 FY02 FY03 FY04 FY05Total
2001-2005
$ FTE $ FTE $ FTE $ FTE $ FTE $ FTE
MFL Research for the Rockland Marl Marsh
15 0.1 100 0.1 0.1 0.1 0.1 115 0.5
317

Chapter 6: Recommendations LEC Regional Water Supply Plan - Planning Document
the amount of water needed to restore Florida Bay and establish a reservation ofwater to protect the ecosystem
Task 37h. Develop a Florida Bay water quality model and incorporate trophic levelresponses
Task 37i. Utilize water quality models to establish Phase 2 MFLs for Florida Bay
Summary Information
Cost: $850,000
FTEs: 11.5
Funding Source: SFWMD
Implementing Agencies: SFWMD and Everglades National Park
Recommendation 38: MFL Recovery Strategies
Pursuant to the requirements of the MFL statute, analyses of current and futureconditions were conducted for each of the priority water bodies where MFLs weredefined. When the evaluation showed MFLs are not or will not be met in the future,recovery or prevention strategies, as appropriate, were developed. See Chapter 5, page227, for a more detailed discussion of MFL recovery strategies.
Subtasks
Task 38a. Complete the design, permitting, and construction of CERP related long-termrecovery strategies
Task 38b. Develop and implement operational protocols for releasing water from regionalstorage, as conditions warrant, to prevent the MFL criteria from being exceededprior to implementation of long-term recovery measures. SeeRecommendation 31 and 32 for more information.
Table 105. Estimated Schedule and Cost for MFLs for the Florida Bay.
Recommendation
Plan Implementation Costs ($1,000s and FTEs)
FY01 FY02 FY03 FY04 FY05Total
2001-2005
$ FTE $ FTE $ FTE $ FTE $ FTE $ FTE
MFLs for the Florida Bay
200 2.5 250 2.5 150 2.5 125 2.0 125 2.0 850 11.5
318

LEC Regional Water Supply Plan - Planning Document Chapter 6: Recommendations
Task 38c. Complete rulemaking that: a) defines regional water supply to coastal serviceareas during 1-in-10 year drought conditions consistent with environmentalrestoration and water resource development implementation schedules; b)addresses permit duration and limits on the amounts of reasonable newdemands on regional water supply in five-year increments; c) establishesenhanced water conservation measures for water users; and d) establishes waterreservations for the Everglades system.
Summary Information
Cost: $200,000
FTEs: 1
Funding Source: SFWMD
Implementing Agencies: SFWMD
Recommendation 39: MFL Monitoring Systems
Discussion
Monitoring systems must be established in order to implement MFL recovery andprevention strategies and conduct research necessary to further refine the ability to projectwhen significant harm could occur. The monitoring systems will collect water flow, waterlevel, and water quality data. Monitoring data is necessary to affect interim operationalstrategies and to gage the success of MFL long-term recovery and prevention strategies.
Subtasks
Task 39a. Identify appropriate locations within the LEC planning area to establish a long-term MFL monitoring network. Review and evaluate the location of currentwater management gages. Relocate and/or install appropriate lake, estuary,marsh, and canal gaging stations and associated telemetry within eachidentified MFL priority water body
Table 106. Estimated Schedule and Cost for MFL Recovery Strategies.
Recommendation
Plan Implementation Costs ($1,000s and FTEs)
FY01 FY02 FY03 FY04 FY05Total
2001-2005
$ FTE $ FTE $ FTE $ FTE $ FTE $ FTE
MFL recovery strategies
75 0.2 50 0.2 25 0.2 25 0.02 25 0.2 200 1.0
319

Chapter 6: Recommendations LEC Regional Water Supply Plan - Planning Document
Task 39b. Develop an interactive database to collect and store MFL data that will providewater managers with real time information that can be used to make operationaldecisions
Task 39c. Conduct field and laboratory research and monitoring programs designed toevaluate the effects of implementing the proposed MFL criteria proposed aspart of this plan. Include both long-term and short-term projects that willevaluate the effects of the proposed criteria at scales ranging from laboratorystudies to field monitoring at specific sites. Provide summaries of the results ofthis research for incorporation into the next update of the LEC Plan.
Summary Information
Cost: $550,000
FTEs: 1.5
Funding Source: SFWMD
Implementing Agencies: SFWMD
Recommendation 40: Consumptive Use Permitting, Rulemaking, and Resource Protection Projects
Discussion
The District will continue conducting the rule development and rulemakingprocesses for the subjects listed in Chapter 5 in the section on Consumptive UsePermitting and Resource Protection Projects. These concepts are conceptually laid outin a series of white papers produced in 19991 and Districtwide rule developmentworkshops were conducted on these rule concepts in February 1999.
Subtasks
Task 40a. Develop draft rules for public review
Table 107. Estimated Schedule and Cost for Establishing a MFL Monitoring System.
Recommendation
Plan Implementation Costs ($1,000s and FTEs)
FY01 FY02 FY03 FY04 FY05Total
2001-2005
$ FTE $ FTE $ FTE $ FTE $ FTE $ FTE
Establish a MFL Monitoring System
50 0.2 200 0.4 200 0.5 50 0.2 50 0.2 550 1.5
1. These white papers can be obtained by contacting the District’s Office of Counsel.
320

LEC Regional Water Supply Plan - Planning Document Chapter 6: Recommendations
Task 40b. Conduct rulemaking workshops
Task 40c. Revise draft language per public comments and Governing Board direction inorder to produce a final draft of the rule
Task 40d. Notice final draft of the rule in FAW and schedule Governing Board adoption ofthe final draft rule in the fall of 20001
Task 40e. Modify ground water models for application to the CUP review process.
Summary Information
Cost: $0
FTEs: 0.5
Funding Source: SFWMD
Implementing Agency: SFWMD
Other Water Resource Projects
Recommendation 41: Comprehensive Water Conservation Program
Discussion
The District will develop and implement a comprehensive water conservationprogram to cultivate a conservation ethic in cooperation with water users, utilities, andlocal governments to promote water conservation and more efficient use of the waterresources in the LEC Planning Area. The conservation program will incorporate continueddevelopment and compliance with water conservation ordinances, development andimplementation of public education programs, use of alternative water sources, otherconservation methods, and document new and existing water conservation efforts. Theconservation program will encompass all uses, but should provide emphasis on the outsideuse of water and Xeriscape™ principles. This program and position will be implementedDistrictwide and focus on urban areas and outdoor uses.
The creation of a water conservation coordinator position and provisions for fiscalincentives are envisioned as potential tools to establish the water conservation plan. Thisposition will be created from an existing position. It will focus on the development of acomprehensive water conservation program and establishment of a strong waterconservation ethic. The coordinator will also assist water users and utilities to furtherpublic education and to develop their own customized water conservation program andestablish numeric efficiency goals that are cost-effective and achievable.
1. The schedule for rule adoption will be subject to possible third party challenges and concerns.
321

Chapter 6: Recommendations LEC Regional Water Supply Plan - Planning Document
Subtasks
Task 41a. Redirect an existing position to a water conservation coordination position
Task 41b. Develop a comprehensive conservation plan in cooperation with water users,utilities, and local governments, including development of a goal andobjectives, by September 2001, capable of the following:
• Identification of inefficiencies in water use
• Identification of projects and programs to improve water useefficiency through incentive and regulatory approaches
• An evaluation of the effectiveness of various options in meetingthe existing and projected needs of the project area
• Identification of specific conservation measures that should beincorporated in the update to this plan
• Development and implementation of public education programs
• Assistance to local governments in development of waterconservation ordinances, land use regulations, and complianceprograms
• Optimization of use of the CUP Program and Development ofRegional Impacts (DRI) review abilities to implementconservation
Task 41c. Identification of cost sharing or incentive programs
Task 41d. Development of numeric efficiency goals for each major user/project area
Summary Information
Cost: $250,000 per year for 2001-2004 (LEC Planning Area portion only)
FTEs: 3.75 (75 percent of Districtwide total)
Funding Source: SFWMD
Implementing Agency: SFWMD
322
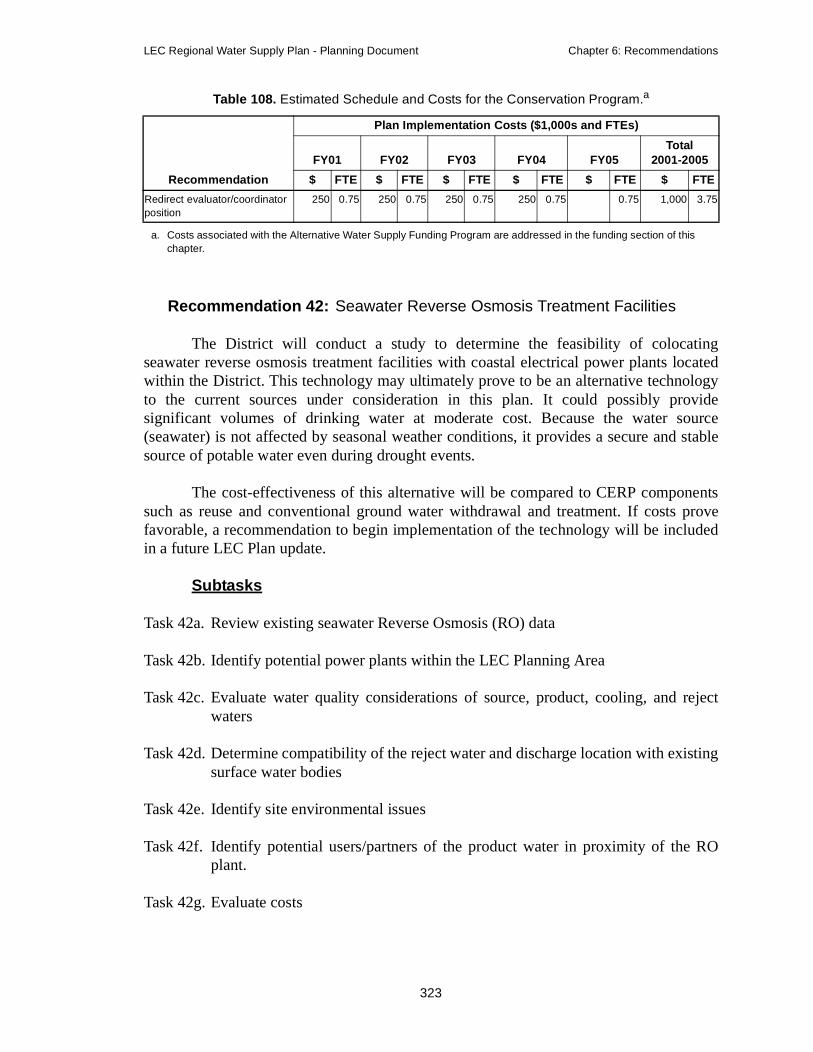
LEC Regional Water Supply Plan - Planning Document Chapter 6: Recommendations
Recommendation 42: Seawater Reverse Osmosis Treatment Facilities
The District will conduct a study to determine the feasibility of colocatingseawater reverse osmosis treatment facilities with coastal electrical power plants locatedwithin the District. This technology may ultimately prove to be an alternative technologyto the current sources under consideration in this plan. It could possibly providesignificant volumes of drinking water at moderate cost. Because the water source(seawater) is not affected by seasonal weather conditions, it provides a secure and stablesource of potable water even during drought events.
The cost-effectiveness of this alternative will be compared to CERP componentssuch as reuse and conventional ground water withdrawal and treatment. If costs provefavorable, a recommendation to begin implementation of the technology will be includedin a future LEC Plan update.
Subtasks
Task 42a. Review existing seawater Reverse Osmosis (RO) data
Task 42b. Identify potential power plants within the LEC Planning Area
Task 42c. Evaluate water quality considerations of source, product, cooling, and rejectwaters
Task 42d. Determine compatibility of the reject water and discharge location with existingsurface water bodies
Task 42e. Identify site environmental issues
Task 42f. Identify potential users/partners of the product water in proximity of the ROplant.
Task 42g. Evaluate costs
Table 108. Estimated Schedule and Costs for the Conservation Program.a
Recommendation
Plan Implementation Costs ($1,000s and FTEs)
FY01 FY02 FY03 FY04 FY05Total
2001-2005
$ FTE $ FTE $ FTE $ FTE $ FTE $ FTE
Redirect evaluator/coordinator position
250 0.75 250 0.75 250 0.75 250 0.75 0.75 1,000 3.75
a. Costs associated with the Alternative Water Supply Funding Program are addressed in the funding section of thischapter.
323
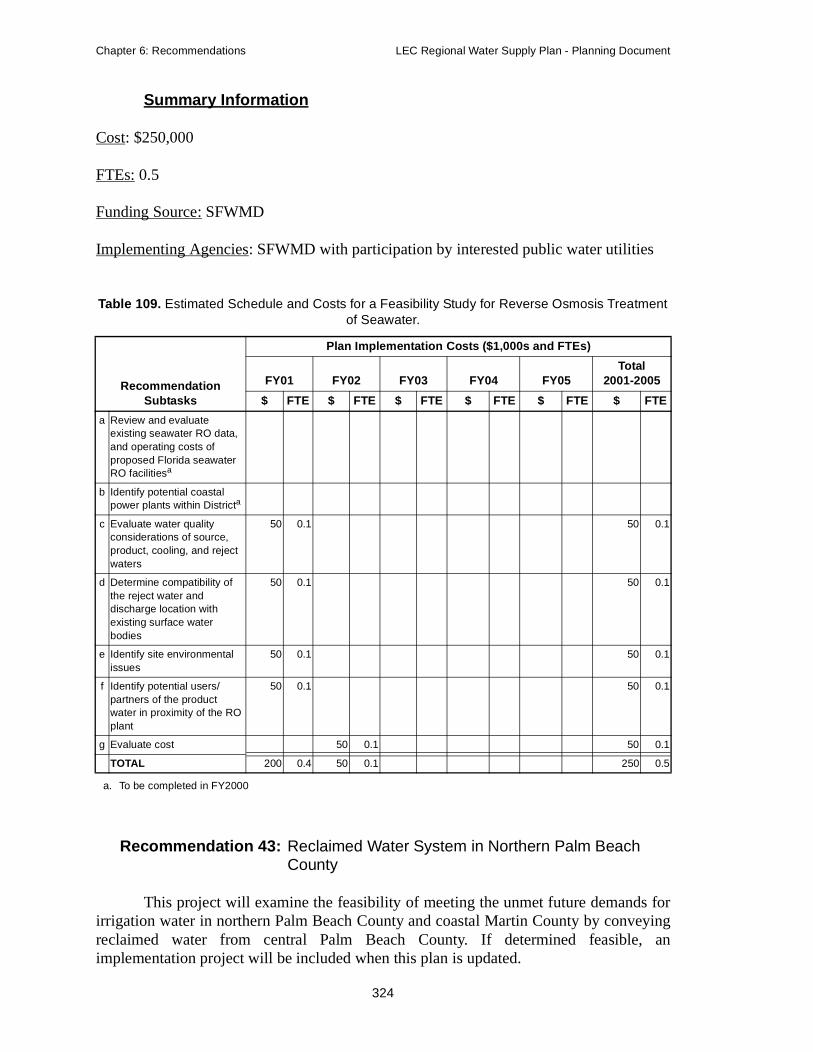
Chapter 6: Recommendations LEC Regional Water Supply Plan - Planning Document
Summary Information
Cost: $250,000
FTEs: 0.5
Funding Source: SFWMD
Implementing Agencies: SFWMD with participation by interested public water utilities
Recommendation 43: Reclaimed Water System in Northern Palm Beach County
This project will examine the feasibility of meeting the unmet future demands forirrigation water in northern Palm Beach County and coastal Martin County by conveyingreclaimed water from central Palm Beach County. If determined feasible, animplementation project will be included when this plan is updated.
Table 109. Estimated Schedule and Costs for a Feasibility Study for Reverse Osmosis Treatment of Seawater.
Recommendation Subtasks
Plan Implementation Costs ($1,000s and FTEs)
FY01 FY02 FY03 FY04 FY05Total
2001-2005
$ FTE $ FTE $ FTE $ FTE $ FTE $ FTE
a Review and evaluate existing seawater RO data, and operating costs of proposed Florida seawater RO facilitiesa
a. To be completed in FY2000
b Identify potential coastal power plants within Districta
c Evaluate water quality considerations of source, product, cooling, and reject waters
50 0.1 50 0.1
d Determine compatibility of the reject water and discharge location with existing surface water bodies
50 0.1 50 0.1
e Identify site environmental issues
50 0.1 50 0.1
f Identify potential users/partners of the product water in proximity of the RO plant
50 0.1 50 0.1
g Evaluate cost 50 0.1 50 0.1
TOTAL 200 0.4 50 0.1 250 0.5
324
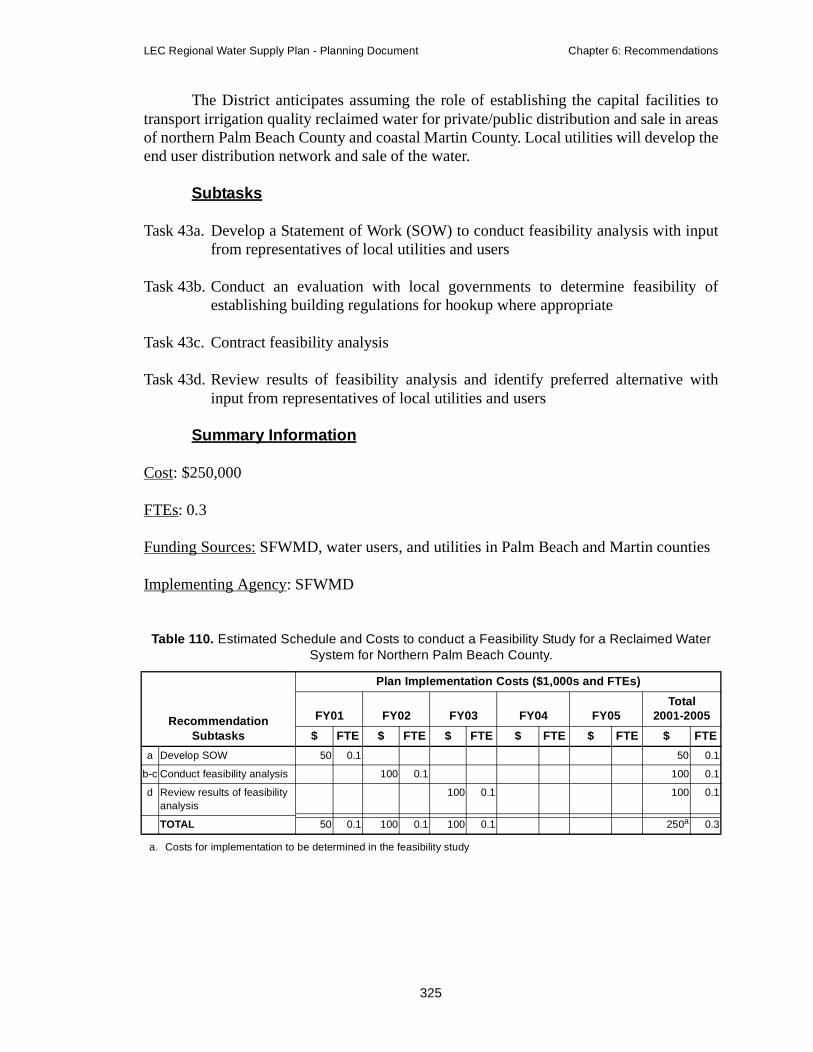
LEC Regional Water Supply Plan - Planning Document Chapter 6: Recommendations
The District anticipates assuming the role of establishing the capital facilities totransport irrigation quality reclaimed water for private/public distribution and sale in areasof northern Palm Beach County and coastal Martin County. Local utilities will develop theend user distribution network and sale of the water.
Subtasks
Task 43a. Develop a Statement of Work (SOW) to conduct feasibility analysis with inputfrom representatives of local utilities and users
Task 43b. Conduct an evaluation with local governments to determine feasibility ofestablishing building regulations for hookup where appropriate
Task 43c. Contract feasibility analysis
Task 43d. Review results of feasibility analysis and identify preferred alternative withinput from representatives of local utilities and users
Summary Information
Cost: $250,000
FTEs: 0.3
Funding Sources: SFWMD, water users, and utilities in Palm Beach and Martin counties
Implementing Agency: SFWMD
Table 110. Estimated Schedule and Costs to conduct a Feasibility Study for a Reclaimed Water System for Northern Palm Beach County.
Recommendation Subtasks
Plan Implementation Costs ($1,000s and FTEs)
FY01 FY02 FY03 FY04 FY05Total
2001-2005
$ FTE $ FTE $ FTE $ FTE $ FTE $ FTE
a Develop SOW 50 0.1 50 0.1
b-c Conduct feasibility analysis 100 0.1 100 0.1
d Review results of feasibility analysis
100 0.1 100 0.1
TOTAL 50 0.1 100 0.1 100 0.1 250a
a. Costs for implementation to be determined in the feasibility study
0.3
325
Chapter 6: Recommendations LEC Regional Water Supply Plan - Planning Document
Recommendation 44: Indirect Aquifer Recharge
Discussion
The feasibility of recharging primary or secondary canals with wastewater treatedto Advanced Wastewater Treatment (AWT) standards in conjunction with a cooperativeutility will be explored. The focus of this project will be on issues not currently consideredin related CERP projects. If economical feasibility is found, a pilot project will berecommended in the update of this plan. Success of the pilot project will ultimately lead tothe development of full-scale projects throughout the region.
This source of water is expected to reduce the dry season demands on the regionalsystem and serve as a source of water for recharging ground water and/or meeting localenvironmental demands. The project will be developed to identify and address regulatoryrequirements to move this use of water forward. FDEP will be part of the project teamseeking to determine the appropriate treatment and timing of reclaimed water use. Thereclaimed water recharge sources would be used only during dry conditions. Alternative,environmentally accepted disposal methods will continue to be necessary during the wetseason.
Subtasks
Task 44a. Form interagency project team consisting of the FDEP, Broward, Palm Beach,and Miami-Dade counties, and the District
Task 44b. Identify data collection needs
Task 44c. Collect data
Task 44d. Determine feasibility
Summary Information
Cost: $250,000
FTEs: 0.3
Funding Sources: FDEP, SFWMD, county, or utility
Implementing Agencies: FDEP, SFWMD, county, or utility
326

LEC Regional Water Supply Plan - Planning Document Chapter 6: Recommendations
Recommendation 45: High Volume Surface Water ASR Testing in Taylor Creek
Discussion
Currently the only ASR well with an USEPA authorized, aquifer exemptioncovering primary water quality parameters is owned by the District and is located byTaylor Creek in Okeechobee County. The well was permitted, constructed, and tested at acapacity of five-MGD during the late 1980s. Results of that testing suggest the mid-Floridan aquifer may be capable of receiving and storing surface water at much largeinjection rates than five MGD. It is recommended that the well be modified to supportinjection/recovery testing at rates of 20 MGD. The ability for wells constructed into themid-Eocene portion of the Floridan aquifer to operate at 20 MGD versus five/ten MGDrepresents potential to save time and cost from the Lake Okeechobee ASR systemrecommended in the CERP.
The well is currently in disrepair and needs a FDEP underground injectionoperation permit, at a minimum, prior to additional testing. It is estimated that the cost toacquire permits, refurbish the well, and upgrade the pumping capacity would be $750,000and would take 12 months to complete. The costs to conduct the high capacity testingwould be approximately $100,000.
Subtasks
Task 45a. Conduct a baseline assessment of the well including compilation of all existingdata, conduct a casing integrity test on the production well, determine thefeasibility to proceed, and file applications for FDEP permits
Task 45b. Prepare specifications for well rehabilitation, injection pump upgrade, andtesting protocol
Task 45c. Contract for either construction or abandonment, based on above evaluations
Task 45d. Conduct high capacity testing
Task 45e. Incorporate results into CERP designs
Table 111. Estimated Schedule and Costs for the Aquifer Recharge Study.
Recommendation
Plan Implementation Costs ($1,000s and FTEs)
FY01 FY02 FY03 FY04 FY05Total
2001-2005
$ FTE $ FTE $ FTE $ FTE $ FTE $ FTE
Aquifer Recharge Study 100 0.1 100 0.1 50 0.1 250a 0.3
a. Implementation costs will be determined by the study
327

Chapter 6: Recommendations LEC Regional Water Supply Plan - Planning Document
Costs: $900,000
FTEs: 0.7
WATER SUPPLY DEVELOPMENT PROJECTS
Some wellfields continue to indicate an increased threat of saltwater intrusion maynot be able to meet a 1-in-10 year level of certainty in 2020. These are Lantana, LakeWorth, Manalapan, Boca Raton, Broward 3A, 3B, and 3C, Hollywood, Dania Beach, andHallandale Beach. Their projected 2020 demands may not be able to be met at theircurrent wellfield locations. Additionally, a few utilities may meet the 1-in-10 year level ofcertainty goal, but may not meet CUP criteria. These include Seacoast, Jupiter, RivieraBeach, Pompano Beach, Boca Raton, Miami-Dade’s proposed South Regional and Westwellfields, North Miami Beach, North Miami, and Homestead. The 2005, 2010, and 2015incremental simulations indicated superior performance when utilizing the same wellfielddistribution in the LEC-1 simulation. To meet the 1-in-10 year level of certainty andreduce the threat of saltwater intrusion in the near-term, the identified demands may needto be shifted from coastal wellfields. The individual utilites may consider other watersupply options. Modeling confirmed that alternative sources are available. Chapter 5 alsoidentified quantities of water available for each water supply option. The analysisconcludes that the water supply options can be considered a menu from which local waterusers can select a combination of sources to meeting their individual water needs.
Recommendation 46: Water Supply Development
The recommendation of this plan is that individual water users evaluate alternativewater supply sources and select the alternative, or combination of alternatives, which bestsuits local conditions. The District will continue to evaluate consumptive uses for theirimpacts on both the regional system and local resources on a case-by-case basis.
Table 112. Estimated Schedule and Costs for High Volume Surface Water ASR Testing for Taylor Creek.
Recommendation Subtasks
Plan Implementation Costs ($1,000s and FTEs)
FY01 FY02 FY03 FY04 FY05Total
2001-2005
$ FTE $ FTE $ FTE $ FTE $ FTE $ FTE
a Baseline assessment 100 0.1 100 0.1
b Prepare specifications 50 0.1 50 0.1
c Construct facilities 700 0.1 700 0.1
d High capacity testing 50 0.2 50 0.2
e Incorporate results into CERP
0.2 0.2
TOTAL 150 0.2 700 0.1 50 0.4 900 0.7
328
LEC Regional Water Supply Plan - Planning Document Chapter 6: Recommendations
RELATIONSHIP OF PROJECTS TO THE FIVE-YEAR WORK PROGRAM
The District is required to prepare a five-year water resource development workprogram every year. This report, submitted to FDEP, documents the District’s progress inimplementing water supply plan recommendations. The time frame for the work programis a five-year minimum. For each recommendation or strategy, the work program willprovide the following information:
• The total cost to the District of the project
• An estimate of the amount of water to become available byimplementation of a project
• Funding source(s)
• Implementing agency or agencies
• A summary of any changes to the recommendation since the planwas implemented
• Timetables
The recommendations in this plan have been incorporated into the 2000 Five-YearWater Resource Development Work Program.
FUNDING
This section addresses the funding strategy and options for implementation of theLEC Plan. The approach takes into account the requirements of Chapter 373, F.S.,feedback and comments from the LEC Regional Water Supply Plan Advisory Committee,and input from District staff. Chapter 373, F.S., requires water supply plans to include afunding strategy that is reasonable and sufficient to pay the costs of constructing orimplementing all of the water resource development projects.
In general, the funding approach is divided into two major categories: waterresource development and water supply development. The water resource developmentcategory addresses funding for projects that are primarily the responsibility of the District.Water supply development projects, on the other hand, are primarily the responsibility oflocal governments, utilities, and other water users. However, information is included onprograms that target funding of water supply development projects in general.
Water Resource Development
Water resource development projects are generally regional in nature and areprimarily the responsibility of the District. The water resource development projects forthe LEC Planning Area were itemized earlier in this chapter. Pursuant to Chapter 373,F.S., each water management district governing board is required to include in its annualbudget the amount needed for the fiscal year to implement water resource development
329
Chapter 6: Recommendations LEC Regional Water Supply Plan - Planning Document
projects, as prioritized in its regional water supply plans. In addition to this plan, theDistrict is also completing regional water supply plans for two other planning areas(Lower West Coast and Kissimmee Basin planning areas) while approaching the third yearof implementation of the Upper East Coast Water Supply Plan.
Besides implementation of the water supply plans, the District is initiatingimplementation of the $7.8 billion CERP, a cost-shared effort with the USACE. It isanticipated that most of the District’s financial resources will be used for this project. TheFlorida Legislature passed the Everglades Restoration Investment Act of 2000, enactingthe Governor’s proposal for CERP funding. An independent state process has been createdunder Section 373.1501, F.S., for authorizing CERP projects at the state level. A five-yearfunding plan will be established and administered by FDEP.
Current ongoing projects may qualify for a portion of the Districts fundingresponsibilities through the identification as in-kind contributions. It is not known, at thistime, the impact that these efforts will have on the District’s resources in the future.Consequently, this plan is unable to commit to implementation strategies beyond thecurrent budget year. The recommendation tables in the plan show the costs of the projectsand potential sources of funding. Furthermore, taxing strategies exist that have not beenimplemented or identified as potential sources of funding. Time frames for completing theprojects are preliminary and are subject to funding availability in the future years.
Total cost to the District of the water resource development projects for this plan isdollars plus FTEs. The traditional funding source for these types of projects has beenprimarily ad valorem taxes. The non-CERP projects (most of those listed in this plan) willbe ranked and prioritized along with projects in all other regional water supply plansduring the annual District budget preparation, and funded as money is available. Priorityconsiderations for a project include availability of a cost-share partner and if a projectmakes new water available. Sustainability of the regional system is also an importantconsideration of project prioritization.
Some of the recommendations in this plan are studies. These studies may result inconstruction projects at a later date. Funding associated with these will be addressed atthat time. Potential funding sources for water resource development include fundsprovided on a project-by-project basis by the District's budget.
Water Supply Development
Water supply development projects are local in nature and generally involve thewithdrawal, treatment, and distribution of water. Chapter 373 states that, “localgovernments, regional water supply authorities, and government owned and privatelyowned water utilities take the lead in securing funds for and implementing water supplydevelopment projects. Generally, direct beneficiaries of water supply developmentprojects should pay the costs of the projects from which they benefit, and water supplydevelopment projects should continue to be paid for through local funding sources.” It isnot the intent that regional water supply plans mandate actions to be taken by local
330
LEC Regional Water Supply Plan - Planning Document Chapter 6: Recommendations
agencies, utilities, and other water users. Therefore, the overall theme of this section is toprovide direction and assistance, but not to mandate directives to local governments orutilities.
Chapter 373 requires water supply plans to identify potential sources of fundingfor water supply development projects. In addition to funding the projects through utilityrates, several other funding programs exist to assist local entities.
Water Resource Protection and Restoration Projects Funding Program
On January 18, 2000, Governor Jeb Bush announced his proposal to finance theprotection and preservation of Florida’s water resources. The Governor’s approved budgetprovides $73 million to fund water resource restoration projects, which includewastewater treatment plant upgrades and STAs. This represents an increase of 38 percentover last year's water project funding.
Projects eligible for the funding must address such criteria as resolving violationsof state water quality standards, preventing drainage and flood control problems, andresolving public health threats. Projects requesting funding for surface water restorationand wastewater improvements will be reviewed by the Water Advisory Panel to ensureeligibility.
The Governor created the Water Advisory Panel to ensure that efforts to protectand preserve Florida's water resources is priority-driven, objective, and policy-based.Projects determined by the panel as meeting the criteria will be forwarded to the FloridaLegislature for funding consideration. This process ensures that state dollars are providingneeded and meaningful improvements to state water resources.
The featured project must be identified in a water management district or FDEPplan as part of a surface water restoration effort. In addition, storm water relatedrestoration projects that have a flood component must be identified in a storm watermitigation master plan and have quantifiable flood protection targets. For wastewaterfacilities projects, grant recipients must have, or agree to adopt, an ordinance requiringmandatory waste management hookup upon failure of individual systems. The sponsor, orrecipient, of the wastewater facilities projects is expected to fund at least 25 percent of thetotal project costs.
Alternative Water Supply Grant Program
Vastly increased demands on natural supplies of fresh water led the FloridaLegislature in 1995 to enact the Alternative Water Supply Grant Program to increase thepotential for the development of alternative water supplies in the state; help utilitiesdevelop cost-effective reclaimed water supplies; and fulfill a public purpose to fund suchprograms. Since FY 1997, the District has funded 82 projects in its Water ResourceCaution Areas (WRCAs) for a total of approximately $20 million.
331

Chapter 6: Recommendations LEC Regional Water Supply Plan - Planning Document
The Alternative Water Supply Grant Program is a cost-share program whichprovides a portion of funding for alternative water supply projects built by local, county,or private water purveyors. Since FY 1997, the District has provided funds for projectsthat save or offset millions of gallons of water everyday.
To be considered for this funding support, the project must be consistent with localgovernment plans and must be located in a WRCA. The local government must require allappropriate new facilities within the project service area to connect and use the project’salternative water supplies. Funding support shall be applied only for the capital orinfrastructure costs for the construction for alternative water supply systems and theproject must fall within guidelines established by the District. The LEC Plan recognizesthe importance of this program in meeting the future needs of the region.
Drinking Water State Revolving Fund Program
The 1996 Amendments to the Safe Drinking Water Act authorized USEPA toaward grants to states for capitalization of Drinking Water State Revolving Funds. Theseare intended to be a source of financial assistance to public water systems to achievecompliance with Drinking Water Regulations and protecting public health. States mustprovide matching funds equal to at least 20 percent of the grant.
The Drinking Water State Revolving Fund Program consists of two elements. Thefirst element is establishment of a loan fund enabling a state to make below-market loansto public water systems for the construction of projects (a public water supply utility canbe publicly or privately owned, but some states have statutory or constitutional restrictionslimiting funding for privately owned systems). States must adopt a priority system,ranking projects based on considerations of public health, compliance, and affordability,and are required to fund to the maximum extent practical in priority order. The secondelement is the ability to set aside money to assist public water supply in meetingregulatory requirements through direct assistance, loans, and/or state grants fundingcapacity development, source water assessment, source water protection, and operatorcertification.
SUMMARY OF RECOMMENDATIONS
Table 113 summarizes the costs of the recommendations. Each water resourcedevelopment project has a projected start and finish date as shown in Figure 36.
332

LEC Regional Water Supply Plan - Planning Document Chapter 6: Recommendations
Table 113. Costs of Recommendations by Fiscal Year ($1,000s).
Recommendation FY2001 FY2002 FY2003 FY2004 FY2005Total
2001-2005Total
2006-2020Total
2001-2020Ongoing Projects from the LEC Interim Plan
1 Regional Saltwater Intrusion Management
130 235 240 216 152 973 2,280 3,253
2 Floridan Aquifer System Ground Water Model
125 75 210 85 60 555 a a
3 Northern Palm Beach County Comprehensive Water Management Plan
881 455 855 400 2,591 a a
4 Eastern Hillsboro Regional ASR Pilot Project
1,500 170 1,670 a a
5 Hillsboro (Site 1) Impoundment Pilot Project
2,220 800 300 100 3,420 3,420
6 Lake Worth Lagoon Minimum/Maximum Flow Targets
100 100 a a
7 Northern Broward County Secondary Canals Recharge Network
150 550 600 600 1,900 a a
8 Southeast Broward County Interconnected Water Supply System
300 50 50 400 a a
9 Broward County Urban Environmental Enhancement
100 50 50 200 a a
10 Miami-Dade Water and Sewer Department Utility ASR
1,500 1,500 1,500 1,500 1,500 7,500 12,000 19,500
11 Biscayne Bay Minimum and Maximum Flow Targets
200 200 a a
Subtotal 7,206 3,885 3,805 2,901 1,712 19,509 14,280 33,789
Other Federal, State, or District Projects
12 Critical Projects 2,130 2,115 4,245 a a
13 Well Abandonment Program (Recommendation from the CWMP)
b b b b b b b b
14 Saltwater Influence at S-79 (Recommendation from the CWMP)
b b b b b b b b
15 Permitting Issues Associated with ASR Systems and Reuse of Reclaimed Water
b b b b b b b b
16 Mobile Irrigation Labs b b b b b b b b
Subtotal 2,130 2,115 4,245
CERP Projects (Nonfederal Share)
17 CERP in the LEC Planning Area
75,112 182,510 228,399 139,280 120,927 746,228 2,335,964 3,082,192
18-27 LEC Recommendations to CERP
b b b b b b b b
28-30 CERP in the Caloosahatchee Basin/CWMP Recommenda-tions to CERP
3,404 6,261 26,004 67,470 44,050 147,189 122,735 269,924
Subtotal 78,516 188,771 254,403 206,750 164,977 893,417 2,458,699 3,352,116
Operational Projects
31 Systemwide Operational Protocols
b b b b b b b b
32 Periodic Operational Flexibility b b b b b b b b
333
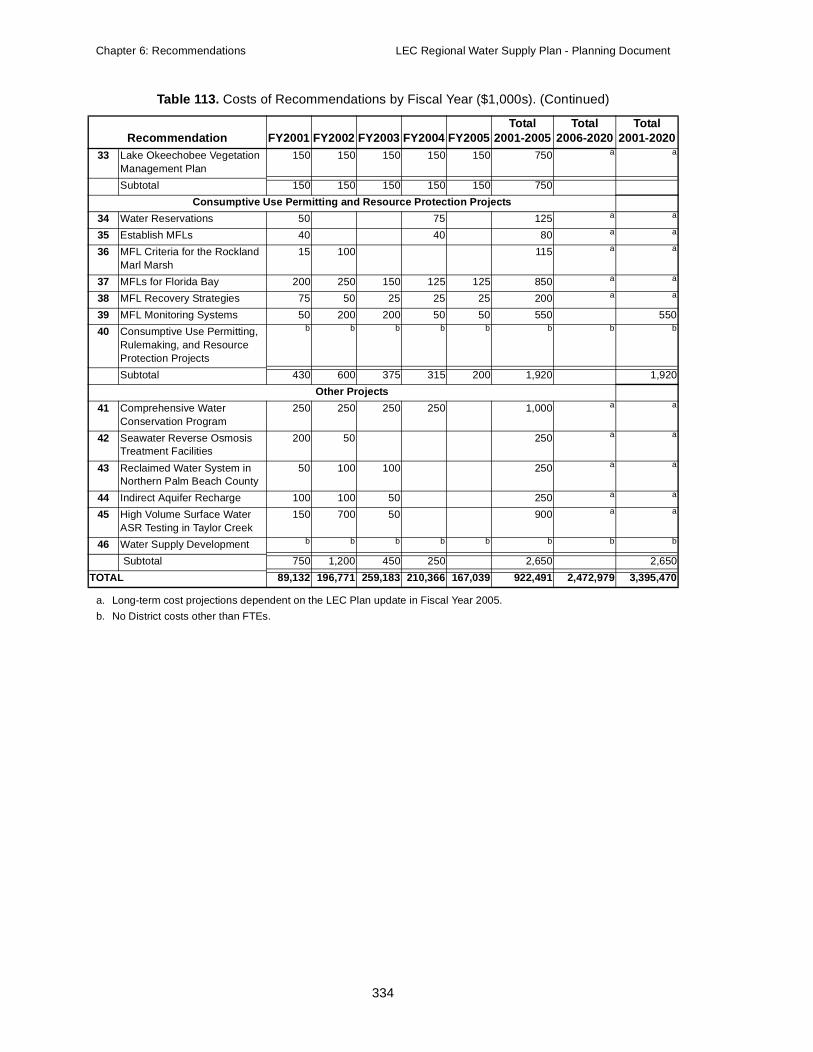
Chapter 6: Recommendations LEC Regional Water Supply Plan - Planning Document
33 Lake Okeechobee Vegetation Management Plan
150 150 150 150 150 750 a a
Subtotal 150 150 150 150 150 750
Consumptive Use Permitting and Resource Protection Projects
34 Water Reservations 50 75 125 a a
35 Establish MFLs 40 40 80 a a
36 MFL Criteria for the Rockland Marl Marsh
15 100 115 a a
37 MFLs for Florida Bay 200 250 150 125 125 850 a a
38 MFL Recovery Strategies 75 50 25 25 25 200 a a
39 MFL Monitoring Systems 50 200 200 50 50 550 550
40 Consumptive Use Permitting, Rulemaking, and Resource Protection Projects
b b b b b b b b
Subtotal 430 600 375 315 200 1,920 1,920
Other Projects
41 Comprehensive Water Conservation Program
250 250 250 250 1,000 a a
42 Seawater Reverse Osmosis Treatment Facilities
200 50 250 a a
43 Reclaimed Water System in Northern Palm Beach County
50 100 100 250 a a
44 Indirect Aquifer Recharge 100 100 50 250 a a
45 High Volume Surface Water ASR Testing in Taylor Creek
150 700 50 900 a a
46 Water Supply Development b b b b b b b b
Subtotal 750 1,200 450 250 2,650 2,650
TOTAL 89,132 196,771 259,183 210,366 167,039 922,491 2,472,979 3,395,470
a. Long-term cost projections dependent on the LEC Plan update in Fiscal Year 2005.
b. No District costs other than FTEs.
Table 113. Costs of Recommendations by Fiscal Year ($1,000s). (Continued)
Recommendation FY2001 FY2002 FY2003 FY2004 FY2005Total
2001-2005Total
2006-2020Total
2001-2020
334
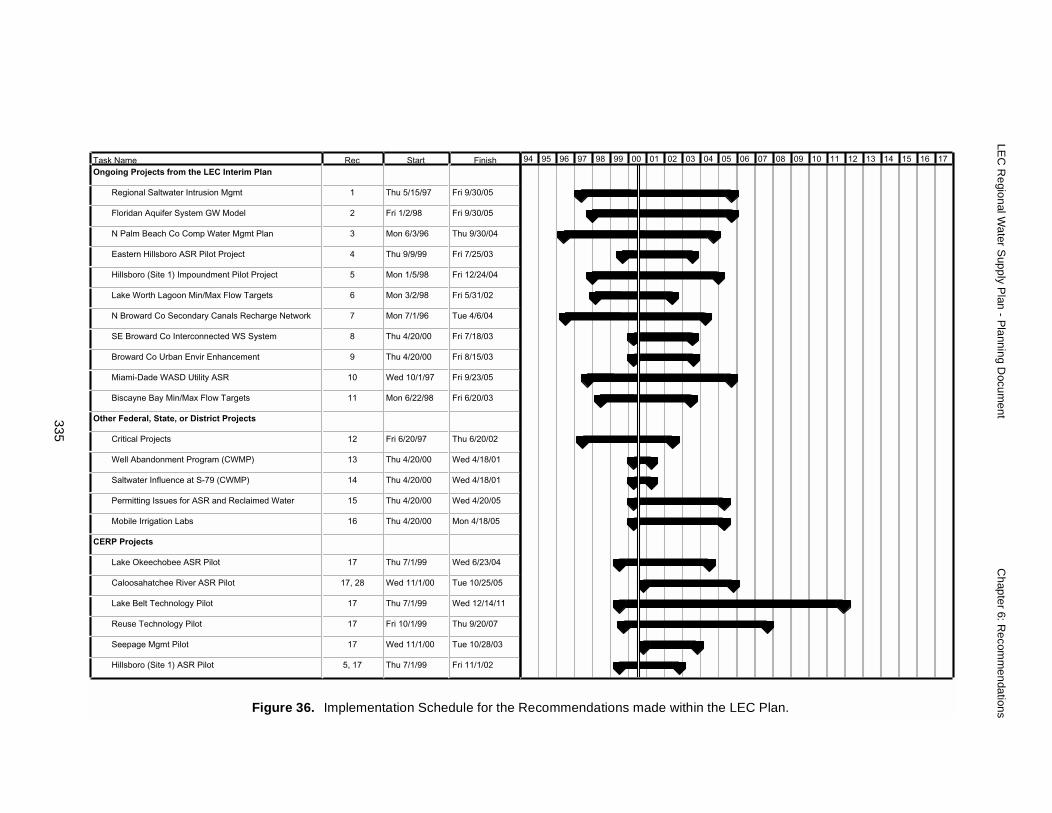
LEC
Regional W
ater Supply P
lan - Planning D
ocument
Chapter 6: R
ecomm
endations
335
Task NamOngoing P
Regio
Florid
N Pal
Easte
Hillsb
Lake
N Bro
SE Br
Browa
Miam
Bisca
Other Fed
Critica
Well A
Saltw
Perm
Mobil
CERP Pro
Lake
Caloo
Lake
Reuse
Seepa
Hillsb
06 07 08 09 10 11 12 13 14 15 16 17
EC Plan.
e Rec Start Finishrojects from the LEC Interim Plan
nal Saltwater Intrusion Mgmt 1 Thu 5/15/97 Fri 9/30/05
an Aquifer System GW Model 2 Fri 1/2/98 Fri 9/30/05
m Beach Co Comp Water Mgmt Plan 3 Mon 6/3/96 Thu 9/30/04
rn Hillsboro ASR Pilot Project 4 Thu 9/9/99 Fri 7/25/03
oro (Site 1) Impoundment Pilot Project 5 Mon 1/5/98 Fri 12/24/04
Worth Lagoon Min/Max Flow Targets 6 Mon 3/2/98 Fri 5/31/02
ward Co Secondary Canals Recharge Network 7 Mon 7/1/96 Tue 4/6/04
oward Co Interconnected WS System 8 Thu 4/20/00 Fri 7/18/03
rd Co Urban Envir Enhancement 9 Thu 4/20/00 Fri 8/15/03
i-Dade WASD Utility ASR 10 Wed 10/1/97 Fri 9/23/05
yne Bay Min/Max Flow Targets 11 Mon 6/22/98 Fri 6/20/03
eral, State, or District Projects
l Projects 12 Fri 6/20/97 Thu 6/20/02
bandonment Program (CWMP) 13 Thu 4/20/00 Wed 4/18/01
ater Influence at S-79 (CWMP) 14 Thu 4/20/00 Wed 4/18/01
itting Issues for ASR and Reclaimed Water 15 Thu 4/20/00 Wed 4/20/05
e Irrigation Labs 16 Thu 4/20/00 Mon 4/18/05
jects
Okeechobee ASR Pilot 17 Thu 7/1/99 Wed 6/23/04
sahatchee River ASR Pilot 17, 28 Wed 11/1/00 Tue 10/25/05
Belt Technology Pilot 17 Thu 7/1/99 Wed 12/14/11
Technology Pilot 17 Fri 10/1/99 Thu 9/20/07
ge Mgmt Pilot 17 Wed 11/1/00 Tue 10/28/03
oro (Site 1) ASR Pilot 5, 17 Thu 7/1/99 Fri 11/1/02
94 95 96 97 98 99 00 01 02 03 04 05
Figure 36. Implementation Schedule for the Recommendations made within the L
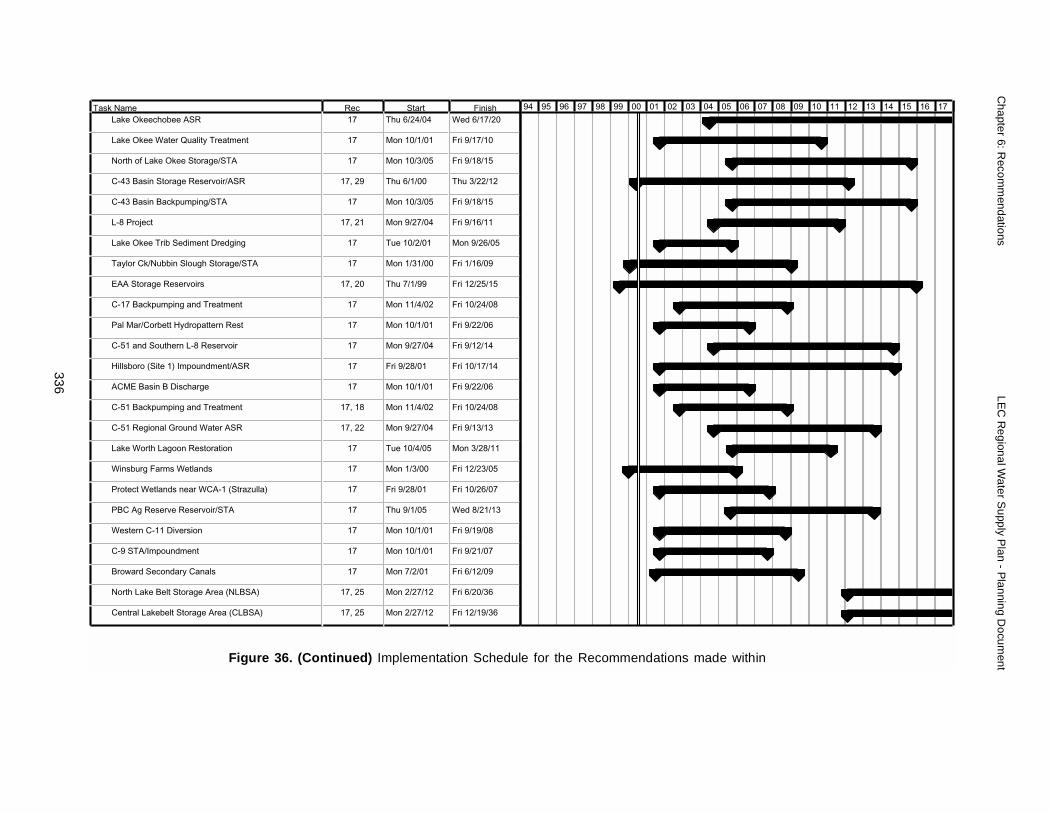
336
Chapter 6: R
ecomm
endations LE
C R
egional Water S
upply Plan - P
lanning Docum
ent
03 04 05 06 07 08 09 10 11 12 13 14 15 16 17
made within
Task Name Rec Start FinishLake Okeechobee ASR 17 Thu 6/24/04 Wed 6/17/20
Lake Okee Water Quality Treatment 17 Mon 10/1/01 Fri 9/17/10
North of Lake Okee Storage/STA 17 Mon 10/3/05 Fri 9/18/15
C-43 Basin Storage Reservoir/ASR 17, 29 Thu 6/1/00 Thu 3/22/12
C-43 Basin Backpumping/STA 17 Mon 10/3/05 Fri 9/18/15
L-8 Project 17, 21 Mon 9/27/04 Fri 9/16/11
Lake Okee Trib Sediment Dredging 17 Tue 10/2/01 Mon 9/26/05
Taylor Ck/Nubbin Slough Storage/STA 17 Mon 1/31/00 Fri 1/16/09
EAA Storage Reservoirs 17, 20 Thu 7/1/99 Fri 12/25/15
C-17 Backpumping and Treatment 17 Mon 11/4/02 Fri 10/24/08
Pal Mar/Corbett Hydropattern Rest 17 Mon 10/1/01 Fri 9/22/06
C-51 and Southern L-8 Reservoir 17 Mon 9/27/04 Fri 9/12/14
Hillsboro (Site 1) Impoundment/ASR 17 Fri 9/28/01 Fri 10/17/14
ACME Basin B Discharge 17 Mon 10/1/01 Fri 9/22/06
C-51 Backpumping and Treatment 17, 18 Mon 11/4/02 Fri 10/24/08
C-51 Regional Ground Water ASR 17, 22 Mon 9/27/04 Fri 9/13/13
Lake Worth Lagoon Restoration 17 Tue 10/4/05 Mon 3/28/11
Winsburg Farms Wetlands 17 Mon 1/3/00 Fri 12/23/05
Protect Wetlands near WCA-1 (Strazulla) 17 Fri 9/28/01 Fri 10/26/07
PBC Ag Reserve Reservoir/STA 17 Thu 9/1/05 Wed 8/21/13
Western C-11 Diversion 17 Mon 10/1/01 Fri 9/19/08
C-9 STA/Impoundment 17 Mon 10/1/01 Fri 9/21/07
Broward Secondary Canals 17 Mon 7/2/01 Fri 6/12/09
North Lake Belt Storage Area (NLBSA) 17, 25 Mon 2/27/12 Fri 6/20/36
Central Lakebelt Storage Area (CLBSA) 17, 25 Mon 2/27/12 Fri 12/19/36
94 95 96 97 98 99 00 01 02
Figure 36. (Continued) Implementation Schedule for the Recommendations

LEC
Regional W
ater Supply P
lan - Planning D
ocument
Chapter 6: R
ecomm
endations
337
Task NamC-4 C
Pinela
Bird D
L-31N
Dade
C-111
Rerou
C-111
South
West
WCA-
Divert
WCA
Additi
Const
Decom
Flows
Divert
Divert
Modif
Bisca
Florid
Big C
Micco
Semin
06 07 08 09 10 11 12 13 14 15 16 17
within
e Rec Start Finishontrol Structures 17 Mon 1/31/00 Fri 7/22/05
nd/Hardwood Restoration 17 Mon 10/2/00 Fri 3/24/06
rive Recharge Area 17 Thu 1/1/04 Wed 12/18/13
Levee Improvement 17 Wed 10/30/02 Tue 10/19/10
-Broward Levee/Pennsuco 17 Mon 10/1/01 Fri 9/19/08
Operations Modifications 17 Wed 5/1/02 Thu 4/1/04
te Miami Canal Wat Sup Del 17 Mon 1/28/02 Fri 1/16/09
N Spreader Canal 17 Mon 1/31/00 Fri 7/18/08
Miami-Dade County Reuse 17 Mon 7/4/11 Fri 6/19/20
Miami-Dade County Reuse 17, 23 Mon 7/4/11 Fri 6/19/20
1 Internal Structures 17 Mon 1/31/00 Fri 7/25/03
WCA-2 Flows to CLBSA 17 Mon 4/1/02 Fri 9/17/10
3A and 3B Seepage Mgmt 17 Tue 10/2/01 Mon 9/22/08
onal S-345 Structures 17 Mon 1/28/02 Fri 1/16/09
ruction of S-356 Structures 17 Mon 11/4/02 Fri 10/26/07
partmentalize WCA-3 17 Mon 1/28/02 Fri 1/4/19
to NW/Central WCA-3A 17 Thu 11/2/00 Wed 4/22/09
WCA-3 Flows to CLBSA 17 Mon 4/1/02 Fri 9/19/08
Flows from CLBSA to WCA-3B 17 Mon 2/27/12 Fri 2/17/17
y G-404 Pump Station 17 Wed 10/1/03 Tue 3/24/09
yne Bay Coastal Wetlands 17 Thu 7/1/99 Wed 5/9/18
a Keys Tidal Restoration 17 Mon 3/6/00 Fri 8/26/05
ypress/L-28 Interceptor 17 Mon 10/2/06 Fri 9/16/16
sukee Water Mgmt Plan 17 Mon 7/3/00 Fri 12/19/08
ole Water Conservation Plan 17 Mon 1/1/01 Fri 6/20/08
94 95 96 97 98 99 00 01 02 03 04 05
Figure 36. (Continued) Implementation Schedule for the Recommendations made

338
Chapter 6: R
ecomm
endations LE
C R
egional Water S
upply Plan - P
lanning Docum
ent
03 04 05 06 07 08 09 10 11 12 13 14 15 16 17
made within
Task Name Rec Start FinishMelaleuca/Exotic Plant Eradication 17 Mon 10/2/06 Fri 9/23/11
Southwest Florida Study 17, 30 Thu 4/1/99 Wed 3/24/04
Comprehensive Water Quality Plan 17 Fri 10/1/99 Fri 12/22/06
Florida Bay/Keys Feasibility Study 17 Fri 10/29/99 Fri 10/22/04
RECOVER/Monitoring/Operational Changes 17, 19, 24, 27 Thu 7/1/99 Wed 12/22/38
Operational Recommendations
Systemwide Operational Protocols 31 Thu 5/11/00 Fri 6/1/01
Complete Regional Water Supply Plans Thu 5/11/00 Thu 5/11/00
Develop Real Time Performance Measures Thu 5/11/00 Mon 10/2/00
Develop Systemwide Operational Policies Tue 10/3/00 Mon 12/4/00
Develop Risk Based Decision Support Tools Tue 10/3/00 Tue 4/3/01
Finalize Systemwide Operational Policies Mon 1/1/01 Fri 6/1/01
Develop Public Input System Thu 5/11/00 Wed 11/1/00
Periodic Operational Flexibility 32 Thu 4/20/00 Wed 4/21/04
Periodic Operational Flexibility Mon 10/2/00 Fri 2/2/01
Finalize Suite of Alt. Short-Term Policies Mon 2/5/01 Tue 4/3/01
Conduct Public Work Shops Mon 2/5/01 Tue 4/3/01
Apply Short-Term Operational Policies Thu 4/20/00 Wed 4/21/04
Lake Okeechobee Vegetation Mgmt Plan 33 Mon 10/2/00 Fri 9/30/05
Form Veg and Fire Mgmt Team Mon 10/2/00 Fri 9/28/01
Develop Lake Vegetation Mgmt Plan Mon 10/1/01 Fri 9/27/02
Utilize Burn Mgmt & Disking Program Tue 10/1/02 Fri 9/30/05
Conduct Torpedo Grass/Melaleuca Erad Tue 10/1/02 Fri 9/30/05
FDACS Coordination Tue 10/1/02 Fri 9/30/05
94 95 96 97 98 99 00 01 02
Figure 36. (Continued) Implementation Schedule for the Recommendations
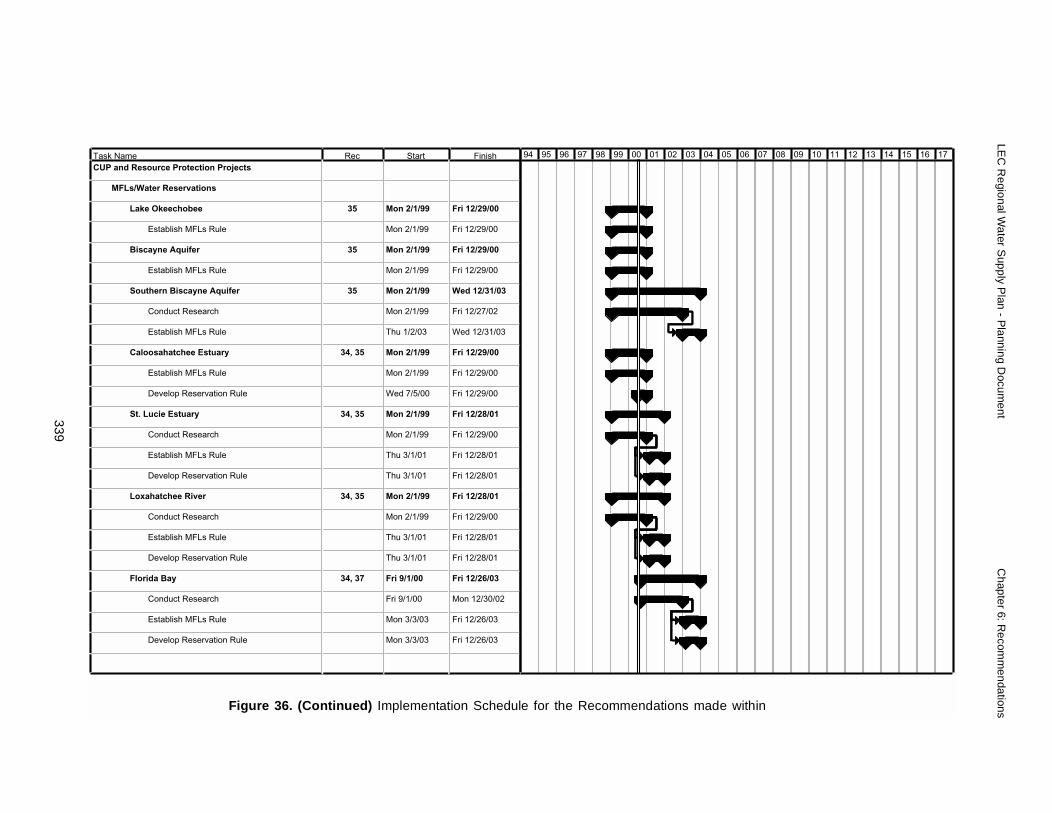
LEC
Regional W
ater Supply P
lan - Planning D
ocument
Chapter 6: R
ecomm
endations
339
Task NamCUP and R
MFLs
L
B
S
C
S
L
F
06 07 08 09 10 11 12 13 14 15 16 17
within
e Rec Start Finishesource Protection Projects
/Water Reservations
ake Okeechobee 35 Mon 2/1/99 Fri 12/29/00
Establish MFLs Rule Mon 2/1/99 Fri 12/29/00
iscayne Aquifer 35 Mon 2/1/99 Fri 12/29/00
Establish MFLs Rule Mon 2/1/99 Fri 12/29/00
outhern Biscayne Aquifer 35 Mon 2/1/99 Wed 12/31/03
Conduct Research Mon 2/1/99 Fri 12/27/02
Establish MFLs Rule Thu 1/2/03 Wed 12/31/03
aloosahatchee Estuary 34, 35 Mon 2/1/99 Fri 12/29/00
Establish MFLs Rule Mon 2/1/99 Fri 12/29/00
Develop Reservation Rule Wed 7/5/00 Fri 12/29/00
t. Lucie Estuary 34, 35 Mon 2/1/99 Fri 12/28/01
Conduct Research Mon 2/1/99 Fri 12/29/00
Establish MFLs Rule Thu 3/1/01 Fri 12/28/01
Develop Reservation Rule Thu 3/1/01 Fri 12/28/01
oxahatchee River 34, 35 Mon 2/1/99 Fri 12/28/01
Conduct Research Mon 2/1/99 Fri 12/29/00
Establish MFLs Rule Thu 3/1/01 Fri 12/28/01
Develop Reservation Rule Thu 3/1/01 Fri 12/28/01
lorida Bay 34, 37 Fri 9/1/00 Fri 12/26/03
Conduct Research Fri 9/1/00 Mon 12/30/02
Establish MFLs Rule Mon 3/3/03 Fri 12/26/03
Develop Reservation Rule Mon 3/3/03 Fri 12/26/03
94 95 96 97 98 99 00 01 02 03 04 05
Figure 36. (Continued) Implementation Schedule for the Recommendations made
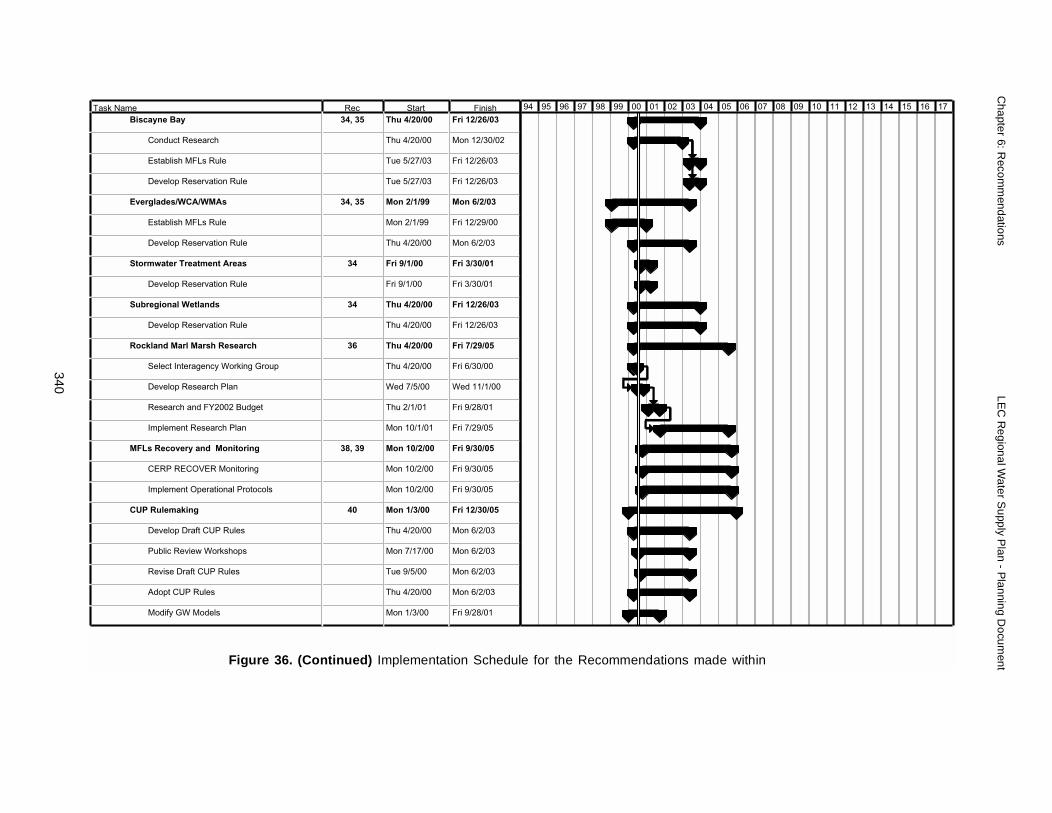
340
Chapter 6: R
ecomm
endations LE
C R
egional Water S
upply Plan - P
lanning Docum
ent
03 04 05 06 07 08 09 10 11 12 13 14 15 16 17
made within
Task Name Rec Start FinishBiscayne Bay 34, 35 Thu 4/20/00 Fri 12/26/03
Conduct Research Thu 4/20/00 Mon 12/30/02
Establish MFLs Rule Tue 5/27/03 Fri 12/26/03
Develop Reservation Rule Tue 5/27/03 Fri 12/26/03
Everglades/WCA/WMAs 34, 35 Mon 2/1/99 Mon 6/2/03
Establish MFLs Rule Mon 2/1/99 Fri 12/29/00
Develop Reservation Rule Thu 4/20/00 Mon 6/2/03
Stormwater Treatment Areas 34 Fri 9/1/00 Fri 3/30/01
Develop Reservation Rule Fri 9/1/00 Fri 3/30/01
Subregional Wetlands 34 Thu 4/20/00 Fri 12/26/03
Develop Reservation Rule Thu 4/20/00 Fri 12/26/03
Rockland Marl Marsh Research 36 Thu 4/20/00 Fri 7/29/05
Select Interagency Working Group Thu 4/20/00 Fri 6/30/00
Develop Research Plan Wed 7/5/00 Wed 11/1/00
Research and FY2002 Budget Thu 2/1/01 Fri 9/28/01
Implement Research Plan Mon 10/1/01 Fri 7/29/05
MFLs Recovery and Monitoring 38, 39 Mon 10/2/00 Fri 9/30/05
CERP RECOVER Monitoring Mon 10/2/00 Fri 9/30/05
Implement Operational Protocols Mon 10/2/00 Fri 9/30/05
CUP Rulemaking 40 Mon 1/3/00 Fri 12/30/05
Develop Draft CUP Rules Thu 4/20/00 Mon 6/2/03
Public Review Workshops Mon 7/17/00 Mon 6/2/03
Revise Draft CUP Rules Tue 9/5/00 Mon 6/2/03
Adopt CUP Rules Thu 4/20/00 Mon 6/2/03
Modify GW Models Mon 1/3/00 Fri 9/28/01
94 95 96 97 98 99 00 01 02
Figure 36. (Continued) Implementation Schedule for the Recommendations

LEC
Regional W
ater Supply P
lan - Planning D
ocument
Chapter 6: R
ecomm
endations
341
Task Nam
Other Wat
Comp
Seaw
Recla
Indire
High V
06 07 08 09 10 11 12 13 14 15 16 17
within
e Rec Start FinishLEC Permit Renewal Mon 12/1/03 Fri 12/30/05
er Resource Projects
rehensive Water Conservation Program 41 Thu 4/20/00 Fri 11/7/03
ater Reverse Osmosis Treatment Facilities 42 Thu 4/20/00 Tue 10/8/02
imed Water System in N. Palm Beach Co 43 Thu 4/20/00 Wed 5/15/02
ct Aquifer Recharge 44 Thu 4/20/00 Wed 10/16/02
olume ASR Testing at Taylor Creek 45 Thu 4/20/00 Fri 4/19/02
94 95 96 97 98 99 00 01 02 03 04 05
Figure 36. (Continued) Implementation Schedule for the Recommendations made

Chapter 6: Recommendations LEC Regional Water Supply Plan - Planning Document
342
LEC Regional Water Supply Plan - Planning Document Glossary
GLOSSARY
1995 Base Case A model simulation which provides an understanding of the how the1995 water management system with 1995 land use and demands responds to historic(1965-1995) climatic conditions.
1995 Revised Base Case The 1995 Base Case model simulation revised to makecomparisons to the incremental simulations valid. This is the beginning point for theincremental simulations.
1-in-10 Year Drought A drought of such intensity, that it is expected to have a returnfrequency of once in 10 years. A drought in which below normal rainfall, which has a 90percent probability of being exceeded over a twelve-month period. This means that thereis only a ten percent chance that less than this amount of rain will fall in any given year.
1-in-10 Year Level of Certainty Probability that the needs for reasonable-beneficial usesof water will be fully met during a 1-in-10 year drought.
2020 Base Case A model simulation which provides information of how the 1995 watermanagement system would respond to anticipated future operations and demands underhistoric (1965-1995) climatic conditions with currently authorized restoration projectsimplemented, but without Restudy features.
2020 with Restudy A model simulation which provides information on how the watermanagement system will perform with the implementation of the Restudy projects thatwould be completed by 2020 along with 2020 demands and operating criteria.
2005 Supply-Side Management Scenario A model simulation that used a modifiedversion of the 2005 incremental simulation to determine the response of the regionalsystem to modifications in Lake Okeechobee’s Supply-Side Management criteria.
Acre-foot The volume of water that would cover one acre to a depth of one foot; 43,560cubic feet; 1,233.5 cubic meters; 325,872 gallons.
Agricultural Field Scale Irrigation Requirements Simulation A simple water budgetmodel for estimating irrigation demands that estimates demand based on basin specificdata.
Agricultural Self-Supplied Water Demand The water used to irrigate crops, to watercattle, and for aquaculture (fish production), that is not supplied by a public water supplyutility.
Aquifer A portion of a geologic formation or formations that yield water in sufficientquantities to be a supply source.
343

Glossary LEC Regional Water Supply Plan - Planning Document
Aquifer Storage and Recovery (ASR) The injection of freshwater into a confinedsaline aquifer during times when supply exceeds demand (wet season), and recovering itduring times when there is a supply deficit (dry season).
Aquifer System A heterogeneous body of intercalated permeable and less permeablematerial that acts as a water-yielding hydraulic unit of regional extent.
Artesian When ground water is confined under pressure greater than atmosphericpressure by overlying relatively impermeable strata.
Available Supply The maximum amount of reliable water supply including surface water,ground water and purchases under secure contracts.
Average Daily Demand A water system’s average daily use based on total annual waterproduction (total annual gallons or cubic feet divided by 365).
Average Irrigation Requirement Irrigation requirement under average rainfall ascalculated by the District’s modified Blaney-Criddle model.
Average Rainfall Year A year having rainfall with a 50 percent probability of beingexceeded over a twelve-month period.
Backpumping The practice of pumping water that is leaving the area back into a surfacewater reservoir.
Basin (Ground Water) A hydrologic unit containing one large aquifer or severalconnecting and interconnecting aquifers.
Basin (Surface Water) A tract of land drained by a surface water body or its tributaries.
Best Management Practices (BMPs) Agricultural management activities designed toachieve an important goal, such as reducing farm runoff, or optimizing water use.
Biscayne Aquifer A portion of the Surficial Aquifer System, which provides most of thefresh water for public water supply and agriculture within Miami-Dade, Broward, andsoutheastern Palm Beach County. It is highly susceptible to contamination due to its highpermeability and proximity to land surface in many locations.
Boulder Zone A highly transmissive, cavernous zone of limestone within the lowerFloridan aquifer.
Brackish Water with a chloride level greater than 250 mg/L and less than 19,000 mg/L.
C&SF Project Comprehensive Review Study (Restudy) A five-year study effort thatlooked at modifying the current C&SF Project to restore the greater Everglades and SouthFlorida ecosystem while providing for the other water-related needs of the region. Thestudy concluded with the Comprehensive Plan being presented to the Congress on July 1,
344

LEC Regional Water Supply Plan - Planning Document Glossary
1999. The recommendations made within the Restudy, that is, structural and operationalmodifications to the C&SF Project, are being further refined and will be implemented inthe Comprehensive Everglades Restoration Plan (CERP).
Central and Southern Florida Project for Flood Control and Other Purposes (C&SFProject) A complete system of canals, storage areas, and water control structuresspanning the area from Lake Okeechobee to both the east and west coasts, and fromOrlando south to the Everglades designed and constructed during the 1950s by the U.S.Army Corps of Engineers (USACE) to provide flood control and improve navigation andrecreation.
Commercial and Industrial Self-Supplied Water Demand Water used by commercialand industrial operations using over 0.1 MGD.
Comprehensive Everglades Restoration Plan (CERP) The recommendations madewithin the Restudy, that is, structural and operational modifications to the C&SF Projectare being further refined and will be implemented through this plan.
Cone of Influence The area around a producing well which will be affected by itsoperation.
Control Structures A man-made structure designed to regulate the level and/or flow ofwater in a canal (e.g., weirs, dams).
Consumptive Use Use that reduces an amount of water in the source from which it iswithdrawn.
Consumptive Use Permit A permit issued by the SFWMD allowing utilities to withdrawground water for consumptive use.
Demand The quantity of water needed to be withdrawn to fulfill a requirement.
District Water Management Plan (DWMP) Regional water resource plan developed bythe District under Ch. 373.036, F. S.
Districtwide Water Supply Assessment (DWSA) This document includes water demandassessments and projections, and descriptions of the surface water and ground waterresources within each of the SFWMD’s four planning areas.
Domestic Self-Supplied Water Demand The water used by households whose primarysource of water is private wells and water treatment facilities with pumpages of less than0.5 MGD.
Domestic Use Use of water for the individual personal household purposes of drinking,bathing, cooking, or sanitation.
Drawdown The drawdown at a given point is the distance the water level is dropped.
345
Glossary LEC Regional Water Supply Plan - Planning Document
Estuary A water passage where the ocean or sea meets a river
Evapotranspiration Water losses from the surface of soils (evaporation) and plants(transpiration).
Everglades Agricultural Area (EAA) The area of histosols (muck) predominantly to theSoutheast of Lake Okeechobee which is used for agricultural production.
Everglades Construction Project The foundation for the largest ecosystem restorationprogram in the history of Florida. It is composed of 12 inter-related construction projectslocated between Lake Okeechobee and the Everglades, including over 47,000 acres ofStormwater Treatment Areas (STAs).
Exotic Nuisance Plant Species A non-native species which tends to out-compete nativespecies and become quickly established, especially in areas of disturbance or where thenormal hydroperiod has been altered.
Florida Department of Agricultural and Consumer Services (FDACS) FDACScommunicates the needs of the agricultural industry to the Legislature, the FDEP, and thewater management districts, and ensures participation of agriculture in the developmentand implementation of water policy decisions. FDACS also oversees Florida’s soil andwater conservation districts, which coordinate closely with the federal Natural ResourcesConservation Service (NRCS).
Florida Department of Environmental Protection (FDEP) The District operates underthe general supervisory authority of the FDEP which includes budgetary oversight.
Floridan Aquifer System A multiple-use aquifer system composed of the upper Floridanand lower Floridan aquifers. It is the principal source of water supply north of LakeOkeechobee and the upper Floridan aquifer is used for drinking water supply in parts ofMartin and St. Lucie counties. From Jupiter to south Miami, water from the FloridanAquifer System is mineralized (total dissolved solids are greater than 1,000 mg/L) alongcoastal areas and in southern Florida.
Florida Water Plan State-level water resource plan developed by the FDEP under Ch.373.036 F.S.
F.S. Florida Statutes.
FY Fiscal Year; the District’s fiscal year begins on October 1 and ends on September 30the following year.
Governing Board Governing Board of the South Florida Water Management District.
Ground Water Water beneath the surface of the ground, whether or not flowing throughknown and definite channels.
346

LEC Regional Water Supply Plan - Planning Document Glossary
Ground Water Heads Elevation of water table
Harm (Term will be defined during proposed Rule Development process) An adverseimpact to water resources or the environment that is generally temporary and short-lived,especially when the recovery from the adverse impact is possible within a period of timeof several months to several years, or less. Water shortage declarations are used to manageand mitigate such adverse impacts.
Hydropattern The pattern of inundation or saturation of an ecosystem.
Hydroperiod The frequency and duration of inundation or saturation of an ecosystem. Inthe context of characterizing wetlands, the term hydroperiod describes that length of timeduring the year that the substrate is either saturated or covered with water.
IFAS The Institute of Food and Agricultural Sciences, that is the agricultural branch of theUniversity of Florida, performing research, education, and extension.
Incremental Simulations Model simulations performed to understand how the systemwould perform with partial completion of the Restudy projects and if the ability to meetthe 1-in-10 year level of certainty criteria improves over time. Incremental years selectedwere, 2005, 2010, and 2015.
Indicator Region A grouping of model grid cells within the SFWMM consisting ofsimilar vegetation cover and soil type. By grouping cells, the uncertainty of evaluatingresults from a single two by two, square mile grid cell that represents a single watermanagement gage is reduced.
Infiltration The movement of water through the soil surface into the soil under the forcesof gravity and capillarity.
Irrigation The application of water to crops, and other plants by artificial means.
Irrigation Audit A procedure in which an irrigation systems application rate anduniformity are measured.
Lake Okeechobee This lake measures 730 square miles and is the second largestfreshwater lake wholly within the United States.
Leak Detection Systematic method of using listening equipment to survey thedistribution system, identify leak sounds, and pinpoint the exact locations of hiddenunderground leaks.
LEC-1 A model simulation which provides information on how additional changes tomodel assumptions may alter hydrologic performance. This simulation was the firstalternative plan simulated.
347
Glossary LEC Regional Water Supply Plan - Planning Document
LEC-1A The LEC-1 simulation without consumptive water users to assist inunderstanding the impact that permitted consumptive uses might have on the regionalsystem.
LEC-1 Revised This is the LEC-1 model simulation revised to include furtherimprovements. This simulation is the end point for comparing incremental simulations.
Levee An embankment to prevent flooding, or a continuous dike or ridge for confining theirrigation areas of land to be flooded.
Marsh A frequently or continually inundated wetland characterized by emergentherbaceous vegetation adapted to saturated soil conditions.
Micro Irrigation The application of water directly to, or very near to the soil surface indrops, small streams, or sprays.
MIKE SHE An integrated surface water/ground water model, which includes a modulefor estimating supplemental irrigation requirements based upon land use, soil type, croptype, rainfall, and evapotranspiration.
Minimum Flows and Levels (MFL) The point at which further withdrawals would causesignificant harm to the water resources.
Mobile Irrigation Laboratory A vehicle furnished with irrigation evaluation equipmentwhich is used to carry out on-site evaluations of irrigation systems and to providerecommendations on improving irrigation efficiency.
MODFLOW A fine-scale model code created by the U.S. Geological Survey. TheDistrict uses it for subregional and ground water modeling.
NGVD National Geodetic Vertical Datum, a nationally established references forelevation data.
Natural Resources Conservation Service (NRCS) An agency of the U.S. Department ofAgriculture (USDA) that provides technical assistance for soil and water conservation,natural resource surveys, and community resource protection.
Organics Being composed of or containing matter of, plant and animal origin.
Per Capita Use Total use divided by the total population served.
Permeability Defines the ability of a rock or sediment to transmit fluid.
Point Source Any discernible, confined and discrete conveyance from which pollutantsare or may be discharged, including but not limited to any pipe, ditch, channel, tunnel,conduit, well, discrete fissure, container, rolling stock, concentrated animal feeding
348
LEC Regional Water Supply Plan - Planning Document Glossary
operation, or vessel or other floating craft. This term does not include agricultural stormwater discharges and return flows from irrigated agriculture.
Potable Water Water that is safe for human consumption.
Potentiometric Head The level to which water will rise when a well is pierced in aconfined aquifer.
Process Water Water used for nonpotable industrial usage, e.g., mixing cement.
Public Water Supply Demand All potable water supplied by regional water treatmentfacilities with pumpage of 0.5 million gallons per day (MGD) or more to all customers,not just residential.
Public Water Supply Utilities Utilities that provide potable water for public use.
Rapid Infiltration Basin (RIB)
Reasonable-Beneficial Use Use of water in such quantity as is necessary for economicand efficient utilization for a purpose and in a manner which is both reasonable andconsistent with the public interest.
Reclaimed Water Water that has received at least secondary treatment and basicdisinfection and is reused after flowing out of a domestic wastewater treatment facility.
RECOVER A comprehensive monitoring and adaptive assessment program formed toperform the following for the Comprehensive Everglades Restoration Program:REstoration, COordination, and VERification.
Recreational Self-Supplied Water Demand The water used for landscape and golfcourse irrigation. The landscape subcategory includes water used for parks, cemeteries,and other irrigation applications greater than 0.1 MGD. The golf course subcategoryincludes those operations not supplied by a public water supply or regional reuse facility.
Reduced Threshold Areas (RTAs) Areas established by the District for which thethreshold separating a General Permit from an Individual Permit has been lowered fromthe maximum limit of 100,000 GPD to 20,000 GPD. These areas are typically resource-depleted areas where there have been an established history of sub-standard water quality,saline water movement into ground or surface water bodies, or the lack of wateravailability to meet projected needs of a region.
Regional Water Supply Plan Detailed water supply plan developed by the District underCh. 373.0361, F.S.
Reservoir A man-made or natural lake where water is stored.
Retrofit The replacement of existing equipment with equipment that uses less water.
349
Glossary LEC Regional Water Supply Plan - Planning Document
Retrofitting The replacement of existing water fixtures, appliances and devices with moreefficient fixtures, appliances and devices for the purpose of water conservation.
Reuse The deliberate application of water that has received at least secondary treatment,in compliance with the Florida Department of Environmental Protection and watermanagement district rules, for a beneficial purpose.
Reverse Osmosis (RO) Common process used to produce deionized water frommunicipal water.
Saline Water Water with a chloride concentration greater than 250 milligrams per liter.The term saline water includes brackish water and seawater.
Saline Water Interface The hypothetical surface of chloride concentration between freshwater and seawater where the chloride concentration is 250 mg/L at each point on thesurface.
Saline Water Intrusion This occurs when more dense saline water moves laterally inlandfrom the seacoast, or moves vertically upward, to replace fresher water in an aquifer.
Seepage Irrigation Systems Irrigation systems which convey water through open ditches.Water is either applied to the soil surface (possibly in furrows) and held for a period oftime to allow infiltration, or is applied to the soil subsurface by raising the water table towet the root zone.
SEEPN A two-dimensional (vertical plane) finite element model developed at theUSACE Waterways Experiment Station. It simulates steady-state subsurface flow througha multilayered aquifer system.
Semi-Confining Layers Layers with little or no horizontal flow that can store groundwater and also transmit it slowly from one aquifer to another. The rate of vertical flow isdependent on the head differential between the semi-confining beds and those above andbelow them, as well as the vertical permeability of the sediments.
Sensitivity Analysis An analysis of alternative results based on variations in assumptions(a “what if” analysis).
Serious Harm (Term will be defined during proposed Rule Development process) Anextremely adverse impact to water resources or the environment that is either permanentor very long-term in duration. Serious harm is generally considered to be more intensethan significant harm.
Significant Harm (Term will be defined during proposed Rule Development process) Anadverse impact to water resources or the environment, relating to an established minimumflow or level for a water body; generally temporary but not necessarily short-lived,especially when the period of recovery from the adverse impact exceeds several months toseveral years in duration; more intense than harm, but less intense than serious harm.
350
LEC Regional Water Supply Plan - Planning Document Glossary
Slough A channel in which water moves sluggishly, or a place of deep muck, mud or mire.Sloughs are wetland habitats that serve as channels for water draining off surroundinguplands and/or wetlands.
South Florida Water Management Model (SFWMM) An integrated surface water-ground water model that simulates the hydrology and associated water managementschemes in the majority of South Florida using climatic data from January 1, 1965,through December 31, 1995. The model simulates the major components of thehydrologic cycle and the current and numerous proposed water management controlstructures and associated operating rules. It also simulates current and proposed watershortage policies for the different subregions in the system.
Stage The elevation of the surface of a surface water body.
Standard Project Flood (SPF) A mathematically derived set of hydrologic conditions fora region that defines the water levels that can be expected to occur in a basin during anextreme rainfall event, taking into account all pertinent conditions of location,meteorology, hydrology, and topography.
Storm Water Surface water resulting from rainfall that does not percolate into the groundor evaporate.
Stormwater Treatment Area (STA) A system of large treatment wetlands that usenaturally occurring biological processes to reduce the levels of phosphorus fromagricultural runoff prior to it being released to the Everglades.
Subregional Ground Water Model A computer model that is used to simulate impactson a smaller scale than the SFWMM, such as effects within public water supply serviceareas and impacts of individual wellfields.
Subsidence An example of subsidence is the lowering of the soil level caused by theshrinkage of organic layers. This shrinkage is due to biochemical oxidation.
Supply-Side Management The conservation of water in Lake Okeechobee to ensure thatwater demands are met while reducing the risk of serious or significant harm to naturalsystems.
Surface Water Water that flows, falls, or collects above the surface of the earth.
Surficial Aquifer System (SAS) The SAS is the major source of water in the LECPlanning Area. It is unconfined, consisting of varying amounts of limestone and sedimentsthat extend from the land surface to the top of an intermediate confining unit.
SWIM Plan Surface Water Improvement and Management Plan, prepared according toCh. 373, F. S.
351
Glossary LEC Regional Water Supply Plan - Planning Document
Thermoelectric Self-Supplied Water Demand The difference in the amount of waterwithdrawn by electric power generating facilities for cooling purposes and the waterreturned to the hydrologic system near the point of withdrawal.
Transmissivity A term used to indicate the rate at which water can be transmitted througha unit width of aquifer under a unit hydraulic gradient. It is a function of the permeabilityand thickness of the aquifer, and is used to judge its production potential.
Turbidity The measure of suspended material in a liquid.
Wastewater The combination of liquid and waterborne discharges from residences,commercial buildings, industrial plants and institutions together with any ground water,surface runoff or leachate that may be present.
Water Budget An accounting of total water use or projected water use for a givenlocation or activity.
Water Conservation Any beneficial reduction in water losses, wastes, or use.
Water-Conserving Plumbing Fixtures Fixtures that meet the standards at a test pressureof 80 psi listed below.
• Toilets - 1.6 gal/flush
• Shower Heads - 2.5 gal/min.
• Faucets - 2.0 gal/min.
Water Resource Caution Areas Areas that have existing water resource problems or areplaced where water resource problems are projected to develop during the next 20 years(previously referred to as critical water supply problem areas).
Water Resource Development The formulation and implementation of regional waterresource management strategies, including: the collection and evaluation of surface waterand ground water data; structural and nonstructural programs to protect and manage thewater resource; the development of regional water resource implementation programs; theconstruction, operation, and maintenance of major public works facilities to provide forflood control, surface and underground water storage, and groundwater rechargeaugmentation; and, related technical assistance to local governments and to government-owned and privately owned water utilities.
Watershed The drainage area from which all surface water drains to a common receivingwater body system.
Water Shortage Declaration (Rule 40E-21.231, Florida Administrative Code) “If…there is a possibility that insufficient water will be available within a source class tomeet the estimated present and anticipated user demands from that source, or to protect thewater resource from serious harm, the Governing Board may declare a water shortage for
352

LEC Regional Water Supply Plan - Planning Document Glossary
the affected source class.” Estimates of the percent reduction in demand required to matchavailable supply is required and identifies which phase of drought restriction isimplemented. A gradual progression in severity of restriction is implemented throughincreasing phases. Once declared, the District is required to notify permitted users by mailof the restrictions and to publish restrictions in area newspapers.
Water Supply Development The planning, design, construction, operation, andmaintenance of public or private facilities for water collection, production, treatment,transmission, or distribution for sale, resale, or end use.
Weir A barrier placed in a stream to control the flow and cause it to fall over a crest. Weirswith known hydraulic characteristics are used to measure flow in open channels.
Wetlands Areas that are inundated or saturated by surface or ground water at a frequencyand duration sufficient to support a prevalence of vegetation typically adapted for life insaturated soil conditions.
XeriscapeTM Landscaping that involves seven principles: proper planning and design;soil analysis and improvement; practical turf areas; appropriate plant selection; efficientirrigation; mulching; and appropriate maintenance.
353

Glossary LEC Regional Water Supply Plan - Planning Document
354

LEC Regional Water Supply Plan - Planning Document References
REFERENCES
Boyle Engineering. 1989. Process and Evaluation and Testing Program - Sarasota WaterImprovements Program Phase I. Prepared by Boyle Engineering Corporation forDames and Moore, Fort Myers, FL. 5 pp.
Chamberlain, R.H, D.E. Haunert, P.H. Doering, K.M Huanert, J.M. Otero, and A.D.Steinman. 1995. Preliminary Estimate of Optimum Freshwater Inflow to theCaloosahatchee Estuary, Florida. Technical Memorandum, Department of EcosystemRestoration, South Florida Water Management District, West Palm Beach, FL.
Davis, J.H. 1943. The Natural Features of Southern Florida, Especially the Vegetation ofthe Everglades. Bulletin No. 25, Florida Geological Survey, Tallahassee FL.
Duever. 1988. Hydrologic Processes for Models of Freshwater Wetlands. In: Mitch, W.,J.M. Jorgensen, and S.E. Jorgensen (Eds.), Wetlands Modeling, Elsevier, Amsterdam,pp 9-39.
Erwin. 1991. An Evaluation of Wetland Mitigation in the South Florida WaterManagement District. South Florida Water Management District, West Palm Beach,FL, 124 pp.
Fish, J.E., and Stewart, M., 1991. Hydrogeology of the Surficial Aquifer System, DadeCounty, Florida. U.S. Geological Survey Water-Resources Investigations Report 90-4108, Tallahassee, FL, 50 p.
FGFWFC. 1998. Personal communication on state-listed species dated February 23, 1998,Florida Game and Fresh Water Fish Commission, CITY, FL.
GCSSF. 1995. Initial Report. Governor’s Commission for a Sustainable South Florida.October 1, 1995. Coral Gables, FL.
GCSSF. 1996a. Technical Advisory Commitee Aquifer Storage and Recovery Report.Governor’s Commission for a Sustainable South Florida. October 23, 1996. CoralGables, FL.
GCSSF. 1999. Restudy Plan Report. Governor’s Commission for a Sustainable SouthFlorida. January 1999. Coral Gables, FL.
Guerra, Robert. 1996. Impacts of the High Water Period of 1994-1995 on Tree Islands inWater Conservation Areas. In: Armentano, T.V. (ed), Ecological Assessment of the1994-1995 High Water Conditions in the Southern Everglades, ConferenceProceedings, Florida International University, August 22-23, 1996, Miami, Florida.South Florida Natural Resources Center, Everglades National Park, Homestead,Florida. pp 47-58.
Havens, K.E and B.H. Rosen. 1995. Plan for Quantifying Long-term Ecological Trends inLake Okeechobee, Technical Memorandum, Okeechobee Systems Research, SouthFlorida Water Management District, West Palm Beach, FL.
Heister, L. and T. Towles. 1999. Personal communication. Florida Fresh WaterConservation Commission.
355
References LEC Regional Water Supply Plan - Planning Document
Hoffmeister, J.E., 1974. Land from the Sea, Miami, FL, 143 p.
Jordan, J.L., D.M. Kent, J.M. Shafer, E. Van Donk, and C.L. Coultas. 1998. Final Reportof the Peer Review Panel Concerning Proposed Minimum Water Level Criteria forLake Okeechobee, the Everglades, and the Biscayne Aquifer within the South FloridaWater Management District. Submitted to the South Florida Water ManagementDistrict, West Palm Beach, FL., on September 22, 1998.
Marban and Trimble. 1988. Preliminary Evaluation of the Lake Okeechobee RegulationSchedule. Technical Report Publication 88-5, South Florida Water ManagementDistrict, West Palm Beach, FL.
McVoy, C., W.A. Park, and J. Obeysekera. In Review. Pre-drainage Landscapes andHydrology of the Everglades, Hydrologic Systems Modeling Department, SouthFlorida Water Management District, West Palm Beach, FL.
Mitch and Gosselink. 1986. Wetlands. Ban Norstran Reinhold Co., New York, NY.
Mulkey, D. and R. Clouser. 1988. The Economic Impact of the Florida Sugar Industry.Food and Res. Economics Department, Institute of Food and Agricultural Sciences,University of Florida, Gainesville, FL, 17 p.
Parker, G.G., G.E. Ferguson, and S.K. Love. 1955. Water Resources of SoutheasternFlorida with Special Reference to the Geology and Groundwater of the Miami Area.Water Supply Paper 1255, U.S. Geological Survey, U.S. Government Printing Office,Washington, D.C., 965 pp.
Paulic, M. and J. Hand. 1998. Florida Water Quality Assessment 1998 305 (b) Report.Bureau of Surface Water Management, Florida Department of EnvironmentalProtection, Tallahasee, FL.
PBS&J. 1991. Water Supply Costs Estimates. Post, Buckely, Schuh & Jernigan, Inc.,Tampa, FL.
Pyne, D. 1995. Ground Water Recharge and Wells: a Guide to Aquifer Storage andRecovery. CRC, Boca Raton, FL.
RAFTF. 1997. Regional Attenuation Facility Task Force Final Report. Prepared by theRegional Attenuation Task Force jointly established by the St. Lucie and MartinCounty Commissions.
SFWMD. 1991. Water Supply Policy Document. South Florida Water ManagementDistrict, West Palm Beach, FL.
SFWMD. 1993. Draft Working Document Lower East Coast Regional Water Supply Plan.Planning Department, South Florida Water Management District, West Palm Beach,FL.
SFWMD. 1994a. Lower West Coast Water Supply Plan. Planning Department, SouthFlorida Water Management District, West Palm Beach, FL.
SFWMD, 1994b. Part A: Basis of Review for Water Use. Management of Water UsePermitting Information Manual Volume III for the South Florida Water ManagementDistrict. SFWMD, West Palm Beach, FL.
356
LEC Regional Water Supply Plan - Planning Document References
SFWMD. 1995. 1995 District Water Management Plan, Planning Department, SouthFlorida Water Management District, West Palm Beach, FL.
SFWMD. 1996a. 1996 District Water Management Plan Annual Report, PlanningDepartment, South Florida Water Management District, West Palm Beach, FL.
SFWMD. 1996b. Kissimmee Basin Water Supply Plan Background Document, PlanningDepartment, South Florida Water Management District, West Palm Beach, FL.
SFWMD. 1997a. Surface Water Improvement and Management Act Plan for LakeOkeechobee, Planning Department, South Florida Water Management District, WestPalm Beach, FL.
SFWMD. 1997b. The 1997 Everglades Annual Report, Office of Government and PublicAffairs, South Florida Water Management District, West Palm Beach, FL.
SFWMD. 1997c. 1997 District Water Management Plan Annual Report, PlanningDepartment, South Florida Water Management District, West Palm Beach, FL.
SFWMD. 1997d. Basis of Review for Water Use. Management of Water Use PermittingInformation Manual Volume III for the South Florida Water Management District.South Florida Water Management District, West Palm Beach, FL.
SFWMD. 1998a. 1998 District Water Management Plan Annual Report, PlanningDepartment, South Florida Water Management District, West Palm Beach, FL.
SFWMD. 1998b. Interim Plan for Lower East Coast Regional Water Supply, PlanningDepartment, South Florida Water Management District, West Palm Beach, FL.
SFWMD. 1998c. Districtwide Water Supply Assessment. South Florida WaterManagement District, West Palm Beach, FL.
SFWMD. 1998d. Upper East Coast Water Supply Plan, Planning Department, SouthFlorida Water Management District, West Palm Beach, FL.
SFWMD. 1998e. Regional Water Supply Assessment, Planning Department, South FloridaWater Management District, West Palm Beach, FL.
SFWMD. 1999. 1999 District Water Management Plan Annual Report, PlanningDepartment, South Florida Water Management District, West Palm Beach, FL.
SFWMD. 2000a. District Water Management Plan, Office of Finance, South FloridaWater Management District, West Palm Beach, FL.
SFWMD. 2000b. Lower West Coast Water Supply Plan. Water Supply Department, WaterResources Management, South Florida Water Management District, West Palm Beach,FL.
SFWMD. 2000c. Kissimmee Basin Water Supply Plan. Water Supply Department, WaterResources Management, South Florida Water Management District, West Palm Beach,FL.
357
References LEC Regional Water Supply Plan - Planning Document
SFWMD. 2000d. Caloosahatchee Water Management Plan. Water Supply Department,Water Resources Management, South Florida Water Management District, West PalmBeach, FL.
SFWMD. 2000e. Draft Minimum Flows and Levels for Lake Okeechobee, the Everglades,and the Biscayne Aquifer, Water Supply Department, Water Resources Management,South Florida Water Management District, West Palm Beach, FL.
Shine, M., D. Padgett, and W.M. Barfknect. 1989. Ground Water Resource Assessment ofEastern Palm Beach County, Florida. Technical Publication #89-4, South FloridaWater Management District, West Palm Beach, FL.
South Dade SWCD. 1999. Mobile Irrigation Lab. South Dade Soil and WaterConservation District, Homestead, FL.
University of Florida. 1993. Microirrigation in Florida: Systems, Acreage and Costs.Bulletin 276, Institute of Food and Agricultural Sciences, University of Florida,Gainesville, FL.
USA v. SFWMD. 1991. 1991 Settlement Agreement. Lawsuit Case No. 88-1886-CIV-HOEVELER.
USFWS. 1997. Personal communication on federally-listed species dated February 20,1997, United States Fish and Wildlife Service, CITY, STATE.
USFWS. 1998a. Personal communication on federally-listed species dated April 8, 1998,United States Fish and Wildlife Service, CITY, STATE
USFWS. 1998b. Multi-Species Recovery Plan for the Threatened and Endangered Speciesof South Florida, Volume I, United States Fish and Wildlife Service, CITY, STATE.
USACE. 1996. Indian River Lagoon Restoration Feasibility Study, Project Study Plan,Central and Southern Florida Project Comprehensive Review, U.S. Army Corps ofEngineers, Jacksonville District.
USACE and SFWMD. 1998. Specific Superfund (National Priority List: NPL) and RCRAhazardous waste sites in South Florida – Appendices H and K. The Central andSouthern Florida Flood Control Project Comprehensive Review Study FinalIntegrated Feasibility Report and Programmatic Environmental Impact Statement.U.S. Army Corps of Engineers, Jacksonville District, Jacksonville, FL, and SouthFlorida Water Management District, West Palm Beach, FL.
USACE and SFWMD. 1999. Central and Southern Florida Flood Control ProjectComprehensive Review Study Final Integrated Feasibility Report and ProgrammaticEnvironmental Impact Statement. U.S. Army Corps of Engineers, JacksonvilleDistrict, Jacksonville, FL, and South Florida Water Management District, West PalmBeach, FL.
358