Embed Size (px)
Citation preview
Lower Colorado River Accounting System
(LCRAS)
Lower Colorado Regionhttp://www.usbr.gov/lc/region/g4000/wtracct.html
Jeff Milliken: [email protected]

Presentation Overview
• Introduction• Demonstration of Technology• Current Status• Future Activities

Water Accounting and Verification Group
• Paul Matuska – Group Manager• Nicole Everett – Water Verification Team Lead• Jeff Milliken – Remote Sensing / GIS Lead• Katherine Zander – GIS Analyst• Michael Baker – Remote Sensing Analyst• David Chubb – Planning Specialist• Jeremy Dodds - Geographer
Introduction

LCRAS Development
• 1984, Initiated by the Task Force on Unmeasured Return Flow, consisting of:
• Reclamation,• U.S. Geological Survey,• Lower Basin States and,• Bureau of Indian Affairs.
• 1984-1990, USGS finished initial development of LCRAS, Reclamation begins further development.
• 1996, Reclamation applied LCRAS, and issued report, “Lower Colorado River Accounting System Demonstration of Technology Calendar Year 1995”.
Introduction
Yuma East Wetlands

Key Components of LCRAS• Map, monitor, and quantify crop and riparian
(phreatophyte) vegetation for water management activities.
• Estimate evapotranspiration (ET) in irrigated areas.
• Estimate ET in riparian areas.
• Estimate Evaporation from the channel and reservoirs of the lower Colorado River and evaporation from canals, lakes, and other open water areas.
Introduction

Diverters along the main stem of the Lower Colorado River fromHoover Dam to the Southern International Boundary of Mexico.
Wellton Mohawk Irrigation Dist. , AZ.
Imperial Irrigation Dist. , CA.
Coachella Valley Water Dist. , CA.
Represents approximately 870,000 acres of irrigated lands, and 500,000 acres of riparian area.
Current Program Area
Program Areas Shown Over Landsat Imagery
Introduction

Demonstration of Technology• Development and Improvement to Initial Methods:
• Contracted with water resources consultant (Dr. Marvin Jensen) for independent review and recommendations for improvements.
• Contracted with remote sensing consultant (Pacific Meridian Resources) for improved methods development.
• Contracted with independent statisticians for calculation and sampling improvements.
• Reclamation reviews and incorporates recommendations and improved methods.
• Reclamation begins annual publication of report and conducts stakeholder/public workshops for review and comment.
Demonstration of Technology

Program Activities• Mapping and Monitoring
Crops, Riparian, Open Water,Fallow Agriculture LandAnnual acreage summaries by diverter
• CalculationsOpen Water EvaporationEvapotranspiration (ET) Crops and Phreatophytes
• Cooperation/funding for weatherstations
AZMET, CIMIS
• ET StudiesUSGS Phreatophyte ET StudyAlliance University ET Study
• Annual publication of LCRAS report
Phreatophytes – Cibola NWR
CIMIS Station – Seeley, IID
Demonstration of Technology

Mapping and Monitoring
Remote Sensing and GIS
Riparian crown closure map and relational database
Demonstration of Technology

Remote Sensing and GIS
• GIS database that locates, identifies, and quantifies:• Crop Types• Riparian Types• Open Water Surface
• Remote Sensing used to generate data for GIS
• Provides for analysis at:• Field level, Irrigation Diverter, River Reach, State Boundaries, or other
required geographic area• Multi-temporal database allows for historical analysis
Crop database - CVWD
Demonstration of Technology
GIS - Field Border Database
• Over 29,000 Fields Digitized• Main stem diverters• Imperial Irrigation District• Wellton Mohawk Irrigation
District• Coachella Valley Irrigation
District
• GIS Database• GPS sample verified for
accuracy• Unique field ID – tracked and
archived• Updated on routine basis Imperial Irrigation District – Field Borders over Landsat Image
Demonstration of Technology

Field Border Relational Database
NAIP Imagery with Field Borders – IID, CA

Remote Sensing - Image ClassificationLandsat Satellite Imagery and NAIP Imagery• Classify Crops : 4 times per year (or as needed based on crop
calendar).• Riparian : General updates annually (change detection). • Open Water Surface : GIS open water surface checked yearly
based on comparison to new satellite imagery or NAIP imagery.
Crucifers – Yuma Area
Demonstration of Technology
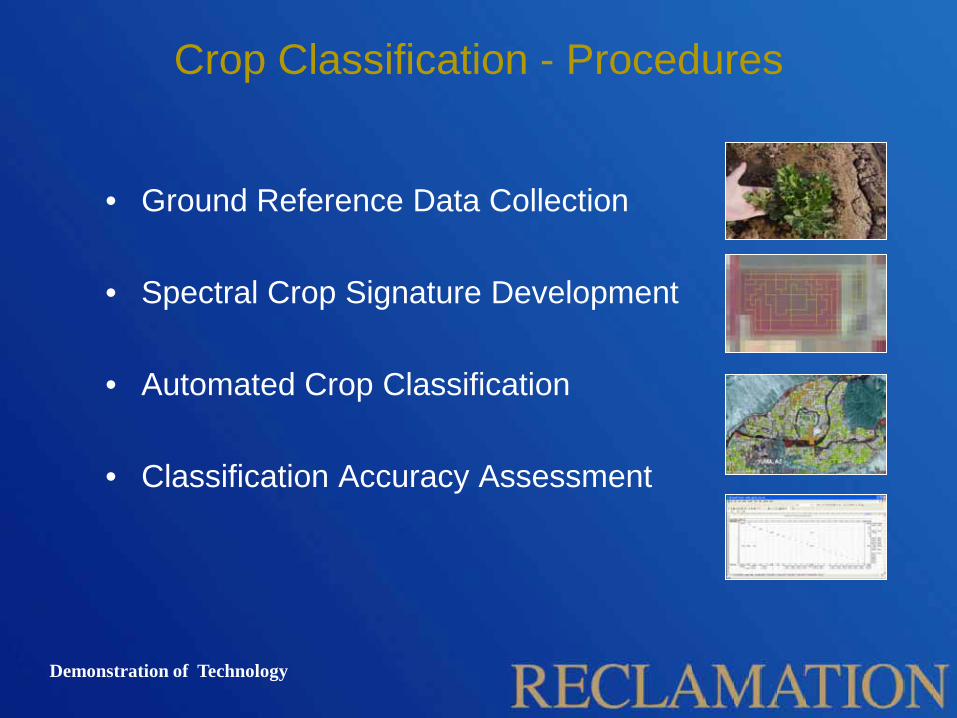
Crop Classification - Procedures
• Ground Reference Data Collection
• Spectral Crop Signature Development
• Automated Crop Classification
• Classification Accuracy Assessment
Demonstration of Technology

Crop Classification - Ground Reference Data• 4 field personnel currently being used (1 from CA DWR).
• Requires approximately 8 days to collect data for each classification period.
• Sample approximately12% of fields.
• “Capture” crop type,condition & spectral variability.
• Populate field border GIS database for crop classificationprocessing and accuracy assessment.
• Random stratified sample reserved for classification accuracy assessment (~40% of ground sample).
Demonstration of Technology

Multi-Year Crop Database
IID CY2007 Annual Summary Database Table Shown With Field Border Database – Alfalfa Field Shown in Blue
Demonstration of Technology

ET and Evaporation Calculation
Estimate of ET by vegetation type, and evaporation from water surface.
The calculation requires:
• Daily reference ET (provided by AZMET and CIMIS).
• Daily precipitation (provided by AZMET, CIMIS, NWS).
• Daily vegetation and water ET coefficients.
• Acreage of vegetation types and water surface (provided by remote sensing and GIS analysis).
Demonstration of Technology
AZMET, Mohave area, AZ

ET Calculation
• Calculated for crops and riparian within the flood plain and the Palo Verde and Yuma Mesas.
• Calculated for crops in Wellton Mohawk, Coachella, and Imperial Irrigation District.
• Crop types are grouped into 16 classes including fallow fields.
The sum of the ETcrop compiled for calendar year 2007 is approximately 3.34 maf, or about 45% of the lower Colorado River basin use.
• Riparian types are grouped into 14 classesThe sum of the ETpht (main stem Lower Colorado River) compiled for calendar year 2007 is about 0.63 maf, or about 8% of the lower Colorado River basin use.
Demonstration of Technology

EvaporationCalculated for Lake Mohave, Lake Havasu, Senator Wash, Colorado River, Backwaters, Major Canals, Some Minor Canals.
Water surface updated annually in GIS database.
Sum of the evaporationCY2007 : approximately0.39 maf or about 5% of the lower Colorado River basin water use.
Digitized Canal – Parker Area
Demonstration of Technology

Current Status• LCRAS data does not replace the
current decree accounting methodology.
• LCRAS data is being integrated into many water management activities requiring crop, phreatophyte, and associated ET information.
• New technologies are being evaluated and tested to improve or enhance current methods.
• Integration of emerging remote sensing technologies such as Energy Balance Algorithms for ET determination.
• Verification and quantification of conserved water for various programs:
• System Conservation • Intentionally Created Surplus • Inadvertent Overrun and Payback• Fallowing agreements
• Economic impact analysis for land use conversions, fallowing programs, and other planning activities.
• Water contract and system conservation program administration, land inclusions, and water entitlement determinations.
Future Activities

Data Web Interface
Web Interface To Provide Data Query, Summary and Data Download Capabilities
Future Activities

Improved ET / Evaporation Calculation Software
Future Activities
Relational database application with improved data calculation interface,versatility for customized applications,and automated interface for downloadingweather station data.

Concluding Remarks
• Requires trained dedicated staff.• Requires development of standardized procedures with
accuracy assessment• Requires expertise in Remote Sensing and GIS.• Requires awareness of emerging technologies for
potential methods improvement.• Benefits from collaboration with partners and
stakeholders.• Requires funding and management support.
Cienega de Santa Clara, Mexico

Discussion
Topock Marsh – 1 foot CIR