Embed Size (px)
Citation preview

Tidal Barriers Audit Summary Report: Lower Bay of Fundy 2004
By Nicole Hynes
April 2005
Coastal Issues Committee Special Publication Number 5
ISBN 0-9734181-5-X

Tidal Barriers Audit Summary Report: Lower Bay of Fundy 2004
By: Nicole Hynes
Edited By: Tony Bowron and Jennifer Graham
Coastal Issues Committee Special Publication Number 5 Ecology Action Centre
April 2005

Tidal Barriers Audit Summary Report: Lower Bay of Fundy 2004 1
©2005 All Rights Reserved. Sections of this report may be copied with permission from the authors. Please acknowledge source on all reproduced materials. The authors wish to thank their funding source: Fisheries & Oceans Canada – Science & Technology Youth Internship Program Bay of Fundy Ecosystem Partnership Unilever-Evergreen Foundation Wildlife Habitat Canada Gulf of Maine Council on the Marine Environment Nova Scotia Department of Transportation and Public Works Cover photo by Nicole Hynes. The photographs displayed within the report taken by Nicole Hynes. National Library of Canada Cataloguing in Publication Data Hynes, Nicole. 1980-
Tidal barriers audit summary report: lower Bay of Fundy 2004 / by Nicole Hynes ; edited by Tony Bowron and Jennifer Graham (Coastal Issues Committee special publication; no. 5) Includes bibliographical references. ISBN 0-9734181-5-X
1. Salt marshes—Nova Scotia—Annapolis (County) 2. Salt
marshes–Nova Scotia–Digby (County) 3. Wetlands restoration—Nova Scotia—Annapolis (County) 4. Wetlands restoration—Nova Scotia—Digby (County) 5. Coastal zone management—Nova Scotia—Annapolis (County) 6. Coastal zone management—Nova Scotia—Digby (County) I. Bowron, Tony M. (Tony Mark), 1974- II. Graham, Jennifer, 1971- III. Ecology Action Centre IV. Title V. Series QH106.2 N68H95 2005 333.91’880971632 C2005-903705-9 To contact the authors or to obtain additional copies, contact: Coastal Issues Committee Ecology Action Centre 1568 Argyle Street Suite 31 Halifax, Nova Scotia B3J 2B3 Phone: (902) 429-2202 Fax: (902)422-6410 Email: [email protected]/l. Website: www.ecologyaction.ca
Tidal Barriers Audit Summary Report: Lower Bay of Fundy 2004 2
Acknowledgements The author would like to thank those who helped make this report possible:
The Parker River Clean Water Association, Massachusetts, for developing the original audit methodology and allowing for its modification and use by groups such as ours.
The members of the Bay of Fundy Ecosystems Partnership (BoFEP) Salt Marsh and
Restricted Tidal Systems Working Group, most notably the Conservation Council of New Brunswick, for adapting the Parker River Methodology for use in the Bay of Fundy, and for developing the field data sheets.
Shayne McQuaid (Stewardship Unit, Habitat Management Division, Fisheries and
Oceans Canada) for his continued support and involvement in this project
Dr. Bob Pett (Nova Scotia Department of Transportation and Public Works) for his support and contributions to the project.
Roland LeBlanc (Salmon River Salmon Association) for the guided tour of Digby
County, the tremendous amount of information provided on the rivers and marshes found in that part of the province and for all his efforts to protect and restore those rivers and wetlands.
The members of the salt marsh project team – Tony Bowron, Jennifer Graham, Nancy
Chiasson, Allison Parker, Phillip Clement and Anne Gregory as well as the many volunteers who helped with the project.
This project was carried out with the financial and in-kind support of: Fisheries & Oceans Canada – Science & Technology Youth Internship Program Bay of Fundy Ecosystem Partnership – SMaRTS Working Group Unilever-Evergreen Foundation Wildlife Habitat Canada Gulf of Maine Council on the Marine Environment Nova Scotia Department of Transportation and Public Works Saint Mary’s University’s Community-Based Environmental Monitoring Network

Tidal Barriers Audit Summary Report: Lower Bay of Fundy 2004 3
Table of Contents 1.0 Introduction......................................................................................................................... 4 2.0 Methodology ....................................................................................................................... 4 3.0 Results and Discussion ....................................................................................................... 7
3.1 Annapolis County ........................................................................................................... 7
Sites AC1C to AC6C .................................................................................................... 8 Annapolis River Hydro Dam (DC7A) .......................................................................... 9 Moose River (East) (DC8C) ......................................................................................... 9
3.2 Digby County................................................................................................................ 10
3.2.1 Sites of Interest ...................................................................................................... 10
Winchester Point (DC6C-7C) ..................................................................................... 10 Walsh Brook (DC10C) ............................................................................................... 11 Haight Brook (DC20C)............................................................................................... 12 Post Brook and Henderson Brook (DC21-22A) ......................................................... 12 Cape St. Mary’s Marsh (DC43B-45B) ....................................................................... 13
3.2.2 Additional Restricted Sites .................................................................................... 14
Chisholm Brook (DC2C) ............................................................................................ 14 Wade Brook (DC5B) .................................................................................................. 15 Little Joggins (DC12C and DC13C)........................................................................... 15 Westport (DC15C) ...................................................................................................... 16 Freeport (DC16C) ....................................................................................................... 17 Long Island Brook (DC17C) ...................................................................................... 17 Little River Wharf (DC19B)....................................................................................... 18 Kinney Brook (DC24B).............................................................................................. 18 Grosses Coques River (DC31B and DC32C) ............................................................. 19 Duffy Brook system (DC34A).................................................................................... 20
3.3 Complete List of Tidal Crossings Assessed.................................................................. 21 3.4 Study Area Maps Showing Locations of Tidal Crossings Assessed ............................ 24
4.0 General Conclusion........................................................................................................... 26 5.0 References and Resources................................................................................................. 27 Appendix A – Project Background ......................................................................................... 28 Appendix B – Tidal Barriers Audit Data Sheet: Phase I Visual Assessment ......................... 29 Appendix C – Tidal Barriers Audit Data Sheet: Phase 2 Tidal Measurements ...................... 31

Tidal Barriers Audit Summary Report: Lower Bay of Fundy 2004 4
1.0 Introduction This report summarizes the findings of a tidal barriers audit conducted for the Nov Scotia side of the lower Bay of Fundy as part of the Ecology Action Centre’s (EAC) Salt Marsh and Tidal River Restoration Project (Salt Marsh Project). Salt marshes are coastal wetlands found throughout the Bay of Fundy. They are formed from the deposition of sediment into low lying areas and experience daily flooding from the tides, which is essential to their form and function. They provide a range of ecological services which include providing habitat and food for a range of birds, fish and wildlife, protecting against storm surges and erosion, improving water quality, and supporting coastal and marine food webs. Salt marshes also provide recreational, educational and scientific opportunities for surrounding communities. Unfortunately tidal river and salt marsh systems throughout the Bay of Fundy have been degraded and lost due to the pressures of human activities over the last 400 years. Tidal barriers are structures that prevent the natural movement of tidal waters and species into low lying coastal areas and are a main cause of salt marsh loss in this region. Such barriers can lead to habitat decline, increased erosion, sedimentation, water turbidity, changes in channel size and direction, and the conversion of salt marshes into brackish and freshwater wetlands (Harvey, 2004). They can block fish passage and historical migration routes and result in loss of access to spawning and nursery areas. Barriers can even lead to the total elimination of the marshland. Tidal barriers come in a variety of forms and restrict waterways in a variety of ways. Common man made barriers include dykes, dams, wharves, causeways and road crossings (bridges, culverts and aboiteaux). For the past five years the EAC’s Salt Marsh Project, with the support of project partners and funders, has been identifying tidal barriers and opportunities for salt marsh restoration around the NS side of the Bay of Fundy. An inventory of tidal barriers has been completed for the upper Bay of Fundy (NS side), the results of which are presented in a series of tidal barrier audit reports (see Resources section for a complete list). In 2001 a pilot salt marsh restoration project began at Cheverie Creek, a salt marsh system identified as being tidally restricted by a causeway-culvert during the first tidal barriers audits (for more information on this project see Appendix A or visit www.ecologyaction.ca). This report is a summary of the findings of the tidal barriers audit conducted for the lower Bay of Fundy region, encompassing Annapolis and Digby Counties.
2.0 Methodology A preliminary visual assessment was conducted on accessible tidal road crossings: bridges, culverts and aboiteaux, along the coast of Digby and Annapolis Counties, to determine which crossings were restricting tidal flow and/or fish passage to salt marsh and tidal rivers. From this it could be established which crossings have the potential to be modified or replaced by less tidally restrictive structures. This methodology was adapted from the Parker River Clean Water Association’s Tidal Crossing Handbook (Purinton and Mountain, 1998). For more information on the methodologies used in the tidal barriers audits please refer to one of the other EAC tidal barrier reports such as, “Tidal Barriers and Opportunities for Salt Marsh
Tidal Barriers Audit Summary Report: Lower Bay of Fundy 2004 5
and Tidal River Restoration in the Southern Bight of the Minas Basin, Nova Scotia” (Hynes, Bowron and Duffy 2005). Potential tidally restrictive sites were first identified using topographical maps and aerial photographs to determine the location, nature of the crossing, type and size of the affected system. This preliminary assessment was followed up by one or more site visits. During the site visits a data sheet was used to help with the assessments and took into account the following factors (for an example of the data sheet used in the visual assessments see Appendix B):
• Visual indicators of restriction (up and downstream): bank slumping, scour pools, water flow, differences in upstream and downstream water levels, ratio of stream width to opening size, divergent channels and vegetation.
• Factors that could potentially influence the assessment: such as weather, tide level and wind.
• Land use: upstream and downstream. Used to determine if land use is contributing to restriction, if there is a possibility of salt marsh recovery (increase in wetland area), and if restoration has the potential to adversely impact adjacent activities.
• Quantitative measurements: tidal crossing and stream dimensions. • Crossing condition: obvious causes of restriction due to construction or deterioration
of crossing, and/or presence of debris. These factors can contribute to the degree of restriction caused by the crossing and determine if there is a potential for restoration activities. GPS coordinates and photographs were taken at each site for future reference and for inclusion in a Bay of Fundy wide database of tidal barriers being developed by St. Mary’s University. Each crossing was assigned a degree of restriction, indicating the severity of impact. Categories include: • No restriction: crossings that allow for full tidal flow and cause no ill effects to the
upstream system • Partial restriction: crossings that limit tidal flow due to the size, placement, condition of
the structure while still allowing for some tidal exchange and retention of wetland function
• Complete restriction: crossings that do not allow for any tidal flow through to the upstream
• No longer tidal: crossings which no longer experience tidal flow due to activities or structures downstream.
Each tidal crossing that was assessed and determined to be either a partial or complete restriction to tidal flow was assigned a restoration priority level. This indicated which sites have the potential to restore tidal flow and salt marsh habitat to the system. These were based on the observations and data collected through the audit visits. More in depth monitoring could result in a change in these categories. These priority levels were adapted from the Conservation Council of New Brunswick’s 2004 Return the Tides campaign publication, “Tidal Barriers in the Bay of Fundy, New Brunswick Coast.” (Harvey 2004)

Tidal Barriers Audit Summary Report: Lower Bay of Fundy 2004 6
Level 1 (Green) – Small to medium-scale projects that could produce clear environmental benefits and which could be accomplished with modest commitments of time and resources, possibly coordinated by local groups, or handled through routine road maintenance. Level 2 (Yellow) - High impact barriers requiring high costs, complex engineering solutions, but which would deliver large environmental benefits. Level 3 (Orange) - Low impact barriers which may not deliver significant environmental benefits. Level 4 (Red) - Barriers which protect infrastructure or active agricultural land and are not likely eligible for restoration. Information provided in this report (indicators, degree of restriction, priority levels, etc.) were based on observations made by the tidal barrier auditors at the time of the assessments. Changes may have occurred to certain sites since this date. In addition, since most information detailed in this report was provided through preliminary visual assessments, more in depth examination could result in different ratings. The study area for this report includes the Bay of Fundy coast for all of Annapolis County and Digby County (Figure 1). This area of coastline contained two main regions, St. Mary’s Bay and the Annapolis Basin. Large salt marshes occur along the Annapolis Basin however many of which have been dyked since the settlement of the Acadians in the early 1600’s. The North Mountain Range runs long the rest of the Coast of Annapolis County and provides little opportunity for the growth of salt marsh habitat due to rapid rise in elevation. Digby County does not have the large tracts of salt marsh seen elsewhere in the Bay of Fundy. There are a number of moderate sized marshlands and many tidal river systems in the County.

Tidal Barriers Audit Summary Report: Lower Bay of Fundy 2004 7
Figure 1. Study Area – Annapolis County and Digby County, Nova Scotia
3.0 Results and Discussion The comments made in this section are based on the visual assessments made by the tidal barriers auditors during the summer/fall 2004. More in depth monitoring may produce different results. Summaries of the partial and complete restrictions for each county are detailed below. Each site was assigned a code indicating the study area, the sequential number of the site and the type of crossing (A-aboiteau, B-bridge, C-culvert). Information on dykes and aboiteuax across the province is available from the Nova Scotia Department of Agriculture and Fisheries. Only those in close proximity to a road crossing were assessed in this audit.
3.1 Annapolis County In Annapolis County (AC), only a small number of tidal crossings were assessed, 10 in total, all of which were found in the Annapolis Basin. This was due to the fact that much of the land along the coast of the Annapolis Basin has been dyked for agricultural purposes and the road crossings were either no longer tidal due to this downstream restriction or because many were far enough inland as to not experience tidal influence due to elevation. The North Mountain Range runs along the Bay of Fundy side of Annapolis County and due to the sharp rise in elevation there were few road crossings found to be tidally influenced. Of the 10 tidal crossings that were assessed, 2 had no restrictions, 7 were partial restrictions, and 1 was a complete restriction.
Tidal Barriers Audit Summary Report: Lower Bay of Fundy 2004 8
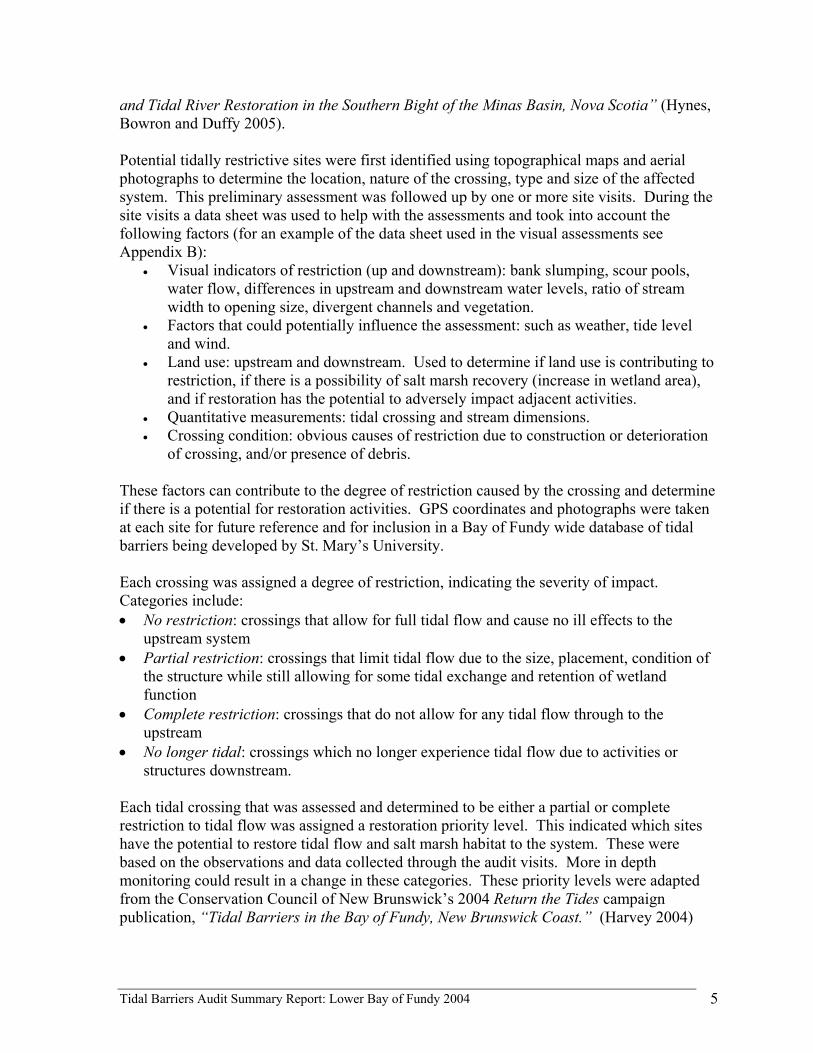
Sites AC1C to AC6C Partial Restrictions Location: North side of the Annapolis Basin from Victoria Beach to Annapolis Royal. Crossing type: There are a series of culverts located along a 15km stretch of Highway 1 along the north side of the Annapolis Basin. With the exception of DC6C most of these culverts are in fair condition and made of either wood of concrete. Comments: These crossings are summarized together because of their low restoration potential and similar tidal situations. They are not experiencing much tidal influence due to their placement and because of the rise in elevation just upstream of the crossings. With each crossing the potential for an increase in wetland habitat is low. These culverts were all smaller than the width of the streams, and many are placed too high in the creek bed for adequate fish passage. Site DC6C is the only site with significant salt marsh habitat that could potentially benefit from culvert replacement. The Dentabella and Queen Anne Marshes are found downstream of a number of crossings in this area but were not assessed due to the dyking along the coast of these marshes and the distance that the crossings were inland. Figures 2-7 show the downstream ends of crossings AC1C through AC6C.
Figure 2. AC1C – Thornes Brook, downstream
Figure 3. AC2C – Port Royal, downstream
Figure 4. AC3C – Croscup Brook, downstream.
Figure 5. DC4C – Dixon Brook, downstream

Tidal Barriers Audit Summary Report: Lower Bay of Fundy 2004 9
Figure 8. Causeway and hydropower station at mouth of Annapolis River. Downstream end of one of the dam gates.
Annapolis River Hydro Dam (DC7A) Complete Restriction Location: Annapolis Royal Crossing type: This causeway was constructed in 1960 to protect upstream agricultural dykelands from tidal flooding. In 1984, North America’s first successful tidal power generation station was installed in the causeway, designed with sluice gate and turbine channels (Figure 8). Comments: Due to the purpose of this structure there is no opportunity for restoring natural tidal flow to the system at this time. There are some dyked marshes around the mouth and edges of the river as well. Installation of the tidal power generation station restored limited tidal flow and fish passage to the system. At such time as the hydro station is decommissioned, replacement of all or part of the causeway with a bridge should be considered.
Moose River (East) (DC8C) Partial Restriction Location: Moose River, Highway 1 Crossing Type: Newly installed concrete culvert, second round culvert sealed off.
Figure 7. DC6C – Granville, downstream
Figure 6. DC5C – Granville, downstream

Tidal Barriers Audit Summary Report: Lower Bay of Fundy 2004 10
Comments: Since this culvert has just recently been installed there is likely little opportunity for replacement. This structure is quite large with an open bottom. Since this river is considerably larger than the culvert opening, a bridge spanning a greater portion of its width might have been the optimal crossing type. There is salt marsh downstream with a house located on the low marsh. Some salt marsh vegetation is present upstream, however, the sharp rise in elevation in a significant limiting factor. A railway crossing, further downstream, does not appear to be restrictive but was not accessible for evaluation.
3.2 Digby County In the Digby County (DC) region 48 tidal crossings were assessed along the coast, which included St. Mary’s Bay and a portion of the Annapolis Basin. Of these crossings, 21 were determined to be non-restrictive, 19 were partial restrictions, 4 were complete restrictions and 4 were no longer tidal. Overall almost half of the tidal crossings assessed were causing a restriction to tidal flow to some degree.
3.2.1 Sites of Interest These are sites that have a higher potential for restoration success either because of the greater amount of restorable marsh area, the condition of the crossing, or interest from local groups and residents.
Winchester Point (DC6C-7C) Complete Restriction Location: Winchester Point, near mouth of Bear River Crossing Type: The Winchester Point site consists of 3 culverts within a rail bed approximately 1.8m by 30m long: (DC6C) at the mouth of the system, a culvert through Highway 1 (DC7C) and a drainage culvert through Highway 101 (not assessed here). The rail bed culverts are now buried beneath rock on the south side of the crossing and the wooden support structure has completely collapsed on the north side. Water is seeping
Figure 9. Downstream end of the new culvert.

Tidal Barriers Audit Summary Report: Lower Bay of Fundy 2004 11
through the rocks where the structure is blocked. The Highway 1 culvert is no longer tidal and is receiving limited water flow due to the downstream blockage. Comments: The Winchester Point culverts greatly impact the upstream wetland. The 3 culverts and resulting head pond were cleared semi-annually by railroad crews. The water seeping through the rail bed rock foundation is the only tidal water getting through to the upstream because of the complete structural failure of the culverts. This area should be cleared and repaired and most likely replaced by a more appropriately sized and placed structure in order to restore tidal flow, fish passage and increase wetland habitat. Should this occur further assessment would be needed of the Highway 1 culvert (DC7C).
Walsh Brook (DC10C) Partial Restriction Location: Big Joggins tributary, Acacia Valley Crossing Type: This crossing contains a square wooden box culvert, 3.5 meters wide. It is filled with debris and in a considerable state of disrepair. Guardrails along the road are caving in, posing as a safety issue. The structure is also set high above the creek bed.
Figure 11. Upstream end of rail bed culverts, completely blocked by rock (DC6C)
Figure 10. Downstream end of rail bed; culverts completely collapsed (DC6C).
Figure 12. Downstream end of Highway 1 culvert (DC7C)

Tidal Barriers Audit Summary Report: Lower Bay of Fundy 2004 12
Comments: This culvert is too small and placed too high in the creek bed to allow for adequate flow of water and species upstream. Large boulders and debris are caving in around the crossing. There are remnants of an old wooden structure along the side of the creek just in front of the downstream end that should be removed to further improve hydrology, although these may not be causing a significant obstruction. This culvert needs to be replaced with a larger more appropriately placed structure. There is potential to improve wetland habitat conditions immediately upstream.
Haight Brook (DC20C) Partial Restriction Location: Highway 217, Rossway, Digby Neck. Crossing Type: This site contains a wooden box culvert, 2.5 meters wide, in poor condition and collecting debris. Comments: Downstream of the crossing there is a large seawall through which the creek channel has been diverted before being further diverted through this culvert. There are large scour pools at either end of the culvert. Upstream is a large salt marsh system which would greatly benefit from an enlarged opening, which would also improve tidal flow and fish passage to the system. Replacement of the culvert should be considered in combination with the enlargement of the opening in the seawall. Road crossing should be similar in size to the seawall opening and more properly aligned.
Post Brook and Henderson Brook (DC21-22A) Complete Restrictions Location: Marsh Road, head of St. Mary’s Bay Crossing Type: This site contains two aboiteaux (upstream end: concrete/square with two round openings) within a large dyke, completely restricting tidal flow to the upstream system.
Figure 13. Downstream end of the culvert at low tide, filled with debris and in poor condition
Figure 14. Downstream end of culvert

Tidal Barriers Audit Summary Report: Lower Bay of Fundy 2004 13
Comments: These aboiteaux are located roughly 1.5 km apart and open directly into St. Mary’s Bay. Upstream is agricultural land which appears to be currently used primarily for cattle grazing. This site is of significance not only because it once was the largest salt marsh system in St. Mary’s Bay, but also because of interest by one of the owners and local community in purchasing the entire dykeland area and restoring it to a functioning salt marsh. If the opportunity arises to do so, these aboiteaux could be removed (or at least the tide gates removed) and the dykes breached (naturally and/or manually), to allow tidal flooding back to the system. This would restore a large amount of converted marsh habitat back to natural conditions but is only possible if the upstream is no longer needed for agricultural purposes.
Cape St. Mary’s Marsh (DC43B-45B) Partial Restrictions Location: Mavillette River, Cape St. Mary’s Crossing Type: The wooden bridge (DC45B) located at the mouth of the Cape St. Mary’s marsh is 5m wide and opens directly onto the beach. Large boulders and wooden planks extend out around the structure and the channel. Upstream a second wooden bridge (DC44B) crosses the creek and is in need of repair. A concrete bridge that is part of Highway 1 (DC43B) crosses the creek further upstream and is significantly smaller than the channel causing the formation of scour pools and altering the path of water flow. Comments: The Cape St. Mary’s Marsh is a large system that is tidally restricted by the downstream structure at the mouth of the river. The channel has been diverted to flow through this crossing which is too small to supply adequate tidal flooding across the marsh surface and to the river and wetland system extending upstream. This should be replaced with a much larger structure placed inline with the original river path or a second larger opening installed along the roadway in inline with the original channel. The two upstream bridge structures will need to be replaced in the event of increased tidal flow from enlargement of site DC45B. Should this not occur, consideration should still be made to enlarging DC43B as it is too small an opening even under current tidal conditions.
Figure 15. Upstream end of aboiteaux Figure 16. Upstream system

Tidal Barriers Audit Summary Report: Lower Bay of Fundy 2004 14
There are two additional crossings further upstream in this system (DC42B, DC41C) but these are at the upper reaches of tidal influence and not causing a large restriction to water flow under current conditions. However, if work is to be done downstream these should be reassessed.
3.2.2 Additional Restricted Sites These sites range from being slight restrictions (from the pinching of the river channel by a bridge) to sites completely restricting tidal flow to the upstream. For reasons such as land use, small restorable area and crossing status (large bridge, newly installed), they are not high priority for restoration activities at the present time.
Chisholm Brook (DC2C) Partial Restriction Location: Tributary of Bear River, Bear River exit road Crossing Type: Wooden box culvert in poor condition, 3.7m wide.
Figure 17. DC45B – Cape St. Mary’s, downstream end.
Figure 19. DC44B – Cape St. Mary’s, downstream end.
Figure 20. DC43B – Mavillette River, upstream end.
Figure 17. DC45B – Cape St. Mary’s, downstream end.
Figure 18. DC45B – Cape St. Mary’s, upstream end.

Tidal Barriers Audit Summary Report: Lower Bay of Fundy 2004 15
Comments: This is a small tributary of Bear River that leads to a small salt marsh upstream. There is not a large potential for restoration because of the sharp rise in elevation. Downstream there is fringe salt marsh running along Bear River. While there is not a huge restriction to tidal flow from this crossing when repairs are made it could be enlarged since it is causing erosion, formation of scour pools and there is a difference in stream width.
Wade Brook (DC5B) Partial Restriction Location: Bear River Crossing Type: The site has a 7m concrete bridge with an old dam structure just downstream. The concrete dam spans the width of the creek with a 1-2m opening. Comments: While the bridge does not represent a restriction to tidal flow the dam opening does and should be removed if no longer serving a purpose. This site is approximately 5km inland and tidal influence may be minimal under normal tidal condition. There is no salt marsh habitat to restore, however, fish passage and water flow would be improved.
Little Joggins (DC12C and DC13C) Partial Restriction Location: Little Joggins, Digby Crossing Type: Two concrete culverts upstream from an old rail bed spanning the mouth of Little Joggins. Railway crossing could not be assessed due to construction activities at the time of assessment. It was not possible to determine the amount of tidal water moving
Figure 21. Downstream of crossing, Bear River system
Figure 22. Downstream dam
Tidal Barriers Audit Summary Report: Lower Bay of Fundy 2004 16
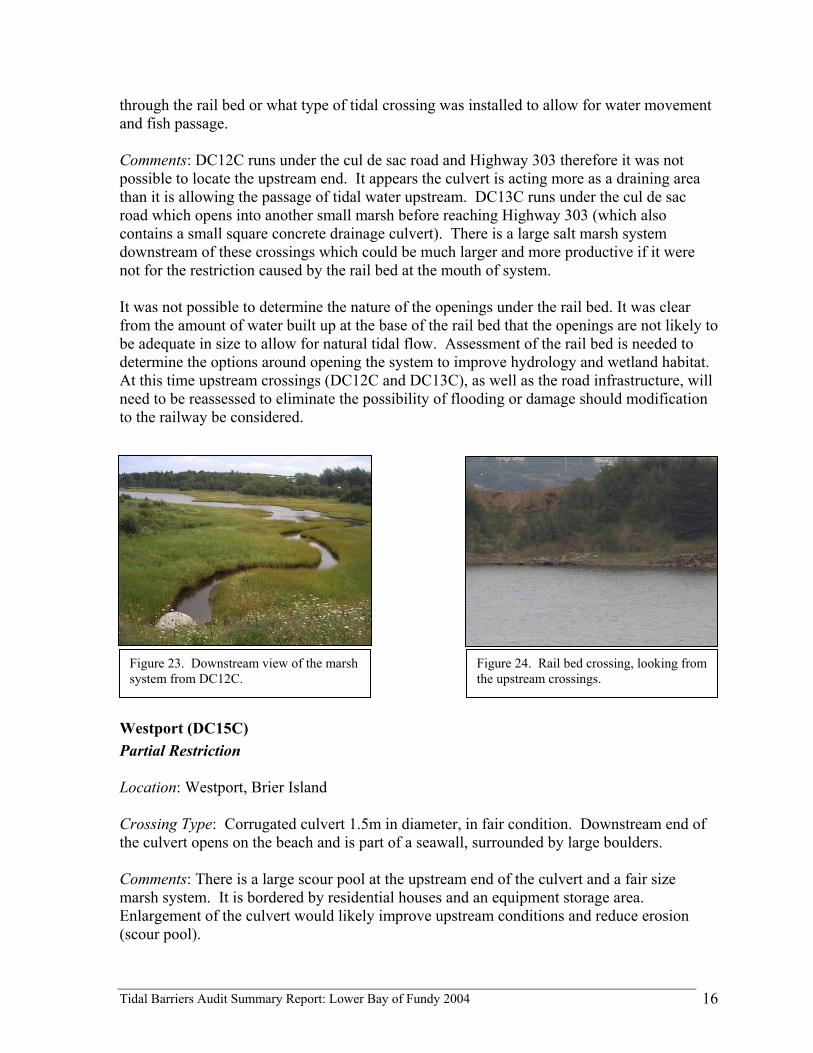
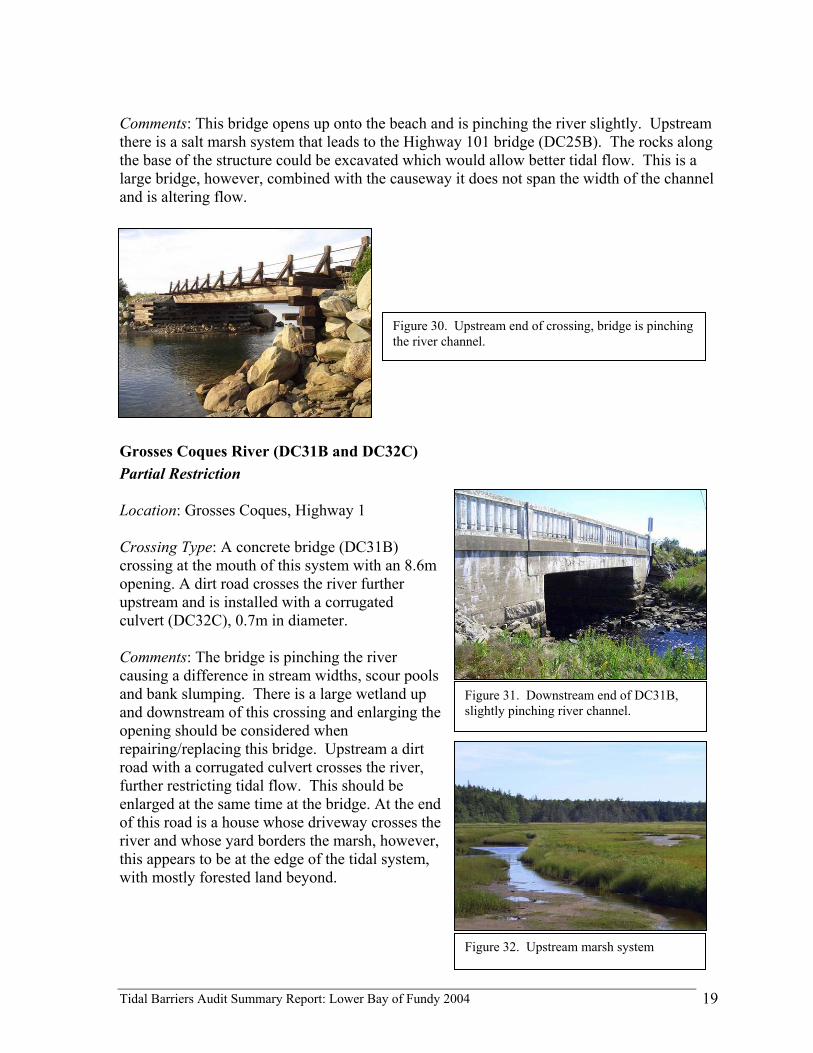
through the rail bed or what type of tidal crossing was installed to allow for water movement and fish passage. Comments: DC12C runs under the cul de sac road and Highway 303 therefore it was not possible to locate the upstream end. It appears the culvert is acting more as a draining area than it is allowing the passage of tidal water upstream. DC13C runs under the cul de sac road which opens into another small marsh before reaching Highway 303 (which also contains a small square concrete drainage culvert). There is a large salt marsh system downstream of these crossings which could be much larger and more productive if it were not for the restriction caused by the rail bed at the mouth of system. It was not possible to determine the nature of the openings under the rail bed. It was clear from the amount of water built up at the base of the rail bed that the openings are not likely to be adequate in size to allow for natural tidal flow. Assessment of the rail bed is needed to determine the options around opening the system to improve hydrology and wetland habitat. At this time upstream crossings (DC12C and DC13C), as well as the road infrastructure, will need to be reassessed to eliminate the possibility of flooding or damage should modification to the railway be considered.
Westport (DC15C) Partial Restriction Location: Westport, Brier Island Crossing Type: Corrugated culvert 1.5m in diameter, in fair condition. Downstream end of the culvert opens on the beach and is part of a seawall, surrounded by large boulders. Comments: There is a large scour pool at the upstream end of the culvert and a fair size marsh system. It is bordered by residential houses and an equipment storage area. Enlargement of the culvert would likely improve upstream conditions and reduce erosion (scour pool).
Figure 24. Rail bed crossing, looking from the upstream crossings.
Figure 23. Downstream view of the marsh system from DC12C.

Tidal Barriers Audit Summary Report: Lower Bay of Fundy 2004 17
Freeport (DC16C) Partial Restriction Location: Freeport, Long Island Crossing Type: Two corrugated culverts, side by side, 0.5m each in diameter, extensive rusting and collecting rock and large woody debris. Comments: Downstream of the system is a medium sized salt marsh, while the upstream wetland is dominated by freshwater vegetation. These culverts need to be replaced since they are in poor condition. When this occurs a single larger structure should be installed to improve tidal flow upstream and increase tidal marsh habitat upstream.
Long Island Brook (DC17C) Partial Restriction Location: Freeport, Long Island
Figure 25. Upstream end of crossing, showing scour pool and upstream system.
Figure 27. Downstream system Figure 26. Downstream end of the culverts, rusted and collecting debris.

Tidal Barriers Audit Summary Report: Lower Bay of Fundy 2004 18
Crossing Type: Two concrete culverts side by side, 2m each in diameter. Comments: The downstream end of this crossing opens into the ocean. Upstream the channel is diverted and flows at an angle. This system would be improved by installing a single opening, most likely a bridge since the river is quite large in size. Upstream infrastructure would have to be considered to ensure flooding does not occur.
Little River Wharf (DC19B) Partial Restriction Location: Little River, Digby Neck Crossing Type: Concrete bridge structure, 3.8m wide in good condition. Comments: Since this area is being used as a wharf there may be little potential to restore this area by enlarging the opening. There is a large tidal river and marsh system upstream that could potentially benefit from an increase in natural tidal flooding. The width of the river at the upstream and downstream ends exceeds 20m. Should the opening be enlarged, upstream infrastructure would need to be assessed to determine flood risk.
Kinney Brook (DC24B) Partial Restriction Location: Gilberts Cove, Lighthouse Road off Highway 101 Crossing Type: Wooden bridge 18m in length
Figure 28. Upstream system looking from on top of the culverts.
Figure 29. Downstream end of crossing, much smaller than the width of the river.
Tidal Barriers Audit Summary Report: Lower Bay of Fundy 2004 19
Comments: This bridge opens up onto the beach and is pinching the river slightly. Upstream there is a salt marsh system that leads to the Highway 101 bridge (DC25B). The rocks along the base of the structure could be excavated which would allow better tidal flow. This is a large bridge, however, combined with the causeway it does not span the width of the channel and is altering flow.
Grosses Coques River (DC31B and DC32C) Partial Restriction Location: Grosses Coques, Highway 1 Crossing Type: A concrete bridge (DC31B) crossing at the mouth of this system with an 8.6m opening. A dirt road crosses the river further upstream and is installed with a corrugated culvert (DC32C), 0.7m in diameter. Comments: The bridge is pinching the river causing a difference in stream widths, scour pools and bank slumping. There is a large wetland up and downstream of this crossing and enlarging the opening should be considered when repairing/replacing this bridge. Upstream a dirt road with a corrugated culvert crosses the river, further restricting tidal flow. This should be enlarged at the same time at the bridge. At the end of this road is a house whose driveway crosses the river and whose yard borders the marsh, however, this appears to be at the edge of the tidal system, with mostly forested land beyond.
Figure 31. Downstream end of DC31B, slightly pinching river channel.
Figure 32. Upstream marsh system
Figure 30. Upstream end of crossing, bridge is pinching the river channel.

Tidal Barriers Audit Summary Report: Lower Bay of Fundy 2004 20
Duffy Brook system (DC34A) Complete Restriction Location: Duffy Brook Aboiteau, Saulnierville Crossing Type: The downstream end of the aboiteau extends from the dyke and opens onto the beach and is surrounded by large boulders. Comments: The upstream system is a large freshwater marsh with a number of crossings that are no longer tidal and are not restricting water flow under current conditions. According to local residents fish passage at this site has been addressed and fish can enter the upstream system. Tidal flow could be reintroduced to the system through the removal of the tidal gates on the upstream end of the aboiteau. At that time the size and condition of the upstream crossings would need to be reassessed.
Figure 33. Downstream end of DC32C, undersized for the size of the system.
Figure 35. Downstream end of aboiteau covered by large boulders.
Figure 34. Upstream freshwater marsh system.

Tidal Barriers Audit Summary Report: Lower Bay of Fundy 2004 21
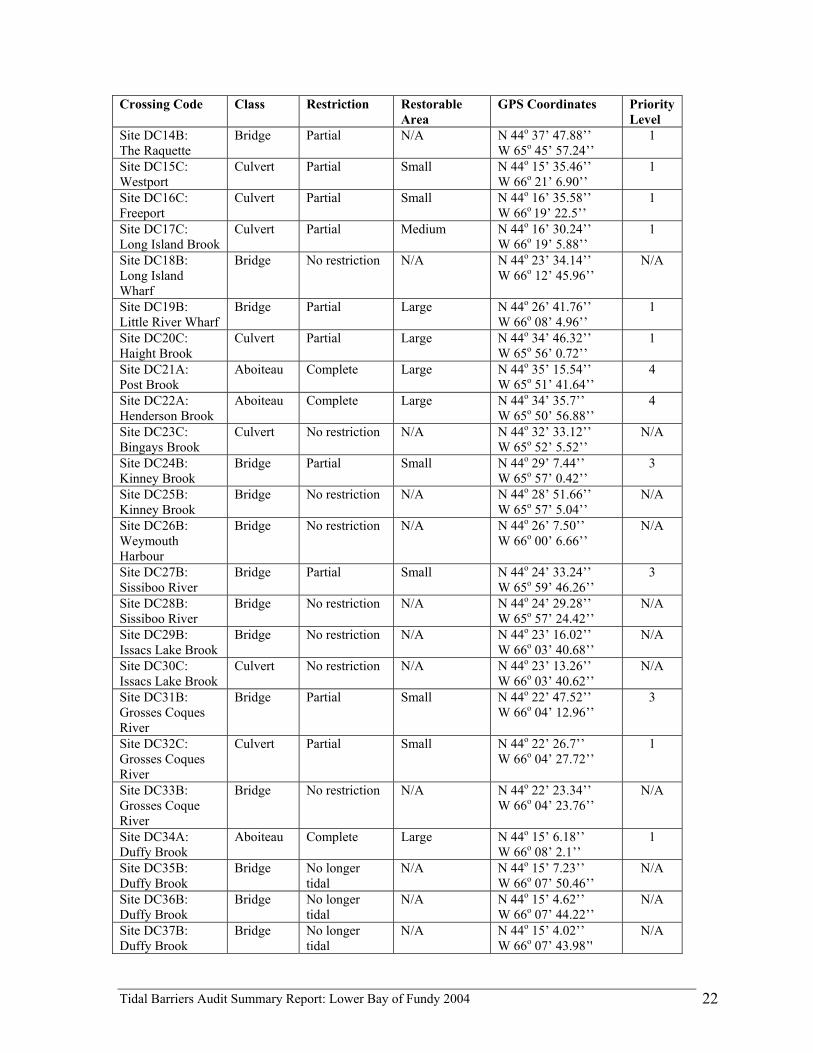
3.3 Complete List of Tidal Crossings Assessed Table 1. List of Tidal Crossings Assessed for Annapolis and Digby Counties Crossing Code Class Restriction Restorable
Area GPS Coordinates Priority
Level Site AC1C: Thornes Brook
Culvert Partial Small N 44o 41’ 59.1’’ W 65o 31’ 44.16’’
3
Site AC2C: Port Royal
Culvert Partial Small N 44o 42’ 37.02’’ W 65o 38’ 6.00’’
3
Site AC3C: Croscup Brook
Culvert Partial Small N 44o 42’ 41.52’’ W 65o 38’ 1.26’’
3
Site AC4C: Dixon Brook
Culvert Partial Small N 44o 42’ 48.54’’ W 65o 37’ 33.9’’
3
Site AC5C: Granville
Culvert Partial Small N 44o 44’ 40.5’’ W 65o 31’ 54.36’’
3
Site AC6C: Granville
Culvert Partial Small N 44o 44’ 49.02’’ W 65o 31’ 38.82’’
1
Site AC7A: Annapolis River
Dam Complete N/A N 44o 45’ 1.56’’ W 65o 30’ 42.9’’
4
Site AC8B: Allains River
Bridge No restriction N/A N 44o 44’ 16.74’’ W 65o 31’ 5.64’’
N/A
Site AC9C: Moose River (East)
Culvert Partial Small N 44o 39’ 38.58’’ W 65o 36’ 15.54’’
3
Site AC10B: Moose River (West)
Bridge No restriction N/A N 44o 39’ 38.58’’ W 65o 36’ 15.54’’
N/A
Site DC1B: Bear River
Bridge No restriction N/A N 44o 36’ 57.44’’ W 65o 40’ 51.87’’
N/A
Site DC2C: Chisholm Brook
Culvert Partial Small N 44o 35’ 18.78’’ W 65o 39’ 5.16’’
3
Site DC3B: Bear River
Bridge No restriction N/A N 44o 34’ 31.68’’ W 65o 38’ 23.7’’
N/A
Site DC4B: Harris Brook
Bridge No restriction N/A N 44o 34’ 34.26’’ W 65o 38’ 19.86’’
N/A
Site DC5B: Wade Brook
Bridge Partial Small N 44o 34’ 27.42’’ W 65o 38’ 24.0’’
1
Site DC6C: Winchester Pt
Culvert Complete
Medium N 44 37’ 2.04’’ W 65 41’ 15.18’’
2
Site DC7C: Winchester Pt
Culvert No longer tidal
N/A N 44 37’ 0.06’’ W 65 41’ 15.78’’
N/A
Site DC8B: Roach Brook
Bridge No restriction N/A N 44o 36’ 37.32’’ W 65o 42’ 53.34’’
N/A
Site DC9B: Big Joggins
Bridge No restriction N/A N 44o 36’ 2.64’’ W 65o 44’ 39.96’’
N/A
Site DC10C: Walsh Brook
Culvert Partial Small N 44o 35’ 43.5’’ W 65o 44’ 27.47’’
1
Site DC11B: Acacia Brook
Bridge No restriction N/A N 44o 34’ 59.64’’ W 65o 45’ 17.4’’
N/A
Site DC12C: Little Joggins
Culvert No restriction N/A N 44o 35’ 49.98’’ W 65o 46’ 3.42’’
N/A
Site DC13C: Little Joggins
Culvert Partial Medium N 44o 35’ 52.2’’ W 65o 46’ 9.78’’
3
Tidal Barriers Audit Summary Report: Lower Bay of Fundy 2004 22
Crossing Code Class Restriction Restorable Area
GPS Coordinates Priority Level
Site DC14B: The Raquette
Bridge Partial N/A N 44o 37’ 47.88’’ W 65o 45’ 57.24’’
1
Site DC15C: Westport
Culvert Partial Small N 44o 15’ 35.46’’ W 66o 21’ 6.90’’
1
Site DC16C: Freeport
Culvert Partial Small N 44o 16’ 35.58’’ W 66o 19’ 22.5’’
1
Site DC17C: Long Island Brook
Culvert Partial Medium N 44o 16’ 30.24’’ W 66o 19’ 5.88’’
1
Site DC18B: Long Island Wharf
Bridge No restriction N/A N 44o 23’ 34.14’’ W 66o 12’ 45.96’’
N/A
Site DC19B: Little River Wharf
Bridge Partial Large N 44o 26’ 41.76’’ W 66o 08’ 4.96’’
1
Site DC20C: Haight Brook
Culvert Partial Large N 44o 34’ 46.32’’ W 65o 56’ 0.72’’
1
Site DC21A: Post Brook
Aboiteau Complete Large N 44o 35’ 15.54’’ W 65o 51’ 41.64’’
4
Site DC22A: Henderson Brook
Aboiteau Complete Large N 44o 34’ 35.7’’ W 65o 50’ 56.88’’
4
Site DC23C: Bingays Brook
Culvert No restriction N/A N 44o 32’ 33.12’’ W 65o 52’ 5.52’’
N/A
Site DC24B: Kinney Brook
Bridge Partial Small N 44o 29’ 7.44’’ W 65o 57’ 0.42’’
3
Site DC25B: Kinney Brook
Bridge No restriction N/A N 44o 28’ 51.66’’ W 65o 57’ 5.04’’
N/A
Site DC26B: Weymouth Harbour
Bridge No restriction N/A N 44o 26’ 7.50’’ W 66o 00’ 6.66’’
N/A
Site DC27B: Sissiboo River
Bridge Partial Small N 44o 24’ 33.24’’ W 65o 59’ 46.26’’
3
Site DC28B: Sissiboo River
Bridge No restriction N/A N 44o 24’ 29.28’’ W 65o 57’ 24.42’’
N/A
Site DC29B: Issacs Lake Brook
Bridge No restriction N/A N 44o 23’ 16.02’’ W 66o 03’ 40.68’’
N/A
Site DC30C: Issacs Lake Brook
Culvert No restriction N/A N 44o 23’ 13.26’’ W 66o 03’ 40.62’’
N/A
Site DC31B: Grosses Coques River
Bridge Partial Small N 44o 22’ 47.52’’ W 66o 04’ 12.96’’
3
Site DC32C: Grosses Coques River
Culvert Partial Small N 44o 22’ 26.7’’ W 66o 04’ 27.72’’
1
Site DC33B: Grosses Coque River
Bridge No restriction N/A N 44o 22’ 23.34’’ W 66o 04’ 23.76’’
N/A
Site DC34A: Duffy Brook
Aboiteau Complete Large N 44o 15’ 6.18’’ W 66o 08’ 2.1’’
1
Site DC35B: Duffy Brook
Bridge No longer tidal
N/A N 44o 15’ 7.23’’ W 66o 07’ 50.46’’
N/A
Site DC36B: Duffy Brook
Bridge No longer tidal
N/A N 44o 15’ 4.62’’ W 66o 07’ 44.22’’
N/A
Site DC37B: Duffy Brook
Bridge No longer tidal
N/A N 44o 15’ 4.02’’ W 66o 07’ 43.98’'
N/A

Tidal Barriers Audit Summary Report: Lower Bay of Fundy 2004 23
Crossing Code Class Restriction Restorable Area
GPS Coordinates Priority Level
Site DC38B: Germains Brook
Bridge No restriction N/A N 44o 14’ 8.16’’ W 66o 08’ 1.2’’
N/A
Site DC39B: Metaghan River
Bridge No restriction N/A N 44o 13’ 37.8’’ W 66o 07’ 11.04’’
N/A
Site DC40B: Metaghan River
Bridge No restriction N/A N 44o 13’ 8.52’’ W 66o 08’ 30.6’’
N/A
Site DC41C: Mavillette Brook
Culvert Partial Small N 44o 06’ 31.14’’ W 66o 10’ 41.46’’
3
Site DC42B: Mavillette Brook
Bridge Partial Small N 44o 06’ 15.72’’ W 66o 10’ 58.38’’
3
Site DC43B: Mavillette River
Bridge Partial Medium N 44o 06’ 0.36’’ W 66o 11’ 5.46’’
1
Site DC44B: Cape St. Mary’s
Bridge Partial Small N 44o 05’ 47.16’’ W 66o 11’ 26.52’’
1
Site DC 45B: Cape St. Mary’s
Bridge Partial Large N 44o 05’ 27.12’’ W 66o 11’ 40.62’’
1
Site DC46B : Bowman Brook
Bridge No restriction N/A N 44o 03’ 43.38’’ W 66o 10’ 12.3’’
N/A
Site DC47B: Salmon River
Bridge No restriction N/A N 44o 03’ 12.96’’ W 66o 09’ 41.88’’
N/A
Site DC48B: Salmon River
Bridge No restriction N/A N 44o 03’ 18.06’’ W 66o 09’ 10.26’’
N/A
Priority Level: 1 - Low to medium impact barriers, requiring little cost that can produce obvious ecological benefits 2 - High impact barriers requiring high costs, but can produce large ecological benefits 3 - Low impact barriers with small ecological benefits 4 - Barriers not eligible for restoration due to protection of infrastructure or agricultural land

Tidal Barriers Audit Summary Report: Lower Bay of Fundy 2004 24
3.4 Study Area Maps Showing Locations of Tidal Crossings Assessed Figure 36. Locations of Tidal Crossing Assessed for the Annapolis County and part of Digby County
Tidal Barriers Audit Summary Report: Lower Bay of Fundy 2004 25
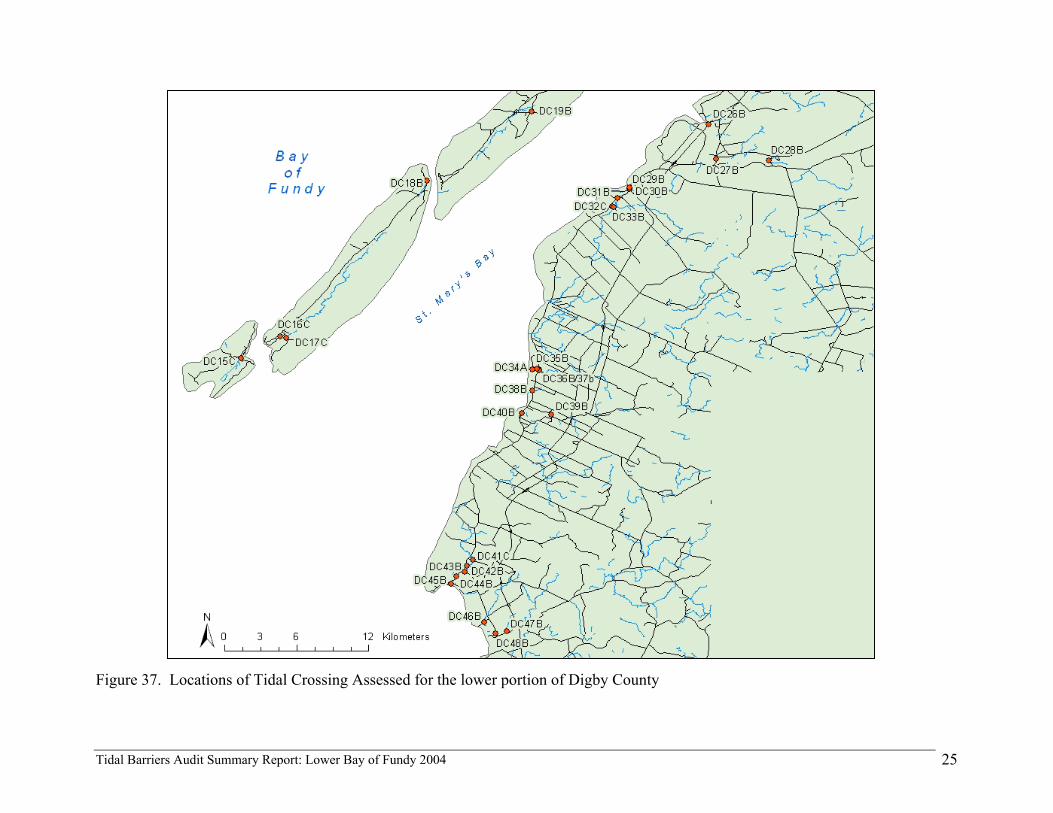
Figure 37. Locations of Tidal Crossing Assessed for the lower portion of Digby County

Tidal Barriers Audit Summary Report: Lower Bay of Fundy 2004 26
4.0 General Conclusion One of the goals of the EAC’s tidal barriers audit work is to increase awareness about the occurrence of tidal barriers throughout the Bay of Fundy and the ecological changes they are causing to our coastal wetlands. It is hoped that individuals, groups and government will be able to use this information to better understand and recognize the implications of coastal development activities and see tidal barriers as a serious problem facing NS’s coastal habitats and species. Having an inventory of the tidal crossings around the province will help allow government and communities alike to identify sites within their areas where restoration efforts could be undertaken. Annapolis County had a small number of tidal crossings assessed in this report because most of the large salt marshes along the Annapolis Basin have been historically dyked. The North Mountain range along the Fundy coast of Annapolis County lessened the potential for the development of large areas of salt marsh and for road crossings to influenced tidal flow and salt marsh habitat. Digby County has a large number of tidal crossings with a wide range of impacts. The majority of crossings were bridges, however, many of these were still causing some degree of restriction to local hydrology. Almost all of the culverts assessed restricted tidal flow and represented barriers to fish passage and could potentially to be replaced with minimal disruption to adjacent land use and activities. While many of the salt marsh systems in Digby are smaller than those found elsewhere in the Bay of Fundy this audit did identify a number of opportunities to restore tidal wetland habitat and fish passage. The Bay of Fundy has lost an estimated 80% of its original salt marsh area. Restoration through the removal of tidal barriers is an excellent opportunity to reclaim some of what has been lost. However, it is also important to protect the remaining 20% from being altered, degraded or lost in the first place. Existing salt marshes need to be identified and the public educated on their value. For more information regarding salt marshes, tidal barriers and restoration, please contact the EAC’s Coastal Issues Committee. Other EAC publications on these issues can be found in the following section. The Coastal Issues Committee is also concerned with raising awareness about a variety of other coastal issues facing Nova Scotia’s coastlines.

Tidal Barriers Audit Summary Report: Lower Bay of Fundy 2004 27
5.0 References and Resources Bay of Fundy Ecosystem Partnership (BOFEP) website. www.bofep.org Bowron, T.M. and A. Fitzpatrick. 2001. Assessment of Tidal Restrictions along Hants County’s Highway 215: Opportunities and Recommendations for Salt Marsh Restoration. Marine Issues Committee Special Publication Number #9, Ecology Action Centre, Halifax, NS.
Bowron, T.M., J Graham, and M Butler. 1999. Community and Social Considerations in Salt Marsh Restoration Work in Nova Scotia. Ecology Action Centre, Halifax, Nova Scotia. Cameron, C., T.M. Bowron, J. Hall, M. Butler and J. Graham. 2000. Getting Dirty: the Why and How of Salt Marsh Restoration. Proceedings of the Salt Marsh Restoration Workshop, Wolfville, NS, Nov 5-7, 2000. Marine Issues Committee Special Publication Number 8. Ecology Action Centre, Halifax, Nova Scotia. Dalton, S and L. Mouland. 2002. Marshes, Tides and Crossings: Colchester County Tidal Barriers Audit Report. Coastal Issues Committee Special Publication Number 1. Ecology Action Centre, Halifax, NS.
Ecology Action Centre website. www.ecologyaction.ca Harvey, J. 2004. Tidal Barriers in the Bay of Fundy, New Brunswick’s Coast. Return the Tides campaign publication. Conservation Council of New Brunswick, Fredericton, NB. Hynes, N., T.M. Bowron and D. Duffy. 2005. Tidal barriers and Opportunities for Salt Marsh and Tidal River Restoration in Cumberland County, Nova Scotia. Coastal Issues Special Publication Number 3. Ecology Action Centre, Halifax, NS. Hynes, N., T.M. Bowron and D. Duffy. 2005. Tidal barriers and Opportunities for Salt Marsh and Tidal River Restoration in the Southern Bight of the Minas Basin, Nova Scotia. Coastal Issues Special Publication Number 4. Ecology Action Centre, Halifax, NS.
Koller, Zsofi. 2001. Return the Tides: Tidal Barriers Audit in the Bay of Fundy. Conservation Council of New Brunswick, Fredericton, NB. Purinton, T.A. and D.C. Mountain, 1998. Tidal Crossing Handbook A Volunteer Guide to Assessing Tidal Restrictions. Parker River Clean Water Association, Byfield, Massachusetts. Teal, J. and M. Teal. 1969. Life and Death of a Salt Marsh. Little, Brown and Company Ltd. Boston, USA and Toronto, Canada. Wells, Peter G. 1999. Environmental Impact of Barriers on Rivers Entering the Bay of Fundy: Report of an ad hoc Environment Canada Working Group. Technical Report Series No. 334, Canadian Wildlife Service, Ottawa, ON

Tidal Barriers Audit Summary Report: Lower Bay of Fundy 2004 28
Appendix A – Project Background The Ecology Action Centre (EAC) is Nova Scotia’s oldest and most active environmental organization. For over three decades the EAC has been a strong advocate for environmental change. Our mission is to encourage a society in Nova Scotia which respects and protects nature and provides environmentally and economically sustainable jobs for its citizens. We have seven active issue committees: Coastal, Energy, Food Action, Marine, Urban, Transportation and Wilderness. The goal of the Coastal Issues Committee (CIC) is to promote coastal conservation and sustainable coastal communities in Nova Scotia. We do this by educating ourselves, the public and government about coastal issues facing Nova Scotia and encourage their involvement and support. We identify habitats at risk and support community efforts to protect them. We review coastal legislation and answer questions from the media and public. Areas we are currently concerned with include habitat loss, coastal access, sustainable coastal industries, coastal development, and coastal policy. The Salt Marsh and Tidal Rivers Restoration Project, of which the tidal barriers audit is a part, has focused on protecting, restoring and raising awareness about the beauty and significance of Nova Scotia's coastal wetlands. Cheverie Creek is our pilot salt marsh restoration site located in Cheverie, NS. This is a tidal river and salt marsh system crossed by a causeway/culvert that partially restricts tidal flow to the upstream habitat. Over the past several years the EAC has been promoting this site for restoration and has conducted field research at the site to collect baseline ecological data about the marsh and to explore the potential for restoration through culvert replacement. Collaboration with project partners, community groups and government agencies resulted in the planning and design of a new crossing aimed at maximizing tidal flow and the restoration of salt marsh habitat and fish passage. Education and community outreach programs are key aspects of the project.
Join the Ecology Action Centre! Yes! I wish to help the EAC build a healthier, more sustainable Nova Scotia
Name:_____________________________________________________ Phone:_____________________________
Address:_______________________________________________________________________________________
Email (for monthly e-newsletter):___________________________________________________________________
One Year: □ $15 Student/Senior/Unwaged □ $30 Regular □ $50 Contributing/Family □ $75 Supporting □ $120 Sustaining □ Other $______ □ Cash □ Cheque □ VISA □ Mastercard □ Monthly contribution □ Auto-renew annually (credit card only)
Name on Card:_________________________________________ Card #:__________________________________
Expiry:_____________________ Signature:_________________________________________________________
Date:________________________________
Ecology Action Centre, 1568 Argyle St. Halifax, NS, B3J 2B3. Tel. (902) 429-2202 Fax: 422-6410 www.ecologyaction.ca [email protected]. All memberships and donations are tax deductible.

Tidal Barriers Audit Summary Report: Lower Bay of Fundy 2004 29
Appendix B – Tidal Barriers Audit Data Sheet: Phase I Visual Assessment

Tidal Barriers Audit Summary Report: Lower Bay of Fundy 2004 30

Tidal Barriers Audit Summary Report: Lower Bay of Fundy 2004 31
Appendix C – Tidal Barriers Audit Data Sheet: Phase 2 Tidal Measurements


![Sea level rise and tidal power plants in the Gulf of Mainee.bangor.ac.uk/817/3/29668_pdf.pdf · 1] The response of the Bay of Fundy and Gulf of Maine to large-scale tidal power plants](https://img.dokumen.tips/doc/110x75/5eca8ddd33be3d38d950473e/sea-level-rise-and-tidal-power-plants-in-the-gulf-of-1-the-response-of-the-bay.jpg)