Embed Size (px)
Citation preview

Paper No. 05-0971
Low Temperature Property Evaluation and Fragility of Asphalt Binders Using Non-Arrhenius Viscosity Temperature Dependency
Huachun Zhai
Delmar Salomon*
Idaho Asphalt Supply, Inc., 2627 Brandt Ave., Nampa, ID 83687, Tel: 208-442-7742, Fax: 208-463-0679 Email: [email protected] and [email protected]
* Corresponding author
A paper submitted for Presentation and Publication to TRB committee AFK10-General Issues in Asphalt Technology for 84th TRB Annual Meeting
Total Words:
3933 + 5 FIGURES (250*5 = 1250) + 7 TABLES (250*7 = 1750) = 6933

1
Abstract: The rotational viscosities of different asphalt binders were determined at temperatures between 80°C to 185°C. Viscosity-temperature dependence of asphalt binders was described using the Vogel-Tammann-Fulcher (VTF) and the William-Landel-Ferry equations. The Vogel temperature (Tv) and the glass transition temperature (Tg) of different asphalt binders were determined by fitting experimental values of viscosity at different temperatures using the two equations. For asphalt binders, the difference between Tv and Tg is around 40K. Effects of asphaltenes, aging, modification and polymer content on these temperatures were evaluated. As the asphaltene content increases, both temperature increases. Different polymers have shown different effects on these temperatures. The values of the Vogel and glass transition temperature were correlated with the Critical Cracking temperature (Tcr) determined using bending beam rheometer and direct tension tests. The results suggest that the correlations between Tv, Tg and Tcr may be used to determine Tcr using the rotational viscosity results tested at high temperature.

2
INTRODUCTION
As temperature decreases, the asphalt binder changes from a rubbery state to a glassy solid, which is called the glass transition [1]. The glass transition may result in two to three orders of magnitude change in stiffness of asphalt binder. This increase in stiffness may result in a more brittle and fragile material, which has a tendency to fracture. Researches have indicated that the glass transition temperature (Tg), the temperature at which the glass transition occurs, is an important parameter to determine an asphalt binders’ resistance to low temperature cracking [2-8]. However, the glass transition is not a sharp change. It has been shown that, for asphalt binders, the transition occurs progressively over a temperature range, which may be tens of degrees wide [2, 4]. This makes the accurate determination of the glass transition temperature of asphalt binders extremely difficult. Current test methods involve direct measurement [2, 5, 6, 8] and the fitting of test data into empirical equations [4, 7]. The direct measurement involves unique equipments that are not available to most asphalt laboratories. The empirical fitting is a more common approach. The temperature dependencies of viscoelastic properties such as viscosity, complex modulus and stiffness have been used to determine the low temperature properties of asphalt binders. Two commonly used theories in describing viscosity-temperature dependency are the absolute rate theory and the free-volume theory [4]. In previous researches, the change of viscosity of asphalt binders at different temperatures was analyzed using the absolute rate theory [9, 10]. The absolute rate theory, applicable widely to flow processes, describes the viscosity-temperature dependence in the Arrhenius form [3, 11]. The other approach is the free-volume theory [12]. This theory has been used to determine changes in the viscoelastic properties of asphalt binders at low temperatures [2-4]. In these researches, the most widely used empirical equation is the Williams-Landel-Ferry (WLF) equation [13]. Another widely used equation for modeling viscosity-temperature dependency is the Vogel-Tammann-Fulcher’s (VTF) equation [14-16]. It was originally developed to analyze the viscosity-temperature relationship for glasses and supercooled organic liquids, and recently, it has been applied to polymers, protein solutions and foods [17-19]. From this equation, the Vogel Temperature (Tv) can be determined. The reduction of free volume for the diffusion was used to interpret the Vogel Temperature [1, 19, 20]. In recent years, Angell’s strong and fragile liquid fragility concept has become a powerful tool in the research of glass transition materials of different materials [20]. The parameters in the VTF equation have been used as a quantitative indicator of liquid fragility for different glass forming liquid. For asphalt binders, the low temperature rheological properties are related to its resistance to low temperature cracking. In current specification, the temperature correlated to low temperature cracking is determined as Critical Cracking Temperature, Tcr using the combination of the results from the Bending Beam Rheometer (BBR) and the Direct Tension Test (DTT)[21]. Tcr is the temperature at which the asphalt will fracture due to the induced thermal stress. This procedure involves multiple equipments and complex calculations, consuming considerable manpower and time. Since Tg and Tv are determined using the WLF and VTF equations and are related to the low temperature properties of asphalt binders, they may be used to predict the Tcr based on experimental fitting. It is proposed that this approach can used to rank different asphalt binders in a quicker way.
In this paper, the viscosity data obtained at different temperatures were fitted using both WLF and VTF equations. The Glass Transition Temperature (Tg) and the Vogel Temperature (Tv) were determined by the indicated equations. Liquid fragility parameters were calculated based on these data. Attempts were made to correlate the above parameters with the current low temperature cracking parameter (Tcr), based on the Bending Beam Rheometer (BBR) and the Direct Tension Test (DTT) [21].
BACKGROUND
Willams-Landel-Ferry (WLF) equation
Equation 1 is the common form of the WLF equation [13]:
)()(
)()(log
2
1
g
g
g TTCTTC
TT
−+
−−=
ηη
(1)
where η(T) is the viscosity at temperature T, η(Tg) is the viscosity at Tg, C1 and C2 are positive constants.

3
The fractional free volume, f is the part of the total volume that is available for the molecule to move into [22].
)11(303.2)(
)(loggg ff
BTT
−=ηη
(2)
It is assumed that the fractional free volume has a linear relationship with temperature [1]:
)( gfg TTff −+= α (3)
where fg is the fractional free volume at Tg, B is a constant and αf is the coefficient of linear expansion of the free volume or the thermal expansion coefficient. Comparing equations (1), (2) and (3),
gfBC
303.21 = (4)
f
gfC
α=2 (5)
Assume B=1,
1303.21
Cf g = (6)
21303.21
CCf =α (7)
Several definitions for the glass transition temperature have been proposed [23]. One common definition for Tg is the temperature at which the viscosity reaches 1012 Pa.s [18]. Asphalt binders exhibit broad range of glass transitions [2-6]. It depends on the cooling or heating rate, and in many cases it is difficult to detect the “true” glass transition temperature. To compare Tg differences in asphalt binders, a common definition is needed. Because the viscosity is the key property measured in this study, this 1012 Pa.s definition at the glass transition temperature is selected to simplify data fitting and the determination of Tg. By fitting the viscosity data versus the reciprocal of the temperature (1/T), Tg, C1 and C2 factors can be obtained using the Solver function in the Microsoft Excel program. Using equation 6 and 7, fg and αf for different asphalt binders can be calculated.
Vogel-Tammann-Fulcher (VTF) equation
Equation 8 is the Vogel-Tammann-Fulcher equation [15-17]:
)exp()exp( 00v
v
v TTDT
TTE
−=
−= ηηη (8)
where η0, D are constants, and Tv is the Vogel Temperature. As T→∞, the viscosity equals to η0. The physical meaning of η0 is the viscosity value at an infinitely high temperature, assuming the material still can be liquid at this stage [17]. The D parameter has been related to the fragility of glass-forming liquids [23-25]. Using the D parameter, strong and fragile liquids can be distinguished. The Vogel Temperature (Tv) can be seen as the temperature at which the viscosity is infinite and flow can no longer occur [25]. In the free-volume approach, the Vogel Temperature is where the free volume equals zero [17]. When Tv→0, the VTF equation becomes the Arrhenius equation. When the test temperature T>>Tv, the VTF equation can also be transferred into the Arrhenius equation.
4
If the assumption of a linear relationship between the fractional free volume and temperature holds, the VTF equation can be transformed into the WLF equation [26, 27, 28]. The relationship between VTF and WLF parameters is as follows:
)(303.21vg
v
TTDTC
−= (9)
vg TTC −=2 (10) Compared to the WLF equation, the VTF law does not rely heavily on the free volume assumption. It has been successfully used in the concept of configuration entropy based on Gibbs-DiMarzio’s cooperative motions [29, 30]. The Vogel temperature Tv approximately equals the Kauzmann Temperature Tk, which is the “ideal” glass transition temperature, where the liquid entropy equals the entropy of the crystal [23]. This implies the Vogel Temperature has a more profound physical meaning that relates both thermodynamic and kinetic concepts. Determination of the Vogel temperature for asphalt binders gives more insights into the relationship between its material structure and physical property. In a very preliminary way, an attempt has been made to correlate asphaltene content with the Vogel temperature for asphalt binders [31]. In this study, the viscosity data was correlated with the inverse of the temperature to determine Tv and the E factor in equation 8. The D factor was calculated by dividing E with Tv.
Liquid Fragility
The concept of liquid fragility has been widely used to study the glass transition of glass-forming liquid, polymers and other aqueous materials [32]. The fragility is the measurement of the deviation of viscosity or relaxation time to the Arrhenius form [18, 23]. Glass formers can be divided into two groups along the liquid fragility index: Strong liquids, showing Arrhenius behavior and fragile liquids with significant non-linear non-Arrhenius behavior [18]. The larger the deviation, the more fragile the material becomes. The typical strong liquids are inorganic network liquids such as SiO2 and GeO2 , while polymeric materials are usually fragile [32]. Fragile liquids are liquids with non-directional electrostatic or van der Waals interaction [20]. Strong liquid tends to be less sensitive to the environmental changes. During the glass transition, the physical properties of the strong liquid are more stable. On the contrary, for fragile liquids, their properties will change dramatically from the liquid state to the glass state. Liquid fragility is strongly related to heat capacity changes and the glass transition range depends strongly on the liquid fragility [23]. The fragility has been correlated with the chemical structure of polymer and other structure related properties [26]. Asphalt, as a glass-forming material, has not been analyzed using the liquid fragility concept. Using the liquid fragility concept to analyze asphalt and classify it based on strong and fragile categories may give researchers a new tool to understand the structure of asphalt and its effects on physical properties. The fragility of different material is commonly represented using the Angell plot [32]. In this plot, the logarithm of the viscosity is plotted against Tg/T (Figure 1). Tg is defined as the temperature where the viscosity reaches 1012 Pa.s or the structural relaxation time equals to 100 s. As a result, all curves meet at the same point at Tg/T = 1. Based on equation 1, at T>>Tg, C2+(T-Tg) ≈ T-Tg. As a result, the WLF equation can be transfer into the following format:
110)(
)( CgT
T −≈η
η (11)
Based on Tg’s definition, when T>>Tg, 11210)( CT −≈η (12)
Several different methods have been proposed to measure the fragility of different materials [24, 26]. Based on the Angell plot, the slope of the curve at the T=Tg can be used as the index of fragility. This is called the steepness index or dynamic fragility, m. It can be calculated [26]:
2)()/(log
vg
gv
TTgT TT
TDTTTd
dmg
−==
=
η (13)
where D is the parameter determined by the VTF equation; Tg is the glass transition temperature and Tv is the Vogel temperature. The m value ranges from 20 to more than 200. A lower m indicates a strong liquid, while fragile liquids have higher m values. Another simple measure of fragility is the use of the D parameter directly [24]. For fragile
5
liquids, D usually is less than 10. In this study, both m and D values were calculated based on the parameters determined from the VTF and WLF equations.
EXPERIMENTAL DESIGN
Materials
Both neat and modified asphalt binders were tested in this study. To determine the effect of crude sources on the low temperature properties, five different PG64-22 were selected: PG64-22 (A to E). To understand the effect of asphaltene content on the Vogel temperature, fifteen different asphalt binders, including different pen grades (0-pen, and 85/100) and different PG grades, were selected. Six different SBS polymers, SBS Radial 1 to 4(SBS-1 (20% Styrene), and SBS-2, 3, 4 (~30% Styrene)), SBS linear (SBS-L), and one EMA polymer were included in this study. Two air blown asphalt binders (PG70-28 (AB), PG70-22 (AB)) and two chemically (acid) modified asphalt binders (PG70-28 (Chemical 1 and 2)) were also studied.
Viscosity measurement
The rotational viscosity of asphalt binders was measured using a SC-27 spindle on a Brookfield DV-III+ programmable viscometer. The temperatures are 80°C, 95°C, 110°C, 125°C, 140°C, 155°C, 170°C and 185°C for all materials except for the 0-pen and high polymer content (>6%) binders where measurements were started at 110°C and ended at 215°C with 15°C interval. To minimize the effect of shear rate dependency and time dependence of viscosity, at each temperature, the viscosity at the plateau measured at the highest shear rate was used for data analysis [10]. Further research needs to be carried out to determine the effects of shear rate dependency on determination of Tg and Tv.
Determination of Tcr
The critical cracking temperatures (Tcr) for different asphalt binders were determined by fitting BBR and DTT results using Abatech’s TSTAR software following ASSHTO Standard [21]. Unaged neat asphalt binders were used since the viscosity data was obtained using neat binders.
RESULTS AND DICUSSION
Viscosity-temperature dependency
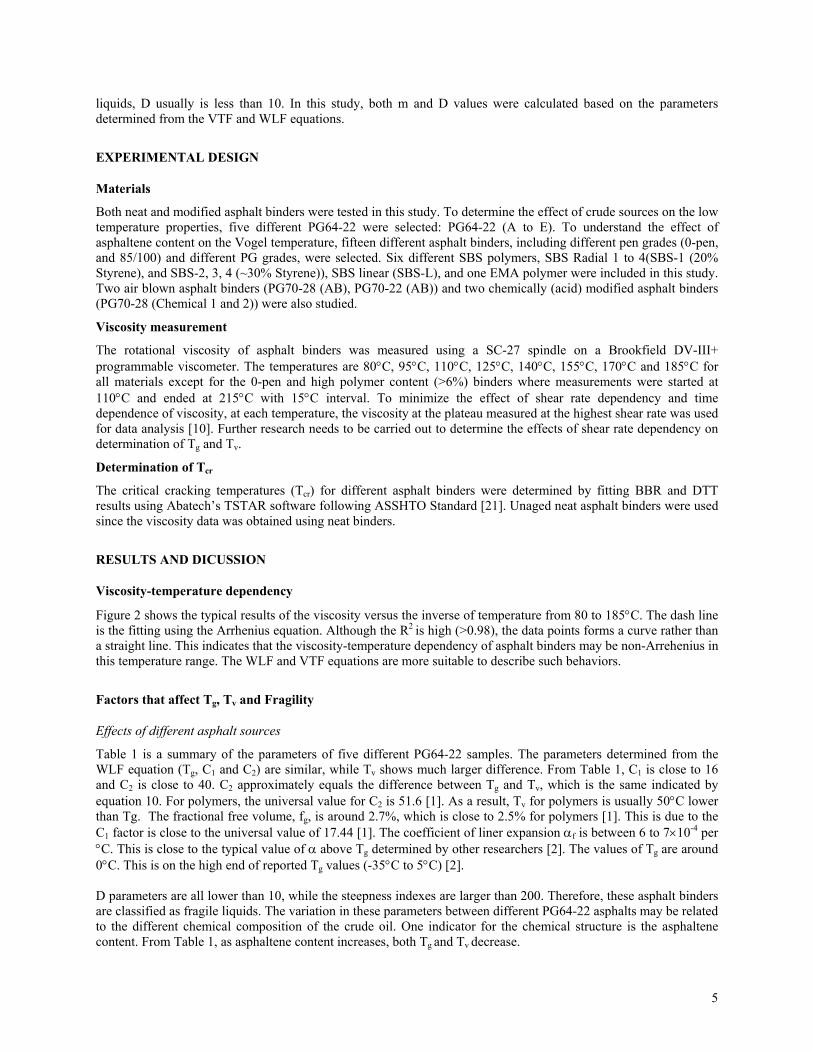
Figure 2 shows the typical results of the viscosity versus the inverse of temperature from 80 to 185°C. The dash line is the fitting using the Arrhenius equation. Although the R2
is high (>0.98), the data points forms a curve rather than a straight line. This indicates that the viscosity-temperature dependency of asphalt binders may be non-Arrehenius in this temperature range. The WLF and VTF equations are more suitable to describe such behaviors.
Factors that affect Tg, Tv and Fragility
Effects of different asphalt sources
Table 1 is a summary of the parameters of five different PG64-22 samples. The parameters determined from the WLF equation (Tg, C1 and C2) are similar, while Tv shows much larger difference. From Table 1, C1 is close to 16 and C2 is close to 40. C2 approximately equals the difference between Tg and Tv, which is the same indicated by equation 10. For polymers, the universal value for C2 is 51.6 [1]. As a result, Tv for polymers is usually 50°C lower than Tg. The fractional free volume, fg, is around 2.7%, which is close to 2.5% for polymers [1]. This is due to the C1 factor is close to the universal value of 17.44 [1]. The coefficient of liner expansion αf is between 6 to 7×10⁻⁴ per °C. This is close to the typical value of α above Tg determined by other researchers [2]. The values of Tg are around 0°C. This is on the high end of reported Tg values (-35°C to 5°C) [2]. D parameters are all lower than 10, while the steepness indexes are larger than 200. Therefore, these asphalt binders are classified as fragile liquids. The variation in these parameters between different PG64-22 asphalts may be related to the different chemical composition of the crude oil. One indicator for the chemical structure is the asphaltene content. From Table 1, as asphaltene content increases, both Tg and Tv decrease.

6
Effects of asphaltene content on Tg and Tv
Figure 3 indicates the effects of asphaltene content on Tg and Tv for 15 different asphalt binders. Although there are trends that higher asphaltene content tends to result in a higher Tg, and Tv, the correlations are not significant. The results from the five PG64-22s in the previous section show an inverse trend. The poor correlations between asphaltene content and Tg and Tv suggest that other components in the asphalt binders also contribute to Tg and Tv. Masson and his colleagues [8] have indicated that saturates, aromatics and resins behave differently during the glass transition process. The final Tg and Tv values are dependent on the combination of all components in asphalt not asphaltene alone.
Effects of ageing
Table 2 shows the effects of ageing on Tg, Tv and fragility of different asphalt binders. For different asphalt binders, the effects of ageing on other parameters are different. The ageing process increases both Tg and Tv. It indicates that the increase of the polar fraction of asphalt binders as a result of oxidation tends to lower the free volume at higher temperature and results into higher Tg and Tv. The effects of ageing on fg is minimal. The C1 factor is still close to 16. Other than the 0-pen material, air-ageing increases C2 factor and decreases αf. The difference between Tg and Tv increases as the result of ageing. This means that ageing decreases the expansion rate of the free volume when the temperature is lower than Tg. As a result, it takes a larger temperature change for the free volume to decrease to 0. The fragility of asphalt binders changes differently after ageing and D and m indicate a different trend for the same asphalt binder. Before and after ageing, all asphalt binders are fragile liquids. The difference for the ageing effects on fragility may be caused by the difference in the chemical structure of the asphalt. For some asphalts, the oxidation may result in a structural change that has a less organized interaction and result into a lower fragility number, while for other binders the increase in polar molecules increases order in the structure and stronger liquids are formed.
Effects of modification
The effects for different modifications on Tg, Tv and fragility are shown in Table 3. The use of modification increases both Tg and Tv. All modified asphalt binders are still fragile liquids (low D value and high m value). There are no significant changes in fg. The modification using EMA increases the coefficient of expansion and has the largest increase on Tg and Tv. Air blowing increases the C1 factor, while the addition of different polymers results in a different change for C1. Different modifications cause different structural change in asphalt binders. The free volume values will change accordingly. Based on the data in Table 3, the occupied volume may increase after the modification and the collapse of free volume may accelerate after the modification. Both of these may cause the Tg and Tv to increase.
Effects of polymer content
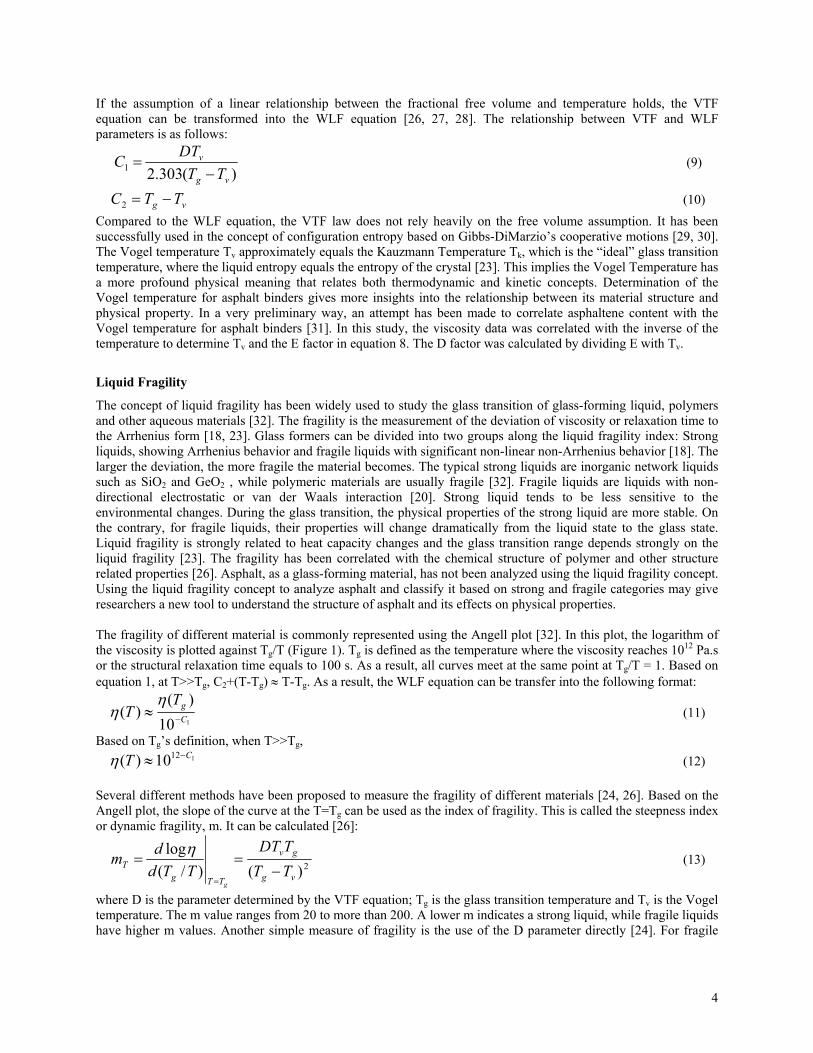
Table 4 shows the effect of polymer content on different parameters. SBS-2 was added in a 85/100 pen grade asphalt to study this effect. The relationships between Tg, Tv and the polymer content are indicated in figure 4. As the polymer content increases, Tg and Tv increase. C1 and C2 decrease, while fg and αf increases. The whole system becomes more fragile as the amount of polymer increases. From the data in Table 4, there is a sharp change in parameters after 6% polymer concentration. Figure 4 demonstrates the abrupt jump. After the 6% concentration, both Tg and Tv shift upward and the jump in αf is more than 50%, while C2 decrease by 10. The fragility factors also change by close to 100%. This indicated 6% is a critical concentration as indicated in a previous paper [33]. Researches have indicated that, at more than 5 % of modification, a critical network is formed contributing to a large change in the rheological properties of the modified binder [33, 34]. The formation of the critical network may be a phase change: from an asphalt dominated network to a polymer dominated one. After this change, the property of the polymer cannot be ignored. The interaction between polymer molecule and the asphalt components changes the distribution and the change rate of the free volume. The parameters are changed as a result.

7
Tg and Tv
Table 5 summarizes the data for Tg and Tv in this study. As indicated in the table, the difference between Tg and Tv for asphalt binders is close to 40, which is also the C2 factor from WLF equation. As an empirical rule, the following equation is proposed for estimating Tg from the Tv temperature:
40+= vg TT (14)
Tg from this study ranges from -6°C to close to 30°C. This is a higher range than the Tg determined using direct measurements. This may be related to the broad the glass transition range for asphalt binders. The data used in this study is obtained from high temperature side. The high coefficient of linear expansion number (> 6×10⁻⁴ per °C) indicated that the WLF equation captures changes of the properties when the asphalt binder is starting the transition from the liquid into the glassy state. As a result, the Tg in this study reflects the high end of the glass transition range. Due to the composite nature of asphalt binders, this temperature may be the average effect of different components in the asphalt binders.
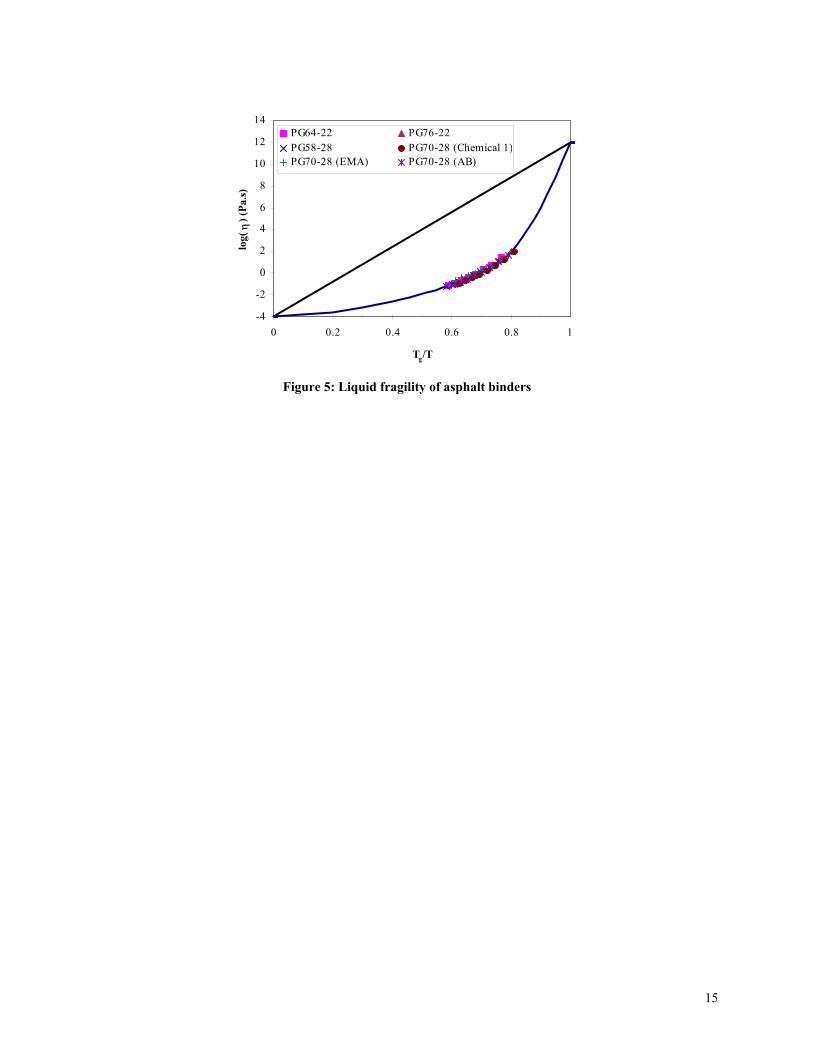
Liquid fragility of asphalt binders
Although there are differences in the m fragility indexes for the different asphalt binders studied, the data indicates, that the asphalt binders, neat or modified, are all fragile liquids. Figure 5 is the Angell plot for some of the asphalt binders in this study. Based on the average C1 factor of 16 and equation 11, as T>>Tg and Tg/T→0, the viscosity of the asphalt binders is approximate 10-4 Pa.s. In the figure, the straight line represents ideal Arrhenius relation. The behaviors of asphalt binders show clear deviations from the Arrhenius law. As a fragile liquid, asphalt binders are dynamically heterogeneous and have changing activation energy through the application temperature range [18]. Liquid fragility is a powerful tool to understand the relationship between kinetics and thermodynamics and the energy distribution in asphalt binders. Further understandings in fragility and factors that influence it can be used to understand the failure or stress mechanism in the low temperature range.
Tg, Tv, and Tcr
To investigate the relationship between Tg, Tv and Tcr and develop an experimental equation to predict Tcr using easier rotational viscosity testing instead of BBR and Direct Tension tests, the critical cracking temperature of several asphalt binders were tested. Table 6 indicates the relationship between Tg, Tv and Tcr for these binders. The values of Tcr are between those of Tg and Tv. Based on the data in Table 6, an empirical equation is developed to estimate Tcr based on Tg and Tv:
gvcr TTT 735.077.0 −= (15)
Combine equation 14 with 15: 6.2903.0 −= vcr TT (16)
Table 7 shows the difference between measured Tcr and calculated Tcr based on equation 15 and 16. For the predicted Tcr using equation 15, other than PG64-22 (E), the difference between the tested Tcr and the fitted Tcr is within 2°C with an average difference of only 0.02°C. For the predicted Tcr using equation 16, the average difference is 1.08C. Based on the limited data, it shows that, instead of using the BBR and DT tests, equations 15 and 16 can be used to determine Tcr from the rotational viscosity at high temperature as a quick experimental estimation. These equations may need further modification as more asphalt binders are tested and different modifications are included. Further research is warranted.
SUMMARY OF FINDINGS
1. The viscosity temperature dependency of asphalt binders does not follow a straight Arrhenius law. The non-Arrhenius behavior should be described using WLF and VTF equations.
2. The glass transition temperature Tg determined from the WLF equation and the Vogel temperature Tv from the VTF equation are influenced by crude sources, asphaltene content, ageing and different modification methods. The fragility of the asphalt binders is also changed by these factors.
3. There is a critical polymer concentration around 6%, at which the relationship between Tg, Tv and fragility parameters changes sharply. This concentration may indicate a phase change from an asphalt-dominated phase to a polymer-dominated phase.
4. The difference between Tg and Tv is close to the C2 factor from WLF equation. For asphalt binders, the difference is close to 40°C.

8
5. Asphalt binders, neat or modified, are classified as fragile liquids and highly influenced by the changes of temperature.
6. The critical cracking temperature Tcr could be reasonably estimated using an empirical equation from Tg and Tv. ( gvcr TTT 735.077.0 −= )
REFERENCE
[1] Ferry, J.D., Viscoelastic Properties of Polymers, 3rd ed., Wiley, New York, NY, 1980. [2] Bahia, H.U. and Anderson, D.A., Glass Transition Behavior and Physical Hardening of Asphalt Binders, Journal of Association of Asphalt Paving Technologists, Vol. 62, 1993, pp. 93-129. [3] Christensen, D.W., Bahia, H.D. and Anderson, D. A., Effects of Free Volume and Intermolecular Friction on the Viscosity of Asphalt Binders, Journal of Association of Asphalt Paving Technologists, Vol. 65, 1996, pp. 385-399. [4] Marateanu, M. and Anderson, D., Time-Temperature Dependency of Asphalt Binders – An Improved Model, Journal of Association of Asphalt Paving Technologists, Vol. 65, 1996, pp. 408-435. [5] Lesueur, D., Gerard, J.F., Claudy, P., Letoffe, J.M., Martin, D. and Planche, J.P., Polymer Modified Asphalts as Viscoelastic Emulsions, Journal of Rheology, Vol. 42, Issue 5, September/October, 1998, pp. 1059-1074. [6] Anderson, D.A., and Marasteanu, M.O., Physical Ageing of Asphalt Binders Relative to Their Glass Transition Temperatures, Transportation Research Record, Vol. 1661, 1999, pp. 27-34. [7] Reinke, G. H., and Engber, S.L., Impact of Factors Affecting Determination of Glass Transition Temperature using a Dynamic Shear Rheometer, Journal of Association of Asphalt Paving Technologists, Vol. 70, 2001, pp. 471-491. [8] Masson, J.F., Polomark, G.M. and Collins, P., Time-Dependent Microstructure of Bitumen and Its Fractions by Modulated Differential Scanning Calorimetry, Energy& Fuels, Vol. 16, 2002, pp. 470-476. [9] Herrin, M. and Jones, G.E., The Behavior of Bituminous Materials from the Viewpoint of the Absolute Rate Theory, Journal of Association of Asphalt Paving Technologists, Vol. 32, 1963, pp. 82-105. [10] Salomon, D. and Zhai, H., Ranking Asphalt Binders by Activation Energy for Flow, Journal of Applied Asphalt Binder Technology, Vol. 2, Issue 2, October 2002. [11] Glasstone, S., Laidler, K. and Eyring, H., The theory of Rate Processes, McGraw-Hill, New York, NY, 1941. [12] Doolittle, A.K., Studies in Newtonian Flow. I. The Dependence of Viscosity of Liquids on Temperature, Journal of Applied Physics, Vol. 22, No. 12, 1951a, pp. 1031. [13] Williams, M.L., Landel, R.F., and Ferry, J.D., Temperature Dependence of Relaxation Mechanisms in Amorphous Polymers and other Glass Forming Liquids”, Journal of the American Chemistry Society, Vol. 77, 1955, pp. 3701-3706. [14] Vogel, H., Das Temperatur-abhängigkeitsgesetz der viskosität von flüssigkeiten (Temperature Dependence of Viscosity of Melts), Physik Zeitschrift, Vol. 22, 1921, pp. 645-646. [15] Tammann, G. and Hesse, W., Die abhängigkeit der viskosität von der temperatur bei underkühlten flüssigkeiten (Temperature Dependence of Viscosity of Melted Supercooled Liquids), Zeitschrift für anorganische und allgemeine Chemie, (Journal of Inorganic and General Chemistry), Vol. 156, 1926, pp. 245-247. [16] Fulcher, G.S., Analysis of Recent Measurements of the Viscosity of Glasses, Journal of the American Ceramic Society, Vol. 8, 1925, pp. 339-55. [17] Monkos, K., A Method of Calculations of the Parameters in the Vogel-Tammann-Fulcher’s Equation: An Application to the Porcine Serum Albumin Aqueous Solutions, Current Topics in Biophysics, Vol. 27, Issue 1, 2003, pp 17-21. [18] Debenedetti, P.G., and Stillinger, F.H., Supercooled Liquids and the Glass Transition, Nature, Vol.410, March 8, 2001, pp. 259-267. [19] Comez, L., Fioretto, D., Palmieri, L., Verdini, L., Gapinski, J., Oakula, T., Patoeski, A., Steffen, W., and Fischer, E.W., Light-scattering Study of a Supercooled Expoxy Resin, Physical Review E, Vol. 60, No. 3, September 1999, pp. 3086-3096. [20] Shelby, J.E., Introduction to Glass Science and Technology, Royal Society of Chemistry (RSC), 1997. [21] Standard Practice for Determine Low-Temperature Performance Grade (PG) of Asphalt Binder, AASHTO Provisional Standard PP42-01, 2002 Edition. [22] Doolittle, A.K., and Doolittle, D.B., Studies in Newtonian Flow, V. Further Verification of the Free Space Viscosity Equation, Journal of Applied Physics, Vol. 28, No. 8, 1957, pp.901 [23] Baysal, C. and Atilgan, A.R., Relaxation Kinetics and the Glassiness of Proteins: The Case of Bovine Pancreatic Trypsin Inhibitor, Biophysical Journal, Vol. 83, No.2, 2002, pp.699-705.

9
[24] Paluch M., Rzoska, S.J., Habdas, P., and Ziolo, J., On the Isothermal Pressure Behavior of the Relaxation Times for Supercooled Glass-forming Liquids, Journal of Physics: Condensed Matter, Vol. 10, No. 19, 1998, pp.4131-4138. [25] Angell, C.A., Liquid Fragility and the Glass Transition in Water and Aqueous Solutions, Chemical Reviews, Vol. 102, No. 8, 2002, pp.2627-2650. [26] Huang, D. and McKenna, G. B., New Insights into the Fragility Dilemma in Liquids, Journal of Chemical Physics, Vol. 114, No. 13, 2001, pp.5621-5629. [27] O’Connell, P.A., and McKenna, G.B., Arrhenius-type Temperature Dependence of the Segmental Relaxation below Tg, Journal of Chemical Physics, Vol. 110, No. 22, 1999, pp.11054-11060. [28] Mertens, I.J.A., Wübbenhort, M., Oosterbaan, W.D., Jenneskens, L.W. and van Turnhout J., Novel Polymer Electrolyte Based on Amorphous Poly(ether-ester)s Containing 1,4,7-Trioxanonyl Main Chain Units. Ionic Conductivity versus Polymer Chain Mobility, Macromolecules, Vol32, No. 10, pp.3314-3324. [29] Stillinger, F.H., Debenedetti, P.G., and Truskett, T.M., The Kauzmann Paradox Revisited, Journal of Physical Chemistry, Vol.105, No.47, 2001, pp.11809-11816. [30] Calalina, R., Capaccioli, S. Lucchesi, M., and Rolla, P.A., Effect of Pressure on Dynamics of Glass Formers, Physical Review E, Vol. 64 No. 3, November 4, 2001, Paper No.041504. [31] Salomon, D., and Zhai, H., Determinación de la Energía de Activación de Flujo en Ligantes Asfálticos (Determination of the Activation Energy for Flow of Asphalt Binders), Proceedings of 12th Ibero-Latin American Asphalt Congress, Nov 10-13, 2003, Quito, Ecuador. [32] Angell, C.A., Formation of Glasses from Liquids and Biopolymers, Science, Vol. 267, 1995, pp. 1924-1935. [33] Salomon, D., and Zhai, H., Asphalt Binder Flow Activation Energy and Its Significant for Compaction Effort, Proceedings of 3rd Eurasphalt & Eurobitume Congress, May 12-14, 2004, Book II, Paper 116, pp. 1754-1762. [34] Chen, J.S., Liao, M.C., Shiah, M.S., Asphalt Modified by Styrene-Butadiene-Styrene Triblock Copolymer: Morphology and Model, Journal of Materials in Civil Engineering, Vol. 14, No. 3, May/June 2002, pp. 224-229.
10
LIST OF FIGURE
Figure 1: Schematic Angell Plot Figure 2: Sample of viscosity-temperature dependency of asphalt Figure 3: Tv, Tg versus asphaltene content Figure 4: Tg, Tv versus polymer content Figure 5: Liquid fragility of asphalt binders
LIST OF TABLE
Table 1: WLF and VTF Parameters for Different PG64-22 Samples Table 2: Effects of Ageing Table 3: Effects of Different Modifications Table 4: Effects of Polymer Content Table 5: Difference between Tg and Tv Table 6: Relationships between Tg, Tv and Tcr Table 7: Measured Tcr versus Predicted Tcr

11
-2
0
2
4
6
8
10
12
14
0.4 0.5 0.6 0.7 0.8 0.9 1
Tg/T
Log
( η) (
Pa.s) Strong
Fragile
Figure 1: Schematic Angell Plot

12
R2 = 0.9844
0.001
0.01
0.1
1
10
100
1000
10000
100000
2.1 2.3 2.5 2.7 2.9
1/T (103/K)
η (P
a.s)
Figure 2: Sample of viscosity-temperature dependency of asphalt

13
y = 1.3774x - 57.101R2 = 0.4006
y = 1.1717x - 14.503R2 = 0.3375
-60
-50
-40
-30
-20
-10
0
10
20
30
40
0 5 10 15 20 25 30
Asphaltene Content (%)
T g, T
v (C
)
Tg
Tv
Figure 3: Tv, Tg versus asphaltene content

14
-60
-40
-20
0
20
40
60
80
0 2 4 6 8 10 12 14 16
Polymer Content (%)
T g a
nd T
v (C
)
Tg Tv
Figure 4: Tg, Tv versus polymer content
15
-4
-2
0
2
4
6
8
10
12
14
0 0.2 0.4 0.6 0.8 1
Tg/T
log(
η) (
Pa.s)
PG64-22 PG76-22PG58-28 PG70-28 (Chemical 1)PG70-28 (EMA) PG70-28 (AB)
Figure 5: Liquid fragility of asphalt binders

16
Table 1: WLF and VTF Parameters for Different PG64-22 Samples Asphalt Tg (°C) C1 C2 Tv (°C) Tg-Tv (°C) D m fg αf Asphaltene (%)
PG64-22 (A) 2.82 15.91 38.26 -35.52 38.34 5.9 263.2 0.0273 0.000713 14.2 PG64-22 (B) 1.88 15.98 38.5 -36.58 38.46 5.99 263.5 0.0271 0.000706 15.1 PG64-22 (C) 0.38 16.06 40.18 -39.56 39.94 6.34 253.9 0.0270 0.000673 15.8 PG64-22 (D) -1.11 16.2 42.22 -43.44 42.34 6.88 239.8 0.0268 0.000635 16.0 PG64-22 (E) -2.56 16.24 43.33 -46.01 43.45 7.15 232.8 0.0267 0.000617 16.5
Average 0.18 16.08 40.57 -40.22 40.40 6.45 252.0 0.0270 0.000667 15.5

17
Table 2: Effects of Ageing Asphalt Tg (°C) C1 C2 Tv (°C) Tg-Tv (°C) D m fg αf 0-pen 28.51 16.18 48.17 -19.74 48.25 7.09 232.8 0.0268 0.000557
0-pen (RTFO) 35.79 15.99 44.76 -9.1 44.89 6.25 253.0 0.0272 0.000607 0-pen (PAV) 41.42 15.83 43.67 -2.3 43.72 5.88 262.1 0.0274 0.000628
PG58-28 -2.75 16.1 39.41 -42.24 39.49 6.81 272.7 0.027 0.000684 PG58-28 (RTFO) 3.91 16.46 45.85 -42.03 45.94 7.53 228.5 0.0264 0.000575 PG58-28 (PAV) 18.51 16.65 48 -29.89 48.4 7.57 229.3 0.0261 0.000543
85-100 -1.49 16.19 41.69 -43.39 41.9 6.93 246.4 0.0268 0.000643 85-100 (RTFO) 3.5 16.29 43.7 -40.06 43.56 6.83 232.1 0.0267 0.00061 85-100 (PAV) 10.44 16.08 42.09 -31.68 42.12 6.6 254.8 0.027 0.000641
PG70-28 (Chemical 1) 6.38 16.34 45.74 -39.46 45.84 7.37 229.1 0.0266 0.000581 PG70-28 (Chemical 1) (RTFO) 11.76 16.36 47.74 -36.03 47.79 7.58 224.2 0.0266 0.000557 PG70-28 (Chemical 1) (PAV) 26.63 16.47 50.07 -23.51 50.14 7.61 226.5 0.0264 0.000526
PG70-28 (SBS-1) 2.25 15.8 41.48 -39.33 41.58 7.85 292.4 0.0275 0.000662 PG70-28 (SBS-1) (RTFO) 10.73 15.76 41.63 -31.19 41.92 6.26 244.7 0.0275 0.000662 PG70-28 (SBS-1) (PAV) 18.27 15.86 44.04 -25.75 44.02 6.5 241.8 0.0274 0.000622

18
Table 3: Effects of Different Modifications Asphalt Tg (°C) C1 C2 Tv (°C) Tg-Tv (°C) D m fg αf
PG64-28 -1.49 16.19 41.69 -43.39 41.9 6.93 246.4 0.0268 0.000643 70-28 (AB) 1.37 19.37 36.27 -34.9 36.27 6.79 337.6 0.0224 0.000618
70-28 (Chemical 1) 6.38 16.34 45.74 -39.46 45.84 7.37 229.1 0.0266 0.000581 70-28 (Chemical 2) 3.71 16.14 42.6 -38.95 42.66 5.36 191.0 0.0269 0.000631
70-28 (SBS-1) 2.25 15.8 41.48 -39.33 41.58 7.85 292.4 0.0275 0.000662 70-28 (SBS-2) 2.92 15.86 37.2 -34.3 37.22 5.69 270.8 0.0274 0.000736 70-28 (SBS-3) 0.25 16.63 39.91 -39.72 39.97 6.55 261.7 0.0261 0.000654 70-28 (SBS-4) 0.58 17.17 31.89 -31.27 31.85 5.22 340.7 0.0253 0.000793 70-28 (SBS-L) 1.16 18.79 33.91 -32.85 34.01 6.12 348.8 0.0231 0.000682 70-28 (EMA) 7.5 15.2 34.68 -27.3 34.8 4.93 280.9 0.0286 0.000826
Average 2.463 16.75 38.54 -36.15 38.61 6.28 279.9 0.0261 0.000683

19
Table 4: Effects of Polymer Content Asphalt Tg (°C) C1 C2 Tv (°C) Tg-Tv (°C) D m fg αf 85-100 -5.98 16.23 41.93 -48.08 42.1 6.98 236.8 0.0268 0.000638
2% SBS-2 2.92 15.86 37.2 -34.3 37.22 5.69 270.8 0.0274 0.0007364% SBS-2 6.97 15.7 38.36 -31.41 38.38 5.74 263.9 0.0277 0.0007216% SBS-2 16.69 15.56 35.08 -18.43 35.12 4.94 295.7 0.0279 0.0007958% SBS-2 34.45 14.75 23.38 11.06 23.39 2.8 447.4 0.0294 0.00126
10% SBS-2 38.6 14.41 23.72 14.88 23.72 2.73 435.7 0.0301 0.00127 12% SBS-2 49.83 14.53 22.24 27.59 22.24 2.47 485.1 0.0299 0.00134 14% SBS-2 54.48 13.97 20.76 33.69 20.79 2.18 507.0 0.0311 0.0015

20
Table 5: Difference between Tg and Tv Tg (°C) Tv (°C) Tg-Tv (°C) 0-pen 28.51 -19.74 48.25 PG58-28 (A) -5.65 -47.80 42.15 PG58-28 (B) -5.55 -45.70 40.15 PG58-28 (C) -2.75 -42.24 39.49 PG58-28 (D) -1.28 -41.26 39.98 PG64-22 (A) 2.82 -35.52 38.34 PG64-22 (B) 1.88 -36.58 38.46 PG64-22 (C) 0.38 -39.56 39.94 PG64-22 (D) -1.11 -43.44 42.33 PG64-22 (E) -2.57 -46.01 43.44 PG64-28 -1.49 -43.39 41.90 PG70-22 (AB) 5.87 -35.15 41.02 PG76-16 9.91 -32.77 42.68 PG70-28 (AB) 1.37 -34.9 36.27 70-28 (Chemical 1) 6.38 -39.46 45.84 70-28 (Chemical 2) 3.71 -38.95 42.66 70-28 (SBS-1) 2.25 -39.33 41.58 70-28 (SBS-2) 2.92 -34.3 37.22 70-28 (SBS-3) 0.25 -39.72 39.97 70-28 (SBS-4) 0.58 -31.27 31.85 70-28 (SBS-L) 1.16 -32.85 34.01 70-28 (EMA) 7.5 -27.3 34.80
Average 2.50 -37.60 40.11

21
Table 6: Relationships between Tg, Tv and Tcr
Tg(°C) Tv (°C) Tcr (°C) ∆(Tg-Tcr) (°C) ∆(Tcr-Tv) (°C) PG58-28 (A) -5.55 -45.7 -32.2 26.65 13.5 PG58-28 (B) -5.65 -47.8 -34.5 28.85 13.3 PG64-22 (A) 2.82 -35.52 -29.6 32.42 5.92 PG64-22 (C) 0.38 -39.56 -31.7 32.08 7.86 PG64-22 (E) -2.57 -46.01 -29.1 26.53 16.91 PG64-28 -1.49 -43.39 -32 30.51 11.39 PG70-22 (AB) 5.87 -35.15 -31.1 36.97 4.05 PG70-28 (Chemical 1) 6.38 -39.46 -35.3 41.68 4.16 PG70-28 (Chemical 2) 3.71 -38.95 -33.8 37.51 5.15
Average 0.43 -41.28 -32.14 32.58 9.14

22
Table 7: Measured Tcr versus Predicted Tcr
Tcr (m)
(°C) Tcr (1) 0.77Tv-0.735Tg(°C)
∆(Tcr (m)-Tcr(1)) (°C)
Tcr (2) 0.03Tv-29.6(°C)
∆(Tcr (m)-Tcr(2)) (°C)
PG58-28 (A) -32.2 -31.12 -1.08 -31.20 0.08 PG58-28 (B) -34.5 -32.67 -1.83 -31.27 -1.40 PG64-22 (A) -29.6 -29.44 -0.16 -30.84 1.40 PG64-22 (C) -31.7 -30.76 -0.94 -30.98 0.22 PG64-22 (E) -29.1 -33.55 4.45 -31.21 -2.34 PG64-28 -32 -32.33 0.33 -31.12 -1.21 PG70-22 (AB) -31.1 -31.39 0.29 -30.83 -0.56 PG70-28 (Chemical 1) -35.3 -35.09 -0.21 -30.98 -4.11 PG70-28 (Chemical 2) -33.8 -32.74 -1.06 -30.96 -1.78
Average -32.14 -32.12 -0.02 -31.04 -1.08