Embed Size (px)
Citation preview
ORIGINAL ARTICLE
Low individual-level dietary plasticity in an island-invasivegeneralist forager
Lise Ruffino • James C. Russell • Benoıt Pisanu •
Stephane Caut • Eric Vidal
Received: 30 April 2010 / Accepted: 26 January 2011 / Published online: 26 February 2011
� The Society of Population Ecology and Springer 2011
Abstract The ability of invasive mammals to adjust their
diet in response to new or variable resources is often pro-
posed to explain their invasion success on islands with
differing environmental conditions, especially islands with
strong spatiotemporal changes in the nature and abundance
of their resources. In this study, we investigated how
habitat heterogeneity and seasonal fluctuation in resource
quality affect dietary breadth and plasticity in an island-
invasive rodent, the black rat Rattus rattus, on a small
Mediterranean island. We tested for dietary plasticity of
rats at both the individual and population levels by using
traditional dietary and stable isotope analyses at succes-
sively increasing time scales, coupled with a long-term
study of individual rats in three habitats of close proximity.
Dietary and movement analyses both indicated that
R. rattus is able to exploit a wide range of resources and
habitats. However, dietary plasticity and habitat breadth
were far narrower at the individual level. Results revealed
that rats exclusively used resources found in their local
habitat, and very few individuals moved among adjacent
habitats in pursuit of higher-quality resources, despite those
resources being abundant in their immediate environment.
This counterintuitive finding suggests that intraspecific
interactions must restrict rat mobility. Our results suggest
that even on small islands, accessibility of patchy and high-
quality resources to individuals from the entire population
is not systematic. This result has important implications
when quantifying invasive rodent impacts on patchily
distributed species, especially when studies use indirect
methods such as dietary analyses as a substitute for direct
observations of predatory behavior.
Keywords Alien invasive rodents �Capture–mark–recapture � Dietary shift � Invasion success �Resource use
Introduction
In a constantly changing world, species must continually
adapt their behavior in order to succeed in their environ-
ment. Intrinsic attributes that may predispose a species to
be successful are generally related to niche breadth (Ehr-
lich 1989; Williamson 1996; Vasquez 2005) and may
include behavioral flexibility (Sol and Lefebvre 2000; Sol
et al. 2002) and dietary or habitat breadth (Ehrlich 1989;
Brousseau et al. 1996; Vasquez 2005; Jeschke and Trayer
2006; Blackburn et al. 2009). According to the optimal
foraging theory, generalist foragers should exploit food that
maximizes the net rate of energy intake by focusing on
L. Ruffino (&) � E. Vidal
IMEP, CNRS-UMR 6116 & IRD 193,
Universite Paul Cezanne, Batiment Villemin,
Domaine du Petit Arbois, Avenue Philibert,
B.P. 80, 13545 Aix-en-Provence Cedex 04, France
e-mail: [email protected]
J. C. Russell
Department of Environmental Science, Policy,
and Management, University of California-Berkeley,
Berkeley, CA 94720, USA
B. Pisanu
Departement Ecologie et Gestion de la Biodiversite
Conservation des especes, restauration et suivi des populations,
UMR 7204 MNHN-CNRS-P6, Museum National d’Histoire
Naturelle, 61, rue Buffon, 75231 Paris Cedex 05, France
S. Caut
Estacion Biologica de Donana,
Consejo Superior de Investigationes Cientıficas (CSIC),
Apdo 1056, 41080 Seville, Spain
123
Popul Ecol (2011) 53:535–548
DOI 10.1007/s10144-011-0265-6
high-quality and abundant resources (MacArthur and
Pianka 1966; Pyke et al. 1977). A nonspecialized forager
can opportunistically switch to alternative resources as a
result, for example, of seasonal resource fluctuations or of
drastic environmental changes (Ben-David et al. 1997;
Begg et al. 2003; Stapp and Polis 2003; Dell’Arte et al.
2007; Popa-Lisseanu et al. 2007). This is particularly true
when resources periodically become available to species in
their immediate environment (Pyke et al. 1977; Boutin
1990; Lin and Batzli 2001).
Invasive mammals have established on islands of vari-
ous environmental conditions, and their impacts on native
communities are often devastating (e.g., Courchamp et al.
2003). Island systems often undergo marked spatiotempo-
ral variations in resource availability, often driven by the
seasonal pulses of enriched resources. Examples include
seasonal patterns of seabird or sea-turtle nesting (Polis
et al. 1997a; Caut et al. 2008a) or seasonal flushes of plant
productivity such as fruit and seed ripening (e.g., Polis
et al. 1997b; Gregory and Macdonald 2009). Therefore,
identifying specific foraging and habitat use strategies that
support invasive mammals on islands and enable them to
cope with sometimes extreme seasonal variation in trophic
conditions is crucial to a better understanding of the
invasive species’ impacts on native communities.
The three species of invasive rats, Rattus rattus (Linne
1758), R. norvegicus (Berkenhout 1769), and R. exulans
(Peale 1968), are among the most successful vertebrate
island invaders (Courchamp et al. 2003). Rats have invaded
[80% of the world’s archipelagos (Atkinson 1985) and are
identified as a leading cause of decline, extirpation, and
extinction of island species (Towns et al. 2006; Jones et al.
2008). The ability of rats to establish on islands ranging
from the wet tropics to subarctic tundra has been attributed
to dietary and ecological flexibility (Courchamp et al.
2003; Caut et al. 2008a; Jones et al. 2008). Rats feed on
plant leaves, stems, fruits, and roots (Daniel 1973; Clark
1981; Grant-Hoffman and Barboza 2010), macroinverte-
brates (Palmer and Pons 1996; Rufaut and Gibbs 2003;
Towns et al. 2009), reptiles (Towns et al. 2003, 2007),
birds (Imber 1975; Blackburn et al. 2004; Jones et al.
2008), and some mammals (Harris 2009). Rats are also
known to preferentially select food items with high energy
and nutrient value, such as fruits, seeds, eggs, birds, and
sea-turtle hatchlings (Imber 1975; Clark 1981; Caut et al.
2008a; Jones et al. 2008; Grant-Hoffman and Barboza
2010). Moreover, the spatiotemporal variability of these
high-quality resources has often been hypothesized to
induce dietary shifts in island-invasive rats toward alter-
native resources to compensate the temporary absence of
primary resources (Stapp 2002; Stapp and Polis 2003;
Major et al. 2006; Towns et al. 2006), yet this diet-switching
ability has rarely been demonstrated.
Comparative analyses of naturally occurring stable iso-
tope ratios of carbon (13C/14C, expressed as d13C) and
nitrogen (15N/14N, expressed as d15N) between consumers’
tissues of different turnover rates (e.g., liver vs. muscle) are
a powerful tool for tracking dietary and habitat use through
time and to determine seasonal dietary and habitat shifts
(Phillips and Eldridge 2006; Crawford et al. 2008), espe-
cially when resources differ in their carbon origin (e.g.,
marine vs. terrestrial or C3 plants vs. C4 plants) or trophic
levels (e.g., N-enriched habitats within seabird colonies on
shore vs. oligotrophic inland; Caut et al. 2008a). Caut et al.
(2008a) recently demonstrated a shift in black rat (R. rat-
tus) isotopic signatures on a dry tropical island, reflecting a
dietary shift between seasons varying in resource avail-
ability. However, whether dietary plasticity was attribut-
able to marked shifts in individual diet or, alternatively, to
differences in diet between different sampled subpopula-
tions remains unclear, as the study did not track individual
rats. The ability to track seasonal dietary or habitat shifts in
individual rats would be improved by combining resource
use analyses at successively larger time scales with indi-
vidual-based movement analyses over several periods of
resource availability. However, this multisource approach
has never been used for invasive rodents on islands.
In this study, we investigated how habitat heterogeneity
and seasonal fluctuation in resource quality within adjacent
habitats affect dietary breadth and plasticity in an invasive
rodent, the black rat, on a small Mediterranean island. We
selected three small habitat patches in very close proximity
to ensure that resources would be successively available to
rats in their immediate environment. We investigated the
capacity of rats to opportunistically switch diet when
higher-quality resources became available. More specifi-
cally, we tested for the level at which plasticity became
apparent by analyzing resource use by individuals at vari-
ous time scales (i.e., individual-level plasticity) and com-
paring diet among individuals (i.e., population-level
plasticity) from different habitats and during different
seasons over 3 years. To investigate spatiotemporal pat-
terns of resource and habitat use by rats, analyses of fecal
contents (i.e., reflecting the daily diet) and stable isotopes
of liver (i.e., reflecting the diet of the previous week) and
muscle (i.e., reflecting the diet of the previous month) were
combined with a 2-year capture–mark–recapture survey of
rats and a 1-month radio-tracking study of rat movements
within and among adjacent habitats. As rats are opportu-
nistic generalist foragers, we hypothesized they would
successively use the different resources according to their
availability and quality in order to maximize energy intake,
especially during drastic seasons. We expected that dietary
breadth and plasticity would vary at the individual level
and that rats would move among adjacent habitats through
seasons.
536 Popul Ecol (2011) 53:535–548
123
Methods
Study site
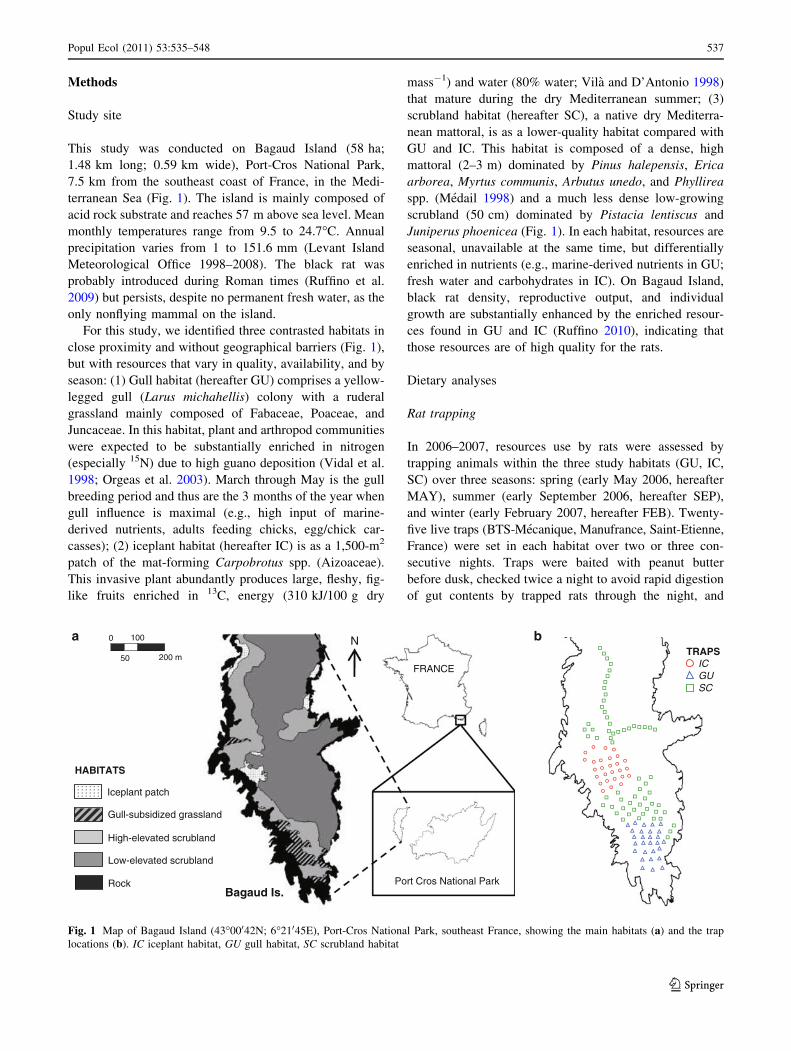
This study was conducted on Bagaud Island (58 ha;
1.48 km long; 0.59 km wide), Port-Cros National Park,
7.5 km from the southeast coast of France, in the Medi-
terranean Sea (Fig. 1). The island is mainly composed of
acid rock substrate and reaches 57 m above sea level. Mean
monthly temperatures range from 9.5 to 24.7�C. Annual
precipitation varies from 1 to 151.6 mm (Levant Island
Meteorological Office 1998–2008). The black rat was
probably introduced during Roman times (Ruffino et al.
2009) but persists, despite no permanent fresh water, as the
only nonflying mammal on the island.
For this study, we identified three contrasted habitats in
close proximity and without geographical barriers (Fig. 1),
but with resources that vary in quality, availability, and by
season: (1) Gull habitat (hereafter GU) comprises a yellow-
legged gull (Larus michahellis) colony with a ruderal
grassland mainly composed of Fabaceae, Poaceae, and
Juncaceae. In this habitat, plant and arthropod communities
were expected to be substantially enriched in nitrogen
(especially 15N) due to high guano deposition (Vidal et al.
1998; Orgeas et al. 2003). March through May is the gull
breeding period and thus are the 3 months of the year when
gull influence is maximal (e.g., high input of marine-
derived nutrients, adults feeding chicks, egg/chick car-
casses); (2) iceplant habitat (hereafter IC) is as a 1,500-m2
patch of the mat-forming Carpobrotus spp. (Aizoaceae).
This invasive plant abundantly produces large, fleshy, fig-
like fruits enriched in 13C, energy (310 kJ/100 g dry
mass-1) and water (80% water; Vila and D’Antonio 1998)
that mature during the dry Mediterranean summer; (3)
scrubland habitat (hereafter SC), a native dry Mediterra-
nean mattoral, is as a lower-quality habitat compared with
GU and IC. This habitat is composed of a dense, high
mattoral (2–3 m) dominated by Pinus halepensis, Erica
arborea, Myrtus communis, Arbutus unedo, and Phyllirea
spp. (Medail 1998) and a much less dense low-growing
scrubland (50 cm) dominated by Pistacia lentiscus and
Juniperus phoenicea (Fig. 1). In each habitat, resources are
seasonal, unavailable at the same time, but differentially
enriched in nutrients (e.g., marine-derived nutrients in GU;
fresh water and carbohydrates in IC). On Bagaud Island,
black rat density, reproductive output, and individual
growth are substantially enhanced by the enriched resour-
ces found in GU and IC (Ruffino 2010), indicating that
those resources are of high quality for the rats.
Dietary analyses
Rat trapping
In 2006–2007, resources use by rats were assessed by
trapping animals within the three study habitats (GU, IC,
SC) over three seasons: spring (early May 2006, hereafter
MAY), summer (early September 2006, hereafter SEP),
and winter (early February 2007, hereafter FEB). Twenty-
five live traps (BTS-Mecanique, Manufrance, Saint-Etienne,
France) were set in each habitat over two or three con-
secutive nights. Traps were baited with peanut butter
before dusk, checked twice a night to avoid rapid digestion
of gut contents by trapped rats through the night, and
Bagaud Is.
FRANCE
Port Cros National Park
N0
50
100
200 m
Iceplant patch
Low-elevated scrubland
Rock
HABITATS
High-elevated scrubland
Gull-subsidized grassland
IC
SCGU
TRAPSba
Fig. 1 Map of Bagaud Island (43�00042N; 6�21045E), Port-Cros National Park, southeast France, showing the main habitats (a) and the trap
locations (b). IC iceplant habitat, GU gull habitat, SC scrubland habitat
Popul Ecol (2011) 53:535–548 537
123
closed each morning. Rats were euthanized, weighed, and
sexed. Fecal contents and tissue samples were collected
for, respectively, dietary and stable isotope analyses.
Fecal-content analysis
Rat fecal contents were analyzed using a compound
microscope for the three habitats during the three sampling
seasons in 2006–2007. The three terminal feces of each rat
were removed from the gut and thoroughly rinsed with water
through a 250-lm mesh sieve to remove the smallest frag-
ments. For each rat, three microscope slides were analyzed
providing a mean of 259 ± 96 standard deviation (SD)
items analyzed per rat. Plant items were identified to the
lowest systematic level possible with the use of a reference
collection of the epidermal parts of most plants found on the
island. A relative abundance index for each consumed item
was calculated as the mean individual abundance of each
item for each habitat–season combination.
Stable isotope analysis
All available potential food items for rats were sampled
during each season and for each habitat. Samples of rat
liver and muscle were preserved in 70% alcohol before
being processed. All samples were dried and ground to fine
powder. Specific parts of plants identified to be consumed
by rats were treated separately. Isotopic analyses were
performed by a spectrometer Delta V Plus (Service Central
d’Analyses, CNRS Solaize, France). Stable carbon (C) and
nitrogen (N) isotope ratios were expressed as:
d13C or d15N ¼ Rsample=Rstandard
� �� 1
� �� 1; 000
where R = 13C/12C or 15N/14N for d13C or d15N, respec-
tively. The standard for C is the International Atomic
Energy Agency–National Bureau of Standards (IAEA-
NBS) 21 (graphite -28.13%) and for N the IAEA-N1
(?0.4%) and IAEA-N2 (?20.3%). Ten replicate assays of
internal laboratory standards indicated measurement max-
imum errors (SD) of ±0.15 and ±0.2% for stable C and N
isotope measurements, respectively.
Iceplant fruits have a distinct isotopic signature com-
pared with C3 plants and other resources on Bagaud Island,
and we used multisource mixing models implemented in
the Stable Isotope Analysis in R (SIAR) package (Parnell
et al. 2008) to assess the relative contributions of iceplant
fruits in the diet of rats from IC and SC across seasons. By
quantifying the assimilated proportion of iceplant fruits in
the consumer’s diet, isotopic mixing models overcome the
possible biases related to fecal content analysis, which can
only quantify excreted proportions of seeds or pulp in
the diet. No attempt was made to run isotopic models for
rats trapped in GU, as no evidence of iceplant fruit
consumption was recorded in this habitat with traditional
dietary analysis (see ‘‘Results’’). Compared with traditional
multisource mixing models, SIAR has provided results that
are markedly more robust when it comes to quantifying
feeding preferences for generalist consumers (Moreno et al.
2010; Parnell et al. 2010). By using Bayesian inference,
SIAR allows all sources of variation and uncertainty (i.e.,
SDs in consumer and source signatures) to be propagated
through the model to return a true probability distribution
of estimated dietary proportions (Jackson et al. 2009;
Parnell et al. 2010). Liver tissue was preferentially used to
reconstruct resource use by rats, as the turnover rates of
stable isotopes are high in liver and reflect the diet of the
previous week, whereas turnover rates in muscle are
around 1 month (Kurle 2009). As discrimination factors
depend on several sources of variation (e.g., taxon, envi-
ronment, tissue; Caut et al. 2008b), discrimination factors
(D13C and D15N) for rat liver were calculated using specific
regression equations between rat liver D13C and D15N and
their corresponding dietary isotopic ratios (Caut et al.
2008b).
Movement analyses
Capture–mark–recapture
In 2007–2009, we investigated whether rats would move
among adjacent habitats in response to seasonal availability
of resources. From April 2007 to April 2009, 19 capture–
mark–recapture sessions were conducted at intervals of
1–3 months. During the 2 years of study, 117 trap stations
(BTS-Mecanique, Manufrance, Saint-Etienne, France)
were set permanently to cover the three study habitats (SC,
GU, IC; 4.25 ha) and record rat movements. Geolocalized
traps were set every 20–25 m, depending on vegetation
cover. Traps were baited with peanut butter before dusk,
set between 3 and 8 consecutive nights depending on
weather conditions, and all checked before 09:00. During
cold and humid seasons, bedding material was provided
inside traps. Rats were individually marked using subcu-
taneous PIT tags (type FDX-B, IER Paris, France), sexed,
weighed to the nearest 2.5 g, checked for sexual maturity,
and released after capture. Software Ranges7 (Kenward
et al. 2006) was used to calculate distances moved between
subsequent captures.
Radio tracking
In August 2008, radio tracking was used to provide a fine-
scale measure of foraging behavior and habitat use over
days and weeks for comparison with the dietary analyses
and capture–recapture data. Nightly movements of a subset
of PIT-tagged individuals were monitored around IC
538 Popul Ecol (2011) 53:535–548
123
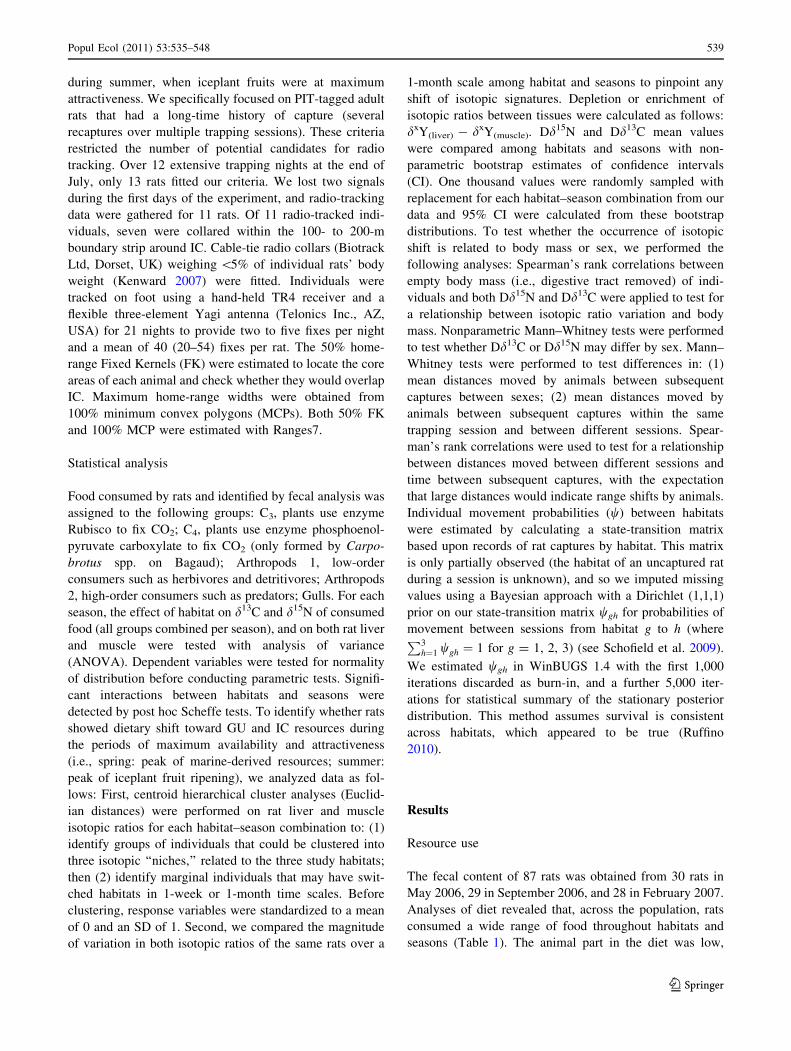
during summer, when iceplant fruits were at maximum
attractiveness. We specifically focused on PIT-tagged adult
rats that had a long-time history of capture (several
recaptures over multiple trapping sessions). These criteria
restricted the number of potential candidates for radio
tracking. Over 12 extensive trapping nights at the end of
July, only 13 rats fitted our criteria. We lost two signals
during the first days of the experiment, and radio-tracking
data were gathered for 11 rats. Of 11 radio-tracked indi-
viduals, seven were collared within the 100- to 200-m
boundary strip around IC. Cable-tie radio collars (Biotrack
Ltd, Dorset, UK) weighing \5% of individual rats’ body
weight (Kenward 2007) were fitted. Individuals were
tracked on foot using a hand-held TR4 receiver and a
flexible three-element Yagi antenna (Telonics Inc., AZ,
USA) for 21 nights to provide two to five fixes per night
and a mean of 40 (20–54) fixes per rat. The 50% home-
range Fixed Kernels (FK) were estimated to locate the core
areas of each animal and check whether they would overlap
IC. Maximum home-range widths were obtained from
100% minimum convex polygons (MCPs). Both 50% FK
and 100% MCP were estimated with Ranges7.
Statistical analysis
Food consumed by rats and identified by fecal analysis was
assigned to the following groups: C3, plants use enzyme
Rubisco to fix CO2; C4, plants use enzyme phosphoenol-
pyruvate carboxylate to fix CO2 (only formed by Carpo-
brotus spp. on Bagaud); Arthropods 1, low-order
consumers such as herbivores and detritivores; Arthropods
2, high-order consumers such as predators; Gulls. For each
season, the effect of habitat on d13C and d15N of consumed
food (all groups combined per season), and on both rat liver
and muscle were tested with analysis of variance
(ANOVA). Dependent variables were tested for normality
of distribution before conducting parametric tests. Signifi-
cant interactions between habitats and seasons were
detected by post hoc Scheffe tests. To identify whether rats
showed dietary shift toward GU and IC resources during
the periods of maximum availability and attractiveness
(i.e., spring: peak of marine-derived resources; summer:
peak of iceplant fruit ripening), we analyzed data as fol-
lows: First, centroid hierarchical cluster analyses (Euclid-
ian distances) were performed on rat liver and muscle
isotopic ratios for each habitat–season combination to: (1)
identify groups of individuals that could be clustered into
three isotopic ‘‘niches,’’ related to the three study habitats;
then (2) identify marginal individuals that may have swit-
ched habitats in 1-week or 1-month time scales. Before
clustering, response variables were standardized to a mean
of 0 and an SD of 1. Second, we compared the magnitude
of variation in both isotopic ratios of the same rats over a
1-month scale among habitat and seasons to pinpoint any
shift of isotopic signatures. Depletion or enrichment of
isotopic ratios between tissues were calculated as follows:
dxY(liver) - dxY(muscle). Dd15N and Dd13C mean values
were compared among habitats and seasons with non-
parametric bootstrap estimates of confidence intervals
(CI). One thousand values were randomly sampled with
replacement for each habitat–season combination from our
data and 95% CI were calculated from these bootstrap
distributions. To test whether the occurrence of isotopic
shift is related to body mass or sex, we performed the
following analyses: Spearman’s rank correlations between
empty body mass (i.e., digestive tract removed) of indi-
viduals and both Dd15N and Dd13C were applied to test for
a relationship between isotopic ratio variation and body
mass. Nonparametric Mann–Whitney tests were performed
to test whether Dd13C or Dd15N may differ by sex. Mann–
Whitney tests were performed to test differences in: (1)
mean distances moved by animals between subsequent
captures between sexes; (2) mean distances moved by
animals between subsequent captures within the same
trapping session and between different sessions. Spear-
man’s rank correlations were used to test for a relationship
between distances moved between different sessions and
time between subsequent captures, with the expectation
that large distances would indicate range shifts by animals.
Individual movement probabilities (w) between habitats
were estimated by calculating a state-transition matrix
based upon records of rat captures by habitat. This matrix
is only partially observed (the habitat of an uncaptured rat
during a session is unknown), and so we imputed missing
values using a Bayesian approach with a Dirichlet (1,1,1)
prior on our state-transition matrix wgh for probabilities of
movement between sessions from habitat g to h (whereP3
h¼1 wgh ¼ 1 for g = 1, 2, 3) (see Schofield et al. 2009).
We estimated wgh in WinBUGS 1.4 with the first 1,000
iterations discarded as burn-in, and a further 5,000 iter-
ations for statistical summary of the stationary posterior
distribution. This method assumes survival is consistent
across habitats, which appeared to be true (Ruffino
2010).
Results
Resource use
The fecal content of 87 rats was obtained from 30 rats in
May 2006, 29 in September 2006, and 28 in February 2007.
Analyses of diet revealed that, across the population, rats
consumed a wide range of food throughout habitats and
seasons (Table 1). The animal part in the diet was low,
Popul Ecol (2011) 53:535–548 539
123
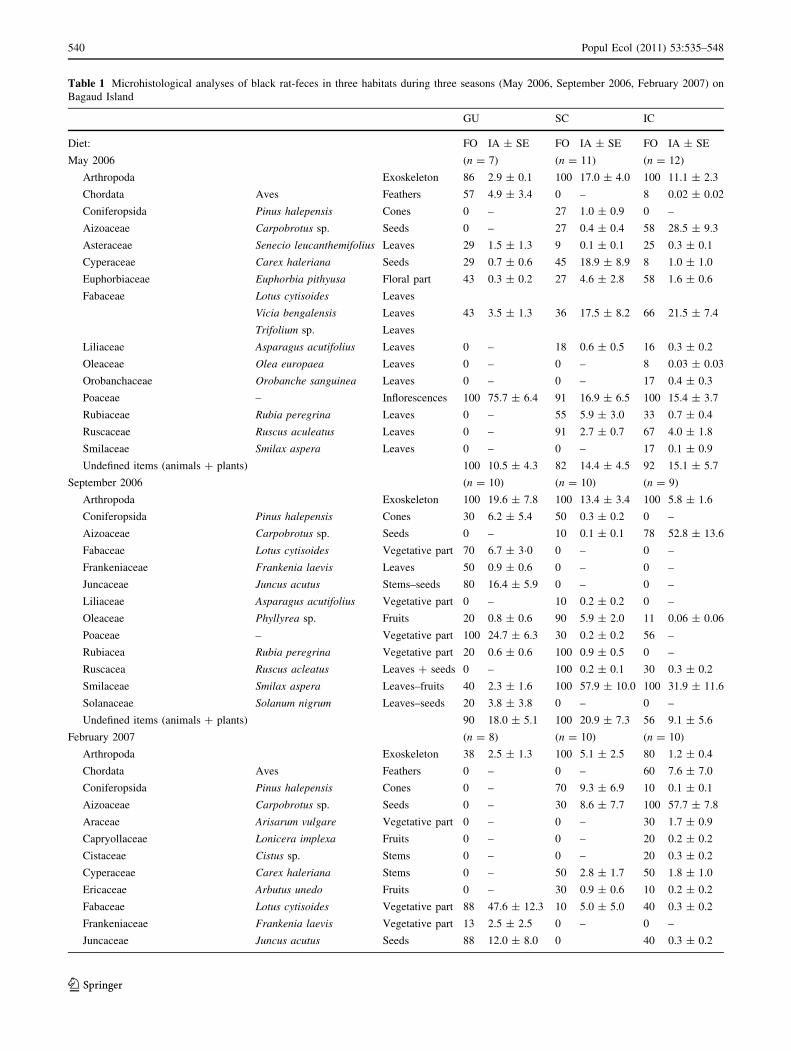
Table 1 Microhistological analyses of black rat-feces in three habitats during three seasons (May 2006, September 2006, February 2007) on
Bagaud Island
GU SC IC
Diet: FO IA ± SE FO IA ± SE FO IA ± SE
May 2006 (n = 7) (n = 11) (n = 12)
Arthropoda Exoskeleton 86 2.9 ± 0.1 100 17.0 ± 4.0 100 11.1 ± 2.3
Chordata Aves Feathers 57 4.9 ± 3.4 0 – 8 0.02 ± 0.02
Coniferopsida Pinus halepensis Cones 0 – 27 1.0 ± 0.9 0 –
Aizoaceae Carpobrotus sp. Seeds 0 – 27 0.4 ± 0.4 58 28.5 ± 9.3
Asteraceae Senecio leucanthemifolius Leaves 29 1.5 ± 1.3 9 0.1 ± 0.1 25 0.3 ± 0.1
Cyperaceae Carex haleriana Seeds 29 0.7 ± 0.6 45 18.9 ± 8.9 8 1.0 ± 1.0
Euphorbiaceae Euphorbia pithyusa Floral part 43 0.3 ± 0.2 27 4.6 ± 2.8 58 1.6 ± 0.6
Fabaceae Lotus cytisoides Leaves
Vicia bengalensis Leaves 43 3.5 ± 1.3 36 17.5 ± 8.2 66 21.5 ± 7.4
Trifolium sp. Leaves
Liliaceae Asparagus acutifolius Leaves 0 – 18 0.6 ± 0.5 16 0.3 ± 0.2
Oleaceae Olea europaea Leaves 0 – 0 – 8 0.03 ± 0.03
Orobanchaceae Orobanche sanguinea Leaves 0 – 0 – 17 0.4 ± 0.3
Poaceae – Inflorescences 100 75.7 ± 6.4 91 16.9 ± 6.5 100 15.4 ± 3.7
Rubiaceae Rubia peregrina Leaves 0 – 55 5.9 ± 3.0 33 0.7 ± 0.4
Ruscaceae Ruscus aculeatus Leaves 0 – 91 2.7 ± 0.7 67 4.0 ± 1.8
Smilaceae Smilax aspera Leaves 0 – 0 – 17 0.1 ± 0.9
Undefined items (animals ? plants) 100 10.5 ± 4.3 82 14.4 ± 4.5 92 15.1 ± 5.7
September 2006 (n = 10) (n = 10) (n = 9)
Arthropoda Exoskeleton 100 19.6 ± 7.8 100 13.4 ± 3.4 100 5.8 ± 1.6
Coniferopsida Pinus halepensis Cones 30 6.2 ± 5.4 50 0.3 ± 0.2 0 –
Aizoaceae Carpobrotus sp. Seeds 0 – 10 0.1 ± 0.1 78 52.8 ± 13.6
Fabaceae Lotus cytisoides Vegetative part 70 6.7 ± 3�0 0 – 0 –
Frankeniaceae Frankenia laevis Leaves 50 0.9 ± 0.6 0 – 0 –
Juncaceae Juncus acutus Stems–seeds 80 16.4 ± 5.9 0 – 0 –
Liliaceae Asparagus acutifolius Vegetative part 0 – 10 0.2 ± 0.2 0 –
Oleaceae Phyllyrea sp. Fruits 20 0.8 ± 0.6 90 5.9 ± 2.0 11 0.06 ± 0.06
Poaceae – Vegetative part 100 24.7 ± 6.3 30 0.2 ± 0.2 56 –
Rubiacea Rubia peregrina Vegetative part 20 0.6 ± 0.6 100 0.9 ± 0.5 0 –
Ruscacea Ruscus acleatus Leaves ? seeds 0 – 100 0.2 ± 0.1 30 0.3 ± 0.2
Smilaceae Smilax aspera Leaves–fruits 40 2.3 ± 1.6 100 57.9 ± 10.0 100 31.9 ± 11.6
Solanaceae Solanum nigrum Leaves–seeds 20 3.8 ± 3.8 0 – 0 –
Undefined items (animals ? plants) 90 18.0 ± 5.1 100 20.9 ± 7.3 56 9.1 ± 5.6
February 2007 (n = 8) (n = 10) (n = 10)
Arthropoda Exoskeleton 38 2.5 ± 1.3 100 5.1 ± 2.5 80 1.2 ± 0.4
Chordata Aves Feathers 0 – 0 – 60 7.6 ± 7.0
Coniferopsida Pinus halepensis Cones 0 – 70 9.3 ± 6.9 10 0.1 ± 0.1
Aizoaceae Carpobrotus sp. Seeds 0 – 30 8.6 ± 7.7 100 57.7 ± 7.8
Araceae Arisarum vulgare Vegetative part 0 – 0 – 30 1.7 ± 0.9
Capryollaceae Lonicera implexa Fruits 0 – 0 – 20 0.2 ± 0.2
Cistaceae Cistus sp. Stems 0 – 0 – 20 0.3 ± 0.2
Cyperaceae Carex haleriana Stems 0 – 50 2.8 ± 1.7 50 1.8 ± 1.0
Ericaceae Arbutus unedo Fruits 0 – 30 0.9 ± 0.6 10 0.2 ± 0.2
Fabaceae Lotus cytisoides Vegetative part 88 47.6 ± 12.3 10 5.0 ± 5.0 40 0.3 ± 0.2
Frankeniaceae Frankenia laevis Vegetative part 13 2.5 ± 2.5 0 – 0 –
Juncaceae Juncus acutus Seeds 88 12.0 ± 8.0 0 40 0.3 ± 0.2
540 Popul Ecol (2011) 53:535–548
123

mostly represented by terrestrial arthropod remains, with
relative abundance ranges from 3–6% to 17–20% accord-
ing to season and habitat. In May 2006, bird feathers were
only recorded in GU. Plant material dominated in the diet,
with an overall mean number of different plant taxa con-
sumed ranging from 7 (SD = 3) to 9 (SD = 4). The main
species consumed varied with seasons, were characteristic
of the habitat where rats were trapped, and mainly com-
prised Fabaceae, Poaceae, and Juncaceae in GU; Cypera-
ceae, Rubiaceae, and Smilaceae in SC; and Aizoaceae in
IC.
For each season, isotopic ratios of food consumed by
rats significantly differed among habitats for both d13C
(F2,82 = 4.06, P \ 0.05) and d15N (F2,82 = 31.83,
P \ 0.001; Table 2). Isotopic ratios of rat liver and muscle
for each season all showed a significant effect of habitat on
both d13C and d15N (all P values \ 0.001; Fig. 2). Overall,
Scheffe tests showed significant interactions between
habitats for both ratios and all seasons, except for differ-
ences in d13C between SC and GU for liver in MAY
and for muscle in FEB and MAY. For each season, both
rat tissues were significantly enriched in d15N in the
Table 1 continued
GU SC IC
Liliaceae Asparagus acutifolius Vegetative part 0 – 0 – 50 1.3 ± 0.8
Myrtaceae Myrtus communis Fruits–seeds 0 – 50 2.0 ± 1.0 20 0.4 ± 0.2
Oleacea Phyllyrea sp. Leaves–fruits 0 – 50 3.5 ± 2.7 20 0.4 ± 0.2
Poaceae – Vegetative part 75 15.4 ± 7.6 30 1.7 ± 1.1 60 8.1 ± 4.1
Rubiaceae Rubia peregrina Vegetative part 0 – 100 43.3 ± 9.3 60 0.8 ± 0.5
Ruscaceae Ruscus aculeatus Vegetative part 0 – 50 0.9 ± 0.5 30 1.4 ± 1.2
Smilaceae Smilax aspera Fruits 0 – 30 13.4 ± 9.1 80 10.7 ± 6.9
Solanaceae Solanum nigrum Seeds 38 6.6 ± 4.0 50 1.8 ± 1.0 0 –
Undefined items (animals ? plants) 75 13.4 ± 11.5 80 3.6 ± 2.0 90 6.8 ± 2.5
GU gull, SC scrubland, IC iceplant, FO percentage of occurrence, IA mean relative abundance [± standard error (SE)], both in %
Table 2 Mean (standard error) stable isotope ratios of carbon (d13C) and nitrogen (d15N), expressed in %, of the main groups of food consumed
by rats for each season and habitat
May 2006 September 2006 February 2007
d13C d15N d13C d15N d13C d15N
SC
C3 Plants -27.09 (0.70) -3.07 (0.29) -28.84 (0.88) -4.85 (0.67) -26.55 (0.70) -3.75 (0.58)
Arthropods 1 -25.55 (0.24) -2.02 (0.90) -24.82 (0.39) 2.33 (0.72) – –
Arthropods 2 -24.14 (0.32) 2.52 (0.40) -23.41 (0.17) 0.90 (0.81) -24.53 (0.82) 5.82 (3.00)
IC
C3 Plants -27.26 (0.64) 0.40 (1.07) -26.39 (1.04) -1.24 (0.27) -26.57 (0.41) -0.16 (0.55)
C4 Carpobrotus spp. -21.01 (0.21) 7.45 (0.27) -20.79 (0.20) 7.30 (0.22) -21.12 (0.35) 6.74 (0.5)
Arthropods 1 -23.97 (1.17) 3.6 (1.21) -23.45c 4.95c -23.74 (0.66) 3.33 (0.55)
Arthropods 2 -24.27c 6.73c -23.80 (0.04) 8.38 (2.19) -23.09 (0.63) 9.18 (0.46)
GU
C3 Plants -27.16 (0.51) 6.94 (0.61) -25.01 (0.67) 11.90 (4.12) -26.64 (0.79) 7.17 (1.25)
Arthropods 1 -24.13 (0.45) 9.08 (2.16) -24.61 (0.68) 10.71 (0.24) -23.10 (0.28) -1.34 (1.10)
Arthropods 2 -24.74 (0.24) 15.04 (0.81) -23.55 (0.09) 4.55 (0.19) -25.46 (1.04) 9.76 (1.17)
Gulls -21.28 (0.80)a 9.34 (0.45)a – – 21.11 (0.79)b 5.14 (1.24)b
Consumed food items were thoroughly identified by fecal content analysis
SC scrubland, IC iceplant, GU gula Chick muscle and eggs were sampledb Fresh gull guano was sampledc One taxonomic group of prey was sampled
Popul Ecol (2011) 53:535–548 541
123
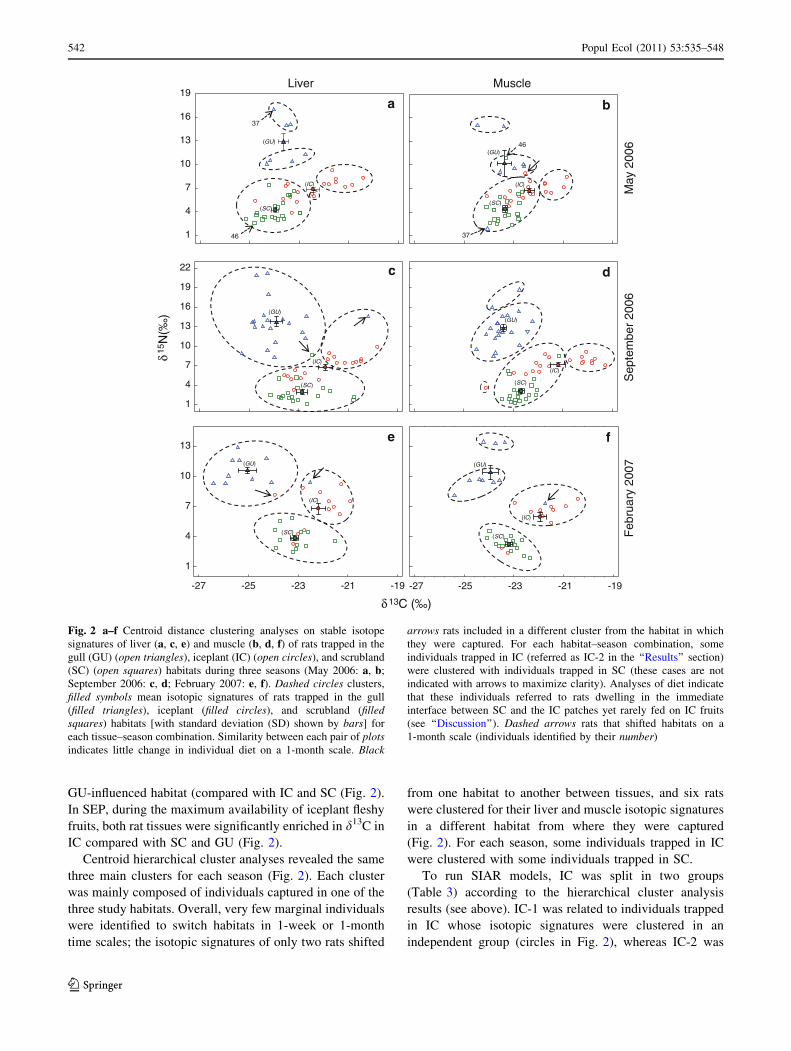
GU-influenced habitat (compared with IC and SC (Fig. 2).
In SEP, during the maximum availability of iceplant fleshy
fruits, both rat tissues were significantly enriched in d13C in
IC compared with SC and GU (Fig. 2).
Centroid hierarchical cluster analyses revealed the same
three main clusters for each season (Fig. 2). Each cluster
was mainly composed of individuals captured in one of the
three study habitats. Overall, very few marginal individuals
were identified to switch habitats in 1-week or 1-month
time scales; the isotopic signatures of only two rats shifted
from one habitat to another between tissues, and six rats
were clustered for their liver and muscle isotopic signatures
in a different habitat from where they were captured
(Fig. 2). For each season, some individuals trapped in IC
were clustered with some individuals trapped in SC.
To run SIAR models, IC was split in two groups
(Table 3) according to the hierarchical cluster analysis
results (see above). IC-1 was related to individuals trapped
in IC whose isotopic signatures were clustered in an
independent group (circles in Fig. 2), whereas IC-2 was
δ15 N
(‰)
δ 13C (‰)
Muscle
(IC)
(GU)
(SC)
(IC)
(SC)
(GU)
(IC)
(SC)
(GU)
(IC)
(GU)
(SC)
(GU)
(SC)
(IC)
(SC)
(IC)
(GU)
-27 -25 -23 -21 -19
Liver
May
200
6S
epte
mbe
r 20
06F
ebru
ary
2007
37
46 37
46
ba
dc
fe
-27 -25 -23 -21 -19
1
4
7
10
13
1
4
7
10
13
16
19
22
1
4
7
10
13
16
19
Fig. 2 a–f Centroid distance clustering analyses on stable isotope
signatures of liver (a, c, e) and muscle (b, d, f) of rats trapped in the
gull (GU) (open triangles), iceplant (IC) (open circles), and scrubland
(SC) (open squares) habitats during three seasons (May 2006: a, b;
September 2006: c, d; February 2007: e, f). Dashed circles clusters,
filled symbols mean isotopic signatures of rats trapped in the gull
(filled triangles), iceplant (filled circles), and scrubland (filledsquares) habitats [with standard deviation (SD) shown by bars] for
each tissue–season combination. Similarity between each pair of plotsindicates little change in individual diet on a 1-month scale. Black
arrows rats included in a different cluster from the habitat in which
they were captured. For each habitat–season combination, some
individuals trapped in IC (referred as IC-2 in the ‘‘Results’’ section)
were clustered with individuals trapped in SC (these cases are not
indicated with arrows to maximize clarity). Analyses of diet indicate
that these individuals referred to rats dwelling in the immediate
interface between SC and the IC patches yet rarely fed on IC fruits
(see ‘‘Discussion’’). Dashed arrows rats that shifted habitats on a
1-month scale (individuals identified by their number)
542 Popul Ecol (2011) 53:535–548
123
related to individuals trapped in IC but whose isotopic
signatures were clustered with those of individuals
trapped in SC (circles clustered with rectangles in
Fig. 2). SIAR estimates showed that rats from adjacent
IC and SC significantly diverged in the assimilated
proportions of iceplant fruits across seasons. In particu-
lar, the model estimated a large relative contribution of
iceplant fruits in rat diet for IC-1 for all seasons, but
more specifically for SEP, and a very low proportion of
iceplant fruits in the diet of rats from IC-2 and adjacent
SC (Table 3).
Variation in isotopic ratio values between rat tissues
(i.e., variation through the previous 4 weeks before
sampling: Dd13C and Dd15N) was \1% for all habitat–
season combinations, except in GU for Dd15N in MAY and
SEP and for Dd13C in FEB (Fig. 3a, b). In spring (i.e.,
MAY), during the middle of the gull nesting period, the
enrichment in mean d15N of rats trapped in GU was sig-
nificantly higher compared with the two other habitats
during the same season and the two other seasons for GU
(Fig. 3b). In summer (i.e., SEP), during the peak of ice-
plant fruit ripening, the depletion in mean d13C of rats
trapped in IC was significantly higher than the two other
habitats, especially SC (Fig. 3a). No correlation was found
between empty body mass of individuals and both Dd13C
(Spearman rs = 0.14, n = 138) and Dd15N (Spearman
Table 3 Estimates of relative contribution [with 95% credible intervals (CI)] of iceplant fruits in the assimilated diet of rats trapped in the
iceplant (IC) and scrubland (SC) habitats during three seasons
Habitat Group May 2006 September 2006 February 2007
Mode Mean CI 2.5% CI 97.5% Mode Mean CI 2.5% CI 97.5% Mode Mean CI 2.5% CI 97.5%
IC 1 0.34 0.36 0.08 0.64 0.43 0.47 0.20 0.77 0.36 0.39 0.14 0.66
2 0.03 0.13 0.00 0.35 0.02 0.07 0.00 0.18 –a –a –a –a
1 ? 2 0.20 0.20 0.00 0.40 0.31 0.28 0.02 0.50 0.26 0.23 0.00 0.44
SC 0.01 0.04 0.00 0.10 0.03 0.08 0.00 0.21 0.02 0.09 0.00 0.22
IC was split in two groups according to the hierarchical cluster analysis results (Fig. 2): IC-1 individuals trapped in IC and whose isotopic
signatures were clustered in an independent group; IC-2 individuals trapped in IC but whose isotopic signatures were clustered with those of
individuals trapped in SC (see ‘‘Resource use’’ for further details)a Too few individuals (n = 3) were clustered in IC-2 to run the model
Dδ15
N (
‰)
-1
0
1
2
3
4
5
Dδ13
C (
‰)
-1.5
-1
-0.5
0
0.5
b
a
IC GU SC IC GU SC IC GU SC
May 06 September 06 February 07
Fig. 3 Variation in isotope
ratios of carbon (d13C) (Dd13C)
(a) and nitrogen (d15N) values
(Dd15N) (b) between liver and
muscle of rats from each
habitat. GU gull, IC iceplant, SCscrubland—season
combinations
Popul Ecol (2011) 53:535–548 543
123

rs = -0.01, n = 138). Neither Dd13C nor Dd15N were
significantly different between sexes (Mann–Whitney tests,
P [ 0.05).
Habitat use
From April 2007 to April 2009, there were 2,236 captures
of 610 rats marked over 19 capture–recapture sessions.
Nearly half the marked rats were recaptured in at least two
different trapping sessions. Mean and maximal distances
moved by rats between subsequent captures were, respec-
tively, 30 m (SD = 37) and 451 m. Mean distances moved
between subsequent captures were significantly higher for
males than for females (mean distMale = 36 m ± 42 SD,
nM = 210; mean distFemale = 23 m ± 30 SD; nF = 196,
Z = -3.9, P \ 0.001). Mean distances moved between
subsequent captures were significantly higher (Z = 9.4,
P [ 0.001) for animals trapped during different sessions
(33 m ± 40 SD, n = 290) than those trapped within the
same session (14 m ± 15 SD, n = 402). Spearman rank
correlations showed a slight correlation between distances
moved between sessions and time between subsequent
captures (n = 596, Spearman rs = 0.22, P \ 0.001).
The habitat transition matrix revealed low probabilities
of movement between habitats (Table 4). In contrast, the
probability of rats staying within the same habitat between
subsequent captures was[0.87 in each habitat. The 50% FK
core areas of all radio-tracked individuals remained in the
same habitat in which they were collared and trapped
by capture–recapture. Estimated 100% MCPs showed a
mean home-range width of 133 m ± 51 SD. Males had
slightly larger mean home ranges than females (males
100% MCP = 0.95 ha ± 0.63 SD, 95% Kernel = 0.79 ha
± 0.62 SD, n = 8; females 100% MCP = 0.63 ha ± 0.25 SD,
95% Kernel = 0.62 ha ± 0.24 SD, n = 3). The seven rats
collared [100 m from the iceplant patch were never
recorded within the patch during the iceplant fruit-ripening
season (August).
Discussion
At a small spatial scale, the isotopic signatures of resources
varied locally among habitats on Bagaud Island. Gulls sub-
stantially enriched local trophic webs in 15N during their
breeding season in spring, and iceplant produced fruits
enriched in 13C during summer. These nutrient enrichments
seemed to persist in the local food webs even when gull and
iceplant fruit resources were reduced and no longer avail-
able. For each season, rat isotopic signatures were clustered
by habitats, and the high 15N and 13C enrichment in their
tissues indicated that these high-order consumers were
locally subsidized by gulls and iceplant fruits, respectively.
Fecal content and stable isotope analyses confirmed
previous suggestions on the generalist foraging behavior
(dietary breadth) of introduced black rats and the ability of
the species, as a whole, to exploit a wide range of resources
and establish in habitats of variable quality (Clark 1981;
Harper et al. 2005; Towns et al. 2006; Caut et al. 2008a). On
Bagaud Island, within each habitat, rats selected different
food items across seasons, probably in relation to their
seasonal phenology, abundance, nutritional value, and pal-
atability (Clark 1981; Grant-Hoffman and Barboza 2010).
However, dietary plasticity of individual rats was far nar-
rower. Surprisingly, even for habitats only tens of meters
apart, the diet of rats was substantially distinct among
adjacent habitats for each season. Moreover, site fidelity
remained high despite the marked influences of gull-derived
resources and, to a lesser extent, iceplant fruits, on rat
population dynamics (e.g., higher individual growth rates,
higher reproductive output and density; Ruffino 2010),
especially during extreme climatic conditions such as dry
years with low terrestrial productivity. This specific pattern
of resource use was found consistently over successively
larger time scales (i.e., days, weeks, and months) and
revealed a specific or even exclusive use of resources by rats
in their local habitat. Gull and iceplant fruit resources, in
particular, were extensively used by rats when they became
available, but only to benefit resident individuals.
The narrow feeding range of individual rats was con-
firmed by our live trapping studies. However, such studies
are prone to biases when habitat use and the home range
size of animals are estimated from successive records of
trapping events. Possible biases were overcome by com-
bining a long-term capture–recapture survey with radio
tracking of the movements of a subsample of individuals at
a finer spatiotemporal scale. Our radio-tracking results
reinforced the apparent high residency rate of black rats.
Although rats showed a home-range span large enough to
reach alternative habitats during the dry summer, they
remained in the surrounding scrubland. Even though our
capture–recapture survey indicated higher mean travel
distances by rats with time between captures, distances
Table 4 Posterior probabilities (w) of rat movement between two
distinct habitats (GU gull, SC scrubland, IC iceplant) with standard
deviation (SD) and 95% credible intervals (CI)
Mean SD CI 2.5% CI 97.5%
wGU,GU 0.93 0.02 0.89 0.96
wGU,SC 0.05 0.02 0.02 0.08
wGU,IC 0.02 0.01 0.01 0.04
wSC,GU 0.07 0.02 0.03 0.12
wSC,SC 0.87 0.03 0.80 0.92
wSC,IC 0.06 0.02 0.03 0.11
wIC,GU 0.02 0.01 0.00 0.04
wIC,SC 0.02 0.01 0.00 0.04
wIC,IC 0.97 0.01 0.93 0.99
544 Popul Ecol (2011) 53:535–548
123

moved remained low (\40 m), suggesting no apparent
range shift with time. Unfortunately, there are few indi-
vidual-based movement studies on rodent populations
covering a long period of time where seasonal resources
fluctuate (but see Moller and Craig 1987), even though
these data are very useful for highlighting habitat or dietary
shifts over time. The apparent short distances moved by
black rats between captures and low individual dispersal
toward unfamiliar areas (i.e., outside their home range
area) were consistent with some other capture–recapture
studies on rodents (e.g., Moller and Craig 1987; Jones
1989) but would be worthy of more investigation. Indeed,
the capacity of small mammals to move among habitats
and disperse long distances may depend on the spatial
distribution (i.e., patchiness) and temporal availability of
resources (Dowding and Murphy 1994; Tobin et al. 1996;
Gauffre et al. 2008), the presence of geographical corridors
or barriers (Krohne and Hoch 1999), or metapopulation
dynamic processes (Krohne 1997; Lin and Batzli 2001).
The variation in isotopic ratios of the same rats over a
1-month scale (i.e., variation between tissues) was low, and
only a few individuals switched habitats when the avail-
ability of high-quality resources was the greatest. This
switching by some individuals was not linked to either body
mass or sex and may be an outcome of other population
processes such as being forced out of territories. Even rats
dwelling in the immediate interface between SC and the IC
patches rarely used iceplant fruits during the dry summer,
whereas rats resident in the IC strongly relied on fruits at the
time (Fig. 2; Table 3). Food supplementation experiments
and manipulations of habitat quality in the field often
encourage immigration toward food-supplemented areas or
higher-quality habitats and increase residential times of
newly established individuals (Boutin 1990), especially
omnivorous rodents (Banks and Dickman 2000; Lin and
Batzli 2001; Van Aarde and Jackson 2007). Therefore, our
finding is counterintuitive for a generalist invasive forager
that may have had access to higher-quality resources in
close proximity throughout the year. These unexpected
findings are likely to be related to other population pro-
cesses, such as intraspecific territorial interactions, that may
limit access to high-quality resources by subordinates.
There is extensive evidence that some species of eco-
logical generalists, which use diverse resources at the
population level, are in fact individuals with narrower
ranges of resource use (Bolnick et al. 2003, 2007; Brooke
McEachern et al. 2006; Quevedo et al. 2009). However,
studies demonstrating distinct foraging strategies in indi-
viduals of generalist species occupying small habitat pat-
ches in close proximity are rare (but see Brooke
McEachern et al. 2006). Reduced niche breadth in indi-
viduals of generalist species may minimize intraspecific
competition by reducing resource use overlap (Bolnick
et al. 2007) and is observed in heterogeneous landscapes or
in individuals exhibiting a strong territoriality (Angerbjorn
et al. 1994; Urton and Hobson 2005). Territory defense
through scent marks and/or agonistic behavior toward
unfamiliar conspecifics may provide a plausible explana-
tion for the low mobility of rats and the privileged access to
enriched resources by dominants and residents, as pre-
dicted by the ideal despotic distribution (Fretwell and
Lucas 1970) and already demonstrated for other rodents
(Spencer and Cameron 1983; Gray et al. 2002; Jensen et al.
2005). Moreover, when the high-quality food source is
clumped in space to form patchy habitats, dominant indi-
viduals may tend to monopolize food sources (Boutin
1990). In this sense, compared with rats that did not have
access to these enriched resources (Ruffino 2010), the
larger body mass of rats foraging on gull-subsidized
resources on Bagaud Island could favor social dominance
and aggression (i.e., Spencer and Cameron 1983).
By combining dietary and trophic analyses at various
time scales with intensive individual-based movement
monitoring over several rat generations, we were able to
examine how habitat heterogeneity and seasonal fluctua-
tion of resource quality within adjacent habitats affect
dietary breadth and plasticity at the individual and popu-
lation levels in an invasive generalist rodent. The diet-
switching ability of introduced rats to benefit from seasonal
high-quality resources is often proposed to explain their
wide invasion success and diverse impact from arctic to
tropical islands (Stapp 2002; Stapp and Polis 2003; Major
et al. 2006; Towns et al. 2006). Caut et al. (2008a) recently
demonstrated a dietary shift in R. rattus on a dry tropical
island between seasons but did not track individual rats.
Conversely, on Bagaud Island, we found that individual rat
diet was relatively consistent with the resources available
in their immediate habitat across seasons, despite the very
close proximity of fluctuating resources of differential
quality in the wider environment. The different feeding
patterns observed between the two systems may be related
to multiple intrinsic and extrinsic factors, such as local
population density, intraspecific interactions, or attrac-
tiveness of resources. Climate is also likely to influence
resource use by invasive rats on islands. Tropical islands
tend to have much higher variation in resource availability,
implying that rats would have to move longer distances to
meet their dietary requirements as resources seasonally
switch, compared with Mediterranean islands where rats
would be less limited by resources.
Conclusions and implications
The pattern of resource use observed in our study seems
surprising for such a successful invader, renowned for its
Popul Ecol (2011) 53:535–548 545
123

ecological flexibility and dietary plasticity. Although our
results support high species- and population-level dietary
breadth and plasticity, they show a much narrower indi-
vidual dietary and habitat breadth, constrained by complex
mechanisms probably related to social organization and
territory defense behavior. Restricted dietary breadth of
individual black rats along with limited movements
between habitats may promote differentiation among sub-
populations in dynamics and structure, reinforcing the
benefits of enriched resources (Ruffino 2010). On the other
hand, our results add to growing evidence that invasive
black rats can occupy various habitats, even those of low
quality, which should explain their wide invasion success
on islands, especially those with extreme environments.
Our results also suggest that even on a small island, the
accessibility of patchy and high-quality resources to rats
from the entire population is not systematic. This result has
important implications when quantifying invasive rat
impact on patchily distributed species, especially when
studies use indirect methods, such as dietary analyses, as a
substitute for direct observations of feeding habits. To
conclude, our study emphasizes the value of integrating
methods and the need for more long-term individual-based
monitoring studies to assess both resource and habitat use
of invasive species at different spatiotemporal scales in
changing environments.
Acknowledgments We are very grateful to all the people who
helped in the field and for processing laboratory samples. We
specially thank J.L. Chapuis for training us in microhistological
analyses of diet, M. Pascal and O. Lorvelec for helping in the field,
and J.F. Giroux and two anonymous referees for comments and
advice on earlier drafts of the manuscript. We thank all the PCNP
staff who enabled this long-term study on the natural reserve of
Bagaud Island. Research was funded by the Agence Nationale pour
la Recherche (ANR) with program ALIENS. Funds were provided
by a PhD fellowship granted by Ecole Doctorale des Sciences de
l’Environement to LR, a postdoctoral fellowship granted by the
New Zealand Foundation for Research, Science and Technology to
JCR, and Consejo Superior de Investigaciones Cientıficas (CSIC) to
SC.
References
Angerbjorn A, Hersteinsson P, Liden K, Nelson E (1994) Dietary
variation in arctic foxes (Alopex lagopus)—an analysis of stable
isotopes. Oecologia 99:226–232
Atkinson IAE (1985) The spread of commensal species of Rattus to
oceanic islands and their effects on island avifaunas. ICPB Tech
Publ 3:35–81
Banks PB, Dickman CR (2000) Effects of winter food supplemen-
tation on reproduction, body mass, and numbers of small
mammals in montane Australia. Can J Zool 78:1775–1783
Begg CM, Begg KS, Du Toit JT, Mills MG (2003) Sexual and
seasonal variation in the diet and foraging behaviour of a
sexually dimorphic carnivore, the honey badger (Mellivoracapensis). J Zool 260:301–316
Ben-David M, Flynn RW, Schell DM (1997) Annual and seasonal
changes in diets of martens: evidence from stable isotope
analysis. Oecologia 111:280–291
Blackburn TM, Cassey P, Duncan RP, Evans KL, Gaston KJ (2004)
Avian extinction and mammalian introductions on oceanic
islands. Science 305:1955–1958
Blackburn T, Cassey P, Lockwood J (2009) The role of species traits
in the establishment success of exotic birds. Glob Chang Biol
15:2852–2860
Bolnick DL, Svanback R, Fordyce JA, Yang LH, Davis JM, Hulsey
CD, Forister ML (2003) The ecology of individuals: incidence
and implications of individual specialization. Am Nat 161:1–28
Bolnick DL, Svanback R, Araujo MS, Persson L (2007) Comparative
support for the niche variation hypothesis that more generalized
populations also are more heterogeneous. Proc Natl Acad Sci
USA 104:10075–10079
Boutin S (1990) Food supplementation experiments with terrestrial
vertebrates: patterns, problems and the future. Can J Zool
68:203–220
Brooke McEachern M, Eagles-Smith CA, Efferson CM, Van Vuren
DH (2006) Evidence for local specialization in a generalist
mammalian herbivore, Neotoma fuscipes. Oikos 113:440–448
Brousseau P, Lefebvre J, Giroux JF (1996) Diet of ringbilled gull
chicks in urban and non-urban colonies in Quebec. Colon
Waterbird 19:22–30
Caut S, Angulo E, Courchamp F (2008a) Diet shift of an invasive
predator: rats, seabirds and sea turtles. J Appl Ecol 45:428–437
Caut S, Angulo E, Courchamp F (2008b) Discrimination factors
(D15N and D13C) in an omnivorous consumers; effect of diet
isotopic ratios. Funct Ecol 22:255–263
Clark DA (1981) Foraging patterns of black rats across a desert-
montane forest gradient in the Galapagos islands. Biotropica
13:182–184
Courchamp F, Chapuis J-L, Pascal M (2003) Mammal invaders on
islands: impact, control and control impact. Biol Rev
78:347–383
Crawford K, McDonald RA, Bearhop S (2008) Applications of stable
isotope techniques to the ecology of mammals. Mammal Rev
38:87–107
Daniel MJ (1973) Seasonal diet of the ship rat (Rattus r. rattus) in
lowland forest in New Zealand. Proc NZ Ecol Soc 20:21–30
Dell’Arte GL, Laaksonen T, Norrdahl K, Korpimaki E (2007)
Variation in the diet composition of a generalist predator, the red
fox, in relation to season and density of main prey. Acta Oecol
31:276–281
Dowding JE, Murphy EC (1994) Ecology of ship rats (Rattus rattus)
in a Kauri forest (Agathis australis) in Northland, New Zealand.
NZ J Ecol 18:19–28
Ehrlich P (1989) Attributes of invaders and the invading processes:
vertebrates. In: Drake JA, Mooney HA, di Castri F, Groves RH,
Kruger FJ, Rejmanek M, Williamson M (eds) Biological
invasions: a global perspective. Wiley, Chichester, pp 315–328
Fretwell SD, Lucas HL (1970) On territorial behavior and other
factors influencing habitat destruction in birds. I. Theoritical
development. Acta Biotheor 19:16–36
Gauffre B, Estoup A, Bretagnolle V, Cosson JF (2008) Spatial genetic
structure of a small rodent in a heterogeneous landscape. Mol
Ecol 17:4619–4629
Grant-Hoffman MN, Barboza PS (2010) Herbivory in invasive rats:
criteria for food selection. Biol Invasions 12:805–825
Gray SJ, Jensen SP, Hurst JL (2002) Effects of resource distribution
on activity and territory defence in house mice, Mus domesticus.
Anim Behav 63:531–539
Gregory SD, Macdonald DW (2009) Prickly coexistence or blunt
competition? Opuntia refugia in an invaded rodent community.
Oecologia 159:225–236
546 Popul Ecol (2011) 53:535–548
123
Harper GA, Dickinson KJM, Seddon PJ (2005) Habitat use by three
rat species (Rattus spp.) on Stewart Island/Rakiura, New
Zealand. NZ J Ecol 29:251–260
Harris DB (2009) Review of negative effects of introduced rodents on
small mammals on islands. Biol Invasions 11:1611–1630
Imber FI (1975) The murine rodents Rattus rattus, exulans and
norvegicus as avian predators. Atoll Res Bull 182:1–13
Jackson AL, Inger R, Bearhop S, Parnell A (2009) Erroneous
behaviour of MixSIR, a recently published Bayesian isotope
mixing model: a discussion of Moore & Semmens (2008). Ecol
Lett 12:E1–E5
Jensen SP, Gray SJ, Hurst JL (2005) Excluding neighbours from
territories: effects of habitat structure and resource distribution.
Anim Behav 79:785–795
Jeschke JM, Trayer DL (2006) Determinants of vertebrate invasion
success in Europe and North America. Glob Chang Biol
12:1608–1619
Jones TW (1989) Dispersal distance and the range of nightly
movements in Merriam’s Kangaroo rats. J Mammal 70:27–34
Jones HP, Tershy BR, Zavaleta ES, Croll DA, Keitt BS, Finkelstein
ME, Howald GR (2008) Severity of the effects of invasive rats
on seabirds: a global review. Conserv Biol 22:16–26
Kenward RE (2007) A manual for wildlife radio tagging. Academic
Press, London
Kenward RE, South AB, Walls SS (2006) Ranges7. Online manual.
Anatrack Ltd, Wareham
Krohne DT (1997) Dynamics of metapopulations of small mammals.
J Mammal 78:1014–1026
Krohne DT, Hoch GA (1999) Demography of Peromyscus leucopuspopulations on habitat patches: the role of dispersal. Can J Zool
77:1247–1253
Kurle CM (2009) Interpreting temporal variation in omnivore
foraging ecology via stable isotope modeling. Funct Ecol
23:733–744
Lin Y-TK, Batzli GO (2001) The influence of habitat quality on
dispersal, demography, and population dynamics of voles. Ecol
Monogr 71:245–275
MacArthur RH, Pianka ER (1966) On optimal use of a patchy
environment. Am Nat 100:377–385
Major HL, Jones IL, Charette MR, Diamond AW (2006) Variation in
the diet of introduced Norway rats (Rattus norvegicus) inferred
using stable isotope analysis. J Zool 271:463–468
Medail F (1998) Flore et vegetation des ıles satellites (Bagaud,
Gabiniere, Rascas) du Parc National de Port-Cros (Var, S.E.
France). Scientific Reports of the Port-Cros National Park,
France 17:55–80 (in French with English abstract)
Moller H, Craig JL (1987) The population ecology of Rattus exulanson Tiritiri Matangi Island, and a model of comparative
population dynamics in New Zealand. NZ J Zool 14:305–328
Moreno R, Jover L, Munilla I, Velando A, Sanpera C (2010) A three-
isotope approach to disentangling the diet of a generalist
consumer: the yellow-legged gull in northwest Spain. Mar Biol
157:545–553
Orgeas J, Vidal E, Ponel P (2003) Colonial seabirds change beetle
assemblages on a Mediterranean island. Ecoscience 10:38–44
Palmer M, Pons GX (1996) Diversity in western Mediterranean islets:
effects of rat presence on a beetle guild. Acta Oecol 17:297–305
Parnell A, Inger R, Bearhop S, Jackson AL (2008) SIAR: stable
isotope analysis in R. http://cran.r-project.org/web/packages/
siar/index.html
Parnell AC, Ringer R, Bearhop S, Jackson AL (2010) Source
partitioning using stable isotopes: coping with too much
variation. PLoS One 5:e9672
Phillips DL, Eldridge PM (2006) Estimating the timing of diet shifts
using stable isotopes. Oecologia 147:195–203
Polis GA, Anderson WB, Holt RT (1997a) Toward an integration of
landscape and food web ecology: the dynamics of spatially
subsidized food webs. Annu Rev Ecol Syst 28:289–316
Polis GA, Hurd SD, Jackson CT, Sanchez-Pinero F (1997b) El Nino
effects on the dynamics and control of an island ecosystem in the
Gulf of California. Ecology 78:1884–1897
Popa-Lisseanu AG, Delgado-Huertas A, Forero MG, Rodrıguez A,
Arlettaz R, Ibanez C (2007) Bats’ conquest of a formidable
foraging niche: the myriads of nocturnally migrating songbirds.
PLoS ONE 2:e205
Pyke GH, Pulliam HR, Charnov EL (1977) Optimal foraging: a
selective review of theory and tests. Q Rev Biol 52:137–154Quevedo M, Svanback R, Eklo P (2009) Intrapopulation niche
partitioning in a generalist predator limits food web connectivity.
Ecology 90:2263–2274
Rufaut CG, Gibbs GW (2003) Response of a tree weta population
(Hemideina crassidens) after eradication of the polynesian rat
from a New Zealand Island. Restor Ecol 11:13–19
Ruffino L (2010) Ecologie, dynamique de population, comportement
et impact d’un rongeur introduit Rattus rattus sur les ıles de
Mediterranee. PhD dissertation, Universite Paul Cezanne, Aix-
en-Provence (in French with English abstract)
Ruffino L, Bourgeois K, Vidal E, Duhem C, Paracuellos M, Escribano
F, Sposimo P, Baccetti N, Pascal M, Oro D (2009) Invasive rats
and seabirds: a review after 2,000 years of an unwanted
coexistence on Mediterranean islands. Biol Invasions
11:1631–1651
Schofield MR, Barker RJ, MacKenzie DI (2009) Flexible hierarchical
mark-recapture modeling for open populations using WinBUGS.
Environ Ecol Stat 16:369–387
Sol D, Lefebvre L (2000) Behavioural flexibility predicts invasion
success in birds introduced to New Zealand. Oikos 90:599–605
Sol D, Timmermans S, Lefebvre L (2002) Behavioural flexibility and
invasion success in birds. Anim Behav 63:495–502
Spencer SR, Cameron GR (1983) Behavioural dominance and its
relationship to habitat patch utilization by the hispid cotton rat
(Sigmodon hispidus). Behav Ecol Sociobiol 13:27–36
Stapp P (2002) Stable isotopes reveal evidence of predation by ship
rats on seabirds on the Shiant Islands, Scotland. J Appl Ecol
39:831–840
Stapp P, Polis GA (2003) Marine resources subsidize insular rodent
populations in the Gulf of California, Mexico. Oecologia
134:496–504
Tobin ME, Sugihara RT, Koehler AE, Ueunten GR (1996) Seasonal
activity and movements of Rattus rattus (Rodentia, Muridae) in a
Hawaiian macadamia orchard. Mammalia 60:3–13
Towns DR, Parrish GR, Westbrooke I (2003) Inferring vulnerability
to introduced predators without experimental demonstration:
case study of Suter’s skink in New Zealand. Conserv Biol
17:1361–1371
Towns D, Atkinson IAE, Daugherty CH (2006) Have the harmful
effects of rats been exaggerated? Biol Invasions 4:863–891
Towns D, Parrish G, Tyrrell CL, Ussher GT, Cree A, Newman DG,
Whittaker TH, Westbrooke I (2007) Responses of tuatara
(Sphenodon punctatus) to removal of introduced pacific rats
from islands conservation biology. Conserv Biol 21:1021–1031
Towns DR, Wardle DA, Mulder CPH, Yeates GW, Fitzgerald BM,
Parrish GR, Bellingham PJ, Bonner KI (2009) Predation of
seabirds by invasive rats: multiple indirect consequences for
invertebrate communities. Oikos 118:420–430
Urton EJM, Hobson KA (2005) Intrapopulation variation in gray wolf
isotope (d15N and d13C) profiles: implications for the ecology of
individuals. Oecologia 145:317–326
Van Aarde RJ, Jackson TP (2007) Food, reproduction and survival in
mice on sub-Antarctic Marion Island. Polar Biol 30:503–511
Popul Ecol (2011) 53:535–548 547
123

Vasquez DP (2005) Exploring the relationship between invasion
success and niche breadth. In: Cadotte MW, McMahon SM,
Fukami T (eds) Conceptual ecology and invasions biology.
Springer, New York, pp 317–332
Vidal V, Medail F, Roche P, Tatoni T, Vidal P (1998) Impact of gull
colonies on the flora of the Riou archipelago (Mediterranean
islands of the south-east France). Biol Conserv 84:235–243
Vila M, D’Antonio CM (1998) Fruit choice and seed dispersal of
invasive vs noninvasive Carpobrotus (Aizoaceae) in coastal
California. Ecology 79:1053–1060
Williamson M (1996) Biological invasions. Chapman & Hall, London
548 Popul Ecol (2011) 53:535–548
123


![0265-0339, Eusebius Caesariensis, De Laudibus Constantini [Schaff], En](https://img.dokumen.tips/doc/110x75/577cd9301a28ab9e78a2f03e/0265-0339-eusebius-caesariensis-de-laudibus-constantini-schaff-en.jpg)