Embed Size (px)
DESCRIPTION
lp
Citation preview

Poster Abstract: Low Battery Communication
Saroj Rajavari, Eirini Petraki, Hou Shu-Yen Uppsala University, Sweden
Abstract
Wireless sensor nodes are some times operate at remote locations with less accessibility. Most of the wireless sensor networks (WSN) operate using 3V coin cell batteries or AAA batteries. The battery voltage is limited resource. To check how performance of WSN depends on the battery voltage level, we conducted experiments to measure how the performance of the sensor nodes in the form of Packet Error Rate (PER) varies for indoor and out door environments for various distances. We also measured the PER at near cutoff voltage of the wireless sensor nodes.
1 Introduction
Each wireless sensor node comprised of microcontroller, sensor, transceiver (Transmitter and receiver ) and battery. WSN's use Time Division Duplex (TDD) protocol to communicate. WSNs are used in so many areas to monitor physical parameters of systems such as heat, pressure, light, humidity and so on. WSN are power constrained devices. So to improve their life time and performance, it is important to know how they perform in various environments, various distances between transmitter and receiver systems, various battery voltage levels of transmitter and receiver devices.
2 Battery power consumption To improve wireless sensor node life time, It is important to use power very sparingly. For example we can control ON time and OFF time of sensor nodes or can increase data rate of communication , which contributes to lower the average current consumption or decrease transmit Radio Frequency (RF) power levels at transmitters.
3 System Design
In this experiments we used Arduino nano [1] board, which has Atmel microcontroller ATmega328[2], Nordic Semiconductor nRF24L01+ [3] 2.4 GHz transceiver. Arduino nano operates with input voltage levels between 7-20 V. The Arduino nano has 5V operating voltage (logic levels). The nRF24L01+ transceiver has operating voltage levels between 3.3-1.7 V. The ATmega328 microcontroller which is present on Arduino nano board has Serial Peripheral Interface (SPI ) [4] protocol interface to communicate with peripherals . The SPI protocol has clock line, data lines, slave select lines. The nRF24L01+ transceiver has built-in SPI interface. To convert Arduino nano logic levels from 5 V to 3 V of nRF24L01+ transceiver , We used Texas Instruments 8-channel Bi-directional logic level converter - TXB0108 [5].
We used three different voltage supplies for nRF24L01+ transceiver to do three different experiments. First, we used 3V power supply available from Arduino board .
Second, We used DC power supply available at lab to provide variable voltage supplies from 3.3-1.5 V. Third, we used 3 V coin cell battery to supply the transceiver.
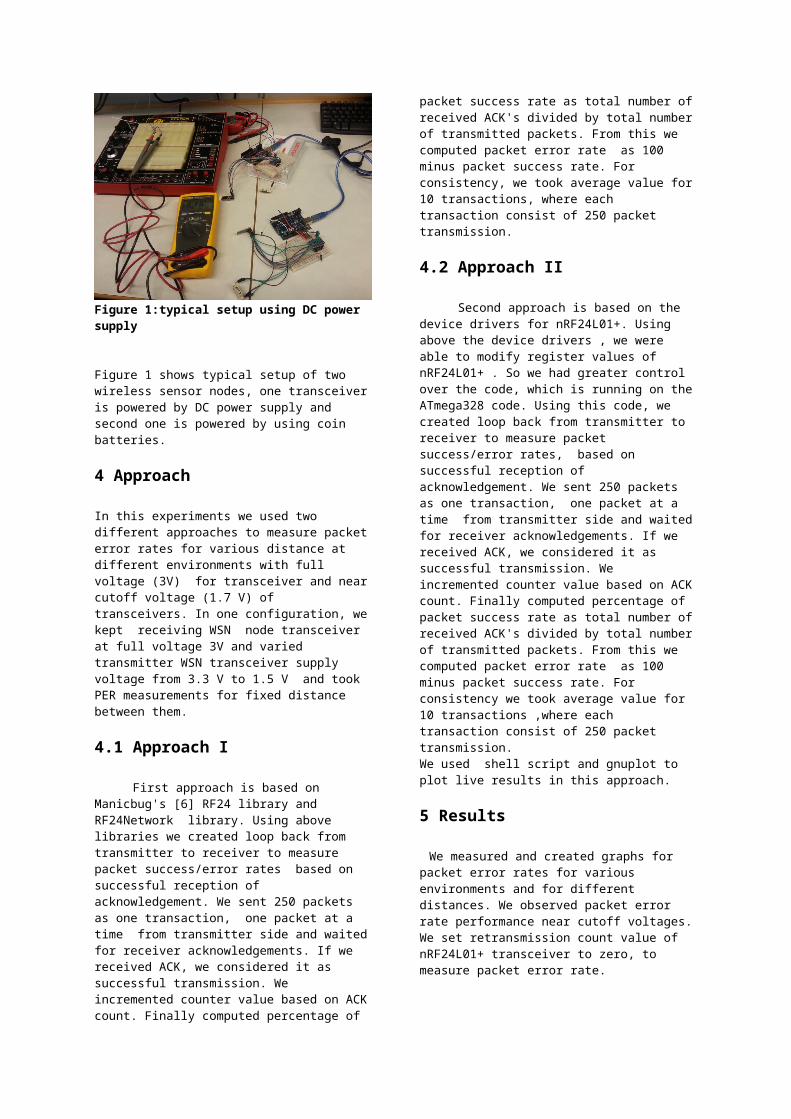
Figure 1:typical setup using DC power supply
Figure 1 shows typical setup of two wireless sensor nodes, one transceiver is powered by DC power supply and second one is powered by using coin batteries.
4 Approach
In this experiments we used two different approaches to measure packet error rates for various distance at different environments with full voltage (3V) for transceiver and near cutoff voltage (1.7 V) of transceivers. In one configuration, we kept receiving WSN node transceiver at full voltage 3V and varied transmitter WSN transceiver supply voltage from 3.3 V to 1.5 V and took PER measurements for fixed distance between them.
4.1 Approach I
First approach is based on Manicbug's [6] RF24 library and RF24Network library. Using above libraries we created loop back from transmitter to receiver to measure packet success/error rates based on successful reception of acknowledgement. We sent 250 packets as one transaction, one packet at a time from transmitter side and waited for receiver acknowledgements. If we received ACK, we considered it as successful transmission. We incremented counter value based on ACK count. Finally computed percentage of packet success rate as total number of received ACK's divided by total number of transmitted packets. From this we computed packet error rate as 100 minus packet success
rate. For consistency, we took average value for 10 transactions, where each transaction consist of 250 packet transmission.
4.2 Approach II
Second approach is based on the device drivers for nRF24L01+. Using above the device drivers , we were able to modify register values of nRF24L01+ . So we had greater control over the code, which is running on the ATmega328 code. Using this code, we created loop back from transmitter to receiver to measure packet success/error rates, based on successful reception of acknowledgement. We sent 250 packets as one transaction, one packet at a time from transmitter side and waited for receiver acknowledgements. If we received ACK, we considered it as successful transmission. We incremented counter value based on ACK count. Finally computed percentage of packet success rate as total number of received ACK's divided by total number of transmitted packets. From this we computed packet error rate as 100 minus packet success rate. For consistency we took average value for 10 transactions ,where each transaction consist of 250 packet transmission. We used shell script and gnuplot to plot live results in this approach.
5 Results
We measured and created graphs for packet error rates for various environments and for different distances. We observed packet error rate performance near cutoff voltages. We set retransmission count value of nRF24L01+ transceiver to zero, to measure packet error rate.
Figure 2 :packet success rates for various distance and environments
In Figure2 it is possible see that by increasing distances the packet success rates decreases, which means packet error rates increases.
Figure 3 : Automated graph with battery level in red (multiplied by 10) and packet success rate in green.
In figure 3, it is possible to see how battery voltage discharges with time and charges after while once load is removed. It is also to possible see how packet success rate goes down with decreasing battery voltage level.
6 Conclusions
We observed packet error rates for various transceiver battery levels, various transmit RF power levels, various environments and various data rates. We observed that greater the distance, greater the packet error rate. At near cutoff voltage levels packet error rates increases rapidly. But it is still possible to have communication link between transmitter and receiver using multiple retransmissions at near cutoff battery voltage. Once voltage levels falls far below the cutoff voltage, then there is no connection exist between transmitter and receiver. Because of both transceivers are switched OFF. The lower RF power levels contributes to more packet error rates, because of Signal to Noise Ratio (SNR) is decreases with decrease in transmit RF power level.
Acknowledgments
We would like to thank our supervisors professor Christian Rohner and professor Uwe Zimmermann for their suggestions, discussions and guidance.
6 References1.http://arduino.cc/en/Main/arduinoBoardNano2.http://www.atmel.com/devices/atmega328.aspx3.http://www.nordicsemi.com/eng/Products/2.4GHz-RF/nRF24L014.http://en.wikipedia.org/wiki/Serial_Peripheral_Interface_Bus5. http://www.ti.com/product/txb01086. https://github.com/maniacbug