Embed Size (px)
Citation preview

Low Bandwidth Offload for Mobile AR
Puneet JainHewlett Packard Labs
Palo Alto, [email protected]
Justin ManweilerIBM Research
Yorktown Heights, [email protected]
Romit Roy ChoudhuryUniversity of Illinois
Urbana-Champaign, [email protected]
ABSTRACTEnvironmental fingerprinting has been proposed as akey enabler to immersive, highly contextualized mobilecomputing applications, especially augmented reality.While fingerprints can be constructed in many domains(e.g., wireless RF, magnetic field, and motion patterns),visual fingerprinting is especially appealing due to theinherent heterogeneity in many indoor spaces. This vi-sual diversity, however, is also its Achilles’ heel – match-ing a unique visual signature against a database of mil-lions requires either impractical computation for a mo-bile device, or to upload large quantities of visual datafor cloud offload. Further, most visual “features” tendto be low entropy – e.g., homogeneous repetitions offloor and ceiling tiles. Our system VisualPrint, proposesa means to offload only the most distinctive visual data,that is, only those visual signatures which stand a goodchance to yield a unique match. VisualPrint enablescloud-offloaded visual fingerprinting with efficacy com-parable to using whole images, but with an order re-duction in network transfer.
Categories and Subject DescriptorsH.3.4 [Information Storage and Retrieval]: Systemsand Software
KeywordsAugmented Reality, Offloading, Bandwidth, Latency
1. INTRODUCTIONReal-time augmented reality (AR) has remained anopen problem in mobile computing. The problem ischallenging because one’s camera preview needs to
Permission to make digital or hard copies of all or part of this work for personalor classroom use is granted without fee provided that copies are not made ordistributed for profit or commercial advantage and that copies bear this noticeand the full citation on the first page. Copyrights for components of this workowned by others than ACM must be honored. Abstracting with credit is per-mitted. To copy otherwise, or republish, to post on servers or to redistribute tolists, requires prior specific permission and/or a fee. Request permissions [email protected].
CoNEXT ’16, December 12-15, 2016, Irvine, CA, USAc© 2016 ACM. ISBN 978-1-4503-4292-6/16/12. . . $15.00
DOI: http://dx.doi.org/10.1145/2999572.2999587
be matched against a pre-existing image database inreal-time. This operation is computationally inten-sive and our smartphones are resource constrained.Therefore, cloud-offloading is considered as an obviousalternative. Not surprising that most research focustoward reducing computation latency. Several designsof faster server-side pipeline [16, 31, 41], light-weightvision algorithms [36], and reducing visual searchspace [22] have been proposed. Despite many at-tempts, substantial drawbacks remain: in deploymentpracticality, in efficacy, or in robustness. Unpredictableend-to-end network latency is one such drawback.Several factors including the distance between thedevice and cloud, network bandwidth and channel,and sheer data quantity contribute to it. While edgecomputing [39], data compression [42], and betterwireless deployment [35] can alleviate this issue tosome extent, due to large volume, have not provensufficient. This paper identifies a unique fingerprintingopportunity to substantially reduce the visual datatransfer, therefore fixing the network latency issue formobile vision applications.
Paris, Louvre, Denon Wing, 1st Floor, Mona Lisa Room
image features
databasefeature {image/
}
Figure 1: User views scene of interest on smart-phone display, image or features shipped to cloudserver, cloud returns with 3D AR location context.
Our solution to network latency lies in the observationthat indoor spaces naturally lend themselves to high vi-sual diversity. Patterns of color in paintings and pho-tographs on walls, stylized light fixtures, corners onfurniture, and even minuscule imperfections in drywall

and baseboards collectively create a unique visual “sig-nature” or “fingerprint” of a particular space. Due to thecombinatorics, it is highly unlikely that any two placeswould have a very similar pattern of visual features.Our goal is to create a lightweight mechanism to extractthese visual fingerprints at scale. As shown in Figure 1,we want to build a lookup service by which it is pos-sible to instantly map a photo to a unique point in thespace; all by using only the essence of the scene – thevisual fingerprint. Importantly, the mechanism must besuch that the fingerprint size is substantially less thanthe corresponding visual data.
Practical Challenges of Cloud OffloadWhile existing approaches for mobile AR might be suf-ficient for identifying a user’s location from a photo-graph, they would quickly become impractical for con-tinuous, real-time use. A stream of images or video im-plies a high sustained bandwidth, especially if we takefull advantage of modern high-resolution smartphonecameras. As shown in Figure 2, at these resolutions,even 10 frames per second (FPS) requires 2 Mbps us-ing state-of-the-art H264 compression. Worse, such lev-els of compression result in an almost unusable reduc-tion in the quantity of extractable keypoints (Figure 3).Thus, we would really need lossless compressed frames,such as PNG – at much higher bitrates. On a cellulardata connection, even LTE, such a stream is at worst in-feasible, or at best, wasteful of the user’s data quota andbattery life, not to mention finite cellular bandwidth.
1 2 4 8 16 32
10−1
100
101
102
Uplink (Mbps)
Av
era
ge
FP
S
H264Lossy Compress (JPEG)Lossless Compress (PNG)RAW
Figure 2: Uplink bandwidth versus sustainableframes per second (FPS), by encoding. Note: log-log scale plot.
It is natural to ask why do mobile AR systems needto process at high frame-rates and why subsamplingframes to reduce bandwidth is not sufficient. One mayargue that people do not move too fast physically, there-fore subsampling should work. However, in mobile ARphysical movement is not necessary – one may scanthe environment by simply moving hands at fast speed.Moreover, subsampling is related to motion blur. [22] inreal-world experiments found majority of frames to beblurred due to motion and shake. Since blurred frames
lack ample visual features, they do not result match onthe server. Therefore, subsampling can delay uploadof a crisp frame for arbitrarily long time and result inperceivable latency on the screen. We discard subsam-pling to make system more responsive. This also avoidsmaking assumption on the way users use an AR system.Finally, we do not infer whether a frame is blurred ornot, because it is non-trivial and adds additional pro-cessing latency on the critical path.
Keypoint Count
CD
F
0 1000 2000 30000
0.1
0.2
0.3
0.4
0.5
0.6
0.7
0.8
0.9
1
JPEG
PNG
Figure 3: CDF of number of SIFT keypoints, PNG ver-sus JPEG compression (same compression ratio asFigure 2). Under compression, SIFT feature extrac-tion efficacy drops substantially. Peak performanceis achieved using lossless compression, such as PNG.
Figure 4: Visualization of SIFT keypoints. For eachkeypoint, center of circle represents location, radiusrepresents detection scale, and line segment repre-sents direction of orientation.
An alternate approach to solve bandwidth issue couldbe to just send the visual features. In computer vision,interesting points such as corners are often referredas keypoint. A keypoint is typically represented using

2D pixel coordinate and a multi-dimensional featuredescription vector. These keypoints can then be usedto identify similarity between the two visual scenes.SIFT [32] is a widely popular algorithm used to detectand describe keypoints. Figure 4 shows a visualizationof SIFT keypoints. However in our case, sending SIFTkeypoints only is also not practical: extracted keypointstypically require at least as much space as the imageitself. Even after heavy GZIP compression, keypointsrequire comparable space for most images, and fivetimes more uncompressed (Figure 5). We envisionan alternative. What if, instead of shipping the entireimage data (or all image keypoints), we ship only thoseparts which define a unique fingerprint?
Ratio (Features Size/Image Size)
CD
F
0 1 2 3 4 5 6 7 8 9 10 11 12 13 14 15 16 17 18 19 200
0.1
0.2
0.3
0.4
0.5
0.6
0.7
0.8
0.9
1
Uncompressed
Compressed (GZIP)
Figure 5: CDF of SIFT feature size (in bytes) ratio toimage size. Even after heavy compression, featuresrequire comparable space to the original image.
VisualPrint: A Uniqueness “Oracle”Imagine waking up in a maze of blank, white walls. It ishard to find your way through, given that each area looksthe same as the one preceding it. Now imagine you havea marker. By drawing a unique symbol on each wall –equivalent to a few bits of information – you could quicklycreate a signature to identify where you are at any time.This paper is about finding those few bits of informationthat naturally occur in real-life environments.
To construct a visual fingerprint, not all parts of an im-age are equally useful. To reduce cloud-offload band-width, we need to distill to only those high-entropybits. This is analogous to delta (difference) encodingfor video compression: all data is thrown away, exceptthe information gain. The challenge here is that theentropy of any pixel cannot be deduced from strictly lo-cal information. For example, imagine an art gallery.The one-of-a-kind paintings are likely to contain goodcandidate, highly-unique keypoints. The corners of acheckerboard floor or the regular pattern of ceiling tilesare less so. Many keypoints could be quickly discarded– for example, if two very similar keypoints appear inthe same image. However, some might be unique in aparticular image, yet common across several. For ex-ample, a door knob or light switch might be unique in
a room, but repeated in every room of a building. Torecognize this global repetition, we need something ofa uniqueness “oracle.”
We want to create a visual lookup mechanism wherebya smartphone app can capture a photograph or streamof video and quickly identify a handful of keypointsthat are highly unique, to define a short fingerprint de-scription. Instead of 2,000 keypoints from a single pho-tograph (not an unusual result from a high-resolutionphoto using SIFT), we wish to capture the same essencein only 200 – an order of magnitude fewer. The appcan then upload this short description (≈ 30KB) of thescene to a cloud service. On that service, we can ap-ply existing techniques of image-based content retrieval(like Google Reverse Image Search or TinEye.com). In-stead of similar images, the service replies with meta-data, an estimate of location and camera pose.
We call our approach VisualPrint. VisualPrint uses onlylocal information (on the smartphone) to leverage aglobal awareness of which visual data is worthwhile(curated on the server and downloaded to the clientin advance). Since this table can be aggressively prob-abilistic – false positives create a minimal performancepenalty – the representation can be extremely compact.Our design ensures that lookups are cheap – constanttime per image keypoint – so we can filter all capturedimage data to only the most essential (the “compact”fingerprint).
In Figure 6, we present our intuition for the opportu-nity. Most of the 128 dimensions of a SIFT descriptorcontain minimal information to differentiate it from allothers. Generally, only a few dimensions are required toisolate a descriptor from its closest neighbor. Locality-sensitive hashing (LSH) is a natural choice to re-projecta minority of valuable dimensions into a more manage-able low-dimensional space – enabling efficient high-dimensional nearest neighbor search.
With feature descriptors distilled using LSH, our keytechnique applies counting Bloom filters to build small,probabilistic lookup tables. These tables (10s of MBs)are downloaded to a user’s device in advance to sum-marize vast quantities of visual data (1000s of MBs). Animage keypoint can be quickly tested against these ta-bles to quantify its uniqueness – how often it appears inother images, globally. Quickly, thousands of keypointscan be sorted according to these uniqueness. The sev-eral (200) most unique are then chosen for matchingon the cloud – others immediately discarded.
Beyond the core intuition, our end-to-end implementedVisualPrint prototype consists of three major systemcomponents: (1) a wardriving app based on GoogleProject Tango [6] using Simultaneous Localizationand Mapping (SLAM) techniques to quickly constructa 3D database of visual features, applicable to indoorenvironments; (2) a cloud storage and compute service

5 10 15 20 25 30 35 40 45 50 55 60 65 70 75 80 85 90 95 100 105 110 115 120 1250
1000
2000
3000
4000
5000
6000
7000
8000
9000
10000
11000
12000
13000D
iffe
re
nc
e
Dimension
0 5 10 15 20 25 30 35 40 45 50 55 60 65 70 75 80 85 90 951001051101151201250
0.1
0.2
0.3
0.4
0.5
0.6
0.7
0.8
0.9
1
Normalized eigenvalues of the covariance matrix
Valu
e
Figure 6: (a) For 500 images, each feature descrip-tor ~A matched to nearest neighbor in the database~B. Boxplots show sort_reversed[( ~A − ~B)2]. Fewdimensions provide most of the Euclidean distancebetween ~A and ~B. (b) Principal component analysis(PCA) confirms this intuition, as only a few PCA di-mensions (far less than 128) are enough to accountfor the majority of covariance.
to curate this database, by identifying the most uniquevisual features, and respond to fingerprint querieswith a location estimate; and (3) a smartphone appto capture photographs and extract visual features,subselect features by estimated uniqueness to a concise“fingerprint,” and perform location lookups on thecloud service.
VisualPrint makes the following contribution:
VisualPrint enables mobile devices to filter visual data byglobal uniqueness — allowing only the most importantbits to be used in a query — and reducing network offloadby an order of magnitude.
2. RELATED WORKVisualPrint builds upon a large body of prior art,especially in the areas of image-based content re-trieval, cloud offload support for mobile systems,visual approaches for localization and mapping, andmulti-sensory indoor localization. Additionally, theVisualPrint approach can enhance several emergingmobile applications beyond localization.
Image-based Retrieval: Image-based content retrievalhas been extensively studied, including considera-tion for resource constraints applicable to mobiledevices. [45] proposes a method to match two uncali-brated stereo images robustly. [13, 32] identify robustfeatures in an image to achieve high accuracy. [9, 37]are binary variants of image features which can be usedto perform faster image matching based on Hammingdistances. While better feature design improvesmatching latency between a pair of images – this isinsufficient to scale to a database of a large size. Ap-proximate matching schemes such as [15, 41] addressthis issue to some extent, but memory and computationoverheads of indexing hinder their applicability toresource-constrained smartphones. Similarly, runningmatching algorithms on GPUs [17] is feasible on aserver but not readily on smartphones. [20, 25] designlocality-sensitive Bloom-filters to address memorylimitations of approximate high-dimensional matching.We extend these approaches for VisualPrint, but in anovel application to identify unique image features.
Cloud Offloading for Mobile Applications: Computationoffloading to a remote server has been used to over-come computational, memory, and energy limitationsof a smartphone [14, 24, 30]. However, real-time of-floaded image processing remains challenging for sev-eral reasons: upload throughput between the phoneand the cloud is often limited (especially over cellu-lar, even LTE uplinks); wireless network latencies be-tween the phone and cloud are unpredictable and cannot guarantee a consistent user experience [27]; andhigh power consumption in continuous uploading de-feats a primary incentive for offloading [22, 26]. Hy-brid architectures leveraging the phone to do some lo-cal computation to (e.g., to pick frames to be uploadedon the cloud) partially address this issue [19]. [39] pro-poses an alternate architecture of bringing computationpower in the proximity of the mobile device.
Visual Simultaneous Localization and Mapping (VS-LAM): VSLAM refers to the problem of simultaneouslyconstructing/updating a map while tracking thelocation of a device, using a camera and other onboardsensors [23]. The Project Tango hardware, used inVisualPrint, is essentially VSLAM put into practice.VSLAM heavily relies on statistical techniques suchas Kalman or particles filter to smooth and correctdead reckoning errors of noisy sensor data. Bundleadjustment [43] is used to generate a 3D modelof the scene, while simultaneously estimating andcorrecting optical parameters of the camera. Later,image registration [33] and inertial tracking is used tofind an instantaneous localization of the device [38].VSLAM is implicitly applied in VisualPrint, throughour reliance on Google Tango during the initial 3Dwardriving phase.

Indoor Localization in Other Domains: WiFi and iner-tial sensing have been applied for indoor localization[11, 44]. Our approach to visual fingerprinting is com-plementary to, and can be further enhanced by, theseworks: location context can be used to reduce imagesearch on the server. However, this context is not ubiq-uitously available. Thus, we do not assume such a loca-tion service, to the benefit of generalizability.
Applications: Crowdsourced video is rising in impor-tance, as evident in the popularity of Youtube, Periscope[8], and Meerkat [7]. Several applications built atopdemand real-time understanding of location context inthe video streams [2], as can be provided by Visual-Print. Image-derived location context can also immedi-ately benefit applications for augmented reality [3, 5],mobile object recognition [1], movable-camera surveil-lance [4], life-logging [18], sports video analytics [21],mood-sensing [29], and reaction sensing [12]. We be-lieve that VisualPrint can be productively applied toeach of these domains.
3. SYSTEM DESIGNFigure 7 illustrates VisualPrint’s simplified systemarchitecture, consisting of three major components:(1) a client app for commodity off-the-shelf Androidsmartphones, providing visual fingerprinting andlocalization; (2) a cloud server module, providingvisual fingerprint pre-processing and fingerprint-to-location lookup services; and (3) a wardriving app forGoogle Tango app, to populate the server with visualfingerprint data, each time a new building is added tothe database.
The smartphone client “app” is really a proof of con-cept. It exists only to demonstrate and test the Visual-Print client library, which could be easily incorporatedinto any Android app requiring fingerprinting and/orlocalization services. Or, it might be plausibly incor-porated as a cross-app system-level service – enablingcamera-based localization applicable indoors when GPSis untenable.
When the library loads the first time, it contacts the Vi-sualPrint cloud service to download up-to-date feature-uniqueness tables (to be refreshed periodically). Theseare structured as a set of counting Bloom filters, in-dexed using locality-sensitive hashing. In the next sub-section, we describe this in details.
Uniqueness “Oracle” ConstructionPrimer – Bloom Filters: A Bloom filter is a probabilisticdata structure, designed for efficient (constant time andmemory) set membership queries. That is, one can lookfor the presence of a particular (exact) element: rangeor nearest-neighbor queries are not supported. There issome uncertainty to a lookup, hence considered prob-abilistic. The filter can determine that an element iseither definitely not in the set or may be in the set.
Bloom filters are typically implemented using a fixed-size bit vector. To insert, an element is hashed multi-ple times using a non-cryptographic hash (typically, ahash is selected for execution speed over cryptographicguarantees, such as Murmur-3). The hash output istaken modulo the size of the bit vector as an index –setting these positions to true. To test set membership,the query element is simply hashed again and the cor-responding bits are checked. If all the hashed bits setto true, the element is probabilistically assumed to bepresent. If a single hashed bit is set to false, the elementis definitely not present.
A counting Bloom filter is a variant that maintains coun-ters (rather than binary bit flips), enabling accumula-tion for multiple occurrences of an element. VisualPrintleverages counting Bloom filter with a low saturationpoint (beyond which additional insertions of the samevalue have no effect). Once saturated for a particu-lar feature, we can be confident that the correspondingkeypoint is fairly common, not useful to our purpose.
Primer – Locality Sensitive Hashing (LSH): LSH tech-niques widely apply to efficient searching in a high di-mensional dataset. The intuition is to reduce dimen-sions of the data in such a way that similar items mapto similar or nearby buckets with high-probability. As-suming the number of buckets is much smaller com-pared to the original data, an efficient nearest-neighborlookup can be performed. For VisualPrint, we wish toenable an efficient lookup mechanism of image descrip-tors. The closeness of two descriptors is measured bythe Euclidean distance between them. Due to this re-quirement, from a variety of LSH variants, E2LSH [10]is most natural for VisualPrint.
E2LSH belongs to a family of random projection-basedLSH schemes. Specifically, a point to be indexed is pro-jected randomly on several hyperplanes. The expec-tation is that for two nearby points, most projectionswill also yield nearby scalar values for each. Therefore,once discretized, most nearby points will be indexedto the same LSH “bucket.” What distinguishes E2LSHfrom related schemes is in how it selects coefficients toeach of the random projection hyperplanes. Critically, ithas been shown that when one constructs hyperplaneswith coefficients drawn as random samples of a p-stabledistribution [15], the projection values preserve the Lp
norm. Thus, under a 2-stable distribution, the L2 norm– the metric of Euclidean distances – is preserved. TheGaussian distribution is 2-stable, and thus an appro-priate choice. Hence, E2LSH (under Gaussian coef-ficient selection) supports nearest neighbor lookup byEuclidean distance, appropriate for SIFT keypoints.
Locality-Sensitive Bloom FiltersVisualPrint blends the advantages of LSH and Bloom fil-ters. LSH enables imprecise queries based on Euclideandistances; Bloom filters provide a compact representa-

Selected Keypoints
Querying Locality Sensitive Bloom Filters
KeypointExtraction
Video Frames
ICPKeypoint to (X, Y, Z) Mapping
Selected Keypoints to Database Matching
Largest Cluster
3D-Indoor Location
Spatial Clustering
Advanced Triangulation
Z
XY
Depth Sensing
Camera
Area Learning
Camera Rotation/Translation
Depth Map
RGB Image
Project Tango Wardriving App
Android Client App
KeypointExtraction
Server Module (Cloud)
Locality Sensitive Hashing
Locality Sensitive Bloom Filters
To be pushed on the phoneOffline Processing
Online Processing
Bloom filters downloaded from the server
Feature Database
Figure 7: System overview. Top left: wardriving-app based on Google Tango. The output of wardriving appconsists of 2D image keypoints with corresponding 3D metadata. Top right: server processes wardriven im-age 2D/3D data and constructs concise representation in the form of locality-sensitive bloom filters. Bottomleft: phone (client) app captures video frames, extracts keypoints, identifies a subset of highly-unique key-points, and queries to server. Bottom right: server processes and infers 3D location from a client query (2D,comprised of several highly-unique keypoints).
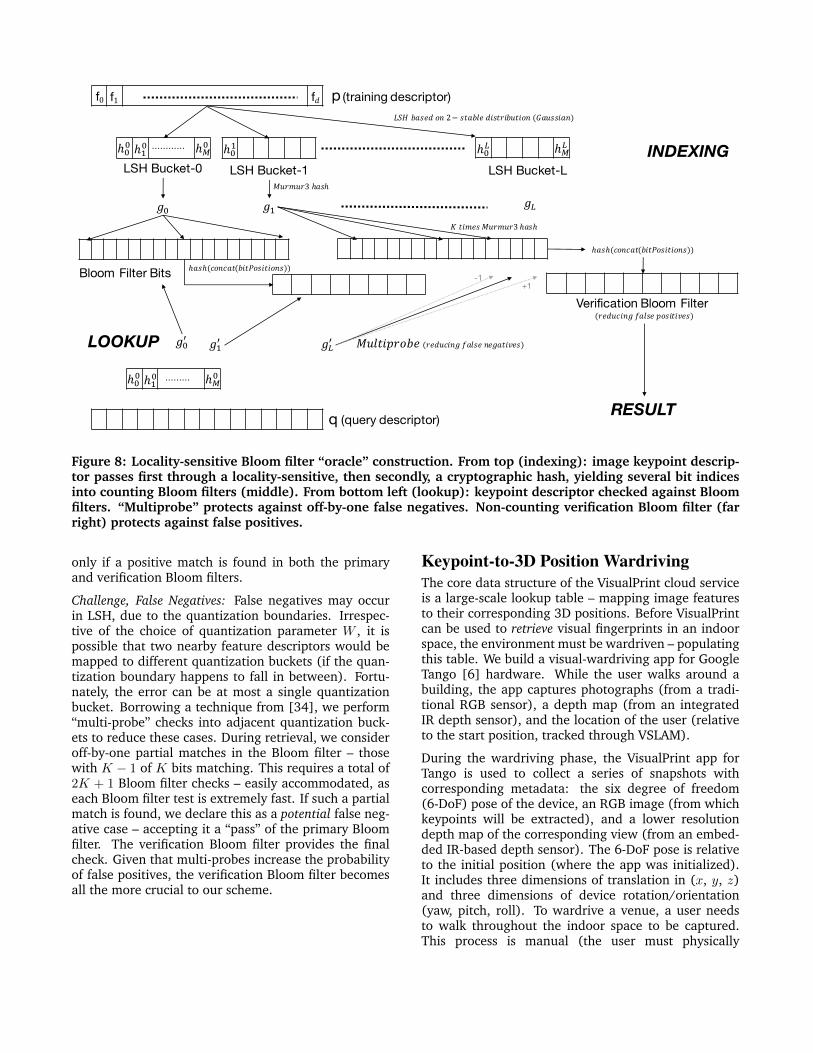
tion. Figure 8 illustrates our locality-sensitive Bloomfilter construction. From top to bottom, we begin witha single keypoint descriptor. A SIFT descriptor exists in128-dimensional space (each dimension being a one-byte integer value). The first step is to take M ran-dom projections of the 128-dimension descriptor. Eachsingular projection yields a single scalar value, with Mprojections yielding a M -dimensional vector. Each pro-jection is quantized into a discrete space based on widthparameterW . We construct L suchM -dimensional vec-tors to create L LSH “buckets.” Each of the M × Lrandomly-chosen projections is held constant for thelife of the data structure. For each of the L buckets, weapply one of L cryptographic hash functions gi from thesame family (Murmur-3) on the M -dimensional vec-tor. The hash output provides K indices into a count-ing Bloom filter (K for each of the L LSH buckets).For each index, we increase the corresponding count byone. Each bit index counter is represented in 10 bits, fora count saturation (maximum count that can be repre-sented) of 1024. Beyond 1024, we treat a keypoint asnot unique enough for consideration. We empiricallyoptimize the various parameters to LSH and Bloom fil-ters from a generic image keypoint dataset: L = 10,M = 7, W = 500, and K = 8.
Challenge, False Positives: Three sources of false posi-tives exist in our scheme: (1) Bloom filters, (2) LSH,
and (3) the interplay of Bloom filters and LSH. Theprobability of Bloom filter false positive is tunable –trading off memory consumption. We tune Bloom fil-ters to support up to 2.5M unique feature vectors withless than 1% false positives. LSH false positives are mit-igated through empirical tuning of L, M , and W . Aftertuning, we observe few false positives from LSH alone.However, the interplay of LSH and Bloom is more prob-lematic. The primary cause is due to the quantizationof features (as tuned using LSH parameter W ). Quan-tization must be coarse enough to capture similarityof two nearby feature descriptors. However, when Wis selected to be more coarse, there are fewer unique“bins.” Thus, the Bloom filter is used less uniformly –bits are only flipped to represent this smaller number ofbins. After many insertions, “hotspots” in the Bloom fil-ter may result. We address these in two ways. First, wechoose a relatively higher saturation point for countingBloom filters: we use 10 bits per Bloom filter index, forsaturation at 1024, when fewer would otherwise be re-quired. Secondly, we leverage an established techniquefrom prior art – a verification Bloom filter. For each in-sertion to a primary Bloom filter, a second insertion isperformed into the verification Bloom filter. However,instead of hashing the original data, we hash the bitpositions of the insertions to the primary Bloom filter.During the query, a positive result is returned if and
(training descriptor)f0 f1 f𝑑 p𝐿𝑆𝐻 𝑏𝑎𝑠𝑒𝑑 𝑜𝑛 2− 𝑠𝑡𝑎𝑏𝑙𝑒 𝑑𝑖𝑠𝑡𝑟𝑖𝑏𝑢𝑡𝑖𝑜𝑛 (𝐺𝑎𝑢𝑠𝑠𝑖𝑎𝑛)
LSH Bucket-0ℎ99 ℎ:9 ℎ;9………… ℎ9: ℎ9< ℎ;<
LSH Bucket-L
𝑔9 𝑔: 𝑔<𝑀𝑢𝑟𝑚𝑢𝑟3 ℎ𝑎𝑠ℎ
Bloom Filter Bits
(query descriptor)q
LOOKUP 𝑔9A 𝑔:A 𝑔<A 𝑀𝑢𝑙𝑡𝑖𝑝𝑟𝑜𝑏𝑒 (𝑟𝑒𝑑𝑢𝑐𝑖𝑛𝑔 𝑓𝑎𝑙𝑠𝑒 𝑛𝑒𝑔𝑎𝑡𝑖𝑣𝑒𝑠)
Verification Bloom Filter (𝑟𝑒𝑑𝑢𝑐𝑖𝑛𝑔 𝑓𝑎𝑙𝑠𝑒 𝑝𝑜𝑠𝑖𝑡𝑖𝑣𝑒𝑠)
ℎ𝑎𝑠ℎ(𝑐𝑜𝑛𝑐𝑎𝑡(𝑏𝑖𝑡𝑃𝑜𝑠𝑖𝑡𝑖𝑜𝑛𝑠))
RESULT
𝐾 𝑡𝑖𝑚𝑒𝑠 𝑀𝑢𝑟𝑚𝑢𝑟3 ℎ𝑎𝑠ℎ
ℎ𝑎𝑠ℎ(𝑐𝑜𝑛𝑐𝑎𝑡(𝑏𝑖𝑡𝑃𝑜𝑠𝑖𝑡𝑖𝑜𝑛𝑠))
INDEXING
ℎ99 ℎ:9 ℎ;9………
LSH Bucket-1
+1-1
Figure 8: Locality-sensitive Bloom filter “oracle” construction. From top (indexing): image keypoint descrip-tor passes first through a locality-sensitive, then secondly, a cryptographic hash, yielding several bit indicesinto counting Bloom filters (middle). From bottom left (lookup): keypoint descriptor checked against Bloomfilters. “Multiprobe” protects against off-by-one false negatives. Non-counting verification Bloom filter (farright) protects against false positives.
only if a positive match is found in both the primaryand verification Bloom filters.
Challenge, False Negatives: False negatives may occurin LSH, due to the quantization boundaries. Irrespec-tive of the choice of quantization parameter W , it ispossible that two nearby feature descriptors would bemapped to different quantization buckets (if the quan-tization boundary happens to fall in between). Fortu-nately, the error can be at most a single quantizationbucket. Borrowing a technique from [34], we perform“multi-probe” checks into adjacent quantization buck-ets to reduce these cases. During retrieval, we consideroff-by-one partial matches in the Bloom filter – thosewith K − 1 of K bits matching. This requires a total of2K + 1 Bloom filter checks – easily accommodated, aseach Bloom filter test is extremely fast. If such a partialmatch is found, we declare this as a potential false neg-ative case – accepting it a “pass” of the primary Bloomfilter. The verification Bloom filter provides the finalcheck. Given that multi-probes increase the probabilityof false positives, the verification Bloom filter becomesall the more crucial to our scheme.
Keypoint-to-3D Position WardrivingThe core data structure of the VisualPrint cloud serviceis a large-scale lookup table – mapping image featuresto their corresponding 3D positions. Before VisualPrintcan be used to retrieve visual fingerprints in an indoorspace, the environment must be wardriven – populatingthis table. We build a visual-wardriving app for GoogleTango [6] hardware. While the user walks around abuilding, the app captures photographs (from a tradi-tional RGB sensor), a depth map (from an integratedIR depth sensor), and the location of the user (relativeto the start position, tracked through VSLAM).
During the wardriving phase, the VisualPrint app forTango is used to collect a series of snapshots withcorresponding metadata: the six degree of freedom(6-DoF) pose of the device, an RGB image (from whichkeypoints will be extracted), and a lower resolutiondepth map of the corresponding view (from an embed-ded IR-based depth sensor). The 6-DoF pose is relativeto the initial position (where the app was initialized).It includes three dimensions of translation in (x, y, z)and three dimensions of device rotation/orientation(yaw, pitch, roll). To wardrive a venue, a user needsto walk throughout the indoor space to be captured.This process is manual (the user must physically

walk), but could be automated using area-coveringrobots like Roomba. During collection, the Tangoapp pushes images, depth context, and positioningmetadata to the VisualPrint cloud service. As describedin the next subsection, the VisualPrint cloud servicepre-processes this data to establish mappings betweenunique image keypoints and their corresponding 3Dlocations. The number of such mappings in a buildingcan be exceedingly large from hundreds of thousandsto millions.
Figure 9: Tango connected with phone using double-backed tape and foam board.
The Tango prototype does not immediately provideall of the required data for VisualPrint. Practicallimitations, due to Tango’s unpolished beta status,complicate our implementation. Principally, whenleveraging Tango visual-SLAM and depth mappingfunctionality, all visual sensing hardware is locked,and cannot be otherwise accessed by third party Tango(a form of Android) apps. We leverage area learningand depth perception to achieve an understanding ofwhere a depth map exists in relation to others in thesame indoor space. Unfortunately, Tango blocks accessto the RGB camera when using these services. So, itis less straightforward to map a 3D depth estimate,projected into a shared indoor space via area learning,to a portion of an RGB image frame. Note that muchof Tango exists in closed source, so we were not ableto circumvent the hardware protections. While it ispossible to grab the RGB screen buffer, this is too lowresolution for our needs. Instead, we used a low-techworkaround: we taped a second Android device tothe back of our Tango and created a simple networkAPI to synchronously grab image frames in concertwith Tango-recorded depth maps (see Figure 9). Ofcourse, limited RGB access is not fundamental, and weexpect this shortcoming to be addressed in the future.Figure 10 shows how we merge Tango-acquired depthdata into RGB.
Challenge, Positioning Error and Uniqueness: Unfortu-nately, but unsurprisingly, there are inaccuracies inTango’s visual-SLAM positioning. As the user walksaround, location estimates naturally reflect someamount of drift from true positions. While small
Figure 10: Tango RGB+depth: (a) original RGB im-age; (b) heat map of depth from observer, red isfarther away.
amounts of positioning error might not cause undueharm to many potential Tango applications, for Visu-alPrint, this can be problematic. If two photographsappear to be of different objects (due to erroneouslocation estimates), truly-unique keypoints may appearto be repeated – a false negative for our uniquenesstracking. We resolve this issue by post-processingTango’s depth map output – a 3D point cloud. Weapply iterative closest point (ICP) heuristics to mergeTango 3D depth maps (from separate snapshots) intoa single coherent point cloud for the entire indoorspace. Only from this converged, comprehensive depthmap we can be sure that two keypoints reflect trulyindependent locations. This post processing also hasa secondary advantage of reducing some error in ourlocation estimates.
Cloud Processing and 3D PositioningVisualPrint cloud service accepts keypoint-to-3D posi-tion mappings from the Tango wardriving app. As theyare received, the service updates two data structures:(1) the keypoint-to-3D position lookup tables and (2)LSH-indexed Boom filters for keypoint uniqueness.
The lookup table is really a large-scale image-basedcontent retrieval table, as one might apply for reverseimage search. For our prototype, we apply standardLSH. Rather than a reference to an image or othercontent, the LSH table stores the 3D position of thekeypoint. The service accepts queries to this table inthe form of keypoint-plus-2D coordinate pairs (the x, ycoordinate of the keypoint in the camera frame). Theservice performs an LSH lookup on each keypoint toretrieve its 3D position. It then applies a localizationstep, described next, and returns the estimated clientlocation and pose.
The second data structure, the LSH-indexed Bloom fil-ter, is the same exact data structure downloaded byVisualPrint clients as the uniqueness oracle. As newkeypoint-to-3D mapping arrives at the VisualPrint cloudservice, we simply perform an LSH lookup followedby insertion to the primary and verification Bloom fil-ters. With this simple design, new keypoint-to-locationmappings can be incorporated continuously, in constanttime and memory.
VisualPrint Application: LocalizationFor each client localization query, the cloud service re-trieves the 3D position associated with each image key-point. This is a straightforward query to a standardLSH-indexed lookup table. However, the retrieved 3Dpositions are only the first step towards localizing theclient user. When combined with the 2D data of howthe 3D position is perceived by the client device, it ispossible to infer the clients 6-DoF camera pose, includ-ing translation (x, y, z) and orientation (yaw, pitch,roll). In the final effect, we achieve a similar position-ing fidelity as Google Tango, but with only a standard,2D, RGB camera. Unlike several approaches in priorart [28, 40, 44], VisualPrint achieves instantaneous lo-calization – continuous tracking not required.
From a single image I, a client queries VisualPrint witha set of keypoints K. From the LSH-indexed lookup ta-ble, VisualPrint finds |K| · n nearest-neighbor matches(since there is uncertainty in the match), and accord-ingly |K| · n 3D points. On these points, VisualPrintapplies spatial clustering to filter down to only those3D points in the largest cluster P , discarding others.K ′ ⊆ K keypoints remain, for |P | 3D points, where|K ′| ≤ |P | ≤ |K ′| · n. For each 3D point p ∈ P , there isa single corresponding keypoint kp ∈ K ′. We also knowthat k has a corresponding 2D pixel coordinate (xp, yp)in the original client query image I.
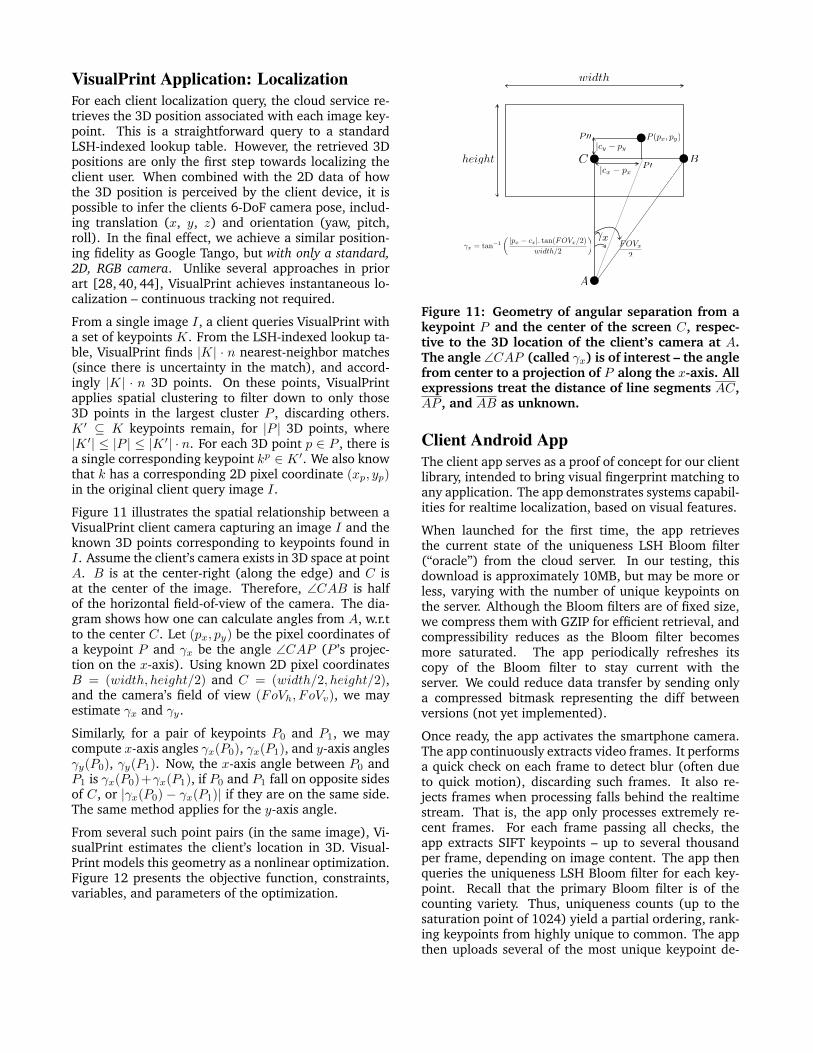
Figure 11 illustrates the spatial relationship between aVisualPrint client camera capturing an image I and theknown 3D points corresponding to keypoints found inI. Assume the client’s camera exists in 3D space at pointA. B is at the center-right (along the edge) and C isat the center of the image. Therefore, ∠CAB is halfof the horizontal field-of-view of the camera. The dia-gram shows how one can calculate angles from A, w.r.tto the center C. Let (px, py) be the pixel coordinates ofa keypoint P and γx be the angle ∠CAP (P ’s projec-tion on the x-axis). Using known 2D pixel coordinatesB = (width, height/2) and C = (width/2, height/2),and the camera’s field of view (FoVh, FoVv), we mayestimate γx and γy.
Similarly, for a pair of keypoints P0 and P1, we maycompute x-axis angles γx(P0), γx(P1), and y-axis anglesγy(P0), γy(P1). Now, the x-axis angle between P0 andP1 is γx(P0)+γx(P1), if P0 and P1 fall on opposite sidesof C, or |γx(P0) − γx(P1)| if they are on the same side.The same method applies for the y-axis angle.
From several such point pairs (in the same image), Vi-sualPrint estimates the client’s location in 3D. Visual-Print models this geometry as a nonlinear optimization.Figure 12 presents the objective function, constraints,variables, and parameters of the optimization.
�x = tan�1
✓ |px � cx|. tan(FOVx/2)
width/2
◆�xFOVx
2
A
BC|cx � px|
|cy � py|
width
heightP 0
P 00 P (px, py)
Figure 11: Geometry of angular separation from akeypoint P and the center of the screen C, respec-tive to the 3D location of the client’s camera at A.The angle ∠CAP (called γx) is of interest – the anglefrom center to a projection of P along the x-axis. Allexpressions treat the distance of line segments AC,AP , and AB as unknown.
Client Android AppThe client app serves as a proof of concept for our clientlibrary, intended to bring visual fingerprint matching toany application. The app demonstrates systems capabil-ities for realtime localization, based on visual features.
When launched for the first time, the app retrievesthe current state of the uniqueness LSH Bloom filter(“oracle”) from the cloud server. In our testing, thisdownload is approximately 10MB, but may be more orless, varying with the number of unique keypoints onthe server. Although the Bloom filters are of fixed size,we compress them with GZIP for efficient retrieval, andcompressibility reduces as the Bloom filter becomesmore saturated. The app periodically refreshes itscopy of the Bloom filter to stay current with theserver. We could reduce data transfer by sending onlya compressed bitmask representing the diff betweenversions (not yet implemented).
Once ready, the app activates the smartphone camera.The app continuously extracts video frames. It performsa quick check on each frame to detect blur (often dueto quick motion), discarding such frames. It also re-jects frames when processing falls behind the realtimestream. That is, the app only processes extremely re-cent frames. For each frame passing all checks, theapp extracts SIFT keypoints – up to several thousandper frame, depending on image content. The app thenqueries the uniqueness LSH Bloom filter for each key-point. Recall that the primary Bloom filter is of thecounting variety. Thus, uniqueness counts (up to thesaturation point of 1024) yield a partial ordering, rank-ing keypoints from highly unique to common. The appthen uploads several of the most unique keypoint de-

Minimize∑
∀i<j∈1...K
Exij + Ey
ij
Subject toγxij = γ(pxi , Cx, Fh,W )− γ(pxj , Cx, Fh,W )
γyij = γ(pyi , Cy, Fv, H)− γ(pyj , Cy, Fv, H)
cos(γxij + Ex
ij) =d(x, z, xi, zi) + d(x, z, xj , zj)− d(xi, zi, xj , zj)
2√d(x, z, xi, zi)
√d(x, z, xj , zj)
cos(γyij + Ey
ij) =d(y, z, yi, zi) + d(y, z, yj , zj)− d(yi, zi, yj , zj)
2√d(y, z, yi, zi)
√d((y, z, yj , zj)
γ(p, C, F, S) = tan−1
(|p− C|. tan(F/2)
S/2
)d(x1, y1, x2, y2) = (x1 − x2)2 + (y1 − y2)2
Solving for∀i < j ∈ 1 . . .K : x, y, z, Ex
ij , Eyij
With parameters∀i < j ∈ 1 . . .K : pxi , p
yi , p
xj , p
yj , xi, yi, zi, xj , yj , zj
Left Side Interpretationi, j Keypoint indices, i < j.γxij Angle from keypoint i to j,
projected on the x-axis.cos(γx
ij + Exij) Geometric constraint derived
from law of cosines.γ(p, C, F, S) Angle from client at A to
keypoint, as a function ofpixel location, image center,field of view, and side length(width or height).
d(x1, y1, x2, y2) Square of Euclidean distance(x1, y1)↔ (x2, y2).
(x, y, z) Optimized 3D coordinate ofclient (position A).
Exij + Ey
ij Minimized angular error be-tween keypoints i, j.
(xi, yi, zi) Known 3D position of i.(pxi , p
yi ) Viewed 2D position of i.
Figure 12: Nonlinear optimization to estimate client camera position (x, y, z), as labeled “A” in the geometryshown by Figure 11. The optimization objective finds x, y, z where perceived angles γxi,j (on the X/Z plane)and γyi,j (Y/Z plane) between any keypoint pair i, j are most consistent with their corresponding known 3Dlocations at xi, yi, zi, xj , yj , zj . The objective minimizes summed residual error for all keypoint pairs.
scriptors (experiments with 200 and 500 are presentedin the next section).
Upon receiving these unique keypoint descriptors, thecloud service performs the keypoint-to-3D client local-ization, returning the 3D camera pose estimate to theclient. The app then displays the estimate on screen.
4. EVALUATIONOur evaluation considers these research questions:
1. How does VisualPrint’s accuracy compare with otherimage/keypoint matching schemes? In particular,we compare VisualPrint to a BruteForce Euclideandistance match (implemented on GPU), a tradi-tional LSH implementation (as would be typical ofa large-scale reverse image search), and Randomwhere we uniformly subsample image keypoints.
2. Are client-side overheads acceptable? How does Vi-sualPrint reduce data upload compared to con-ventional cloud offload? Memory? Computation?and Energy?
3. How effective is VisualPrint in enabling our exampleapplication: client localization?
Matching AccuracyWe photographed 100 non-overlapping scenes acrossthe three floors of our research facility, the CoordinatedScience Lab (CSL). Each CSL floor is 50m × 10m indimension. We captured each scene with a single im-age. We also capture 400 additional distractor images.
These images consist of ceiling, floor, name-plates, fur-niture, etc. in the building. Since these images natu-rally contain repeated patterns, they are likely to haverepeated visual features as well. For each of the 500 im-ages, we use OpenCV’s default SIFT implementation toextract features. Across these 500 images, the databasecontains a total of ≈2.5M feature descriptors (each de-scriptor is 128 bytes).
The query database consists of five additionalphotographs of each scene in the database. Wesystematically captured these five photograph fromsubstantially different angles. As SIFT matching effi-cacy degrades substantially with angular separation,these diverse angles are intended to challenge allmatching schemes.
The average number of features per query image was3,500. From these keypoints, we evaluate VisualPrintacross five different system regimes. Random picks 500random keypoints from the query image and uploadsthem to the server for matching. Random can be un-derstood as lower-bound on VisualPrint’s performance(one with no intelligence in feature subselection). ForVisualPrint-200 and VisualPrint-500, our complete sys-tem selects the 200 and 500 most unique keypoints. LSHapplies the reference E2LSH locality-sensitive hash-ing implementation for nearest-neighbor search. Brute-Force finds the “optimal” nearest neighbor match. Notethat unlike Random and VisualPrint-200/500, LSH andBruteForce use all image keypoints. Note that whileit may be tempting to consider BruteForce an upper

bound on accuracy, it can be misled by homogeneouskeypoints across images.
Metrics: Let Y be the set of all processed query frames.Let V ⊂ Y be the set of frames containing scene k. LetP ⊂ Y be the set of frames identified by our systemas capturing k. Then, V \ P denotes our system’s falsenegative predictions, P \ V denotes false positive pre-dictions, and Y \ V denotes the set of frames which donot contain scene k. We evaluate VisualPrint’s predictionefficacy by the following metrics of information retrieval:
Precisionk = |V ∩ P |/|P |i.e., among all frames that VisualPrint identifies ascapturing scene k, what fraction truly captures k.
Recallk |V ∩ P |/|V |i.e., among all frames that truly have cap-ture scene k, what fraction was identified byVisualPrint.
Precision
CD
F
0 0.1 0.2 0.3 0.4 0.5 0.6 0.7 0.8 0.9 10
0.1
0.2
0.3
0.4
0.5
0.6
0.7
0.8
0.9
1
Random−500
VisualPrint−200
VisualPrint−500
LSH
BruteForce
Recall
CD
F
0 0.1 0.2 0.3 0.4 0.5 0.6 0.7 0.8 0.9 10
0.1
0.2
0.3
0.4
0.5
0.6
0.7
0.8
0.9
1
Random−500
VisualPrint−200
VisualPrint−500
LSH
BruteForce
Figure 13: For precision/recall, our goal was for Vi-sualPrint to be roughly comparable with a Brute-Force approach — true gains are measured in sub-stantial network transfer savings. Incidentally, Vi-sualPrint’s precision improves slightly over LSHand BruteForce, as VisualPrint automatically elimi-nates useless, distracting non-unique keypoints (ho-mogeneous repetitions can lead to false positivematches). Recall suffers slightly against Brute-Force (some additional false negatives due to somediscarded-but-useful keypoints), but still surpassesLSH (the most realistic server-side comparison) andrandom keypoint subselection (strawman baseline).
Figure 13 presents CDF of (a) precision and (b) recallresults. The precision and recall values are calculatedper scene using the above definition. For example,50% of the test scenes achieve precision > 58% andrecall > 61% incase of VisualPrint-200. Unsurpris-ingly, Random performs poorly in both precision andrecall. The results for BruteForce are more nuanced.BruteForce precision is poor, likely due to confusionamong homogeneous keypoints. BruteForce recall ismost favorable, likely some valuable keypoints aremissed by VisualPrint, or it is able to differentiateeven among homogeneous keypoints based on theirrelative quantities (the entire distribution is scored inthe BruteForce heuristic). LSH performs comparablyto VisualPrint-200, but is inferior to VisualPrint-500 –likely due to the same confusion-under-homogeneityafflicting BruteForce. Note that sole purpose of theprecision and recall results is to make sure thatVisualPrint does not compromise accuracy to gainbandwidth savings.
Client Overheads
Time (seconds)0 5 10 15 20 25 30 35 40 45 50 55 60 65 70
Data
Sen
t (M
B)
0.05
0.1
0.2
0.5
1
2
5
10
20
304050
Frame UploadVisualPrint
Figure 14: Cumulative data upload by executiontime. VisualPrint reduces data consumption byat least one order of magnitude compared to rawframes (sending all raw keypoints would be morethan frames, as shown in Figure 5).
Data Upload Savings: Figure 14 compares uploaddata for VisualPrint versus whole frame upload. Notethat, as shown in Figure 5, uploading keypoints (evencompressed) does not save any upload bandwidthsince their size is comparable (often more) to that ofthe original frame.
Client Storage and Memory Overhead: Figure 15 com-pares the client-side storage/memory footprints of Ran-dom, VisualPrint, LSH, and BruteForce. Random requireseffectively no memory (there is no index). VisualPrinthas a substantial memory footprint, due to the Bloomfilters. LSH has an extremely large memory footprint,much larger than the input data, due to multiple repli-cations supporting multiple projections. BruteForce hasa memory footprint comparable to the database size –here this is implemented on GPU as a SIMD matching

(CPU matching would be nonsensical due to extreme la-tency). It would be possible to reduce BruteForce mem-ory footprint by loading the database in parts, but witha trade-off of excessive loading latency, rather than aone-time cost.
ApproachRandom-500
VisualPrint
LSH
BruteForce
Mem
ory
Co
nsu
mp
tio
n (
MB
)
10-1
100
101
102
103
104
Disk SpaceIn-memory Space
Figure 15: Client disk/memory consumption. Visu-alPrint uses substantially less memory than conven-tional LSH, which caches the entire image database.VisualPrint requires somewhat more memory thanrandom keypoint subselection to maintain Bloomfilters in memory. BruteForce memory consumptionreflects loading all database keypoints into memoryfor a GPU SIMD parallel execution.
Latency (second)
CD
F
0 0.5 1 1.5 2 2.5 3 3.5 4 4.5 5 5.5 6 6.5 7 7.5 8 8.5 9 9.5 100
0.1
0.2
0.3
0.4
0.5
0.6
0.7
0.8
0.9
1
VisualPrint MatchingSIFT (920x540)
Figure 16: Computational overheads on Galaxy S6.VisualPrint requires an order of magnitude lesscomputation than SIFT feature extraction. Ampleroom for end-to-end improvement by running SIFTon GPU or a coprocessor.
Client Computational Latency: Figure 16 presents a CDFof VisualPrint computational latency, as compared toSIFT feature extraction. Principally, VisualPrint latencyis due to the LSH Bloom filter lookups for each keypointdescriptor, plus sorting. SIFT delay dominates over Vi-sualPrint computation overhead.
Energy: All non-energy experiments were performed onthe latest-generation Samsung Galaxy S6 phone. How-ever, as the battery compartment of the S6 is not re-movable, we revert to the prior generation S5 phone for
energy measurements (only). The measurement setupis shown in Figure 17. We use a Monsoon power mon-itor to measure the average power consumption of thephone. No additional applications apart from Visual-Print and required background services were runningduring the experiment. The phone was put on airplanemode to avoid cellular communications and WiFi wasturned on for VisualPrint tests (only). As energy con-sumption is impacted by the number of extracted key-points, lighting conditions and scene were kept sameacross all schemes. See Figure 18.
Figure 17: Experimental setup for energy measure-ment. Monsoon power meter provides current toGalaxy S5 phone in place of battery. Measurementat 5,000 Hz.
Time (seconds)
Av
era
ge
Po
we
r (w
att
)
0 5 10 15 20 25 30 35 40 45 50 55 60 65 700
1
2
3
4
5
6
DisplayAndroid CameraVisualPrint (only computation)VisualPrint (only upload)VisualPrint (computation+upload)
Figure 18: Energy. Including display and camera,complete VisualPrint ≈ 6.5 W. Not shown: whole-frame cloud offload ≈ 4.9 W. Energy consumptionof our current prototype is unacceptable but av-enues for substantial improvement exist. SIFT andBloom filter operations can be highly-parallelizedusing GPU. When using GPU, the processor is oc-cupied for short time, can lead to significant energysavings [36].
LocalizationWe test VisualPrint’s localization performance in threeindoor environments: an office space, employee cafe-teria, and grocery store. The office environment con-sisted of similar looking cubicles, a kitchen area, andlounge. In the office, we wardrive a rectangular space

of approximate dimensions 50m × 20m. The cafeteriaconsists of many identical chairs and tables, food menuboards, foodservice and checkout counters, and regis-ters in a 50m × 15m room. The grocery store (80m× 50m) had standard aisle based layout, filled withhousehold items.
During wardriving, the Tango was mounted with aphone (Galaxy Note 3) as shown in Figure 9. Duringquery phase, a different phone (Galaxy S6) was usedto take photographs, in arbitrary orientations. Weuse Tango to collect a “ground-truth” reference tocompare query results. Wardriving and query datawere collected along similar routes.
Figure 19 shows cumulative localization errors. Fig-ure 20 isolates those errors to X, Y , and, Z directions.While localization is generally quite accurate, some fail-ure cases do occur. We believe that most cases of sub-standard performance may be attributed to suboptimal-ity at local minima (we solve the localization optimiza-tion using a time-bounded differential evolution).
Error (meters)
CD
F
0 0.5 1 1.5 2 2.5 3 3.5 4 4.5 5 5.5 6 6.5 7 7.5 80
0.1
0.2
0.3
0.4
0.5
0.6
0.7
0.8
0.9
1
Grocery StoreCafeteriaOffice Space
Figure 19: CDF of 3D localization error. Graphshows 3D distance from “ground truth” (as esti-mated from Google Tango), to VisualPrint’s estimateon Galaxy S6.
X Y Z
0
0.5
1
1.5
2
2.5
3
3.5
4
Err
or
(mete
rs)
Dimension
Grocery StoreCafeteriaOffice Space
Figure 20: Localization accuracy by dimension. Lo-calization on the horizontal X/Y plane (parallel tofloor and ceiling) is more accurate than vertically(changes in elevation). This is expected, as thewardriving motion is also along the X/Y plane.
Evaluation TakeawaysThe key findings of our evaluation are as follows:
1. VisualPrint precision and recall are roughly com-parable to LSH, the parent scheme on which it isbased (Figure 13).
2. VisualPrint requires 1/10th bandwidth of whole
frame uploads, only 51.2 KB oppose to 523 KB(Figure 14).
3. Based on our 2.5M descriptor database, the Visu-alPrint client uses 10.5 MB disk space for Bloomfilters, stored compressed – 1/124th of the serverside LSH indices compressed (1.3 GB).
4. Based on our 2.5M descriptor database, the Vi-sualPrint client requires 162 MB in RAM uncom-pressed – 1/58
th of the LSH indices uncompressed(9.4 GB), cached in RAM by the server.
5. Client compute latency consists of SIFT extraction(3300 ms at median) and Bloom filter lookups(217 ms at median) for a total median computelatency of 3547 ms, dominated by SIFT (Figure16). However, using [36], upto 7x latencyreduction is possible by running SIFT extractionon a mobile GPU or a coprocessor.
6. Client energy consumption is substantial (6.5W), principally due to camera and local com-putation, especially SIFT feature extraction(Figure 18). Again, using [36], upto 87% of theSIFT computation energy can be saved.
7. Results show VisualPrint has a median 3D local-ization error of 2.5 m (Figure 19).
5. LIMITATIONS AND DISCUSSIONSeveral practical limitations are apparent from ourevaluation of VisualPrint. Principally, SIFT keypointextraction incurs substantial compute overhead,yielding a large energy impact. Secondly, any visualfingerprinting scheme will incur a large energy cost,simply from turning on the camera. Fundamentally,VisualPrint could never be energy-competitive withlighter-weight sensory approaches.
VisualPrint should also not be taken as a replacement fortraditional localization schemes. Rather it is an attemptto leverage visual data when it is anyways available(i.e., the camera is already turned on). Due to its vi-sual nature, VisualPrint cannot always return preciseuser location. It can fail due to: (1) a lack of ample fea-tures in the query image, such as hallway with whitewalls; (2) insufficient wardriving – the environment ata location may not be well fingerprinted, causing imagematching to fail; (3) false positives in keypoint match-ing – some environmental repetition might not be cap-tured during wardriving; and (4) dead reckoning er-rors during wardriving – Tango uses IR depth sensing

and IMU to track user location, which are prone to er-rors (especially, in environments with natural sunlightor electromagnetic machinery).
From a cursory look, VisualPrint appears to be SIFTspecific; mostly due to the techniques based on LSHand Bloom filter. However, this is not a fundamen-tal systems limitation. Keypoint detection and descrip-tion are two separate stages in computer vision. Onecan use any keypoint detection algorithm (e.g., SURF[13]) with another integer keypoint description algo-rithm without modification in the system pipeline. Inthe cases where floating point descriptors are desired,one can scale floating point descriptor elements to theintegers by multiplying with an order of required deci-mal precision.
6. CONCLUSIONEnvironmental fingerprint is a powerful primitive formobile vision and augmented reality applications.However, the identification of visual fingerprintsis challenging from a perspective of data storage,indexing, and retrieval. Cloud offload presents anobvious-if-challenging solution. VisualPrint enablesselective cloud offload of only those visual fingerprintsthat carry the greatest global entropy – those thatare highly unique, particular to the user’s true loca-tion. Beyond visual fingerprints, we believe that theVisualPrint approach can be productively reappliedin other high-dimensional sensory domains, such aswireless RF, auditory, and hyperspectral signatures. Weconsider these in our ongoing research.
7. ACKNOWLEDGMENTSWe sincerely thank our many volunteers, Dr. GaneshAnanthanarayanan our shepherd, as well the anony-mous reviewers for their invaluable feedback. We arealso grateful to Intel, Google, and NSF for partiallyfunding this research through the grant NSF 1430064.
8. REFERENCES[1] Amazon fire phone. https://developer.amazon.
com/public/solutions/devices/fire-phone.[2] Dextro stream. https://www.dextro.co/.[3] Microsoft hololens.
https://www.microsoft.com/microsoft-hololens/en-us.
[4] Nest cam.https://nest.com/camera/meet-nest-cam/.
[5] Oculus vr. https://www.oculus.com/en-us/.[6] Project tango.
https://www.google.com/atap/projecttango/.[7] Meerkat: Live stream video.
http://meerkatapp.co/.[8] Periscope: Explore the world through someone
else’s eyes. https://www.periscope.tv/.
[9] P. F. Alcantarilla, A. Bartoli, and A. J. Davison.Kaze features. In ECCV. Springer, 2012.
[10] A. Andoni and P. Indyk. E2lsh: Exact euclideanlocality-sensitive hashing, 2004.
[11] P. Bahl and V. N. Padmanabhan. Radar: Anin-building rf-based user location and trackingsystem. In INFOCOM. IEEE, 2000.
[12] X. Bao, S. Fan, A. Varshavsky, K. Li, andR. Roy Choudhury. Your reactions suggest youliked the movie: Automatic content rating viareaction sensing. In UbiComp. ACM, 2013.
[13] H. Bay, A. Ess, T. Tuytelaars, and L. Van Gool.Speeded-up robust features (surf). Computervision and image understanding, 110(3):346–359,2008.
[14] E. Cuervo, A. Balasubramanian, D.-k. Cho,A. Wolman, S. Saroiu, R. Chandra, and P. Bahl.Maui: making smartphones last longer with codeoffload. In MobiSys. ACM, 2010.
[15] M. Datar, N. Immorlica, P. Indyk, and V. S.Mirrokni. Locality-sensitive hashing schemebased on p-stable distributions. In Proceedings ofthe twentieth annual symposium onComputational geometry. ACM, 2004.
[16] J. Fung and S. Mann. Openvidia: parallel gpucomputer vision. In MM. ACM, 2005.
[17] M. Gong and Y.-H. Yang. Near real-time reliablestereo matching using programmable graphicshardware. In CVPR. IEEE, 2005.
[18] S. Hodges, L. Williams, E. Berry, S. Izadi,J. Srinivasan, A. Butler, G. Smyth, N. Kapur, andK. Wood. Sensecam: A retrospective memory aid.In UbiComp. Springer, 2006.
[19] W. Hu, B. Amos, Z. Chen, K. Ha, W. Richter,P. Pillai, B. Gilbert, J. Harkes, andM. Satyanarayanan. The case for offload shaping.In HotMobile. ACM, 2015.
[20] Y. Hua, B. Xiao, B. Veeravalli, and D. Feng.Locality-sensitive bloom filter for approximatemembership query. Computers, IEEE Transactionson, 61(6):817–830, 2012.
[21] P. Jain, J. Manweiler, A. Acharya, and K. Beaty.Focus: clustering crowdsourced videos byline-of-sight. In SenSys, page 8. ACM, 2013.
[22] P. Jain, J. Manweiler, and R. Roy Choudhury.Overlay: Practical mobile augmented reality. InMobiSys. ACM, 2015.
[23] N. Karlsson, E. Di Bernardo, J. Ostrowski,L. Goncalves, P. Pirjanian, and M. E. Munich. Thevslam algorithm for robust localization andmapping. In ICRA. IEEE, 2005.
[24] R. Kemp, N. Palmer, T. Kielmann, and H. Bal.Cuckoo: a computation offloading framework forsmartphones. In Mobile Computing, Applications,and Services. Springer, 2012.

[25] A. Kirsch and M. Mitzenmacher.Distance-sensitive bloom filters. In ALENEX,volume 6. SIAM, 2006.
[26] K. Kumar and Y.-H. Lu. Cloud computing formobile users: Can offloading computation saveenergy? Computer, (4):51–56, 2010.
[27] K. Lee, J. Lee, Y. Yi, I. Rhee, and S. Chong.Mobile data offloading: how much can wifideliver? In CoNext, page 26. ACM, 2010.
[28] L. Li, P. Hu, C. Peng, G. Shen, and F. Zhao.Epsilon: A visible light based positioning system.In NSDI. USENIX Association, 2014.
[29] R. LiKamWa, Y. Liu, N. D. Lane, and L. Zhong.Moodscope: Building a mood sensor fromsmartphone usage patterns. In MobiSys. ACM,2013.
[30] R. LiKamWa, B. Priyantha, M. Philipose,L. Zhong, and P. Bahl. Energy characterizationand optimization of image sensing towardcontinuous mobile vision. In MobiSys. ACM,2013.
[31] Y. Lin, F. Lv, S. Zhu, M. Yang, T. Cour, K. Yu,L. Cao, and T. Huang. Large-scale imageclassification: fast feature extraction and svmtraining. In CVPR. IEEE, 2011.
[32] D. G. Lowe. Object recognition from localscale-invariant features. In ICCV, volume 2. Ieee,1999.
[33] B. D. Lucas, T. Kanade, et al. An iterative imageregistration technique with an application tostereo vision. In IJCAI, volume 81, 1981.
[34] Q. Lv, W. Josephson, Z. Wang, M. Charikar, andK. Li. Multi-probe lsh: efficient indexing forhigh-dimensional similarity search. In VLDB.VLDB Endowment, 2007.
[35] G. Papagiannakis, G. Singh, andN. Magnenat-Thalmann. A survey of mobile andwireless technologies for augmented realitysystems. Computer Animation and Virtual Worlds,2008.
[36] B. Rister, G. Wang, M. Wu, and J. R. Cavallaro. Afast and efficient sift detector using the mobilegpu. In ICASSP. IEEE, 2013.
[37] E. Rublee, V. Rabaud, K. Konolige, andG. Bradski. Orb: an efficient alternative to sift orsurf. In ICCV. IEEE, 2011.
[38] T. Sattler, B. Leibe, and L. Kobbelt. Fastimage-based localization using direct 2d-to-3dmatching. In ICCV. IEEE, 2011.
[39] M. Satyanarayanan, P. Bahl, R. Caceres, andN. Davies. The case for vm-based cloudlets inmobile computing. Pervasive Computing, IEEE,8(4):14–23, 2009.
[40] S. Sen, J. Lee, K.-H. Kim, and P. Congdon.Avoiding multipath to revive inbuilding wifilocalization. In MobiSys. ACM, 2013.
[41] C. Silpa-Anan and R. Hartley. Optimised kd-treesfor fast image descriptor matching. In CVPR.IEEE, 2008.
[42] G. Takacs, V. Chandrasekhar, N. Gelfand,Y. Xiong, W.-C. Chen, T. Bismpigiannis,R. Grzeszczuk, K. Pulli, and B. Girod. Outdoorsaugmented reality on mobile phone usingloxel-based visual feature organization. In ICMR.ACM, 2008.
[43] B. Triggs, P. F. McLauchlan, R. I. Hartley, andA. W. Fitzgibbon. Bundle adjustment a modernsynthesis. In Vision algorithms: theory andpractice. Springer, 2000.
[44] H. Wang, S. Sen, A. Elgohary, M. Farid,M. Youssef, and R. R. Choudhury. No need towar-drive: unsupervised indoor localization. InMobiSys. ACM, 2012.
[45] Z. Zhang, R. Deriche, O. Faugeras, and Q.-T.Luong. A robust technique for matching twouncalibrated images through the recovery of theunknown epipolar geometry. Artificialintelligence, 78(1):87–119, 1995.


![Cellular Offload[1]](https://img.dokumen.tips/doc/110x75/577cd7ee1a28ab9e78a002b1/cellular-offload1.jpg)


