Embed Size (px)
Citation preview

NOAA National Centers for Environmental Information | State Summaries 149-LA
LOUISIANAKey MessagesLouisiana has exhibited little overall warming in surface temperatures over the 20th century. However, under a higher emissions pathway, historically unprecedented warming is projected by the end of the 21st century.
Hurricanes strike Louisiana an average of once every three years. As the climate continues to warm, hurricane-associated rainfall rates are projected to increase. The resulting flooding caused by these storms is of particular concern for the state.
A large portion of Louisiana’s coastline is extremely vulnerable to sea level rise due to coastal subsidence and low elevation in the southern portion of the state. Projected sea level rise poses widespread and continuing threats to coastal communities.
Louisiana is located on the coast of the Gulf of Mexico and on the southern end of the vast, relatively flat plains of central North America, which extend from the Arctic Circle to the Gulf of Mexico. The state is therefore exposed to the influences of diverse air masses, including the warm, moist air over the Gulf of Mexico as well as dry continental air masses, which are cold in the winter and warm in the summer. Relatively short, mild winters, hot summers, and year-round precipitation characterize Louisiana’s climate. The Gulf of Mexico helps to moderate the climate in the southern portion of the state, while temperatures and precipitation are more variable in the north.
Louisiana has exhibited little overall warming in surface temperatures over the 20th century (Figure 1). Temperatures were hottest in the early 20th century, followed by a substantial cooling of almost 2°F from the 1950s to the 1970s. Temperatures have risen since that cool period by about 2°F, such that the most recent one to two decades have been about as warm as early 20th century levels, with 14 of the 16 years since 2000 being above average. Because of the large cooling that occurred in the middle of the 20th century, the southeastern United
Observed and Projected Temperature Change
Figure 1: Observed and projected changes (compared to the 1901–1960 average) in near-surface air temperature for Louisiana. Observed data are for 1900–2014. Projected changes for 2006–2100 are from global climate models for two possible futures: one in which greenhouse gas emissions continue to increase (higher emissions) and another in which greenhouse gas emissions increase at a slower rate (lower emissions)1. Temperatures in Louisiana (orange line) have risen little since the beginning of the 20th century. Shading indicates the range of annual temperatures from the set of models. Observed temperatures are generally within the envelope of model simulations of the historical period (gray shading). Historically unprecedented warming is projected during the 21st century. Less warming is expected under
a lower emissions future (the coldest years being about as warm as the hottest year in the historical record; green shading) and more warming under a higher emissions future (the hottest years being about 10°F warmer than the hottest year in the historical record; red shading). Source: CICS-NC and NOAA NCEI.
1Technical details on models and projections are provided in an appendix, available online at: https://statesummaries.ncics.org/la.
1900 1925 1950 1975 2000 2025 2050 2075 2100Year
−4
−2
0
2
4
6
8
10
12
14
Tem
pera
ture
Cha
nge
(°F)
Observed and Projected Temperature Change
ObservationsModeled HistoricalHigher EmissionsLower Emissions
Louisiana
High
erEm
ission
sLo
wer
Emiss
ions

LOUISIANA | 2
NOAA National Centers for Environmental Information | State Summaries
States is one of the few regions globally that has not experienced overall warming since 1900, while the United States as whole as warmed by about 1.5°F. The United States as a whole also cooled from the 1930s into the 1960s, but not by nearly as much as Louisiana. Potential causes for this difference in warming rates have been the subject of research, but this phenomenon
has not been fully explained. In Louisiana, the number of very hot days (maximum temperature above 95°F) was above the long-term average in the early 20th century. In the 1960s and 1970s, there was a period of a much below average number of occurrences of very hot days. In recent years, the number of very hot days has begun to increase, approaching the long-term average
Figure 2: The observed (a) number of very hot days (maximum temperature above 95°F), (b) number of days below freezing (maximum temperature below 32°F), (c) spring and fall precipitation, and (d) extreme precipitation (precipitation greater than 4 inches), averaged over 5-year periods. The values in Figures 2a, 2b, and 2d are averages from long-term reporting stations, 13 for temperature and 16 for precipitation. The values in Figure 2c are from NCEI’s version 2 climate division dataset. The number of very hot days and days below freezing during the most recent 5-year period (2010–2014) have been similar to the long-term average. Seasonal precipitation is highly variable from year to year and between seasons, with the period of 2000–2004 having the wettest falls on record, while the spring experienced below average precipitation. The number of extreme precipitation events in the most recent 10-year period (2005–2014) has been near to below average. Source: CICS-NC and NOAA NCEI.
10
15
20
25
30
35
40
4519
00–0
4
1910
–14
1920
–24
1930
–34
1940
–44
1950
–54
1960
–64
1970
–74
1980
–84
1990
–94
2000
–04
2010
–14
Num
ber o
f Day
sw
ith M
axim
um T
empe
ratu
re A
bove
95°
F
5-year Period
Observed Number of Very Hot Days
Louisiana
Observed Number of Very Hot Daysa)
0.0
0.2
0.4
0.6
0.8
1.0
1.2
1.4
1.6
1.8
1900
–04
1910
–14
1920
–24
1930
–34
1940
–44
1950
–54
1960
–64
1970
–74
1980
–84
1990
–94
2000
–04
2010
–14
Num
ber o
f Day
sw
ith M
axim
um T
empe
ratu
re B
elow
32°
F
5-year Period
Observed Number of Days Below Freezing
Louisiana
b) Observed Number of Days Below Freezing
6
8
10
12
14
16
18
20
1895
–99
1905
–09
1915
–19
1925
–29
1935
–39
1945
–49
1955
–59
1965
–69
1975
–79
1985
–89
1995
–99
2005
–09
Tota
l Fal
l Pre
cipi
tatio
n (in
ches
)
5-year Period
Observed Fall Precipitation
Louisiana
10
11
12
13
14
15
16
17
18
19
1895
–99
1905
–09
1915
–19
1925
–29
1935
–39
1945
–49
1955
–59
1965
–69
1975
–79
1985
–89
1995
–99
2005
–09
Tota
l Spr
ing
Prec
ipita
tion
(inch
es)
5-year Period
Observed Spring Precipitation
Louisiana
c) Observed Spring Precipitation Observed Fall Precipitation
0.0
0.2
0.4
0.6
0.8
1.0
1.2
1900
–04
1910
–14
1920
–24
1930
–34
1940
–44
1950
–54
1960
–64
1970
–74
1980
–84
1990
–94
2000
–04
2010
–14
Num
ber o
f Eve
nts
with
Pre
cipi
tatio
n G
reat
er T
han
4 In
ches
5-year Period
Observed Number of Extreme Precipitation Events
Louisiana
d) Observed Number of Extreme Precipitation Events

LOUISIANA | 3
NOAA National Centers for Environmental Information | State Summaries
(Figure 2a). By contrast, the number of very warm nights (minimum temperature above 75°F) has risen substantially (Figure 3) to record high levels in the most recent 5-year period of 2010–2014. The number of days below freezing (days with maximum temperature below 32°F) has also displayed large variability over the past century with no long-term trend (Figure 2b). Historical observed extreme temperatures for the state range from 114°F at Plain Dealing (August 10, 1936), to −16°F at Minden (February 13,1899).
The state receives abundant precipitation throughout the year. Annual precipitation ranges from around 50 inches in the north to around 70 inches at some locations in the southeast. Statewide annual precipitation has ranged from a low of 36.6 inches in 1924 to a high of 79.48 inches in 1991. The driest multi-year periods are the early 1900’s, late 1930s, and early 1950s, and the wettest multi-year periods were the late 1940s and 1990s (Figure 4). Annual precipitation has ranged from about 50 inches during the driest 5-year period on record (1914–1918) to about 65 inches during the wettest 5-year period on record (1989–1993). While precipitation has generally been above average for the last 40 years, the last 10 years have been drier than normal. This is particularly evident in the spring, while fall seasons have been wetter (Figure 2c). There is no trend in the number of extreme precipitation events (Figure 2d). Louisiana averages more than 60 days with thunderstorms annually, the 2nd highest state after Florida. Severe thunderstorms occur most frequently in the late winter and early spring months, and these storms can produce tornadoes. Snowfall is rare near the Gulf of Mexico but can occur occasionally in the north when polar air masses enter the state.
A direct hurricane strike on the coast occurs about once every three years and the Louisiana coast is particularly vulnerable to severe flooding from these storms (Figure 5). In 2005, Hurricane Katrina (a Category 3 storm at landfall) caused massive damage from heavy precipitation and storm surge flooding in the eastern part of the state. New Orleans was particularly hard hit, with more than 80% of the city flooded and some areas under as much as 15 feet of water. Hurricane Katrina caused more than 1,500 fatalities in the state and immense amounts of property damage. A month later,
Hurricane Rita (a Category 3 storm at landfall) struck the southwestern portion of Louisiana. Rita produced rains of 5 to 9 inches and caused a 15-foot storm surge along the southwestern coast. In New Orleans, the storm caused an 8-foot storm surge, which breeched provisionally repaired levees and caused additional flooding in the area
0
5
10
15
20
25
30
35
1900
–04
1910
–14
1920
–24
1930
–34
1940
–44
1950
–54
1960
–64
1970
–74
1980
–84
1990
–94
2000
–04
2010
–14
Num
ber o
f Day
sw
ith M
inim
um T
empe
ratu
re A
bove
75°
F
5-year Period
Observed Number of Very Warm Nights
Louisiana
Observed Number of Very Warm Nights
Figure 3: The observed number of very warm nights (annual number of days with minimum temperature above 75°F) for 1900–2014, averaged over 5-year periods; these values are averages from 13 long-term reporting stations. Louisiana has experienced a substantial increase in the frequency of very warm nights over the past two decades. During the most recent 5-year period (2010–2014), the number of such nights has been double the long-term average. The dark horizontal line is the long-term average of 15 days per year. Source: CICS-NC and NOAA NCEI.
50
52
54
56
58
60
62
64
66
1895
–99
1905
–09
1915
–19
1925
–29
1935
–39
1945
–49
1955
–59
1965
–69
1975
–79
1985
–89
1995
–99
2005
–09
Tota
l Ann
ual P
reci
pita
tion
(inch
es)
5-year Period
Observed Annual Precipitation
Louisiana
Observed Annual Precipitation
Figure 4: The observed annual precipitation across Louisiana for 1895–2014, averaged over 5-year periods; these values are averages from NCEI’s version 2 climate division dataset. Louisiana receives abundant precipitation throughout the year. The most recent 10-year period (2005–2014) has been drier than average. The dark horizontal line is the long-term average of about 56.9 inches per year. Source: CICS-NC and NOAA NCEI.
LOUISIANA | 4
NOAA National Centers for Environmental Information | State Summaries
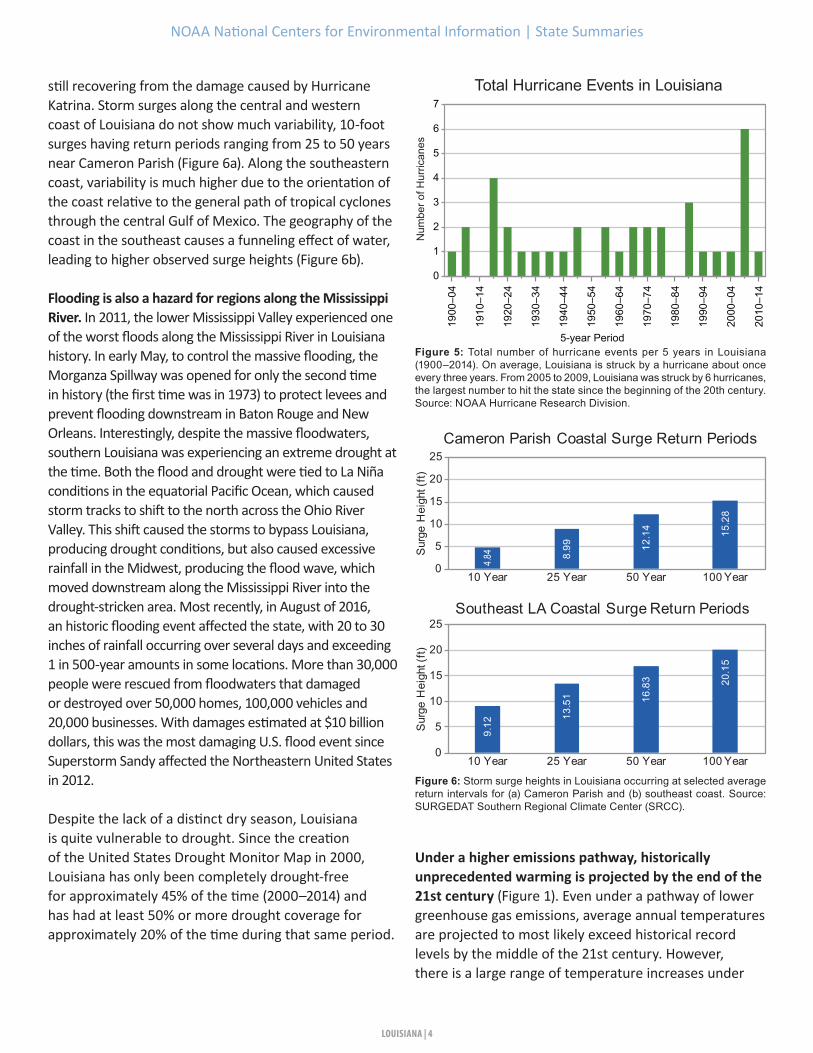
still recovering from the damage caused by Hurricane Katrina. Storm surges along the central and western coast of Louisiana do not show much variability, 10-foot surges having return periods ranging from 25 to 50 years near Cameron Parish (Figure 6a). Along the southeastern coast, variability is much higher due to the orientation of the coast relative to the general path of tropical cyclones through the central Gulf of Mexico. The geography of the coast in the southeast causes a funneling effect of water, leading to higher observed surge heights (Figure 6b).
Flooding is also a hazard for regions along the Mississippi River. In 2011, the lower Mississippi Valley experienced one of the worst floods along the Mississippi River in Louisiana history. In early May, to control the massive flooding, the Morganza Spillway was opened for only the second time in history (the first time was in 1973) to protect levees and prevent flooding downstream in Baton Rouge and New Orleans. Interestingly, despite the massive floodwaters, southern Louisiana was experiencing an extreme drought at the time. Both the flood and drought were tied to La Niña conditions in the equatorial Pacific Ocean, which caused storm tracks to shift to the north across the Ohio River Valley. This shift caused the storms to bypass Louisiana, producing drought conditions, but also caused excessive rainfall in the Midwest, producing the flood wave, which moved downstream along the Mississippi River into the drought-stricken area. Most recently, in August of 2016, an historic flooding event affected the state, with 20 to 30 inches of rainfall occurring over several days and exceeding 1 in 500-year amounts in some locations. More than 30,000 people were rescued from floodwaters that damaged or destroyed over 50,000 homes, 100,000 vehicles and 20,000 businesses. With damages estimated at $10 billion dollars, this was the most damaging U.S. flood event since Superstorm Sandy affected the Northeastern United States in 2012.
Despite the lack of a distinct dry season, Louisiana is quite vulnerable to drought. Since the creation of the United States Drought Monitor Map in 2000, Louisiana has only been completely drought-free for approximately 45% of the time (2000–2014) and has had at least 50% or more drought coverage for approximately 20% of the time during that same period.
Under a higher emissions pathway, historically unprecedented warming is projected by the end of the 21st century (Figure 1). Even under a pathway of lower greenhouse gas emissions, average annual temperatures are projected to most likely exceed historical record levels by the middle of the 21st century. However, there is a large range of temperature increases under
0
1
2
3
4
5
6
7
1900
–04
1910
–14
1920
–24
1930
–34
1940
–44
1950
–54
1960
–64
1970
–74
1980
–84
1990
–94
2000
–04
2010
–14
5-year Period
Total Hurricane Events in Louisiana
Num
ber o
f Hur
rican
es
Total Hurricane Events in Louisiana
Figure 5: Total number of hurricane events per 5 years in Louisiana (1900–2014). On average, Louisiana is struck by a hurricane about once every three years. From 2005 to 2009, Louisiana was struck by 6 hurricanes, the largest number to hit the state since the beginning of the 20th century. Source: NOAA Hurricane Research Division.
4.84 8.99 12
.14 15
.28
0
5
10
15
20
25
10 Year 25 Year 50 Year 100 Year
Sur
ge H
eigh
t (ft)
Cameron Parish Coastal Surge Return Periods
9.12
13.5
1 16.8
3 20.1
5
0
5
10
15
20
25
10 Year 25 Year 50 Year 100 Year
Sur
ge H
eigh
t (ft)
Southeast LA Coastal Surge Return Periods
Figure 6: Storm surge heights in Louisiana occurring at selected average return intervals for (a) Cameron Parish and (b) southeast coast. Source: SURGEDAT Southern Regional Climate Center (SRCC).

LOUISIANA | 5
NOAA National Centers for Environmental Information | State Summaries
WWW.NCEI.NOAA.GOV | HTTPS://STATESUMMARIES.NCICS.ORG/LA | LEAD AUTHORS: REBEKAH FRANKSON, KENNETH E. KUNKEL | CONTRIBUTORS: SARAH CHAMPION
both pathways, and under the lower pathway, a few projections are only slightly warmer than historical records. Since the 1970s, Louisiana temperatures have generally been within the range, but on the low end, of model-simulated temperatures. Continuation of the post-1980 warming trend would lead to an approximate additional warming of 1°F by 2050 and 2–3°F by 2100. In this case, the future warming would be on the low end of the model-simulated increases. However, under a high emissions scenario the future rate of warming is projected to increase, potentially leading to considerably larger temperature increases. Any overall warming will lead to increasing heat wave intensity but decreasing cold wave intensity.
Summer precipitation is projected to decrease, although the projected decreases are smaller than natural variations (Figure 7). Even if average precipitation remains the same, higher temperatures will increase the rate of loss soil moisture during dry periods, which could increase the intensity of naturally-occurring droughts.
Increasing global temperatures raise concerns for sea level rise in coastal areas. Since 1880, sea level has risen by about 8 inches globally. It is projected to rise another 1 to 4 feet by 2100 as a result of both past and future emissions from human activities (Figure 8). Sea level rise has caused an increase in tidal floods associated with nuisance-level impacts. Nuisance floods are events in which water levels exceed the local threshold (set by NOAA’s National Weather Service) for minor impacts. These events can damage infrastructure, cause road closures, and overwhelm storm drains. Nuisance flooding has increased in all U.S. coastal areas, with more rapid increases along the East and Gulf Coasts. Nuisance flooding events in Louisiana are likely to occur more frequently as global and local sea levels continue to rise. Louisiana is at extreme risk for sea level rise due to its low elevation, which averages only 3 feet above sea level in the southeastern part of the state. Additionally, the coastline is rapidly sinking due to subsidence (settling of the soil over time), which has already caused the state to lose almost 2,000 square miles of land since the 1930s. Due to subsidence, sea level rise at some locations is more than 4 times the global rate. The New Orleans metropolitan area, the most populous in the
Projected Change in Summer PrecipitationProjected Change in Summer Precipitation
Change in Summer Precipitation (%)
<−20 −15 −10 −5 0 5 10 >15Figure 7: Projected change in summer precipitation (%) for the middle of the 21st century relative to the late 20th century under a higher emissions pathway. Hatching represents areas where the majority of climate models indicate a statistically significant change. Summer precipitation is projected to decrease throughout Louisiana. However, these changes are small relative to the natural variability in this region. Source: CICS-NC, NOAA NCEI, and NEMAC.
Past and Projected Changes in Global Sea Level
Figure 8: Estimated, observed, and possible future amounts of global sea level rise from 1800 to 2100, relative to the year 2000. The orange line at right shows the most likely range of 1 to 4 feet by 2100 based on an assessment of scientific studies, which falls within a larger possible range of 0.66 feet to 6.6 feet. Source: Melillo et al. 2014 and Parris et al. 2012.
state, is at particular risk for sea level rise impacts. Sea level rise will present major challenges to Louisiana’s existing coastal water management system and could cause extensive economic damage through ecosystem damage and losses in property, tourism, and agriculture.