Embed Size (px)
Citation preview

LOUISIANA CRUDE OIL REFINERY SURVEY REPORT
Twentieth Edition
2014 Survey
Department of Natural Resources Thomas Harris
Secretary of Natural Resources
Prepared by Manuel Lam, Senior Energy Analyst
Technology Assessment Division
P.O. Box 94396 Baton Rouge, LA 70804-9396 E-mail: [email protected]
WEB: www.dnr.louisiana.gov/tad
January 5, 2016

Table of Contents
Page Foreword ....................................................................................................................................1 Overview ....................................................................................................................................3 DNR’s Louisiana Refinery Survey ............................................................................................7 Operating Refinery Recent Changes ..............................................................................7 Non-Operating Refinery Recent Changes ...................................................................11 Refinery’s Product Codes ............................................................................................14 Louisiana Operating Refineries not Surveyed by DNR ...........................................................23 Louisiana Refineries Motor Fuels Production .........................................................................27 U.S. Energy Information Administration Capacity of Louisiana Operable Petroleum Refineries as of January1, 2015 Data ......................................................................................28 Oil and Gas Journal 2014 Worldwide Refining Survey Capacities of Louisiana Refineries as of January 1, 2015 Data .....................................................................................32 Glossary ...................................................................................................................................37
Figures Page 1 Map and Highlights of Louisiana Refineries .......................................................................2 2 Operating Capacity of Louisiana and U.S. Refineries .........................................................4 3 Operating Rates (%), U.S., Texas Gulf Coast, Louisiana Gulf Coast Refineries ................9 4 Louisiana Oil Production (Excluding OCS) and Refinery Operable Capacity ..................12 5 Historical Crude Oil Sources for Louisiana Refineries .....................................................16 6 Crude Oil Input Percentages by Source and Refinery .......................................................17 7 Historical Louisiana Refineries Motor Fuels Production ..................................................27
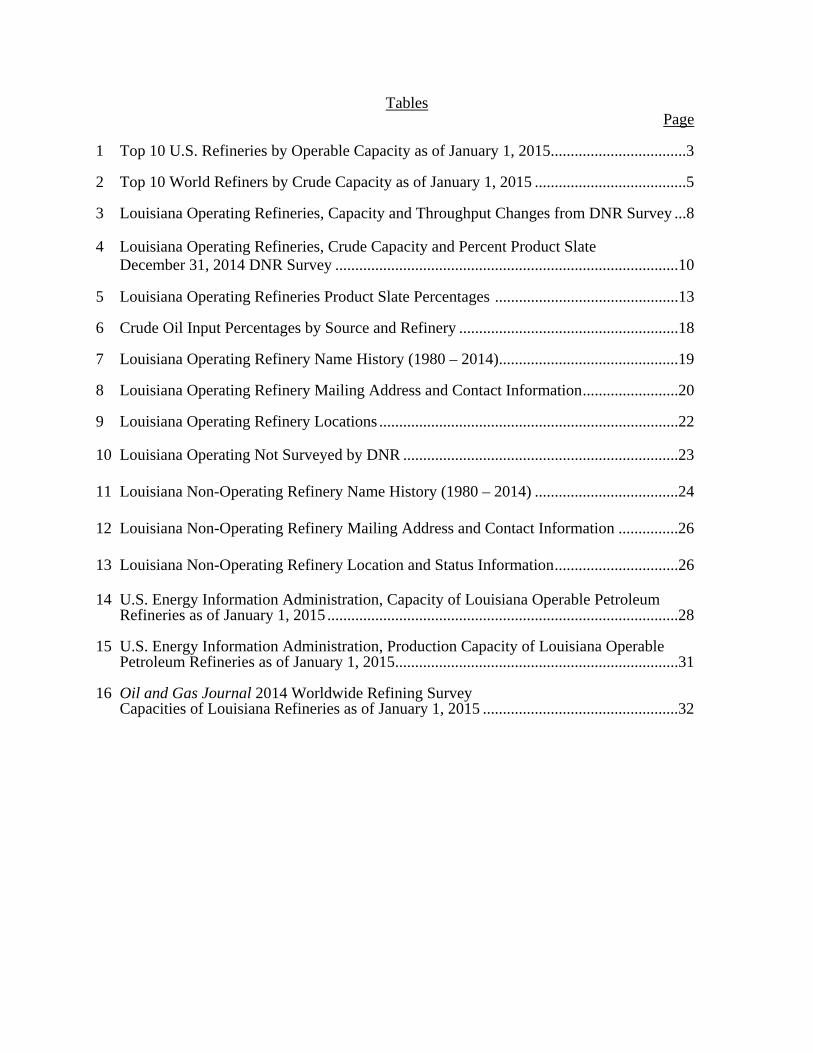
Tables Page 1 Top 10 U.S. Refineries by Operable Capacity as of January 1, 2015 ..................................3 2 Top 10 World Refiners by Crude Capacity as of January 1, 2015 ......................................5 3 Louisiana Operating Refineries, Capacity and Throughput Changes from DNR Survey ...8 4 Louisiana Operating Refineries, Crude Capacity and Percent Product Slate December 31, 2014 DNR Survey ......................................................................................10 5 Louisiana Operating Refineries Product Slate Percentages ..............................................13 6 Crude Oil Input Percentages by Source and Refinery .......................................................18 7 Louisiana Operating Refinery Name History (1980 – 2014) .............................................19 8 Louisiana Operating Refinery Mailing Address and Contact Information ........................20 9 Louisiana Operating Refinery Locations ...........................................................................22 10 Louisiana Operating Not Surveyed by DNR .....................................................................23 11 Louisiana Non-Operating Refinery Name History (1980 – 2014) ....................................24 12 Louisiana Non-Operating Refinery Mailing Address and Contact Information ...............26 13 Louisiana Non-Operating Refinery Location and Status Information ...............................26 14 U.S. Energy Information Administration, Capacity of Louisiana Operable Petroleum Refineries as of January 1, 2015 ........................................................................................28 15 U.S. Energy Information Administration, Production Capacity of Louisiana Operable Petroleum Refineries as of January 1, 2015 .......................................................................31 16 Oil and Gas Journal 2014 Worldwide Refining Survey Capacities of Louisiana Refineries as of January 1, 2015 .................................................32

Foreword Since 1989, the Technology Assessment Division of the Louisiana Department of Natural Resources (DNR) has periodically conducted surveys of Louisiana crude oil refineries. The results of the survey are compiled into a report focusing on developments that have occurred since the previous survey. These include an overview of the general direction of the industry and updated information on the current status of refinery ownership, mailing addresses, operating status, and key personnel. Tabulated statistical data, charts, and graphs relating to oil production, refinery crude oil sources, refinery margins, capacities, operating rates, and product slate are also presented. Information on both operating and non-operating refineries that are still intact is included. The operating refining capacities, operating rates, and product slate statistics presented in this report are prepared from data supplied by survey respondents and the Refiner’s Monthly Report (R3 report). The information on the non-operating refineries is obtained from their owners, trustees, or management personnel and is current within a few weeks of publication. The data used to construct the charts and graphs on oil production, refinery margins, and crude oil sources is obtained from DNR’s database. The time period covered by DNR’s current report is January 1, 2014 – December 31, 2014, and is designed to complement the petroleum statistics published by the Energy Information Administration (EIA). DNR gratefully acknowledges permission to use the December 1, 2014 Oil and Gas Journal Worldwide Refining Survey results to provide another independent dataset for comparison. Louisiana motor fuels production from 2000 to 2014 is shown on Figure 7 (pg. 27), U.S. EIA Louisiana refineries data is shown in Table 14 (pg. 28) and Table 15 (pg. 31), and Oil & Gas Journal, Louisiana refineries data is shown in Table 16 (pg. 32). The principal terms and phrases used in this report are the same as those used in EIA publications. The definitions of these terms can be found on the glossary of this report. The slight difference in meaning between operable and operating, when used to specify capacity or utilization rate, has caused some confusion. “Operable” refers to the maximum amount of crude oil capacity that a refinery can utilize to process crude oil in its atmospheric stills; “operating” refers to the amount of crude oil capacity actually utilized. See glossary for detailed definitions. The Department of Natural Resources uses the information in this report to enhance the economic development efforts of the State by:
Developing information on State and Federal energy policies that affect the oil and gas production and refining industries located in the State;
Helping crude suppliers locate refining sources and refined petroleum product buyers locate sources of supply;
Assisting new industries desiring to site facilities near refineries; and, Providing information to parties evaluating refineries for possible purchase.
1

Figure 1: Map and Highlights of Louisiana Refineries
2

Overview Louisiana is a primary energy producing state with 622 million barrels in crude and lease condensate reserves (2013), ranking it 10th among the states (3nd if the Louisiana portion of the federal outer continental shelf (OCS) is included). Louisiana ranks 7th among the states in crude oil and lease condensate production, with an estimated 73.4 million barrels produced in 2014. The Central Gulf of Mexico OCS territory is the most extensively developed and matured OCS territory in the United States, and over 90% of this area is located adjacent to the Louisiana coastal boundary. The Central Gulf of Mexico OCS territory has produced approximately 90% of the 20 billion barrels of crude oil and condensate produced in the U.S. OCS areas through the end of 2014. The discovery of these large quantities of crude oil led to the development of the refining and petrochemical industry in Louisiana. Louisiana’s refining capacity grew with oil production until about 1970 when Louisiana’s oil production peaked and began to decline. Refinery capacity continued to grow by processing more foreign oil and oil from other states as well. Approximately two thirds of refinery input is foreign crude. All refineries and refining companies are not created equal. There are small refineries and large ones. Some are quite complex, while others are relatively simple. A number are part of major, integrated oil companies, and some are independent.
Table 1 Top 10 U.S. Refineries* by Operable Capacity
(As of January 1, 2015)
Rank Corporation Company State Site Capacity
(bcd)
1 Motiva Enterprises LLC Motiva Enterprises LLC Texas Port Arthur 603,000
2 ExxonMobil Corp. ExxonMobil Refining & Supply Co.
Texas Baytown 560,500
3 Marathon Petroleum Corp.
Marathon Petroleum Co. LLC
Louisiana Garyville 522,000
4 ExxonMobil Corp. ExxonMobil Refining & Supply Co.
Louisiana Baton Rouge 502,500
5 Marathon Petroleum Corp.
Marathon Petroleum Corp.
Texas Galveston Bay 451,000
6 PDV America Inc. Citgo Petroleum Corp. Louisiana Lake Charles 427,800
7 BP PLC BP Products North America Inc.
Indiana Whiting 413,500
8 ExxonMobil Corp. ExxonMobil Refining & Supply Co.
Texas Beaumont 344,600
9 WRB Refining LP WRB Refining LP Illinois Wood River 336,000
10 Carlyle Group Philadelphia Energy Solutions
Pennsylvania Philadelphia 335,000
*Only refineries with Atmospheric Crude Oil Distillation Capacity
Source: Energy Information Administration, "Refinery Capacity Report 2015"
3

Source: 1950 - 1975: U.S. Bureau of Mines, "Petroleum Refineries in the
Untied States and Puerto Rico" Annual
1976 - 1981: EIA, "Petroleum Refineries in the United States and
U.S. Territories" Annual
1982 - 2004: EIA, "Petroleum Supply Annual, Vol. 1"
2005 - 2014: EIA, "Refinery Capacity Report"
1995: Louisiana data from DNR survey, as of June 30, 1995
1997: Louisiana data from DNR survey, as of June 30, 1997
Figure 2
Operating Capacity of Louisiana and U.S. Refineries
0
2
4
6
8
10
12
14
16
18
201950
1952
1954
1956
1958
1960
1962
1964
1966
1968
1970
1972
1974
1976
1978
1980
1982
1984
1986
1988
1990
1992
1994
1996
1998
2000
2002
2004
2006
2008
2010
2012
2014
Million Barrels per Calendar Year
US Total Louisiana
DNR ‐ Technology Assessment Division
4

In addition to refining, integrated oil companies are engaged in all other aspects of the petroleum industry which range from the exploration of crude oil to the marketing of finished petroleum products. Independent refiners, on the other hand, purchase most of their crude oil on the open market rather than producing it. Refiners such as Placid Refining Co. and Calcasieu Refining Co. are examples of independent refiners. Major oil companies dominate the refining industry, the top 10 U.S. refiners, all of them major integrated oil companies, account for about 75% of the total domestic refinery charge capacity. Most of these have operations in Louisiana, either as wholly owned facilities such as the Baton Rouge ExxonMobil refinery, or as part owners or joint ventures such as Motiva Refineries in Norco and Convent. A list of the top 10 U.S. refineries by operable capacity is shown on Table 1 (pg. 3). Many refineries are primarily fuels refineries, some are lube stock refineries, and others are petrochemical refineries. Phillip 66’s refinery in West Lake is a good example of a petrochemical refinery, where some of its products are raw feed for a chemical plant or refinery (Excel Paralubes). Besides the level of vertical integration of a refiner and the product mix of a refinery, industry analysts also look at capacity and complexity. A "complexity factor" is assigned to each process unit of a refinery based on its relative construction cost. The atmospheric crude distillation unit is assigned a value of one. For example, the cost of a fluidized catalytic cracker is six times greater than an atmospheric crude distillation unit of the same capacity, so its unit complexity factor is six. Greater complexity does not necessarily go hand-in-hand with larger capacity. Some of the smaller facilities in Louisiana are the most complex. For example, the smaller lube and wax producing refineries of North Louisiana are quite complex when compared to some very large refineries in the state. EIA statistics show total U.S. petroleum consumption in 2014 increased 0.7% to 19.11 million barrels per day (bpd). Finished motor gasoline increased 0.9% to 8,921 thousand bpd, jet fuel increased 2.5% to 1,470 thousand bpd, and overall distillate fuel oil increased 5.5% to 4,037 thousand bpd in 2014. As reported in the Oil & Gas Journal’s 2014 Worldwide Refinery Report, yearly worldwide refining capacity fell for the second time since reaching its record high in 2013. In
Table 2 Top 10 World Refiners by Crude Capacity
(As of January 1, 2015)
World Rank
Company Crude
Capacity1 (bcd)
1 ExxonMobil 5,465,500
2 Royal Dutch Shell 4,184,600
3 Sinopec 3,971,000
4 BP 2,858,964
5 Saudi Aramco 2,835,500
6 Valero Energy 2,769,500
7 Petroleos de Venezuela SA 2,678,000
8 China National Petroleum 2,675,000
9 Phillips 66 2,523,200
10 Chevron 2,463,600
Source: Oil & Gas Journal, Dec. 1, 2014
1 Includes partial interest in refineries not wholly owned by the company.
5

2014 it decreased by nearly 70,000 bcd, from 88 million bcd in 2013. Oil & Gas Journal reported the downturn can be attributed to refinery shutdowns, some capacity reductions, and the availability of more accurate data. Table 2 (pg. 5) shows the ranking of the 10 largest refiners in the world according to crude capacity, and it includes partial interest in refineries not wholly owned by the company. There were no newcomers to the list; Phillips 66, moves up from 10th to the 9th spot, and Chevron moves from 9th to 10th place.
Catalytic cracking technology invented at Exxon Baton Rouge in 1942 helped win WWII. It remains industry standard.
Photo courtesy Exxon Public Affair
6

DNR’s Louisiana Refinery Survey According to DNR’s survey, the Louisiana refinery operating rate was 86.2% for this survey period with little idle capacity. Figure 3 (pg. 9) compares Louisiana Gulf Coast, Texas Gulf Coast, and total U.S. refinery operating rates since 1990. The operating capacity for Louisiana refineries in 2014 was 3,286,120 barrels per calendar day (bcd), 18,400 bcd, or 0.56% lower than previous DNR’s survey. Table 3 (pg. 8) shows the details of operating capacity and throughput changes between DNR’s two most recent surveys. Figure 4 (pg. 12) shows the historical Louisiana and U.S. operating capacity since 1950. Table 5 (pg.13) shows the refinery products slate reported to DNR in the R3 report. Motor gasoline accounted for 39.3% of Louisiana refinery production. The percentages are weighted by the refineries’ crude capacity, to reflect the contribution made by each refinery. From the 16 surveyed refineries that have atmospheric distillation capacity, only 13 of them produced motor gasoline. Most of Louisiana’s refinery products are exported to other states. According to the most recent data published by the Energy Information Administration (EIA), Louisiana itself consumes about 327 million barrels of petroleum products. This represents only 24% of the 1,367 million barrels of petroleum products its refineries produce. Louisiana refineries continue to obtain most of their crude supply from outside the state as oil production within the state continues to decline. Only about 7.1% comes from Louisiana State. The outside sources supplying crude to Louisiana refineries are, the federal OCS provided the most at 45.6%, foreign countries is next at 32.6%, and other states at 14.7%. Figure 5 (pg. 16) shows the historical sources of crude oil for Louisiana refineries for the period 1993-2014. Generally, the smaller refineries use a greater percentage of Louisiana crude than the large refineries to satisfy their total requirements. Figure 6 (pg. 17) shows the percentage crude source for each Louisiana refinery for 2014.
Operating Refinery Recent Changes Marathon at Garyville facility completed a $3.9 billion expansion of the refinery in 2009 that nearly doubled its production capacity to 522,000 bpd, making it the third largest refinery in the US. Marathon also proposed a follow up upgrade project called ROUX (residual oil upgrade expansion) to convert residual oil from the refining process into low-sulfur diesel. The proposed ROUX upgrades would have added another 1.2 billion gallons of diesel production per day. In the first quarter of 2015, Marathon Petroleum Corp. announced that is pulling the plug on the plan for more than $2 billion in upgrades at its Garyville refinery. The project is the latest casualty of low oil prices, which have hovered below $50 per barrel. The Norco Manufacturing Complex since 1995 has been split into two units Norco Refining Co., and Shell Chemical Co. The Norco Refining Co. became Motiva Enterprise LLC 250,000 bpd refinery that refines “medium sweet” crude oil.
7

Valero Refining Co Meraux
ExxonMobil Refining & Supply Co Baton Rouge
Marathon Petroleum Co LLC Garyville
Table 3
Louisiana Operating Refineries 1
Capacity and Throughput Changes from DNR Survey
Refinery Name
Operating capacity as of
12/31/2013 (bcd)
Capacity Change From 2013 to 2014
(bcd)
Throughput 1/1/2013 - 12/31/2013 (Barrels)
Throughput Change From 2013 to 2014
(Barrels)
Capacity Change (%)
Throughput Change (%)
Alon Refining Krotz Springs Inc Krotz Springs
80,000 0 21,819,402 1,863,891 0.00 8.54
Calcasieu Refining Co 80,000 0
0.00
26,119,989 381,042 0.00 1.46
-7.14
Chalmette Refining LLC Chalmette
197,000 -4,500 50,248,212 3,970,196 -2.28 7.90
Calumet Shreveport LLC Shreveport
65,000 0 13,230,593 -944,088 0.00
1.91
Calumet Lubricants Co LP Princeton
8,300 0 2,049,965 372,532
1.68
18.17
Calumet Lubricants Co LP Cotton Valley
13,020 0 2,356,515 45,121 0.00
Citgo Petroleum Corp Lake Charles
427,800 0 138,820,092 2,334,784 0.00
Motiva Enterprises LLC Convent
Motiva Enterprises LLC Norco
502,500 0 169,081,277 10,387,760 0.00 6.14
5.64
235,000 0 70,943,162 6,969,022 0.00 9.82
522,000 0 179,588,724 10,120,351 0.00
59,000 16,000 21,345,121 -1,624,820 27.12
Phillips 66 Belle Chasse
-7.61
233,500 4,500 73,891,592 -7,955,270 1.93
9.40Phillips 66 West Lake
239,400 20,600 81,161,759 7,631,785 8.60
252,000 -5,000 80,442,976 -6,125,486
-10.77
-1.98 -7.61
36,739,355 117,842 -10.71 0.32140,000 -15,000
1 Louisiana operating refineries with no atmospheric distillation capacity were not surveyed by DNR and not included in this table. These facilities are listed in Table 10.
4.13
Totals 3,304,520 -18,400 1,004,496,199 29,059,327 -0.56 2.89
Valero Refining Co Norco
250,000 -35,000 36,657,465 1,514,665 -14.00
Placid Refining Co Port Allen
8

* Louisiana Gulf Coast includes the parishes of Vernon, Rapides, Avoyelles, Pointe Coupee, West Feliciana, East Feliciana,
Saint Helena, Tangipahoa, Washington, and all parishes south thereof, Mississippi counties of Pearl River, Stone, George, Hancock,
Harrison, and Jackson, and Alabama counties of Mobile and Baldwin.
Source: EIA, "Petroleum Supply Annual, Volume 1"
Figure 3
Operating Rates (%)
U.S., Texas Gulf Coast, Louisiana Gulf Coast Refineries
DNR Technology Assessment Division
80
85
90
95
100
105
1990
1992
1994
1996
1998
2000
2002
2004
2006
2008
2010
2012
2014
U.S. Texas Gulf Coast Louisiana Gulf Coast *
DNR ‐ Technology Assessment Division
9

86.2 86.2
3,286,120 0 1,033,555,526
Alon Refining Krotz Springs Inc Krotz Springs
HLL 80,000 81.1 0 81.1 23,683,293
Operable rate (%)
Table 4
Louisiana Operating Refineries Crude Capacity 1
Data as of December 31, 2014 DNR Survey
Throughput 1/1/2014 - 12/31/2014 (Barrels)
Data in this table may differ from data reported elsewhere for a different time period.
Refinery NameDNR FAC Code
Operating capacity as of
12/31/2014 (bcd)
Operating rate (%)
Idle capacity
(bcd)
26,501,031
Calumet Lubricants Co LP Cotton Valley
CTT 13,020 50.5 0 50.5 2,401,636
Calcasieu Refining Co Lake Charles
CLC 80,000 90.8 0 90.8
2,422,497
Calumet Shreveport LLC Shreveport
ATL 65,000 51.8 0 51.8 12,286,505
Calumet Lubricants Co LP Princeton
CLM 8,300 80.0 0 80.0
54,218,408
Citgo Petroleum Corp Lake Charles
CTS 427,800 90.4 0 90.4 141,154,876
Chalmette Refining LLC Chalmette
TNN 192,500 77.2 0 77.2
74,317,490
Phillips 66 West Lake
CNB 260,000 93.6 0 93.6 88,793,544
Phillips 66 Belle Chasse
STN 247,000 82.4 0 82.4
179,469,037
Marathon Petroleum Co LLC Garyville
MRT 522,000 99.6 0 99.6 189,709,075
ExxonMobil Refining & Supply Co Baton Rouge
EXX 502,500 97.8 0 97.8
77,912,184
Motiva Enterprises LLC Norco
SHL 238,000 75.9 0 75.9 65,936,322
Motiva Enterprises LLC Convent
TXC 235,000 90.8 0 90.8
Placid Refining Co Port Allen
PLC 75,000 72.0 0 72.0
1 Louisiana operating refineries with no atmospheric distillation capacity were not surveyed by DNR and not included in this table. These facilities are listed in table 10.
Weighted State Average
Total La. Operating Capacity
36,857,197
Valero Refining Co Norco
GDH 215,000 48.6 0 48.6 38,172,130
Valero Refining Co Meraux
MRP 125,000 80.8 0 80.8
19,720,301
10

M o t i v a N o r c o R e f i n e r y produces gasoline (premium and regular grades, unleaded), jet aviation fuel, Ultra Low Sulfur diesel, liquefied petroleum gases (i.e. propane, propylene, isobutene), and anode grade coke. In 2 0 0 3 i t w a s a c q u i r e d b y V a l e r o . Since acquisition, Valero has invested nearly $4.5 billion, making the plant one of the company's more complex refineries. These investments enabled the plant to process additional heavy feedstocks, increase throughput capacity to 275,000 bpd, upgrade its product yields, reduce emissions and improve on-stream reliability. The Norco facility also adds value to the company’s operations by providing intermediate feedstocks to other refineries and chemical plants located along the Gulf Coast, and it has access to the Colonial and Plantation pipelines for distribution of refined products to numerous markets in the southern and eastern US. The Shell Chemical plant is further described in the Louisiana Operating Refineries not Surveyed by DNR. The identity and location of each of the surveyed operating refineries is shown on the map in Figure 1 (pg. 2). Name histories are listed in Table 7 (pg. 19), mailing addresses and contacts are listed in Table 8 (pg. 20), and physical locations are listed in Table 9 (pg. 22). The identity and location of each of the not surveyed operating refineries is shown on the map in Figure 1 (pg. 2). Name, contact information, location and products are listed in Table 10 (pg. 23).
Non-Operating Refinery Recent Changes During this survey period there is one change to non-operating refinery status. The Shell Oil Products US refinery at St Rose which has been idle since October 2011 was moved from Surveyed Operating Refinery list to the Non-Operating Refinery list. The identity and location of each of the non-operating refineries is shown on the map in Figure 1 (pg. 2). Name histories are listed in Table 11 (pg. 24), and mailing addresses and contacts are listed in Table 12 (pg. 26). Physical locations, last known crude capacity, date last operated and present status are described in Table 13 (pg. 26).
11

Source: Oil historical and projected production data from DNR Technology Assessment Division; and refinery capacity
data from DNR database and EIA, "Petroleum Supply Annual, Vol. 1" and EIA, Refinery Capacity Data Report
Figure 4
Louisiana Oil Production (Excluding OCS) and Refinery Operable Capacity
0
200
400
600
800
1,000
1,200
1,400
1900 1910 1920 1930 1940 1950 1960 1970 1980 1990 2000 2010 2020 2030
Million Barrels per Year
Refinery Capacity Historical Production Projected Production
DNR ‐ Technology Assessment Division
12

1 1 2 2 2 2 3 3 3 3 4 4 5 5 5 6
1 4 1 2 3 9 2 4 5 9 1 9 1 2 9 1
0 0 0 0 0 0 0 0 0 0 0 0 0 0 0 0
Wtd % 0.0 3.6 0.0 39.3 7.4 8.0 1.1 23.9 0.1 3.0 0.7 3.5 0.5 3.6 2.7 2.54 See products code definition on page 14
Source: DNR Database - Refiner's Monthly Report, R-3 Report
Table 5Louisiana Operating Refineries
Product Slate Percentages2014 DNR's R3 Report
Product Code4
0.0 4.4 20.8 14.0 0.0 0.0HLL 0.0 13.3 0.0 47.6
DNR FAC Code
0.0 0.0 0.0 0.0 0.0 0.0
CTT 0.0 0.0 0.0 0.0
CLC 0.0 0.0 0.0 0.0
0.0 79.4 0.0 0.0 0.0 0.0
24.0 18.8 28.0 0.0 0.00.0
ATL 0.0 33.1 0.0 7.4
CLM 0.0 41.3 0.0 0.0
18.6 0.0 0.0 14.5 0.0 4.7
0.0 0.0 0.0 0.0 9.80.0
0.0 6.7
CTS 0.0 0.1 0.0 41.4
TNN 0.0 4.9 0.0 37.3 0.0
17.6 5.5 0.0 0.0 0.0 15.1
10.6 0.0 26.6
MRT 0.0 2.9 0.0 46.4
EXX 0.0 2.1 0.1 35.2
0.0 1.8 0.0 37.1 0.0 0.0
21.4 0.0 18.3 0.3 0.19.7
SHL 0.0 0.0 0.0 59.0
TXC 0.0 3.4 0.0 44.8
10.6 0.0 0.0 26.0 0.0 0.0
0.0 0.0 28.0 0.1 11.811.8
0.0 0.0 21.0 0.0 0.012.6
CNB 0.0 3.8 0.0 25.8
STN 0.0 22.3 0.0 39.1
33.4 0.0 5.3
12.6 4.3 0.1 25.0 0.0 2.3
0.0 18.6 0.0 0.08.5
3.4
0.4
1.7
0.0 45.3 0.0 0.1GDH 0.0 0.0 0.0 33.7
PLC 0.0 0.6 0.0 55.0
MRP 0.0
0.0 11.6
0.0
0.0 0.0
28.5 0.7
0.4
0.0
0.5
20.6
0.0
0.0
6.4
1.9
0.0
10.1
0.0
0.0
0.0
3.6
6.3
3.4
4.2
0.0
1.4
0.0 0.0 0.0 0.0
0.0
38.8
19.7
0.0
0.0
2.3 0.0
1.9
0.0
0.0
0.0
0.0
1.0
0.0
0.0
0.0
0.0
1.4
0.0
0.0
13.7
8.7
0.0
0.0
0.0
0.5
6.8
1.6
0.8
0.0
0.0
0.0
0.0
1.6
3.4
4.8
2.1
4.5
0.0
0.0
0.5
0.0
3.0
0.0
5.1
5.3
1.5
5.5
0.5
3.6
1.8
2.79.6
0.17.40.0
0.320.2 0.0 0.2 0.0 26.9 0.0
0.00.0
1.5
13
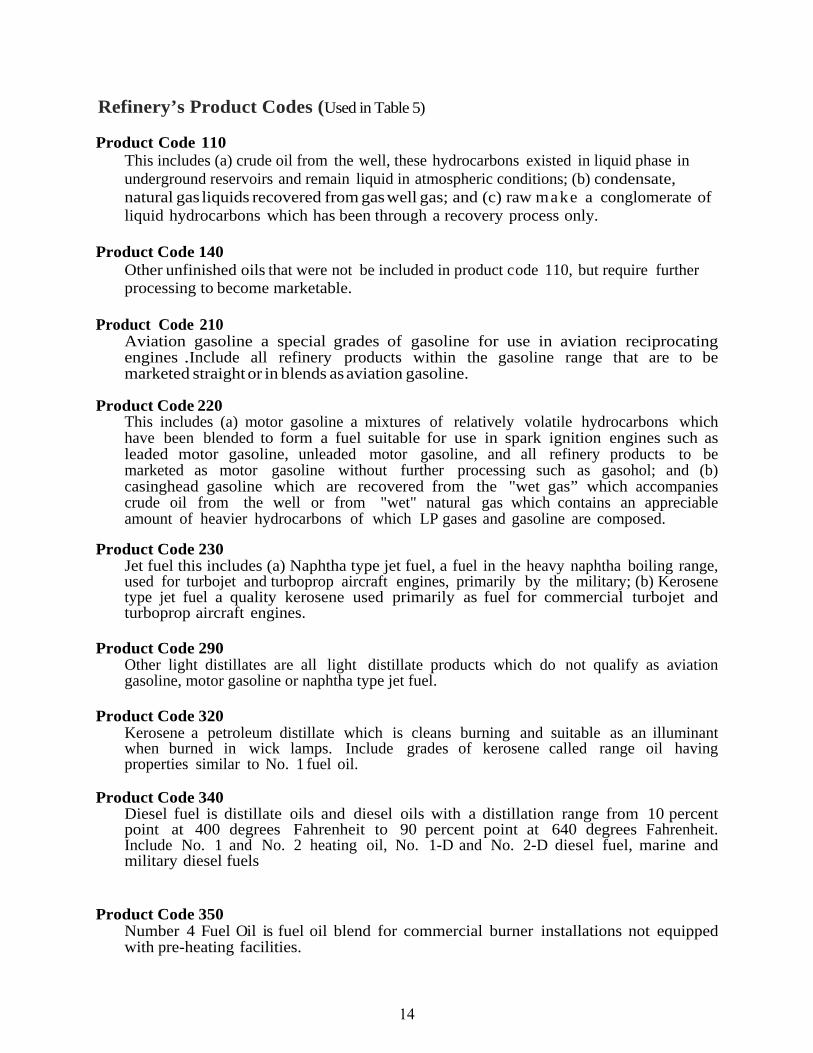
Refinery’s Product Codes (Used in Table 5)
Product Code 110 This includes (a) crude oil from the well, these hydrocarbons existed in liquid phase in underground reservoirs and remain liquid in atmospheric conditions; (b) condensate, natural gas liquids recovered from gas well gas; and (c) raw make a conglomerate of liquid hydrocarbons which has been through a recovery process only.
Product Code 140 Other unfinished oils that were not be included in product code 110, but require further processing to become marketable.
Product Code 210 Aviation gasoline a special grades of gasoline for use in aviation reciprocating engines .Include all refinery products within the gasoline range that are to be marketed straight or in blends as aviation gasoline.
Product Code 220
This includes (a) motor gasoline a mixtures of relatively volatile hydrocarbons which have been blended to form a fuel suitable for use in spark ignition engines such as leaded motor gasoline, unleaded motor gasoline, and all refinery products to be marketed as motor gasoline without further processing such as gasohol; and (b) casinghead gasoline which are recovered from the "wet gas” which accompanies crude oil from the well or from "wet" natural gas which contains an appreciable amount of heavier hydrocarbons of which LP gases and gasoline are composed.
Product Code 230
Jet fuel this includes (a) Naphtha type jet fuel, a fuel in the heavy naphtha boiling range, used for turbojet and turboprop aircraft engines, primarily by the military; (b) Kerosene type jet fuel a quality kerosene used primarily as fuel for commercial turbojet and turboprop aircraft engines.
Product Code 290
Other light distillates are all light distillate products which do not qualify as aviation gasoline, motor gasoline or naphtha type jet fuel.
Product Code 320
Kerosene a petroleum distillate which is cleans burning and suitable as an illuminant when burned in wick lamps. Include grades of kerosene called range oil having properties similar to No. 1 fuel oil.
Product Code 340
Diesel fuel is distillate oils and diesel oils with a distillation range from 10 percent point at 400 degrees Fahrenheit to 90 percent point at 640 degrees Fahrenheit. Include No. 1 and No. 2 heating oil, No. 1-D and No. 2-D diesel fuel, marine and military diesel fuels
Product Code 350 Number 4 Fuel Oil is fuel oil blend for commercial burner installations not equipped with pre-heating facilities.
14

Product Code 390
Include all middle distillate products which do not qualify as kerosene, kerosene type jet fuel, casinghead gasoline, diesel fuel or number 4 fuel oil.
Product Code 410
Include all grades of lubricating oils from spindle oil to cylinder oil and those used in greases, and all marketable waxes should also be included whether crude scaled or refined.
Product Code 490 Include all heavy distillate products which are not lubricants or waxes.
Product Code 510 Asphalt is a mix of finished asphalt products such as cements, fluxes, the asphalt content of emulsions (exclusive of water) and petroleum distillates blended with asphalt to make cutback asphalts.
Product Code 520
Petroleum coke is a solid residue, the final product of the condensation process in cracking, consisting mainly of highly polycyclic aromatic hydro-carbons very poor in hydrogen. Include both marketable and catalyst.
Product Code 590
Include all refinery residue products which do not qualify as asphalt or petroleum coke.
Product Code 610 Any form or mixture of gas produced in refineries by distillation, cracking, reforming and other processes. Include still gas used for petrochemical feedstock and other uses sometimes called still gas.
In some cases the % of Total Product Slate in Table 5 did not add up to 100. We did not change any of the numbers reported, but normalized the figures to derive the weighted totals for each product.
15

Source: DNR Database, from Refiner's Monthly Report, Form R-3
Historical Crude Oil Sources for Louisiana Refineries
Figure 5
0
200
400
600
800
1,000
1,2001993
1994
1995
1996
1997
1998
1999
2000
2001
2002
2003
2004
2005
2006
2007
2008
2009
2010
2011
2012
2013
2014
Million Barrels per Year
Louisiana OCS Other States Foreign
DNR ‐ Technology Assessment Division
16

Source: DNR Database, from Refiner's Monthly Report, Form R-3
Crude Oil Input Percentages by Source and RefineryFigure 6
2014 DNR's R3 Report
0 20 40 60 80 100
Alon
Calcasieu
Calumet - Prin.
Calumet - C.V.
Calumet - Shrev.
Chalmette
Citgo
ExxonMobil
Marathon
Motiva - Norc.
Motiva - Conv.
Pelican
Phillips 66 B.C.
Phillips 66 L.C.
Placid
Valero - Meraux
Valero - NO GH
% From Louisiana
0 20 40 60 80 100
Alon
Calcasieu
Calumet - Prin.
Calumet - C.V.
Calumet - Shrev.
Chalmette
Citgo
ExxonMobil
Marathon
Motiva - Norc.
Motiva - Conv.
Pelican
Phillips 66 B.C.
Phillips 66 L.C.
Placid
Valero - Meraux
Valero - NO GH
% From Federal OCS
0 20 40 60 80 100
Alon
Calcasieu
Calumet - Prin.
Calumet - C.V.
Calumet - Shrev.
Chalmette
Citgo
ExxonMobil
Marathon
Motiva - Norc.
Motiva - Conv.
Pelican
Phillips 66 B.C.
Phillips 66 L.C.
Placid
Valero - Meraux
Valero - NO GH
% From Other States
0 20 40 60 80 100
Alon
Calcasieu
Calumet - Prin.
Calumet - C.V.
Calumet - Shrev.
Chalmette
Citgo
ExxonMobil
Marathon
Motiva - Norc.
Motiva - Conv.
Pelican
Phillips 66 B.C.
Phillips 66 L.C.
Placid
Valero - Meraux
Valero - NO GH
% From Foreign
DNR ‐ Technology Assessment Division
17

RefineryDNR FAC Code
Louisiana Federal OCS Other States Foreign
Alon Refining Krotz Springs Inc Krotz Springs
HLL 100.0 0.0 0.0 0.0
Calcasieu Refining Co Lake Charles
CLC 100.0 0.0 0.0 0.0
Calumet Lubricants Co Princeton
CTT 59.1 0.0 40.9 0.0
Calumet Lubricants Co Cotton Valley
CLM 95.0 0.0 5.0 0.0
Calumet Shreveport LLC Shreveport
ATL 95.0 0.0 5.0 0.0
Chalmette Refining LLC Chalmette
TNN 15.3 50.7 1.2 32.8
Citgo Petroleum Corp Lake Charles
CTS 45.2 0.0 42.2 12.7
Excel Paralubes Westlake
EXL 0.0 0.0 0.0 0.0
ExxonMobil Refining & Supply Co Baton Rouge
EXX 12.0 63.1 2.8 22.1
Marathon Petroleum Co LLC Garyville
MRT 6.7 26.8 16.3 50.2
Motiva EnterprisesLLC Norco
SHL 91.7 0.0 0.0 8.3
Motiva Enterprises LLC Convent
TXC 0.0 0.0 0.0 100.0
Pelican Refining Co Lake Charles
PLN 0.0 0.0 0.0 0.0
Phillis 66 Belle Chase
STN 41.2 33.7 24.0 1.1
Phillis 66 West Lake
CNB 13.9 0.0 28.7 57.4
Placid Refining Co LLC Port Allen
PLC 81.9 16.6 1.5 0.0
Valero Refining Co Meraux
MRP 0.4 79.7 19.8 0.0
Valero Refining Co Good Hope
GDH 13.0 2.2 4.1 80.7
Source: DNR Database - Refiner's Monthly Report, R-3 Report
Table 6 (Data for Figure 6)Crude Oil Input Percentages by Source and Refinery
2014 DNR's R3 Report
18

Refinery Name DateFAC/Conservation Code & Location
Refinery Name DateFAC/Conservation Code & Location
ExxonMobil Refinery and Supply Co 1999- Alon Refining Krotz Springs Inc 2008-
Exxon Co USA 1980-99 Valero Refining Co 1997-07
Basis Petroleum Inc 1996-96
Phillips 66 Phibro Energy USA Inc 1993-95
ConocoPhillips 2003-12 Phibro Refining Inc 1992-92
Philips Petroleum Co 2000-02 Hill Petroleum Co 1980-91
B.P. Amoco PLC 1999-00
B.P. Oil Corp 1989-98 Calcasieu Refining Co 1985-
Standard Oil Co 1986-88 CPI Oil & Refining Inc 1982-84
Gulf Refining & Marketing Co 1985-85 Calcasieu Refining Ltd 1980-81
Gulf Oil Corp 1981-84 Phillips 66
Gulf Oil Co US 1979-80
Citgo Petroleum Corp 1984-
Chalmette Refining LLC 1998 - Cities Service Co 1980-83
Mobil Oil Corp 1989-98
Tenneco Oil Co 1980-88 ConocoPhillips 2003-12
Conoco Inc 1982-02
Motiva Enterprises LLC 1998- Conoco 1980-81
Star Enterprises 1989-98 Continental Oil Co 1979
Texaco Refining & Marketing 1985-88
Texaco Inc 1980-84 Valero Refining Meraux 2011-
Murphy Oil USA Inc 1984-11
Calumet Lubricants Co LP 1996- Murphy Oil Corp 1980-83
Kerr-McGee Refining Corp 1985-95
Kerr-McGee Corp 1983-84 Motiva Enterprises LLC 1998-
Cotton Valley Solvents Co 1980-82 Shell Oil Co 1980-98
Marathon Petroleum Co LLC 2005- Calumet Lubricants Co LP 1991-
Marathon Ashland Petroleum LLC 1998-04 Calumet Refining Co 1980-90
Marathon Oil Co 1992-98
Marathon Petroleum Co 1985-91 Placid Refining Co 1980-
Marathon Oil Co 1980-84
Valero Refining Co 2004- Calumet Shreveport LLC 2005-
Orion Refining Corp 1999-03 Calumet Lubricants Co LP 2000-04
TransAmerican Refining Co 1992-98 Pennzoil-Quaker State Corp 1999-00
TransAmerica Refining Co 1988-91 Pennzoil Producing Co 1992-98
GHR Energy Corp 1982-87 Pennzoil Products Co 1986-91
Good Hope Refineries Inc 1981-81 Pennzoil Co 1985-85
Good Hope Industries Inc 1980-80 Atlas Processing Co 1980-84
Source: DNR Database - Refiner's Monthly Report, R-3 Report and TAD Refinery Survey
PLC / 9165 Port Allen
ATL / 9104 Shreveport
MRP / 9161 Meraux
CTT / 9156 Cotton Valley
SHL / 9163 Norco
MRT / 9159 Garyville
CLM / 9117 Princeton
GDH / 9144 Norco
CLC / 9118 Lake Charles
CTS / 9126 Lake CharlesTNN / 9174
Chalmette
CNB / 9129 Lake Charles
TXC / 9180 Convent
Table 7Louisiana Operating Refinery Name History (1980-2014)
HLL / 9151 Krotz Springs
EXX / 9140 Baton Rouge
STN / 9148 Belle Chasse
19

Alon Refining Krotz Springs Inc PO Box 453 Kevin Roy (337) 566 0114
Krotz Springs, LA 70750 0453 Gregg Byers
Stephen Chachere
Calcasieu Refining Co 4359 W. Tank Farm Rd. Don Johnson (337) 480 6637
Lake Charles, LA 70605 Russ Willmon
Tim Jordan
Calumet Lubricants Co LP PO Box 97 Wayne Rhymes (318) 832 4236
Cotton Valley, LA 71018 Charles Cost
Rodney Butts
Calumet Lubricants Co LP 10234 La Hwy. 157 Levi LaMothe (318) 949 2421
Princeton, LA 71067-9172 Jerry Arnold
Grady Lee
Calumet Shreveport LLC PO Box 3099 Stan Snead (318) 632 4063
Shreveport, LA 71133 Tom Germany
James Kelly
Chalmette Refining LLC 500 W Saint Bernard Hwy Ajesh D'Souza (504) 281 6266
Chalmette, LA 70043 Janet Matsushita
Citgo Petroleum Corp PO Box 1562 Phil Woods (337) 708 6357
Lake Charles, LA 70602 Eduardo Assef
Don Fruge
ExxonMobil Refining and Supply Co PO Box 551 Barbara Beckman (225) 977 8888
Baton Rouge, LA 70821 Steve Blume
Dave Brownwell
Marathon Petroleum Co LLC PO Box AC Scott Poche (985) 535 2241
Garyville, LA 70051-0842 Aulton Anderson
Eric Sjunnesen
Motiva Enterprises LLC PO Box 37 Oliver Boyd (225) 562 6747
Convent, LA 70723 David Brignac
Brian Evans
Motiva Enterprises LLC PO Box 10 Jenny Weber (504) 465 7873
Norco, LA 70079 Donald Weaver
Robert Perrotta
* Contacts are listed in order as: Contact Person, Plant Manager, Plant Engineer
Source: DNR Database - Refiner's Monthly Report, R-3 Report and TAD Refinery Survey
Table 8Louisiana Operating Refinery Mailing Address and Contact Information
Company Name Mailing Address Contacts * Telephone
20

Phillips 66 15551 Hwy 23 Bill Baker (504) 656 3647
Bell Chasse, LA 70037 Greg Lucchesi
Phillips 66 PO Box 37 Grant Jones (337) 491 4913
Westlake, LA 70669 Willie Tempton Jr
Placid Refining Co 1940 La Hwy 1 North Joey Hagmann (225) 387 0278
Port Allen, LA 70767 Joey Hagmann
Valero Refining Co PO Box 537 Tracie Lack (985) 764 5839
Norco, LA 70079 Ralph Phillip
Gary Devenish
Valero Refining Co 1615 E. Judge Perez Tim Andrews (504) 278 5245
Chalmette, LA 70043 Lauren Bird
Chuck Morgan
* Contacts are listed in order as: Contact Person, Plant Manager, Plant Engineer
Source: DNR Database - Refiner's Monthly Report, R-3 Report and TAD Refinery Survey
Table 8 (Continued)Louisiana Operating Refinery Mailing Address and Contact Information
Company Name Mailing Address Contacts * Telephone
21

356 S. Levee Rd.
Krotz Springs, LA 70750
4359 W. Tank Farm Rd.
Lake Charles, LA 70605
1756 Old Hwy. 7
Cotton Valley, LA 71018
10234 Hwy. 157
Princeton, LA 71067
3333 Midway St.
Shreveport, LA 71109
500 W. St. Bernard Hwy.
Chalmette, LA 70044
4401 Hwy. 108
Sulphur, LA 70665
4045 Scenic Hwy.
Baton Rouge, LA 70805
4663 West Airline Hwy.
Garyville, LA 70051
La. 44 & 70
Convent, LA 70723
15536 River Rd.
Norco, LA 70079
15551 Hwy. 23 South
Belle Chase, LA 70037
2200 Old Spanish Trail Rd.
Westlake, LA 70669
1940 La. 1 North.
Port Allen, LA 70767
14902 River Rd.
Norco, LA 70079
2500 E. St. Bernard
Meraux 70075
Source: DNR Database - Refiner's Monthly Report, R-3 Report and TAD Refinery Survey
Valero Refining Co
Motiva Enterprises LLC
Phillips 66
Phillips 66
Placid Refining Co
Valero Energy Corp
Table 9
Company Name Physical Location
Louisiana Operating Refinery Locations
Alon Refining Krotz Springs Inc
Calcasieu Refining Co
Calumet Lubricants Co LP
Calumet Lubricants Co LP
Calumet Shreveport LLC
Chalmette Refining LLC
Citgo Petroleum Corp
ExxonMobil Refining and Supply Co
Marathon Petroleum Co LLC
Motiva Enterprises LLC
22

Louisiana Refineries Not Surveyed by DNR
Table 10
Company Name Contact Information Capacity
(bcd) Process Product FAC/Conservation
Code & Location
Excel Paralubes 1 2800 Old Spanish Trail
Westlake, LA 70669 (337) 497-4900
42,000 2 Catalytic
hydrocracking Lubes
EXC / ####
Westlake
Pelican Refining Co 1 4646 Old Town Rd
Lake Charles, LA 70615 (337) 433-6773
12,000 2 Vacuum
distillation Asphalt
PEL / 9102 Lake Charles
Shell Chemical Co 1 Norco
15536 River Road Norco, LA 70615 (504) 465-7342
Part of the Norco
Manufacturing Complex
Part of the Norco Manufacturing
Complex
Ethylene, propylene and
butadiene
SCN / 9102 Norco
1 The facilities in this table do not have any atmospheric distillation capacity. They typically process heavy crude fractions and / or waste streams. 2 Source: Energy Information Administration, "Refinery Capacity Report 2015"
Excel Paralubes It started as a lube hydrocracker facility a 50-50 joint venture between Conoco and Pennzoil (in 2003-04 Pennzoil sold its share to Flint Hills Resources) in 1994 located in Westlake, Louisiana. Later the lube plant was upgraded to be a refinery with the addition of 40,000 bpd atmospheric distillation capacity, 60,000 barrels per day (bpd) vacuum distillation capacity and 34,000 bpd catalytic reforming capacity. The lubes plant's main units are a 32,000 bpd hydrocracker and a 20,000 bpd Isodewaxing unit. The lubes plant also includes two sulfur-recovery units. Excel Paralubes sits adjacent to a 260,000 bpd refinery owned by Phillips 66. This refinery provides Vacuum Gas Oil (VGO) to Excel Paralubes vacuum distillation tower, where 15,000 bpd of lighter distillates are removed and returned to the Phillips 66 refinery. Recent survey by EIA says its catalytic hydrocracking has 42,000 bpd capacity. Pelican Refinery The Lake Charles refinery is located on 4343 Old Town Road. The 87-acre Lake Charles refinery is best accessed by barge via the Calcasieu River. Formally known as American International Refinery, Inc. which sold the Lake Charles refinery and all associated real and personal property to Pelican Refining Company L.L.C. for $9 million in cash, on December 9, 2004. In 2006 the Pelican Refinery Company LLC commences production and equipped with an atmospheric distillation unit, a vacuum distillation unit, a Pre-Flash Drum and an asphalt terminal. It was run mainly as an asphalt plant and sold some of its byproducts to other refiners for further processing. By 2011, the Lake Charles refinery's production was down to zero. Recent survey by EIA says its vacuum distillation unit has 12,000 bpd capacity.
23

Lazarus Energy Holdings LLC 2006- Shepard Oil Co 1980-82
Canal Refining Co 1980-06
Sooner Refining Co 1980-82 Laidlaw Environmental Systems 1992-92
GSX Recovery Systems 1983-91
Dubach Gas 2000- Pelican Refinery 2004-
El Paso Field Services 1997-99 American Int’l Refining Inc 1997-04
Arcadia Refining 1995-96 Gold Line Refining Ltd 1992-97
Endevco Inc 1989-94 American Int’l Refining Inc 1989-91
Kerr-McGee Refining Corp 1985-88 Lake Charles Refining Co 1980-88
Kerr-McGee Corp 1980-84 Aweco 1979-79
Conoco Inc 1982-89 Lisbon Refinery J.V LLC 1998-07
Conoco 1980-81 Padre Refining Co 1997-98
Continental Oil Co 1979 Arcadia Refining & Mktg. Co 1995-96
Dubach Gas Co 1992-94
Quantum Fuel & Refining 1998- Claiborne Gasoline Co 1980-91
U.S. Refining Inc 1994-98
Britt Processing & Refining Co 1992-93 Lazarus Energy Holdings LLC 2006-
Crystal Refining Inc 1989-91 Gold Line Refining Co Ltd 1994-98
OGC Corp 1988-88 CAS Refining 1991-93
Louisiana Oil Refining Co of Egan 1987-87 Celeron Oil and Gas Co 1983-90
Slapco 1980-82
Tina Resources Inc 1993-96 South Louisiana Production Co 1979
Cameron Oil Refining Co Inc 1992-92
Cameron Resources 1990-91 Petroleum Fuel & Terminal Co 1992-03
Mallard Resources Inc 1980-89 Clark Oil and Refining Corp 1983-91
Mt. Airy Refining 1980-82
Bayou State Oil Corp 1980-06
St. James Co LLC 1998-03
Texas NAPCO Inc 1983-98
Evangeline Refining Co 1980-92 La Jet Inc 1980-82
Source: DNR Database - Refiner's Monthly Report, R-3 Report and TAD Refinery Survey
EVN / 9135 Jennings
MTR / 9160 Mt. Airy
TXS / 9157 St. James
CNL / 9120 Church Pt.
SNR / 9178 Darrow
KRR / 430Z Dubach
CAN / 9171 Egan
LOR / 9164 Egan
MLL / 9158 Gueydon
BYS / 9114 Hosston
SHP/ 9172 Jennings
TSR / 9150 Jennings
LKC / 9102 Lake Charles
CLB / 9125 Lisbon
SLP / 9173 Mermenteau
Table 11Louisiana Non-Operating Refinery Name History (1980-2014)
Refinery Name DatesFAC/Conservation Code & Location
Refinery Name DatesFAC/Conservation Code & Location
24

Table 11 (Continued) Louisiana Non-Operating Refinery Name History (1980-2014)
Refinery Name Dates FAC/Conservation Code & Location Refinery Name Dates FAC/Conservation
Code & Location
McTan Refining Corp 1983-96 BRN / 9162 St. James Sabine Resources Group
1990-92 PRT / 9166 Stonewall
McTan Corp 1982-82 Port Petroleum Inc 1980-89
Bruin Refining Co 1980-81
Schulze Processing Inc 1981-82 SCH / 9169
Tallulah Shell Oil Products US 2012- INT / 9155
St. Rose Shell Chemical Co 1996-11
St. Rose Refinery Inc 1994-95 Idle
Gulf Oil Co USA 1981-81 GLF / 9149
Venice Phibro Energy USA Inc 1993-93
Gulf Oil Corp 1980-80
Phibro Refining Inc 1992-92
Hill Petroleum Co 1987-91 International Processors 1981-86
Source: DNR Database - Refiner's Monthly Report, R-3 Report and TAD Refinery Survey
Shell Chemical Co - Norco Refinery The Shell Chemical Co owns the plant which produces ethylene, propylene and butadiene using a variety of feedstocks including crude oil. Technically this is a chemical plant but is considerate as refinery by Louisiana Office of Conservation, but EIA and O&G Journal consider it as part of the Norco Manufacturing Complex (Valero refinery). Shell Chemical Co - St Rose Refinery Shell Chemical Co and IMTT (International-Matex Tank Terminals) owns and operates this petroleum refinery located in St. Rose, St. Charles Parish Louisiana. The refinery was acquired by Shell on August 11, 1995 from St. Rose Refining, Inc. Process units at the St. Rose 55,000 barrel/day refinery includes a crude distillation column, vacuum flasher, steam boiler, storage tanks, a wastewater treatment plant, and various support facilities. The facility was in the process of converting to an asphalt production facility. Today the refinery is idle and has not process any crude since October 2010. By 2012 IMITT completed construction of the tank farm and associated infrastructure at the site. The tank farm has 212 tanks with a total capacity of 163 million barrels, and truck and railcar loading/unloading facilities with spill containment and many fitted with vapor emissions controls and monitoring instrumentation; in excess of 100 tank car spots able to handle vegetable oil, chemical and petroleum heated and non-heated products.
25

Table 12 Louisiana Non-Operating Refinery Mailing Address and Contact Information
Company Name Mailing Address Contacts Telephone
Lazarus Energy Holdings LLC 4400 Post Oak Pkwy
Mr. Jason Huering (713) 850 0500 Houston, TX 77027
Lazarus Energy Holdings LLC 4400 Post Oak Pkwy
Mr. Jason Huering (713) 850 0500 Houston, TX 77027
Quantum Fuel & Refining PO Box 136
Mr. Mike McQueen (713) 977 6108 Newton, TX 75966
Source: DNR Database - Refiner's Monthly Report, R-3 Report and TAD Refinery Survey
Table 13 Louisiana Non-Operating Refinery Location and Status Information
Name Physical Location
Last Known
Operating Capacity
Date Last Operated
Status
American International Refinery Inc
La. 3059 Lake Charles
35,000 2003 Sold to Pelican Refining in 2005 (asphalt plant, no crude capacity).
Bayou State Oil Corp US 71 N. @ La. 2 West Hosston
3,000 Feb. 1987 Dismantled.
Lazarus Energy Co 1901 E. Ebey Church Point
30,000 2003 Planning to start up.
Lazarus Energy Co U.S. 90 E. Jennings
14,800 Feb. 1998 Planning to start up.
Lisbon Refinery J.V. LLC La. 2 Lisbon
12,500 Jan. 1996 Dismantled.
Ergon St. James Co LLC La.18 St. James
20,000 Aug. 1983 Dismantled.
Tina Resources Inc La. 14 Lake Arthur
7,400 Dismantled.
Feb. 1986
Quantum Fuel & Refining 101 Old Ferry Rd. Egan
10,000 Sep. 1987 Planning to start up.
Shell Chemical Co 11842 River Rd. St. Rose
45,000 May-09 Idle
Source: DNR Database - Refiner's Monthly Report, R-3 Report and TAD Refinery Survey
26

Louisiana Refineries Motor Fuels Production Motor fuels are the sum of diesel, jet fuel and motor gasoline. They are major components of the total output slate from the refineries as shown on Table 5 (pg. 13). Motor gasoline is 39.3%, jet fuel is 7.4% and diesel fuel is 23.9% of the total Louisiana refineries product slate output. Motor gasoline: 2014 production increased 2.2% over 2013 and 8.8% over 2010 production.
The Louisiana refineries gasoline production averages by type are 82% regular gasoline, 13% premium gasoline and 5% of RPG gasoline.
Jet fuel: 2014 production increased 2.1% over 2013 but decrease 2.5% from 2010. Diesel fuel: 2014 production increased 5.9% over 2013 and 19.5% over 2010.
Figure 7
Louisiana Refineries Motor Fuels Production 2000 - 2014
Source: DNR Database, from Refiner's Monthly Report (R-3 Report)
Figure 7 showed Louisiana an average production increase 3.2% per year in motor gasoline and 5.8% in diesel fuel over the past five years. While the jet fuel showed an almost stable production level for the same time period.
00 01 02 03 04 05 06 07 08 09 10 11 12 13 14
JET FUEL 109 98 99 101 98 104 104 106 96 97 103 100 95 98 100
DIESEL FUEL 199 205 199 204 221 211 224 245 250 246 269 313 290 304 322
MOTOR GASOLINE 484 475 492 479 496 458 472 486 434 451 486 502 504 518 529
0
100
200
300
400
500
600
Mill
ion
Bar
rels
per
Yea
r
27

Operating Idle Operating Idle
HLL 80,000 0 83,000 0 36,200 0 0 0 0
CLC 80,000 0 85,000 0 30,000 0 0 0 0
CTT 13,020 0 14,000 0 0 0 0 0 0
CLM 8,300 0 8,655 0 7,000 0 0 0 0
ATL 57,000 0 60,000 0 28,000 0 0 0 0
TNN 192,500 0 195,000 0 116,700 30,000 0 0 0
CTS 427,800 0 440,000 0 230,000 110,000 0 0 0
0 0 0 0 0 0 0 0 0
EXX 502,500 0 523,200 0 246,100 123,500 0 0 0
MRT 522,000 0 561,000 0 291,000 93,500 0 0 0
TXC 235,000 0 255,000 0 119,400 0 0 0 0
SHL 238,000 0 250,000 0 95,000 28,500 0 0 0
Pelican Refining Company LLC PLN 0 0 0 0 12,000 0 0 0 0
Lake Charles
STN 247,000 0 260,000 0 103,000 26,000 0 0 0
CNB 260,000 0 273,000 0 132,000 60,000 0 0 10,600
PLC 75,000 0 82,000 0 27,000 0 0 0 0
INT 0 45,000 0 46,000 25,000 0 0 0 0
MRP 125,000 0 128,000 0 60,000 0 0 0 0
GDH 215,000 0 220,000 0 160,000 84,000 0 0 0
3,278,120 45,000 3,437,855 46,000 1,718,400 555,500 0 0 10,600
Source: Energy Information Administration, "Refinery Capacity Report 2015", Table 3
Valero Refining Co Norco
Totals
Marathon Petroleum Co LLC Garyville
Motiva Enterprises LLC Convent
Motiva Enterprises LLC Norco
Placid Refining Co Port Allen
Shell Chemical Co St. Rose
Valero Refining Co Meraux
Citgo Petroleum Corp Lake Charles
Phillips 66 Belle Chasse
Phillips 66 West Lake
Excel Paralubes Westlake
EXL
ExxonMobil Refining & Supply Co Baton Rouge
Chalmette Refining LLC Chalmette
Vacuum Distillation
Thermal Cracking
Delayed Coking
Fluid Coking
Vis- Breaking
Other Gas/Oil
Alon Refining Krotz Springs Inc Krots Springs
Calcasieu Refining Co Lake Charles
Calumet Lubricants Co LP Cotton Valley
Calumet Lubricants Co LP Princeton
Calumet Shreveport LLC Shreveport
Table 14 U.S. Energy Information AdministrationCapacity of Louisiana Operable Petroleum Refineries as of January 1, 2015
(Barrels per Stream Day, Except Where Noted)
Refinery NameDNR FAC Code
Atmospheric Crude Oil Distillation Capacity Downstream Charge Capacity
Barrels per Calender Day
Barrels per Stream Day
28

HLL 34,000 0 0 0 0 0 13,000 0
CLC 0 0 0 0 0 0 0 0
CTT 0 0 0 0 0 0 0 0
CLM 0 0 0 0 0 0 0 0
ATL 0 0 0 0 0 12,000 0 0
TNN 75,600 0 0 0 0 23,000 0 0
CTS 148,000 3,000 0 47,300 0 58,000 52,000 0
EXL 0 0 0 42,000 0 0 0 0
EXX 244,500 0 27,000 0 0 76,000 0 0
MRT 138,000 0 0 117,000 0 128,000 0 37,500
TXC 92,000 0 0 0 52,000 0 40,000 0
SHL 118,800 0 0 44,000 0 40,000 0 0
Pelican Refining Company LLC PLN 0 0 0 0 0 0 0 0
Lake Charles
STN 105,000 2,000 0 0 0 0 48,490 0
CNB 50,000 0 0 0 0 44,000 0 0
PLC 25,000 500 0 0 0 11,000 0 11,000
INT 0 0 0 0 0 0 0 0
MRP 0 0 0 47,000 0 32,000 0 22,000
GDH 100,000 0 28,000 70,000 0 27,500 0 0
1,130,900 5,500 55,000 367,300 52,000 451,500 153,490 70,500
Source: Energy Information Administration, "Refinery Capacity Report 2015", Table 3
Table 14 (Continued) U.S. Energy Information Administration
Valero Refining Co Meraux
Valero Refining Co Norco
Totals
Capacity of Louisiana Operable Petroleum Refineries as of January 1, 2015(Barrels per Stream Day, Except Where Noted)
Motiva Enterprises LLC Convent
Motiva Enterprises LLC Norco
Phillips 66 Belle Chasse
Phillips 66 West Lake
Placid Refining Co Port Allen
Shell Chemical Co St. Rose
Calumet Shreveport LLC Shreveport
Chalmette Refining LLC Chalmette
Citgo Petroleum Corp Lake Charles
Excel Paralubes Westlake
Marathon Petroleum Co LLC Garyville
High Pressure
Refinery Name
Alon Refining Krotz Springs Inc Krots Springs
Calcasieu Refining Co Lake Charles
Calumet Lubricants Co LP Cotton Valley
Calumet Lubricants Co LP Princeton
Fresh Recycled Distillate Gas Oil ResidualLow
Pressure
DNR FAC Code
Downstream Charge Capacity (Continued)
Catalytic Cracking Catalytic Hydrocracking Catalytic Reforming Fuels Solvent
Deasphalting
ExxonMobil Refining & Supply Co Baton Rouge
29

HLL 14,000 18,000 0 0 0 0 0 0
CLC 0 0 0 0 0 0 0 0
CTT 6,200 0 0 0 0 0 0 0
CLM 0 0 0 0 0 0 0 0
ATL 16,000 0 0 14,000 0 0 21,100 1,200
TNN 22,000 44,000 0 30,000 0 0 64,800 0
CTS 127,000 85,400 64,800 100,000 0 0 0 0
EXL 0 0 0 0 0 0 0 0
EXX 76,000 238,000 0 189,500 0 0 0 23,000
MRT 106,500 110,000 80,000 149,000 0 0 106,000 0
TXC 98,000 0 39,800 70,000 0 0 40,000 0
SHL 38,500 77,000 0 70,000 0 0 0 0
Pelican Refining Company LLC PLN 0 0 0 0 0 0 0 0
Lake Charles
STN 50,540 65,000 0 74,800 0 0 0 0
CNB 50,000 38,500 24,000 55,000 0 12,500 49,000 0
PLC 11,000 20,000 0 25,000 0 0 0 0
INT 0 0 0 0 0 0 0 0
MRP 40,000 0 16,400 45,000 0 0 0 0
GDH 44,000 60,000 12,000 50,000 44,000 0 24,000 0
699,740 755,900 237,000 872,300 44,000 12,500 304,900 24,200Totals
Source: Energy Information Administration, "Refinery Capacity Report 2015", Table 3
Motiva Enterprises LLC Convent
Motiva Enterprises LLC Norco
Placid Refining Co Port Allen
Shell Chemical Co St. Rose
Valero Refining Co Meraux
Valero Refining Co Norco
Citgo Petroleum Corp Lake Charles
Phillips 66 Belle Chasse
Phillips 66 West Lake
Excel Paralubes Westlake
ExxonMobil Refining & Supply Co Baton Rouge
Marathon Petroleum Co LLC Garyville
Chalmette Refining LLC Chalmette
Kerosene/Jet Fuel
Diesel FuelOther
DistillateResidual
Alon Refining Krotz Springs Inc Krots Springs
Calcasieu Refining Co Lake Charles
Calumet Lubricants Co LP Cotton Valley
Calumet Lubricants Co LP Princeton
Calumet Shreveport LLC Shreveport
Table 14 (Continued) U.S. Energy Information Administration
Heavy Gas Oil
Other
Capacity of Louisiana Operable Petroleum Refineries as of January 1, 2015(Barrels per Stream Day, Except Where Noted)
Refinery NameDNR FAC Code
Downstream Charge Capacity (Continued)
Desulfurization (incl. Catalytic Hydrotreating)
Naptha/Reformer Feed
Gasoline
30

HLL 0 0 0 0 6,220 0 0 0 0
CLC 0 0 0 3,500 0 0 0 0 0
CTT 0 0 0 0 500 0 0 2 0
CLM 0 0 2,000 0 0 7,000 0 4 3
ATL 0 0 6,500 0 0 12,500 0 12 40
TNN 16,800 5,800 0 0 8,200 0 9,000 0 935
CTS 24,000 17,200 0 0 28,000 0 30,000 0 717
EXL 0 0 0 0 0 30,000 0 0 185
EXX 41,000 0 0 0 0 16,500 31,525 0 800
MRT 33,000 0 33,000 23,000 26,500 0 33,000 0 1,476
TXC 16,500 0 0 0 12,500 0 0 0 728
SHL 16,800 0 0 0 0 0 7,316 0 180
Pelican Refining Company LLC PLN 0 0 6,000 0 0 0 0 0 0
Lake Charles
STN 35,000 15,500 0 0 0 0 6,716 0 125
CNB 6,000 0 0 0 0 0 22,500 0 440
PLC 7,500 0 0 0 0 0 0 0 55
INT 0 0 13,000 0 0 0 0 0 0
MRP 0 0 0 0 0 0 0 0 180
GDH 21,000 3,000 0 0 0 0 26,000 100 880
217,600 41,500 60,500 26,500 81,920 66,000 166,057 118 6,744
Source: Energy Information Administration, "Refinery Capacity Report 2015", Table 4
Sulfur (short tons per day)Isobutane
Isopentane and
Isohexane
Table 15 U.S. Energy Information AdministrationProduction Capacity of Lousiana Operable Petroleum Refineries as of January 1, 2015
(Barrels per Stream Day, Except Where Noted)
Refinery NameDNR FAC
CODE
Production Capacity
Alkylate Aromatics
Asphalt and
Road Oil
Chalmette Refining LLC Chalmette
Isomers
Lubricants
Marketable Petroleum
CokeHydrogen (MMcfd)
Alon Refining Krotz Springs Inc Krots Springs
Calcasieu Refining Co Lake Charles
Calumet Lubricants Co LP Cotton Valley
Calumet Lubricants Co LP Princeton
Calumet Shreveport LLC Shreveport
Citgo Petroleum Corp Lake Charles
Phillips 66 Belle Chasse
Phillips 66 West Lake
Excel Westlake
ExxonMobil Refining & Supply Co Baton Rouge
Marathon Petroleum Co LLC Garyville
Totals
Motiva Enterprises LLC Convent
Motiva Enterprises LLC Norco
Placid Refining Co Port Allen
Shell Chemical Co St. Rose
Valero Refining Co Meraux
Valero Refining Co Norco
31

74,000 36,000133,000 112,000 114,000
24,500
75,000
13,500135,000
10,000 8,50048,000
60,000 15,000110,000 C48,500 112,000
57,000135,000
189,000 162,000228,500 172,000 321,500 121,500
730,500863,000
1243,000
440,000 79,800288,200 1126,000 142,300 C137,800 1103,500
352,200 26,300426,100532,400864,800
36,100
502,500 236,5002117,500 1232,500 273,500 C124,500 173,500
2105,0007183,0001123,500
12101,0001347,500
522,000 276,500288,800 1131,100 3121,600 1111,200 1101,200
476,0005141,6008100,700
12104,500
See page 36 for notes and legend
ExxonMobil Refining Supply Co. Baton Rouge
EXX
Citgo Petroleum Corp. Lake Charles
CTS
Excel Paralubus (Citgo Oil Corp) Westlake
EXL
Calumet Lubricants Co. Princeton
CLM
Calumet Lubricants Co. Shreveport
ATL
Chalmette Refining LLC Chalmette
TNN
Alon Refining Krotz Springs Inc. Krotz Springs
HLL
Calcasieu Refining Co. Lake Charles
CLC
Calumet Lubricants Co. Cotton Valley
CTT
Marathon Ashland Petroleum LLC Garyville
MRT
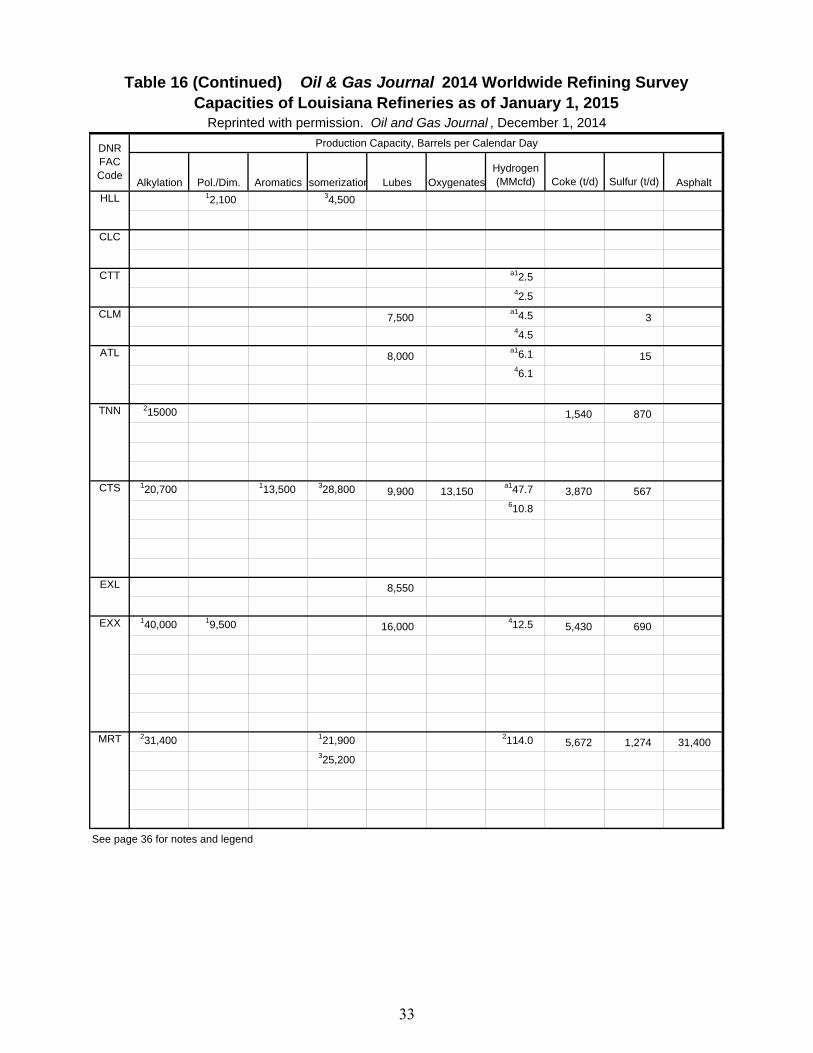
Table 16 Oil & Gas Journal 2014 Worldwide Refining SurveyCapacities of Louisiana Refineries as of January 1, 2015
Reprinted with permission. Oil and Gas Journal , December 1, 2014
Refinery NameDNR FAC Code
Charge Capacity, Barrels per Calendar Day
CrudeVacuum
Distillation CokingThermal
OperationsCatalytic Cracking
Catalytic Reforming
Cat Hydro-cracking
Cat Hydro-treating
32
12,100 34,500
a12.542.5
7,500a14.5 344.5
8,000a16.1 1546.1
215000 1,540 870
120,700 113,500 328,800 9,900 13,150a147.7 3,870 567610.8
8,550
140,000 19,500 16,000412.5 5,430 690
231,400 121,900 2114.0 5,672 1,274 31,400325,200
See page 36 for notes and legend
Sulfur (t/d) Asphalt
CTS
EXX
CLC
CTT
CLM
ATL
TNN
MRT
EXL
HLL
Table 16 (Continued) Oil & Gas Journal 2014 Worldwide Refining SurveyCapacities of Louisiana Refineries as of January 1, 2015
Reprinted with permission. Oil and Gas Journal , December 1, 2014
DNR FAC Code
Production Capacity, Barrels per Calendar Day
Alkylation Pol./Dim. Aromatics Isomerization Lubes OxygenatesHydrogen (MMcfd) Coke (t/d)
33

230,000 104,000212,520 182,000 136,000 245,000 140,000
426,000564,000838,000
1248,000
235,000 78,000225,000 1107,000 120,000 C139,000 138,000
438,000 536,0001249,500
247,000 97,900123,400 194,500 143,100 145,400
767,3001258,5001332,400
244,000 106,200261000 146,100 343,200 335,100 151,900
327,900 425,100535,000
64,000724,000845,700
1231,5001312,100
82,000 27,000122,500 111,000 111,000
525,0001220,000
55,000 28,000
135,000 50,000137,000 235,000
752,000912,000
1324,750
280,000 200,000270,400 1100,000 325,000 60,000
236,000548,000835,100
1212,000
3,394,000 1,541,500 502,800 12,520 1,086,200 549,400 397,000 2,579,350
See page 36 for notes and legend
Valero Energy Corp. Meraux
MRP
Valero Energy Corp. Norco
GDH
Totals
Cat Hydro-cracking
Cat Hydro-treating
Placid Refining Co. LLC Port Allen
PLC
Motiva Enterprises LLC Norco
SHL
Phillips 66 Belle Chasse
STN
Phillips 66 Westlake
CNB
Shell Chemical Co. St. Rose
INT
Motiva Enterprises LLC Convent
TXC
Table 16 (Continued) Oil & Gas Journal 2008 Worldwide Refining SurveyCapacities of Louisiana Refineries as of January 1, 2015
Reprinted with permission. Oil and Gas Journal , December 1, 2014
Refinery NameDNR FAC Code
Charge Capacity, Barrels per Calendar Day
CrudeVacuum
Distillation CokingThermal
OperationsCatalytic Cracking
Catalytic Reforming
34

114,000 24,000 312,000 158.0 640
114,000 17780 18,000150.0 1,020 140
234,200 130,000 710.4 1,100 8028,100
17,700 11,900 a115.0 3,600 3374112.0
27,500 50
28,500 1,800
119,000 4,500 450
Totals 212,000 25,280 51,800 92,400 49,950 11,150 457 26,732 6,916 31,400
See page 36 for notes and legend
MRP
GDH
OxygenatesHydrogen (MMcfd) Coke (t/d)
STN
CNB
INT
Sulfur (t/d) Asphalt
PLC
Table 16 (Continued) Oil & Gas Journal 2014 Worldwide Refining SurveyCapacities of Louisiana Refineries as of January 1, 2015
Reprinted with permission. Oil and Gas Journal , December 1, 2014
DNR FAC Code
Production Capacity, Barrels per Calendar Day
Alkylation Pol./Dim. Aromatics Isomerization Lubes
SHL
TXC
35

Legend & Notes for Table 16 Source: Oil & Gas Journal’s 2014 Worldwide Refinery Report
LEGEND Coking 1. Fluid coking 2. Delayed coking 3. Other Thermal Processes 1. Thermal cracking 2. Visbreaking Catalytic Cracking 1. Fluid 2. Other Catalytic Reforming 1. Semiregenerative 2. Cyclic 3. Continuous regenerative 4. Other Catalytic Hydrocracking 1. Distillate upgrading 2. Residual upgrading 3. Lube oil manufacturing 4. Other c. Conventional (high-pressure) hydrocracking: (>100 barg or 1,450 psig) m. Mild to moderate hydrocracking: (<100 barg or 1,450 psig) Catalytic Hydrotreating 1. Pretreating cat reformer feeds 2. Naphtha desulfurization 3. Naphtha aromatics saturation 4. Kerosine/jet fuel desulfurization 5. Diesel desulfurization 6. Distillate aromatics saturation 7. Other distillates 8. Pretreatment of cat cracker feeds 9. Other heavy gas oil hydrotreating 10. Resid hydrotreating 11. Lube oil polishing 12. Post hydrotreating of FCC naphtha 13. Other Alkylation 1. Sulfuric acid 2. Hydrofluoric acid Polymerization/Dimerization 1. Polymerization 2. Dimerization Aromatics 1. BTX 2. Hydrodealkylation 3. Cyclohexane 4. Cumene Isomerization 1. C4 feed 2. C5 feed 3. C5 and C6 feed
Oxygenates 1. MTBE 2. ETBE 3. TAME 4. Other Hydrogen Production: 1. Steam methane reforming 2. Steam naphtha reforming 3. Partial oxidation a. Third-party plant Recovery: 4. Pressure swing adsorption 5. Cryogenic 6. Membrane 7. Other NOTES Capacity definitions: Capacity expressed in barrels per calendar day (b/cd) is the maximum number of barrels of input that can be processed during a 24-hr period, after making allowances for the following: (a) Types and grades of inputs to be processed. (b) Types and grades of products to be manufactured. (c) Environmental constraints associated with refinery operations. (d) Scheduled downtime such as mechanical problems, repairs, and slowdowns. Capacity expressed in barrels per stream day (b/sd) is the amount a unit can process when running at full capacity under optimal feedstock and product slate conditions. An asterisk (*) beside a refinery location indicates that the number has been converted from b/sd to b/cd using the conversion factor 0.95 for crude and vacuum distillation units and 0.9 for all downstream cracking and conversion units. Hydrogen: Hydrogen volumes presented here represent either generation or upgrading to 90+% purity. Catalytic reforming: 1. Semiregenerative reforming is characterized by shutdown of the reforming unit at specified intervals, or at the operator’s convenience, for in situ catalyst regeneration. 2. Cyclic regeneration reforming is characterized by continuous or continual regeneration of catalyst in situ in any one of several reactors that can be isolated from and returned to the reforming operation. This is accomplished without changing feed rate or octane. 3. Continuous regeneration reforming is characterized by the continuous regeneration of part of the catalyst in a special regenerator, followed by continuous addition of this regenerated catalyst to the reactor. 4. Other includes nonregenerative reforming (catalyst is replaced by fresh catalyst) and moving-bed catalyst systems.
36

Glossary Asphalt - A dark-brown to black cement-like material containing bitumen as the predominant constituents, obtained by petroleum processing. The definition includes crude asphalt as well as the following finished products: cements, fluxes, the asphalt content of emulsions (exclusive of water), and petroleum distillates blended with asphalt to make cutback asphalts. The conversion factor f or asphalt is 5.5 barrels of 42 U.S gallons per short ton. ASTM – It is the acronym for the American Society for Testing and Materials. Barrels per calendar day – It is the amount of input that a distillation facility can process under usual operating conditions. The amount is expressed in terms of capacity during a 24-hour period and reduces the maximum processing capability of all units at the facility under continuous operation (see Barrels per Stream Day) to account for the following limitations that may delay, interrupt, or slow down production:
The capability of downstream facilities to absorb the output of crude oil processing facilities of a given refinery. No reduction is made when a planned distribution of intermediate streams, through other than downstream facilities, is part of a refinery’s normal operation;
The types and grades of inputs to be processed;
The types and grades of products expected to be manufactured;
The environmental constraints associated with refinery operations;
The reduction of capacity for scheduled downtime due to such conditions as routine
inspection, maintenance, repairs, and turnaround; and
The reduction of capacity for unscheduled downtime due to such conditions as mechanical problems, repairs, and slowdowns
Barrels per stream day – It is maximum number of barrels of input that a distillation facility can process within a 24-hour period when running at full capacity under optimal crude oil and product slate conditions with no allowance for downtime. Butane - A normally gaseous straight chain or branch chain hydrocarbon, (C4H10), it is extracted from natural gas or refined gas streams. It includes isobutene and normal butane and is covered by ASTM Specification D1835 and Gas Processors Association Specifications for commercial butane
Isobutene - A normally gaseous branch chain hydrocarbon, (C4H10), it is a colorless paraffinic gas that boils at a temperature 10.9 degrees F. It is extracted from natural gas or refinery gas streams.
37

Normal Butane - A normally gaseous straight ·chain hydrocarbon, (C4H10), it is a colorless paraffinic gas that boils at a temperature of 31 1degrees F. It is extracted from natural gas or refinery gas streams.
Catalytic Cracking – It is the refining process of breaking down the larger, heavier, and more complex hydrocarbon molecules into simpler and lighter molecules. Catalytic cracking is accomplished by the use of a catalytic agent and is an effective process for increasing the yield of gasoline from crude oil Catalytic Hydrocracking – It is refining process for converting middle boiling or residual material to high-octane gasoline, reformer charge stock, jet fuel and/or high grade fuel oil. Hydrocracking is an efficient, relatively low temperature process using hydrogen and a catalyst. Catalytic Hydrotreating – It is process for treating petroleum fractions (e.g. distillate fuel oil and residual oil) and unfinished oils (e.g. naphtha, reformer feeds and heavy gas oils) in the presence of catalysts and substantial quantities of hydrogen to upgrade their quality. Charge capacity - The input (feed) capacity of the refinery processing facilities. Ethane - A normally gaseous straight-chain hydrocarbon,(C2H6). It is a colorless paraffinic gas that boils at a temperature of -127.48 degrees F. It is extracted from natural gas and refinery gas streams. Ethylene – It is a small hydrocarbon gas, (C2H4), recovered from refinery processes or petrochemical processes Idle capacity - The component of operable capacity that is not in operation and not under active repair, but capable of being placed in operation within 30 days; and capacity not in operation, but under active repair that can be completed within 90 days. Lubricating Oils - A substance used to reduce friction between bearing surfaces. Petroleum lubricants may be produced either from distillates or residues. Other substances may be added to impart or improve certain recurred properties "Lubricants" includes all grades of lubricating oils from spindle oil to cylinder oil and those used in greases. Operable capacity - The amount of capacity that, at the beginning of the period, is in operation; not in operation and not under active repair, but capable of being placed in operation within 30 days; or not in operation, but under active repair that can be completed within 90 days. Operable capacity is the sum of the operating and idle capacity and is measured in barrels per calendar day or barrels per stream day. Note: This survey uses the capacity at the end of the period. Operating capacity - The component of operable capacity that is in operation at the beginning of the period. Note: This survey uses the capacity at the end of the period.
38

Operating utilization rate - Represents the utilization of the atmospheric crude oil distillation units. The rate is calculated by dividing the gross input to these units by the operating refining capacity of the units. Operating rate % - Throughput divided by 365 divided by operating capacity expressed as a percentage. Operable rate % - Throughput divided by 365 divided by operable capacity expressed as a percentage. Petroleum Products - Petroleum products are obtained from the processing of crude oil (including lease condensate), natural gas and other hydrocarbon compounds. Petroleum products include unfinished oils, liquefied petroleum gases, pentanes plus, aviation gasoline, motor gasoline, naphtha-type jet fuel, kerosene-type jet f uel, kerosene, distillate fuel oil, residual fuel oil, naphtha less than 400 F. end-point, other oils· over 400 F. end-point , special naphtha, lubricants, waxes, petroleum coke, asphalt, road oil, still gas, and miscellaneous products Petroleum Refinery - An installation that manufacturers finished petroleum products from crude oil, unfinished oils, natural gas liquids, other hydrocarbons, and alcohol· Thermal Cracking - It is a refining process in which heat and pressure are used to break down, rearrange or combine hydrocarbon molecules. Thermal cracking is used to increase the yield of gasoline obtainable from crude oil. Throughput - Is the actual barrels of crude oil processed by the atmospheric stills for the survey time period. Vacuum Distillation – Distillation under reduced pressure (less the atmospheric) which lowers the boiling temperature of the liquid-being distilled. This technique with its relatively low temperatures prevents cracking or decomposition of the charge stock Wax - A solid or semi-solid material derived from petroleum distillates or residues by such treatments as chilling, precipitating with a solvent, or de-oiling. It is light-colored, more-or-less translucent crystalline mass, slightly greasy to the touch, consisting of a mixture of solid hydrocarbons in which the paraffin series predominates. Includes all marketable wax whether crude scale or fully refined. The three wax grades included are:
Microcrystalline Wax - Wax extracted from certain petroleum residues having a finer and less apparent crystalline structure than paraffin wax.
Crystalline-Fully Relined Wax - A light-colored paraffin wax. Crystalline-Other Wax - A paraffin wax.
39