Embed Size (px)
Citation preview

Louise Yamada
Technical Research Advisors, LLC
L O U I S E Y A M A D A R O N A L D L O U I S E Y A M A D A R O N A L D F. D A I N O F. D A I N O A l a n R. S h a w A l a n R. S h a w -- C o n s u l t a n t E m e r i t u s C o n s u l t a n t E m e r i t u s
TechnicalPerspectives
January 4, 2006Volume II, No. 1
OUTLOOK 2006
Less “Americentric” – 2006 A Good Year in the Right Stocks.
The Alternating Hypothesis Still In Play.
A Few Dark Clouds; Selective Silver Linings.
Gold, Oil, CRB, Dollar, and Interest Rates Addressed.
Global Growth: Similar to the 1942-66 U.S. War / Post-War
Boom?
Editorial: Food for Thought.
Gold and the Dollar.
Global Wage and Price Equalization.
Inflation Thoughts.
Sub-Industries: Capitalization weightings on the Relative Buy and Hold lists unchanged week to week:
S&P 500, 52% S&P 400, 46% S&P 600, 42%
LY Alert – Crude Oil on the Move Again.
Louise Yamada, CMT [email protected]
Ronald F. Daino, CMT [email protected]
Jonathan T. Lin, CMT, CFA [email protected]
-2-
LY ADVISORS: Technical Perspectives January 4, 2006
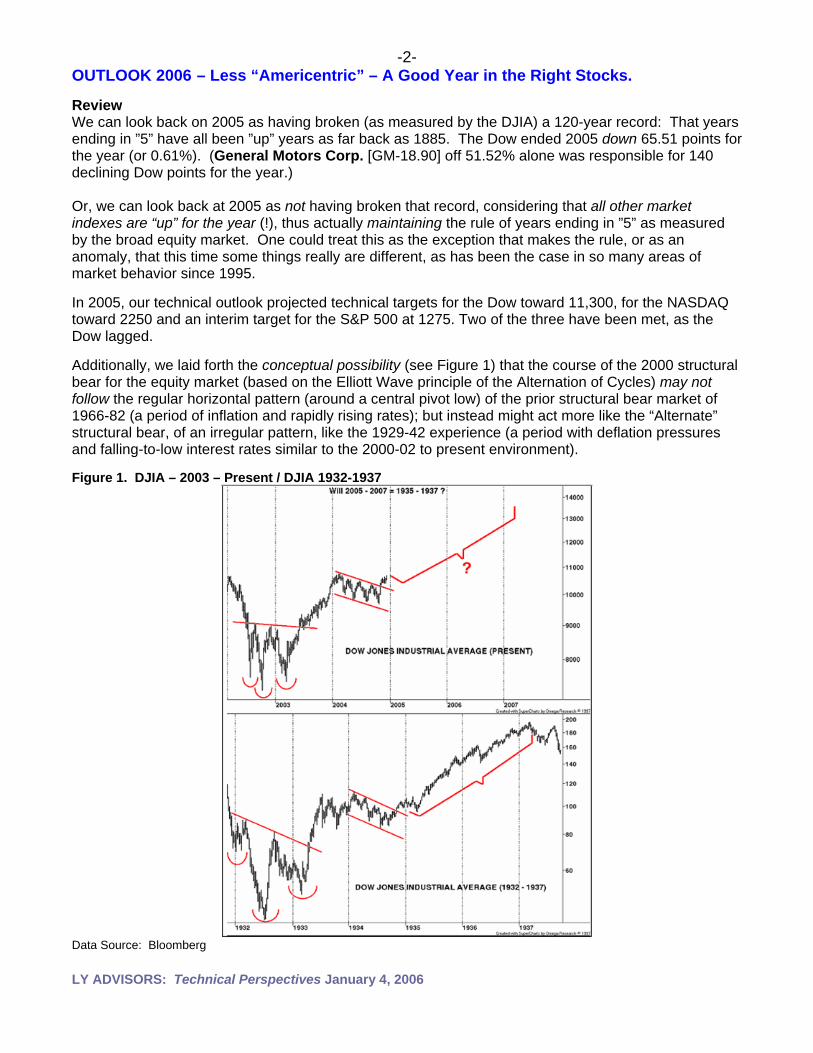
OUTLOOK 2006 – Less “Americentric” – A Good Year in the Right Stocks. Review We can look back on 2005 as having broken (as measured by the DJIA) a 120-year record: That years ending in ”5” have all been ”up” years as far back as 1885. The Dow ended 2005 down 65.51 points for the year (or 0.61%). (General Motors Corp. [GM-18.90] off 51.52% alone was responsible for 140 declining Dow points for the year.) Or, we can look back at 2005 as not having broken that record, considering that all other market indexes are “up” for the year (!), thus actually maintaining the rule of years ending in ”5” as measured by the broad equity market. One could treat this as the exception that makes the rule, or as an anomaly, that this time some things really are different, as has been the case in so many areas of market behavior since 1995. In 2005, our technical outlook projected technical targets for the Dow toward 11,300, for the NASDAQ toward 2250 and an interim target for the S&P 500 at 1275. Two of the three have been met, as the Dow lagged. Additionally, we laid forth the conceptual possibility (see Figure 1) that the course of the 2000 structural bear for the equity market (based on the Elliott Wave principle of the Alternation of Cycles) may not follow the regular horizontal pattern (around a central pivot low) of the prior structural bear market of 1966-82 (a period of inflation and rapidly rising rates); but instead might act more like the “Alternate” structural bear, of an irregular pattern, like the 1929-42 experience (a period with deflation pressures and falling-to-low interest rates similar to the 2000-02 to present environment). Figure 1. DJIA – 2003 – Present / DJIA 1932-1937
Data Source: Bloomberg

-3-
LY ADVISORS: Technical Perspectives January 4, 2006
We asked whether or not the post-crash pivot low of our structural bear experience (2000-present) may be behind us in the 2002 decline (as 1932 provided the post-crash pivot low for that alternate bear experience). We suggested, as such, that the nine-month consolidation of 2004 (see Figure 1) could provide a similar platform (to that of the 1934 consolidation) for a generous lift-off, or an extension of the previous rally, which could even carry through 2005 or beyond. All this was projected and occurred against the backdrop of improving technical indicators as we entered 2005. The 1932-37 analogy succeeded through last year (see Figures 2 and 3), particularly as measured by the small- and mid-cap outperformance focus of the NYSE, the S&P 400 and S&P 600, yet only to a lesser degree by the S&P 500 and the DJIA. The analogy still could be considered “in play” as we enter 2006, though more selectivity as to stock participation may be warranted. Figure 2 NYSE Composite (Present) S&P 400 (Present) DJIA (1932-37)
Data Source: Bloomberg

-4-
LY ADVISORS: Technical Perspectives January 4, 2006
Figure 3. S&P 500 Index (Present) DJIA (Present) and DJIA 1932-37
Data Source: Bloomberg Peering Into 2006: A Few Dark Clouds; Selective Silver Linings 1) We enter 2006 with a slightly less buoyant technical top-down indicator profile (see Technical Perspectives dated December 21, 2005) than existed as we entered January of last year. Rather than robust uptrends for advancing versus declining issues, new highs versus new lows and volume confirmations, to name a few, there are now negative divergences in view as we move into January 2006 that were not present entering 2005. These negative divergences can precede more substantial market declines from four to six to nine months from the points of divergence. But January has opened with a burst that has narrowed the Advance-Decline line (A-D) divergence to only 1,200 issues.

-5-
LY ADVISORS: Technical Perspectives January 4, 2006
2) Additionally, the decennial pattern of years ending in “6” carries only a 55% record of notching an “up” year (45% down years) since 1885. (The average return was 6.07%.) 3) We should consider that equities have enjoyed three consecutive ”up” years in a row (2003, 2004 and 2005) with very generous gains: The S&P 600 Small-cap index leads the pack with a three-year gain of 110%; the S&P 400 rose 97%; the NASDAQ rose 81%; the NYSE rose 78%; the S&P 500 rose 61%; and the Dow rose 47%. In the course of these advances, while the majority of the indexes have experienced interim corrections, the S&P 500 and the NYSE have not experienced as much as a 10%-plus decline (correction). One might wonder how long that can continue. Historically, three consecutive years up in a defined structural bear market environment (which we believe this represents, until proven otherwise) have only once seen a fourth consecutive year “up:” 1933, 1934, 1935, 1936. Interestingly, this corresponds to the same time frame (the repair phase of a bear market) we reference in our alternating observation above, thus leaving open a window for 2006. (In structural bull market periods, with strong technical indicator readings, there have been up to a five-year sequential advance in the 1920s and a nine-year sequential advance in the 1990s.) 4) Additionally, the forces of the four-year cycle, which turned up in 2002, in tandem with the equity market bottom, are now rolling down as we enter 2006 into what conceptually should provide the making of another market low. But four-year cycles can also right align, or bottom late, as they did in 1937 (and 1987), an occurrence which can make the subsequent decline more contracted and severe (as occurred in the two above examples). On the Plus Side 1) From a “bottoms-up” approach, and regardless of market action, we are finding a generous number of multi-year bases and / or reconsolidations in place in our individual point-and-figure stock work, which we have featured herein and will continue to feature in the weeks ahead. Just as there have been stocks to sell into the cyclical bull years we have enjoyed, there are also always stocks to buy in a declining market were that to occur. 2) It may well be that 2006 becomes a year of greater selectivity on individual stocks with attractive technicals. Many may carry strong international growth prospects as the developing world continues its multi-year, up-from-the ground-level, growth progression. Individual stock selection in the U.S. may become more important in 2006 than any index focus. 3) One interesting technical observation well worth making is that, even in the face of deteriorating internal technical data, we do not yet have evidence of extended major topping processes in place (with a few exceptions such as Publishing and Autos) as we had in 1999-2000. While this does not preclude a more serious decline from occurring, it does allow one to contemplate individual declines for overextended stocks, but not necessarily the end to their longer-term uptrends. Stocks already experiencing bear declines, or relative underperformance, may experience further declines. 4) The up to 20-plus-year sequential structural trend reversals that we have identified over the past five years continue their extensions, directing us to the beneficiaries of the new structural bull trending areas.
• The 18-year uptrend violations in 2000 for the DJIA and the S&P 500 remain in place, despite the generous rallies off the 2002 lows, continuing to define structural bear markets for these

-6-
LY ADVISORS: Technical Perspectives January 4, 2006
indexes. Structural bear markets are created by declines in large-cap stocks. Thus those former leaders should not be expected to lead again for some time, notwithstanding interim rallies (witness General Electric Co. [GE-35.37], Intel Corp. [INTC-25.57], Microsoft Corp. [MSFT-26.84], Pfizer Inc. [PFE-23.78] and Verizon Corp. [VZ-30.38] in the Dow).
• The small- and mid-cap outperformance cycle we identified five years ago remains in
place. We have noted that small- and mid- cap relative outperformance cycles have always tended to accompany the “repair” process years of structural bear market environments (1934-42; 1975-83). Small- and mid-cap stocks and the indexes representing them (NYSE, 400 and 600) have maintained this outperformance profile since the 2002 low.
These indices have seen prices advance into what might be considered new, or extensions of, a bull market progression. Their generous uptrends (noted above) were interspersed with corrective (not bear) interruptions. The implication may indicate a bifurcated equity market index environment, a trend that may continue into 2006, with more selectivity as to particular stocks. Large caps may join in, but we don’t see evidence of a shift to their leadership.
• The structural bull market for gold (see Figure 4) that we watched initiate in 2001 is still
intact. The past year has seen gold lift through our targets of 400 as well as the next hurdle, the resistance level at 500, just penetrated. The penetration through 500 represented a 24-year breakout for gold, an impressive achievement. Structural bull markets endure for years, even decades, and we see no exception for gold, with further technical targets to 580, 750 and beyond.
We would use pauses and / or pullbacks to accumulate gold and gold stocks. We have maintained that gold could easily exceed its 1980 peak and progress to 1000—and beyond. Global economic growth and consumer demand represent factors in gold’s favor, as well as its newly accepted entry as an “investment asset“ class.
Figure 4. London Gold Price
Data Source: Bloomberg

-7-
LY ADVISORS: Technical Perspectives January 4, 2006
• The 2003 structural bull market for energy stocks and crude oil (see Figure 5) are still in place and crude achieved our 2004 target of 67. Both the commodity and the stocks recently have been in the throes of the first more extended consolidation / corrective trend. That corrective trend appears to be coming to an end as we enter 2006 (see LY Alert on page 15).
Figure 5. Crude Oil Prices (West Texas, Monthly Average)
Data Source: Bloomberg
We believe oil has embarked on only its third multi-year step up in price (like the three years in the 1940s and the six years in the 1970s, each followed by a 24-year plateau and each time never to retreat to the prior lows). Oil may consolidate above 50, but over time, we foresee much higher levels for oil over the years and decades ahead, with the next outstanding target at 80. We would continue to use corrections to accumulate positions in energy stocks.
• The Reuters/Jefferies CRB futures index (CRB), in its new structural bull market (defined by the
penetration of a 23-year downtrend in 2002), is challenging its prior high as we move into 2006; we believe the commodity bull should continue over many years ahead, notwithstanding occasional pauses to digest gains. With energy in a structural bull, gold in a structural bull, copper lifting through a 30-year base at 153 and to a new closing all-time high currently at 216 and the agricultural products also rising in price, the CRB should continue its advance toward new all-time highs.
• The U.S. dollar survived the 2004 test of its 17-year support level at 80 and has since rallied from
our January 2005 Buy signal, as U.S. interest rates have risen somewhat. The dollar has been hesitating at 92 resistance and is testing support at 89 with an important support at 86. The dollar may remain at least stable into 2006 within a range. But we must keep in mind that the support level at 80 represents a critical structural support level to monitor into the future.
• The one still outstanding 24-year structural trend reversal remains that of the bond market
(which was also the last structural trend to reverse in the early 1980s). Interest rates, based on the 10-year Treasury note, remain in our now five-year transitional trading range between 3.5% and

-8-
LY ADVISORS: Technical Perspectives January 4, 2006
5.5% (see Figure 6). We have noted that within this range breakouts have failed to follow through, and breakdowns have failed to follow through. The continuation of this trading range may see yields fluctuate therein for another year or more, even declining again, but overall with the 10-year yield remaining relatively benign.
This behavior is in line with the 200-plus year history of interest rates in our country. Reversals from structural falling rate cycles to rising rate cycles have been very slow, multi-year affairs, and the current one is no exception perhaps because each such event has experienced deflationary pressures and structural bear market environments. The last structural rising rate cycle commenced in 1946 (14 years after the 1932 bear market low)! An eventual move through 5.5%, technically, would definitively end the 24-year bond bull market and qualify as the initiation of the next rising rate cycle. U.S. interest rate cycles have endured for 22 to 37 years.
Figure 6. 10-Year Treasury Yield
Data Source: Bloomberg
• Might global growth be similar to the 1942-66 U.S. war and post-war boom? Our Global markets’ perspective is that of emerging new structural bull markets around the world, with some like Japan and South Korea, just initiating and moving up through multi-year bottoming configurations. A glance at Figure 7 shows the relative performance of the MSCI U.S. Index to the MSCI World Index. The plunge in the U.S. relative strength through a two-year top suggests to us that global market prospects should continue to outperform the U.S. not just through 2006, but perhaps for a number of years -- in a less “Americentric” world.
The global behavior may be very similar to the U.S. war and post-war bull market period from 1942-66, an explosive period of development and growth within our country that is being mirrored, if not magnified, by growing demands from China, India, Vietnam and the balance of the rapidly developing nations.
The developing world now seems on track for a very legitimate growth boom which could provide continued bull markets for the global arena as well as bull markets for individual stocks within our growingly selective U.S. stock arena.

-9-
LY ADVISORS: Technical Perspectives January 4, 2006
The anti-American sentiment that is being fostered worldwide might suggest to us that companies of other nations may benefit more, overall, from the global growth demand, leaving the U.S. more and more on the global periphery. Thus, within our U.S. market, we may need to focus more on those equity names with good technical patterns that may be reflective of their participation in the global build-out.
Figure 7. MSCI U.S. Index/Relative Strength to MSCI World Index (Free)
Data Source: Bloomberg Wrap Up – 2006 A Good Year in the Right Stocks Moving into 2006 we expect the structural trends above to continue globally and would focus on the select Industrials, Materials, Energy, Metals and Rails, where we believe the technical Capital Goods outperformance leadership resides, representing the new-growth beneficiaries of the global build-out. These should continue to advance, notwithstanding contratrend moves which undoubtedly will arrive and seem to occur rotationally among these leaders. We can’t help reiterating the observation that global warming weather extremes of tornados, hurricanes and heat waves, on top of natural disasters of earthquakes, tsunamis, volcanoes, fires and floods, all create an ongoing need to rebuild the world—a strong case for an extended Capital Goods outperformance cycle (see Technical Perspectives dated December 7, 2005). As the growth action continues abroad, 2006 should be less “Americentric.” U.S. stocks that participate in the global growth should do well. Some large-cap names may join the mid-cap parade. As such, there is a chance that 2006 could echo 1936, completing the alternating cycle hypothesis above. Interest rates should remain benign. The 5%-5.25% level has proved to be the average as well as the median area for long-term rates. One wild card may be that select growth utilities will continue to do well even if rates inch up. Electricity is becoming the basic material of the new high-tech economy – and copper is a key ingredient in the global electric build-out. The year 2006 may be a more challenging year, but well-placed investments in the outperforming areas should make it a rewarding year as well. For reference, we include short-term and intermediate-term, more critical, support levels for the major indexes:

-10-
LY ADVISORS: Technical Perspectives January 4, 2006
Short-Term Intermediate-TermIndex Support Support
DJIA 10,730 10,000S&P 500 1250 1170, 1140NYSE 7700 7200, 7000NASDAQ 2220 2020, 1890S&P 400 730 660, 620S&P 600 350 325, 300
Editorial: Food For Thought Gold and the Dollar We believe gold is not responding to perceived forces of inflation at this point in time, as China and other low wage countries export wage and price deflation: Rather, gold has taken on a bull market cycle of its own, rising in dollars even as the dollar rallied (see Technical Perspectives dated November 23, 2005) as well as rising in most foreign currencies across the globe; this perhaps as countries struggle to maintain weak currencies (print money?) to survive in the deflationary global competitive wage and price environment. The result, of course, is one of currency devaluation. Developed country central banks have sold gold, are floating paper and now the U.S. will hide the data by no longer reporting M3 as they print dollars with abandon. The currency devaluations alone could take gold price well into thousands of dollars; China, buying gold in its own right, may well be buying gold also in an effort to shed excess paper dollars. In the 19th century, Britain was the economic leader and the pound the currency of choice. In the 20th century, the U.S. became the economic leader and the dollar the currency of choice. There should be little doubt that the 21st century may well see China as the economic leader, and the Yuan may become the currency of choice. China will revalue on its own schedule, notching the dollar down with each step. Could we end up with a gold-backed Yuan and a fiat dollar over the years ahead? Global Wage and Price Equalization It should come as no surprise that the U.S. has been suffering job loss and wage adjustments over recent years. The internet and new technologies of the 1990s, in addition to trade globalization, act as major forces of global wage and price equalization (see Figure 8) as lower cost areas enable 24-hour workdays traversing the globe, and benefit from outsourcing, as corporations rush to survive in the falling price environment. Since the U.S. has been at the high end of the global wage and price scale, the U.S. (and other developed nations) has the most to lose in the equalization process. The expected inflationary forces appear perhaps to be offset by the global dis-inflationary forces of this process. The offset may well be what is keeping long interest rates low. Once this equalization process is complete, price inflation may then re-emerge. Figure 8. Wages & Prices
Source: LY Advisors

-11-
LY ADVISORS: Technical Perspectives January 4, 2006
Inflation We have suggested for nearly a decade that the powers that be are “looking for inflation in all the wrong places” ** Our belief has been that inflation is experiencing a century-long shift: Out of the Capital Goods and product arena (where wage and price deflation pressures are being brought to bear through globalization, technology advances and the internet, and will continue for possibly decades . . . and into what we have called consumer essentials inflation: food, water and energy (as well as healthcare). Pockets of inflation in raw material commodities, we believe, may well be offset through the lower wages of outsourcing—keeping the finished product low cost to the point of disinflation, if not deflation, in the Capital Goods product arena. The Capital Goods (formerly what we dubbed “old tech” 10-12 years ago) have spent the decade utilizing the new technology to make themselves cost effective and competitive again, becoming what we have called the “new old tech” (see Technical Perspectives dated December 7, 2005). Those that have not accommodated will succumb to the forces of creative destruction (witness Autos, Movies, Broadcasting, Telecommunication Services and Publishing). Thus, too, we see growing selectivity within the Technology arena, continuing to separate the wheat from the chaff. Survivors of the fittest will have to innovate and focus on the ever-emerging new-tech applications and the wider global dissemination, commoditization and global competition thereof. The consumer, as long as interest rates stay at reasonable levels, might retrench somewhat against rising consumer essential costs, but we may find moderate corporate capital spending from global build-out beneficiaries could absorb the slack to keep the economy at least moderate and steady for 2006. We should also take a less “Americentric” view and recognize that some two billion consumers are coming to the fore in Asia and may eventually replace the U.S. consumer as the global driver of world economies!
Louise Yamada
** Market Magic, John Wiley & Sons, 1998

-12-
LY ADVISORS: Technical Perspectives January 4, 2006
An introductory word about our sub-industry work and the accompanying lists: Our discipline in this area is one of relative strength (RS). We evaluate each sub-industry versus its benchmark index. Those areas showing relative outperformance reside on the Buy and Hold lists (see our Relative Strength Ratings list) and those areas underperforming the benchmark would be located on the Avoid and Sell lists. Our experience has been that relative underperformance generally precedes price depreciation, so monitoring these sub-industries can add to a preservation of capital discipline. Conceptually, if one owns only those outperforming sub-industries, and owns none of the underperforming ones, outperformance can dominate and is not offset by underperformance.
SUB-INDUSTRY ANALYSIS AS OF JANUARY 3, 2006 - DATA THROUGH DECEMBER 30, 2005
GROUPS TO HOLD GROUPS TO AVOIDGROUPS TO BUY (ACCUMULATE) (LIGHTEN) GROUPS TO SELL
Application Software Aerospace & Defense Apparel Retail Advertising Construction & Engineer. Agricultural Products Apprl, Acces. & Lxry Goods Automobile Manufacturers Diversified Metals&Mining Air Freight & Logistics Auto Parts & Equipment Brewers Electrical Comp & Equip. Airlines Casino & Gaming Broadcasting & Cable TV Gold Aluminum Commercial Printing Building Products Health Care Distributors Asset Mgmt&Custody Banks Communications Equipment Diversified Commercial Services Managed Health Care Auto Retail Computer Stor. & Periph. Education ServicesOil & Gas Drilling Biotechnology Construction Materials Food Distributors Oil & Gas Equipment & Svcs Computer Hardware Department Stores Health Care Facilities Railroads Computer&Electron. Retail Distributors Home Entertainment Software Restaurants Const, Farm Mach,&Hvy Tr. Diversified Chemicals IT Consulting & Other Svcs Specialized Finance Consumer Finance Drug Retail Integrated Telecom Svcs Trading Cos. & Distributors Data Processing & Out. Svcs Electric Utilities Leisure Products
Distillers & Vintners Electronic Manufact. Svcs Packaged Foods & Meats Diversified Banks Food Retail Pharmaceuticals Electronic Equip. Manufact. Forest Products Photographic Products Environmental Services Gas Utilities Publishing & Printing Fertilizers & Agric. Chem. General Merchandise Stores Soft Drinks Footwear Health Care Equipment Health Care Services Health Care Supplies Home Improvement Retail Home Furnishings Hotels, Resorts & Cruise Lines Home Furnishings RetailHousehold Products Homebuilding Human Res.&Employment Svcs. Household Appliances Hyper Markets&Super Ctrs. Housewares & Specialties Industrial Conglomerates Industrial Power, Prod &TrdingIndustrial Gases Industrial Machinery Insurance Brokers Integrated Oil & Gas Internet Retail Metal & Glass Containers Internet Software & Services Motorcycle Manufacturers Invest. Banking&Brokerage Movies & Entertainment Life & Health Insurance Multi Utilities & Unreg. PowerOffice Electronics Multi-line Insurance Oil & Gas Exploration&Prod. Office Services & Supplies Other Diversified Financial Oil & Gas Refin, Marketing Paper Packaging Oil & Gas Storage & Trans.Paper Products Personal Products Property & Casualty Insur. Real-Estate Investment Tr. Semiconductor Equipment Regional Banks Semiconductors Specialty Chemicals Specialty Stores Specialty ConsultingSteel Systems Software Tobacco Thrifts & Mortgage Finance
Tires & Rubber Wireless Telecom Svcs
S&P 500 SUB INDUSTRY RELATIVE STRENGTH RATINGS
OUTPERFORMING UNDERPERFORMING

-13-
LY ADVISORS: Technical Perspectives January 4, 2006
SUB-INDUSTRY ANALYSIS AS OF JANUARY 3, 2006 - DATA THROUGH DECEMBER 30, 2005
GROUPS TO HOLD GROUPS TO AVOIDGROUPS TO BUY (ACCUMULATE) (LIGHTEN) GROUPS TO SELLFood Retail Aerospace Defense Auto Retail Advertising IT Consulting & Other Air Freight & Logistics Building Products Auto Parts & Equipment Industrial Gases Airlines Communication Equip Broadcast & Cable TVManaged Health Care Apparel Retail Computer & Electronic Retail Casinos & GamingOil & Gas Equipment Application Software Computer Hardware Commercial PrintingTrading Cos.&Distrib. Asset Mgmt. & Cust. Construct.Materials Commodity Chemicals
Automobile Manuf. Consumer Electronics Department Stores Biotechnology Consumer Finance Electric UtilitiesCoal & Consumer Fuel Distiller & Vintners FootwearComputer Stor. & Peri Diversified Chemicals Home Entertainment SoftConstr. & Farm Mach. Diversified Comm. Svcs. Household ProductsConstruction & Eng. Education Services Housewares&SpecialtiesData Process&Outs. Gas Utilities Integrated Telecomm.Electr. Manufact. Svc General Merch. Stores Leisure FacilitiesElectrical Comp. & Equip Health Care Distributors Office Services & Supp.Electronic Equip.&Man. Health Care Facilities Publishing & PrintingEnvironmental Services Health Care Services Systems SoftwareFert. & Agric. Ch. Health Care Supplies Tire & RubberHealth Care Equipment Home Furnishings Wireless Telecommun.Insurance Brokers Home Furnishings RetailInvestment Banking Homebuilding Life & Health Insurance Human Rsc&Empl ServicesMulti-Sector Holdings Hyper Mkts&Super Ctrs.Oil & Gas Drilling Ind. Power, Prod.&Trad.Oil & Gas Exploration Indus. ConglomeratesPaper Packaging Industrial MachineryPharmaceuticals Leisure ProductsProp. & Cas Insurance Marine Semiconductor Equip. Multi-Utilities & Unreg. Semiconductors Multiline InsuranceWater Utilities Office Electronics
Oil & Gas RefiningOil & Gas Storage&TradPackaged Foods&MeatsPaper ProductsREITRegional Banks ReinsuranceRestaurants Soft DrinksSpecialty ChemicalsSpecialty ConsultingSpecialty Stores SteelTechnology DistributorThrifts & MortgagesTobaccoTrucking
S&P 400 SUB INDUSTRY RELATIVE STRENGTH RATINGS
OUTPERFORMING UNDERPERFORMING

-14-
LY ADVISORS: Technical Perspectives January 4, 2006
SUB-INDUSTRY ANALYSIS AS OF JANUARY 3, 2006 - DATA THROUGH DECEMBER 30, 2005
GROUPS TO HOLD GROUPS TO AVOIDGROUPS TO BUY (ACCUMULATE) (LIGHTEN) GROUPS TO SELLConstruct&Farm Mac Air Freight & Logistics Advertising Apparel, Access.&Lxy.Data Process Svc Airlines Aerospace & Defense Auto Parts & Equip.Food Retail Aluminum Agricultural Products Automobile Manufact.Oil & Gas Equipment Apparel Retail Casinos & Gaming Diversified ChemicalsRailroads Application Software Coal & Consumer Fuel Electronic Equip. Man.Steel Auto Retail Commercial Printing Environmental Svcs.Trading Cos. & Distrib. Biotechnology Commodity Chemicals Food DistributorsTrucking Building Products Communications Eq. Health Care-Supplies
Catalog Retail Computer Hardware Household AppliancesConstruction&Eng. Computer Storage&Per. Household ProductsDivers. Metals&Mining Construction Materials Housewares & Spec.Electrical Comp. & Eq. Consumer Finance Integrat. Telecom. Sv.Forest Products Distributors Managed Health CareHealth Care-Equipment Diversified Commc'l Svcs. Movies & EntertainmentHealth Care-Services Drug Retail Packaged Fds&MeatsHmn Rs. & Employ. Svc. Electric Utilities Paper PackagingHotels Resorts&Cruise Electronic Manuf. Svc. Personal ProductsInternet Software & Svcs. Footwear Publishing & PrintingInvestment Bnk. & Brok. Gas Utilities Semiconductor Equip.Leisure Facilities General Merch. Stores Specialty Stores Marine Health Care-Dist.Metal & Glass Containers Health Care-FacilitiesOffice Services & Supplies Home Entertainment Soft.Oil & Gas Drilling Home Furnishing RetailOil & Gas Explor.& Prod. Home FurnishingsOil & Gas Refining HomebuildingProp. & Cas. Insurance IT Consulting & Svcs.Soft Drinks Industrial ConglomeratesSpecialized Finance Industrial MachineryTechnology Distributors Insurance Brokers
Leisure ProductsLife and Health Ins.Multi-Util.&Unreg. PowerPaper ProductsPharamaceuticals Real-estate Invest. Tr. Regional BanksRestaurants SemiconductorsSpecialty ChemicalsSpecialty ConsultingSystems SoftwareThrifts & Mortgage Fin.TobaccoWater Utilities
S&P 600 SUB INDUSTRY RELATIVE STRENGTH RATINGS
OUTPERFORMING UNDERPERFORMING

-15-
LY ADVISORS: Technical Perspectives January 4, 2006
ENERGY: LY Alert Crude Oil: On the Move Again. On January 3, 2006, we sent out an LY Alert, reproduced below.
Louise Yamada

-16-
LY ADVISORS: Technical Perspectives January 4, 2006
LOUISE YAMADA TECHNICAL RESEARCH ADVISORS, LLC 530 Fifth Avenue - Suite 200
New York, NY 10036 (212) 944-6200
IMPORTANT DISCLOSURES Louise Yamada Technical Research Advisors, LLC (the “Company”) hereby certifies that the views expressed in this research report accurately reflect the personal views of the Company’s research analysts about any and all of the subject markets or securities, and further certifies that no part of the compensation of such research analysts was, is, or will be directly or indirectly related to the recommendations or views in this report. The Company is engaged solely in the conduct and publication of independent technical analysis research and, as such, is completely unconflicted. Although employees of the Company may from time to time hold positions in securities mentioned in research reports, the Company’s policy proscribes any employee activity that would conflict with client interests. A copy of the policy is available on request. The Company’s technical analysis research is prepared from data believed to be accurate and reliable but the Company cannot guarantee its accuracy or completeness and no representation is made to that effect. The Company’s technical research is based on analysis of the current price performance of a security as compared to its historical price performance, taking into account also the technical position of the industry group and the overall position of the securities markets. Past performance is not necessarily a guide to future performance, however, and technical analysis alone should not be relied upon in making investment decisions. All publicly available information regarding the security in question should be reviewed including the fundamentals of the security and other information provided in any filings with the Securities and Exchange Commission (SEC). The information in this report is specifically prepared for institutional investors and is not for the use of individual investors. By virtue of this publication neither the Company nor any of its employees shall be responsible for any investment decision. Copyright 2006 Louise Yamada Technical Research Advisors, LLC. All rights reserved. Copyright warning and notice: It is a violation of federal copyright law to reproduce all or part of this publication or its contents by any means. The Copyright Act imposes liability of up to $150,000 per issue for such infringement. Information concerning illicit duplication will be gratefully received. Louise Yamada Technical Research Advisors, LLC does not license or authorize reproduction by subscribers or anyone else without specific written permission. Copyright 2006 Louise Yamada Technical Research Advisors, LLC. All rights reserved.


![Staad[1].Pro 2006 Technical Reference (Halid)](https://img.dokumen.tips/doc/110x75/5526fae549795900108b46a9/staad1pro-2006-technical-reference-halid.jpg)


