Embed Size (px)
Citation preview
Application of Mechanistic Tests for Performance of HMA Mixtures
Louay Mohammad, Ph.D.Louisiana Transportation Research Center
Louisiana State University
2009 Louisiana Transportation ConferenceFebruary 8-11, 2009
Baton Rouge, Louisiana
Outline HMA Design Review performance Tests Results Summary Recommendation

Composition of Compacted HMA Mixture
Aggregates– Provide a strong stone skeleton to
resist repeated load applications
Asphalt cement– Glue aggregate particles into a
cohesive mass
Additives– Enhance performance
Air
VOLUME MASS
air
asphalt
aggregate
TotalMass
TotalVolume
aggregate

How Does One Determine the Proportions of
Asphalt Cement Aggregate Others
Perform Mixture Design
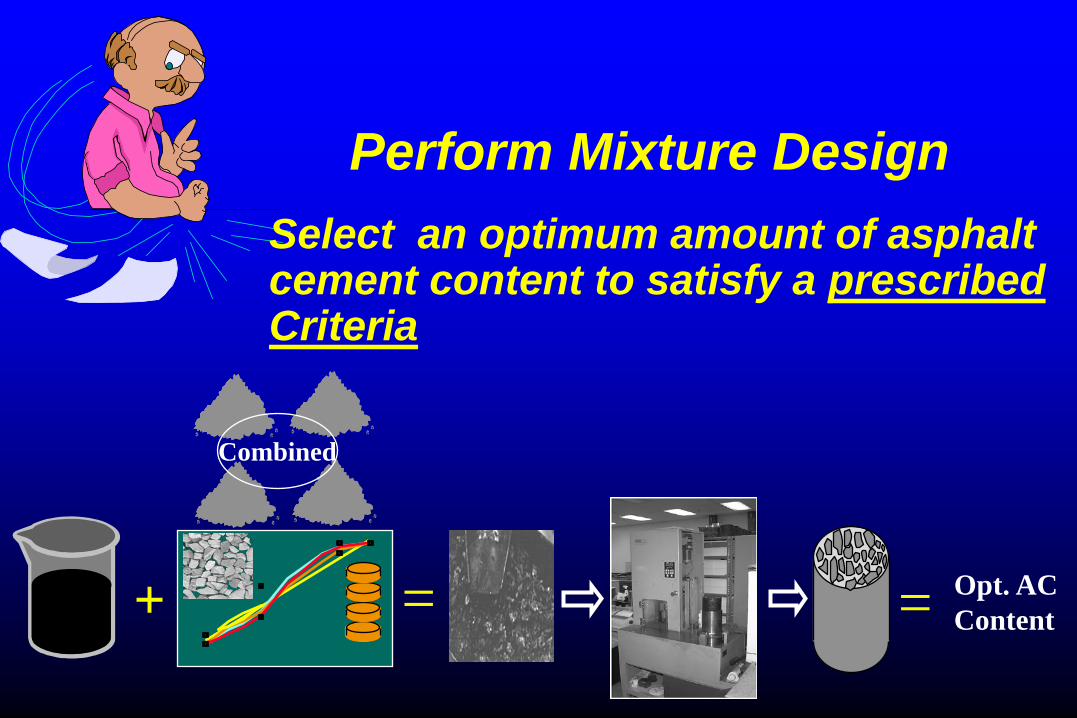
Perform Mixture DesignSelect an optimum amount of asphalt cement content to satisfy a prescribed Criteria
+ = = Opt. ACContent
Combined

What Are the Criteria? Volumetrics
– Voids in the Total Mix, VTM– Voids in the Mineral Aggregate,
VMA– Voids Filled with Asphalt, VFA
Densification– Stages during lab compaction
process
VOLUME MASS
air
asphalt
aggregate
TotalMass
TotalVolume
aggregate

Background Superpave volumetric mix design
– No mechanical “proof” test » Marshall mix design
– Ensure satisfactory performance: did use strict requirement » material specifications» volumetric mix criteria.
Mechanical tests– mix verification for intermediate and high volume traffic
» advanced materials characterizations tests : » Superpave Shear Tester
– Not widely used
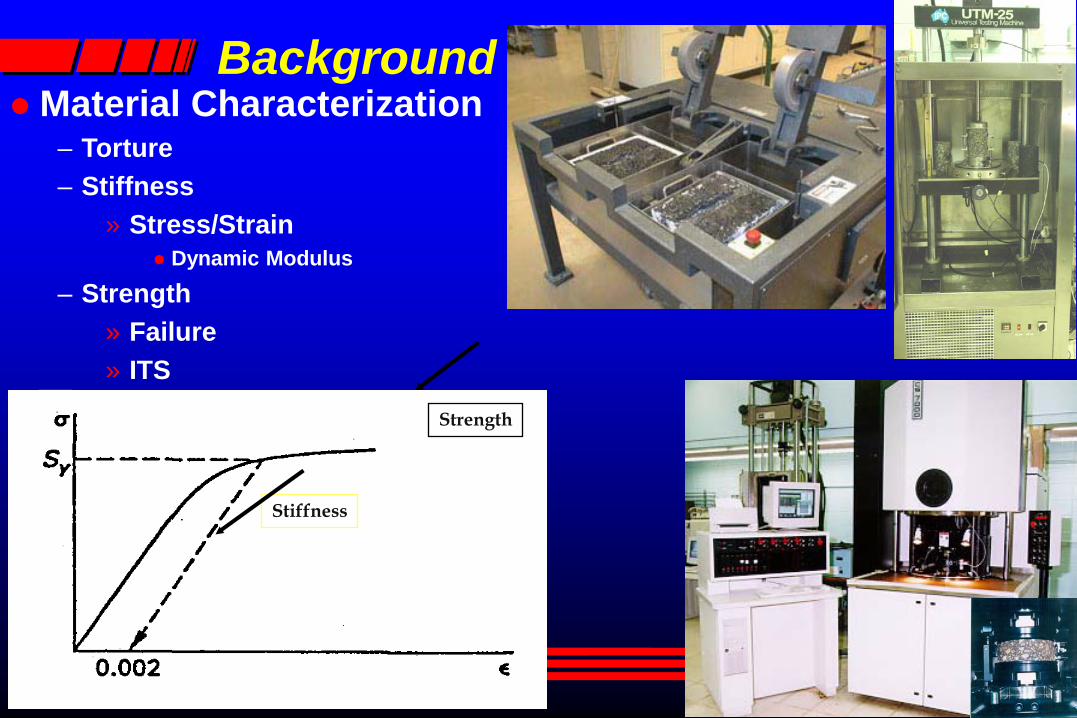
Background Material Characterization
– Torture– Stiffness
» Stress/Strain Dynamic Modulus
– Strength» Failure» ITS
Stiffness vs Strength– Modulus
Strength
Stiffness
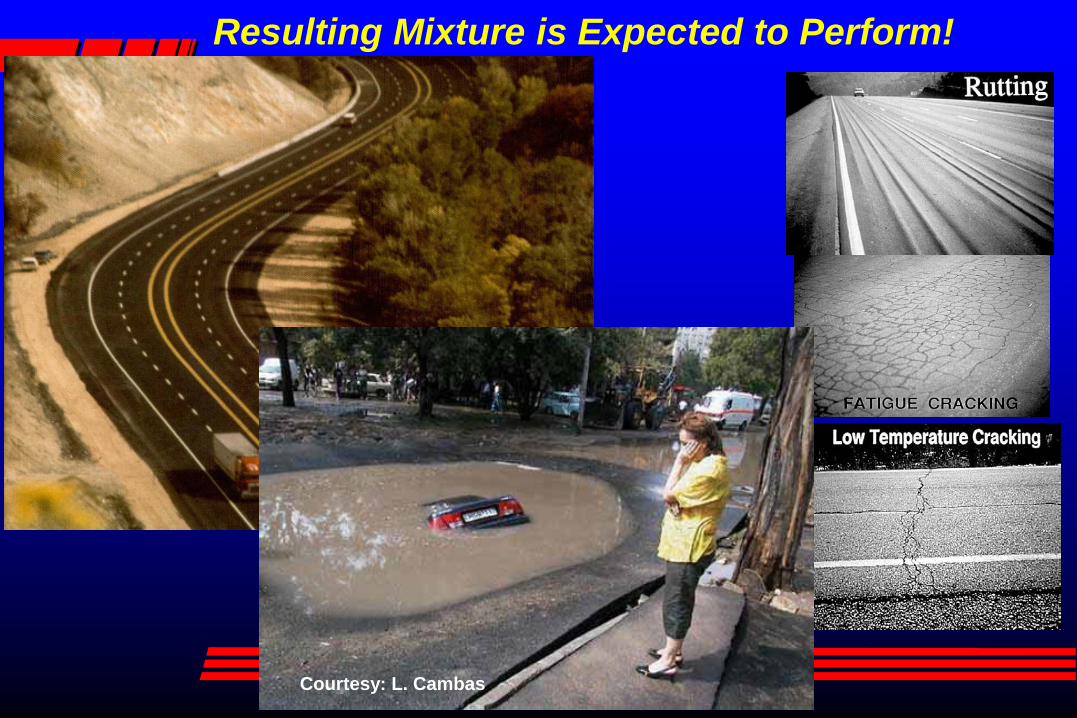
Resulting Mixture is Expected to Perform!
Courtesy: L. Cambas
L III
L I
L I
L II
L I
L I
L III
L II
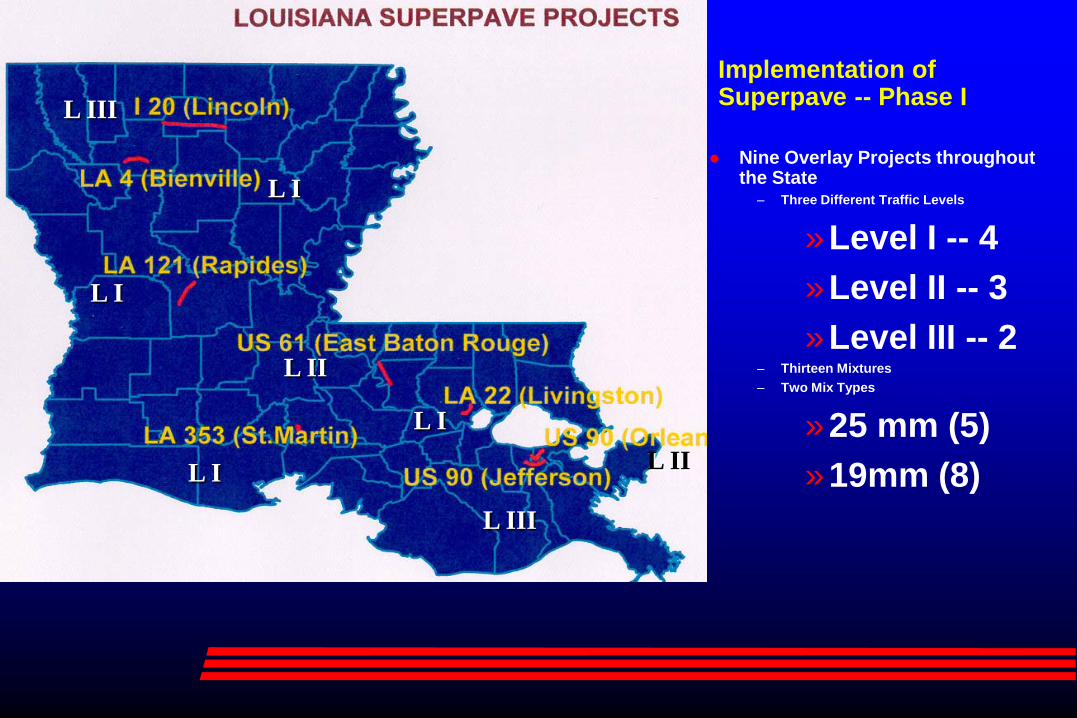
Nine Overlay Projects throughout the State
– Three Different Traffic Levels
»Level I -- 4»Level II -- 3»Level III -- 2
– Thirteen Mixtures – Two Mix Types
»25 mm (5)»19mm (8)
Implementation of Superpave -- Phase I

All Mixtures Met Superpave Volumetric Specifications
Do these mixes have similar performance?

Overall Relative Rut Susceptibility Ranking Level I
0
1
2
3
Rel
ativ
e R
ut S
usce
ptib
ility
LA 4 BC LA 22 BC LA 22 WC LA 121 BC LA 121 WC LA 353 BC/WC
Excellent
Good
Fair
25 mm19 mm

Overall Relative Rut Susceptibility Ranking -- Level II
0
1
2
3
Rel
ativ
e R
ut S
usce
ptib
ility
US 90 BC Us 61 (2) BC LA 22 BC US 61 (1) WC
Excellent
Good
Fair
25 mm19 mm

The Search
Mechanistic Tests – Pavement Performance
Intermediate Temperature – Fatigue endurance
High Temperature– Permanent deformation
Features– Fundamental– Easy to Use– Reliable– Cost
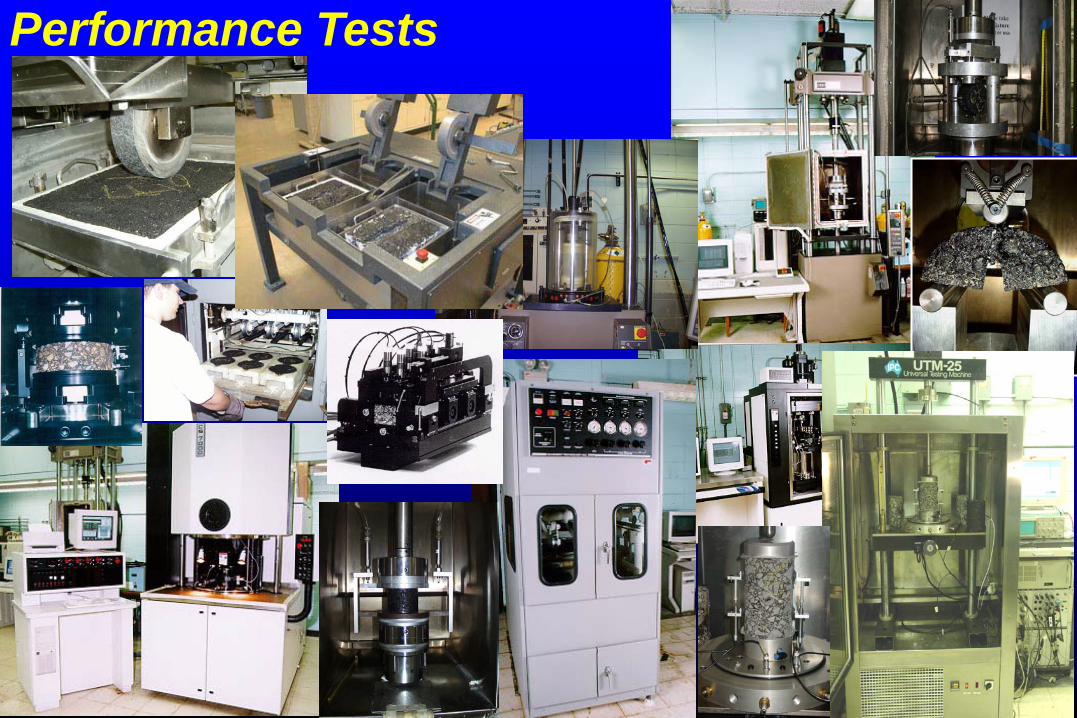
Performance Tests

Performance Tests
Mixture Rutting Performance of Mixtures
Loaded Wheel Tracking Test Flow Number
Fatigue Performance Semi Circular Bend Test Indirect Tensile Strength Test Loaded Wheel Tracking Test

Rutting Performance of Mixtures
originalprofile
Asphalt Mixture
originalprofile
weak asphalt layer
shear plane

Loaded Wheel Tracking Test AASHTO T 324-04 Damage by rolling a steel wheel across the
surface of a sample Cylindrical
Core or SGC Slab
320 mm long, 260 mm wide, and 80 mm thick
50 oC, Wet or dry Deformation at 20,000 passes is recorded
Wheel Diameter: 203.5 mm (8 inch)
Wheel Width: 47mm (1.85 inch)
Fixed Load: 703 N (158 lbs)
Rolling Speed: 1.1 km/hr
Passing Rate: 56 passes/min

Sample Preparation, LWT
Kneading Compactor

0
1
2
3
4
5
6R
ut D
epth
, mm
GRF GRM GRC LSF LSM LSC SSF SSM SSC
LWT Test Results

LWT Test Results I-10 Vinton– SMA– 12.5 mm WC (Vinton WC)
I-10 Egan– Superpave– 12.5 mm WC (Egan WC)– 25.0 mm BC (Egan BC)
US 190 Port Allen– Superpave – 25.0 mm BC (190BC)
LA 964– Marshall– 19.0 mm WC (964WC)– 25.0 mm BC (964BC)2.3
3.2 3.85 5
14.8
02468
10121416
Rut
Dep
th, m
m
VintonWC EganWC EganBC 964WC 964BC 190BC
Mixtures

0
2
4
6
8
10
12
Mixture Type
PG 64-22 PG 70-22M PG 76-22M
LWT Test Results
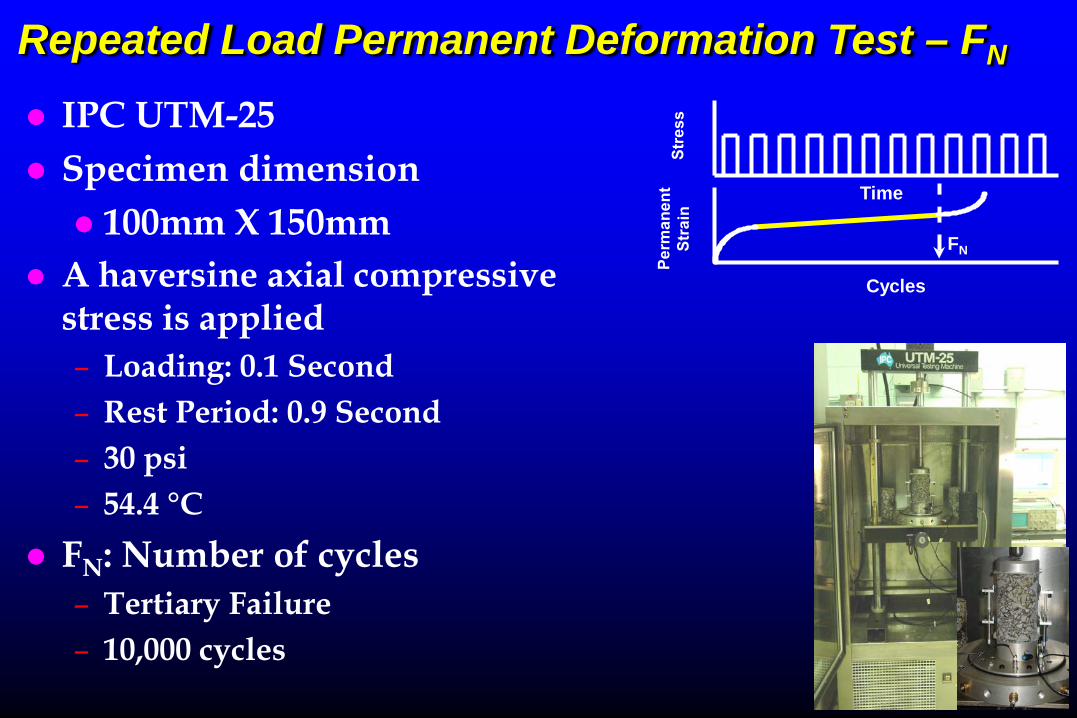
Repeated Load Permanent Deformation Test – FN
IPC UTM-25 Specimen dimension 100mm X 150mm
A haversine axial compressive stress is applied– Loading: 0.1 Second – Rest Period: 0.9 Second– 30 psi– 54.4 °C
FN: Number of cycles– Tertiary Failure – 10,000 cycles
Cycles
FN
Time

Sample Preparation -- FN
150mmX170mm
100mmX150mm

Repeated Load Permanent Deformation Test -- FN FN
CYCLES
0
2000
4000
6000
8000
10000
Mixture Type
PG 64-22 PG 70-22M PG 76-22M

Repeated Load Permanent Deformation Test -- FN
0
2000
4000
6000
8000
10000Fl
ow N
umbe
r, C
ycle
s
VintonWC EganWC EganBC 964WC 964BC 190BC
Mixtures
FN
CYCLES

y = 10909x-0.9106
R2 = 0.75
0
4
8
12
16
0 2000 4000 6000 8000 10000 12000
Average Flow Number
Ave
rage
Rut
Dep
th (m
m)
Relationship B/W LWT Rut Depth & FN

Relationship B/W LWT Rut Depth & FN
R2 = 0.89
0
2
4
6
8
10
12
0 2000 4000 6000 8000 10000 12000
Flow Number
Rut
Dep
th (m
m)

Indirect Tensile Strength TestTest ProtocolCylindrical Specimen: 100mm x 63.5mm 50.8 mm/min vertical deformation rateTemperature: 25CIndirect Tensile Strength Indirect Tensile StrengthToughness Index

Indirect Tensile Strength Test
Toughness Index
tp HDTPITS
52.0
2
=
=
επ
)()(
p
pAATI
εεε
−
−=

Indirect Tensile Strength, psi –25C
0
50
100
150
200
250
Aged
PG 64-22 PG 70-22M PG 76-22M

ITS Strain, % -- 25C
0
0.1
0.2
0.3
0.4
0.5
0.6
0.7
Aged
PG 64-22
PG 70-22M
PG 76-22M
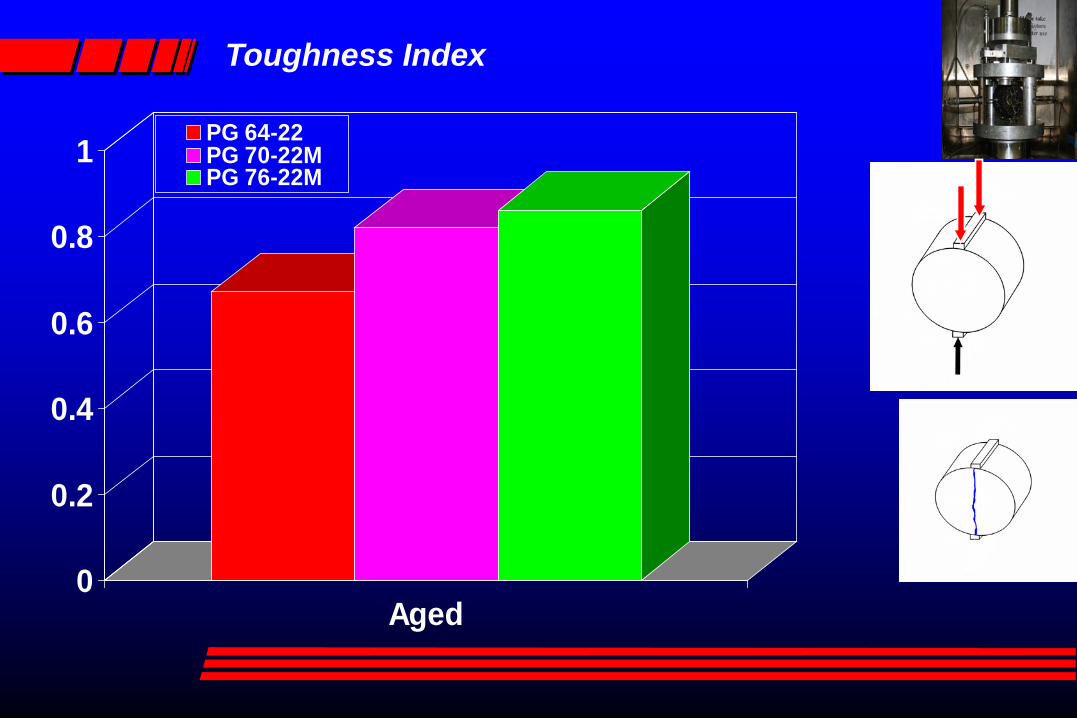
Toughness Index
0
0.2
0.4
0.6
0.8
1
Aged
PG 64-22PG 70-22MPG 76-22M

Indirect Tensile Strength Test Result
0
100
200
300
400
ITS,
psi
Fine Granite Fine Limestone Coarse Limestone MediumSandstone

0
0.2
0.4
0.6
0.8
1
Toug
hnes
s Ind
ex
Fine Granite Fine Limestone Coarse Limestone MediumSandstone
Indirect Tensile Strength Test Result
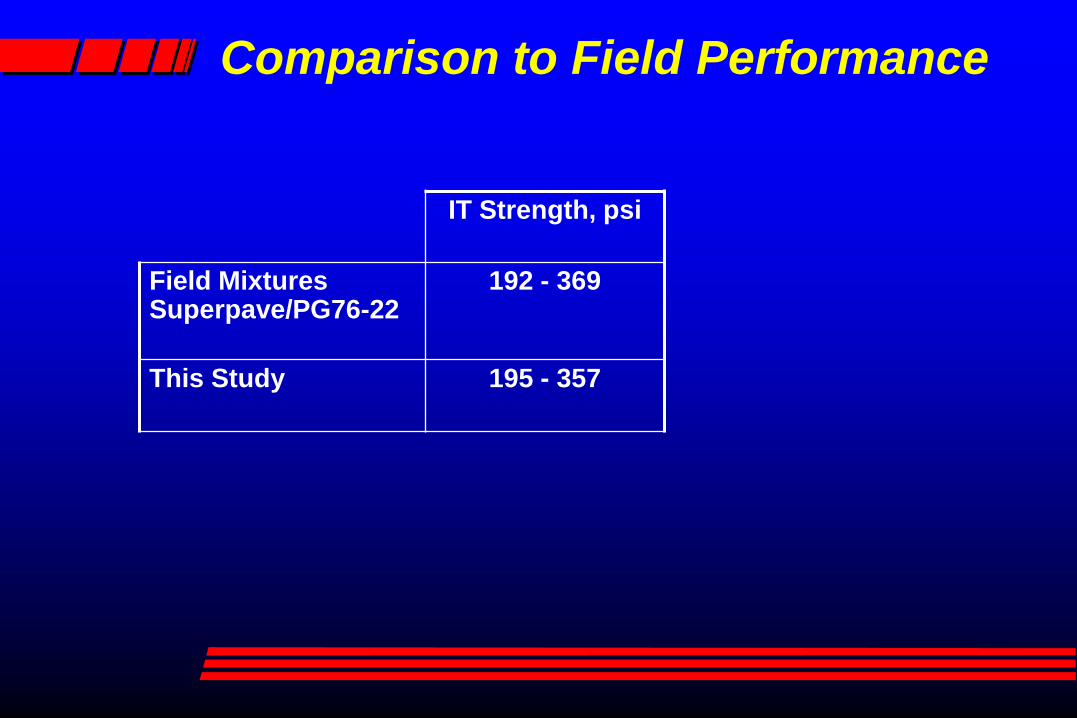
Comparison to Field Performance
IT Strength, psi
Field Mixtures Superpave/PG76-22
192 - 369
This Study 195 - 357

Comparison to Field Performance
IT Strength, psi Strain, %
Field Mixtures Superpave/PG76-22
192 - 369 0.260 - 0.880
This Study 195 - 357 0.290 – 0.62

Semi Circular Bend (SCB) Test
0.0
0.5
1.0
1.5
0.0 0.5 1.0 1.5 2.0 2.5Deflection (mm)
Lo
ad
(k
N)
notch a1
notch a2U2
U1
JUb
Ub a ac = −
−1
1
2
2 2 1
1
U is the total strain energy to failureJc: the critical strain energy release rate
Test Temperature: 25°C Unaged and Aged Mixtures Three Notch Depths
– 25.4 -, 31.8-, and 38.0-mm
Load: 0.5 mm/min vertical deformation rate
Load & Ver Def recorded The critical value of fracture
resistance
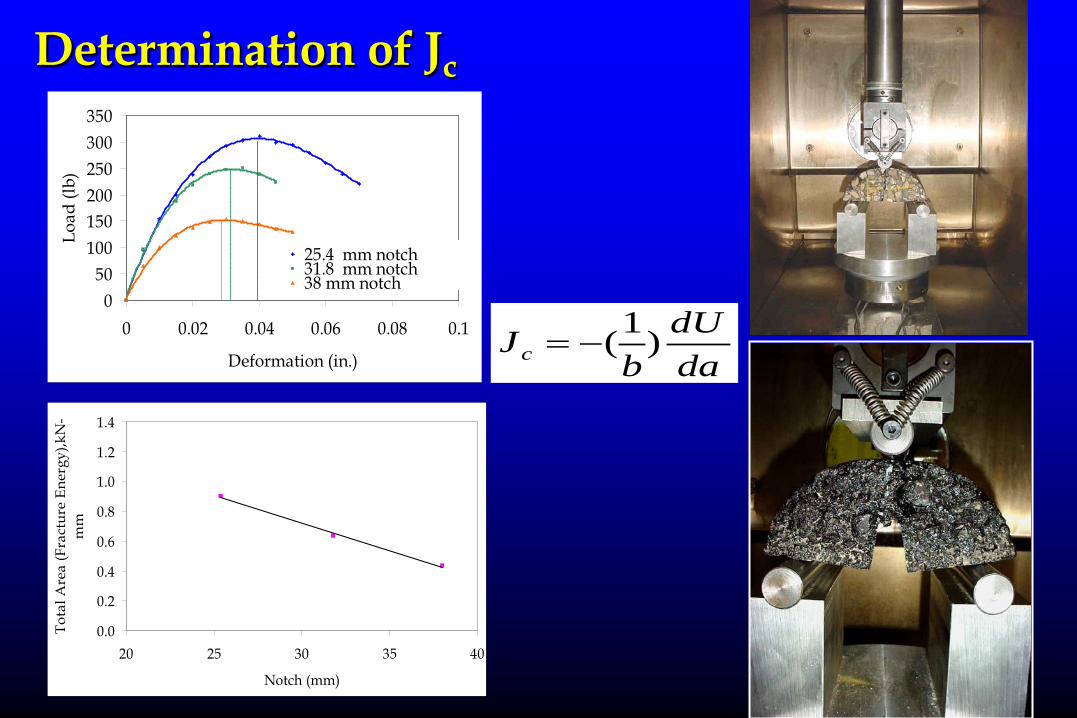
Determination of Jc
050
100150200250300350
0 0.02 0.04 0.06 0.08 0.1
Deformation (in.)
Load
(lb)
25.4 mm notch31.8 mm notch38 mm notch
0.0
0.2
0.4
0.6
0.8
1.0
1.2
1.4
20 25 30 35 40
Notch (mm)
Tota
l Are
a (F
ract
ure
Ener
gy),k
N-
mm
dadU
bJc )1(−=

Sample Preparation – SCB
150mm x 57mm
38mm
31.8mm
25.4mm

Advantages of SCB Test Utilize gyratory compacted cylindrical specimens
or cores obtained from the field multiple specimens can be obtained from one core reducing the error caused by heterogeneities
among samples

SCB Test Results
0
0.2
0.4
0.6
0.8
1
Jc, K
j/m2
Aged
PG 64-22 PG 70-22M PG 76-22M

SCB Test Results
0
0.4
0.8
1.2
1.6
2
Jc, k
J/m
2
Fine Granite Fine Limestone Coarse Limestone MediumSandstone
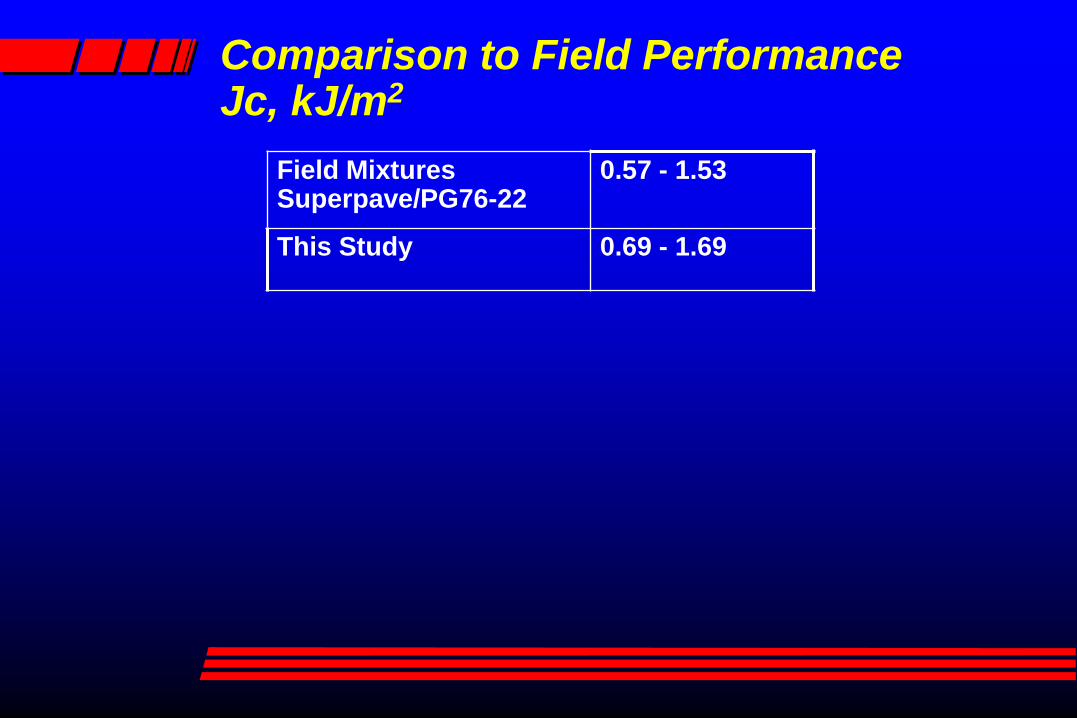
Comparison to Field PerformanceJc, kJ/m2
Field Mixtures Superpave/PG76-22
0.57 - 1.53
This Study 0.69 - 1.69

Comparison B/W Jc & TI
Unaged Mixturesy = 1.26x - 0.26R2 = 0.93
Aged mixturesy = 1.54x - 0.42R2 = 0.75
0.4
0.6
0.8
1
1.2
0.50 0.70 0.90 1.10
TI
J c (K
j/m2)
Unaged MixturesAged Mixtures

Summary Mixes that meet Superpave volumetric specifications does
not indicate similar performances Performance tests are necessary to identify mixture
characteristics FN values have a fairly good relationship with the LWT rut
depths Mixture ranking order obtained from the FN and LWT test
results was quite consistent with the field use of those mixtures
Results form SCB test exhibited good correlation with the TI
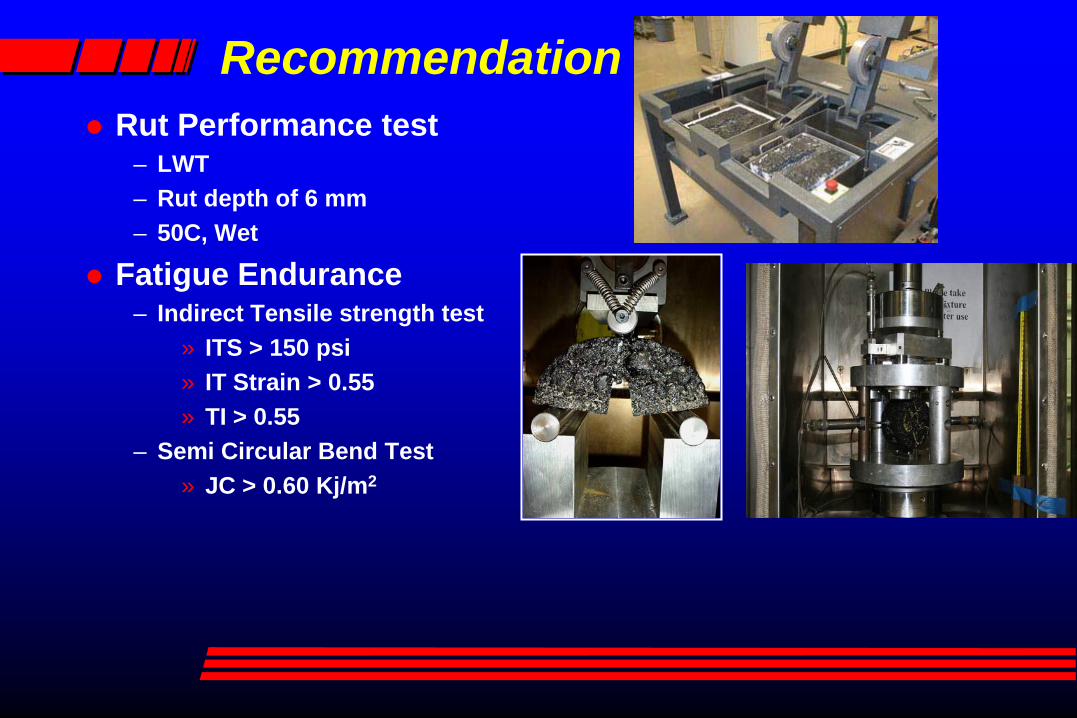
Recommendation Rut Performance test
– LWT– Rut depth of 6 mm– 50C, Wet
Fatigue Endurance– Indirect Tensile strength test
» ITS > 150 psi» IT Strain > 0.55» TI > 0.55
– Semi Circular Bend Test» JC > 0.60 Kj/m2

THANK
YOU