Embed Size (px)
Citation preview

Loss Reduction in Radial Distribution Systems by
Optimal Voltage Regulator Placement Using
Fuzzy Logic
N. Visali, Member, IAENG, D.R. Srinivasan, N. Sreenivasulu
Abstract - The reduction of total loss in distribution systems is
very essential to improve the overall efficiency of power
delivery. This can be achieved by placing automatic voltage
regulators at proper locations in Radial Distribution Systems
(RDS). In this paper, two novel methods are proposed for
selecting the optimal number, location and tap setting of
voltage regulators in RDSs. The first method is an analytical
method named as back tracking algorithm and the second
method is based on Fuzzy logic The aim of proposed methods is
to maintain the voltage within the acceptable limits and reduce
the total losses in the RDS by maximizing the objective
function, which represents the net savings on capital
investment on VRs and capitalized costs of energy losses.
The effectiveness of the proposed methods is illustrated with
two examples a 47 bus practical RDS and a 69 bus RDS. The
results obtained from both the methods are presented and
compared.
Index Terms - Fuzzy expert systems, Radial distribution
system, Tap position, Voltage regulator
I INTRODUCTION
In the operation of a distribution system, control of
reactive power and voltage are very important. A proper
control of voltage will improve voltage profile, which
reduces the system loss and improves the system efficiency.
The different methods that are generally used to maintain
the voltages in RDS are by providing Shunt capacitors,
Voltage Regulators (VRs) and by employing conductor
grading in RDS.
Reactive power control and voltage control of RDS using
shunt capacitors and voltage regulators is respectively
reported in [1-3]. The voltage stability analysis of radial
distribution networks is presented in [4].
In [5], neural networks for combined control of capacitor
banks and voltage regulators in distribution systems are
presented. The optimal placement of voltage regulators in
RDS is presented in [6] in which the authors have not
considered the effect of load variation on selection and
placement of voltage regulators. A.N. Ng et. al [7] have
proposed the capacitor allocation problem by approximate
reasoning using fuzzy capacitor placement
Manuscript received July 26, 2016; revised August 9, 2016.
N. Visali is with the Department of Electrical and Electronics Engineering, JNTUA College of Engineering, Pulivendula, Kadapa,
Andhra Pradesh, India. (Phone: 09440202996; e-mail: [email protected]).
D. R. Srinivasan is with the Department of Mechanical Engineering, JNTUA College of Engineering, Pulivendula, Kadapa, Andhra Pradesh,
India. (e-mail: [email protected]).
N. Sreenivasulu is with the Department of Electrical and Electronics Engineering, Srinivasa Ramanujan Institute of
Technology, Anantapur, Andhra Pradesh, India. (e-mail:
In this paper, two new algorithms are proposed which
gives the best location, optimal number and tap setting of
VRs ensuring the bus voltage variations within ±5% of rated
voltage and minimizing the losses. The voltage regulators,
which are determined by the proposed methods, will
optimize the savings in capital cost of VR and cost of
energy loss in RDS and in addition maintain the acceptable
voltage limits at all buses. The proposed methods are easy
and simple to implement for any radial distribution system
since it is independent of the size of the system. The first
method of approach (back tracking algorithm) is illustrated
with a 19 bus RDS in the next section. The second method
of approach (Fuzzy based voltage regulator placement), a
fuzzy expert system containing a set of heuristic rules is
illustrated with two examples to determine the VR
placement in the RDS.
II PROCEDURE FOR DETERMINING OPTIMAL
LOCATION AND NUMBER OF VOLTAGE
REGULATORS USING BACK TRACKING
ALGORITHM
The vector based distribution load flow method [8] is
used to calculate the voltage at each bus, total real and
reactive power losses in the system.
Consider a typical branch of a RDS and can be
represented by a single line equivalent circuit as shown in
Fig 1.
Fig 1 Single line equivalent circuit
The voltage at bus i+1 can be calculated as
1/22
iV0.5jX1iQjR1iP2
1iQ21iP
2jX
2jR
2
iV0.5jX1iQjR1iP1iV
(1)
where
i=1,2,…… number of buses.
j=1,2,……. number of branches
In order to have better voltage profile for given load
conditions at all buses, the voltage at each bus should be
between specific limits of Vmin and Vmax. This requires that
the maximum percentage voltage drop along the feeder
should be less than a definite percentage of rated voltage. If
this requirement is not satisfied, the voltage regulators are to
Rj+j Xj
Vi
∟δi
Vi+1∟δi+1
P i+1+j Q i+1
I
i
Proceedings of the World Congress on Engineering and Computer Science 2016 Vol I WCECS 2016, October 19-21, 2016, San Francisco, USA
ISBN: 978-988-14047-1-8 ISSN: 2078-0958 (Print); ISSN: 2078-0966 (Online)
WCECS 2016
be employed at the proper buses so as to improve the
voltage profile, which in turn also reduces the losses in the
system.
In order to reduce the losses, it is necessary to install VR
at each bus, so as to improve the voltage profile, which
leads to minimizing the cost of losses.
The objective function is formulated as maximizing the
cost function,
βαNVRKLLf8760ΔPeKFMax. (2)
where
ΔP = Reduction in total real power loss due to
installation of VR in kW
= (Real power loss before installation of VR – Real
power loss after installation of VR)
Ke = Cost of energy in Rs./kWh
LLf = Loss load factor = 0.8 × (Lf)2+ 0.2×Lf
Lf = load factor
N = Number of voltage regulators
KVR = Cost of each VR in Rs./unit
α = the rate of annual depreciation charges on VR
β = Operation and maintenance charges of VR.
(Generally it is taken as percentage of cost of VR)
This optimization problem consists of two sub problems,
that of optimal placement and optimal choice of tap setting
of VRs. The first sub problem determines the location and
number of VRs to be placed and the second sub problem
decides the tap positions of VR. The first step involves the
selection of VRs at the buses where the voltage is violating
the upper and lower limits.
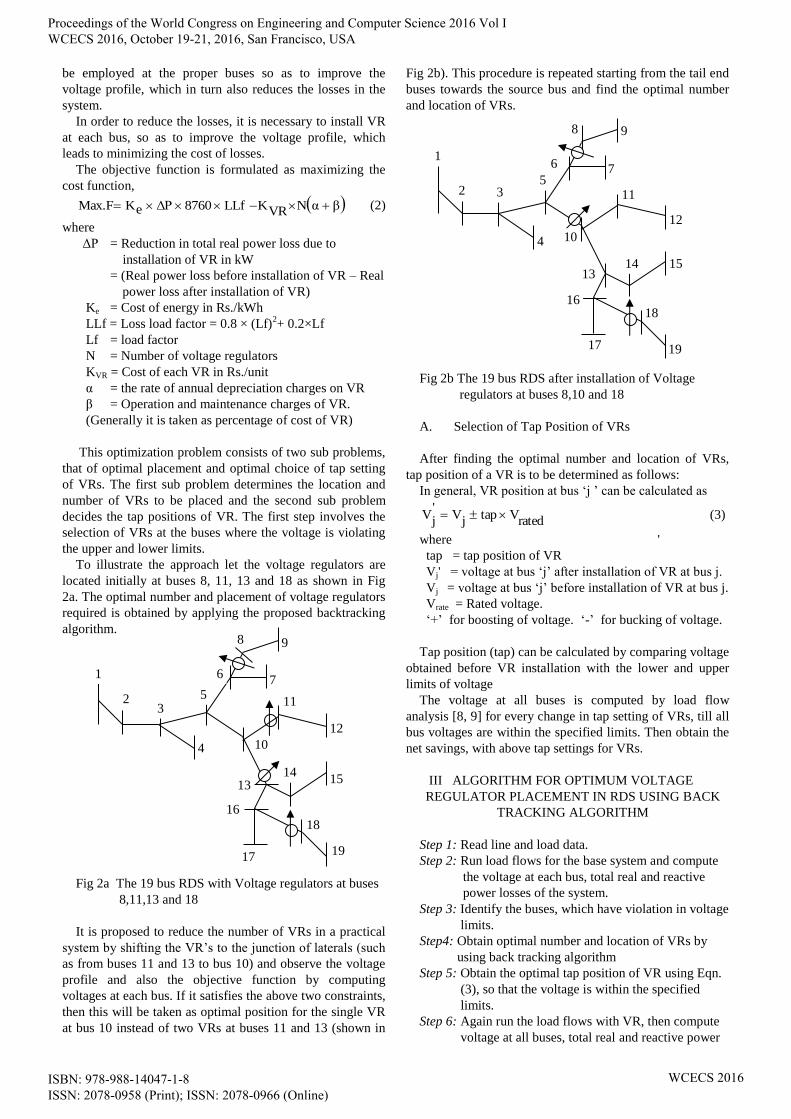
To illustrate the approach let the voltage regulators are
located initially at buses 8, 11, 13 and 18 as shown in Fig
2a. The optimal number and placement of voltage regulators
required is obtained by applying the proposed backtracking
algorithm.
Fig 2a The 19 bus RDS with Voltage regulators at buses
8,11,13 and 18
It is proposed to reduce the number of VRs in a practical
system by shifting the VR’s to the junction of laterals (such
as from buses 11 and 13 to bus 10) and observe the voltage
profile and also the objective function by computing
voltages at each bus. If it satisfies the above two constraints,
then this will be taken as optimal position for the single VR
at bus 10 instead of two VRs at buses 11 and 13 (shown in
Fig 2b). This procedure is repeated starting from the tail end
buses towards the source bus and find the optimal number
and location of VRs.
Fig 2b The 19 bus RDS after installation of Voltage
regulators at buses 8,10 and 18
A. Selection of Tap Position of VRs
After finding the optimal number and location of VRs,
tap position of a VR is to be determined as follows:
In general, VR position at bus ‘j ’ can be calculated as
ratedVtap
jV
'j
V (3)
where '
tap = tap position of VR
Vj' = voltage at bus ‘j’ after installation of VR at bus j.
Vj = voltage at bus ‘j’ before installation of VR at bus j.
Vrate = Rated voltage.
‘+’ for boosting of voltage. ‘-’ for bucking of voltage.
Tap position (tap) can be calculated by comparing voltage
obtained before VR installation with the lower and upper
limits of voltage
The voltage at all buses is computed by load flow
analysis [8, 9] for every change in tap setting of VRs, till all
bus voltages are within the specified limits. Then obtain the
net savings, with above tap settings for VRs.
III ALGORITHM FOR OPTIMUM VOLTAGE
REGULATOR PLACEMENT IN RDS USING BACK
TRACKING ALGORITHM
Step 1: Read line and load data.
Step 2: Run load flows for the base system and compute
the voltage at each bus, total real and reactive
power losses of the system.
Step 3: Identify the buses, which have violation in voltage
limits.
Step4: Obtain optimal number and location of VRs by
using back tracking algorithm
Step 5: Obtain the optimal tap position of VR using Eqn.
(3), so that the voltage is within the specified
limits.
Step 6: Again run the load flows with VR, then compute
voltage at all buses, total real and reactive power
1
19
18
17
16
15 14 13
12
11
10
7
9 8
6
5
4
3 2
1
2
19
18
17
16
15 13
14
12
11
10
3
4
5
6 7
8 9
Proceedings of the World Congress on Engineering and Computer Science 2016 Vol I WCECS 2016, October 19-21, 2016, San Francisco, USA
ISBN: 978-988-14047-1-8 ISSN: 2078-0958 (Print); ISSN: 2078-0966 (Online)
WCECS 2016
losses. If voltages are not within the limits, repeat
from step 3.
Step 7: Determine the reduction in total real power loss
and net saving by using objective function (Eqn.
(2)).
Step 8: Print results.
Step 9: Stop.
IV IMPLEMENTATION ASPECTS OF FUZZY BASED
VOLTAGE REGULATOR PLACEMENT
The Fuzzy Expert System (FES) contains a set of rules,
which are developed from qualitative descriptions. In a FES,
rules may be fired with some degree using fuzzy inference,
whereas in a conventional Expert System, a rule is either
fired or not fired. For the VR placement problem, rules are
defined to determine the suitability of a bus where VR is
placed. Such rules are expressed in the following form:
If premise (antecedent), THEN conclusion (Consequent)
For determining the suitability of a particular bus for VR
placement, sets of multiple-antecedent fuzzy rules have been
established. The inputs to the rules are the bus voltages in
p.u., power loss indices and the output consequent is the
suitability of bus where VR is going to be placed. The rules
are summarized in the fuzzy decision matrix in Table I. The
consequents of the rules are in the shaded part of the matrix.
The fuzzy variables power loss index, voltage and VR
placement suitability are described by the fuzzy terms high,
high-medium/normal, medium/normal, low-medium/normal
and low. The fuzzy variables described by linguistic terms
are represented by membership functions. These are
graphically shown in Figs 3 to 5.
Table I Decision matrix for determining suitable VR
locations
A. Fuzzy Inferencing and Defuzzification Process
After the FES receives inputs from the load flow
program, several rules may fire with some degree of
membership. The fuzzy inference methods are used to
determine the aggregated output from a set of triggered
rules.
The MAX-MIN METHOD [10, 11] involves truncating the
consequent membership function of each fired rule at the
minimum membership value of all the antecedents. A final
aggregated membership function is achieved by taking the
union of all the truncated consequent membership functions
of the fired rules. For the voltage regulator problem,
resulting VR placement suitability membership function, s,
of node i for k fired rules is
S (i) =maxk [min [p (i), v (i)]]
where p and v are the membership functions of the
power loss index and voltage level respectively.
Once the suitability membership function of a bus is
calculated, it must be defuzzified in order to determine the
buses of suitability ranking.
The centroid method of defuzzification is used; this finds
the centre of area of the membership function. Thus, the VR
suitability index is determined by:
S=s (z).z dz/( s (z) dz)
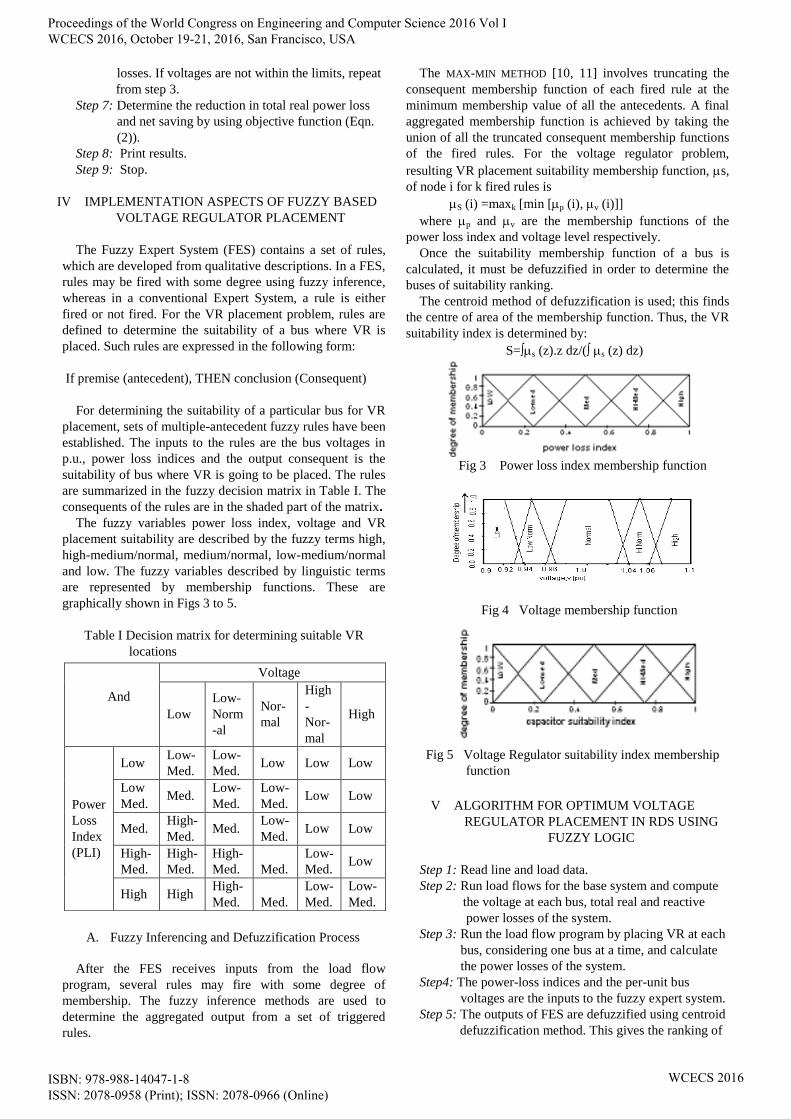
Fig 3 Power loss index membership function
Fig 4 Voltage membership function
Fig 5 Voltage Regulator suitability index membership
function
V ALGORITHM FOR OPTIMUM VOLTAGE
REGULATOR PLACEMENT IN RDS USING
FUZZY LOGIC
Step 1: Read line and load data.
Step 2: Run load flows for the base system and compute
the voltage at each bus, total real and reactive
power losses of the system.
Step 3: Run the load flow program by placing VR at each
bus, considering one bus at a time, and calculate
the power losses of the system.
Step4: The power-loss indices and the per-unit bus
voltages are the inputs to the fuzzy expert system.
Step 5: The outputs of FES are defuzzified using centroid
defuzzification method. This gives the ranking of
And
Voltage
Low
Low-
Norm
-al
Nor-
mal
High
-
Nor-
mal
High
Power
Loss
Index
(PLI)
Low Low-
Med.
Low-
Med. Low Low Low
Low
Med. Med.
Low-
Med.
Low-
Med. Low Low
Med. High-
Med. Med.
Low-
Med. Low Low
High-
Med.
High-
Med.
High-
Med.
Med.
Low-
Med. Low
High High High-
Med.
Med.
Low-
Med.
Low-
Med.
Proceedings of the World Congress on Engineering and Computer Science 2016 Vol I WCECS 2016, October 19-21, 2016, San Francisco, USA
ISBN: 978-988-14047-1-8 ISSN: 2078-0958 (Print); ISSN: 2078-0966 (Online)
WCECS 2016

VR suitability.
Step 6: Find the minimum value of VR suitability index
at which the voltages are minimum and the buses
which are having minimum suitability index are
the best suitable nodes for a VR placement.
Step 7: Obtain the optimal tap position of VR using Eqn.
(3), so that the voltage is within the specified
limits.
Step 8: Again run the load flows with VR, then compute
voltage at all buses, total real and reactive power
losses. If voltages are not within the limits, repeat
from step 3.
Step 9: Determine the reduction in total real power loss
and net saving by using objective function (Eqn.
(2)).
Step 10: Print results.
Step 11: Stop.
VI RESULTS AND ANALYSIS
The proposed methods are illustrated with two radial
distribution systems of 47 bus and 69 bus.
A. Example 1
Consider a 47 bus existing practical RDS in Anantapur
town, Andhra Pradesh, India. The line and load data is given
in Appendix and the single line diagram is shown in Fig 6.
For the positioning of voltage regulators, the upper and
lower bounds of voltage are taken as ±5% of base value.
The voltage regulators are of 11kV, 200MVA with 32 steps
of 0.00625 p.u. each.
Fig 6 Single line diagram of 47 bus practical RDS
Load flow solution of 47 bus RDS without and with
voltage regulators is given in Table II. Observing the
voltage levels in first column of Table II, it is found that all
bus voltages except at bus 1 violate the lower limit of 0.95
p.u. Ideally, voltage regulators are to be installed at all buses
except at bus 1. However, in practice, it is not economical to
have voltage regulators at all buses and hence by applying
the proposed methods the optimal number of voltage
regulators required to maintain the voltage profile within the
above limits is determined. By applying the proposed back
tracking algorithm for this system it is found that voltage
regulators at buses 2, 36 and 42 are sufficient to maintain
the voltages within limits at all buses. By applying the fuzzy
based VR placement method it is found that two voltage
regulators at 2nd
bus is sufficient to maintain the voltages
within limits at all buses.
Table II Load flow results with and without voltage
Regulators Bus
No.
Bus voltages
without VR
placement
Bus Voltages with
Voltage regulators at
2, 36, 42 buses (Back
Tracking method)
Bus Voltages with
Voltage regulators
at 2nd bus (Fuzzy
based method)
1 1.0000 1.0000 1.0000
2 0.9378 1.0378 1.0440
3 0.9376 1.0377 1.0439
4 0.9132 1.0160 1.0224
5 0.9128 1.0156 1.0220
6 0.9126 1.0155 1.0218
7 0.9090 1.0122 1.0187
8 0.9087 1.0120 1.0184
9 0.9004 1.0046 1.0110
10 0.9001 1.0043 1.0108
11 0.8997 1.0040 1.0105
12 0.8911 0.9963 1.0028
13 0.8863 0.9921 0.9986
14 0.8861 0.9919 0.9984
15 0.8852 0.9911 0.9977
16 0.8848 0.9908 0.9973
17 0.8846 0.9905 0.9971
18 0.8842 0.9902 0.9967
19 0.8839 0.9900 0.9965
20 0.8760 0.9830 0.9896
21 0.8754 0.9825 0.9891
22 0.8751 0.9822 0.9888
23 0.8555 0.9645 0.9716
24 0.8536 0.9632 0.9699
25 0.8533 0.9630 0.9697
26 0.8531 0.9628 0.9696
27 0.8508 0.9607 0.9675
28 0.8507 0.9607 0.9674
29 0.8480 0.9583 0.9651
30 0.8469 0.9573 0.9641
31 0.8455 0.9561 0.9629
32 0.8452 0.9558 0.9626
33 0.8452 0.9559 0.9626
34 0.8438 0.9546 0.9614
35 0.8420 0.9530 0.9598
36 0.8375 1.0490 0.9558
37 0.8373 1.0488 0.9557
33
32
31
30
22 25
43
44 47
42
45
46 41
38
40
37
39
36
35
34
29
28
26 18
17
14
13
15
16
27
24
23
20
19
12
9
7
4
2
1
3
8
5
6
10
11
21
Proceedings of the World Congress on Engineering and Computer Science 2016 Vol I WCECS 2016, October 19-21, 2016, San Francisco, USA
ISBN: 978-988-14047-1-8 ISSN: 2078-0958 (Print); ISSN: 2078-0966 (Online)
WCECS 2016
38 0.8372 1.0487 0.9556
39 0.8362 1.0480 0.9547
40 0.8359 1.0477 0.9545
41 0.8357 1.0476 0.9543
42 0.8381 1.0495 0.9564
43 0.8373 1.0489 0.9557
44 0.8370 1.0486 0.9554
45 0.8344 1.0466 0.9532
46 0.8333 1.0457 0.9522
47 0.8330 1.0454 0.9519
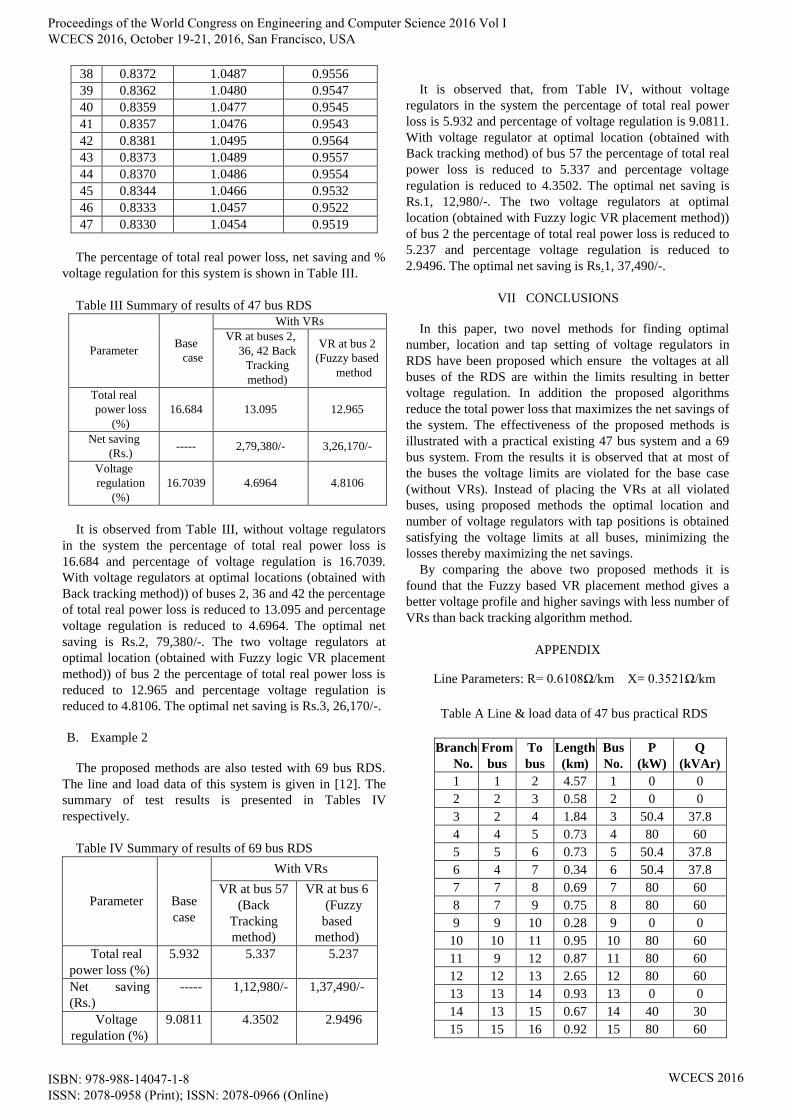
The percentage of total real power loss, net saving and %
voltage regulation for this system is shown in Table III.
Table III Summary of results of 47 bus RDS
Parameter
Base
case
With VRs
VR at buses 2,
36, 42 Back
Tracking
method)
VR at bus 2
(Fuzzy based
method
Total real
power loss
(%)
16.684 13.095 12.965
Net saving
(Rs.) ----- 2,79,380/- 3,26,170/-
Voltage
regulation
(%)
16.7039 4.6964 4.8106
It is observed from Table III, without voltage regulators
in the system the percentage of total real power loss is
16.684 and percentage of voltage regulation is 16.7039.
With voltage regulators at optimal locations (obtained with
Back tracking method)) of buses 2, 36 and 42 the percentage
of total real power loss is reduced to 13.095 and percentage
voltage regulation is reduced to 4.6964. The optimal net
saving is Rs.2, 79,380/-. The two voltage regulators at
optimal location (obtained with Fuzzy logic VR placement
method)) of bus 2 the percentage of total real power loss is
reduced to 12.965 and percentage voltage regulation is
reduced to 4.8106. The optimal net saving is Rs.3, 26,170/-.
B. Example 2
The proposed methods are also tested with 69 bus RDS.
The line and load data of this system is given in [12]. The
summary of test results is presented in Tables IV
respectively.
Table IV Summary of results of 69 bus RDS
Parameter
Base
case
With VRs
VR at bus 57
(Back
Tracking
method)
VR at bus 6
(Fuzzy
based
method)
Total real
power loss (%)
5.932 5.337 5.237
Net saving
(Rs.)
----- 1,12,980/- 1,37,490/-
Voltage
regulation (%)
9.0811 4.3502 2.9496
It is observed that, from Table IV, without voltage
regulators in the system the percentage of total real power
loss is 5.932 and percentage of voltage regulation is 9.0811.
With voltage regulator at optimal location (obtained with
Back tracking method) of bus 57 the percentage of total real
power loss is reduced to 5.337 and percentage voltage
regulation is reduced to 4.3502. The optimal net saving is
Rs.1, 12,980/-. The two voltage regulators at optimal
location (obtained with Fuzzy logic VR placement method))
of bus 2 the percentage of total real power loss is reduced to
5.237 and percentage voltage regulation is reduced to
2.9496. The optimal net saving is Rs.1, 37,490/-.
VII CONCLUSIONS
In this paper, two novel methods for finding optimal
number, location and tap setting of voltage regulators in
RDS have been proposed which ensure the voltages at all
buses of the RDS are within the limits resulting in better
voltage regulation. In addition the proposed algorithms
reduce the total power loss that maximizes the net savings of
the system. The effectiveness of the proposed methods is
illustrated with a practical existing 47 bus system and a 69
bus system. From the results it is observed that at most of
the buses the voltage limits are violated for the base case
(without VRs). Instead of placing the VRs at all violated
buses, using proposed methods the optimal location and
number of voltage regulators with tap positions is obtained
satisfying the voltage limits at all buses, minimizing the
losses thereby maximizing the net savings.
By comparing the above two proposed methods it is
found that the Fuzzy based VR placement method gives a
better voltage profile and higher savings with less number of
VRs than back tracking algorithm method.
APPENDIX
Line Parameters: R= 0.6108Ω/km X= 0.3521Ω/km
Table A Line & load data of 47 bus practical RDS
Branch
No.
From
bus
To
bus
Length
(km)
Bus
No.
P
(kW)
Q
(kVAr)
1 1 2 4.57 1 0 0
2 2 3 0.58 2 0 0
3 2 4 1.84 3 50.4 37.8
4 4 5 0.73 4 80 60
5 5 6 0.73 5 50.4 37.8
6 4 7 0.34 6 50.4 37.8
7 7 8 0.69 7 80 60
8 7 9 0.75 8 80 60
9 9 10 0.28 9 0 0
10 10 11 0.95 10 80 60
11 9 12 0.87 11 80 60
12 12 13 2.65 12 80 60
13 13 14 0.93 13 0 0
14 13 15 0.67 14 40 30
15 15 16 0.92 15 80 60
Proceedings of the World Congress on Engineering and Computer Science 2016 Vol I WCECS 2016, October 19-21, 2016, San Francisco, USA
ISBN: 978-988-14047-1-8 ISSN: 2078-0958 (Print); ISSN: 2078-0966 (Online)
WCECS 2016

16 15 17 0.95 16 80 60
17 17 18 0.93 17 50.4 37.8
18 12 19 0.85 18 80 60
19 19 20 0.97 19 60 45
20 20 21 0.82 20 80 60
21 21 22 0.77 21 50.4 37.8
22 20 23 2.95 22 80 60
23 23 24 0.29 23 50.4 37.8
24 24 25 0.56 24 0 0
25 24 26 1.5 25 80 60
26 24 27 0.47 26 50.4 37.8
27 27 28 0.29 27 0 0
28 27 29 0.48 28 40 30
29 29 30 0.87 29 0 0
30 30 31 1.29 30 50.4 37.8
31 31 32 0.82 31 50.4 37.8
32 31 33 1.06 32 80 60
33 29 34 0.96 33 50.4 37.8
34 34 35 0.79 34 0 0
35 35 36 2.25 35 40 30
36 36 37 0.6 36 40 30
37 36 38 1.05 37 50.4 37.8
38 36 39 1.05 38 50.4 37.8
39 39 40 0.95 39 80 60
40 39 41 1.09 40 50.4 37.8
41 34 42 2.69 41 80 60
42 42 43 0.78 42 0 0
43 43 44 0.8 43 80 60
44 42 45 3 44 80 60
45 45 46 1.5 45 80 60
46 46 47 1.08 46 80 60
47 50.4 37.8
REFERENCES
[1] J.J.Grainger and S. Civanlar,”Volt/Var Control on Distribution
System with Lateral Branches Using Shunt Capacitors and Voltage
Regulators Part I: The Overall Problem.” IEEE Trans. on PAS,
Vol.104, No.11, pp 3278-3283, November 1985.
[2] J.J.Grainger and S. Civanlar,”Volt/Var Control on Distribution
System with Lateral Branches Using Shunt Capacitors and Voltage
Regulators Part II: The Solution Method.” IEEE Trans. on PAS,
Vol.104, No.11, pp. 3284-3290, November 1985.
[3] J.J.Grainger and S. Civanlar,” Volt/Var Control on Distribution
System with Lateral Branches Using Shunt Capacitors and Voltage
Regulators Part III: The Numerical Results.” IEEE Trans. on PAS,
Vol.104, No.11, pp 3291-3297, November 1985.
[4] M.Chakravorthy and D.Das, “Voltage stability analysis of radial
distribution systems”, Electrical Power and Energy Systems, Vol.
23, pp.129-135, 2001.
[5] Z.Gu , D.T.Dizy, “Neural Networks for combined control of
capacitor banks and voltage regulators in Distribution systems”,
IEEE transactions on power delivery, Vol. II, No.4, pp. 1921-1928,
October 1996.
[6] Anastasia S.Safigianni, “Optimum Voltage Regulator Placement in a
Radial Power Distribution Network”, IEEE Trans. on Power
Systems, Vol. 15, No.2, pp.879-886, May 2000.
[7] A.N. Ng, M.M.A. Salama, A.Y. Chikhini, “Capacitor allocation by
approximate reasoning: fuzzy capacitor allocation”, IEEE Trans.
on Power Delivery, Vol. 15, No. 1, Jan. 2000, pp. 393 – 398.
[8] D.Das, H.S.Nagi, D.P.Kothari, “Novel method for solving Radial
Distribution System”,IEE proc. Gener.Trans.Distrib., Vol.141, No.4,
pp. 291-298, July 1994.
[9] S.Ghosh, D.Das “Method for load flow solution of Radial
Distribution Networks”, IEE proc. Gener.Trans.Distrib., Vol.146,
No.6, pp. 641-648, November 1999.
[10] H. J. Zimeermann, FUZZY SET THEORY AND ITS
APPLICATIONS ed. Norwell, MA: nluwer. 190, Ch. 12, 241 – 272.
[11] M. Chis, M.M.A. Salama and S. Jayaram, “Capacitor placement in
distribution systems using Heuristic search strategies”, Proc.
Inst. Elect. Eng., Vol. 144, No. 3, pp. 225 – 230, 1997.
[12] Baran, M.E, Wu.F.F, “Optimal sizing of Capacitors placed on a
Radial Distribution System”, IEEE Trans.on PWRD –2, pp. 735-743,
January 1989.
Proceedings of the World Congress on Engineering and Computer Science 2016 Vol I WCECS 2016, October 19-21, 2016, San Francisco, USA
ISBN: 978-988-14047-1-8 ISSN: 2078-0958 (Print); ISSN: 2078-0966 (Online)
WCECS 2016