Embed Size (px)
Citation preview

University of Kentucky University of Kentucky
UKnowledge UKnowledge
University of Kentucky Master's Theses Graduate School
2004
Loss of Sympathetic Control of Cardiovascular Function Loss of Sympathetic Control of Cardiovascular Function
Following Spinal Cord Injury Following Spinal Cord Injury
Charles Everett Hogancamp II University of Kentucky, [email protected]
Right click to open a feedback form in a new tab to let us know how this document benefits you. Right click to open a feedback form in a new tab to let us know how this document benefits you.
Recommended Citation Recommended Citation Hogancamp II, Charles Everett, "Loss of Sympathetic Control of Cardiovascular Function Following Spinal Cord Injury" (2004). University of Kentucky Master's Theses. 198. https://uknowledge.uky.edu/gradschool_theses/198
This Thesis is brought to you for free and open access by the Graduate School at UKnowledge. It has been accepted for inclusion in University of Kentucky Master's Theses by an authorized administrator of UKnowledge. For more information, please contact [email protected].

Copyright © Charles Everett Hogancamp II 2004
ABSTRACT OF THESIS
Loss of Sympathetic Control of Cardiovascular Function Following Spinal Cord Injury
Cardiovascular control in the human is significantly impaired after spinal cord injury (SCI) having a direct effect on the sympathetic nervous system (SNS) causing an inability to regulate vasoconstriction below the level of the lesion. The effects of SCI on the two major components of blood pressure regulation, control of plasma volume and neural control of the heart and peripheral vasculature are poorly understood. In particular, no index to diagnose disorders to autonomic control of the heart and vasculature has been developed. The present study primarily utilized noninvasively acquired, easily accessible variables that may have promise as indicators of autonomic activity for assessing the level of autonomic injury and recovery of visceral control following SCI. The most significant results and the clearest differences between the three groups (able-bodied, paraplegic and tetraplegic) were evident in spectral analysis obtained in the frequency domain: Arterial blood pressure and lower body (at a region on the shin) skin perfusion spectral power in the low frequency (LF) region are of significance. These variables could be good discriminators of the three groups, as well as show level of SCI and autonomic function. Keywords: Spinal cord injury, cardiovascular function, skin perfusion, autonomic activity,
sympathetic control
Charles Everett Hogancamp II July 28, 2004

Copyright © Charles Everett Hogancamp II 2004
Loss of Sympathetic Control of Cardiovascular Function Following Spinal Cord Injury
By
Charles Everett Hogancamp II
Dr. Charles Knapp Dr. David Randall
Dr. Abhijit Patwardhan July 28, 2004

RULES FOR USE OF THESES
Unpublished theses submitted for the Master’s degree and deposited in the University of Kentucky Library are as a rule open for inspection, but are to be used only with due regard to the rights of the authors. Bibliographical references may be noted, but quotations or summaries of parts may be published only with the permission of the author, and with the usual scholarly acknowledgments. Extensive copying or publication of the thesis in whole or in part also requires the consent of the Dean of the Graduate School of the University of Kentucky.

Loss of Sympathetic Control of Cardiovascular Function Following Spinal Cord Injury
Charles Everett Hogancamp II
The Graduate School
University of Kentucky
2004

Copyright © Charles Everett Hogancamp II 2004
Loss of Sympathetic Control of Cardiovascular Function Following Spinal Cord Injury
THESIS
A thesis submitted in partial fulfillment of the requirements for the degree of Master of Science in Biomedical Engineering in the
Graduate School at the University of Kentucky
By
Charles Everett Hogancamp II
Lexington, Kentucky
Director: Dr. Abhijit Patwardhan, Professor of Biomedical Engineering
Lexington, Kentucky
2004

iii
ACKNOWLEDGMENTS
The following thesis, while an individual work, benefited from the insights and
direction of several people. First, my Thesis Chair, Dr. Charles Knapp, exemplifies the
high quality scholarship to which I aspire. In addition, Joyce Evans provided intuition
and direction at every stage of thesis process, allowing me to complete this project on
schedule. Next, I wish to thank the complete Thesis Committee: Dr. Charles Knapp, Dr.
David Randall and Dr. Abhijit Patwardhan. Each individual provided insights that
guided and challenged my thinking, significantly improving the finished product. Dr.
Kevin Donohue and Dr. David Brown provided direction at every stage of data collection
and analysis. Sevda Aslan supplied insights and knowledge on a peer level that allowed
me to branch out my thinking. Additionally, Eric and Andrea Hartman offered assistance
during data collection and analysis as well as with hormonal analysis. Adam Vogt and
Evan Baxter assisted with data analysis and transporting equipment on days of study.

iv
TABLE OF CONTENTS
Acknowledgments……………………………………………………………………..…iii List of Tables……………………………………………………………………………..vi List of Figures……………………………………………………………………………vii
List of Files………………………………………………………………………………..x Chapter One: Introduction Cardiovascular control is inhibited following spinal cord injury…….………...…1 Science and clinical aims…………………...……………………………………..2 Primary goal……………………………………………………………………….2 Chapter Two: Physiological Background Anatomy and physiology of the spinal cord…..…………………………………..3 The autonomic nervous system……...…………………………………………….4
Anatomy of the circulatory system…………..……………………………………6 Anatomy of the cutaneous circulation…………….………………………………7
Rationale for using skin blood flow……………………………………………….8 Assessment of autonomic dysfunction using skin blood flow…………..………...9
Impaired cardiovascular control in SCI: Background and Significance………..…9
Chapter Three: Methods Subjects…………………………………………………………………………..12 Protocol…………………………………………………………………………..13 Acquired variables………….……………………………………………………13 Data acquisition……………………………………….…………………………14 Data analysis……………………………………………………………………..15 Statistics………………………………………………………………………….17 Tables and results………………………………………………………………..18
Chapter Four: Results Hemodynamic responses to head-up-tilt…………………………………………20 Spectral analysis………………………………………………………………….20 Cross correlation analysis………………………………………………………..22 Hormonal analysis……………………………………………………………….25 Response to results………………………………………….……………………26 Tables of results………………………………………………………………….28 Figures of results…………………………………………………………………34 Chapter Five: Discussion Progress toward our goal…………………………………………….…………..48

v
Arterial pressure as a determinant of autonomic function……………………….48 Lower body skin perfusion as a determinant of autonomic function……….…....49 Limitations of study...……………………………………………………………52 Figures……………………………………………………………………………54 Chapter Six: Conclusion
Conclusion………………………………………………………………………55 Appendices Appendix A: ASIA scale used to assess motor and sensory function………...…56 Appendix B: Subject information……………………………….external Excel file Appendix C: Additional instrumentation background……………………….…..57 Appendix D: Additional information on Matlab functions………………………60 Appendix E: Group averaged spectral power figures……………………..……..61 Appendix F: Group averaged cross correlation figures………………………….63 Appendix G: Medications that could possibly affect data collection……..……..69 References……………..…………………………………………………………………70 Vita………………………………...……………………………………………………..73

vi
LIST OF TABLES
Table 3.1: Information on American Spinal Cord Injury Association (ASIA) scores from
spinal cord injured subjects………………….………………….…………..…….18
Table 3.2: Channel listing with calibrations and units………………….………….……..19
Table 4.1: Stroke volume, cardiac output, total peripheral resistance, regional
resistances………………….………………….……………………………….…28
Table 4.2: Arterial pressure raw data and spectral power group results from AB,
paraplegic and tetraplegic groups………………….……………………….…….29
Table 4.3: Heart rate raw data and spectral power group results from AB, paraplegic, and
tetraplegic groups………………….………………….……………….………….29
Table 4.4: Upper body skin perfusion raw data and spectral power group results from AB,
paraplegic, and tetraplegic groups………………….………………….…………30
Table 4.5: Lower body skin perfusion raw data and spectral power group results from
AB, paraplegic, and tetraplegic groups………………….………………….…….30
Table 4.6: Heart rate and arterial pressure low frequency cross correlation group
results………………….………………….………………….…………….……..31
Table 4.7: Arterial pressure and upper body skin perfusion low frequency cross
correlation group results………………….………………….………….………..31
Table 4.8: Heart rate and upper body skin perfusion low frequency cross correlation
group results………………….………………….……………………………….32
Table 4.9: Arterial pressure and lower body skin perfusion low frequency cross
correlation group results………………….………………….…………………. 32
Table 4.10: Heart rate and lower body skin perfusion low frequency cross correlation
group results………………….………………….…………………. ….………..33
Table 4.11: Upper and lower body skin perfusion low frequency cross correlation group
results………………….………………….………………………….…………..33

vii
LIST OF FIGURES
Figure 2.1: Breakdown of the nervous system……………………………………...……………11
Figure 3.1: Standard protocol with supine control, four levels of head-up-tilt and
recovery……………………….………………….………………………………………19
Figure 4.1: Hemodynamic responses to head-up-tilt………………….…………………………34
Figure 4.1a: Arterial pressure from five min of supine control, four levels of head-up-tilt
and recovery in AB, paraplegic and tetraplegic groups………………………………….35
Figure 4.1b: Example of orthostatic hypotension in response to head-up-tilt in one
tetraplegic subject………………….…………………………………………………….35
Figure 4.2: Arterial pressure raw data and spectral power from one AB subject during
five min of supine control………………….…………………………………………….36
Figure 4.2a: Mean, very low, low and high frequency arterial pressure in AB, paraplegic
and tetraplegic groups………………….………………………………………………...36
Figure 4.3: Heart rate raw data and spectral power from one AB subject during
five min of supine control………………….…………………………………………….37
Figure 4.3a: Mean, very low, low and high frequency heart rate in AB, paraplegic
and tetraplegic groups………………….………………………………………………...37
Figure 4.4: Upper body skin perfusion raw data and spectral power from one AB subject
during five min of supine control………………….……………………………………..38
Figure 4.4a: Mean, very low, low and high frequency upper body skin perfusion in AB,
paraplegic and tetraplegic groups………………….…………………………………….38
Figure 4.5: Lower body skin perfusion raw data and spectral power from one AB subject
during five min of supine control………………….………………………….…………39
Figure 4.5a: Mean, very low, low and high frequency lower body skin perfusion in AB,
paraplegic and tetraplegic groups………………….…………………………………….39
Figure 4.6: Heart rate and arterial pressure raw data (two min) and cross correlation (five
min) in the low and high frequency regions from one AB subject during supine
control………………….………………….………………….………………………….40
Figure 4.6a: Cross correlation of heart rate and arterial pressure low frequency negative
peaks and lag times and low frequency positive peaks and lag times for AB,

viii
paraplegic and tetraplegic groups………………….…………………………………….40
Figure 4.7: Arterial pressure and upper body skin perfusion raw data (two min) and cross
correlation (five min) in the low and high frequency regions from one AB subject during
supine control………………….…………………..……………………………….……41
Figure 4.7a: Cross correlation of arterial pressure and upper body skin perfusion low
frequency negative peaks and lag times and low frequency positive peaks and lag
times for AB, paraplegic and tetraplegic groups………………………………..……….41
Figure 4.8: Heart rate and upper body skin perfusion raw data (two min) and cross
correlation (five min) in the low and high frequency regions from one AB subject during
supine control………………….…………………………………………………………42
Figure 4.8a: Cross correlation of heart rate and upper body skin perfusion low frequency
negative peaks and lag times and low frequency positive peaks and lag times for
AB, paraplegic and tetraplegic groups………………….……………………………….42
Figure 4.9: Arterial pressure and lower body skin perfusion raw data (two min) and cross
correlation (five min) in the low and high frequency regions from one AB subject during
supine control…………………. ………………………………………………………..43
Figure 4.9a: Cross correlation of arterial pressure and lower body skin perfusion low
frequency negative peaks and lag times and low frequency positive peaks and lag
times for AB, paraplegic and tetraplegic groups………………………………………...43
Figure 4.10: Heart rate and lower body skin perfusion raw data (two min) and cross
correlation (five min) in the low and high frequency regions from one AB subject during
supine control…………………………………………………………………………….44
Figure 4.10a: Cross correlation of heart rate and lower body skin perfusion low frequency
negative peaks and lag times and low frequency positive peaks and lag times for
AB, paraplegic and tetraplegic groups………………….………………..………..……..44
Figure 4.11: Upper and lower body skin perfusion raw data (two min) and cross
correlation (five min) in the low and high frequency regions from one AB subject during
supine control………………….………………………………………………....………45
Figure 4.11a: Cross correlation of upper and lower body skin perfusion low frequency
negative peaks and lag times and low frequency positive peaks and lag times for
AB, paraplegic and tetraplegic groups………………….………………….………...…..45

ix
Figure 4.12: Index of fluid volume shifts (total proteins and hematocrit) ………………………46
Figure 4.13: Index of fluid volume regulation (plasma renin activity) …………….………...….46
Figure 4.14: Indexes of sympathetic activity (epinephrine) ………………………..………..….47
Figure 4.15: Indexes of sympathetic activity (norepinephrine) ………………….….………..…47
Figure 5.1: Assessing level of injury and degree of autonomic function using low
frequency spectral analysis of arterial blood pressure……………………………....…...54
Figure 5.2: Assessing level of injury and degree of autonomic function using low
frequency spectral analysis of lower body skin perfusion……………….………………54

x
LIST OF FILES
01CHths-1.27Mb 02CHapB-49.5kb Special media file (Excel .xls file)

1
Chapter One
Introduction
Cardiovascular control in the human is significantly impaired after spinal cord injury
(SCI) (Krassioukov 1999). The sympathetic nervous system (SNS) may be seriously impaired
causing an inability to regulate vasoconstriction in the arms, legs and splanchnic area below the
level of the lesion (Houtman 2000). Cardiovascular control in humans with high spinal cord
lesions is dissociated from any cerebral or medullary regulatory component. These individuals
form a human physiological model in whom the afferent, central, and vagal efferent components
of the baroreflex arc are intact, but where the spinal and peripheral sympathetic nervous system
is isolated (Rowell 1993). Impairment of cardiovascular regulation following SCI has short and
long-term impact on the recovery of the individual. In the short-term, the patient’s ability to
participate in rehabilitation therapy is limited and in-patient stay is increased. Enhancing the
recovery of cardiovascular control could provide significant benefit to SCI patients and their
long- term quality of health. The long-term adaptive mechanisms are still controversial,
probably involving multiple neurological, endocrine, renal, cardiovascular and hemodynamic
factors. These factors include inhibition of vagal tone, plasma catecholamine levels, sensitivity
of vascular beds to catecholamines, stretch reflexes in blood vessels, spinal blood pressure
reflexes, renin-angiotensin system, aldosterone and plasma volume changes. Individual
differences may also interact with these various mechanisms, further complicating the issues
(Figoni 1984). Research is needed to clarify these adaptive mechanisms, as well as to investigate
the physiological effects of SCI on the human body.
The effects of SCI on the two major components of blood pressure regulation, control of
plasma volume and neural control of the heart and peripheral vasculature are poorly understood.
In particular, no index to diagnose disorders to autonomic control of the heart and vasculature
has been developed. A broad, overall objective of this SCI research at the University of
Kentucky’s Center for Biomedical Engineering is to characterize the level of autonomic damage
after injury so that indices can be developed to monitor the rate of recovery of autonomic and
volume regulatory control during rehabilitation.
At the core of this SCI research there exists both a basic science and a clinical aim. The
basic science aim addresses the issue of quantifying blood pressure regulation in able-bodied
(AB) and SCI subjects with respect to:

2
1. Neural regulation of cardiac and vascular function.
2. Hormonal regulation of cardiac and vascular function.
3. Tilt-induced fluid volume shifts to assess both intravascular pooling and extravascular
filtration.
The clinical aim of this SCI research is to develop a protocol (using the parameters identified in
the basic science aim) to diagnose disorders of cardiovascular regulation in individuals with SCI
and assess rehabilitation therapies.
This thesis will address both neural and hormonal mechanisms, their function under
normal conditions and what determines the activity or lack-there-of post-SCI because following
SCI, the sympathetic chain at the spinal cord is severed at some level leading to disruptions in
autonomic control below the level of injury. These autonomic disruptions have a great effect on
the cardiovascular system and are a major contributing factor to orthostatic intolerance post-SCI.
Circulating hormones have elevated concentrations due either to attempts to compensate for loss
of neural control or due to loss of inhibition of their release. However, these increased hormonal
levels (mainly PRA) are thought to accelerate the development of arthersclerosis in the
vasculature.
The primary goal of this thesis is to increase understanding of blood pressure regulation
by indirect assessment of autonomic function. A secondary goal is that the results of this thesis
may be used to develop more effective means to assess and promote recovery from orthostatic
intolerance in SCI patients in the weeks and months following their injury. This research utilizes
primarily noninvasively acquired, easily accessible variables that are promising indicators of
autonomic activity to assess level of autonomic injury and recovery of visceral control following
SCI. From what will be a large pool of parameters, variables such as arterial blood pressure,
heart rate, skin blood flow (in the upper and lower body), stroke volume and cardiac output will
be acquired and analyzed in both the time and frequency domain. Special emphasis will be
placed on skin blood flow for reasons described below. It is envisioned that these experiments
will provide the database for other investigators to develop an optimal index of autonomic
activity. Such an index would allow for the development of practical protocols that could be
conducted in a clinical setting.

3
Chapter Two
Physiological Background
As mentioned earlier, the focus of this research is to explore the effects of spinal cord
injury on blood pressure regulation with special emphasis on the contribution of skin perfusion in
helping to better understand the regulatory process. The following section provides the
necessary background in anatomy and physiology of the neural and circulatory systems in order
to develop experiments for this study.
Anatomy and Physiology of the Spinal Cord
The spinal cord is a 45 cm long slender cylinder of nerve tissue in adults measuring ~two
cm in diameter that extends from the brain stem. The spinal cord exits through the foramen
magnum in the base of the skull and is enclosed by the protective vertebral column as it descends
through the vertebral canal (refer to figure 5.30 in Sherwood, Lauralee, Human Physiology:
From Cells to Systems. 2001). The vertebral canal works as the main support for the spinal cord
and the nerve pathways that carry information from the arms, legs, and the rest of the body, and
carries signals from the brain to the body (Sherwood 2001).
Paired spinal nerves emerge from the spinal cord through spaces formed between the
bony, wing-like arches of adjacent vertebrae (refer to figure 5.30 in Sherwood, Lauralee, Human
Physiology: From Cells to Systems. 2001). The spinal nerves are named according to the region
of the vertebral column from which they emerge (refer to Figure 5.31 in Sherwood, Lauralee.
Human Physiology: From Cells to Systems. 2001): there are eight pairs of cervical (neck) nerves
(C1-C8), twelve thoracic (chest) nerves (T1-T12), five lumbar (abdominal) nerves (L1-L5), five
sacral (pelvic) nerves (S1-S5), and one coccygeal (tailbone) nerve (Sherwood 2001).
Spinal nerves connect with each side of the spinal cord by a dorsal root and a ventral root
(refer to figure 5.32 in Sherwood, Lauralee. Human Physiology: From Cells to Systems. 2001).
Afferent fibers carrying incoming signals enter the spinal cord through the dorsal root and
efferent fibers carrying outgoing signals leave through the ventral root. The cell bodies for the
afferent neurons at each level are clustered together in a dorsal root ganglion. The cell bodies for
the efferent neurons originate in the gray matter and send axons out through the ventral root.
The dorsal and ventral roots at each level join to form a spinal nerve that emerges from the
vertebral column. A spinal nerve contains both afferent and efferent fibers traversing between a
particular region of the body and the spinal cord (Sherwood 2001).

4
Although there are some slight regional variations, the cross-sectional anatomy of the
spinal cord is generally the same throughout its length (refer to figure 5.32 in Sherwood,
Lauralee. Human Physiology: From Cells to Systems. 2001). The “gray matter” in the spinal
cord forms a butterfly-shaped region on the inside and is surrounded by the outer “white matter.”
As in the brain, the cord gray matter consists primarily of neuronal cell bodies and their
dendrites, short interneurons and glial cells. The white matter is organized into tracts, some
ascending tracts (spinal cord to brain) that transmit to the brain signals derived from afferent
input and descending tracts (brain to spinal cord) that relay messages from the brain to efferent
neurons (Sherwood 2001).
The Autonomic Nervous System
The human nervous system is more than the brain (figure 2.1). The brain and the spinal
cord make up the central nervous system (CNS), and information is brought to and from the CNS
by means of an enormous network of nerves that make up the peripheral nervous system. The
peripheral nervous system is divided into the somatic nervous system, which controls organs
under voluntary control (mainly muscles) and the autonomic nervous system (ANS), which
regulates individual organ function and homeostasis, and for the most part is not subject to
voluntary control. It is also known as the visceral or automatic system (Sherwood 2001).
The ANS is predominantly an efferent system transmitting impulses from the central
nervous system (CNS) to peripheral organ systems. Its effects include control of heart rate and
force of contraction, constriction and dilation of blood vessels, contraction and relaxation of
smooth muscle in various organs and secretions from exocrine and endocrine glands. Autonomic
nerves constitute all the efferent fibers, which leave the CNS, except those which innervate
skeletal muscle. There are some afferent autonomic fibers, which are concerned with the
mediation of visceral sensation and the regulation of vasomotor and respiratory reflexes, for
example the baroreceptors and chemoreceptors in the carotid sinus aortic arch, which are
important in the control of heart rate, blood pressure and respiratory activity (Sherwood 2001).
Reflex responses to autonomic efferent fibers can cause contraction of smooth muscle in certain
organs (blood vessels and lungs) and can influence the function of the heart (Mathias 1992).
The ANS is divided into two separate divisions called the parasympathetic and
sympathetic nervous systems, on the basis of anatomical and functional differences. Both of
these systems consist of myelinated preganglionic fibers, which make synaptic connections with

5
unmyelinated postganglionic fibers, and it is the latter that innervate the effector organ.
Sympathetic nerve fibers originate in the thoracic and lumbar regions of the spinal cord. Most
sympathetic preganglionic fibers are very short, synapsing with cell bodies of postganglionic
neurons within ganglia that lie in a sympathetic ganglion chain located along either side of the
spinal cord (Sherwood 2001). Long postganglionic fibers originating in the ganglion terminate
on the effector organ. Parasympathetic preganglionic fibers arise from the cranial (brain) and
sacral (lower spinal cord) areas of the CNS. These fibers are long in comparison to sympathetic
preganglionic fibers because they do not end until they reach terminal ganglia. Very short
postganglionic fibers terminate on the cells of an organ itself (Sherwood 2001). Most organs are
innervated by fibers from both divisions of the ANS (refer to figure 7.3 in Sherwood, Lauralee.
Human Physiology: From Cells to Systems. 2001) and the influence is usually opposing (e.g.
stimulating the vagus nerve slows the heart, whilst stimulating sympathetic nerves increases
heart rate and contractility).
Anatomy of the Circulatory System
The circulatory system contributes to homeostasis by serving as the body’s transport
system. The circulatory system consists of the heart, blood vessels and the blood. The heart
serves as the pump that establishes the pressure gradient needed for blood (the transport medium
within which materials being transported are dissolved or suspended) to flow to the tissues. The
blood vessels transport and distribute blood pumped through them by the heart to meet the
body’s need for oxygen and nutrient delivery, waste removal and hormonal signaling (Sherwood
2001).
The blood vessels of the circulatory system are made up of a high-pressure arterial
network and a low-pressure venous network. The arterial system is composed of a complex
series of arteries, arterioles and capillaries and the venous system is composed of venules and
veins (refer to figure 10.20 in Sherwood, Lauralee. Human Physiology: From Cells to Systems.
2001). The arterial network is used to distribute oxygen and nutrients to the organs and systems
of the body, while the venous system is used to carry blood back to the heart. The highly elastic
arteries transport blood from the heart to the tissues and serve as a pressure reservoir to continue
driving blood forward when the heart is relaxing and filling. The amount of blood that flows
through a given tissue (refer to figure 10.1 in Sherwood, Lauralee. Human Physiology: From
Cells to Systems. 2001) depends on the blood pressure perfusing the organ and on the caliber of

6
the highly muscular arterioles that supply the tissue. Arteriolar tone is subject to control (neural
and local) so that the distribution of cardiac output can be constantly readjusted to best serve the
body’s needs at the moment (Sherwood 2001). For example, during exercise, some of the blood
that normally flows through the digestive organs or kidneys is diverted to skeletal muscles in
order to meet metabolic needs. Likewise, blood flow is redistributed to the skin during heat
exposure in order to keep inner core temperature at a reasonable level. Indirect evidence
suggests that heated human skin comprises one of the largest venous reservoirs into which blood
volume will accumulate when blood flow is high (Rowell 1993). Therefore skin and its ability to
receive redistributed blood to the peripheral segments of the body plays a very important role in
maintaining adequate temperature stability.
Anatomy of the Cutaneous Circulation
The skin is a large organ, weighing as much as two kg in an average-size human with
1.8m2 surface area. It is our waterproof coating, vapor barrier, protection from mechanical
injury, and our thermal insulation together with underlying subcutaneous adipose tissue. Its role
as a heat exchanger and insulator stems from its location on the body surface and its dense
system of capillary loops that empty into a capacious subpapillary venous plexus (Rowell 1993).
The cutaneous blood supply is a microcirculatory bed composed of three segments-arterioles,
arterial and venous capillaries, and venules.
Large Fluid Reservoir: Indirect evidence suggests that heated human skin comprises one of the
largest venous reservoirs. When maximally vasodilated, skin can receive as much as 7-8 L/min
of blood, competing largely with skeletal muscle for cardiac output (Rowell 1993). Many factors
influence blood pressure regulation, however the large volume capacity of skin vascular beds
makes studying the cutaneous circulation and skin perfusion very attractive.
Neural control: All cutaneous resistance vessels receive tonic outflow from sympathetic
vasoconstrictor fibers. The first demonstration of tonic vasoconstrictor activity was made in
1852 by Claude Bernard, who saw that cutting the nerves supplying a rabbit’s ear caused an
increase in its blood flow. The same result can be attained by surgical section or
pharmacological blockade of sympathetic nerves supplying human skin (Rowell 1993). When
all vasoconstrictor tone is withdrawn, skin blood flow is approximately doubled (Shepherd,
1963). Tonic vasoconstrictor activity decreases with rising body temperature and skin
temperature. Blood flow to nonacral skin (limbs and body trunk) is controlled by these fibers in

7
cool environments, but tone is minimal in neutral environments (Rowell 1993). Regulation of
sympathetic vasoconstrictor activity is accomplished by increasing or decreasing the firing rate
above or below the tonic level in these sympathetic fibers (Mathias 1988). The vasoconstrictor
activity of cutaneous vessels caused by neural sympathetic outflow allows us to make an attempt
to diagnose the degree of autonomic dysfunction in SCI patients.
A rationale for using skin blood flow as one of the parameters for assessing blood pressure
regulation
There are many reasons to study the cutaneous circulation:
One of the largest reservoirs for fluid in the body
At rest, total skin blood flow between 200 & 500 mL/min (Rowell 1993)
At rest, total skin blood volume ~3000 mL (Rowell 1993)
Skin can receive as much as 7000-8000 mL/min when “maximally” vasodilated by
whole body heating (Rowell 1993)
Under neural control
Skin appears to be second only to skeletal muscle in its capacity to receive high blood
flows at normal perfusion pressure (Rowell 1993)
Competes with skeletal muscle for cardiac output during exercise (Rowell 1993)
Experimental advantages
Studied non-invasively
Easily accessible
The aforementioned skin properties create a great opportunity to use skin perfusion and
cutaneous circulation to analyze blood pressure regulation in AB subjects and diagnose
decrements in blood pressure regulation in SCI patients.
Assessment of Autonomic Dysfunction Using Skin Blood Flow
Skin blood flow fluctuations around 0.1 Hz are thought to be indicative of autonomic
control of the cutaneous vasculature (Crandall 1998) [(throughout this document skin blood flow
will also be referred as microvascular blood flow, cutaneous circulation and skin perfusion)].
Skin circulation largely depends on neurogenic influences and metabolic needs and skin
vasomotor reflexes are studied to detect focal abnormalities of autonomic function (Bernardi
1989). Although, rhythmical variations have been described in human skin blood flow,

8
quantitative comparison between skin blood flow fluctuations and phasic changes of autonomic
tone are rare (Bernardi 1989). Heart rate fluctuations are largely dependent on autonomic
influences, which can be easily described and quantified by spectral analysis techniques
(Bernardi 1989). Low-frequency (LF; 0.1 Hz) oscillations, considered a marker of sympathetic
activity in heart rate and blood pressure, in the skin circulation are also modified by changes in
sympathetic tone, suggesting that oscillations in microsvascular blood flow may be controlled by
both central and local mechanisms (Bernardi 1997).
As a result of SCI, descending spinal sympathetic pathways are disrupted, possibly
severed (Curt 1995). It has been shown that SCI results in profound changes within the affected
limbs, both in the upper and lower body, dependent upon the level of injury. I hypothesize that
low frequency spectral power of skin blood flow fluctuations in the upper and lower body will be
significantly larger in AB subjects than in paraplegic and tetraplegic subjects. These data can
then be used to assess the relationship between autonomic nervous control and local cutaneous
circulation. Post-SCI, peripheral circulatory adaptations, indicative of autonomic dysfunction,
may largely contribute to the increased risk of cardiovascular disease in SCI patients. By
studying these peripheral adaptations in SCI patients, the level of autonomic dysfunction in SCI
subjects can be quantified.
The driving force for cardiovascular research following SCI:
1. Diminished cardiovascular control presents significant health risks and obstructs effective
rehabilitation in individuals with SCI.
2. The nature of the effects of SCI on the autonomic nervous system are poorly understood
3. An improved understanding of the mechanisms of cardiovascular control may
facilitate optimization of rehabilitation practices for SCI subjects. This information may be
particularly important as new techniques for spinal cord regeneration and repair are developed.
Impaired Cardiovascular Control in SCI: Background and Significance
Background: SCI results in immediate derangement in cardiovascular control with associated
acute and chronic consequences. The dysfunction of the sympathetic nervous system (SNS) after
acute SCI results in hypotension (decrease in blood pressure), bradycardia (decrease in heart
rate), autonomic dysreflexia (surges in blood pressure), and, rarely, cardiac arrest. Hypotension
is the first observed manifestation of autonomic dysfunction following SCI. Autonomic
dysreflexia occurs, almost exclusively, in SCI subjects with high level of injury after six months

9
post-injury. Acute manifestations of alteration of SNS activity typically resolve in the first few
weeks, but orthostatic hypotension and low blood pressure persist for months and, in some
patients, may persist for years (Garstang 2001).
Pathophysiology: Immediately after SCI, an acute rise in blood pressure occurs. This
phenomenon has been shown in experimental studies to be caused by release of epinephrine from
the adrenal glands and by pressor response from mechanical disruption of vasoactive neurons
and tracts in the cervical and upper thoracic spinal cord resulting in additional outpouring of
norepinephrine (Garstang 2001). This brief response is followed by a period of decreased SNS
activity because of interruption of the descending sympathetic tracts. Lack of supraspinal input
develops, causing cutaneous vasodilatation, lack of sympathetic vasoconstrictor activity, and
absent sympathetic input to the heart. Clinically, the patient with SCI is susceptible then to
hypothermia, hypotension, and bradycardia from lack of sympathetic input and unopposed vagal
tone (Garstang 2001).
Frequency: Annual incidence of SCI in the U.S. is approximately 40 cases per million
population, or approximately 11,000 new cases each year (there are approximately 250,000
people in the U.S. living with SCI) (Lali 2001, Garstang 2001). Of these, 51.7% have tetraplegia
(i.e. a level of injury at the cervical, C1 to C8, spinal cord), and 46.7% have paraplegia (i.e. a
level of injury at the thoracic, T1-T12, lumbar, L1-L5, or sacral, S1-S5, regions of the spinal cord).
The most frequent neurologic category is incomplete tetraplegia (29.5%), followed by complete
paraplegia (27.9%), incomplete paraplegia (21.3%), and complete tetraplegia (18.5%) (Lali
2001, Garstang 2001).
The loss of autonomic control of cardiac and vascular regulatory mechanisms is
dependent on the severity and level of injury to the spinal cord (Grimm 1995). Of the patients
with severe cervical injuries in the C1 to C8 region of the spinal cord that are diagnosed with
ASIA A or ASIA B (analyzed with the American Spinal Cord Injury Association [ASIA] scale)
up to 100% develop bradycardia, 68% are hypotensive, 35% require pressors, and 16% have
primary cardiac arrest (Garstang 2001). Of those with milder cervical injuries (incomplete
grades of ASIA C or ASIA D), 35-71% develop persistent bradycardia, and some have
hypotension or require medication with pressor agents. Patients with thoracolumbar injuries
experience bradycardia 13-35% of the time and rarely experience other cardiovascular problems
(Garstang 2001). Only SCI patients with level of injury above T6, the level of major outflow

10
from the sympathetic chain are affected. However, patients with injuries below T6 are only
affected by loss of local muscle tone that can result in increased lower extremity venous pooling.

11
Figure 2.1: Breakdown of the nervous system

12
Chapter Three
Methods
Subjects
There were 11 AB (control group: eight male, three female) subjects studied once, three
male paraplegic (lesions between T10 and T12) and three male tetraplegic (lesions between C3 and
C4) patients between the ages of 18-45 studied up to eight times each during the first year post-
injury. For each SCI subject, initial studies (~ two, four, six and eight weeks post-injury) were
conducted while the subject was a patient at Cardinal Hill Rehabilitation Hospital (CHRH).
These sessions were performed at the Physical Therapy Clinic at CHRH. Subsequent studies
(conducted three, six, nine and 12 months post-injury) were performed at the General Clinical
Research Center (GCRC) at the University of Kentucky. For the studies at the GCRC, the
subjects (both AB and SCI subjects) were admitted on the day prior to the data collection session
in order to provide dietary and behavioral conditions similar to those at CHRH. The following
conditions excluded any subjects: any orthopaedic, neurological or dermatological disorder that
would contraindicate a HUT, deep vein thrombosis or any psychological disorder. Most SCI
subjects were in some degree of deconditioning secondary to extended bed rest and immobility,
causing some degree of orthostatic intolerance during the rehabilitation phase.
None of the participants had any previous cardiovascular-related disease and only a few
of the AB subjects took any medication likely to affect the cardiovascular system (a list of
medications likely to affect data collection can be found in Appendix G). All the SCI patients
wore TED hose and abdominal binders during the study. Some SCI patients were on blood
pressure medication and some were on medications to treat muscle spasms (list of medications
can be found in Appendix G). One tetraplegic and two paraplegic patients had sustained
complete injuries (ASIA A), two tetraplegic patients had some sensitivity below the level of
lesion (ASIA B) and one paraplegic patient had some motor control below the level of the lesion
that was of such poor quality that it could not be used functionally (ASIA C). A physician, using
the American Spinal Cord Injury Association (ASIA) scale (Appendix A) to assess the severity
of the spinal cord injury, diagnosed all SCI patients during the acute phase of injury before the
SCI patients participated in the study. All participants were familiarized with the study protocol
and signed an informed consent form before experimental data were collected. All subject
information can be found in Appendix B.

13
Protocol
All subjects were studied at least one hour post-prandial and refrained from alcohol and
caffeine at least 24 hours before the study. The subjects consumed a fat free breakfast, as to not
interfere with data and hormonal analysis. AB subjects emptied their bladder 30 min before the
study and SCI subjects had bladder catheterization. After arriving at the tilt site (Physical
Therapy Clinic at CHRH or GCRC), the subjects were acquainted with instrumentation and
experimental procedures and then rested supine on the tilt table. An IV cannula was inserted in
an antecubital vein to obtain blood for hormonal analysis. The non-invasive instrumentation,
described below, was applied while the subject was supine on the tilt table. These preparations
took approximately 30 minutes. All subjects were fixed to the tilt table by straps at the chest
and pelvis. All subjects underwent a provocative head-up-tilt (HUT) test used to elicit a
cardiovascular response. A HUT test was used to test for baroreflex activity, bradycardia,
hypotentsion, orthostatic intolerance, hormone responses, fluid volume shifts and regulation.
More specifically, a HUT test is a well-known maneuver that is able to produce a generalized
sympathetic activation. For the present study, a HUT is utilized to elicit heart rate, arterial
pressure, and skin blood flow responses that are then used to assess sympathetic activity and
level of autonomic damage in SCI.
The study lasted about one hour beginning with a 10 min period of supine control,
followed by four levels of HUT (20o, 40 o, 60 o, 80 o) each lasting about 10 min. The last phase,
the recovery period, consisted of one min at 20 o HUT and up to seven min in the supine position
(a typical protocol can be found in figure 3.1). During the tilt, members of the research and
clinical team continuously monitored the alertness of the subject and the hemodynamic variables.
If the subjects developed syncopal symptoms (signs of fainting) during any part of the study,
they were brought to a supine position and the recovery phase began. Blood samples for
hormonal assay were taken at the end of supine control, 20o, 40 o, 60 o, 80 o HUT and recovery.
Acquired Variables
Non-invasive instrumentation was used to measure the following hemodynamic variables.
Arterial Blood Pressure: Beat-to-beat continuous blood pressure was acquired through a
Portapres Model-2 (Finapres Medical Systems, The Netherlands) with a sphygmomanometer
finger cuff placed around the left middle or index finger (Additional information on the Portapres
and the Penaz principle can be found in the additional instrumentation background in Appendix

14
C). Manual arterial blood pressure measurements were taken at the beginning of supine control
and at the end of the recovery period with an AND digital blood pressure measurement device.
Thoracic Electrical Bioimpedance Cardiac Output (TEBCO): Eight thoracic impedance
leads were placed on the neck and thorax to obtain analog ECG, dZ/dt, dZ/dt respiration, cardiac
output and stroke volume through an EXT-TEBCO Module (Hemo Sapiens, Sedona, AZ)
(Additional information on TEBCO can be found in Appendix C).
Skin Perfusion and Concentration of Moving Cells: Cutaneous skin perfusion (also referred
to as skin blood flow) and concentration of moving cells at locations on the forearm (upper body)
and shin (lower body) were acquired through a Perimed (Perimed, Sweden) using the Laser
Doppler flowmetry technique (Additional information on the Perimed and the Laser Doppler
flowmetry technique can be found in Appendix C).
Calf Circumference: Calf circumference was acquired with a Hokanson EC-4 Plethysmograph
(Hokanson, Bellvue, Washington) via a mercury-in-rubber strain gauge placed around the largest
part of the left calf.
Tilt Angle: Tilt angle was acquired from an accelerometer mounted on the tilt table.
Eleven mL of venous blood was drawn from an antecubital vein at six intervals during
the protocol. Each sample was analyzed to determine levels of epinephrine, norepinephrine,
hematocrit (HCT), total proteins (TP), plasma renin activity (PRA) and pancreatic polypeptide
(PPP). Laboratory analysis of the blood samples was performed at laboratories with expertise in
each analysis: catecholamines (one mL) by Michael Ziegler, Clinical Research Center, UCSD,
San Diego, CA; PPP (three mL); PRA (five mL); HCT and TP (two mL) at the University of
Kentucky clinical laboratory. A set of data (in the process of being collected and analyzed) from
the AB control group and the SCI groups were evaluated.
Data Acquistion
All data was acquired at 250 Hz and saved as a LABVIEW file to a Dell Inspiron 4100.
Calibration files were created for all variables and saved as separate files for future reference in
case the data acquisition laptop were to crash. A data file was then created, in which all acquired
data was stored and saved. After the study, the data were stripped and copied from the data
acquisition computer, converted to a binary file, then to a raw (.raw) file in order to be observed
in a data playback browser program written by Dr. David Brown of the University of Kentucky.
Large peaks and anomalies were removed from all the acquired variables and saved as a

15
modified (.mod) file. Heart rate was then calculated using Dr. Brown’s Browser Program and
correctly aligned in time with all the other variables. Finally, all 16 channels of data were down-
sampled to 5 Hz using Dr. Brown’s Browser Program and converted to a MATLAB (.mat) file
for data analysis.
Data Analysis
All data analysis was done with MATLAB, Dr. Brown’s Browser Program, Microsoft Excel,
PowerPoint and Word.
Mean Value Analysis: Using MATLAB and Excel in the time domain, a mean value analysis
was conducted on the last 5 min (1500 data points) of data at each level of the protocol (supine
control, 20o, 40 o, 60 o, 80 o HUT and recovery). Before conducting mean value analysis, the data
in question were low-pass filtered (LPF) with the low-pass cutoff equal to 0.5 Hz. The LPF was
initialized with the MATLAB function “fir1” using a 100th order finite impulse response filter
and filtering was carried out using the MATLAB “filtfilt” function (Additional information on
the fir1 and filtfilt MATLAB functions can be found in Appendix D). An LPF was used to
preserve the low-frequency data, while stripping out high-frequency information.
Cardiac output was found by multiplying heart rate and stroke volume.
Cardiac output = Heart rate * Stroke volume (1)
Assuming the central venous pressure to be sufficiently small so as not to be considered
in the pressure drop calculation across the circulation. Total peripheral resistance was calculated
as:
Total peripheral resistance, TPR = (Mean arterial pressure – 0) / Cardiac output (2)
Spectral Power Analysis: Using MATLAB and Excel in the frequency domain, a power
spectral density estimate was conducted on the last 5 min (1500 data points) of data at each level
of the protocol (supine control, 20o, 40 o, 60 o, 80 o HUT and recovery). The data were filtered
using an LPF and the above LPF methods and parameters. The data were linearly detrended and
the power spectral density was found using the MATLAB function “psd.” A 1024 point Fast
Fourier Transform (FFT) was used to obtain the power spectrum and a 500 point Hanning
Window with 250 points of overlap was used to decrease leakage of the power spectrum. Power
spectral density estimates were analyzed in three frequency regions:
Very low frequency region (0.01-0.04 Hz), thermal domination of regulation
Low frequency region (0.04-0.15 Hz), sympathetic domination of regulation

16
High frequency region (0.15-0.4 Hz), parasympathetic domination of regulation
Autonomic balance was estimated based on the following indicies:
SNS spectral index = LF power / HF power (3)
PNS spectral index = HF power / Total power (VLF + LF + HF) (4)
Cross Correlation Analysis: Using MATLAB and Excel in the frequency domain, a cross
correlation analysis was conducted on the last 5 min (1500 data points) of data at each level of
the protocol (supine control, 20o, 40 o, 60 o, 80 o HUT and recovery). For low-pass analysis, the
data were filtered using a low-pass Butterworth filter with cutoff coefficients equal to 0.04 and
0.15 Hz. For high-pass analysis, the data were filtered using a high-pass Butterworth filter with
cutoff coefficients equal to 0.15-0.4 Hz. Cross correlation analysis provides a measure of the
correlation and phase relationships between two signals in the frequency domain. The existence
and location of cross correlation peaks provide indications of sympathetic and parasympathetic
influences that are shared by cardiovascular variables and may indicate commonalities in control
mechanisms.
Cross correlation is an engineering tool used to study the coordination of two signals.
One signal is defined as the stationary or reference signal and the other signal is the sliding
signal. The autocorrelation of the two signals is calculated as the sliding signal moves through
the reference signal. An autocorrelation of one is perfect correlation, i.e. the signals are
identical, and an autocorrelation of zero is the worst that the two signals can correlate. Negative
and positive cross correlation peaks are calculated, where a positive peak indicates a point at
which the two signals are increasing simultaneously or decreasing simultaneously. A negative
peak designates a point at which one signal is increasing and the other is decreasing. In addition
to positive and negative cross correlation peaks, lag times are calculated at each of the positive
and negative peaks. Negative and positive cross correlation peaks that occur closest to a lag time
of zero seconds are the peaks that are thought to indicate the most significance. An
autocorrelation of one is considered to be ideal, although this phenomenon is rare in a
physiological environment. The magnitude of positive and negative cross correlation peaks of
0.5 and –0.5, respectively, are typical with correlations involving skin blood flow. In AB
subjects these maximum positive and negative cross correlation peaks are used as the gold
standard against which paraplegic and tetraplegic subjects will be compared.

17
Statistics
Differences within and between the three groups (AB, Paraplegic and Tetraplegic) during
supine control, the four levels of HUT and recovery were tested for significance using a two
factor Analysis of Variance (ANOVA) using SPSS statistical software. The within factor was
used to indicate a tilt affect among the groups. The between factor was used to indicate
differences between the three groups. A p value ≤ 0.05 was considered to indicate statistical
significance. Results were expressed as mean and standard error. Statistical significance for all
analyzed variables are shown in tables, not figures. Note: throughout the present study, the
paraplegic sample size of five indicates five studies from three subjects and the tetraplegic
sample size of six indicates six studies from three subjects.
Dr. Helena Truszczynska from the University of Kentucky assisted with the repeated
measures ANOVA statistical design and analysis.

18
Table 3.1: Information on SCI ASIA scores
Subject Level of Injury Severity of Injury Assessment Date
Times studied
11 AB subjects AB AB N/A One time per subject
Tetraplegic subject 1 C3 ASIA B 2/5/2002 Six
Tetraplegic subject 1 C3 ASIA C 2/28/2004 Six
Tetraplegic subject 1 C4 ASIA D 11/7/2002 Six
Tetraplegic subject 1 C4 ASIA D 3/27/2003 Six
Tetraplegic subject 2 C3 ASIA A 1/17/2003 Two
Tetraplegic subject 2 C4 ASIA A 3/15/2003 Two
Tetraplegic subject 3 C4 ASIA B 8/20/2003 Four
Tetraplegic subject 3 C4 ASIA C 3/16/2004 Four
Paraplegic subject 1 L1-L3 ASIA A 3/26/2002 Eight
Paraplegic subject 1 T12 ASIA C 6/3/2002 Eight
Paraplegic subject 1 L1 ASIA A 10/1/2002 Eight
Paraplegic subject 1 T12 ASIA A 1/16/2003 Eight
Paraplegic subject 1 T12 ASIA C 2/11/2003 Eight
Paraplegic subject 2 T10 ASIA A Three
Paraplegic subject 3 T12-L1 ASIA A Once

19
Table 3.2: Channel listing with calibrations & units Engineering Units Channel Signal Voltage (V) Value Units
0 AP [0 2] [0 200] mmHg 1 ECG (analog) No calibration No calibration unitless 2 ∆Z [0 0.98 1.95 4.88] [0 50 100 250] unitless 3 ∆Z/∆T [0 0.98 1.95 4.88] [0 50 100 250] unitless 4 SV [0 0.83 1.67 2.5] [0 50 100 150] mL 5 HR (TEBCO) [0 0.83 1.67 3.33] [0 50 100 200] beats/min 6 TFC [0 4.03] [0 0.033] unitless 7 ∆Z/∆Tresp [0 0.98 1.95 4.88] [0 50 100 250] unitless 8 Resp. rate [0 0.5 1 1.5] [0 10 20 30] breaths/min 9 RF ±0.35 ±10, 0 cm/sec
10 CC [0 0.025], [0 0.25] [0 0.1], [0 1] % 11 Tilt Angle [0.62 3.2] [0 90] degrees 12 SP1 [0 1] [0 100] perfusion units
13 CMBC1 [0 1] [0 100] concentration units
14 SP2 [0 1] [0 100] perfusion units
15 CMBC2 [0 1] [0 100] concentration units
Supine Control
20o HUT
40o HUT
60o HUT
80o HUT
Time (min)
Figure 3.1: Standard protocol with supine control, four levels of HUT and recovery
Recovery

20
Chapter Four
Results
Typical hemodynamic responses to HUT are shown for one AB and one tetraplegic
subject in figure 4.1. The cardiovascular variables of interest (heart rate, arterial pressure, stroke
volume, upper and lower body skin perfusion and calf circumference) exhibit dissimilarities
between the two subjects. Arterial pressure and heart rate were well maintained in the AB
subject but not in the tetraplegic subject. Upper and lower body skin perfusion were more
affected by HUT in the AB subject because in the tetraplegic subject skin perfusion in the upper
and lower body was low during control and remained low during HUT.
When considering the responses for the AB and paraplegic groups, arterial blood pressure
(figure 4.1a) was similar for the group of AB and paraplegic subjects during supine control, four
levels of HUT and recovery; however, there was much variability in the tetraplegic group. Due
to diminished cardiovascular control, orthostatic hypotension was common in SCI (figure 4.1b).
Mean values and spectral power of arterial blood pressure, heart rate and upper and lower
body skin perfusion were used to test for differences between AB and SCI (paraplegic and
tetraplegic) subjects. For all mean and spectral power results shown from the three groups, five
minutes of data were used to analyze supine control, four levels of HUT (20o, 40 o, 60 o, 80 o ) and
recovery periods. A typical mean arterial blood pressure trace (i.e. pressure average per cardiac
cycle and downsampled to 5 Hz) with the spectral power from five minutes of supine control
(insert) in one AB subject is shown in figure 4.2. Figure 4.2 shows five min of arterial pressure
during control and the spectral power produced from the arterial pressure signal-the peak in the
LF region is indicative of sympathetic activity. Arterial blood pressure group results analyzed in
the time and frequency domains (figure 4.2a and table 4.2) further illustrate arterial pressure
differences among the three groups. Arterial pressure spectral power in the VLF and HF regions
do not show any great differences among the three groups, however, arterial pressure spectral
power in the LF region is an excellent discriminator (p<0.05) among the three groups. Arterial
pressure spectral power in the LF region is larger in the AB than the SCI groups and spectral
power increases with increasing HUT in AB but decreases in SCI. For illustrative purposes, AB,
paraplegic and tetraplegic group averaged arterial pressure spectral power figures are shown in
Appendix E.

21
Heart rate raw data (downsampled to 5 Hz) with the mean and spectral power from five
minutes of supine control in one AB subject is shown in figure 4.3-the peak in the LF region is
indicative of sympathetic activity and the peak in the HF region is indicative of parasympathetic
activity. In AB subjects, the LF peak increases and the HF peak decreases with increasing levels
of HUT. Heart rate group results analyzed in the time and frequency domains (figure 4.3a and
table 4.3) further illustrate heart rate differences among the three groups. Mean heart rate
increases with increasing HUT in all three groups, however tetraplegic subjects have lower
values of heart rate at all levels of HUT. Heart rate spectral power in the VLF and LF regions is
greatest in the AB group, as it increases with increasing HUT, however in the paraplegic and
tetraplegic groups heart rate spectral power in these regions decreases with increasing HUT.
Heart rate spectral power in the HF region is greatest in the AB group and is marked by
decreases with increasing HUT in all three groups. For illustrative purposes, AB, paraplegic and
tetraplegic group averaged heart rate spectral power figures are shown in Appendix E.
Upper body skin perfusion raw data (downsampled to 5 Hz) with the mean and spectral
power from five minutes of supine control (insert) in one AB subject is shown in figure 4.4.
Most of the spectral power is in the LF region, which is indicative of sympathetic activity to the
skin arterioles controlling blood flow in the forearm. There is very little power in the HF region,
which shows that skin blood flow in the forearm is not under much parasympathetic control.
Upper body skin perfusion group results analyzed in the time and frequency domains (figure 4.4a
and table 4.4) further illustrate upper body skin perfusion differences among the three groups.
Mean upper body skin perfusion tended to decrease with increasing HUT in all three groups,
with paraplegic subjects having the highest perfusion values. Upper body skin perfusion spectral
power in the VLF, LF and HF regions in the AB groups remains relatively constant with
increasing HUT. Paraplegic subjects exhibit the largest, non-significant, values of spectral
power, while the tetraplegic subjects exhibit the lowest values of spectral power in the VLF, LF
and HF regions. For illustrative purposes, AB, paraplegic and tetraplegic group averaged upper
body skin perfusion spectral power figures are shown in Appendix E.
Lower body skin perfusion raw data (downsampled to 5 Hz) with the mean and spectral
power from five minutes of supine control (control) in one AB subject is shown in figure 4.5.
Most of the spectral power is in the LF region, which is indicative of sympathetic activity to the
skin arterioles controlling blood flow in the shin. Lower body skin perfusion group results

22
analyzed in the time and frequency domains (figure 4.5a and table 4.5) further illustrate the
lower body skin perfusion differences among the three groups. Mean lower body skin perfusion
decreases with increasing HUT in all three groups, however the AB group has a greater perfusion
than the SCI groups. Lower body skin perfusion spectral power in the VLF and LF regions
decrease with increasing HUT in all three groups, however the AB group maintains the greatest
(p<0.05 in LF region) spectral power in these regions for every level of HUT. Lower body skin
perfusion spectral power in the LF region is an excellent approach that can be used to
discriminate among the three groups and assess level of autonomic damage following SCI.
Lower body skin perfusion spectral power in the HF region has a tendency to decrease with
increasing HUT in all three groups. For illustrative purposes, AB, paraplegic and tetraplegic
group averaged lower body skin perfusion spectral power figures are shown in Appendix E.
In order to assess cardiac function, the coordination or correlation of heart rate and
arterial blood pressure signals was conducted. Cross correlation of heart rate and arterial
pressure in the LF and HF regions during five minutes of supine control in one AB subject is
shown in figure 4.6. Cross correlation negative and positive peaks, negative and positive lag
times in the LF region for AB, paraplegic and tetraplegic groups are shown in figure 4.6a and
table 4.6. As mentioned in the methods section, a negative peak designates a point at which
arterial pressure is increasing as heart rate is decreasing or vice versa and a positive peak
indicates a point at which both signals are increasing or decreasing together. In AB subjects,
arterial pressure and heart rate have a negative cross correlation magnitude of –0.4 during supine
control and increases to –0.5 with HUT. AB and paraplegic subjects have a negative cross
correlation lag time of ~2.2 seconds for supine control, all levels of HUT and recovery, while
tetraplegic subjects have a lag time a ~1.8 seconds for the entire protocol. In paraplegic and
tetraplegic subjects, the negative cross correlation peak is –0.2, increases to –0.4 in paraplegic
and decreases to –0.03 in tetraplegic subjects with increasing levels of HUT. AB subjects have a
positive cross correlation lag time of ~two seconds during supine control and decreases to ~1.5
seconds with increasing HUT, while paraplegic subjects maintain a lag time of ~1.5 seconds and
tetraplegic subjects have a lag time of ~1.25 seconds during control and decreased to 0.25
seconds during the 80o HUT. For descriptive purposes, AB, paraplegic and tetraplegic group
averaged cross correlation of heart rate and arterial pressure are shown in Appendix F.

23
Cross correlation of arterial pressure and upper body skin perfusion in the LF and HF
regions during five minutes of supine control in one AB subject is shown in figure 4.7. Cross
correlation positive and negative peaks, positive and negative lag times in the LF region for AB,
paraplegic and tetraplegic groups are shown in figure 4.7a and table 4.7. In AB subjects the
magnitude of the positive cross correlation between upper body skin perfusion and arterial
pressure is 0.3 during control and increases to 0.4 at the highest degree of HUT. Paraplegic and
tetraplegic subjects had a magnitude of 0.4 and 0.3, respectively, during control and decreased to
0.15 and 0.18, respectively, during the highest degree of HUT. Upper body skin perfusion
lagged arterial pressure in all groups, however the lag times were minimal. In AB subjects the
magnitude of the negative cross correlation was –0.4 during control and decreased to –0.3 at the
highest degree of HUT. In paraplegic subjects the magnitude of the negative correlation was –
0.3 and decreased to –0.1 at the highest degree of HUT, whereas tetraplegic subjects maintained
a magnitude of –0.2 for the entire protocol. Upper body skin perfusion led arterial pressure in all
three groups: four seconds in AB, five to six seconds in paraplegic and seven seconds in
tetraplegic subjects. For descriptive purposes, AB, paraplegic and tetraplegic group averaged
cross correlation of arterial pressure and upper body skin perfusion are shown in Appendix F.
Cross correlation of heart rate and upper body skin perfusion in the LF and HF regions
during five minutes of supine control in one AB subject is shown in figure 4.8. Cross correlation
positive and negative peaks, positive and negative lag times in the LF region for AB, paraplegic
and tetraplegic groups are shown in figure 4.8a and table 4.8. In AB, paraplegic and tetraplegic
subjects the magnitude of the positive cross correlation was 0.4, 0.4 and 0.35, respectively,
during control and decreased to 0.35, 0.2 and 0.1, respectively, at the highest level of HUT. In
all cases, upper body skin perfusion led heart rate and the lead times were minimal and not
significant. In AB, paraplegic and tetraplegic subjects the magnitude of the negative cross
correlation was –0.35, -0.25 and –0.2, respectively, during control and decreased to –0.25, -0.2
and –0.05, respectively, at the highest level of HUT. In all cases, upper body skin perfusion led
heart rate: in AB seven seconds during control and five seconds at the highest level of HUT, in
paraplegic subjects seven seconds during control and three seconds at the highest level of HUT
and tetraplegics had a lead time of six seconds for the entire HUT. For descriptive purposes, AB,
paraplegic and tetraplegic group averaged cross correlation of heart rate and upper body skin
perfusion are shown in Appendix F.

24
Cross correlation of arterial pressure and lower body skin perfusion in the LF and HF
regions during five minutes of supine control in one AB subject is shown in figure 4.9. Cross
correlation positive and negative peaks, positive and negative lag times in the LF region for AB,
paraplegic and tetraplegic groups are shown in figure 4.9a and table 4.9. In AB, paraplegic and
tetraplegic subjects the magnitude of the positive cross correlation was 0.35, 0.4 and 0.25,
respectively, during control and increased to 0.4 in AB, but decreased to 0.2 for paraplegic and
tetraplegic at the highest level of HUT. In all cases, lower body skin perfusion lagged arterial
pressure and the lag times for AB were ~two seconds for all levels of HUT. In paraplegic
subjects, lower body skin perfusion lagged arterial pressure by two seconds during control but
led arterial pressure by two seconds during the highest level of HUT. In tetraplegic subjects,
lower body skin perfusion led arterial pressure by ~0.2 seconds during control and ~two seconds
during the highest level of HUT. In AB, paraplegic and tetraplegic subjects the magnitude of the
negative cross correlation was –0.35, -0.25 and –0.15, respectively, during control and decreased
to –0.28, -0.18 and –0.15, respectively, at the highest level of HUT. In all cases, lower body skin
perfusion led arterial pressure: in AB ~five seconds during all levels of HUT, in paraplegic
subjects ~four seconds during all levels of HUT and tetraplegics had a lead time of ~four
seconds during control to ~six seconds for the highest level of HUT. For descriptive purposes,
AB, paraplegic and tetraplegic group averaged cross correlation of arterial pressure and lower
body skin perfusion are shown in Appendix F.
Cross correlation of heart rate and lower body skin perfusion in the LF and HF regions
during five minutes of supine control in one AB subject is shown in figure 4.10. Cross
correlation positive and negative peaks, positive and negative lag times in the LF region for AB,
paraplegic and tetraplegic groups are shown in figure 4.10a and table 4.10. In AB, paraplegic
and tetraplegic subjects the magnitude of the positive cross correlation was 0.4, 0.28 and 0.32,
respectively, during control and decreased to 0.32, 0.15 and 0.15 at the highest level of HUT.
Lower body skin perfusion lagged heart rate in AB subjects by 0.25 seconds during control and
one second during the highest level of HUT. In paraplegic and tetraplegic subjects, lower body
skin perfusion led heart rate by two and 2.25 seconds, respectively, during control and lagged
heart rate by 0.25 seconds during the highest level of HUT. In AB, paraplegic and tetraplegic
subjects the negative cross correlation magnitude was –0.2, -0.15 and –0.18, respectively, during
control and increased to –0.33 in AB, but decreased to –0.1 in paraplegic and tetraplegic subjects

25
during the highest degree of HUT. Lower body skin perfusion led heart rate by ~four seconds in
AB, ~six seconds in paraplegic and ~five seconds in tetraplegic subjects. For descriptive
purposes, AB, paraplegic and tetraplegic group averaged cross correlation of heart rate and lower
body skin perfusion are shown in Appendix F.
Cross correlation of upper and lower body skin perfusion in the LF and HF regions
during five minutes of supine control in one AB subject is shown in figure 4.11. Cross
correlation positive and negative peaks, positive and negative lag times in the LF region for AB,
paraplegic and tetraplegic groups are shown in figure 4.11a and table 4.11.
In AB, paraplegic and tetraplegic subjects the positive cross correlation magnitude was 0.4, 0.32
and 0.2 (significant group effect, p<0.05), respectively, during control and decreased to 0.3, 0.2
and 0.15 during the highest level of HUT. In AB subjects, lower body skin perfusion led upper
body skin perfusion by 0.25 seconds during control but lagged upper body skin perfusion by
~two seconds during the highest level of HUT. In paraplegic subjects lower body skin perfusion
lagged upper body skin perfusion by ~0.5 seconds during control and led upper body skin
perfusion by ~1.5 seconds during the highest level of HUT. In tetraplegic subjects, the minimal
lead and lag times were variable and largely dependent on the level of HUT. In AB, paraplegic
and tetraplegic subjects the negative cross correlation magnitude was -0.3, -0.2 and –0.1,
respectively, during control and decreased to –0.15 in paraplegic subjects but remained constant
in AB and tetraplegic subjects during the highest level of HUT. Lower body skin perfusion
lagged upper body skin perfusion by ~six, six and seven seconds, respectively, in AB, paraplegic
and tetraplegic subjects. For descriptive purposes, AB, paraplegic and tetraplegic group averaged
cross correlation of upper and lower body skin perfusion are shown in Appendix F.
Plasma volume shifts out of the intravascular space, into the interstitial space are shown
for AB, paraplegic and tetraplegic groups in figure 4.12. Plasma volume shifts, a natural effect
of HUT, is greater in tetraplegic than paraplegic than the AB group. The larger shift of plasma
volume out of the vascular space in the SCI groups is indicative of a leaky vascular system and
could also be a contributor to orthostatic hypotension. Plasma volume shifts, % change per
minute, were calculated from changes in hematocrit and total proteins using only those samples
taken before and after the HUT. These tilt-induced changes indicate that SCI subjects were less
effective regulators of circulating plasma than were AB subjects, even though SCI subjects wore
support stockings during the study.

26
Plasma renin activity (PRA), an index of the body’s attempt to regulate plasma volume,
was dramatically higher in SCI than AB subjects (figure 4.13). With increasing levels of HUT,
AB demonstrate small gradual increases, while SCI subjects display erratic behavior of PRA. In
AB subjects, PRA rose from levels below 1 ng/mL/hr to about 4 ng/mL/hr with increasing levels
of tilt, however SCI subjects had resting levels ranging from 2-16 ng/mL/hr rising to over 60
ng/mL/hr with tilt.
Indexes of sympathetic activity, epinephrine (figure 4.14) and norepinephrine (figure
4.15), are illustrated for AB and SCI subjects. AB have lower initial concentrations of
epinephrine and norepinephrine and exhibit gradual increases with increasing levels of HUT of
both epinephrine and norepinephrine when compared to SCI. SCI subjects demonstrate erratic
behavior of epinephrine and norepinephrine with increasing levels of HUT, indicating a possible
lack of controlled release of hormones from the adrenal medulla or a possible lack of end organ
effect caused by disrupted receptors (discussed in more detail in chapter five).
Response to Results
There are many results presented at this point, however only some are of importance.
The clearest differences between the three groups were evident in spectral analysis obtained in
the frequency domain: Arterial blood pressure and lower body skin perfusion spectral power in
the LF region are of significance. These variables analyzed in the LF region show differences
among the three groups that could be good discriminators of the three groups, as well as show
level of SCI and autonomic function. Arterial pressure in the LF region provides a significant
group and group by HUT interaction. AB and tetraplegic, as well as paraplegic and tetraplegic
have a significant group interaction. Lower body skin perfusion analyzed in the LF region gave
a significant group and a significant HUT effect. Other variables have scattered significance,
albeit, not as important as arterial pressure and lower body skin perfusion.
A more complicated measure to assess the level of SCI and autonomic function is to use
the engineering tool of cross correlation. Cross correlation can be applied to arterial blood
pressure, heart rate, upper and lower body skin perfusion to assess the coordination of arterial
pressure with upper and lower body skin perfusion and then to assess the correlation of heart rate
with upper and lower body skin perfusion.
Additional measures of autonomic function are present in hormonal analysis. The
behavior of PRA, epinephrine and norepinephrine are excellent indicators of erratic, uncontrolled

27
release of hormones and may provide discriminants of levels of injury once data analysis is
complete. These vasoactive hormones may also provide an early indication of future vascular
damage due to loss of controlled release. The behavior of hematocrit and total proteins with
HUT was also a good indicator of the larger amount of fluid shifted out of the vasculature in SCI
subjects. This index of fluid shifts may provide an index of future orthostatic hypotension
problems that SCI subjects may experience.

28
During Control, 20o, 40 o, 60 o HUT: AB (n=11), Paraplegic (5 studies from 3 subjects), Tetraplegic (6 studies from 3 subjects)
Due to pre-syncope: 80 o HUT data excluded from statistical analysis: AB (n=7), Paraplegic (n=5 studies from 3 subjects),Tetraplegic (n=5 studies from 3 subject)
Post hoc pairwise comparisons are made if group by tilt interaction is significant: ♣ different from AB at p≤0.05 level (indicates Group and Group x HUT effects) ∗ different from Tetraplegic at p≤0.05 level (indicates Group and Group x HUT effects) ♦ difference from control is significant at p≤0.05 level (indicates overall HUT effect)
Table 4.1: Stroke volume, cardiac output & total peripheral resistance for AB, paraplegic
& tetraplegic during supine control, 20o, 40 o, 60 o, 80 o HUT and recovery. Stroke volume (mL)-HUT effect (p<0.001)
Control 20 o 40 o 60 o 80 o Recovery AB 118 ± 8 106 ± 9♦ 89 ± 7♦ 75 ± 6♦ 70 ± 6 115 ± 10
Paraplegic 104 ± 9 93 ± 6♦ 84 ± 4♦ 77 ± 2♦ 68 ± 2 95 ± 4Tetraplegic 109 ± 15 94 ± 10♦ 77 ± 17♦ 82 ± 10♦ 70 ± 11 127 ± 18
Cardiac output (L/min)-HUT effect (p<0.027) AB 7 ± 0.3 7 ± 0.3♦ 6 ± 0.3♦ 6 ± 0.3♦ 6 ± 0.5 7 ± 0.4♦
Paraplegic 8 ± 0.8 7 ± 0.6♦ 7 ± 0.4♦ 7 ± 0.3♦ 7 ± 0.3 8 ± 0.7♦Tetraplegic 7 ± 1 6 ± 1♦ 6 ± 1♦ 6 ± 1♦ 6 ± 1 6 ± 1♦
Total peripheral resistance (mmHg/(L/min))-HUT effect (p<0.034) AB 11 ± 0.5 12 ± 0.7 13 ± 0.7 14 ± 0.7♦ 15 ± 1.3 13 ± 0.9♦
Paraplegic 10 ± 2 11 ± 2 11 ± 1 11 ± 1♦ 13 ± 2 11 ± 2♦Tetraplegic 16 ± 3 13 ± 1 14 ± 1 13 ± 3♦ 16 ± 5 18 ± 4♦
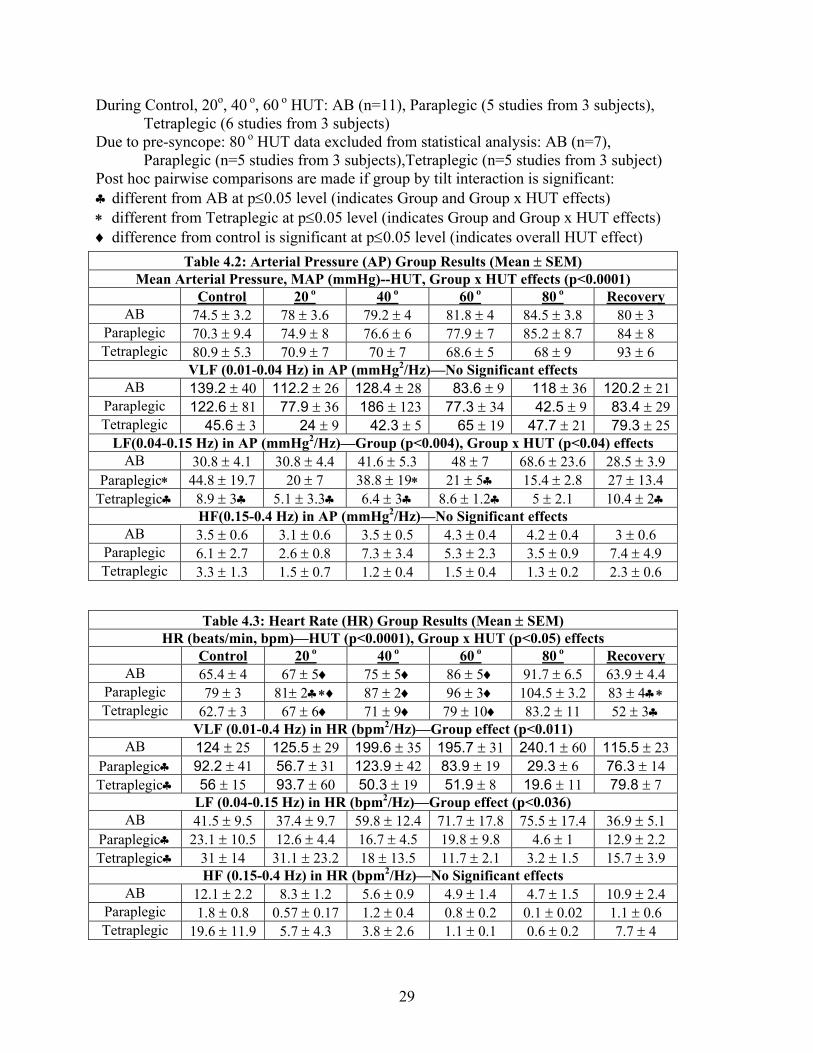
29
During Control, 20o, 40 o, 60 o HUT: AB (n=11), Paraplegic (5 studies from 3 subjects), Tetraplegic (6 studies from 3 subjects)
Due to pre-syncope: 80 o HUT data excluded from statistical analysis: AB (n=7), Paraplegic (n=5 studies from 3 subjects),Tetraplegic (n=5 studies from 3 subject)
Post hoc pairwise comparisons are made if group by tilt interaction is significant: ♣ different from AB at p≤0.05 level (indicates Group and Group x HUT effects) ∗ different from Tetraplegic at p≤0.05 level (indicates Group and Group x HUT effects) ♦ difference from control is significant at p≤0.05 level (indicates overall HUT effect)
Table 4.2: Arterial Pressure (AP) Group Results (Mean ± SEM) Mean Arterial Pressure, MAP (mmHg)--HUT, Group x HUT effects (p<0.0001) Control 20 o 40 o 60 o 80 o Recovery
AB 74.5 ± 3.2 78 ± 3.6 79.2 ± 4 81.8 ± 4 84.5 ± 3.8 80 ± 3 Paraplegic 70.3 ± 9.4 74.9 ± 8 76.6 ± 6 77.9 ± 7 85.2 ± 8.7 84 ± 8 Tetraplegic 80.9 ± 5.3 70.9 ± 7 70 ± 7 68.6 ± 5 68 ± 9 93 ± 6
VLF (0.01-0.04 Hz) in AP (mmHg2/Hz)—No Significant effects AB 139.2 ± 40 112.2 ± 26 128.4 ± 28 83.6 ± 9 118 ± 36 120.2 ± 21
Paraplegic 122.6 ± 81 77.9 ± 36 186 ± 123 77.3 ± 34 42.5 ± 9 83.4 ± 29Tetraplegic 45.6 ± 3 24 ± 9 42.3 ± 5 65 ± 19 47.7 ± 21 79.3 ± 25
LF(0.04-0.15 Hz) in AP (mmHg2/Hz)—Group (p<0.004), Group x HUT (p<0.04) effects AB 30.8 ± 4.1 30.8 ± 4.4 41.6 ± 5.3 48 ± 7 68.6 ± 23.6 28.5 ± 3.9
Paraplegic∗ 44.8 ± 19.7 20 ± 7 38.8 ± 19∗ 21 ± 5♣ 15.4 ± 2.8 27 ± 13.4 Tetraplegic♣ 8.9 ± 3♣ 5.1 ± 3.3♣ 6.4 ± 3♣ 8.6 ± 1.2♣ 5 ± 2.1 10.4 ± 2♣
HF(0.15-0.4 Hz) in AP (mmHg2/Hz)—No Significant effects AB 3.5 ± 0.6 3.1 ± 0.6 3.5 ± 0.5 4.3 ± 0.4 4.2 ± 0.4 3 ± 0.6
Paraplegic 6.1 ± 2.7 2.6 ± 0.8 7.3 ± 3.4 5.3 ± 2.3 3.5 ± 0.9 7.4 ± 4.9 Tetraplegic 3.3 ± 1.3 1.5 ± 0.7 1.2 ± 0.4 1.5 ± 0.4 1.3 ± 0.2 2.3 ± 0.6
Table 4.3: Heart Rate (HR) Group Results (Mean ± SEM) HR (beats/min, bpm)—HUT (p<0.0001), Group x HUT (p<0.05) effects
Control 20 o 40 o 60 o 80 o Recovery AB 65.4 ± 4 67 ± 5♦ 75 ± 5♦ 86 ± 5♦ 91.7 ± 6.5 63.9 ± 4.4
Paraplegic 79 ± 3 81± 2♣∗♦ 87 ± 2♦ 96 ± 3♦ 104.5 ± 3.2 83 ± 4♣∗ Tetraplegic 62.7 ± 3 67 ± 6♦ 71 ± 9♦ 79 ± 10♦ 83.2 ± 11 52 ± 3♣
VLF (0.01-0.4 Hz) in HR (bpm2/Hz)—Group effect (p<0.011) AB 124 ± 25 125.5 ± 29 199.6 ± 35 195.7 ± 31 240.1 ± 60 115.5 ± 23
Paraplegic♣ 92.2 ± 41 56.7 ± 31 123.9 ± 42 83.9 ± 19 29.3 ± 6 76.3 ± 14 Tetraplegic♣ 56 ± 15 93.7 ± 60 50.3 ± 19 51.9 ± 8 19.6 ± 11 79.8 ± 7
LF (0.04-0.15 Hz) in HR (bpm2/Hz)—Group effect (p<0.036) AB 41.5 ± 9.5 37.4 ± 9.7 59.8 ± 12.4 71.7 ± 17.8 75.5 ± 17.4 36.9 ± 5.1
Paraplegic♣ 23.1 ± 10.5 12.6 ± 4.4 16.7 ± 4.5 19.8 ± 9.8 4.6 ± 1 12.9 ± 2.2 Tetraplegic♣ 31 ± 14 31.1 ± 23.2 18 ± 13.5 11.7 ± 2.1 3.2 ± 1.5 15.7 ± 3.9
HF (0.15-0.4 Hz) in HR (bpm2/Hz)—No Significant effects AB 12.1 ± 2.2 8.3 ± 1.2 5.6 ± 0.9 4.9 ± 1.4 4.7 ± 1.5 10.9 ± 2.4
Paraplegic 1.8 ± 0.8 0.57 ± 0.17 1.2 ± 0.4 0.8 ± 0.2 0.1 ± 0.02 1.1 ± 0.6 Tetraplegic 19.6 ± 11.9 5.7 ± 4.3 3.8 ± 2.6 1.1 ± 0.1 0.6 ± 0.2 7.7 ± 4

30
Table 4.4: Upper Body (Forearm) Skin Perfusion (SP1) Results (Mean ± SEM) SP1 (Perfusion Units, PU)—HUT (p<0.03), Group x HUT (p<0.025) effects
Control 20 o 40 o 60 o 80 o Recovery AB 10.6 ± 2 11.5 ± 1.9 11.3 ± 2 10 ± 2♦ 9.3 ± 1.8 11.3 ± 2♦
Paraplegic 18.3 ± 5♣ 17.3 ± 4.7 14.1 ± 2.9 12.3 ± 2♦ 10.5 ± 1.9 12.6 ± 3♦ Tetraplegic 11 ± 1.8 10.4 ± 2 8.9 ± 2 7.1 ± 2♦ 5.4 ± 1.7 9.8 ± 2♦
VLF (0.01-0.04 Hz) in SP1 (PU2/Hz)—No Significant effects AB 11.2 ± 4 18 ± 9 33.4 ± 14 20.2 ± 5 18.7 ± 7 20 ± 6
Paraplegic 95 ± 60 21.8 ± 5 22.2 ± 4 19.1 ± 7 19 ± 9 38.2 ± 24Tetraplegic 4.8 ± 3 5 ± 4 1.9 ± .3 2.8 ± 1 1 ± .3 3.8 ± 1
LF (0.04-0.15 Hz) in SP1 (PU2/Hz)—No Significant effects AB 5.4 ± 1.2 10.7 ± 4.9 10.9 ± 3.7 9.4 ± 2.4 8.5 ± 2.5 7.5 ± 2.1
Paraplegic 17.8 ± 9.2 8.3 ± 1.4 7 ± 3.4 8.6 ± 5.9 5.7 ± 2.5 11.2 ± 6.6 Tetraplegic 1.6 ± 0.6 1.1 ± 0.4 1.3 ± 0.9 1 ± 0.2 0.5 ± 0.1 1.7 ± 0.9
HF (0.15-0.4 Hz) in SP1 (PU2/Hz)—No Significant effects AB 0.4 ± 0.1 0.6 ± 0.2 0.6 ± 0.3 0.6 ± 0.2 0.6 ± 0.3 0.8 ± 0.4
Paraplegic 1.9 ± 0.9 1 ± 0.5 1.2 ± 0.7 2.5 ± 1.8 1 ± 0.5 3.6 ± 2.9 Tetraplegic 0.4 ± 0.1 0.4 ± 0.2 0.2 ± 0.04 0.3 ± 0.1 0.2 ± 0.1 0.6 ± 0.3
Table 4.5: Lower Body (Shin) Skin Perfusion (SP2) Group Results (Mean ± SEM) SP2 (Perfusion Units, PU)—HUT effect (p<0.001)
Control 20 o 40 o 60 o 80 o Recovery AB 8.1 ± 1 5.5 ± 0.4♦ 4.8 ± 0.3♦ 4.6 ± 0.3♦ 4.6 ± 0.4 7.8 ± 0.9♦
Paraplegic 7.5 ± 1 5.6 ± 1♦ 5.2 ± 1♦ 4.7 ± 1♦ 4.7 ± 0.9 6.3 ± 1♦Tetraplegic 6.9 ± 1 4.8 ± 1♦ 4.5 ± 1♦ 4.2 ± 1♦ 4.3 ± 1 5.4 ± 1♦
VLF (0.01-0.04 Hz) in SP2 (PU2/Hz)—Group effect (p<0.016) AB 5.4 ± 1 5 ± 1 6.6 ± 2 5.3 ± 2 4 ± 1 13 ± 6
Paraplegic♣ 7 ± 4 1 ± .7 1 ± .4 1 ± .6 0.4 ± .2 1.4 ± .6Tetraplegic♣ 1 ± .2 1.2 ± 1 1 ± .8 0.3 ± .2 0.2 ± .1 1 ± .7
LF (0.04-0.15 Hz) in SP2 (PU2/Hz)—HUT (p<0.007), Group (p<0.004) effects AB 1.7 ± 0.2 1.2 ± 0.2♦ 1 ± 0.3♦ 1 ± 0.3♦ 0.7 ± 0.2 1.6 ± 0.4
Paraplegic♣ 1.5 ± 1 0.4 ± 0.2♦ 0.3 ± 0.1♦ 0.3 ± 0.2♦ 0.1 ± 0.03 0.4 ± 0.3Tetraplegic♣ 0.5 ± 0.2 0.1 ± 0.1♦ 0.1 ± .05♦ 0.1 ± .01♦ 0.1 ± 0.06 0.3 ± 0.1
HF (0.15-0.4 Hz) in SP2 (PU2/Hz)—HUT effect (p<0.022) AB 0.2 ± 0.05 0.3 ± 0.06 0.1 ± .04♦ 0.2 ± 0.07 0.1 ± 0.02 0.2 ± 0.06
Paraplegic 0.3 ± 0.2 0.4 ± 0.1 0.1 ± .05♦ 0.2 ± 0.1 0.2 ± 0.06 0.1 ± 0.1Tetraplegic 0.1 ± 0.08 0.03 ± 0.01 .01 ± .01♦ 0.03 ± 0.01 0.05 ± 0.04 0.04 ± 0.01

31
Table 4.6: Low Frequency (0.04-0.15 Hz) Cross Correlation Between Heart Rate & Arterial Pressure (Mean ± SEM)
LF Negative Magnitudes—Group effect (p<0.001) Control 20 o 40 o 60 o 80 o Recovery
AB -0.4 ± .03 -0.4 ± .02 -0.5 ± .06 -0.5 ± .06 -0.5 ± .07 -0.4 ± .03 Paraplegic♣ -0.2 ± .05 -0.2 ± .05 -0.3 ± .07 -0.4 ± .09 -0.2 ± .13 -0.2 ± .06 Tetraplegic♣ -0.2 ± .1 -0.1 ± .09 -0.2 ± .1 -0.07 ± .1 -0.03 ± .04 -0.09 ± .08
LF Negative Lag Times (sec)—No Significant effects AB -2.2 ± .02 -2.1 ± .05 -2.1 ± .03 -2.2 ± .01 -2.12 ± .03 -2.05 ± .09
Paraplegic -2.2 -2.2 -2.2 -2.2 ± .04 -2.12 ± .08 -2.2 Tetraplegic -1.8 ± .3 -1.8 ± .3 -1.8 ± .3 -1.3 ± .4 -1.8 ± .4 -1.8 ± .3
LF Positive Magnitudes—Group effect (p<0.0001) AB 0.5 ± .04 0.4 ± .03 0.4 ± .03 0.4 ± .04 0.4 ± .05 0.5 ± .04
Paraplegic∗ 0.5 ± .09 0.5 ± .05 0.4 ± .07 0.4 ± .07 0.4 ± .03 0.4 ± .07 Tetraplegic♣ 0.6 ± .1 0.4 ± .1 0.4 ± .1 0.2 ± .1 0.03 ± .1 0.5 ± .1
LF Positive Lag Times (sec)—HUT (p<0.003), Group x HUT (p<0.036), Group (p<0.003) effects
AB 1.7 ± .03 1.8 1.8 1.8 1.8 ± .05 1.8 Paraplegic∗ 1.6 ± .1 1.6 ± .1♣ 1.8 ± .04 1.8 1.4 ± .4 1.6 ± .2
Tetraplegic♣ 1.3 ± .3♣ 1.2 ± .3♣ 1.3 ± .3♣ 0.7 ± .4♣ 0.2 ± .2 1 ± .3♣
Table 4.7: Low Frequency (0.04-0.15 Hz) Cross Correlation Between Arterial Pressure & Upper Body Skin Perfusion (Mean ± SEM)
LF Negative Magnitudes—Group effect (p<0.002) Control 20 o 40 o 60 o 80 o Recovery
AB -0.4 ± .03 -0.4 ± .03 -0.4 ± .03 -0.4 ± .05 -0.3 ± .05 -0.4 ± .03 Paraplegic♣ -0.3 ± .1 -0.4 ± .05 -0.3 ± .04 -0.2 ± .05 -0.1 ± .02 -0.3 ± .1 Tetraplegic♣ -0.2 ± .04 -0.2 ± .05 -0.3 ± .03 -0.2 ± .02 -0.2 ± .1 -0.1 ± .04
LF Negative Lag Times (sec)—Group effect (p<0.006) AB 4.3 ± .2 3.9 ± .2 4 ± .3 3.7 ± .4 3.9 ± .5 3.4 ± .4
Paraplegic♣ 5.7 ± .8 4.8 ± .6 5.5 ± 1.1 5.6 ± .9 5.2 ± 2 4 ± .7Tetraplegic♣ 6.6 ± 1.1 7.2 ± 1 4.9 ± .9 5.3 ± 1.2 5.9 ± 1.1 4.1 ± .9
LF Positive Magnitudes—No Significant effects AB 0.3 ± .03 0.4 ± .04 0.4 ± .04 0.4 ± .05 0.3 ± .05 0.3 ± .03
Paraplegic 0.4 ± .1 0.4 ± .05 0.3 ± .03 0.3 ± .05 0.2 ± .02 0.3 ± .1Tetraplegic 0.3 ± .06 0.4 ± .09 0.3 ± .05 0.3 ± .05 0.2 ± .04 0.3 ± .07
LF Positive Lag Times (sec)—No Significant effects AB -0.2 ± 1 -1.4 ± .3 1.7 ± 1.4 -1.1 ± 1.3 0.2 ± 1.2 1.5 ± 2
Paraplegic -0.3 ± 1 -1.1 ± .6 -0.9 ± .6 -0.5 ± .9 0.6 ± 1 -0.2 ± 3.1Tetraplegic -0.03 ± .2 -0.6 ± .7 -0.4 ± .7 0.1 ± 1.4 2.9 ± 2.1 2.1 ± 1.5

32
Table 4.8: Low Frequency (0.04-0.15 Hz) Cross Correlation Between Heart Rate & Upper Body Skin Perfusion (Mean ± SEM)
LF Negative Magnitudes—HUT (p<0.03), Group (p<0.013) effects Control 20 o 40 o 60 o 80 o Recovery
AB -0.3 ± .03 -0.3 ± .02 -0.3 ± .03 -0.2 ± .04♦ -0.2 ± .03 -0.3 ± .02Paraplegic♣ -0.3 ± .03 -0.2 ± .05 -0.2 ± .07 -0.2 ± .05♦ -0.2 ± .04 -0.2 ± .07Tetraplegic♣ -0.2 ± .04 -0.2 ± .05 -0.2 ± .04 -0.1 ± .04♦ -0.06 ± .03 -0.1 ± .02
LF Negative Lag Times (sec)—HUT (p<0.002), Group x HUT (p<0.006) effects AB 7 ± .2 6.7 ± .2 6 ± .7 5.7 ± .9 4.7 ± 1.1 6.5 ± .3♦
Paraplegic 6.9 ± .7 6.2 ± .4∗ 5.3 ± 1.4 4.4 ± 1.4 2.9 ± 1.9 5.5 ± .7♦Tetraplegic 6.1 ± .9 8.2 ± .7♣ 5.5 ± 1 6.3 ± 1.2 6.2 ± 1.6 3.8 ± 1♣♦
LF Positive Magnitudes—HUT (p<0.023), Group (p<0.013) effects AB 0.4 ± .04 0.4 ± .03 0.4 ± .05 0.4 ± .05♦ 0.3 ± .04 0.3 ± .03♦
Paraplegic♣ 0.4 ± .04 0.3 ± .02 0.3 ± .03 0.2 ± .04♦ 0.2 ± .03 0.1 ± .03♦Tetraplegic♣ 0.4 ± .06 0.3 ± .07 0.3 ± .05 0.2 ± .02♦ 0.1 ± .02 0.2 ± .05♦
LF Positive Lag Times (sec)—No Significant effects AB 1.5 ± .2 1.4 ± .2 -0.1 ± .9 -0.4 ± 1.2 1.9 ± .8 0.4 ± .8
Paraplegic 0.4 ± .4 2.4 ± 1.9 -1.2 ± 1.6 2.4 ± 1.8 2.6 ± 3.8 -3.9 ± 3.7Tetraplegic 2.3 ± .9 -0.7 ± 1.3 0.6 ± .9 -0.3 ± .9 1.5 ± 2.5 2.2 ± 1.7
Table 4.9: Low Frequency (0.04-0.15 Hz) Cross Correlation Between Arterial Pressure & Lower Body Skin Perfusion (Mean ± SEM)
LF Negative Magnitudes—Group effect (p<0.004) Control 20 o 40 o 60 o 80 o Recovery
AB -0.3 ± .04 -0.3 ± .03 -0.3 ± .04 -0.3 ± .04 -0.3 ± .04 -0.3 ± .04Paraplegic -0.2 ± .06 -0.2 ± .04 -0.1 ± .06 -0.3 ± .06 -0.2 ± .04 -0.2 ± .06
Tetraplegic♣ -0.1 ± .04 -0.2 ± .03 -0.2 ± .04 -0.1 ± .03 -0.2 ± .04 -0.1 ± .02LF Negative Lag Times (sec)—No Significant effects
AB 5.1 ± .2 4.8 ± .3 5.4 ± .6 5 ± .3 4.9 ± .6 5.7 ± .6Paraplegic 5.4 ± 1.5 5.6 ± 1.5 6.5 ± .9 6.3 ± 1 4.3 ± 1.4 4.9 ± 2Tetraplegic 4.6 ± 1.4 5.6 ± 1.4 4.4 ± 1 4.7 ± .9 5.9 ± 1.3 6.1 ± 1.8
LF Positive Magnitudes—No Significant effects AB 0.3 ± .04 0.3 ± .04 0.3 ± .03 0.4 ± .05 0.4 ± .05 0.4 ± .05
Paraplegic 0.4 ± .1 0.3 ± .1 0.3 ± .05 0.4 ± .1 0.2 ± .02 0.3 ± .1Tetraplegic 0.3 ± .1 0.2 ± .05 0.3 ± .04 0.2 ± .02 0.2 ± .1 0.2 ± .03
LF Positive Lag Times (sec—No Significant effects) AB -0.4 ± 1.1 1 ± 1.2 0.5 ± 1 -0.8 ± .3 -1.1 ± .3 1.3 ± 1.2
Paraplegic 1.6 ± 1.7 -3.4 ± 2.3 0.4 ± .6 0.1 ± .7 -3 ± 2.4 -0.2 ± 2.4Tetraplegic -0.6 ± 1.4 1.6 ± .8 2 ± 2.1 -1.3 ± .9 -1.8 ± 1 -1.6 ± 1.8

33
Table 4.10: Low Frequency (0.04-0.15 Hz) Cross Correlation Between Heart Rate & Lower
Body Skin Perfusion (Mean ± SEM) LF Negative Magnitudes—No Significant effects
Control 20 o 40 o 60 o 80 o Recovery AB -0.2 ± .02 -0.2 ± .03 -0.2 ± .04 -0.3 ± .05 -0.3 ± .03 -0.2 ± .04
Paraplegic -0.1 ± .03 -0.2 ± .05 -0.2 ± .05 -0.2 ± .03 -0.1 ± .04 -0.2 ± .06Tetraplegic -0.2 ± .04 -0.1 ± .03 -0.1 ± .03 -0.1 ± .02 -0.1 ± .03 -0.2 ± .03
LF Negative Lag Times (sec)—Group effect (p<0.001) AB -4.5 ± .5 -3.2 ± .4 -4 ± .8 -3.2 ± .6 -4.7 ± 1.1 -3 ± .7
Paraplegic∗ -6.2 ± 1.2 -2.4 ± .7 -4.2 ± 1.3 -2.8 ± .8 -4.3 ± 1.6 -2.6 ± 1Tetraplegic♣ -4.9 ± 1.1 -7.2 ± .9 -6 ± 1.5 -5.6 ± 1.3 -6.8 ± 1 -6.4 ± 1.4
LF Positive Magnitudes— Group effect (p<0.035) AB 0.4 ± .04 0.3 ± .03 0.3 ± .04 0.3 ± .04 0.3 ± .02 0.3 ± .04
Paraplegic∗ 0.3 ± .06 0.2 ± .1 0.2 ± .1 0.3 ± .06 0.1 ± .02 0.3 ± .04Tetraplegic 0.3 ± .1 0.2 ± .06 0.3 ± .04 0.2 ± .04 0.1 ± .02 0.2 ± .04
LF Positive Lag Times (sec)—No Significant effects AB 2 ± .2 1.7 ± 1.4 0.1 ± 1.2 1.8 ± .9 1.5 ± .8 1.9 ± 1
Paraplegic 2 ± .4 -1.1 ± 2.5 -1 ± 1.6 -0.9 ± 3 -0.3 ± 2.4 -0.4 ± 2Tetraplegic 2.7 ± 1.5 3.1 ± 1 0.9 ± 1 1.8 ± .6 -0.4 ± 1.6 -0.8 ± 1.6
Table 4.11: Low Frequency (0.04-0.15 Hz) Cross Correlation Between Upper (Forearm) & Lower (Shin) Body Skin Perfusion Group Results (Mean ± SEM)
LF Negative Magnitudes—Group effect (p<0.0001) Control 20 o 40 o 60 o 80 o Recovery
AB -0.3 ± .03 -0.2 ± .04 -0.3 ± .03 -0.3 ± .03 -0.3 ± .03 -0.3 ± .02Paraplegic♣ -0.2 ± .05 -0.2 ± .04 -0.2 ± .02 -0.1 ± .02 -0.1 ± .02 -0.2 ± .1Tetraplegic♣ -0.1 ± .02 -0.1 ± .03 -0.2 ± .04 -0.2 ± .02 -0.1 ± .02 -0.1 ± .03
LF Negative Lag Times (sec)—HUT effect (p<0.013) AB -5.5 ± .6 -5.2 ± .5 -5 ± .7♦ -5.2 ± .4 -5.1 ± .8 -4.1 ± .5
Paraplegic -6 ± 1.6 -4.1 ± 1.1 -4 ± .9♦ -7.4 ± .8 -5.7 ± 1.6 -4.4 ± 1.8Tetraplegic -6.9 ± 1.1 -5.9 ± 1.5 -3.8 ± 1♦ -5.8 ± .6 -7.5 ± 1.1 -4.7 ± 1.1
LF Positive Magnitudes—Group effect (p<0.0001) AB 0.4 ± .03 0.4 ± .05 0.4 ± .05 0.4 ± .06 0.3 ± .06 0.5 ± .04
Paraplegic♣ 0.3 ± .1 0.2 ± .05 0.2 ± .04 0.2 ± .04 0.2 ± .04 0.2 ± .04Tetraplegic♣ 0.2 ± .03 0.2 ± .06 0.2 ± .04 0.3 ± .01 0.2 ± .06 0.2 ± .03
LF Positive Lag Times (sec)—Group x HUT effect (p<0.042) AB 0.5 ± .4 -0.2 ± .9 1.2 ± .5 0.5 ± 1.2 -1.8 ± 1.6 2.1 ± .5
Paraplegic -0.7 ± 1.1 0.5 ± 1.4 1.7 ± .9∗ 1.1 ± 2.2 1.4 ± 1.1 2.1 ± 1.5∗Tetraplegic 0.2 ± 1.7 1.6 ± 1.5 -2.9 ± 1.8♣ 0.8 ± 1.3 -0.2 ± 2.9 -3.7 ± 2.5♣

34

35
Arterial Pressure
60
65
70
75
80
85
90
95
0 20 40 60 80 100
Tilt Angle
mm
Hg
Able-Bodied (n=11)Paraplegic (n=5)Tetraplegic (n=6)
control recovery
Figure 4.1a: Arterial pressure from five min of supine control, 20o, 40o, 60o
and 80o HUT and recovery in AB, Paraplegic and Tetraplegic groups
Art
eria
l pre
ssur
e
(m
mH
g)H
eart
rat
e (b
pm)
120
60
80
120
Figure 4.1b: Orthostatic hypotension in response to head-up-tilt, characterized by a gradual decline in arterial pressure (bottom trace) and declines in heart rate (top trace) during the last minute of tilt in one Tetraplegic.

36
0 1 2 3 4 560
70
80
90
100
0 0.1 0.2 0.4
150
300
Mea
n A
rter
ial P
ress
ure
(mm
Hg)
Time (min)
Frequency (Hz)0.1 0.2
mm
Hg2
/ Hz
150
300
Figure 4.2: Arterial pressure raw data and spectral power (top right insert) from five min supine control in one AB subject
0.4
Figure 4.2a: Mean (top left), VLF (top right), LF (bottom left) and HF (bottom right) arterial pressure in AB, Paraplegic and Tetraplegic groups
Mean Arterial Pressure
60
70
80
90
100
control 20 40 60 80 recovery
Tilt Angle
mm
Hg
AB (n=11)Paraplegic (n=5)Tetraplegic (n=6)
VLF (0.01-0.04 Hz) in Arterial Pressure
0100200300400
control 20 40 60 80 recovery
Tilt Angle
mm
Hg2 /H
z
HF (0.15-0.4 Hz) in Arterial Pressure
02468
101214
control 20 40 60 80 recovery
Tilt Angle
mm
Hg2 /H
z
LF (0.04-0.15 Hz) in Arterial Pressure
02040
6080
100
control 20 40 60 80 recovery
Tilt Angle
mm
Hg
2 /Hz

37
0 1 2 3 4 540
50
60
70
80
90
100
0 0 .1 0 . 2 0 . 4
1 0 0
2 0 0
Hea
rt R
ate
(bpm
)
Time (min)
Frequency (Hz)0.1 0.2
100
200
bpm
2/ H
z
Figure 4.3: Heart rate raw data and spectral power (top insert) from five min supine control in one AB subject
0.4
Figure 4.3a: Mean (top left), VLF (top right), LF (bottom left), and HF (bottom right) heart rate in AB, Paraplegic and Tetraplegic groups
VLF (0.01-0.04 Hz) in Heart Rate
0
50
100
150
200
250
300
control 20 40 60 80 recovery
Tilt Angle
bpm
2 /Hz
LF (0.04-0.15 Hz) in Heart Rate
0
20
40
60
80
100
control 20 40 60 80 recovery
Tilt Angle
bpm
2 /Hz
Mean Heart Rate
5060708090
100110
control 20 40 60 80 recovery
Tilt Angle
bpm
AB (n=11)Paraplegic (n=5)Tetraplegic (n=6)
HF (0.15-0.4 Hz) in Heart Rate
02468
10121416
control 20 40 60 80 recovery
Tilt Angle
bpm
2 /Hz

38
0 1 2 3 4 5
4
6
8
10
12
0 0 .1 0 .2 0 .40
6
1 2
PU2
/ Hz
Frequency (Hz)0.1 0.2
12
6
Upp
er B
ody
Skin
Per
fusi
on (P
U)
Time (min)
0.4
Figure 4.4: Upper body skin perfusion raw data and spectral power (top right insert) from five min supine control for one AB subject
Figure 4.4a: Mean (top left), VLF (top right), LF (bottom left), and HF (bottom right) upper body skin perfusion in AB, Paraplegic and Tetraplegic groups
Upper Body Skin Perfusion
0
5
10
15
20
25
control 20 40 60 80 recoveryTilt Angle
PU
AB (n=11)Paraplegic (n=5)Tetraplegic (n=6)
VLF (0.01-0.04 Hz) in Upper Body Skin Perfusion
0
40
80
120
160
control 20 40 60 80 recovery
Tilt Angle
PU2 /H
z
LF (0.04-0.15 Hz) in Upper Body Skin Perfusion
05
1015202530
control 20 40 60 80 recovery
Tilt Angle
PU2 /H
z
HF (0.15-0.4 Hz) in Upper Body Skin Perfusion
0
2
4
6
8
control 20 40 60 80 recovery
Tilt Angle
PU
2 /Hz

39
0 1 2 3 4 53
4
5
6
7
8
9
10
11
12
0 0 .1 0 . 2 0 .4
4
8
Low
er B
ody
Skin
Per
fusi
on (P
U)
Time (min)
PU2
/ Hz
Frequency (Hz)
4
8
0.1 0.2 0.4
Figure 4.5: Lower body skin perfusion raw data and spectral power (top right insert) from five min supine control in one AB subject
Figure 4.5a: Mean (top left), VLF (top right), LF (bottom left), and HF (bottom right) lower body skin perfusion in AB, Paraplegic and Tetraplegic groups
Lower Body Skin Perfusion
0
2
4
6
8
10
control 20 40 60 80 recovery
Tilt Angle
PU
AB (n=11)Paraplegic (n=5)Tetraplegic (n=6)
VLF (0.01-0.04 Hz) in Lower Body Skin Perfusion
0
4
812
16
20
control 20 40 60 80 recovery
Tilt Angle
PU2 /H
z
LF (0.04-0.15 Hz) in Lower Body Skin Perfusion
00.5
11.5
22.5
3
control 20 40 60 80 recovery
Tilt Angle
PU2 /H
z
HF (0.15-0.4 Hz) in Lower Body Skin Perfusion
0
0.2
0.4
0.6
control 20 40 60 80 recoveryTilt Angle
PU2 /H
z

40
-15 0 15-0.6
0
0.65
-5 0 5-0.6
0
0.65
Time (min)
High Pass (0.15-0.4 Hz) Filtered
Low Pass (0.04-0.15 Hz) Filtered
Lag Time (sec)
Lag Time (sec)
-0.6
0
0.65
0.65
0
-0.6
0-5
150
5
-15
Mag
nitu
deM
agni
tude
Figure 4.6 : Heart rate and arterial pressure raw data with mean subtracted from two min of control, shown for illustrative purposes (right) and the cross correlation of five min of heart rate and arterial pressure in one AB subject (left).
Hea
rt r
ate
(bpm
)H
eart
rat
e (b
pm)
Art
eria
l pre
ssur
e (m
mH
g)A
rter
ial p
ress
ure
(mm
Hg)
HR/AP: LF Negative Peaks
-0.6
-0.4
-0.2
0control 20 40 60 80 recovery
Tilt Angle
Corr
elat
ion
Mag
nitu
de
AB (n=11)Paraplegic (n=5)Tetraplegic (n=6)
HR/AP: LF Negative Lag Time
-2.2
-1.8
-1.4
-1control 20 40 60 80 recovery
Tilt Angle
Lag
Tim
e (s
ec)
HR/AP: LF Positive Peaks
0
0.2
0.4
0.6
control 20 40 60 80 recovery
Tilt Angle
Cor
rela
tion
Mag
nitu
de
HR/AP: LF Positive Lag Time
0
0.5
1
1.5
2
2.5
control 20 40 60 80 recovery
Tilt Angle
Lag
Tim
e (s
ec)
Figure 4.6a: Cross correlation of heart rate (HR) and arterial pressure (AP) LF negative peaks (top left) and lag times (top right) and LF positive peaks (bottom left) and lag times (bottom right) for AB, paraplegic and tetraplegic groups.

41
-5 0 5-0.4
0
0.4
-15 0 15-0.4
0
0.4
Lag Time (sec)
Lag Time (sec)
Mag
nitu
deM
agni
tude
Figure 4.7: Arterial pressure and upper body skin perfusion raw data with mean subtracted from two min of control, shown for illustrative purposes (right) and the cross correlation of five min of arterial pressure and upper body skin perfusion in one AB subject (left).
Skin
per
fusi
on (P
U)
-0.4
0
0.4
-15 0 15
0.4
0
-0.40 5-5
Low Pass (0.04-0.15 Hz) Filtered
Art
eria
l pre
ssur
e (m
mH
g)
High Pass (0.15-0.4 Hz) Filtered
Art
eria
l pre
ssur
e (m
mH
g)
Skin
per
fusi
on (P
U)
Time (min)Figure 4.7a: Cross correlation of arterial pressure (AP) and upper body skin perfusion (SP1) LF negative peaks (top left) and lag times (top right) and LF positive peaks (bottom left) and lag times (bottom right) for AB, paraplegic and tetraplegic groups.
AP/SP1: LF Negative Peaks
-0.5
-0.4
-0.3
-0.2
-0.1
0control 20 40 60 80 recovery
Tilt Angle
Cor
rela
tion
Mag
nitu
de
AB (n=11)Paraplegic (n=5)Tetraplegic (n=6)
AP/SP1: LF Negative Lag Time
0
2
4
6
8
10
control 20 40 60 80 recovery
Tilt Angle
Lag
Tim
e (s
ec)
AP/SP1: LF Positive Peaks
0
0.10.2
0.3
0.40.5
0.6
control 20 40 60 80 recovery
Tilt Angle
Cor
rela
tion
Mag
nitu
de
AP/SP1: LF Positive Lag Time
-4
-2
0
2
4
6
control 20 40 60 80 recovery
Tilt Angle
Lag
Tim
e (s
ec)

42
-5 0 5-0.4
0
0.4
Time (min)
High Pass (0.15-0.4 Hz) Filtered
Low Pass (0.04-0.15 Hz) Filtered
Lag Time (sec)
Lag Time (sec)
Mag
nitu
deM
agni
tude
Figure 4.8: Heart rate and upper body skin perfusion raw data with mean subtracted from two min of control, shown for illustrative purposes (right) and the cross correlation of five min of heart rate and upper body skin perfusion in one AB subject (left).
Hea
rt r
ate
(bpm
)
Skin
per
fusi
on (P
U)
Skin
per
fusi
on (P
U)
-20 0 20-0.4
0
0.4
200-20-0.4
0.4
0
0.4
0
-0.4-5 0 5
Hea
rt r
ate
(bpm
)
Figure 4.8a: Cross correlation of heart rate (HR) and upper body skin perfusion (SP1) LF negative peaks (top left) and lag times (top right) and LF positive peaks (bottom left) and lag times (bottom right) for AB, paraplegic and tetraplegic groups.
HR/SP1: LF Negative Peaks
-0.4
-0.3
-0.2
-0.1
0control 20 40 60 80 recovery
Tilt Angle
Cor
rela
tion
Mag
nitu
de
HR/SP1: LF Negative Lag Time
0
2
4
6
8
10
control 20 40 60 80 recovery
Tilt Angle
Lag
Tim
e (s
ec)
HR/SP1 LF Positive Peaks
0
0.10.2
0.30.4
0.50.6
control 20 40 60 80 recovery
Tilt Angle
Cor
rela
tion
Mag
nitu
de
HR/SP1: LF Positive Lag Time
-8
-4
0
4
8
control 20 40 60 80 recovery
Tilt Angle
Lag
Tim
e (s
ec)

43
Lag Time (sec)
Lag Time (sec)
Mag
nitu
deM
agni
tude
Figure 4.9: Arterial pressure and lower body skin perfusion raw data with mean subtracted (right) from two min of control and the cross correlation (left) of five min of arterial pressure and lower body skin perfusion in one AB subject.
Skin
per
fusi
on (P
U)
-15 0 15-0.4
0
0.4
-5 0 5-0.4
0
0.4
-0.4
0
0.4
-15 0 15
0.4
0
-0.40 5-5
Low Pass (0.04-0.15 Hz) Filtered
Art
eria
l pre
ssur
e (m
mH
g)
High Pass (0.15-0.4 Hz) Filtered
Art
eria
l pre
ssur
e (m
mH
g)
Skin
per
fusi
on (P
U)
Time (min)Figure 4.9a: Cross correlation of arterial pressure (AP) and lower body skin perfusion (SP2) LF negative peaks (top left) and lag times (top right) and LF positive peaks (bottom left) and lag times (bottom right) for AB, paraplegic and tetraplegic groups.
AP/SP2: LF Negative Peaks
-0.4
-0.3
-0.2
-0.1
0control 20 40 60 80 recovery
Tilt Angle
Cor
rela
tion
Mag
nitu
de
AB (n=11)Paraplegic (n=5)Tetraplegic (n=6)
AP/SP2: LF Negative Lag Time
0
2
4
6
8
control 20 40 60 80 recovery
Tilt Angle
Lag
Tim
e (s
ec)
AP/SP2: LF Positive Peaks
0
0.1
0.2
0.3
0.4
0.5
control 20 40 60 80 recovery
Tilt Angle
Cor
rela
tion
Mag
nitu
de
AP/SP2: LF Positive Lag Time
-8-6
-4-2
02
46
control 20 40 60 80 recovery
Tilt Angle
Lag
Tim
e (s
ec)

44
-5 0 5-0.3
0
0.4
Time (min)Lag Time (sec)
Lag Time (sec)
Mag
nitu
deM
agni
tude
Figure 4.10: Heart rate and lower body skin perfusion raw data with mean subtracted from two min of control, shown for illustrative purposes (right) and the cross correlation of five min of heart rate and lower body skin perfusion in one AB subject (left).
0.4
0
-0.30 5-5
Low Pass (0.04-0.15 Hz) Filtered
Skin
per
fusi
on (P
U)
Skin
per
fusi
on (P
U)
Hea
rt r
ate
(bpm
)
High Pass (0.15-0.4 Hz) Filtered
-15 0 15-0.3
0
0.4
0.4
0
-0.3-15 0 15
Hea
rt r
ate
(bpm
)
Figure 4.10a: Cross correlation of heart rate (HR) and lower body skin perfusion (SP2) LF negative peaks (top left) and lag times (top right) and LF positive peaks (bottom left) and lag times (bottom right) for AB, paraplegic and tetraplegic groups.
HR/SP2: LF Negative Peaks
-0.4
-0.3
-0.2
-0.1
0control 20 40 60 80 recovery
Tilt Angle
Cor
rela
tion
Mag
nitu
de
AB (n=11)Paraplegic (n=5)Tetraplegic (n=6)
HR/SP2: LF Negative Lag Time
-10
-8
-6
-4
-2
0control 20 40 60 80 recovery
Tilt Angle
Lag
Tim
e (s
ec)
HR/SP2: LF Positive Peaks
0
0.1
0.2
0.3
0.4
0.5
control 20 40 60 80 recovery
Tilt Angle
Cor
rela
tion
Mag
nitu
de
HR/SP2: LF Positive Lag Time
-6
-4
-2
0
2
4
6
control 20 40 60 80 recovery
Tilt Angle
Lag
Tim
e (s
ec)

45
-5 0 5-0.4
0
0.4
-15 0 15-0.4
0
0.4
Lag Time (sec)
Lag Time (sec)
Mag
nitu
deM
agni
tude
Figure 4.11: Upper and lower body skin perfusion raw data with mean subtracted from two min of control, shown for illustrative purposes (right) and the cross correlation of five min of upper and lower body skin perfusion in one AB subject (left).
Skin
per
fusi
on (P
U)
-0.4
0
0.4
-15 0 15
0.4
0
-0.40 5-5
Low Pass (0.04-0.15 Hz) Filtered
Skin
per
fusi
on (P
U)
High Pass (0.15-0.4 Hz) Filtered
Skin
per
fusi
on (P
U)
Skin
per
fusi
on (P
U)
Time (min)Figure 4.11a: Cross correlation of upper (SP1) and lower body skin perfusion (SP2) LF negative peaks (top left) and lag times (top right) and LF positive peaks (bottom left) and lag times (bottom right) for AB, paraplegic and tetraplegic groups.
SP1/SP2: LF Negative Peaks
-0.4
-0.3
-0.2
-0.1
0control 20 40 60 80 recovery
Tilt Angle
Cor
rela
tion
Mag
nitu
de
AB (n=11)Paraplegic (n=5)Tetraplegic (n=6)
SP1/SP2: LF Negative Lag Time
-10
-8
-6
-4
-2
0control 20 40 60 80 recovery
Tilt Angle
Lag
Tim
e (s
ec)
SP1/SP2: LF Positive Peaks
0
0.1
0.2
0.3
0.4
0.5
0.6
control 20 40 60 80 recovery
Tilt Angle
Cor
rela
tion
Mag
nitu
de
SP1/SP2: LF Positive Lag Time
-8-6-4-2
0246
control 20 40 60 80 recovery
Tilt Angle
Lag
Tim
e (s
ec)

46
Fig 4.12: Tilt-Induced Rate of Change in Plasma Volume
-0.5
1
% C
hang
e pe
r min
ute
(mea
n ±
sem
)
Able-Bodied (n=11)Paraplegic (n=5)Tetraplegic (n=6)
Able-Bodied PRA Response to Tilt
0
5
10
15
20
25
0 5 10 15 20 25 30 35 40 45 50
Elapsed Tim e(m in)
PRA
(ng/
mL/
hr)
Figure 4.13: Index of fluid volume regulation (plasma renin activity) for AB (top) and SCI (bottom) subjects [*.*-- truncated at 25 for resolution purposes]
S p in a l C o r d In j u r e d P R A R e s p o n s e t o T i l t
0
5
1 0
1 5
2 0
2 5
0 1 0 2 0 3 0 4 0 5 0 6 0
E l a p s e d T i m e ( m i n )
PRA
(ng/
mL/
hr)
*.*

47
Able-Bodied Epinephrine Response to T ilt
0
50
100
150
200
0 10 20 30 40 50 60
Elapsed time (minutes)
pg/d
L
Spinal Cord Injured Epinephrine Response to Tilt
0
50
100
150
200
0 10 20 30 40 50 60
Elapsed Time (Minutes)
pg/d
L
Figure 4.14: Epinephrine as an index of sympathetic activity for AB (top) and SCI (bottom) subjects
Able-Bodied Norepinephrine Response to Tilt
0
400
800
1200
1600
0 10 20 30 40 50 60
Elapsed Time (Minutes)
pg/d
L
Figure 4.15: Norepinephrine as an index of sympathetic activity for AB (top) and SCI (bottom) subjects
Spinal Cord Injured Norepinephrine Response to Tilt
0400800
12001600
0 10 20 30 40 50 60
Elapsed Time (Minutes)
pg/d
L

48
Chapter Five
Discussion
The foundation of the discussion section focuses on whether or not the present research
provides some useful information that helps to answer the central questions of our larger SCI
research program: “Have we enhanced our knowledge and improved our understanding of
cardiovascular function following SCI, mainly in the peripheral vasculature, so that
classifications of autonomic function can be made in rehabilitation protocols and drug therapies
to expedite post-SCI recovery? I have focused on a few variables that lend the most promise
towards achieving these goals.
Mean value analysis in the time domain of arterial blood pressure, heart rate, cardiac
output, stroke volume, total peripheral resistance, upper and lower body skin perfusion during
control and HUT did not provide any significant discriminators among AB, paraplegic and
tetraplegic groups. However, trends within and between groups were apparent in these variables,
especially in arterial blood pressure during HUT. Analysis of these variables in the frequency
domain via spectral power analysis was a step in the right direction as the differences among the
three groups were more apparent. First of all, patients with tetraplegia and paraplegia failed to
show increased SNS activity, based on arterial pressure and heart rate variability spectral
analysis, during head-up-tilt (HUT), in contrast to able-bodied subjects. For example, spectral
power of arterial blood pressure in the LF region was greatly reduced in paraplegic and
tetraplegic subjects during supine control, all levels of HUT and recovery (figure 4.2a, table 4.2,
Appendix E). Arterial pressure oscillations in the 0.1 Hz frequency region (also known as the LF
region) are indicative of sympathetic control. This paves the way for the application of relating
0.1 Hz oscillations in arterial pressure to sympathetic activity and autonomic function in AB
subjects and more importantly subjects who have sustained SCI. Results from spectral analysis
lead me to believe that these oscillations in arterial pressure are a good precursor to determine
level of SCI and degree of autonomic function (figure 5.1) [More paraplegic and tetraplegic
subjects will be required to further separate the three groups]. The increase in LF spectral power
of arterial pressure, with increasing levels of HUT, in AB subjects was expected due to
sympathetic mediated vasoconstriction to the peripheral vasculature. I also expected to see
paraplegic subjects maintain some sympathetic induced vasoconstriction (this was observed
during control, 20o and 40o low levels of HUT, but not the higher levels of HUT and recovery)

49
due to the nature of their injury. In tetraplegic subjects I observed little to no sympathetic
activity due to the lack of sympathetic innervation to the heart and peripheral vasculature (in
tetraplegic subjects, sympathetic activity, marked by 0.1 oscillations, started very low during
supine control and decreased with increasing levels of HUT). In studies by others in which SNS
was assessed by spectral analysis of blood pressure (Houtman 2000, Pagani 1986, de Boer 1987)
or heart rate variability (Houtman 2000, Malliani 1991, Bootsma 1994, Yamamoto 1991) SNS
activity assessed in this way during supine rest was reported to be lower in patients with
tetraplegia and paraplegia than in able-bodied (AB) subjects. The observations from the present
study are consistent with these arterial pressure and heart rate variability findings of others. In
the present study, SNS activity increased in AB subjects, but decreased in paraplegic and
tetraplegic subjects with increasing levels of HUT which is consistent with the work of other
researchers (Figoni 1984).
Secondly, spectral power of lower body skin perfusion analyzed in the LF region is an
additional way to discriminate among the three groups. I have found a reduction of 0.1 Hz skin
perfusion fluctuations during control and HUT below the level of injury (lower body) in
paraplegic and tetraplegic subjects when compared to AB subjects. Skin perfusion fluctuations
in the 0.1 Hz frequency region (also known as the LF region) are due to the activity of the
sympathetic nervous system (Bernardi 1997). Reduction of skin blood flow oscillations below
the level of injury are indicative of a loss of sympathetic control of the arteriolar tone and
peripheral vasculature. Paraplegic and tetraplegic subjects exhibit significant decreases (when
compared to AB) of skin perfusion oscillations in the LF region for supine control, all levels of
HUT and recovery. Thus an important question to ask is: Are these LF oscillations in lower
body skin perfusion a good way to separate AB, paraplegic and tetraplegic groups (in order to
classify autonomic function)? In fact, lower body skin blood flow appears to be at least as good
of an approach as arterial pressure to investigate level of sympathetic activity, autonomic
function and level of SCI (figure 5.2). However, caution must be exercised because of the limited
number of paraplegic and tetraplegic subjects studied. Nonetheless, I expected AB subjects to
have higher LF spectral power in skin blood flow in the lower body than the paraplegic and
tetraplegic subjects during supine control, all levels of HUT and recovery. All three groups
exhibit decreased spectral power of lower body skin blood flow with increasing levels of HUT.
A few possible reasons could exist for this phenomenon: lower body skin perfusion must

50
decrease to maintain consciousness and venous pooling could lower the pressure gradient thus
decreasing blood flow and it’s accompanying 0.1 Hz oscillations in the lower body. Muscle
metabolic needs in SCI subjects have decreased in the lower body, thus creating an environment
that doesn’t require a great deal of nutrient, oxygen, and blood flow supply, however these
decreased muscle demands do not have an effect the skin. Decreased oscillations in the lower
body of SCI individuals could be attributed to the cut in the sympathetic chain, the chain that
innervates skin arterioles causing them to vasoconstrict. AB subjects, however, still need a large
amount of skin blood flow because the tissue requires a nutrient and oxygen supply. Another
topic worthy of discussion is the mechanical nature of the vasculature. Vessel walls have
parameters equivalent to an electrical RLC circuit (consists of resistance, inductance and
capacitance). These parameters can change at any time due to local, neural and hormonal
influences and can have a direct effect on arteriolar tone, thus affecting capillary skin blood flow
and skin perfusion at the forearm and shin. Different parts of the skin have different
capacitances, resistances and inductances.
Cross correlation analysis in the low frequency region of heart rate/upper body skin
perfusion, arterial pressure/upper body skin perfusion, arterial pressure/lower body skin
perfusion and upper/lower body skin perfusion provided additional discriminates among the
three groups, while showing the coordination or lack of coordination between cardiac and
peripheral vascular function. The negative cross correlation peak of heart rate and upper body
skin perfusion during control is a significant (p<0.05) discriminator between the three groups:
AB (-0.35) > paraplegic (-0.25) > tetraplegic (-0.18). The negative cross correlation peak of
arterial pressure and upper body skin perfusion during control is a significant (p<0.05)
discriminator between the three groups: AB (-0.4) > paraplegic (-0.32) > tetraplegic (-0.2). The
negative cross correlation peak of arterial pressure and lower body skin perfusion during control
is significant (p<0.05) discriminator between the three groups: AB (-0.35) > paraplegic (-0.25) >
tetraplegic (-0.15). The negative and positive cross correlation peaks of upper and lower body
skin perfusion during control are significant (p<0.05) discriminators between the three groups.
All of the above cross correlation negative peaks are indicative of negative feedback and in
paraplegic and tetraplegic subjects there is diminished control (compared to AB) of blood vessels
in the upper (tetraplegic) and lower (paraplegic and tetraplegic) body. The above cross
correlation results demonstrate a lack of central or neural control in paraplegic and tetrapleigc

51
subjects. It is possible that heart rate and arterial blood pressure changes can occur without those
same changes taking place in skin blood flow (i.e. the predominantly centrally controlled system
in AB oscillates together, whereas the predominantly locally controlled system in paraplegic and
tetraplegic doesn’t oscillate together).
Possible mechanical and neural regulatory control mechanisms have been covered, but
what is the effect of catecholamines and hormones on heart rate, arterial pressure and skin blood
flow? Indexes of sympathetic activity, epinephrine and norepinephrine, have increased
circulating levels in SCI subjects, compared to AB, during supine control. This could be
attributed to a possible end organ spillover or many receptor sites are saturated or less sensitive
to the circulating hormones. Erratic behavior of epinephrine and norepinephrine with increasing
levels of HUT is indicative of a receptor site issue because there is a large concentration level but
no response (i.e. no vasoconstriction). Epinephrine levels could also increase due to inhibition
of release at the adrenal medulla, whereas norepinephrine levels could increase due to organ
spillover Other researchers, Rowell et al, believe that plasma norepinehrine and epinephrine
levels do not increase during HUT unless sympathetic nerves are activated by local spinal
sympathetic reflexes caused by skeletal muscle spasms or urinary bladder contractions (Rowell
1993). Our data support the Rowell hypothesis in that our SCI subjects do not exhibit increased
levels of epinephrine during orthostatic stress. In addition, SCI subjects demonstrated
significantly elevated concentrations of epinephrine during control and HUT when compared to
AB subjects. Norepinephrine levels in SCI subjects were higher during control, when compared
to AB, however SCI subjects did exhibit a tendency to control release of norepinephrine in
response to HUT.
Other potential invasive measures of level of injury could lie in hormonal analysis,
however these measures would not be as direct of a technique as the ones stated above. As
observed by other researchers, supine tetraplegics have low tonic sympathetic activity, however
PRA tends to be above normal (Rowell 1993). PRA is an attempt to regulate fluid volume and
increased circulating levels indicate that fluid has been lost or shifted out of the vasculature and
the body goes into “conserve” mode. With increasing levels of HUT, paraplegic and tetraplegic
subjects filter more plasma volume out of the vasculature (than do AB subjects) indicating
“leaky pipes”. Compensation for these leaky pipes is an increase in the release of PRA as the
body makes an attempt to retain as much fluid as possible. The large variability in all hormonal

52
analysis in SCI subjects indicate that more subjects will be required in the paraplegic and
tetraplegic groups in order to achieve statistical significance with these variables.
To summarize, low frequency spectral analysis of arterial pressure and lower body skin
perfusion are equally important discriminators between the three groups, followed by cross
correlation analysis of arterial pressure/upper and lower body skin perfusion, upper/lower body
skin perfusion and heart rate/upper body skin perfusion. Hormonal analysis of epinephrine,
norepinephrine, measures of fluid volume shifts (hematocrit and total proteins) and measures of
fluid volume regulation (PRA) are invasive methods that discriminate among the three groups.
Limitations of Study: Medications that subjects were taking (Appendix G), motion
artifacts and the thermal environment in which the study was conducted are additional topics
worthy of discussion because they could affect data collection. Many subjects were taking
medications to treat hypotension, bradycardia, hypertension, tachycardia and muscle spasms.
These medications are necessary for the health of the subject and could possibly have an affect
on data collection. Skin perfusion acquired via the Perimed is susceptible to motion artifacts
caused by movement of the fiber optic probe, displacement of probe from the skin and
movement of the subject. These anomalies were removed to the best of abilities, but there is
some chance that a motion artifact could have gone unnoticed. Skin is also known to have a
thermal regulatory component that acts in the very low frequency region in the range of 0.01-
0.03 Hz. Because of this thermal component, our protocol, at times, is vulnerable. For the most
part, the environment in which the study is conducted is thermally neutral and this does not have
a great effect on data collection, however it is worthy of mention.
The microcirculatory network of the skin, like other body tissues, continuously exhibits
rhythmic changes in diameter and flow (Bernardi 1997). The fundamental mechanism of these
fluctuations is not yet clarified, particularly for the skin microvessels. Some researchers
hypothesized that skin blood flow is exclusively under local control, whereas others have
suggested both general and baroreflex induced changes. Skin blood flow decrease induced by
HUT is a good index of arterioloar tone, which is regulated by sympathetic nerve traffic
(Bernardi 1989). However, other mechanisms mediate changes in skin blood flow, such as local
autoregulatory mechanisms, local temperature, the status of arteriovenular shunts and venous
reflexes (Bernari 1989). There is evidence of both, local (Rowell 1993) and central (Rowell
1993) control of skin blood flow. Although, there is evidence of neural and local control of skin

53
blood flow, the present study has proven that a lack of sympathetic innervation to skin arterioles
is a factor in the decreased amount of 0.1 Hz oscillations which lends a good way to separate
AB, paraplegic and tetraplegic subjects.

54
Level of Injury Determinants: LF Arterial Blood Pressure
0
20
40
60
80
0 5 10 15 20 25 30
Level of Injury
Control LF AP80 degree LF AP
AB L2 T9 T4 C7 C2S2
Figure 5.1: Assessing level of injury and degree of autonomic function using low frequency spectral analysis of arterial blood pressure as a determinant during supine control and 80o HUT.
Level of Injury Determinants: LF Lower Body Skin Perfusion
0
0.5
1
1.5
2
0 5 10 15 20 25 30
Level of Injury
Control LF SP280 degree LF SP2
AB L2 T9 T4 C7 C2S2
Figure 5.2: Assessing level of injury and degree of autonomic function using low frequency spectral analysis of lower body skin perfusion as a determinant during supine control and 80o HUT.

55
Chapter Six
Conclusion
The present study primarily utilized noninvasively acquired, easily accessible variables
that may have promise as indicators of autonomic activity for assessing the level of autonomic
injury and recovery of visceral control following SCI. Peripheral vascular function was analyzed
using power spectral density estimates of upper and lower body skin blood flow. Low frequency
(0.1 Hz) oscillations in lower body skin blood flow proved to be a good discriminator between
the three groups as our findings indicate a high occurrence of sympathetic impairment of skin
vascular control in paraplegic and tetraplegic subjects. Arterial blood pressure analyzed in the
low frequency range also proved to be a good discriminator between the three groups, since our
results show decreased 0.1 Hz oscillations in arterial pressure in paraplegic and tetraplegic
subjects. These two variables are very good potential candidates to use in a clinical setting in
order to assess level of autonomic function in persons with spinal cord injury. Unfortunately,
more subjects will be required to produce sufficient significance, however I have provided
substantial evidence that low frequency spectral analysis of arterial blood pressure and lower
body skin perfusion are promising indicators of autonomic function and level of spinal cord
injury.
Additional potential invasive measures of vascular function, with the possibility to
determine the level of SCI, lie within hormonal analysis. Paraplegic and tetraplegic subjects
filtered more fluid volume out of the vasculature than did AB subjects during HUT (shown by
increases in hematocrit and total proteins with HUT). Paraplegic and tetraplegic subjects had
increased circulating PRA levels compared to AB during control and HUT.

56
Appendix A: ASIA scale used to assess motor and sensory function

57
Appendix C: Additional Instrumentation Background
Portapres and Penaz Principle
The portrapres uses the volume-clamp method, originally described by the Czech
physiologist Jan Penaz, to measure blood pressure in the finger. In this method the diameter of
an artery under a cuff wrapped around the finger is kept constant (clamped), in spite of the
changes in arterial pressure during each heartbeat. Changes in arterial diameter are detected by
means of an infrared photo-plethysmograph and opposed by a fast pressure servo controller that
changes pressure in an inflatable air bladder, both of which are built into the finger cuff. The
system is used to define and maintain the correct diameter at which the finger artery is clamped.
The main components of the finger cuff (figure C1) are an inflatable air bladder and a
plethysmograph consisting of a light source and a light detector. The light source is a light
emitting diode (LED) emitting infrared light and the light detector in the finger cuff is an infrared
photodiode. The air bladder is connected to the Portapres frontend unit via an air hose and both
components of the infrared plethysmograph via a cuff cable (figure C2). A blood pressure
waveform is created from a signal coming from a finger infrared plethysmograph when the
pressure in the finger cuff is kept constant. A sudden rise in finger intra-arterial pressure during
systole causes an increase in arterial diameter, which is detected as an increase in light
absorption and thus as a decrease in the signal detected by the plethysmograph. During the
diastolic phase of a heartbeat, when blood pressure declines gradually, the blood is expelled from
the artery and consequently the amount of light detected by the photodiode will increase again
(Portapres Model-2 User’s Guide).
The relationship between changes in arterial diameter and changes in intra-arterial pressure
depends on the mechanical properties of the artery. When the artery is very compliant (low
rigidity) diameter changes are relatively large, whereas diameter changes in stiff arteries are
small. It is a well-known fact that arterial compliance depends on the transmural pressure, the
pressure difference between the pressure inside the artery and the pressure of the surrounding
tissue. At high transmural pressures, when cuff pressure is low, the arterial diameter is relatively
large. Therefore, the artery is distended and becomes stiff causing small diameter changes.
When transmural pressure is low, when cuff pressure is high with respect to mean blood
pressure, the artery is almost collapsed and diameter changes will be small. At zero transmural

58
pressure, when the pressure inside the artery equals the pressure in the finger cuff, diameter
changes are largest Portapres Model-2 User’s Guide).
To compensate for the hydrostatic head caused by the distance from the instrumented
finger to the heart, the built-in Portapres height-correction adjustment feature was used. Keeping
the transducer ending and reference ending of the height correction unit at the same level and
pressing the “height” key performed the height nulling procedure. After doing this the reference
ending was placed at heart level and the transducer ending was placed on the finger cuff.
Thoracic Electrical Bioimpedance Cardiac Output
TEBCO uses four pairs of TEB electrodes and leads (two black and white pairs for the
neck and two red and green pairs for the thorax). Before placing any TEB leads, the skin area is
to be prepared with alcohol to remove skin oils and to assure good adhesion and proper electrical
performance of the electrodes. In TEB, a patient’s thorax is utilized as the impedance transducer
and the eight electrodes (four electrode pairs with 5 cm, 2”, nipple-to-nipple distance) used with
EXT-TEBCO’s application, provide the electrical connections to the transducer.
The sensing electrodes (white and red pair) should always be placed on the patient first.
The white electrode pair, located at the intersection of frontal plane and the line of the root of the
neck (the plane of the root of the neck is sloping down, toward the sternum) on each side of the
neck (figure C3). The red electrode pair, located at each midaxillary line at the xiphoid process
level (figure C3). The black and green electrodes are positioned above and below each
corresponding sensing electrode. These electrodes are the source and sink of the TEB
measurement current and must meet TEB requirements for the skin-to-electrode impedance. The
spacing between each sensing and measurement current electrode is critical and must be
maintained at 5 cm, 2”, nipple-to-nipple.
In TEB, the thorax is utilized as an impedance transducer. A high frequency
measurement current of a constant magnitude is introduced between the black and green pairs of
electrodes and flows through the thorax approximately in a direction parallel with the spine. A
HF voltage, which develops across the impedance of the thorax, is differentially sensed between
the white and red electrode pairs. This voltage is directly proportional to the impedance of the
thorax (EXT-TEBCO Operator’s Manual).

59
Perimed and Laser Doppler Flowmetry
Quantitative measurement of skin blood flow continues to be a problem. Presently, there
is no way to determine total skin blood flow. Measurements of flow, regardless of the organ, are
indirect (except timed collection of volume in a calibrated container: beaker and stopwatch),
being derived from variables that are related to flow. Some measurements provide estimates of
absolute flow, whereas others can only provide information about relative changes in flow.
However, none give quantitative measurements of skin blood flow in absolute units. Changes in
regional skin blood flow have been assessed from changes in skin temperature, thermal
conductivity, rates of heat loss by calorimetry, absorption of light by red cells and
transilluminated skin, light-scattering techniques, and rates of isotope clearance. Laser-Doppler
flowmetry has become especially useful because it provides reasonable estimates of flow
changes in any cutaneous region (Johnson 1984).
Laser Doppler technique is a simple method for monitoring microvascular perfusion. A
narrow beam of laser-generated monochromatic light is applied to the surface of the tissue being
studied via a fiber optic probe. Back-scattered light (caused by moving blood cells which
undergo a slight change in wavelength [Doppler shift]) is picked up by sensitive photodetectors
via a separate fiber in the probe (Figure C4). The magnitude & frequency distribution of the
shifted light is related to the number & velocity of moving cells, no matter what their direction of
movement (Perimed PF2 Operator’s Manual):
Skin perfusion (PU) = Concentration of moving cells (CU) * Velocity of moving cells
(VU)
Skin perfusion is defined by the above equation in arbitrary perfusion units, which is the product
of the concentration of moving cells in arbitrary concentration units and the velocity of those
moving cells in arbitrary velocity units.

60
Appendix D: Matlab Functions (MATLAB 6.5 Help Menu)
FIR1 filter design using the window method. B = FIR1(N,Wn) designs an N'th order lowpass FIR digital filter and returns the filter coefficients in length N+1 vector B. The cut-off frequency Wn must be between 0 < Wn < 1.0, with 1.0 corresponding to half the sample rate (MATLAB 6.5 Help Menu) -Applied fir1 as: b=fir1(100,[(2*0.5)/5]); Initializing a 100th order LPF and setting the LPF coefficient to 0.5Hz FILTFILT Zero-phase forward and reverse digital filtering. Y = FILTFILT(B, A, X) filters the data in vector X with the filter described by vectors A and B to create the filtered data Y. The filter is described by the difference equation: y(n) = b(1)*x(n) + b(2)*x(n-1) + ... + b(nb+1)*x(n-nb) - a(2)*y(n-1) - ... - a(na+1)*y(n-na) After filtering in the forward direction, the filtered sequence is then reversed and run back through the filter; Y is the time reverse of the output of the second filtering operation. The result has precisely zero phase distortion and magnitude modified by the square of the filter's magnitude response. Care is taken to minimize startup and ending transients by matching initial conditions (MATLAB 6.5 Help Menu). Applied filtfilt as: y = filtfilt(b,1,signal); Low Pass Filtering the data using a LPF cutoff coefficient of 0.5

61
0 0.2 0.40
10
20
30
40
50
0 0.2 0.40
10
20
30
40
50
0 0.2 0.40
10
20
30
40
50
0 0.2 0.40
10
20
30
40
50
0 0.2 0.40
10
20
30
40
50
0 0.2 0.40
10
20
30
40
50
0 0.2 0.40
10
20
30
40
50
0 0.2 0.40
10
20
30
40
50
0 0.2 0.40
10
20
30
40
50
0 0.2 0.40
10
20
30
40
50
0 0.2 0.40
10
20
30
40
50
0 0.2 0.40
10
20
30
40
50
0 0.2 0.40
10
20
30
40
50
0 0.2 0.40
10
20
30
40
50
0 0.2 0.40
10
20
30
40
50
0 0.2 0.40
10
20
30
40
50
0 0.2 0.40
10
20
30
40
50
0 0.2 0.40
10
20
30
40
50
AB (n=11)
Appendix E: Heart rate averaged spectral power for AB, Paraplegic & Tetraplegic
Paraplegic (n=5)
Tetraplegic(n=6)
Frequency (Hz)
Control 20 degree 40 degree 60 degree 80 degree Recovery
0 0.2 0.40
10
20
30
40
50
0 0.2 0.40
10
20
30
40
50
0 0.2 0.40
10
20
30
40
50
0 0.2 0.40
10
20
30
40
50
0 0.2 0.40
10
20
30
40
50
0 0.2 0.40
10
20
30
40
50
0 0.2 0.40
10
20
30
40
50
0 0.2 0.40
10
20
30
40
50
0 0.2 0.40
10
20
30
40
50
0 0.2 0.40
10
20
30
40
50
0 0.2 0.40
10
20
30
40
50
0 0.2 0.40
10
20
30
40
50
0 0.2 0.40
10
20
30
40
50
0 0.2 0.40
10
20
30
40
50
0 0.2 0.40
10
20
30
40
50
0 0.2 0.40
10
20
30
40
50
0 0.2 0.40
10
20
30
40
50
0 0.2 0.40
10
20
30
40
50
AB (n=11)
Appendix E: Arterial blood pressure averaged spectral power for AB, Paraplegic & Tetraplegic
Paraplegic (n=5)
Tetraplegic(n=6)
Frequency (Hz)
Control 20 degree 40 degree 60 degree 80 degree Recovery

62
0 0.2 0.40
10
20
30
40
50
0 0.2 0.40
10
20
30
40
50
0 0.2 0.40
10
20
30
40
50
0 0.2 0.40
10
20
30
40
50
0 0.2 0.40
10
20
30
40
50
0 0.2 0.40
10
20
30
40
50
0 0.2 0.40
10
20
30
40
50
0 0.2 0.40
10
20
30
40
50
0 0.2 0.40
10
20
30
40
50
0 0.2 0.40
10
20
30
40
50
0 0.2 0.40
10
20
30
40
50
0 0.2 0.40
10
20
30
40
50
0 0.2 0.40
10
20
30
40
50
0 0.2 0.40
10
20
30
40
50
0 0.2 0.40
10
20
30
40
50
0 0.2 0.40
10
20
30
40
50
0 0.2 0.40
10
20
30
40
50
0 0.2 0.40
10
20
30
40
50
AB (n=11)
Appendix E: Upper body skin perfusion averaged spectral power for AB, Paraplegic & Tetraplegic
Paraplegic (n=5)
Tetraplegic(n=6)
Frequency (Hz)
Control 20 degree 40 degree 60 degree 80 degree Recovery
0 0.2 0.40
10
20
30
40
50
0 0.2 0.40
10
20
30
40
50
0 0.2 0.40
10
20
30
40
50
0 0.2 0.40
10
20
30
40
50
0 0.2 0.40
10
20
30
40
50
0 0.2 0.40
10
20
30
40
50
0 0.2 0.40
10
20
30
40
50
0 0.2 0.40
10
20
30
40
50
0 0.2 0.40
10
20
30
40
50
0 0.2 0.40
10
20
30
40
50
0 0.2 0.40
10
20
30
40
50
0 0.2 0.40
10
20
30
40
50
0 0.2 0.40
10
20
30
40
50
0 0.2 0.40
10
20
30
40
50
0 0.2 0.40
10
20
30
40
50
0 0.2 0.40
10
20
30
40
50
0 0.2 0.40
10
20
30
40
50
0 0.2 0.40
10
20
30
40
50
AB (n=11)
Appendix E: Lower body skin perfusion averaged spectral power for AB, Paraplegic & Tetraplegic
Paraplegic (n=5)
Frequency (Hz)
Control 20 degree 40 degree 60 degree 80 degree Recovery
Tetraplegic (n=6)

63
-10 0 10-0.5
0
0.5
-10 0 10-0.5
0
0.5
-10 0 10-0.5
0
0.5
-10 0 10-0.5
0
0.5
-10 0 10-0.5
0
0.5
-10 0 10-0.5
0
0.5
-10 0 10-0.5
0
0.5
-10 0 10-0.5
0
0.5
-10 0 10-0.5
0
0.5
-10 0 10-0.5
0
0.5
-10 0 10-0.5
0
0.5
-10 0 10-0.5
0
0.5
-10 0 10-0.5
0
0.5
-10 0 10-0.5
0
0.5
-10 0 10-0.5
0
0.5
-10 0 10-0.5
0
0.5
-10 0 10-0.5
0
0.5
-10 0 10-0.5
0
0.5
AB (n=11)
Appendix F: Heart rate & arterial pressure: averaged cross correlation in LF for AB, Paraplegic & Tetraplegic
Paraplegic (n=5)
Lag time (sec)
Control 20 degree 40 degree 60 degree 80 degree Recovery
Tetraplegic (n=6)
-5 0 5
-0.4
-0.2
0
0.2
0.4
0.6
-5 0 5
-0.4
-0.2
0
0.2
0.4
0.6
-5 0 5
-0.4
-0.2
0
0.2
0.4
0.6
-5 0 5
-0.4
-0.2
0
0.2
0.4
0.6
-5 0 5
-0.4
-0.2
0
0.2
0.4
0.6
-5 0 5
-0.4
-0.2
0
0.2
0.4
0.6
-5 0 5
-0.4
-0.2
0
0.2
0.4
0.6
-5 0 5
-0.4
-0.2
0
0.2
0.4
0.6
-5 0 5
-0.4
-0.2
0
0.2
0.4
0.6
-5 0 5
-0.4
-0.2
0
0.2
0.4
0.6
-5 0 5
-0.4
-0.2
0
0.2
0.4
0.6
-5 0 5
-0.4
-0.2
0
0.2
0.4
0.6
-5 0 5
-0.4
-0.2
0
0.2
0.4
0.6
-5 0 5
-0.4
-0.2
0
0.2
0.4
0.6
-5 0 5
-0.4
-0.2
0
0.2
0.4
0.6
-5 0 5
-0.4
-0.2
0
0.2
0.4
0.6
-5 0 5
-0.4
-0.2
0
0.2
0.4
0.6
-5 0 5
-0.4
-0.2
0
0.2
0.4
0.6
Appendix F: Heart rate & arterial pressure: averaged cross correlation in HF for AB, Paraplegic & Tetraplegic Control 20 degree 40 degree 60 degree 80 degree Recovery
Lag time (sec)
AB (n=11)
Paraplegic (n=5)
Tetraplegic(n=6)

64
-10 0 10-0.5
0
0.5
-10 0 10-0.5
0
0.5
-10 0 10-0.5
0
0.5
-10 0 10-0.5
0
0.5
-10 0 10-0.5
0
0.5
-10 0 10-0.5
0
0.5
-10 0 10-0.5
0
0.5
-10 0 10-0.5
0
0.5
-10 0 10-0.5
0
0.5
-10 0 10-0.5
0
0.5
-10 0 10-0.5
0
0.5
-10 0 10-0.5
0
0.5
-10 0 10-0.5
0
0.5
-10 0 10-0.5
0
0.5
-10 0 10-0.5
0
0.5
-10 0 10-0.5
0
0.5
-10 0 10-0.5
0
0.5
-10 0 10-0.5
0
0.5
AB (n=11)
Appendix F: Arterial pressure & upper body skin perfusion: averaged cross correlation in LF for AB, Paraplegic & Tetraplegic
Paraplegic (n=5)
Lag time (sec)
Control 20 degree 40 degree 60 degree 80 degree Recovery
Tetraplegic (n=6)
-5 0 5-0.5
0
0.5
-5 0 5-0.5
0
0.5
-5 0 5-0.5
0
0.5
-5 0 5-0.5
0
0.5
-5 0 5-0.5
0
0.5
-5 0 5-0.5
0
0.5
-5 0 5-0.5
0
0.5
-5 0 5-0.5
0
0.5
-5 0 5-0.5
0
0.5
-5 0 5-0.5
0
0.5
-5 0 5-0.5
0
0.5
-5 0 5-0.5
0
0.5
-5 0 5-0.5
0
0.5
-5 0 5-0.5
0
0.5
-5 0 5-0.5
0
0.5
-5 0 5-0.5
0
0.5
-5 0 5-0.5
0
0.5
-5 0 5-0.5
0
0.5
Appendix F: Arterial pressure & upper body skin perfusion: averaged cross correlation in HF for AB, Paraplegic & Tetraplegic Control 20 degree 40 degree 60 degree 80 degree Recovery
Lag time (sec)
AB (n=11)
Paraplegic (n=5)
Tetraplegic(n=6)

65
-10 0 10-0.5
0
0.5
-10 0 10-0.5
0
0.5
-10 0 10-0.5
0
0.5
-10 0 10-0.5
0
0.5
-10 0 10-0.5
0
0.5
-10 0 10-0.5
0
0.5
-10 0 10-0.5
0
0.5
-10 0 10-0.5
0
0.5
-10 0 10-0.5
0
0.5
-10 0 10-0.5
0
0.5
-10 0 10-0.5
0
0.5
-10 0 10-0.5
0
0.5
-10 0 10-0.5
0
0.5
-10 0 10-0.5
0
0.5
-10 0 10-0.5
0
0.5
-10 0 10-0.5
0
0.5
-10 0 10-0.5
0
0.5
-10 0 10-0.5
0
0.5
AB (n=11)
Appendix F: Heart rate & upper body skin perfusion: averaged cross correlation in LF for AB, Paraplegic & Tetraplegic
Paraplegic (n=5)
Lag time (sec)
Control 20 degree 40 degree 60 degree 80 degree Recovery
Tetraplegic (n=6)
-5 0 5-0.5
0
0.5
-5 0 5-0.5
0
0.5
-5 0 5-0.5
0
0.5
-5 0 5-0.5
0
0.5
-5 0 5-0.5
0
0.5
-5 0 5-0.5
0
0.5
-5 0 5-0.5
0
0.5
-5 0 5-0.5
0
0.5
-5 0 5-0.5
0
0.5
-5 0 5-0.5
0
0.5
-5 0 5-0.5
0
0.5
-5 0 5-0.5
0
0.5
-5 0 5-0.5
0
0.5
-5 0 5-0.5
0
0.5
-5 0 5-0.5
0
0.5
-5 0 5-0.5
0
0.5
-5 0 5-0.5
0
0.5
-5 0 5-0.5
0
0.5
Appendix F: Heart rate & upper body skin perfusion: averaged cross correlation in HF for AB, Paraplegic & Tetraplegic Control 20 degree 40 degree 60 degree 80 degree Recovery
Lag time (sec)
AB (n=11)
Paraplegic (n=5)
Tetraplegic(n=6)

66
-10 0 10-0.5
0
0.5
-10 0 10-0.5
0
0.5
-10 0 10-0.5
0
0.5
-10 0 10-0.5
0
0.5
-10 0 10-0.5
0
0.5
-10 0 10-0.5
0
0.5
-10 0 10-0.5
0
0.5
-10 0 10-0.5
0
0.5
-10 0 10-0.5
0
0.5
-10 0 10-0.5
0
0.5
-10 0 10-0.5
0
0.5
-10 0 10-0.5
0
0.5
-10 0 10-0.5
0
0.5
-10 0 10-0.5
0
0.5
-10 0 10-0.5
0
0.5
-10 0 10-0.5
0
0.5
-10 0 10-0.5
0
0.5
-10 0 10-0.5
0
0.5
AB (n=11)
Appendix F: Arterial pressure & lower body skin perfusion: averaged cross correlation in LF for AB, Paraplegic & Tetraplegic
Paraplegic (n=5)
Lag time (sec)
Control 20 degree 40 degree 60 degree 80 degree Recovery
Tetraplegic (n=6)
-5 0 5-0.5
0
0.5
-5 0 5-0.5
0
0.5
-5 0 5-0.5
0
0.5
-5 0 5-0.5
0
0.5
-5 0 5-0.5
0
0.5
-5 0 5-0.5
0
0.5
-5 0 5-0.5
0
0.5
-5 0 5-0.5
0
0.5
-5 0 5-0.5
0
0.5
-5 0 5-0.5
0
0.5
-5 0 5-0.5
0
0.5
-5 0 5-0.5
0
0.5
-5 0 5-0.5
0
0.5
-5 0 5-0.5
0
0.5
-5 0 5-0.5
0
0.5
-5 0 5-0.5
0
0.5
-5 0 5-0.5
0
0.5
-5 0 5-0.5
0
0.5
Appendix F: Arterial pressure & lower body skin perfusion: averaged cross correlation in HF for AB, Paraplegic & Tetraplegic Control 20 degree 40 degree 60 degree 80 degree Recovery
Lag time (sec)
AB (n=11)
Paraplegic (n=5)
Tetraplegic(n=6)

67
-10 0 10-0.5
0
0.5
-10 0 10-0.5
0
0.5
-10 0 10-0.5
0
0.5
-10 0 10-0.5
0
0.5
-10 0 10-0.5
0
0.5
-10 0 10-0.5
0
0.5
-10 0 10-0.5
0
0.5
-10 0 10-0.5
0
0.5
-10 0 10-0.5
0
0.5
-10 0 10-0.5
0
0.5
-10 0 10-0.5
0
0.5
-10 0 10-0.5
0
0.5
-10 0 10-0.5
0
0.5
-10 0 10-0.5
0
0.5
-10 0 10-0.5
0
0.5
-10 0 10-0.5
0
0.5
-10 0 10-0.5
0
0.5
-10 0 10-0.5
0
0.5
AB (n=11)
Appendix F: Heart rate & lower body skin perfusion: averaged cross correlation in LF for AB, Paraplegic & Tetraplegic
Paraplegic (n=5)
Lag time (sec)
Control 20 degree 40 degree 60 degree 80 degree Recovery
Tetraplegic (n=6)
-5 0 5-0.5
0
0.5
-5 0 5-0.5
0
0.5
-5 0 5-0.5
0
0.5
-5 0 5-0.5
0
0.5
-5 0 5-0.5
0
0.5
-5 0 5-0.5
0
0.5
-5 0 5-0.5
0
0.5
-5 0 5-0.5
0
0.5
-5 0 5-0.5
0
0.5
-5 0 5-0.5
0
0.5
-5 0 5-0.5
0
0.5
-5 0 5-0.5
0
0.5
-5 0 5-0.5
0
0.5
-5 0 5-0.5
0
0.5
-5 0 5-0.5
0
0.5
-5 0 5-0.5
0
0.5
-5 0 5-0.5
0
0.5
-5 0 5-0.5
0
0.5
Appendix F: Heart rate & lower body skin perfusion: averaged cross correlation in HF for AB, Paraplegic & Tetraplegic Control 20 degree 40 degree 60 degree 80 degree Recovery
Lag time (sec)
AB (n=11)
Paraplegic (n=5)
Tetraplegic(n=6)

68
-10 0 10-0.5
0
0.5
-10 0 10-0.5
0
0.5
-10 0 10-0.5
0
0.5
-10 0 10-0.5
0
0.5
-10 0 10-0.5
0
0.5
-10 0 10-0.5
0
0.5
-10 0 10-0.5
0
0.5
-10 0 10-0.5
0
0.5
-10 0 10-0.5
0
0.5
-10 0 10-0.5
0
0.5
-10 0 10-0.5
0
0.5
-10 0 10-0.5
0
0.5
-10 0 10-0.5
0
0.5
-10 0 10-0.5
0
0.5
-10 0 10-0.5
0
0.5
-10 0 10-0.5
0
0.5
-10 0 10-0.5
0
0.5
-10 0 10-0.5
0
0.5
AB (n=11)
Appendix F: Upper & lower body skin perfusion: averaged cross correlation in LF for AB, Paraplegic & Tetraplegic
Paraplegic (n=5)
Lag time (sec)
Control 20 degree 40 degree 60 degree 80 degree Recovery
Tetraplegic (n=6)
-5 0 5-0.5
0
0.5
-5 0 5-0.5
0
0.5
-5 0 5-0.5
0
0.5
-5 0 5-0.5
0
0.5
-5 0 5-0.5
0
0.5
-5 0 5-0.5
0
0.5
-5 0 5-0.5
0
0.5
-5 0 5-0.5
0
0.5
-5 0 5-0.5
0
0.5
-5 0 5-0.5
0
0.5
-5 0 5-0.5
0
0.5
-5 0 5-0.5
0
0.5
-5 0 5-0.5
0
0.5
-5 0 5-0.5
0
0.5
-5 0 5-0.5
0
0.5
-5 0 5-0.5
0
0.5
-5 0 5-0.5
0
0.5
-5 0 5-0.5
0
0.5
Appendix F: Upper & lower body skin perfusion: averaged cross correlation in HF for AB, Paraplegic & Tetraplegic Control 20 degree 40 degree 60 degree 80 degree Recovery
Lag time (sec)
AB (n=11)
Paraplegic (n=5)
Tetraplegic(n=6)

69
Appendix G: Medications that could possibly affect data collection
Drug Classification Can cause Used by SubjectHydrocodone/acetaminophen narcotic hypotension 4 Baclofen skeletal muscle relaxant hypotension 4,5 Oxycontin narcotic hypotension 5 Methadone opiate analgesic bradycardia, change in BP 8 Percocet narcotic hypotension 8, 13, 14 Zanaflex skeletal muscle relaxant hypotension 8 Lasix Diuretic Fluid loss 8 HCTZ Antihypertensive/diuretic hypotension/fluid loss 8, 15 Ritalin cerebral stimulant tachycardia, changes in BP 12 Dantrium skeletal muscle relaxant hypotension 4 Lorcet narcotic hypotension 5 Sudafed decongestant hypertension 14
Theophylline
spasmolytic- relaxes smooth muscle of the respiratory system
sinus tachycardia, hypotension, fluid retention 14
Zestril Antihypertensive hypotension 15

70
REFERENCES
Berardesca E, Elsner P, Maibach H. Bioengineering of the Skin: Cutaneous Blood Flow
and Erythema. CRC Press. 1995.
Bernardi L, Radaelli A, Solda P, Coats A, Reeder M, Calciati A, Garrard C, Sleight P.
Autonomic control of skin microsvessels: assessment by power spectrum of
photoplethysmographic waves. Clin Sci. 90:345-355. 1996.
Bernardi L, Rossi M, Leuzzi S, Mevio E, Fornasari G, Calciati A, Orlandi C, Fratino P.
Reduction of 0.1 Hz microcirculatory fluctuations as evidence of sympathetic
dysfunction in insulin-dependent diabetes. Card Res. 34:185-191. 1997.
Bernardi L, Rossi M, Fratino P, Finardi G, Mevio E, Orlandi C. Relationship between
phasic changes in human skin blood flow and autonomic tone. Microvas Res. 37:16-
27. 1989.
Bernardi L, Hayoz D, Wenzel R, Passino C, Calciati A, Weber R, Noll G. Synchronous
and Baroceptor-Sensitive Oscillations in Skin Microcirculation: Evidence for Central
Autonomic Control. Am J Physiol. 273 (Heart Circ Physiol. 42):H1867-H1878.
1997.
Bootsma M, Swenne CA, van Bolhuis HH, Chang PC, Cats VM, Bruschke AVG. Heart
rate and heart rate variability as indexes of sympathovagal balance. Am J Physiol.
266:H1565-H1571. 1994.
Crandall C, Johnson J, Kosiba W, Kellogg D. Baroreceptor control of the cutaneous
active vasodilator system. J Appl Physiol. 81(5):2192-2198. Nov 1996.
Crandall C, Etzel R. Cutaneous Venoarterioloar reflex alters 0.1 Hz fluctuations in skin
blood flow. FASEB Journal. 12(5):A986. 1998. (Abstract)
Curt A, Weinhardt C, Dieta V. Significance of Sympathetic Skin Response in the
Assessment of Autonomic Failure in Patients with Spinal Cord Injury. J Autonomic
Nervous System. 61:175-180. 1996.
de Boer RW, Karemaker JM, Strackee J. Hemodynamic fluctuations and baroreflex
sensitivity in humans: a beat-to-beat model. Am J Physiol. 253:H680-H689.
1987.
EXT-TEBCO Operator’s Manual, Hemo Sapiens 2000.
Figoni SF. Cardiovascular and Haemodynamic Responses to Tilting and Standing in

71
Tetraplegic Patients: A Review. Paraplegia. 22:99-109. 1984.
Garstang SV. www.emedicine.com. “Cardiovascular Concerns in Spinal Cord Injury.”
2001.
Grimm DR, DeMeersman Re, Garofano RP, Spungen AM, Bauman WA. Effect of
provocative maneuvers on heart rate variability in subjects with quadraplegia. Am J
Physiol. 268(6 Pt 2):H2239-H2245. 1995.
Houtman S, Oeseburg B, Hughson RL, Hopman MT. Sympathetic nervous system
activity and cardiovascular homeostasis during head-up-tilt in patients with spinal
cord injuries. Clin Auton Res. 10:207-212. 2000.
Inoue K, Ogata H, Hayano J, Miyake S, Kamada T, Kuno M, Kumashiro M. Assessment
of autonomic function in traumatic quadriplegic and paraplegic patients by spectral
analysis of heart rate variability. J Auton Nerv Syst. 54(3):225-34. Sep 1995.
Johnson J, Taylor W, Shepherd A, Park M. Laser-Doppler measurement of skin blood
flow: comparison with plethysmography. J Appl Physiol. 56(3):798-803. Mar 1984.
Johnson J. Nonthermoregulatory control of human skin blood flow. J Appl Physiol.
61(5):1613-1622. Nov 1986.
Krassioukov AV, Bunge RP, Pucket WR, Bygrave MA. The changes in human
spinal sympathetic preganglionic neurons after spinal cord injury. Spinal Cord. 37:6-13.
1999.
Lali HS, Fehlings MG. Epidemiology, Demographics and Pathophysiology of Acute
Spinal Cord Injury. Spine. 26:S2-S12. 2001.
Malliani A, Pagani M, Lombardi F, Cerutti S. Cardiovascular neural regulation explored
in the frequency domain. Circulation. 84:482-492. 1991.
Mathias CJ, Frankel HL. Cardiovascular control in spinal man. Ann Rev Physiol 1988,
50:577-592.
Mathias CJ, Frankel HL. The Cardiovascular system in Tetraplegia and Paraplegia.
Handbook of Clinical Neurology, 17 edn. Elsevier Science Publishers: B.V. 1992,
435-456.
Olive J, McCully K, Dudley G. Blood flow response in individuals with incomplete
spinal cord injuries. Spinal Cord. 40:639-645. 2002.
Pagani M, Lombardi F, Guzzetti S, Rimoldi O, Furlan R, Pizzinelli P. Power

72
spectral analysis of heart rate and arterial pressure variabilities as a marker of
sympatho-vagal interaction in man and conscious dog. Circ Res. 59:178-
193. 1986
Perimed PF 2 Operator’s Manual.
Portapres Model-2 User’s Guide.
Rosner B. Fundamentals of Biostatistics. 5th edition. Duxbury Thomas Learning. 2000.
Rossi M, Ricordi L, Mevio E, Fornasari G, Orlandi C, Fratino P, Finardi G, Bernardi L.
Autonomic nervous system and microcirculation in diabetes. J Autonomic Nervous
System. 30:S133-S136. 1990.
Rowell, Loring. Human Cardiovascular Control. Oxford University Press. 1993
Shepherd AP, Oberg PA. Laser-Doppler Blood Flowmetry. Kluwer Academic
Publishers. 1990.
Sherwood, Lauralee. Human Physiology: From Cells to Systems. 2001.
Yamamoto Y, Hughson RL. Coarse graining spectral analysis: new method for studying
heart rate variability. J Appl Physiol. 71:1143-1150. 1991.

73
VITA
Charles Everett Hogancamp II Born: June 8, 1980
Place of Birth: Louisville, KY EDUCATION Vanderbilt University Nashville, TN Bachelor of Engineering, May 2002
Biomedical Engineering, Major GPA-3.15 THESIS Conducted research sponsored by the Kentucky Spinal Cord and Head Injury Trust to
explore human cardiovascular control after spinal cord injury. RESEARCH National Aeronautics and Space Administration Moffett Field, CA
Research Assistant, January 2004. Collaborated with NASA investigators at the Ames University of Kentucky Lexington, KY
Research Assistant, Fall 2002
EXPERIENCE University of Kentucky Chandler Medical Center Lexington, KY Perioperative Services Technician, March 2003-November 2003 Lourdes Hospital Paducah, KY Dialysis Reprocessing Technician, Summers 2000, 2001, Winter break 2000.
ACTIVITIES University of Kentucky Biomedical Engineering Society, Member, 2002-present;
Secretary, 2003-present Vanderbilt University Biomedical Engineering Society, Member, 2000-2002 Alpha Tau Omega Fraternity, Member, 1998-2002; Scholarship Chair, 2001-2002 Impact Symposium, Campus Relations, Promoted University-wide symposiums by H. Norman Schwarzkopf and Thomas Von Essen, 2001-2002 Tomorrow’s Leaders Daycare, Mentor, Tutored children at an after school program, 1999-2001