Embed Size (px)
Citation preview
Student Receptivity to New School Meal Offerings: Assessing Fruit and Vegetable Waste among Middle School Students in the Los Angeles Unified School District
Lauren N. Gase, MPHa,*, William J. McCarthy, PhDb, Brenda Robles, MPHa, and Tony Kuo, MD, MSHSa,c
aDivision of Chronic Disease and Injury Prevention, Los Angeles County Department of Public Health, Los Angeles, California.
bDepartment of Health Policy and Management, UCLA Jonathan and Karin Fielding School of Public Health, Los Angeles, California.
cDepartment of Family Medicine, David Geffen School of Medicine at UCLA, Los Angeles, California.
Abstract
Objective—We sought to characterize student receptivity to new menu offerings in the Los
Angeles Unified School District by measuring the levels of fruit and vegetable waste after
implementation of changes to the school lunch menu in fall 2011.
Methods—We measured waste at four randomly selected middle schools in the school district,
using two sources: a) food prepared and left over after service (production waste); and b) food that
was selected but not eaten by students (plate waste).
Results—10.2% of fruit and 28.7% of vegetable items prepared at the four schools were left over
after service. Plate waste data, collected from 2,228 students, suggest that many of them did not
select fruit (31.5%) or vegetable (39.6%) items. Among students who did, many threw fruit and
vegetable items away without eating a single bite.
Conclusions—Our findings suggest that fruit and vegetable waste was substantial and that
additional work may be needed to increase student selection and consumption of fruit and
vegetable offerings. Complementary interventions to increase the appeal of fruit and vegetable
options may be needed to encourage student receptivity to these healthier items in the school meal
program.
© 2014 Elsevier Inc. All rights reserved.*Corresponding author: Program Manager, Health and Policy Assessment Division of Chronic Disease and Injury Prevention Los Angeles County Department of Public Health 3530 Wilshire Blvd, 8th floor Los Angeles, California 90010 Tel: 213 351 4409; Fax: 213 351 2713 [email protected].
Publisher's Disclaimer: This is a PDF file of an unedited manuscript that has been accepted for publication. As a service to our customers we are providing this early version of the manuscript. The manuscript will undergo copyediting, typesetting, and review of the resulting proof before it is published in its final citable form. Please note that during the production process errors may be discovered which could affect the content, and all legal disclaimers that apply to the journal pertain.
Conflict of interest statement The authors declare that there are no conflicts of interest.
HHS Public AccessAuthor manuscriptPrev Med. Author manuscript; available in PMC 2015 October 01.
Published in final edited form as:Prev Med. 2014 October ; 67(0 1): S28–S33. doi:10.1016/j.ypmed.2014.04.013.
Author M
anuscriptA
uthor Manuscript
Author M
anuscriptA
uthor Manuscript
Introduction
To stem and reverse childhood obesity, a number of policymakers and public health
authorities at the federal, state, and local level have intensified their efforts to improve the
nutritional quality of school meals through the establishment of institutional policies or
practices that promote healthy food procurement (Institute of Medicine (IOM), 2010; United
States Department of Agriculture (USDA), 2012). These practices have included such
strategies as setting upper limits for calories, sodium, and other nutrients per serving in the
contracts of food services vendors; institutional procurement of healthier options such as
whole grains and plant-based foods; and/or complementary approaches such as nutrition
education, signage, and product placement to increase student selection of healthy food.
Collectively, these institutional practices aim to improve the quality of foods served in
schools, increase food security, and positively influence student dietary intake (IOM, 2010).
The Los Angeles Unified School District (LAUSD), the second largest school district in the
United States, serves more than 650,000 meals per day. With such volume and purchasing
power, LAUSD has become a national leader in increasing student access to healthy foods
through changes to its school meal program (Cummings et al., 2014). In the 2011-2012
school year (SY), the LAUSD Food Services Branch (FSB) launched a new menu that
included more fresh fruits and vegetables, whole grains, vegetarian items, and a range of
ethnic foods; it also eliminated flavored milk. These menu changes currently exceed the
USDA school Final Rule on school meal nutrition standards, released in 2012 (USDA,
2012). In developing the revised menu, LAUSD held community taste tests during the
summer of 2011 at its central kitchen. While taste testing results suggest students reacted
favorably to the new menu options, there were anecdotal reports that students reacted
negatively when the meals were served in the actual school cafeterias (Watanabe, 2011).
The national Communities Putting Prevention to Work (CPPW) program, funded by the
Centers for Disease Control and Prevention (CDC), supports increasing access to healthier
food options, including establishing healthy food procurement practices in schools (Bunnell
et al., 2012). Despite growing support for such school-based practices (Story et al., 2008;
IOM, 2010), limited evidence exists to support the effectiveness of such efforts for changing
student food selection and eating behaviors. A key question is how students react to these
changes to the menu. Few studies have examined student receptivity to school menu
changes and results of such studies have been mixed. Most studies have assessed student
receptivity to procurement practice changes based on older meal standards and used only
one method to assess student receptivity, such as the amount of food left on students’ trays
(plate waste) (Adams et al., 2005; Templeton et al., 2005; Cashman et al., 2010) or
administrative records of unused food (Cohen et al., 2012).
Supported in part by CPPW, this study sought to examine student receptivity to school
meals offered by the LAUSD in SY 2011-2012 that met the 2012 USDA school meal
nutrition standards. It builds on current evidence by using both administrative records and
plate waste data to provide a more comprehensive picture of student receptivity to new
menu offerings. While food waste represents only one of several dimensions of student
receptivity, it is a plausible and reliable proxy measure of student reactions to school menu
Gase et al. Page 2
Prev Med. Author manuscript; available in PMC 2015 October 01.
Author M
anuscriptA
uthor Manuscript
Author M
anuscriptA
uthor Manuscript
changes. Because previous research suggests that plant-based options are the food category
most frequently wasted by youth (Reger et al., 1996; Marlette et al., 2005), this study
focused its analysis on describing fruit and vegetable waste.
Methods
To characterize student receptivity to adopted school meal changes in the LAUSD, we
measured leftover fruit and vegetable items at four randomly selected middle schools, using
two sources: a) food prepared and left over after service (production waste); and b) food
selected but not eaten by students (plate waste).
Current USDA policy promotes the “offer versus serve” concept, where students are
required, for purposes of government reimbursement, to choose at least three of five food
components from a variety of categories (meat/meat alternate, grains, fruits, vegetables, and
lowfat (1%) or fat-free milk). During any given lunch period, LAUSD schools offer multiple
options for each of the categories (e.g., two entrées, two vegetable items, two fruit items).
Therefore, we attempted to capture information about a) whether students selected the fruit
and vegetable items and b) the extent to which students consumed these items.
Sample
Simple random sampling using a random numbers generator was used to select four of the
75 middle schools served by the FSB (Table 1). Plate waste studies are notoriously labor
intensive, disruptive of school lunchtime routine and expensive to conduct. To ensure
variability of student demographic characteristics within the study budget and thereby
minimize type I error, the investigators emulated sample sizes used in recent literature
(Cohen et al, 2013; Cohen et al, 2012; Yon et al, 2012; Nozue et al, 2010) by including four
schools in the study. Selected schools were comparable with estimates of LAUSD student
demographics for the 2011-2012 school year, which showed that 72.3% of students were
Hispanic, and 76.7% were eligible for free/reduced price lunch (California Department of
Education, 2014). All selected schools agreed to participate, in part due to district
leadership, which heavily supported participation. Plate waste data collection took place
each day, for five consecutive days (Monday through Friday) at each school in November or
December of 2011. At each school, all lunch periods were observed. Waste data were
collected only for students who chose to eat in the primary eating areas immediately
adjacent to the cafeteria food line.
Data Collection: Food Production Records
Food production records were abstracted from administrative databases housed at the
LAUSD. Data on food production are recorded by staff working in the school cafeteria and
reported to the FSB using a standardized template. The following data fields were requested
from LAUSD for this study: school, service date, service period (breakfast, snack or lunch),
and a description and number of each food item (e.g., entrée, side, drink) projected,
prepared, added, served and left over.
Gase et al. Page 3
Prev Med. Author manuscript; available in PMC 2015 October 01.
Author M
anuscriptA
uthor Manuscript
Author M
anuscriptA
uthor Manuscript

Data Collection: Plate Waste of Food Served
The goal of the plate waste assessment was to measure the amount of fruit, vegetable, and
milk waste that remained on students’ trays after they finished their school lunch. This
analysis focuses on fruit and vegetable waste only. Prior to the first lunch period, the plate
waste evaluation team obtained and recorded information from the cafeteria manager about
the day’s fruit and vegetable menu choices, including the names of the food items served
(stock description) and their mean weights (5 samples for each item were weighed) as
served (including container weight). Any entrée with more than 50% vegetables by weight
(according to the school food service director) was included as a vegetable choice.
When students entered the lunch line, a unique, arbitrary study identification number was
placed on each tray and a member of the evaluation team observed and recorded the
students’ sex and race/ethnicity (coded as African American, Asian/Pacific Islander, Latino,
white, or other). As students left the cafeteria they were instructed (through signage and
public announcements) to leave all remaining/uneaten food items on their tray and deposit
their tray at one of two staffed stations at opposite ends of the primary eating area. Once the
majority of students had dropped off their trays, one team member at each station visually
inspected each tray and recorded: the assigned identification number; the number of items
the student took (based on the presence of packaging or waste); and the amount of waste.
Based on visual inspection, fruit and vegetable waste was recorded as: a) no evidence of the
food component on the plate (i.e., that the student had not selected that food item); b) none
(wrapper only or fruit residues (e.g. apple core)); c) one-quarter remaining; d) one half
remaining; e) three quarters remaining; or f) all remaining. Using the study identification
numbers, the demographic data observed at the start of the lunch period were linked with the
observed plate waste data recorded at the end of the lunch period. Protocol for the collection
of plate waste was comparable to previous studies (Cohen et al, 2013; Cohen et al, 2012).
In addition to individual-level tray data, the aggregated waste was bagged and weighted
using a calibrated scale. All data were collected by trained observers using standardized
forms (see Figure 1). Two members of the team, masters-level health educators with
experience working with schools, were permanent members across all schools. Between two
and four additional members, trained graduate student interns or the principal investigators,
were also present during data collection. The permanent members received training on the
detailed study protocol from a Ph.D.-level former food service director prior to any data
collection. The permanent members then trained the additional members by having them
shadow them for a day prior to letting them collect plate waste data. The study protocol and
all study materials were reviewed and approved by the University of California, Los
Angeles and the Los Angeles County Department of Public Health Institutional Review
Boards prior to field implementation.
Data Analysis
Food production record data and plate waste data were linked using descriptions of the food
items served for the specific date and lunch service period. When discrepancies in items
served were found between the two data sources, the stock descriptions from the plate waste
Gase et al. Page 4
Prev Med. Author manuscript; available in PMC 2015 October 01.
Author M
anuscriptA
uthor Manuscript
Author M
anuscriptA
uthor Manuscript
data were used. For the purposes of the study, the analysis focused only on fruit and
vegetable waste as the outcomes of interest.
For each school, production and plate waste values were pooled across the five day
observation period. The number of entrées served was used as a proxy for the number of
meals served. Descriptive statistics of production waste (percent of food items prepared but
never served) were analyzed by food type (fruit or vegetable). Two values were calculated
using the plate waste data: 1) whether or not the student took the item(s) and, 2) among
students who took the item(s), the amount of food that was eaten, dichotomized as to
whether the student ate any of the item(s) or threw the item(s) away without eating a single
bite. Missing data, as a result of students removing identification numbers from their lunch
trays or disposing of their lunch waste outside of the cafeteria, were included in the
denominator when calculating percentages. Fruit and vegetable plate waste were also
analyzed by race/ethnicity and sex. In addition to descriptive statistics, four simple logistic
regression analyses, adjusted for school-level clustering, were performed to examine
differences in consumption among sexes and race/ethnicities. The logistic regressions tested
(separately) for differences between males/females and races (Latinos, African-Americans,
or other) on: a) whether students selected the fruit/vegetable item, and b) whether the student
ate any of the fruit/vegetable item. All analyses were performed using Stata version 12.1
(StataCorp LP, College Station, Texas).
Results
Analysis of the production data suggested that three out of the four schools prepared a lower
number of vegetable items, when compared to the number of entrées and fruit items (Table
2). For example, at School A, on a day when 334 entrées (of four varieties) and 266 fruit
items (of one variety) were prepared, only 42 vegetable items (of two varieties) were
prepared. Analysis of the food production records showed that 10.2% of fruit and 28.7% of
vegetable items served were left over after service. Across all schools, vegetables were left
over at a greater rate (range 22.0% to 34.6%) than fruits (range 5.0% to 16.4%) (Table 3).
Among vegetable items, salads were prepared at the lowest quantities and left over at the
highest quantities – e.g., at School B on a day when 181 meals were served, only 5 salads
(of one variety) were prepared and all 5 were left over. The most frequently wasted fruit
items were whole fruit (e.g., whole orange or apple), while fruit juices and fruit cups were
left over at lower rates.
Plate waste data were collected for 2,228 students – 35.5% of the total meals served over
five days at each of the four middle schools during the study period. Plate waste data
analysis suggests that many students did not select fruit (31.5%) or vegetable (39.6%). Of
those who did, many did not eat any, with more wasting vegetables (31.4%) than fruits
(22.6%) (Table 3).
Rates of students selecting and eating fruits and vegetables differed across schools. School B
had the highest rate of students selecting these items, but also high rates of wasting them
(Table 3). Results of the logistic regression suggest that rates of selecting and eating items
differed by sex. A greater percentage of female students selected fruit (51.0%) and
Gase et al. Page 5
Prev Med. Author manuscript; available in PMC 2015 October 01.
Author M
anuscriptA
uthor Manuscript
Author M
anuscriptA
uthor Manuscript

vegetables (42.1%), than male students (41.7% and 32.2%, respectively) – odds ratio for
selecting fruit (male as the referent group): 1.45 (95% CI 1.05, 2.00), odds ratio for selecting
vegetable (male as the referent group): 1.52 (95% CI 1.32, 1.76). Among students who
selected any fruit and vegetable, a greater percentage of female students ate any fruit,
compared to male students (odds ratio for eating any fruit (male as the referent group): 1.41
(95% CI 1.02, 1.95)) (Table 4). Overall, rates of selecting and eating fruit and vegetable
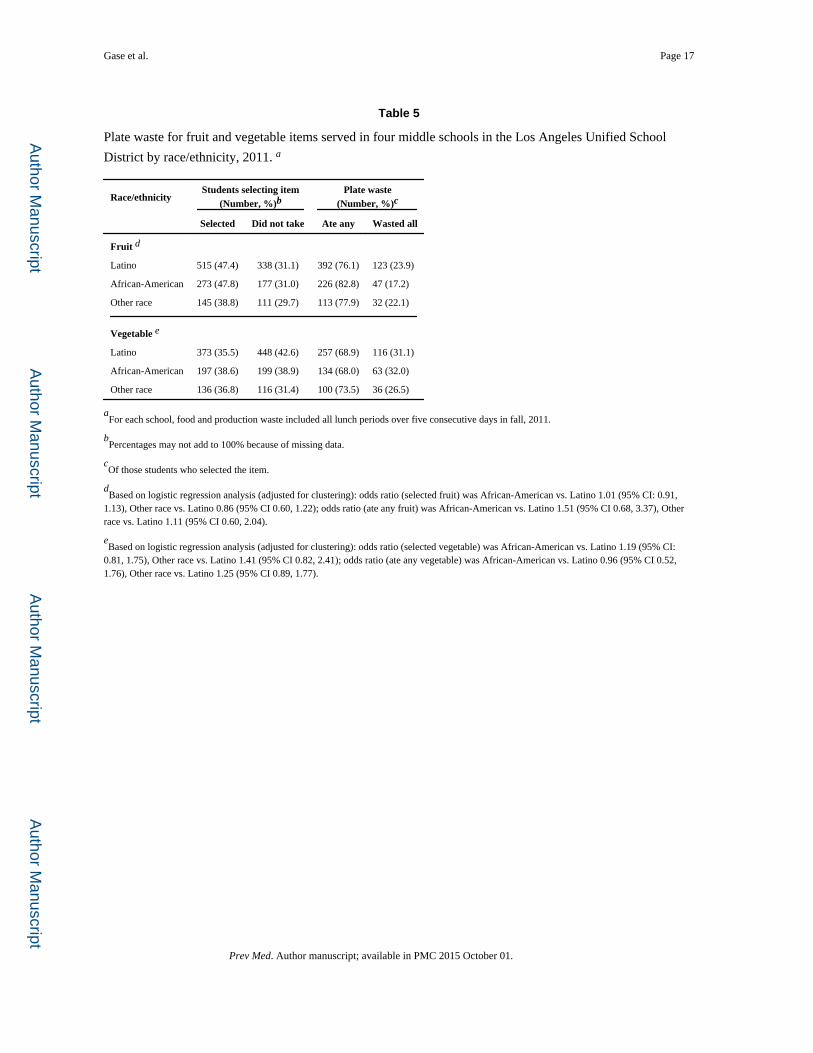
items did not differ greatly across race/ethnicities. No visible patterns were seen in
aggregate production or plate waste data between schools with a greater percentage of
Latino students (Table 3) and none of the logistic regression odds ratios showed statistical
significance (Table 5).
Discussion
Our findings suggest that a significant proportion of students did not consume the fruits and
vegetables offered as a component of their school lunch either because they did not select
any fruits and vegetables or because they did not eat even a bite of them before throwing the
lunch away. Production records showed that many vegetable and fruit items were prepared
at lower rates. In order to avoid waste, cafeteria managers may be preparing fewer vegetable
items because such items have not been previously selected by students.
These results are similar to those reported in other studies which have found that students
are likely to waste fruits and vegetables (Cohen et al., 2013; Marlette et al. 2005),
inadequately consume key recommended nutrients (Cohen et al., 2013; Cashman et al.,
2010; Marlette et al., 2005; Templeton et al., 2005), and tend to opt for food items that are
more highly processed, more calorie dense, or higher in saturated fat (Martin et al., 2010). In
contrast to previous studies (Reger et al., 1996; Marlette et al., 2005), our results suggest
that female students tended to waste less than males. Our study builds on previous work by
suggesting that many students did not select fruit and vegetable items to begin with, and that
food production staff may be responding to this perceived low demand.
Fruits and vegetables provide key nutrients, but increasing student consumption of fruits and
vegetables is a fundamentally challenging task. Waste, per se, need not be a bad thing; some
waste may be a necessary part of students learning to acquire a taste for new plant foods
(Edwards et al., 2010; Knaapila et al., 2011). However, in order to increase fruit and
vegetable consumption, it is important that students actually select and try the fruit and
vegetable choices. Results of our study suggest that many students did not select or try the
plant foods being offered and that program redesign and/or additional food environment
changes may be needed to motivate students to select and consume fruits and vegetables in
the school cafeteria setting.
Implementing changes to the school menu, as has been done by the LAUSD, is an important
first step to increasing access to healthy foods. However, in order to increase student
receptivity and consumption of healthy options, school-based healthy food procurement
practices should be implemented with a thorough understanding of how to prime the target
population to accept environmental changes (IOM, 2010). Engaging students in designing
new menu options and implementing complementary interventions can help increase student
Gase et al. Page 6
Prev Med. Author manuscript; available in PMC 2015 October 01.
Author M
anuscriptA
uthor Manuscript
Author M
anuscriptA
uthor Manuscript

demand for and consumption of more fruit and vegetable options. Potentially promising
interventions include offering a greater variety of fruits and vegetables (Adams et al., 2005),
increasing physical activity (e.g., recess, physical education) before lunch to increase hunger
for water-rich foods (Murray et al, 2013; Getlinger et al, 1996), involving students in
growing fruits and vegetables as part of school gardens (Davis et al, 2011; Gatto et al, 2012;
Heim et al, 2009), infusing nutrition education materials into the school’s standard
curriculum (Guthrie and Buzby, 2002), implementing more health marketing campaigns that
promote the appeal of new food items (Baranowski et al 2000; Blanchette and Brug, 2005),
and redesigning the placement of products to encourage consumption – for example,
providing a variety of vegetables at a salad bar (Slusser et al, 2007; Adams et al, 2005) or
providing healthy food at eye level (Berkeley Media Studies Group, 2006).
While similar types of food items were offered and served across the four middle schools in
our study sample, rates of production and student plate waste appeared to differ between
schools. More research and evaluation is clearly needed to better understand these
differences and the collective impacts of school food services on students’ consumption/
non-consumption of fruits and vegetables so that school meal programs can help students
increase consumption of healthy foods.
Limitations
While this is one of the first studies to use food production records in conjunction with
student plate waste data to get a more comprehensive picture of student receptivity to
school-based healthy food procurement practices that met the new 2012 USDA school meal
standards, it is subject to limitations. First, because this study used a cross-sectional
observational design, it did not assess waste patterns before school menu changes were
implemented. Therefore, it is not possible to ascertain whether the plate waste patterns
reported here represent an increase or decrease in overall waste from SY 2010-11 to SY
2011-12.
Second, while it would have been ideal to observe the entire population of students who
obtained school lunch meals, due to resource constraints, only students who ate lunch in the
cafeteria after obtaining their food were observed in the study. No information on
consumption patterns is available for students who left the cafeteria after obtaining their
food. Comparison between observed and unobserved students was, therefore, not possible.
Plate waste data were also not collected for roughly a fifth of the students in the sample due
to students removing identification numbers from their lunch trays or disposing of their
lunch waste outside of the cafeteria.
Third, even though a standardized form was used for data collection, some mistakes in
collecting plate waste data may have been present. For example, if whole fruit was served
without a wrapper and was taken off the tray by the student, then no evidence would be left
behind to indicate that fruit had ever been served, creating undercounting of the number of
students selecting whole fruit. Field observations during data collection, however, suggest
that only a relatively small number of students selected whole fruit and, among those who
did, only a few were seen removing the whole fruit from the tray and leaving no remainder.
Most students who selected a whole apple, for instance, left the core on the tray after
Gase et al. Page 7
Prev Med. Author manuscript; available in PMC 2015 October 01.
Author M
anuscriptA
uthor Manuscript
Author M
anuscriptA
uthor Manuscript

consuming some of it. Because the field observations were not recorded in detail on the
visual monitoring form and primarily serve to provide qualitative context, the extent of this
potential limitation is not quantifiable.
Fourth, based on discrepancies between food production records and the on-site recording of
foods served, recording errors either on the part of the food services staff or the plate waste
data collectors may have occurred. These discrepancies (6% of the items served), however,
appeared to be minimal. Finally, because our plate waste assessment was limited to middle
school students in LAUSD, our findings may not generalize to other student populations
within the District nor elsewhere in the U.S.
Taken together, the study findings and limitations support the need to further assess the
collective impacts of these and other school-based healthy food procurement practices on
health, including collecting more information on downstream outcomes such as body mass
index.
Conclusions
Given that children consume a substantial amount of their daily nutrients in school, school-
based interventions to increase access to healthier food options are an important component
of a comprehensive strategy for improving childhood nutrition. In order to ensure
effectiveness of such practices, students need to have opportunities to become receptive to
menu changes and consume the healthy food being offered and served. While institutional
policies to increase access to a wider range of healthy food choices are a critical first step
towards achieving this, simply offering these options may not be sufficient. More research
and evaluation of complementary interventions to increase consumption of healthier foods
are needed to help guide these and other institutional policy and practice decisions.
Acknowledgements
The authors thank evaluation teams at WestEd, including project leads Barbara Dietsch, PhD and Sara Griego, MS, and at the Division of Cancer Prevention and Control Research in the UCLA Fielding School of Public Health, including Tammy Liu, MPH, for their contributions to the collection of the plate waste data. The analysis was conducted as part of program assessment activities at the Los Angeles County Department of Public Health, with partial support from the Centers for Disease Control and Prevention (CDC) Cooperative Agreement No. 1U58DP002485-01. William J. McCarthy was supported by 1P50HL105188 during the project. The findings and conclusions in this article are those of the authors and do not necessarily represent the views of the Los Angeles County Department of Public Health, the Centers for Disease Control and Prevention, or the organizations mentioned in the text. Users of this document should be aware that every funding source has different requirements governing the appropriate use of funding. Under U.S. law, no Federal funds are permitted to be used for lobbying or to influence, directly or indirectly, specific pieces of pending or proposed legislation at the federal, state, or local level. Organizations should consult appropriate legal counsel to ensure compliance with all rules, regulations, and restriction of any funding sources. The CDC invited authors to submit this article for the CDC-sponsored supplement through a contract with ICF International (Contract No. 200-2007-22643-0003). Through this contract, the contracted firm supported staff training and review by scientific writers for the development of the paper. Staff at the CDC has reviewed the article for design and data collection methodology, and for scientific accuracy. All authors have read and approved the final version.
Abbreviations
IOM Institute of Medicine
Gase et al. Page 8
Prev Med. Author manuscript; available in PMC 2015 October 01.
Author M
anuscriptA
uthor Manuscript
Author M
anuscriptA
uthor Manuscript
USDA U.S. Department of Agriculture
LAUSD Los Angeles Unified School District
SY School Year
FSB Food Service Branch in the Los Angeles Unified School District
CPPW Communities Putting Prevention to Work
CDC Centers for Disease Control and Prevention
References
Adams MA, Pelletier RL, Zive MM, Sallis JF. Salad bars and fruit and vegetable consumption in elementary schools: a plate waste study. J Am Diet Assoc. 2005; 105(11):1789–92. [PubMed: 16256765]
Baranowski T, Davis M, Resnicow K, et al. Gimme 5 fruit, juice, and vegetables for fun and health: Outcome evaluation. Health Educ Behav. 2000; 27(1):96–111. PMID:10709795. [PubMed: 10709795]
Berkeley Media Studies Group. [Last accessed June 2013] Fighting junk food marketing to kids: A toolkit for advocates. 2006. http://www.bmsg.org/pdfs/BMSG_Junk_Food_toolkit.pdf
Blanchette L, Brug J. Determinants of fruit and vegetable consumption among 6-12-year-old children and effectiveinterventions to increase consumption. J Hum Nutr Diet. 2005; 18(6):431–43. [PubMed: 16351702]
Bunnell R, O’Neil D, Soler R, Payne R, Giles WH, Collins J, Bower U. Fifty Communities Putting Prevention to Work: Accelerating chronic disease prevention through policy, systems and environmental change. J Community Health. 2012; 37(5):1081–90. [PubMed: 22323099]
California Department of Education. [Last accessed April 2014] Data Question. http://dq.cde.ca.gov/dataquest/
Cashman L, Tripurana M, Englund T, Bergman EA. Food group preferences of elementary school children participating in the National School Lunch Program. J Child Nutr Manag. 2010; 34(1):1–9.
Cohen JF, Richardson S, Austin SB, Economos CD, Rimm EB. School lunch waste among middle school students: nutrients consumed and costs. Am J Prev Med. 2013; 44(2):114–21. DOI: 10.1016/j.amepre.2012.09.060. [PubMed: 23332326]
Cohen JF, Smit LA, Parker E, Austin SB, Frazier AL, Economos CD, Rimm EB. Long-term impact of a chef on school lunch consumption: findings from a 2-year pilot study in Boston middle schools. J Acad Nutr Diet. 2012; 112(6):927–33. DOI: 10.1016/j.jand.2012.01.015. Epub 2012 Apr 13. [PubMed: 22504283]
Cummings PL, Burbage L, Wood M, Butler R, Kuo T. Evaluating changes to sodium content in school meals at a large, urban school district in Los Angeles County, California. J Public Health Manag Pract. 2014; 20(1 Suppl 1):S43–9. doi: 10.1097/PHH.0b013e31829f2e50. [PubMed: 24322815]
Davis JN, Ventura EE, Cook LT, Gyllenhammer LE, Gatto NM. LA Sprouts: A gardening, nutrition, and cooking intervention for Latino Youth improves diet and reduces obesity. J Am Diet Assoc. 2011; 111(8):1224–1230. PMID:21802571. [PubMed: 21802571]
Edwards JSA, Hartwell HL, Brown L. Changes in food neophobia and dietary habits of international students. J Hum Nutr Diet. 2010; 23(3):301–311. PMID:20642641. [PubMed: 20642641]
Gatto NM, Ventura EE, Cook LT, Gyllenhammer LE, Davis JN. LA Sprouts: A garden-based nutrition intervention pilot program influences motivation and preferences for fruits and vegetables in Latino Youth. J Acad Nutr Diet. 2012; 112(6):913–920. PMID:22516551. [PubMed: 22516551]
Getlinger M, Laughlin V, Bell E, Akre C, Arjmandi B. Food waste is reduced when elementary-school children have recess before lunch. J Am Diet Assoc. 1996; 96(9):906–908. PMID:8784336. [PubMed: 8784336]
Gase et al. Page 9
Prev Med. Author manuscript; available in PMC 2015 October 01.
Author M
anuscriptA
uthor Manuscript
Author M
anuscriptA
uthor Manuscript

Guthrie JF, Buzby JC. Several strategies may lower plate waste in school feeding programs. Food Rev. 2002; 25(2):36–42.
Heim S, Stang J, Ireland M. A garden pilot project enhances fruit and vegetable consumption among children. J Am Diet Assoc. 2009; 109(7):1220–1226. PMID:19559139. [PubMed: 19559139]
Institute of Medicine. School Meals: Building Blocks for Healthy Children. The National Academies Press; Washington, DC: 2010. http://www.fns.usda.gov/Ora/menu/Published/CNP/FILES/SchoolMealsIOM.pdf
Knaapila A, Silventoinen K, Broms U, Rose RJ, Perola M, Kaprio J, Tuorila HM. Food neophobia in young adults: Genetic architecture and relation to personality, pleasantness and use frequency of foods, and body mass index—A twin study. Behav Genetics. 2011; 41(4):512–521.
Marlette MA, Templeton SB, Panemangalore M. Food type, food preparation, and competitive food purchases impact school lunch plate waste by sixth-grade students. J Am Diet Assoc. 2005; 105(11):1779–82. [PubMed: 16256763]
Martin CK, Thomson JL, LeBlanc MM, Stewart TM, Newton RL Jr, Han H, Sample A, Champagne CM, Williamson DA. Children in school cafeterias select foods containing more saturated fat and energy than the Institute of Medicine recommendations. J Nutr. 2010; 140(9):1653–60. DOI: 10.3945/jn.109.119131. Epub 2010 Jul 28. [PubMed: 20668251]
Murray R, Ramstetter C, Devore C, Council on School Health; American Academy of Pediatrics. The crucial role of recess in school. Pediatrics. 2013; 131(1):183–188. PMID:23277311. [PubMed: 23277311]
Nozue M, Yoshita K, Jun K, Ishihara Y, Taketa Y, Naruse A, Nagai N, Ishida H. Amounts served and consumed of school lunch differed by gender in Japanese elementary schools. Nutr. Res. Pract. 2010; 4(5):400–404. [PubMed: 21103086]
Reger C, Neil EO, Nicklas TA, Myers L, Berenson GS. Plate waste of school lunches served to children in a low-socioeconomic elementary school in south Louisiana. Sch Food Ser Res Rev. 1996; 20:13–19.
Slusser WM, Cumberland WG, Browdy BL, Lange L, Neumann C. A school salad bar increases frequency of fruit and vegetable consumption among children living in low-income households. Public Health Nutr. 2007; 10(12):1490–1496. PMID:17610759. [PubMed: 17610759]
Story M, Kaphingst KM, Robinson-O‘Brien R, Glanz K. Creating healthy food and eating environments: policy and environmental approaches. Annu Rev Public Health. 2008; 29:253–72. [PubMed: 18031223]
Templeton SB, Marletter MA, Panemangalore M. Competitive foods increase the intake of energy and decrease the intake of certain nutrients by adolescents consuming school lunch. J Am Diet Assoc. 2005; 105(2):215–20. [PubMed: 15668677]
United States Department of Agriculture. Nutrition standards in the National School Lunch and School Breakfast Programs. Final Rule. Fed Regist. 2012; 77(17):4088–167.
Wantanabe, T. L.A. schools’ healthful lunch menu panned by students. Los Angeles Times. 2011. Available from: http://articles.latimes.com/2011/dec/17/local/la-me-food-lausd-20111218
Yon BA, Johnson RK, Stickle TR. School children’s consumption of lower-calorie flavored milk: a plate waste study. J Acad Nutr Diet. 2012; 112(1):132–136. [PubMed: 22709643]
Gase et al. Page 10
Prev Med. Author manuscript; available in PMC 2015 October 01.
Author M
anuscriptA
uthor Manuscript
Author M
anuscriptA
uthor Manuscript

Highlights
• Food production records and plate waste data from 2,228 students were
examined.
• Nearly 1/3 girls and 1/2 boys did not select fruit/vegetable offerings at school.
• About a quarter of students threw away untouched fruits and vegetables.
• More evaluation of complementary interventions to menu changes is needed.
Gase et al. Page 11
Prev Med. Author manuscript; available in PMC 2015 October 01.
Author M
anuscriptA
uthor Manuscript
Author M
anuscriptA
uthor Manuscript
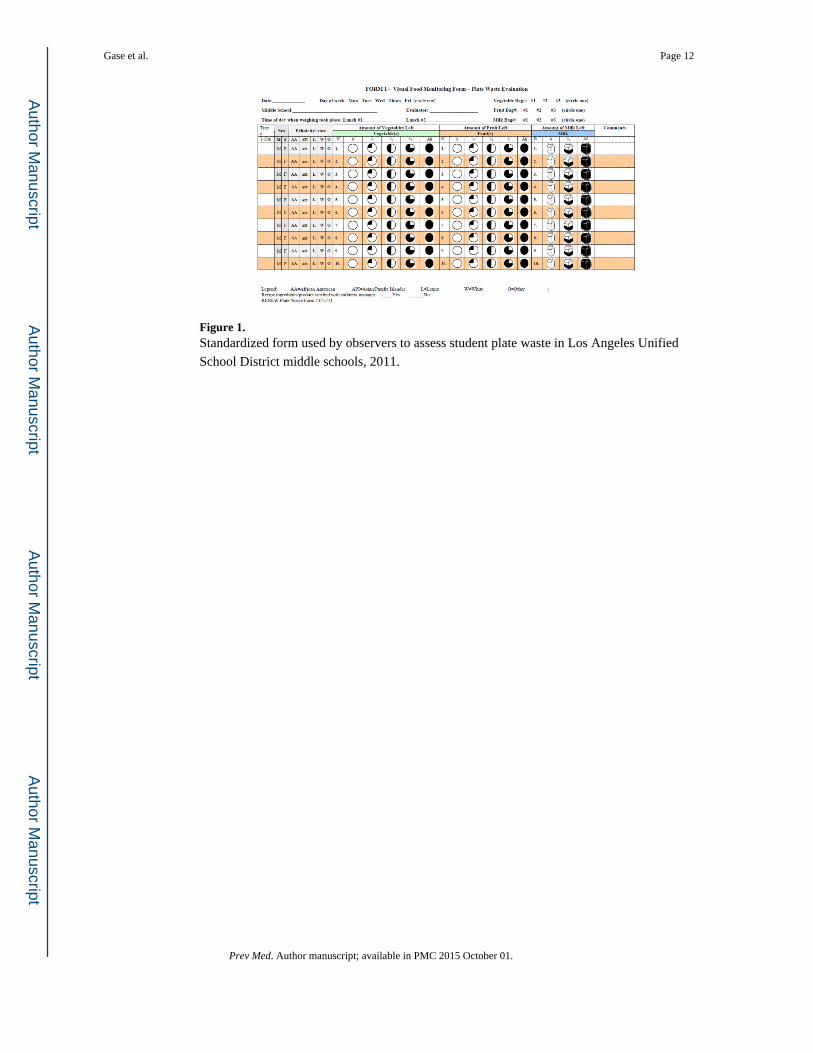
Figure 1. Standardized form used by observers to assess student plate waste in Los Angeles Unified
School District middle schools, 2011.
Gase et al. Page 12
Prev Med. Author manuscript; available in PMC 2015 October 01.
Author M
anuscriptA
uthor Manuscript
Author M
anuscriptA
uthor Manuscript

Author M
anuscriptA
uthor Manuscript
Author M
anuscriptA
uthor Manuscript
Gase et al. Page 13
Table 1
Characteristics of the four Los Angeles Unified School District middle schools that participated in the plate
waste assessment, 2011.
SchoolTotal
enrollmentaPercent
Hispanica
Percentage ofstudents
eligible for freeor reduced
price luncha
Percentage ofstudents whowere obeseb
Numberof
lunchesservedc
Numberof
studentsobservedd
A 860 87% 85% 27.2% 1602 430
B 707 38% 76% 23.4% 1158 590
C 1686 67% 73% 19.7% 1795 840
D 1724 39% 53% 15.0% 1729 368
aThe Los Angeles Unified School District administrative data for 2011-2012.
bBased on State-mandated fitnessgram body composition measures for students in the 7th grade during school year 2010-2011.
cEstimated using the number of entrées served. Data extracted from five days of food production records from the Los Angeles Unified School
District.
dDuring the five days of on-site observation of student plate waste conducted as a part of this study.
Prev Med. Author manuscript; available in PMC 2015 October 01.
Author M
anuscriptA
uthor Manuscript
Author M
anuscriptA
uthor Manuscript
Gase et al. Page 14
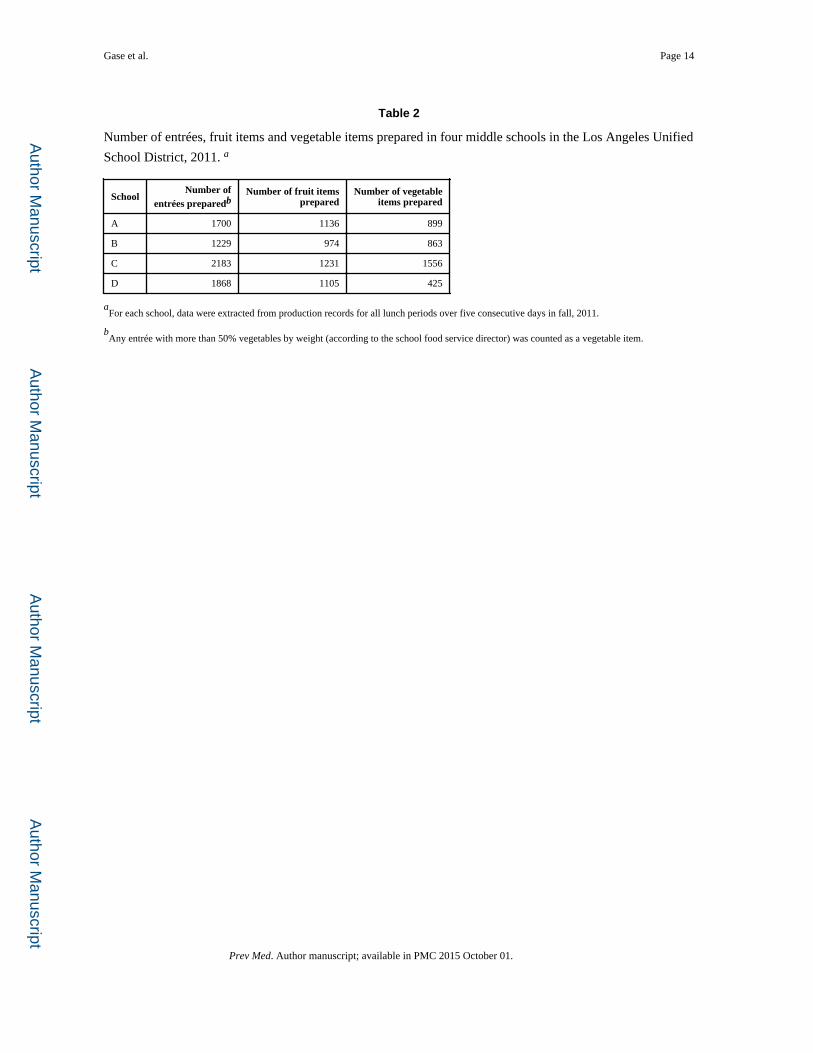
Table 2
Number of entrées, fruit items and vegetable items prepared in four middle schools in the Los Angeles Unified
School District, 2011. a
SchoolNumber of
entrées preparedbNumber of fruit items
preparedNumber of vegetable
items prepared
A 1700 1136 899
B 1229 974 863
C 2183 1231 1556
D 1868 1105 425
aFor each school, data were extracted from production records for all lunch periods over five consecutive days in fall, 2011.
bAny entrée with more than 50% vegetables by weight (according to the school food service director) was counted as a vegetable item.
Prev Med. Author manuscript; available in PMC 2015 October 01.

Author M
anuscriptA
uthor Manuscript
Author M
anuscriptA
uthor Manuscript
Gase et al. Page 15
Table 3
Food production and plate waste for fruit and vegetable items in four middle schools in the Los Angeles
Unified School District, 2011. a
School Foodtype
Production waste(% of items leftover)
Students selecting item(Number, %)b
Plate waste(Number, %)c
Selected Did not take Ate any Wasted all
A Fruit 7.0 231(53.9) 156 (36.3) 188 (81.4) 43 (18.6)
A Vegetable 22.0 130 (30.2) 257 (59.8) 107 (82.3) 23 (17.7)
B Fruit 13.6 321 (54.4) 195 (33.1) 239 (74.5) 82 (25.6)
B Vegetable 29.2 217 (46.0) 191 (40.5) 130 (59.9) 87 (40.1)
C Fruit 5.0 309 (36.8) 215 (25.6) 243 (78.6) 66 (21.4)
C Vegetable 34.6 288 (34.3) 236 (28.1) 172 (59.7) 116 (40.3)
D Fruit 16.4 153 (41.6) 135 (36.7) 115 (75.2) 38 (24.8)
D Vegetable 25.2 137 (37.2) 151 (41.0) 121 (88.3) 16 (11.7)
Summary
Fruit 10.2 1014 (45.5) 701 (31.5) 785 (77.4) 229 (22.6)
Vegetable 28.7 772 (36.6) 835 (39.6) 530 (68.7) 242 (31.4)
aFor each school, food and production waste included all lunch periods over five consecutive days in fall, 2011.
bPercentages do not add to 100% because of missing data as a result of students removing identification numbers from their lunch trays and
disposing of their lunch waste outside of the cafeteria. n= 1715 for fruit waste observations and 1607 for vegetable waste observations; vegetables were not served in one school on one day.
cOf those students who selected the item.
Prev Med. Author manuscript; available in PMC 2015 October 01.
Author M
anuscriptA
uthor Manuscript
Author M
anuscriptA
uthor Manuscript
Gase et al. Page 16
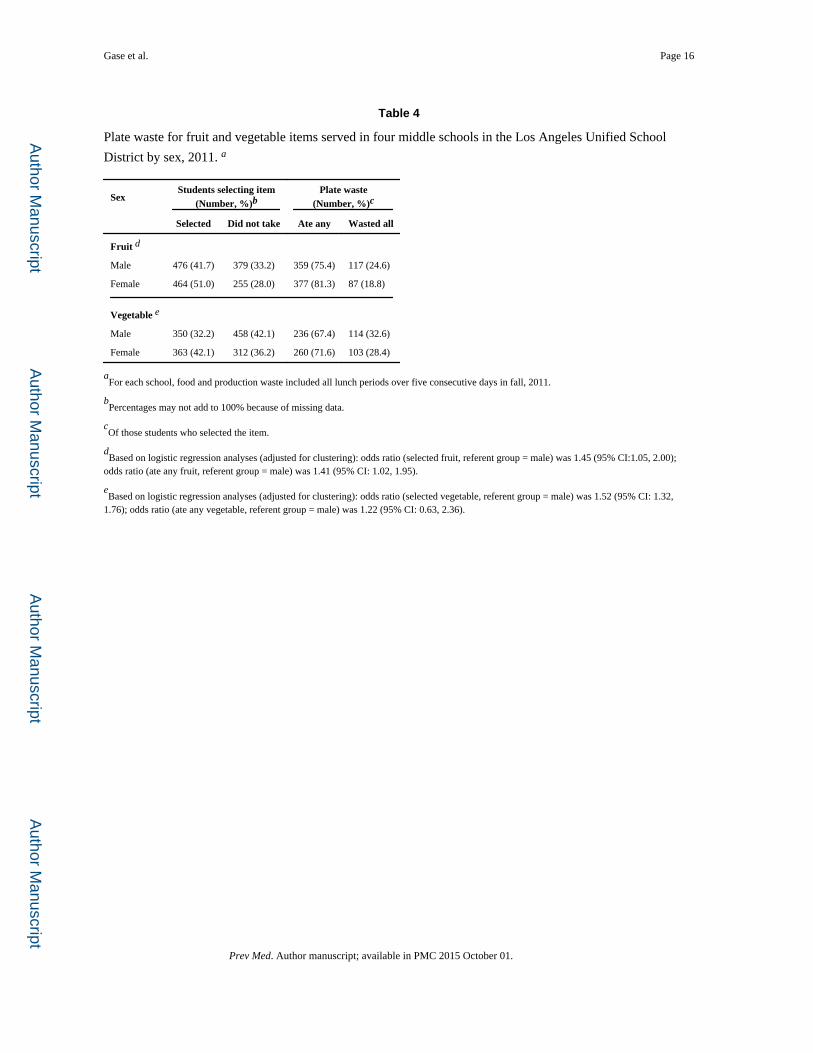
Table 4
Plate waste for fruit and vegetable items served in four middle schools in the Los Angeles Unified School
District by sex, 2011. a
SexStudents selecting item
(Number, %)bPlate waste
(Number, %)c
Selected Did not take Ate any Wasted all
Fruit d
Male 476 (41.7) 379 (33.2) 359 (75.4) 117 (24.6)
Female 464 (51.0) 255 (28.0) 377 (81.3) 87 (18.8)
Vegetable e
Male 350 (32.2) 458 (42.1) 236 (67.4) 114 (32.6)
Female 363 (42.1) 312 (36.2) 260 (71.6) 103 (28.4)
aFor each school, food and production waste included all lunch periods over five consecutive days in fall, 2011.
bPercentages may not add to 100% because of missing data.
cOf those students who selected the item.
dBased on logistic regression analyses (adjusted for clustering): odds ratio (selected fruit, referent group = male) was 1.45 (95% CI:1.05, 2.00);
odds ratio (ate any fruit, referent group = male) was 1.41 (95% CI: 1.02, 1.95).
eBased on logistic regression analyses (adjusted for clustering): odds ratio (selected vegetable, referent group = male) was 1.52 (95% CI: 1.32,
1.76); odds ratio (ate any vegetable, referent group = male) was 1.22 (95% CI: 0.63, 2.36).
Prev Med. Author manuscript; available in PMC 2015 October 01.
Author M
anuscriptA
uthor Manuscript
Author M
anuscriptA
uthor Manuscript
Gase et al. Page 17
Table 5
Plate waste for fruit and vegetable items served in four middle schools in the Los Angeles Unified School
District by race/ethnicity, 2011. a
Race/ethnicityStudents selecting item
(Number, %)bPlate waste
(Number, %)c
Selected Did not take Ate any Wasted all
Fruit d
Latino 515 (47.4) 338 (31.1) 392 (76.1) 123 (23.9)
African-American 273 (47.8) 177 (31.0) 226 (82.8) 47 (17.2)
Other race 145 (38.8) 111 (29.7) 113 (77.9) 32 (22.1)
Vegetable e
Latino 373 (35.5) 448 (42.6) 257 (68.9) 116 (31.1)
African-American 197 (38.6) 199 (38.9) 134 (68.0) 63 (32.0)
Other race 136 (36.8) 116 (31.4) 100 (73.5) 36 (26.5)
aFor each school, food and production waste included all lunch periods over five consecutive days in fall, 2011.
bPercentages may not add to 100% because of missing data.
cOf those students who selected the item.
dBased on logistic regression analysis (adjusted for clustering): odds ratio (selected fruit) was African-American vs. Latino 1.01 (95% CI: 0.91,
1.13), Other race vs. Latino 0.86 (95% CI 0.60, 1.22); odds ratio (ate any fruit) was African-American vs. Latino 1.51 (95% CI 0.68, 3.37), Other race vs. Latino 1.11 (95% CI 0.60, 2.04).
eBased on logistic regression analysis (adjusted for clustering): odds ratio (selected vegetable) was African-American vs. Latino 1.19 (95% CI:
0.81, 1.75), Other race vs. Latino 1.41 (95% CI 0.82, 2.41); odds ratio (ate any vegetable) was African-American vs. Latino 0.96 (95% CI 0.52, 1.76), Other race vs. Latino 1.25 (95% CI 0.89, 1.77).
Prev Med. Author manuscript; available in PMC 2015 October 01.


![Hospital PHDB 072002[1]](https://img.dokumen.tips/doc/110x75/577cd0541a28ab9e7891f7ea/hospital-phdb-0720021.jpg)

