Embed Size (px)
Citation preview

Shaista Malik, J. Thomas Rosenthal and José J. EscarceAlein Chun, Bruce Davidson, Theodore G. Ganiats, Sheldon Greenfield, Michael A. Gropper, Michael K. Ong, Carol M. Mangione, Patrick S. Romano, Qiong Zhou, Andrew D. Auerbach,
Outcomes for Elderly Patients With Heart FailureLooking Forward, Looking Back: Assessing Variations in Hospital Resource Use and
Print ISSN: 1941-7705. Online ISSN: 1941-7713 Copyright © 2009 American Heart Association, Inc. All rights reserved.
Greenville Avenue, Dallas, TX 75231is published by the American Heart Association, 7272Circulation: Cardiovascular Quality and Outcomes published online October 13, 2009;Circ Cardiovasc Qual Outcomes.
http://circoutcomes.ahajournals.org/content/early/2009/10/13/CIRCOUTCOMES.108.825612World Wide Web at:
The online version of this article, along with updated information and services, is located on the
http://circoutcomes.ahajournals.org/content/suppl/2009/10/13/CIRCOUTCOMES.108.825612.DC1.htmlData Supplement (unedited) at:
http://circoutcomes.ahajournals.org//subscriptions/
at: is onlineCirculation: Cardiovascular Quality and Outcomes Information about subscribing to Subscriptions:
http://www.lww.com/reprints
Information about reprints can be found online at: Reprints:
document. Question and AnswerPermissions and Rightspage under Services. Further information about this process is available in the
which permission is being requested is located, click Request Permissions in the middle column of the WebCopyright Clearance Center, not the Editorial Office. Once the online version of the published article for
can be obtained via RightsLink, a service of theCirculation: Cardiovascular Quality and Outcomesin Requests for permissions to reproduce figures, tables, or portions of articles originally publishedPermissions:
by guest on October 14, 2014http://circoutcomes.ahajournals.org/Downloaded from by guest on October 14, 2014http://circoutcomes.ahajournals.org/Downloaded from by guest on October 14, 2014http://circoutcomes.ahajournals.org/Downloaded from by guest on October 14, 2014http://circoutcomes.ahajournals.org/Downloaded from by guest on October 14, 2014http://circoutcomes.ahajournals.org/Downloaded from by guest on October 14, 2014http://circoutcomes.ahajournals.org/Downloaded from by guest on October 14, 2014http://circoutcomes.ahajournals.org/Downloaded from by guest on October 14, 2014http://circoutcomes.ahajournals.org/Downloaded from by guest on October 14, 2014http://circoutcomes.ahajournals.org/Downloaded from by guest on October 14, 2014http://circoutcomes.ahajournals.org/Downloaded from by guest on October 14, 2014http://circoutcomes.ahajournals.org/Downloaded from by guest on October 14, 2014http://circoutcomes.ahajournals.org/Downloaded from by guest on October 14, 2014http://circoutcomes.ahajournals.org/Downloaded from by guest on October 14, 2014http://circoutcomes.ahajournals.org/Downloaded from by guest on October 14, 2014http://circoutcomes.ahajournals.org/Downloaded from by guest on October 14, 2014http://circoutcomes.ahajournals.org/Downloaded from by guest on October 14, 2014http://circoutcomes.ahajournals.org/Downloaded from by guest on October 14, 2014http://circoutcomes.ahajournals.org/Downloaded from by guest on October 14, 2014http://circoutcomes.ahajournals.org/Downloaded from by guest on October 14, 2014http://circoutcomes.ahajournals.org/Downloaded from by guest on October 14, 2014http://circoutcomes.ahajournals.org/Downloaded from

Looking Forward, Looking BackAssessing Variations in Hospital Resource Use and Outcomes for Elderly
Patients With Heart Failure
Michael K. Ong, MD, PhD; Carol M. Mangione, MD, MSPH; Patrick S. Romano, MD, MPH;Qiong Zhou, MA; Andrew D. Auerbach, MD, MPH; Alein Chun, PhD, MSPH;
Bruce Davidson, PhD, MPH; Theodore G. Ganiats, MD; Sheldon Greenfield, MD;Michael A. Gropper, MD, PhD; Shaista Malik, MD, PhD;
J. Thomas Rosenthal, MD; Jose J. Escarce, MD, PhD
Background—Recent studies have found substantial variation in hospital resource use by expired Medicarebeneficiaries with chronic illnesses. By analyzing only expired patients, these studies cannot identify differ-ences across hospitals in health outcomes like mortality. This study examines the association betweenmortality and resource use at the hospital level, when all Medicare beneficiaries hospitalized for heart failure areexamined.
Methods and Results—A total of 3999 individuals hospitalized with a principal diagnosis of heart failure at 6 Californiateaching hospitals between January 1, 2001, and June 30, 2005, were analyzed with multivariate risk-adjustment modelsfor total hospital days, total hospital direct costs, and mortality within 180-days after initial admission (“LookingForward”). A subset of 1639 individuals who died during the study period were analyzed with multivariaterisk-adjustment models for total hospital days and total hospital direct costs within 180-days before death (“LookingBack”). “Looking Forward” risk-adjusted hospital means ranged from 17.0% to 26.0% for mortality, 7.8 to 14.9 daysfor total hospital days, and 0.66 to 1.30 times the mean value for indexed total direct costs. Spearman rank correlationcoefficients were �0.68 between mortality and hospital days, and �0.93 between mortality and indexed total directcosts. “Looking Back” risk-adjusted hospital means ranged from 9.1 to 21.7 days for total hospital days and 0.91 to 1.79times the mean value for indexed total direct costs. Variation in resource use site ranks between expired and allindividuals were attributable to insignificant differences.
Conclusions—California teaching hospitals that used more resources caring for patients hospitalized for heartfailure had lower mortality rates. Focusing only on expired individuals may overlook mortality variation aswell as associations between greater resource use and lower mortality. Reporting values without identifyingsignificant differences may result in incorrect assumption of true differences. (Circ Cardiovasc Qual Outcomes.2009;2:00-00.)
Key Words: heart failure � delivery of health care � outcome assessment � healthcare costs� healthcare economics � organizations
Recent national1,2 and California3 studies have docu-mented substantial variation across hospitals in the
resources used to care for expired elderly Medicare bene-ficiaries with chronic illnesses, including heart failure(HF), during the 6-month period immediately preceding
death. The premise of these studies is that examininghospital resource use among expired elderly Medicarebeneficiaries during a fixed time interval before death,which we term as the “Looking Back” method, minimizesthe likelihood that variations in resource use are attribut-
Received October 3, 2008; accepted September 1, 2009.From the Departments of Medicine (M.K.O., C.M.M., Q.Z., J.T.R., J.J.E.) and Health Services (C.M.M.), University of California, Los Angeles;
Department of Medicine (P.S.R.), University of California, Davis; Department of Medicine (A.D.A., M.A.G.), University of California, San Francisco;Department of Resource and Outcomes Management (A.C., B.D.), Cedars-Sinai Medical Center, Los Angeles; Department of Family and PreventiveMedicine (T.G.G.), University of California, San Diego; Department of Medicine (S.G., S.M.), University of California, Irvine; and RAND Health (J.J.E.),Santa Monica, Calif.
The online-only Data Supplement is available at http://circoutcomes.ahajournals.org/cgi/content/full/CIRCOUTCOMES.108.825612/DC1.Correspondence to Michael K. Ong, MD, PhD, David Geffen School of Medicine at the University of California, Los Angeles, Department of
Medicine, Division of General Internal Medicine & Health Services Research, 911 Broxton Ave, 1st Floor, Los Angeles, CA 90024. [email protected]
© 2009 American Heart Association, Inc.
Circ Cardiovasc Qual Outcomes is available at http://circoutcomes.ahajournals.org DOI: 10.1161/CIRCOUTCOMES.108.825612
1 by guest on October 14, 2014http://circoutcomes.ahajournals.org/Downloaded from

able to differences in severity of illness, because allpatients have the same outcome: death. Therefore, the argu-ment goes, hospitals with the lowest resource use can be used toestablish performance benchmarks, whereas hospitals with thehighest resource use can be identified as inefficient. Publicdiscussions of these studies suggest that reducing hospitalresource use to these performance benchmarks would resultin substantial savings from current health care spendingwithout adversely affecting health outcomes.4–6
However, the “Looking Back” method suffers from 2potentially serious shortcomings. First, by design, the methodused in these studies cannot identify differences acrosshospitals in health outcomes. By analyzing only expiredpatients, this method forces health outcomes to be identicalacross hospitals: 100% mortality. The “Looking Back”method ignores the possibility that resource-intensive caremay improve survival, and therefore identifies resource-intensive care as inherently inefficient. Second, the “LookingBack” method implicitly assumes that patterns of resourceuse observed among expired patients accurately reflectpatterns of resource use among all patients, includingpatients who survived. Thus, the “Looking Back” methodignores the possibility that some hospitals may directresources to patients in a selective manner, based in part onthe likelihood that the patient will benefit from receivingthose resources.
This study examines these 2 concerns regarding the“Looking Back” method by comparing it with a “LookingForward” methodology which allows conclusions to bedrawn about survival in addition to resource use. Forphysicians, patients, and patients’ families, survival is acritical concern in patient care.7 Specifically, our goalswere (1) to determine whether health outcomes for chron-ically ill patients vary across hospitals, as measured bymortality rates over fixed time intervals after hospitaliza-tion, and (2) to determine whether the patterns of hospitalresource use observed among expired patients accuratelyreflect the patterns among all patients hospitalized duringthe same time period, including patients who survived. Toachieve these goals, we examined 2 cohorts of elderlyMedicare beneficiaries hospitalized for HF at 6 nonprofitacademic hospitals in California between 2001 and 2005: a“Looking Forward” cohort, which included all patientshospitalized during the study period, whether they expiredor survived, and a “Looking Back” cohort of patients whoexpired during the study period, drawn from the “LookingForward” cohort. The 6 study hospitals include the 5 Univer-sity of California Medical Centers (UC Davis, UC Irvine, UCLos Angeles, UC San Diego, and UC San Francisco) andCedars-Sinai Medical Center in Los Angeles. Cedars-Sinai isthe largest teaching hospital in California and is academicallyaffiliated with UC Los Angeles. These hospitals variedwidely on hospital resource use in the prior studies,1–3 andthey include both hospitals identified as examples of perfor-mance benchmarks (UC Davis and UC San Francisco) as wellas hospitals identified as examples of high resource use(Cedars-Sinai and UC Los Angeles).
WHAT IS KNOWN
● Substantial variation has been documented amonghospitals in the resources used to care for elderlyMedicare beneficiaries with chronic illnesses duringthe last 6 months of life.
● By only including individuals who have died in theanalyses, researchers cannot identify differences onhealth outcomes such as survival.
WHAT THE STUDY ADDS
● This study found variation among California teach-ing hospitals in survival for patients hospitalizedwith heart failure. This variation would have beenoverlooked by a study that only examined heartfailure patients who died.
● When analyzing all patients hospitalized for heartfailure, California teaching hospitals that used moreresources had lower mortality rates.
● When analyzing all patients hospitalized for heartfailure, the variation in resource use among Califor-nia teaching hospitals was 27% to 44% less than thevariation observed when analyzing only heart failurepatients who died.
Methods“Looking Forward” CohortWe used administrative data from the 6 study hospitals to identifyhospitalizations for 4990 elderly (age 65 or over at admission)Medicare beneficiaries that occurred between January 1, 2001 andJune 30, 2005 with a principal diagnosis of HF as defined byICD-9-CM codes used by the Dartmouth Atlas of Health Care(398.9, 398.90, 398.91, 398.99, 402.0, 402.01, 402.1, 402.11, 402.9,402.91, 404.0, 404.01, 404.03, 404.11, 404.13, 404.91, 404.93,428.0, 428.1, 428.9, but not 428.2, 428.3, or 428.4)1,8 or with aprincipal ICD-9-CM code of acute respiratory failure and a second-ary diagnosis of HF.9 We defined initial hospitalizations as HFhospitalizations that occurred within the specified time period at the6 sites and were not preceded by any other HF hospitalization withinthe previous 6 months. To enhance clinical homogeneity, weexcluded initial hospitalizations for 107 patients assigned to asurgical Diagnostic Related Group (DRG) classification10 (except forvalve replacement and pacemaker/defibrillator placement, which weincluded); for 120 patients who were transferred from another acutecare hospital (because of unknown severity of illness and resourceuse at the preceding facility)11–14; and for 53 patients who hadreceived a cardiac, renal, or hepatic transplant or were admitted fortransplant evaluation based on ICD-9-CM codes (996.8, 996.80,996.81, 996.82, 996.83, 996.89, E878.0, v42.0 v42.1, v42.7, v42.9,v49.83). We also excluded 711 individuals hospitalized at site Fduring 2001 and the first half of 2002 who had missing cost data. Forthe 445 patients who had multiple initial hospitalizations during theperiod, we randomly selected 1 of the initial hospitalizations tominimize bias in the assessment of hospital differences in mortalityrates. The final ”Looking Forward” cohort consisted of 3999patients.
“Looking Back” CohortThe “Looking Back” cohort were drawn from the 1650 patients inthe “Looking Forward” cohort who expired between July 1, 2001,and December 31, 2005. Dates of death were identified using thehospital administrative data and the National Death Index (http://www.cdc.gov/nchs/ndi.htm). We excluded an additional 11 individ-
2 Circ Cardiovasc Qual Outcomes November 2009
by guest on October 14, 2014http://circoutcomes.ahajournals.org/Downloaded from

uals hospitalized at site F who had missing cost data for hospital-izations before the initial hospitalization used in the “LookingForward” cohort. The final “Looking Back” cohort consisted of 1639patients.
OutcomesWe generated 2 resource use outcomes, total hospital days andindexed total direct costs, from each hospital’s administrative data,and we obtained mortality outcomes from the administrative data andthe National Death Index. For the “Looking Forward” cohort, wedetermined total hospital days during the 180-day period after eachinitial HF hospitalization by summing the lengths of stay for theinitial hospitalization and any subsequent hospitalization, regardlessof principal diagnosis, for which the admission date occurred within180 days of the initial hospitalization admission date. We determinedtotal direct costs using internal cost accounting system data for eachhospitalization included in the calculation of total hospital days. Wealso assessed total hospital days and total direct costs for the initialhospitalization (not shown in tables). We did not use total (directplus indirect) costs because of concerns regarding a lack of compa-rability of indirect cost accounting across sites. Total direct costswere indexed to 2005 using the medical care component of theConsumer Price Index (www.bls.gov/CPI). To avoid revealingproprietary information about hospital-specific costs, we then di-vided each site’s predicted total direct cost estimate by the meanpredicted estimate for the entire study cohort (all 6 hospitals). Weassessed mortality during the initial hospitalization and at 30 and 180days after the initial hospitalization admission date. We chose tolimit mortality assessment to 180 days after the initial hospitalizationas one of our outcomes to be consistent with the 180-day resourceuse outcomes, and because previous studies have found that death upto 180 days after an initial hospitalization is associated withprocesses of care during the initial hospitalization.15
For the “Looking Back” cohort, we followed the same proceduresexcept that we determined total hospital days and total hospital directcosts during the 180-day period immediately preceding death bysumming the lengths of stay and costs from all hospitalizations thatoverlapped the beginning of a 180-day period counted backwardsfrom the date of death.1–3
Statistical AnalysisWe used multivariate regression analysis to assess differences acrossthe study hospitals in the study outcomes, adjusted for differences inpatient characteristics that can influence use and mortality. The keyindependent variables in the models were indicator variables for the6 study hospitals, and the covariates included indicator variables forpatient age on admission, gender, race/ethnicity (Hispanic, black,other, white), admission year, Medicaid as an additional payor, DRGfor valve replacement or pacemaker/defibrillator placement, andeach of 21 comorbidities derived from the Agency for HealthcareResearch and Quality’s Healthcare Cost & Utilization Project, aftertaking out HF, comorbidities subject to misclassification (coagulopa-thies, electrolytes and fluid disorders), and comorbidities too rare toinclude in the analysis (chronic peptic ulcer disease, drug abuse, HIVand AIDS, pulmonary circulation disorders, and valvular dis-ease).16,17 Covariates for the “Looking Forward” cohort were derivedfrom the initial hospitalization, whereas covariates for the “LookingBack” cohort were derived from the earliest hospitalization within180 days of death.
For the “Looking Forward” cohort, we used zero-truncated Pois-son regression models for total hospital days, zero-truncated negativebinomial regression models for total hospital direct costs, andlogistic regression models for mortality. We chose zero-truncatedmodels for days and direct costs because these outcomes assumeonly nonzero positive values.18,19 We further confirmed the choice ofmodels by assessing goodness of fit for alternative models (negativebinomial versus overdispersed Poisson models, and models withoutzero truncation). For the “Looking Back” cohort, we used overdis-persed Poisson regression models for total hospital days and ordinaryleast square regression models for total hospital direct costs, whichwere the methods used by prior studies.1–3 Cost analyses with
negative binomial models found similar results. In all models, weused the Huber-White sandwich estimator to obtain robust standarderrors for the regression coefficients that accounted for the noninde-pendence (ie, clustering) of observations within hospitals. All anal-yses were performed using Stata 10 (College Station, Tex).
We report results as unadjusted and risk-adjusted means andproportions, where the latter are estimated using the method ofrecycled predictions.20–25 This method is the most appropriatemethod for estimating the risk-adjusted mean value of an outcomevariable from nonlinear regression models, because it enables us toestimate what each study outcome would have been at each studyhospital in 2005 if the hospital’s patients had the same distribution ofcharacteristics as the entire study population. We used the deltamethod to obtain standard errors for each hospital’s risk-adjustedmeans and proportions and to conduct statistical tests of pair-wisedifferences between hospitals in these outcomes.19,26,27 To ensurethat these standard errors and tests also accounted for clustering, weapplied the delta method to the robust variance-covariance matrixestimates obtained using the Huber-White estimator. A probabilityvalue of 0.05 or less was used as the criterion for statisticalsignificance in all analyses, without adjustment for multiple com-parisons due to differing views about the appropriate null hypothe-sis.28 The institutional review boards at all 6 study hospitalsapproved this study. The authors had full access to the data and takeresponsibility for its integrity. All authors have read and agree to themanuscript as written.
ResultsTable 1 describes the demographic characteristics of the“Looking Back” and “Looking Forward” cohorts. The “Look-ing Back” cohort was older (82.0 years versus 80.3 years),had a slightly lower proportion with Medicaid coinsurance(31.3% versus 33.9%), and a higher proportion of whites(74.6% versus 71.9%) than the “Looking Forward” cohort.The demographic characteristics of the “Looking Back”cohort were derived from each patient’s first hospitalization,which may or may not have been for HF. As a result, the“Looking Back” cohort had a higher prevalence of surgicalDRGs than the “Looking Forward” cohort (9.3% to 3.5%).
Table 1. Patient Characteristics
Characteristics “Looking Forward” Cohort “Looking Back” Cohort
Total, n 3999 1639
Mean age 80.3 (SD�8.2; 77.4–81.8) 82.0 (SD�8.2; 78.3–83.9)
Male gender, % 48.1 (43.7–50.8) 50.8 (36.3–55.6)
White ethnicity, % 71.9 (38.7–86.3) 74.6 (40.3–89.0)
Hispanicethnicity, %
4.8 (0.0–10.6) 3.7 (0.0–6.1)
Black ethnicity, % 11.4 (3.3–15.8) 10.4 (4.4–15.8)
Other ethnicity, % 11.9 (2.1–37.6) 11.3 (2.1–37.8)
Medicaidcoinsurance, %
33.9 (7.4–55.8) 31.3 (7.3–53.6)
Surgical DRG, % 3.5 (1.1–4.9) 9.3 (6.1–11.5)
Site A, % 11.4 12.0
Site B, % 4.6 5.6
Site C, % 19.1 19.6
Site D, % 13.2 13.1
Site E, % 13.4 14.3
Site F, % 38.3 35.6
Ranges are provided in parentheses across the 6 medical centers.
Ong et al Looking Forward, Looking Back 3
by guest on October 14, 2014http://circoutcomes.ahajournals.org/Downloaded from

We report the risk-adjusted mean values by site formortality rates, total hospital days, and indexed total directhospital costs at 180-days (Table 2). We only analyzedadjusted mortality for the “Looking Forward” cohort (Figure1). Across sites, the difference between the highest andlowest adjusted mortality increased with longer follow-upperiods. The adjusted mortality estimates ranged from 2.2%
to 4.7% for inpatient mortality, from 5.1% to 8.8% for 30-daymortality, and from 17.0% to 26.0% for 180-day mortality.There were no significant differences between sites forinpatient or 30-day mortality. However, the site with the lowest180-day mortality (site F) was significantly lower than sites A,D, and E; site C also was significantly lower than site A.
Across sites, the adjusted mean number of hospital days at180-days ranged from 9.1 days to 21.7 days for the “LookingBack” cohort, and from 7.8 days to 14.9 days for the“Looking Forward” cohort (Table 3 and Figure 2). Thisdifference in ranges was 44% less in the “Looking Forward”cohort than in the “Looking Back” cohort (7.0 days versus12.6 days, respectively). The rank order for total hospital daysbetween the “Looking Back” and “Looking Forward” cohortsdiffered for 4 of the 6 sites; only the sites with the highest andlowest ranks stayed the same across cohorts (Table 4). The 4sites that changed ranks did not significantly differ from eachother on mean total hospital days in either cohort. Site F wassignificantly higher than all other sites in both cohorts,whereas site D also was significantly lower than sites C andE in the “Looking Back” cohort.
Across sites, the adjusted mean indexed value of totaldirect hospital costs at 180-days ranged from 0.91 to 1.79 forthe “Looking Back” cohort, and from 0.66 to 1.30 for the“Looking Forward” cohort (Table 3 and Figure 3). Thisdifference in ranges for nonindexed values was 27% less in
Table 2. 180-Day Mortality: “Looking Forward” Cohorts
“Looking Forward” Mortality, %
Site180-d Mortality
(Unadjusted)
180-d Mortality (Adjusted)
Estimate 95% CI
A 21.7 26.0*,** (21.7–30.4)
B 21.9 22.7 (16.5–28.9)
C 18.4 19.1 (16.2–22.0)
D 21.6 22.9† (19.3–26.5)
E 20.5 21.6‡ (17.9–25.3)
F 19.1 17.0 (15.1–18.8)
*Significantly different from site F at P�0.001.†Significantly different from site F at P�0.01.‡Significantly different from site F at P�0.05.§Significantly different from site E at P�0.01.�Significantly different from site E at P�0.05.¶Significantly different from site C at P�0.001.**Significantly different from site C at P�0.05.
Figure 1. “Looking Forward” cohort inpatient, 30-day, and 180-day mortality rates.
4 Circ Cardiovasc Qual Outcomes November 2009
by guest on October 14, 2014http://circoutcomes.ahajournals.org/Downloaded from

the “Looking Forward” cohort than in the “Looking Back”cohort. The rank order for total direct costs between the“Looking Back” and “Looking Forward” cohorts differed for4 of the 6 sites; only the sites with the highest and lowestranks stayed the same across cohorts (Table 4). Of the 4 sitesthat changed ranks, 2 pairs switched rank orders. These pairsdid not significantly differ from each other on mean totaldirect costs in either cohort. Site F was significantly higherthan all sites, and site D was significantly lower from site E,in both cohorts. In addition, site E was significantly higherthan site A in the “Looking Back” cohort, and site C wassignificantly higher from sites A and D in the “LookingForward” cohort.
For the “Looking Forward” cohort, the Spearman rankcorrelation coefficient between adjusted mortality and ad-justed total hospital days at 180-days was �0.68 (P�0.12),and between adjusted mortality and adjusted indexed totaldirect costs at 180-days was �0.93 (P�0.01). Site F had thehighest hospital use by both measures, but it also had thelowest mortality. Dropping site F from the analysis changedthe correlation estimates for the 180-day outcomes to �0.45(P�0.43) and �0.88 (P�0.04), respectively. Similarly, theSpearman rank correlation coefficient between adjusted 180-day mortality and adjusted initial hospitalization total hospitaldays was �0.45 (P�0.36), and between adjusted 180-daymortality and adjusted initial hospitalization indexed totaldirect costs was �0.87 (P�0.02). The Spearman rank corre-lation coefficients between the “Looking Forward” and
“Looking Back” cohorts were 0.62 (P�0.17) for adjustedtotal hospital days (Figure 4) and 0.87 (P�0.02) for adjustedindexed total direct costs at 180-days (Figure 5).
Sensitivity AnalysesWe conducted the following sensitivity analyses to assess therobustness of our findings: (1) analyses of the “LookingForward” and “Looking Back” cohorts that included individ-uals with missing cost data (Appendix 2), (2) analyses thatused total costs instead of direct costs (Appendix 3), (3)analyses that included initial hospitalizations for patientstransferred from other hospitals, transplant patients, andpatients in surgical DRGs besides valve replacement orpacemaker placement (Appendix 4), (4) analyses of the“Looking Forward” cohort using all initial HF hospitaliza-tions, including multiple initial hospitalizations for the samepatient (Appendix 5), and (5) analyses of subsamples fromthe “Looking Forward” and “Looking Back” cohorts thatincluded clinical laboratory values at admission (blood ureanitrogen, serum creatinine) as covariates in the multivariateregression models (Appendix 6). We did not use laboratoryvalues in the main analyses as they were available only for anunevenly distributed subset of patients. We found that theresults of the sensitivity analyses exhibited the same patternsas the findings of the main analyses (data not shown). Inaddition, associations between adjusted outcome variables atthe hospital level were very similar, in both magnitude andstatistical significance, when we estimated weighted Pearson
Table 3. 180-Day Total Hospital Days and Indexed Total Direct Costs: “Looking Forward” and “Looking Back” Cohorts
“Looking Forward” Use “Looking Back” Use
Site180-d Total Hospital Days
(Unadjusted)
180-d Total Hospital Days(Adjusted)
180-d Total Hospital Days(Unadjusted)
180-d Total Hospital Days(Adjusted)
Estimate 95% CI Estimate 95% CI
A 8.25 8.24* (7.25–9.23) 11.18 11.08* (8.93–13.23)
B 8.53 9.54* (7.22–11.85) 9.96 10.27* (6.36–14.19)
C 8.98 8.79* (7.96–9.62) 11.71 12.58* (10.38–14.78)
D 7.55 7.84* (6.92–8.76) 8.62 9.14*§** (7.23–11.06)
E 8.34 8.82* (7.92–9.71) 12.27 13.39* (11.16–15.63)
F 15.38 14.86 (13.96–15.77) 23.78 21.73 (19.66–23.79)
Site180-d Indexed Total Direct
Costs (unadjusted)
180-d Indexed Total DirectCosts (Adjusted) 180-d Indexed Total Direct
Costs (unadjusted)
180-d Indexed Total DirectCosts (Adjusted)
Estimate 95% CI Estimate 95% CI
A 0.77 0.75*,** (0.64–0.85) 1.07 0.97*� (0.72–1.23)
B 0.85 0.83* (0.63–1.04) 0.99 0.95† (0.42–1.48)
C 0.92 0.90* (0.81–0.99) 1.15 1.26† (0.96–1.55)
D 0.65 0.66*§¶ (0.57–0.76) 0.83 0.91*§ (0.69–1.14)
E 0.85 0.87* (0.77–0.97) 1.31 1.39‡ (1.13–1.65)
F 1.30 1.30 (1.21–1.39) 1.89 1.79 (1.61–1.97)
*Significantly different from site F at P�0.001.†Significantly different from site F at P�0.01.‡Significantly different from site F at P�0.05.§Significantly different from site E at P�0.01.�Significantly different from site E at P�0.05.¶Significantly different from site C at P�0.001.**Significantly different from site C at P�0.05.
Ong et al Looking Forward, Looking Back 5
by guest on October 14, 2014http://circoutcomes.ahajournals.org/Downloaded from

correlations instead of Spearman rank correlations (eg,r��0.79 [P�0.046] between adjusted mortality and adjustedtotal hospital days; r��0.86 [P�0.017] between adjustedmortality and adjusted indexed total direct costs at 180-days).
DiscussionPrior studies of variation in hospital resource use that focusonly on expired patients have been interpreted to mean thathospitals with low resource use should be regarded asperformance benchmarks. Our findings agree with previ-ous investigators that such benchmarking based only on
expired individuals should be viewed with caution,29
particularly when benchmarking is extrapolated beyondexpired individuals.4 – 6 First, and most importantly, thisstudy identified substantial variation among the 6 studyhospitals on adjusted mortality rates in the “LookingForward” cohort, particularly when observed for 180 daysafter the initial admission. This health outcome variationalso was inversely correlated with resource use variation,meaning that hospitals with higher adjusted resource usewithin 180 days after an initial hospitalization also hadlower adjusted mortality.
Figure 2. 180-day total hospital days for the “Looking Back” and “Looking Forward” cohorts.
Table 4. Ranks for 180-Day Mortality, Total Hospital Days, and Indexed Total Direct Costs: “Looking Forward” and “Looking Back”Cohorts
Cohort Outcome Rank Measure Site A Site B Site C Site D Site E Site F
“Looking Forward” 180-d total hospital days Point estimate of rank 2 5 3 1 4 6
Mean rank 2.25 4.15 3.47 1.53 3.60 6.00
Standard deviation 1.05 1.28 0.98 0.82 1.00 0.00
180-d indexed total direct costs Point estimate of rank 2 3 5 1 4 6
Mean rank 2.20 3.27 4.33 1.19 4.02 6.00
Standard deviation 0.67 1.19 0.74 0.43 0.77 0.03
180-d mortality Point estimate of rank 6 4 2 5 3 1
Mean rank 5.58 4.10 2.27 4.25 3.63 1.17
Standard deviation 0.71 1.41 0.78 0.97 1.03 0.41
“Looking Back” 180-d total hospital days Point estimate of rank 3 2 4 1 5 6
Mean rank 2.77 2.39 3.92 1.38 4.54 6.00
Standard deviation 0.87 1.23 0.84 0.58 0.67 0.00
180-d indexed total direct costs Point estimate of rank 3 2 4 1 5 6
Mean rank 2.29 2.33 3.92 1.80 4.69 5.98
Standard deviation 0.88 1.34 0.78 0.75 0.58 0.16
Mean rank and standard deviations are calculated over 1000 iterations.
6 Circ Cardiovasc Qual Outcomes November 2009
by guest on October 14, 2014http://circoutcomes.ahajournals.org/Downloaded from

Second, the patterns of resource use across hospitals werenot the same between the “Looking Forward” and “LookingBack” cohorts; the only consistent pattern was that site 6 hadthe highest level and site 4 had the lowest level of resourceuse in both cohorts, when measured by either use measure.However, changes in rank order occurred among sites that didnot significantly differ from each other; simple reporting ofmeans without accounting for significant differences, al-though simpler for general audiences, may result in incorrectassumptions that sites truly differ from each other on usemeasures. Further, the study hospitals varied considerably inthe size of the difference between risk-adjusted use measuresderived from all patients and measures derived only fromexpired patients.
The 1.5-fold difference across the 6 study hospitals inrisk-adjusted 180-day mortality among elderly Medicarepatients hospitalized for HF challenges the notion that studiesof expired patients provide valid and useful information onhospital efficiency, which should be measured by bothresource use and health outcomes. Although prior studieshave demonstrated mortality variation across hospitals for HFpatients,7 we also found negative correlations between mea-sures of resource use and 180-day mortality across the studyhospitals. Although we do not intend to suggest that thiscorrelation implies a causal relationship between more re-sources and better outcomes, it does suggest a need for furtherwork to explore how care processes and resource use duringan initial hospitalization and subsequent visits influencehealth outcomes. Although hospitals with excellent adherenceto evidence-based process measures30 have slightly lower
risk-adjusted mortality than hospitals with poorer adher-ence,7,31 these widely accepted process measures are unlikelyto drive the substantial differences in resource use that weobserved across teaching hospitals in a single state.
The authors of prior studies of variations in hospitalresource use have acknowledged that use must be weighedwith outcomes to assess efficiency. However, the commonpractice of restricting analyses to expired individuals (whichis represented with our “Looking Back” approach) ignoresoutcome differences and overlooks the real possibility thatresource use influences outcomes. The relationship betweenhospital efficiency and quality of care is complex,32–36 andfocusing on expired individuals is likely to be overly simplis-tic. Appropriate estimation of the value of health carespending requires assessment of potential outcome differ-ences and cannot be done with a “Looking Back” approach.We believe that future studies should use the “LookingForward” approach to ensure that important outcomes are notmissed. Furthermore, clinicians have very limited ability toidentify patients who are destined to die within 6 months andselectively withhold health care resources from those pa-tients.37–39 Although studying only expired patients is expe-dient because of human subject protection issues that applyonly to living individuals,40 a better solution is to studydatabases that include all individuals and to not ignore healthoutcomes.
The methods we used differed in several ways from themethods used in prior studies of variations in hospitalresource use, but in most cases the changes in methodsstrengthened the study. Notably, we examined patients with a
Figure 3. 180-day indexed total direct costs for the “Looking Back” and “Looking Forward” cohorts.
Ong et al Looking Forward, Looking Back 7
by guest on October 14, 2014http://circoutcomes.ahajournals.org/Downloaded from

principal diagnosis of HF, whereas prior studies includedpatients with a principal or secondary diagnosis of HF. Wechose to be more restrictive to enhance the clinical homoge-neity of the study cohort, because resource use patterns arelikely to be driven by the principal diagnosis. For instance,use of resources to care for a patient who is hospitalized forhip fracture will differ from the use of resources to care for apatient who is hospitalized for HF, even if the hip fracturepatient receives some treatment for HF. Similarly, we ex-cluded patients whose clinical characteristics were likely toskew use patterns. Transfer11–14 and transplant patients41–43
often have unmeasured severity of illness beyond what can becaptured by diagnosis codes or comorbid conditions.44 Hos-pitalizations associated with surgery incur additional resourceuse and convalescence that occurs with surgical procedures.Future studies should exclude these types of patients, becausethese types of patients can vary substantially across hospitals.Of note, although the proportion of patients in the excludedcategories varied substantially across hospitals, sensitivityanalyses that included these patients also found substantialhealth outcome variation between sites that were inverselycorrelated with resource use variation.
We also expanded on the risk-adjustment methodologyused by prior studies of variations in hospital resource use,1–3
which only adjusted for age, gender, ethnicity, and thepresence of 12 chronic conditions. Our regression modelsadjusted for age, gender, ethnicity, 21 comorbid conditions,
dual Medicaid eligibility (to partially account for socioeco-nomic status), and admission year (to account for seculartrends in clinical practice). In addition, we performed sensi-tivity analyses that adjusted for selected clinical laboratoryvalues as well. Risk-adjustment methods using administrativedata are subject to potential biases from unmeasured riskfactors and other differences in care.45 Although the risk-adjustment methods we used cannot capture all differencesacross HF patients at different hospitals, we use a compre-hensive list of covariates that are similar to other validatedrisk adjustment models for HF,45 and we also find similarresults with our sensitivity analyses using clinical laboratoryvalues that may capture some of these unmeasured riskfactors.
Our study has additional limitations. First, excluding indi-viduals with missing cost data could affect internal validity ofthis study if there was a systematic pattern of missingness,such as related to severity of illness. However, the underlyingcause of missing cost data were attributable to a knownvariable (in this case, time), and inclusion of these individualsactually strengthens our findings of mortality differencesbetween sites (Appendix 2).
Second, because we used administrative data from the 6study hospitals, we were unable to identify hospitalizations atother hospitals or include them in our calculations of resourceuse. However, prior studies suggest very high “hospitalloyalty” among patients hospitalized for chronic illnesses46;
Figure 4. 180-day total hospital days for the “Looking Back” and “Looking Forward” cohorts.
8 Circ Cardiovasc Qual Outcomes November 2009
by guest on October 14, 2014http://circoutcomes.ahajournals.org/Downloaded from

specifically, these studies found that chronically ill patientswho were hospitalized in any of our 6 study hospitals had80% to 90% of their total hospital days in the same hospital.47
Third, because of lack of data, our study could not accountfor outpatient use. It is possible that the rank ordering ofhospitals on resource use and the relationship between re-source use and mortality would have changed if we had beenable to include outpatient care.
Fourth, by counting hospital days and costs for all hospi-talizations during the 180-day period of analysis for eachpatient, we included resource use that may not be directlyattributable to the study condition, HF. However, we adoptedthis approach for comparability with prior studies, andanalyses of days and costs for initial hospitalizations alonefound similar variation across hospitals as our main analyses.
Fifth, even the direct cost values from one site mayincorporate other costs (eg, teaching costs) that would havebeen attributed differently at another site. However, thesimilar associations observed between 180-day mortality andboth resource use measures, total direct costs and totalhospital days, suggest that total direct costs are a reasonablerepresentation of resource use.
Finally, our results may not generalize to smaller hospitalsand nonteaching hospitals, which did not participate in ourstudy. Nonetheless, our findings suggest that focusing onlyon expired patients may lead to different ranking of hospitalswith regard to resource use. More importantly, these studiesignore potentially large differences in health outcomes among
chronically ill patients. Further studies should be conductedthat include these and other hospitals to determine whethersimilar findings occur.
Assessing hospital efficiency requires that we consideroutputs as well as inputs, that is, health outcomes as well asresource use. Contrary to public discussion of variation,4–6 itis likely that not all variation is inefficient or wasteful.However, much more work is needed to truly distinguishinefficient from beneficial resource use. The 6 hospitalsinvolved in our study are currently investigating the under-lying processes and practices that contribute to the variationin resource use and outcomes for HF that we identified. Theirgoal is to improve the outcomes of patients with HF and toprovide care to those patients as efficiently as possible.
AcknowledgmentsWe gratefully acknowledge the analysis assistance by Alfonso Ang,PhD; Honghu Liu, PhD; Connie Wu, PhD; Wenyi Xiong, MS; andHaiyong Xu, PhD; and the assistance of the Chief Medical Officersat the 6 medical centers with data collection: Allan Siefkin, MD;Eugene Spiritus, MD; Angela Scioscia, MD; Ernest Ring, MD; andMichael Langberg, MD.
Sources of FundingWe gratefully acknowledge our funding from the California HealthCare Foundation (06-1311), and the in-kind support from the 6medical centers included in the study. Dr Mangione received supportfrom the Resource Centers for Minority Aging Research/Center forHealth Improvement of Minority Elderly (RCMAR/CHIME) fundedby National Institutes of Health/National Institute on Aging (P30
Figure 5. 180-day indexed total direct costs for the “Looking Back” and “Looking Forward” cohorts.
Ong et al Looking Forward, Looking Back 9
by guest on October 14, 2014http://circoutcomes.ahajournals.org/Downloaded from

AG021684) and from the UCLA Older Americans IndependenceCenter funded by the National Institutes of Health/National Instituteon Aging (5 P30 AG028748).
DisclosuresNone.
References1. Dartmouth Atlas of Health Care. The Care of Patients With Severe
Chronic Illness. Hanover, NH: Center for the Evaluative ClinicalSciences, Dartmouth Medical School; 2006.
2. Dartmouth Atlas of Health Care. Tracking the Care of Patients withSevere Chronic Illness. Lebanon, NH: The Dartmouth Institute for HealthPolicy and Clinical Practice; 2008.
3. Wennberg JE, Fisher ES, Baker L, Sharp SM, Bronner KK. Evaluatingthe efficiency of California providers in caring for patients with chronicillnesses. Health Affairs (Millwood). 2005; Supplemental Web Exclu-sives:526–43.
4. Brownlee S. Overtreated. New York: Bloomsbury USA; 2007.5. New York Times Editorial. Quality care at bargain prices. New York
Times. 2008.6. Pear R. Researchers find huge variations in end-of-life treatment. New
York Times. 2008.7. Krumholz HM, Normand S-LT, Spertus JA, Shahian DM, Bradley EH.
Measuring performance for treating heart attacks and heart failure: thecase for outcomes measurement. Health Affairs (Millwood). 2007;26:75–85.
8. Iezzoni LI, Heeren T, Foley SM, Daley J, Hughes J, Coffman GA.Chronic conditions and risk of in-hospital death. Health Serv Res. 1994;29:435–460.
9. Goff DC Jr, Pandey DK, Chan FA, Ortiz C, Nichaman MZ. Congestiveheart failure in the United States: is there more than meets the I(CDcode)? The Corpus Christi Heart Project. Arch Intern Med. 2000;160:197–202.
10. Manitoba Centre for Health Policy. Surgical/medical/obstetrical inpatientidentification. http://www.umanitoba.ca/centres/mchp/concept/dict/surgmed_inpt.html.
11. Bernard AM, Hayward RA, Rosevear J, Chun H, McMahon LF. Com-paring the hospitalizations of transfer and non-transfer patients in anacademic medical center. Acad Med. 1996;71:262–266.
12. Escarce JJ, Kelley MA. Admission source to the medical intensive careunit predicts hospital death independent of APACHE II score. JAMA.1990;264:2389–2394.
13. Gordon HS, Rosenthal GE. Impact of interhospital transfers on outcomesin an academic medical center. Implications for profiling hospital quality.Med Care. 1996;34:295–309.
14. Rosenberg AL, Hofer TP, Strachan C, Watts CM, Hayward RA.Accepting critically ill transfer patients: adverse effect on a referralcenter’s outcome and benchmark measures. Ann Intern Med. 2003;138:882–890.
15. Kahn KL, Keeler EB, Sherwood MJ, Rogers WH, Draper D, Bentow SS,Reinisch EJ, Rubenstein LV, Kosecoff J, Brook RH. Comparingoutcomes of care before and after implementation of the DRG-basedprospective payment system. JAMA. 1990;264:1984–1988.
16. Agency for Healthcare Research and Quality. HCUP ComorbiditySoftware, Version 3.2. http://www.hcup-us.ahrq.gov/toolssoftware/comorbidity/comorbidity.jsp.
17. Baldwin LM, Klabunde CN, Green P, Barlow W, Wright G. In search ofthe perfect comorbidity measure for use with administrative claims data:does it exist? Med Care. 2006;44:745–753.
18. Grogger JT, Carson RT. Models for truncated counts. J Appl Economet.1991;6:225–238.
19. StataCorp. Stata Statistical Software: Release 10. College Station, TX:StataCorp LP; 2007.
20. Graubard BI, Korn EL. Predictive margins with survey data. Biometrics.1999;55:652–659.
21. Basu A, Meltzer D. Implications of spillover effects within the family formedical cost-effectiveness analysis. J Health Econ. 2005;24:751–773.
22. Davern M, Rodin H, Blewett LA, Call KT. Are the Current PopulationSurvey uninsurance estimates too high? An examination of the imputationprocess. Health Serv Res. 2007;42:2038–2055.
23. Heslin KC, Andersen RM, Ettner SL, Cunningham WE. Racial and ethnicdisparities in access to physicians with HIV-related expertise. J GenIntern Med. 2005;20:283–289.
24. Liao TF. Interpreting Probability Models: Logit, Probit, and Other Gen-eralized Linear Models. Newbury Park, Calif: Sage Publications; 1994.
25. Manning WG, Newhouse JP, Duan N, Keeler EB, Leibowitz A. Healthinsurance and the demand for medical care: evidence from a randomizedexperiment. The Am Econ Rev. 1987;77:251–277.
26. Greene WH. Econometric Analysis. 6th Edition ed. Upper Saddle River,NJ: Pearson Prentice Hall; 2008.
27. Bishop YMM, Fienberg SE, Holland PW, (with the collaboration of LightRJ & Mosteller F). Discrete Multivariate Analysis: Theory and Practice.Cambridge, Mass: MIT Press; 1975.
28. Rothman KJ. No adjustments are needed for multiple comparisons.Epidemiology. 1990;1:43– 46.
29. Bach PB, Schrag D, Begg CB. Resurrecting treatment histories of deadpatients: a study design that should be laid to rest. JAMA. 2004;292:2765–2770.
30. Centers for Medicare and Medicaid Services. Hospital Compare. http://www.hospitalcompare.hhs.gov. Accessed July 4, 2008.
31. Werner RM, Bradlow ET. Relationship between medicare’s hospitalcompare performance measures and mortality rates. JAMA. 2006;296:2694–2702.
32. Ayanian JZ, Weissman JS. Teaching hospitals and quality of care: areview of the literature. Milbank Quarterly. 2002;80:569–593.
33. Fleming ST. The relationship between the cost and quality of hospitalcare: a review of the literature. Med Care Rev. 1990;47:487–502.
34. Morey RC, Fine DJ, Loree SW, Retzlaff-Roberts DL, Tsubakitani S. Thetrade-off between hospital cost and quality of care. An exploratoryempirical analysis. Med Care. 1992;30:677–698.
35. Siegrist RB Jr, Kane NM. Exploring the relationship between inpatienthospital costs and quality of care. Am J Manag Care. 2003;9:SP43–SP49.
36. Thomas JW, Guire KE, Horvat GG. Is patient length of stay related toquality of care? Hospit Health Serv Admin. 1997;42:489–507.
37. Poses RM, Smith WR, McClish DK, Huber EC, Clemo FL, Schmitt BP,Alexander-Forti D, Racht EM, Colenda CC III, Centor RM. Physicians’survival predictions for patients with acute congestive heart failure. ArchIntern Med. 1997;157:1001–1007.
38. Sinuff T, Adhikari NK, Cook DJ, Schunemann HJ, Griffith LE, RockerG, Walter SD. Mortality predictions in the intensive care unit: comparingphysicians with scoring systems. Crit Care Med. 2006;34:878–885.
39. Detsky AS, Stricker SC, Mulley AG, Thibault GE. Prognosis, survival,and the expenditure of hospital resources for patients in an intensive-careunit. N Engl J Med. 1981;305:667–672.
40. Protection of Human Subjects. In: Department of Health and HumanServices, ed. Code of Federal Regulations. 2005;45.
41. Angus DC, Clermont G, Kramer DJ, Linde-Zwirble WT, Pinsky MR.Short-term and long-term outcome prediction with the Acute Physiologyand Chronic Health Evaluation II system after orthotopic liver transplan-tation. Crit Care Med. 2000;28:150–156.
42. Sadaghdar H, Chelluri L, Bowles SA, Shapiro R. Outcome of renaltransplant recipients in the ICU. Chest. 1995;107:1402–1405.
43. Sawyer RG, Durbin CG, Rosenlof LK, Pruett TL. Comparison ofAPACHE II scoring in liver and kidney transplant recipients versustrauma and general surgical patients in a single intensive-care unit. ClinTransplant. 1995;9:401–405.
44. Iezzoni LI. The risks of risk adjustment. JAMA. 1997;278:1600–1607.45. Krumholz HM, Wang Y, Mattera JA, Wang Y, Han LF, Ingber MJ,
Roman S, Normand SL. An administrative claims model suitable forprofiling hospital performance based on 30-day mortality rates amongpatients with heart failure. Circulation. 2006;113:1693–1701.
46. Wennberg JE, Fisher ES, Stukel TA, Skinner JS, Sharp SM, Bronner KK.Use of hospitals, physician visits, and hospice care during last six monthsof life among cohorts loyal to highly respected hospitals in the UnitedStates. BMJ. 2004;328:607–611.
47. Hospital performance reports by state: California. 2006. http://www.dartmouthatlas.org/data/download/perf_reports/CA_HOSP_perfrpt.pdf.Accessed March 11, 2008.
10 Circ Cardiovasc Qual Outcomes November 2009
by guest on October 14, 2014http://circoutcomes.ahajournals.org/Downloaded from

1
SUPPLEMENTAL MATERIAL

2
Appendix 1: Detailed Main Analyses Appendix 1: “Looking Back”: Utilization (n = 1,639)
Site
180-Day Total Hospital
Days (unadjusted)
180-Day Total
Hospital Days
(adjusted) 95% CI A 11.18 11.08 a (8.93 - 13.23) B 9.96 10.27 a (6.36 - 14.19) C 11.71 12.58 a (10.38 - 14.78) D 8.62 9.14 a,d,g (7.23 - 11.06) E 12.27 13.39 a (11.16 - 15.63) F 23.78 21.73 (19.66 - 23.79)
Site
180-Day Indexed Total Direct Costs (unadjusted)
180-Day Indexed
Total Direct Costs
(adjusted) 95% CI A 1.07 0.97 a,e (0.72 - 1.23) B 0.99 0.95 b (0.42 - 1.48) C 1.15 1.26 b (0.96 - 1.55) D 0.83 0.91 a,d (0.69 - 1.14) E 1.31 1.39 c (1.13 - 1.65) F 1.89 1.79 (1.61 - 1.97)
Appendix 1: Looking Forward: Utilization (n = 3,999)
Site
Initial Hospitalization Length of Stay (unadjusted)
Initial Hospitalization Length of Stay
(adjusted) 95% CI
180-Day Total
Hospital Days
(unadjusted)
180-Day Total
Hospital Days
(adjusted) 95% CI A 4.51 4.62 a (4.07 - 5.16) 8.25 8.24 a (7.25 - 9.23) B 4.55 5.23 c (3.55 - 6.91) 8.53 9.54 a (7.22 - 11.85) C 5.13 4.96 a,e (4.58 - 5.35) 8.98 8.79 a (7.96 - 9.62) D 4.42 4.53 a – (4.15 - 4.91) 7.55 7.84 a (6.92 - 8.76) E 4.19 4.33 a (3.91 - 4.75) 8.34 8.82 a (7.92 - 9.71) F 7.81 7.44 – (7.08 - 7.79) 15.38 14.86 (13.96 - 15.77)
Site
Initial Hospitalization Indexed Total Direct Costs (unadjusted)
Initial Hospitalization Indexed Total Direct Costs (adjusted) 95% CI
180-Day Indexed Total Direct Costs (unadjusted)
180-Day Indexed Total Direct Costs (adjusted) 95% CI
A 0.39 0.41 a,h (0.36 - 0.45) 0.77 0.75 a,g (0.64 - 0.85) B 0.48 0.47 b (0.34 - 0.60) 0.85 0.83 a (0.63 - 1.04) C 0.52 0.51 a,e (0.47 - 0.56) 0.92 0.90 a (0.81 - 0.99) D 0.34 0.36 a,e,f (0.32 - 0.39) 0.65 0.66 a,d,f (0.57 - 0.76) E 0.42 0.44 a (0.38 - 0.49) 0.85 0.87 a (0.77 - 0.97) F 0.66 0.65 (0.61 - 0.69) 1.30 1.30 (1.21 - 1.39)

3
Appendix 1: Looking Forward: Mortality (n = 3,999)
Site
Initial Hospitalization
Mortality (unadjusted)
Initial Hospitalization
Mortality (adjusted) 95% CI
One Month Mortality
(unadjusted)
One Month Mortality
(adjusted) 95% CI
180-Day Mortality
(unadjusted)
180-Day Mortality
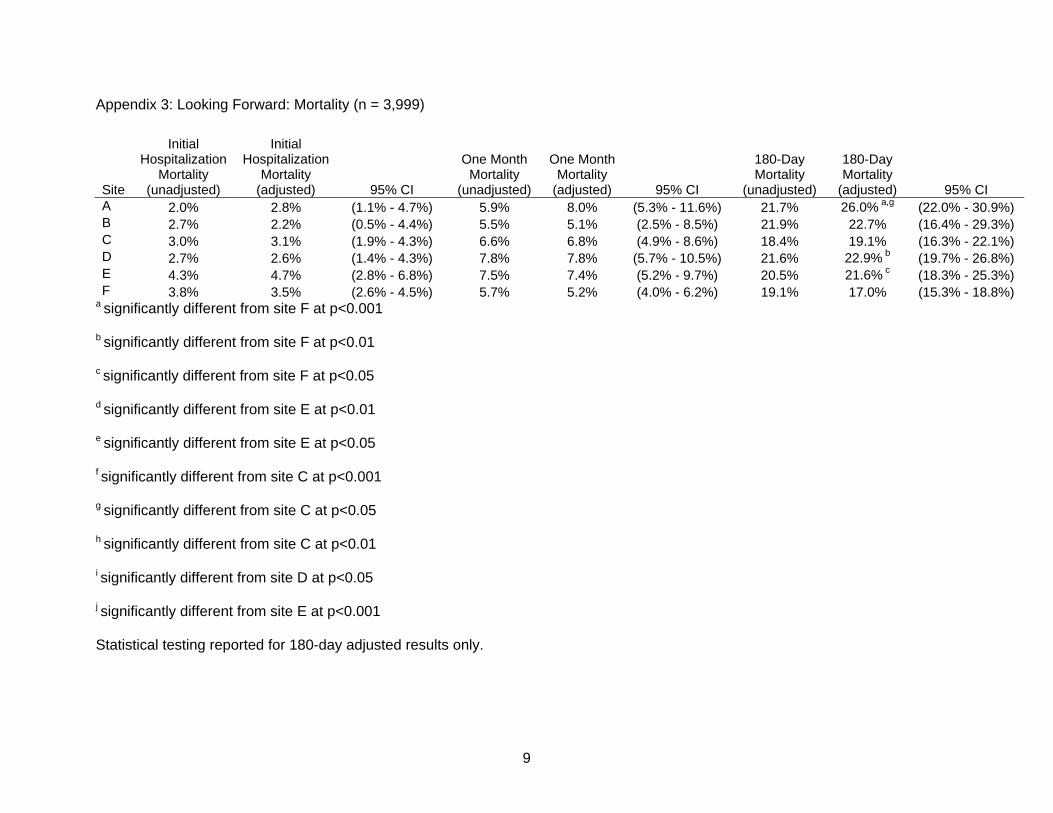
(adjusted) 95% CI A 2.0% 2.8% (0.9% - 4.6%) 5.9% 8.0% (5.0% - 11.1%) 21.7% 26.0% a,g (21.7% - 30.4%) B 2.7% 2.2% (0.3% - 4.1%) 5.5% 5.1% (2.1% - 8.1%) 21.9% 22.7% (16.5% - 28.9%) C 3.0% 3.1% (1.8% - 4.3%) 6.6% 6.8% (4.9% - 8.6%) 18.4% 19.1% (16.2% - 22.0%) D 2.7% 2.6% (1.2% - 4.0%) 7.8% 7.8% (5.5% - 10.2%) 21.6% 22.9% b (19.3% - 26.5%) E 4.3% 4.7% (2.7% - 6.7%) 7.5% 7.4% (5.2% - 9.7%) 20.5% 21.6% c (17.9% - 25.3%) F
3.8% 3.5% (2.5% - 4.5%) 5.7% 5.2% (4.1% - 6.3%) 19.1% 17.0%
(15.1% - 18.8%) a significantly different from site F at p<0.001
b significantly different from site F at p<0.01
c significantly different from site F at p<0.05
d significantly different from site E at p<0.01
e significantly different from site E at p<0.05
f significantly different from site C at p<0.001
g significantly different from site C at p<0.05
h significantly different from site C at p<0.01
Statistical testing reported for 180-day adjusted results only. Adjusted results for Looking Forward Inpatient Death and 30-Day
Mortality did not have statistically significant findings.

4
Appendix 1: Pairwise Comparison p-Values for Outcomes
Looking Forward: Total Hospital Days Site A B C D E A B 0.3160 C 0.4156 0.5559 D 0.5736 0.1783 0.1353E 0.3824 0.5681 0.9707 0.1478F 0.0000‡ 0.0000‡ 0.0000‡ 0.0000‡ 0.0000‡
Looking Forward: Indexed Total Direct Costs Site A B C D E A B 0.4709 C 0.0326* 0.5625 D 0.2365 0.1403 0.0004‡ E 0.0724 0.7257 0.6888 0.0028† F 0.0000‡ 0.0000‡ 0.0000‡ 0.0000‡ 0.0000‡
Looking Forward: 180-Day Mortality Site A B C D E A B 0.3901 C 0.0101* 0.3069 D 0.2822 0.9585 0.1013E 0.1160 0.7622 0.2927 0.6159F 0.0003‡ 0.0809 0.2271 0.0052† 0.0372*
Looking Back: Total Hospital Days Site A B C D E A B 0.7302 C 0.3325 0.3274 D 0.1884 0.6079 0.0223*E 0.1313 0.1779 0.5916 0.0056†F 0.0000‡ 0.0000‡ 0.0000‡ 0.0000‡ 0.0000‡
Looking Back: Indexed Total Direct Costs Site A B C D E A B 0.9472 C 0.1533 0.3619 D 0.7378 0.8994 0.0774 E 0.0243* 0.1560 0.4643 0.0081† F 0.0000‡ 0.0036† 0.0050† 0.0000‡ 0.0172*
*p<0.05, †p<0.01, ‡p<0.001.

5
Appendix 2: Analyses Including 711 Individuals Excluded Due to Missing Cost Data
Appendix 2: “Looking Back”: Utilization (n = 1,848)
Site
180-Day Total Hospital
Days (unadjusted)
180-Day Total
Hospital Days
(adjusted) 95% CI A 11.18 11.34 a (9.40 - 14.03) B 9.96 10.94 a (7.33 - 15.71) C 11.71 13.11 a (11.07 - 15.72) D 8.62 9.47 a,d,g (7.61 - 11.53) E 12.27 14.14 b (11.82 - 16.53) F 21.32 19.03 (17.42 - 20.81)
Site
180-Day Indexed Total Direct Costs (unadjusted)
180-Day Indexed
Total Direct Costs
(adjusted) 95% CI A 1.07 1.00 a,e (0.77 - 1.26) B 0.98 1.05 (0.61 - 1.64) C 1.14 1.29 (1.06 - 1.65) D 0.82 0.95 a,d (0.76 - 1.22) E 1.30 1.44 (1.19 - 1.70) F 1.74 1.58 (1.43 - 1.74)
Appendix 2: Looking Forward: Utilization (n = 4,710)
Site
Initial Hospitalization Length of Stay (unadjusted)
Initial Hospitalization Length of Stay
(adjusted) 95% CI
180-Day Total
Hospital Days
(unadjusted)
180-Day Total
Hospital Days
(adjusted) 95% CI A 4.47 4.59 (4.11 - 5.19) 8.26 8.47 a (7.58 - 9.57) B 4.51 5.29 (4.06 - 7.39) 8.50 9.58 a (7.54 - 12.11) C 5.06 5.03 (4.68 - 5.47) 8.87 8.92 a (8.12 - 9.91) D 4.38 4.61 (4.24 - 5.02) 7.62 8.08 a (7.20 - 9.03) E 4.10 4.36 (3.94 - 4.86) 8.26 9.02 a (8.11 - 9.93) F 7.82 7.39 (7.11 - 7.69) 15.22 14.48 (13.80 - 15.24)
Site
Initial Hospitalization Indexed Total Direct Costs (unadjusted)
Initial Hospitalization Indexed Total Direct Costs (adjusted) 95% CI
180-Day Indexed Total Direct Costs (unadjusted)
180-Day Indexed Total Direct Costs (adjusted) 95% CI
A 0.75 0.77 (0.69 - 0.86) 0.77 0.75 a,g (0.65 - 0.86) B 0.92 0.89 (0.67 - 1.19) 0.85 0.83 a (0.65 - 1.07) C 1.00 0.98 (0.89 - 1.06) 0.92 0.90 a (0.81 - 1.00) D 0.65 0.69 (0.62 - 0.76) 0.65 0.66 a,d,f (0.58 - 0.77) E 0.81 0.83 (0.74 - 0.94) 0.85 0.87 a (0.77 - 0.98) F 1.27 1.24 (1.15 - 1.30) 1.30 1.30 (1.21 - 1.39)

6
Appendix 2: Looking Forward: Mortality (n = 4,710)
Site
Initial Hospitalization
Mortality (unadjusted)
Initial Hospitalization
Mortality (adjusted) 95% CI
One Month Mortality
(unadjusted)
One Month Mortality
(adjusted) 95% CI
180-Day Mortality
(unadjusted)
180-Day Mortality
(adjusted) 95% CI A 2.0% 2.7% (1.1% - 4.7%) 5.7% 7.8% (5.0% - 11.0%) 21.4% 25.4% a,g (21.3% - 30.0%) B 2.7% 2.7% (0.7% - 5.7%) 6.6% 6.7% (3.6% - 11.1%) 23.0% 24.9% c (18.6% - 30.8%) C 3.2% 3.2% (2.0% - 4.6%) 7.1% 7.2% (5.3% - 9.1%) 19.0% 19.7% (17.0% - 22.9%) D 2.7% 2.7% (1.5% - 4.2%) 7.4% 7.7% (5.4% - 10.0%) 21.6% 23.2% a (19.8% - 26.8%) E 4.3% 4.9% (3.0% - 7.1%) 7.3% 7.5% (5.2% - 9.9%) 20.1% 20.6% c (16.9% - 24.0%) F 3.6% 3.3% (2.5% - 4.0%) 5.5% 5.1% (4.2% - 6.1%) 17.9% 16.5% (15.0% - 18.1%)
a significantly different from site F at p<0.001
b significantly different from site F at p<0.01
c significantly different from site F at p<0.05
d significantly different from site E at p<0.01
e significantly different from site E at p<0.05
f significantly different from site C at p<0.001
g significantly different from site C at p<0.05
Statistical testing reported for 180-day adjusted results only.

7
Appendix 2: Pairwise Comparison p-Values for Outcomes
Looking Forward: Total Hospital Days Site A B C D E A B 0.3766 C 0.5074 0.5938 D 0.5774 0.2180 0.1952E 0.4103 0.6493 0.8872 0.1548F 0.0000‡ 0.0001‡ 0.0000‡ 0.0000‡ 0.0000‡
Looking Forward: Indexed Total Direct Costs Site A B C D E A B 0.4872 C 0.0328* 0.5716 D 0.2520 0.1466 0.0003‡E 0.0812 0.7358 0.6911 0.0037†F 0.0000‡ 0.0001‡ 0.0000‡ 0.0000‡ 0.0000‡
Looking Forward: 180-Day Mortality Site A B C D E A B 0.8905 C 0.0353* 0.1391 D 0.4470 0.6543 0.1223 E 0.0725 0.2520 0.7027 0.3133 F 0.0002‡ 0.0126* 0.0549 0.0007‡ 0.0477*
Looking Back: Total Hospital Days Site A B C D E A B 0.8710 C 0.2880 0.3745 D 0.2340 0.5369 0.0222* E 0.0875 0.1861 0.5152 0.0036† F 0.0000‡ 0.0005‡ 0.0000‡ 0.0000‡ 0.0014†
Looking Back: Indexed Total Direct Costs Site A B C D E A B 0.8567 C 0.1428 0.4633 D 0.7873 0.7172 0.0918 E 0.0155* 0.2037 0.3888 0.0067† F 0.0002‡ 0.0544 0.0788 0.0000‡ 0.3446
*p<0.05, †p<0.01, ‡p<0.001.

8
Appendix 3: Analyses Using Indexed Total Costs Instead of Indexed Total Direct Costs Appendix 3: “Looking Back”: Utilization (n = 1,639)
Site
180-Day Total Hospital
Days (unadjusted)
180-Day Total
Hospital Days
(adjusted) 95% CI A 11.18 11.08 a (9.04 – 13.47) B 9.96 10.27 a (6.73 – 14.51) C 11.71 12.58 a (10.60 - 14.97) D 8.62 9.14 a,d,g (7.49 – 11.45) E 12.27 13.39 a (11.30 - 15.82) F 23.78 21.73 (19.81 - 24.06)
Site
180-Day Indexed Total
Costs (unadjusted)
180-Day Indexed
Total Costs (adjusted) 95% CI
A 1.17 1.09 a (0.84 - 1.34) B 0.80 0.78 a,e (0.39 - 1.31) C 1.14 1.27 b (1.02 - 1.63) D 0.77 0.87 a,d,g (0.69 - 1.12) E 1.33 1.43 b (1.20 - 1.72) F 1.99 1.88 (1.69 - 2.08)
Appendix 3: Looking Forward: Utilization (n = 3,999)
Site
Initial Hospitalization Length of Stay (unadjusted)
Initial Hospitalization Length of Stay
(adjusted) 95% CI
180-Day Total
Hospital Days
(unadjusted)
180-Day Total
Hospital Days
(adjusted) 95% CI A 4.51 4.62 (4.14 - 5.26) 8.25 8.24 a (7.28 - 9.32) B 4.55 5.23 (3.87 - 7.10) 8.53 9.54 a (7.51 - 12.24) C 5.13 4.96 (4.57 - 5.33) 8.98 8.79 a (8.02 - 9.67) D 4.42 4.53 (4.18 - 4.94) 7.55 7.84 a (7.00 - 8.83) E 4.19 4.33 (3.92 - 4.74) 8.34 8.82 a (7.95 - 9.75) F 7.81 7.44 (7.09 - 7.80) 15.38 14.86 (13.89 - 15.77)
Site
Initial Hospitalization Indexed Total
Costs (unadjusted)
Initial Hospitalization Indexed Total
Costs (adjusted) 95% CI
180-Day Indexed Total
Costs (unadjusted)
180-Day Indexed Total
Costs (adjusted) 95% CI
A 0.83 0.86 (0.76 - 0.96) 0.85 0.82 a,i (0.72 - 0.95) B 0.75 0.74 (0.57 - 0.98) 0.70 0.69 a,e,g (0.54 - 0.89) C 0.99 0.98 (0.90 - 1.06) 0.90 0.89 a (0.81 - 0.98) D 0.64 0.68 (0.62 - 0.76) 0.62 0.64 a,f,j (0.57 - 0.74) E 0.82 0.85 (0.75 - 0.96) 0.86 0.89 a (0.79 - 1.00) F 1.27 1.23 (1.16 - 1.30) 1.31 1.31 (1.22 - 1.40)
9
Appendix 3: Looking Forward: Mortality (n = 3,999)
Site
Initial Hospitalization
Mortality (unadjusted)
Initial Hospitalization
Mortality (adjusted) 95% CI
One Month Mortality
(unadjusted)
One Month Mortality
(adjusted) 95% CI
180-Day Mortality
(unadjusted)
180-Day Mortality
(adjusted) 95% CI A 2.0% 2.8% (1.1% - 4.7%) 5.9% 8.0% (5.3% - 11.6%) 21.7% 26.0% a,g (22.0% - 30.9%) B 2.7% 2.2% (0.5% - 4.4%) 5.5% 5.1% (2.5% - 8.5%) 21.9% 22.7% (16.4% - 29.3%) C 3.0% 3.1% (1.9% - 4.3%) 6.6% 6.8% (4.9% - 8.6%) 18.4% 19.1% (16.3% - 22.1%) D 2.7% 2.6% (1.4% - 4.3%) 7.8% 7.8% (5.7% - 10.5%) 21.6% 22.9% b (19.7% - 26.8%) E 4.3% 4.7% (2.8% - 6.8%) 7.5% 7.4% (5.2% - 9.7%) 20.5% 21.6% c (18.3% - 25.3%) F 3.8% 3.5% (2.6% - 4.5%) 5.7% 5.2% (4.0% - 6.2%) 19.1% 17.0% (15.3% - 18.8%)
a significantly different from site F at p<0.001
b significantly different from site F at p<0.01
c significantly different from site F at p<0.05
d significantly different from site E at p<0.01
e significantly different from site E at p<0.05
f significantly different from site C at p<0.001
g significantly different from site C at p<0.05
h significantly different from site C at p<0.01
i significantly different from site D at p<0.05
j significantly different from site E at p<0.001
Statistical testing reported for 180-day adjusted results only.

10
Appendix 3: Pairwise Comparison p-Values for Outcomes
Looking Forward: Total Hospital Days Site A B C D E A B 0.3287 C 0.4127 0.5660 D 0.5842 0.1828 0.1310E 0.3989 0.5766 0.9712 0.1515F 0.0000‡ 0.0001‡ 0.0000‡ 0.0000‡ 0.0000‡
Looking Forward: Indexed Total Costs Site A B C D E A B 0.2039 C 0.3664 0.0409* D 0.0144* 0.6174 0.0001‡ E 0.3789 0.0466* 0.9864 0.0004‡ F 0.0000‡ 0.0000‡ 0.0000‡ 0.0000‡ 0.0000‡
Looking Forward: 180-Day Mortality Site A B C D E A B 0.3995 C 0.0117* 0.3125 D 0.2892 0.9590 0.0993E 0.1163 0.7656 0.2969 0.6464F 0.0003‡ 0.0867 0.2279 0.0045† 0.0343*
Looking Back: Total Hospital Days Site A B C D E A B 0.7336 C 0.3422 0.3329 D 0.1977 0.6122 0.0203*E 0.1250 0.1839 0.5842 0.0046†F 0.0000‡ 0.0000‡ 0.0000‡ 0.0000‡ 0.0000‡
Looking Back: Indexed Total Costs Site A B C D E A B 0.2655 C 0.3594 0.1125 D 0.2080 0.7209 0.0339* E 0.0643 0.0193* 0.3627 0.0011† F 0.0000‡ 0.0000‡ 0.0012† 0.0000‡ 0.0082†
*p<0.05, †p<0.01, ‡p<0.001.

11
Appendix 4: Analyses Including Transfer Patients, Transplant Patients, and Patients With Surgical DRGs Appendix 4: “Looking Back”: Utilization (n = 1,756)
Site
180-Day Total Hospital
Days (unadjusted)
180-Day Total
Hospital Days
(adjusted) 95% CI A 11.29 11.38 a (9.47 – 13.57) B 9.77 9.85 a (6.79 – 14.25) C 12.89 13.39 a (11.48 - 15.72) D 9.56 10.10 a,e,g (8.11 – 12.27) E 12.37 13.36 a (11.40 - 15.96) F 24.35 22.63 (20.59 - 25.13)
Site
180-Day Indexed Total Direct Costs (unadjusted)
180-Day Indexed
Total Direct Costs
(adjusted) 95% CI A 0.97 0.93 a,e (0.71 - 1.18) B 0.85 0.75 a (0.38 - 1.37) C 1.22 1.26 c (1.01 - 1.55) D 0.86 0.92 a,e (0.73 - 1.17) E 1.18 1.25 b (1.03 - 1.50) F 1.75 1.70 (1.55 - 1.89)
Appendix 4: Looking Forward: Utilization (n = 4,249)
Site
Initial Hospitalization Length of Stay (unadjusted)
Initial Hospitalization Length of Stay
(adjusted) 95% CI
180-Day Total
Hospital Days
(unadjusted)
180-Day Total
Hospital Days
(adjusted) 95% CI A 4.61 4.96 (4.51 - 5.67) 8.33 8.69 a,h (7.70 - 9.81) B 4.56 5.01 (3.89 - 7.11) 8.44 9.18 a (7.35 - 11.80) C 7.07 6.68 (6.07 - 7.47) 11.14 10.73 a,d (9.81 - 11.80) D 4.84 5.11 (4.65 - 5.77) 8.10 8.51 a,h (7.64 - 9.71) E 4.51 4.70 (4.31 - 5.17) 8.55 9.00 a (8.18 - 9.94) F 8.33 7.89 (7.51 - 8.35) 16.00 15.42 (14.57 - 16.39)
Site
Initial Hospitalization Indexed Total Direct Costs (unadjusted)
Initial Hospitalization Indexed Total Direct Costs (adjusted) 95% CI
180-Day Indexed Total Direct Costs (unadjusted)
180-Day Indexed Total Direct Costs (adjusted) 95% CI
A 0.65 0.77 (0.69 - 0.88) 0.69 0.73 a,f (0.64 - 0.84) B 0.75 0.80 (0.62 - 1.09) 0.72 0.75 a,g (0.59 - 0.98) C 1.37 1.06 (0.97 - 1.17) 1.15 0.97 a (0.88 - 1.08) D 0.64 0.67 (0.60 - 0.75) 0.66 0.67 a,d,f (0.58 - 0.77) E 0.75 0.81 (0.72 - 0.93) 0.79 0.86 a (0.77 - 0.96) F 1.13 1.20 (1.12 - 1.29) 1.22 1.27 (1.19 - 1.37)

12
Appendix 4: Looking Forward: Mortality (n = 4,249)
Site
Initial Hospitalization
Mortality (unadjusted)
Initial Hospitalization
Mortality (adjusted) 95% CI
One Month Mortality
(unadjusted)
One Month Mortality
(adjusted) 95% CI
180-Day Mortality
(unadjusted)
180-Day Mortality
(adjusted) 95% CI A 2.7% 3.8% (2.1% - 6.3%) 6.8% 9.4% (6.5% - 12.9%) 22.4% 27.6% a,e,h (23.3% - 31.8%) B 2.6% 2.5% (0.6% - 5.1%) 6.3% 5.7% (2.7% - 9.1%) 22.1% 22.4% (16.8% - 28.9%) C 3.9% 3.7% (2.5% - 5.1%) 6.2% 6.3% (4.6% - 8.0%) 19.2% 20.0% (17.4% - 22.7%) D 3.2% 3.2% (1.9% - 4.9%) 8.1% 7.9% (5.5% - 10.3%) 22.9% 23.9% b (20.2% - 27.5%) E 4.7% 5.3% (3.4% - 7.4%) 7.6% 7.8% (5.5% - 10.2%) 20.1% 21.4% c (18.0% - 25.4%) F 4.3% 3.9% (3.0% - 4.9%) 5.5% 5.1% (4.1% - 6.3%) 19.3% 17.0% (15.1% - 18.9%)
a significantly different from site F at p<0.001
b significantly different from site F at p<0.01
c significantly different from site F at p<0.05
d significantly different from site E at p<0.01
e significantly different from site E at p<0.05
f significantly different from site C at p<0.001
g significantly different from site C at p<0.05
h significantly different from site C at p<0.01
Statistical testing reported for 180-day adjusted results only.

13
Appendix 4: Pairwise Comparison p-Values for Outcomes
Looking Forward: Total Hospital Days Site A B C D E A B 0.7025 C 0.0050† 0.2226 D 0.7993 0.5935 0.0015† E 0.6484 0.8860 0.0091† 0.4851 F 0.0000‡ 0.0000‡ 0.0000‡ 0.0000‡ 0.0000‡
Looking Forward: Indexed Total Direct Costs Site A B C D E A B 0.8944 C 0.0007‡ 0.0440* D 0.3400 0.4536 0.0000‡ E 0.0758 0.3040 0.0744 0.0057† F 0.0000‡ 0.0000‡ 0.0000‡ 0.0000‡ 0.0000‡
Looking Forward: 180-Day Mortality Site A B C D E A B 0.1800 C 0.0043† 0.4902 D 0.1985 0.6832 0.0752 E 0.0272* 0.7927 0.5186 0.3306 F 0.0000‡ 0.0934 0.0846 0.0011† 0.0397*
Looking Back: Total Hospital Days Site A B C D E A B 0.4791 C 0.1693 0.1240 D 0.3904 0.9069 0.0328* E 0.1883 0.1151 0.9817 0.0348* F 0.0000‡ 0.0000‡ 0.0000‡ 0.0000‡ 0.0000‡
Looking Back: Indexed Total Direct Costs Site A B C D E A B 0.5224 C 0.0650 0.0991 D 0.9365 0.5107 0.0631 E 0.0492* 0.0656 0.9422 0.0342* F 0.0000‡ 0.0003‡ 0.0115* 0.0000‡ 0.0030†
*p<0.05, †p<0.01, ‡p<0.001

14
Appendix 5: Analyses Allowing for Individuals to Have Multiple Episodes.
Appendix 5: “Looking Back”: Utilization (n = 1,639)
Site
180-Day Total Hospital
Days (unadjusted)
180-Day Total
Hospital Days
(adjusted) 95% CI A 11.18 11.08 a (9.04 – 13.47) B 9.96 10.27 a (6.73 – 14.51) C 11.71 12.58 a (10.60 - 14.97) D 8.62 9.14 a,d,g (7.49 – 11.45) E 12.27 13.39 a (11.30 - 15.82) F 23.78 21.73 (19.81 - 24.06)
Site
180-Day Indexed Total Direct Costs (unadjusted)
180-Day Indexed
Total Direct Costs
(adjusted) 95% CI A 1.07 0.97 a,e (0.74 - 1.21) B 0.99 0.95 b (0.50 - 1.59) C 1.15 1.26 b (1.01 - 1.62) D 0.83 0.91 a,d (0.72 - 1.18) E 1.31 1.39 c (1.16 - 1.69) F 1.89 1.79 (1.61 - 1.98)
Appendix 5: Looking Forward: Utilization (n = 4,508)
Site
Initial Hospitalization Length of Stay (unadjusted)
Initial Hospitalization Length of Stay
(adjusted) 95% CI
180-Day Total
Hospital Days
(unadjusted)
180-Day Total
Hospital Days
(adjusted) 95% CI A 4.34 4.36 (3.91 - 4.95) 8.14 8.12 a (7.21 - 9.12) B 4.52 5.21 (4.01 - 7.12) 8.56 9.49 a (7.61 - 11.75) C 5.03 4.89 (4.53 - 5.26) 8.91 8.81 a (8.01 - 9.60) D 4.35 4.43 (4.06 - 4.79) 7.73 7.99 a (7.13 - 8.91) E 4.12 4.24 (3.89 - 4.71) 8.31 8.88 a (8.09 - 9.79) F 7.73 7.39 (7.04 - 7.70) 15.49 14.89 (14.12 - 15.78)
Site
Initial Hospitalization Indexed Total Direct Costs (unadjusted)
Initial Hospitalization Indexed Total Direct Costs (adjusted) 95% CI
180-Day Indexed Total Direct Costs (unadjusted)
180-Day Indexed Total Direct Costs (adjusted) 95% CI
A 0.73 0.75 (0.67 - 0.83) 0.75 0.73 a,e,g (0.63 - 0.82) B 0.91 0.89 (0.69 - 1.19) 0.84 0.82 a (0.65 - 1.04) C 0.98 0.97 (0.89 - 1.05) 0.90 0.89 a (0.82 - 0.98) D 0.65 0.68 (0.62 - 0.74) 0.66 0.67 a,d,f (0.59 - 0.78) E 0.78 0.82 (0.73 - 0.93) 0.83 0.88 a (0.79 - 0.97) F 1.28 1.25 (1.19 - 1.34) 1.30 1.29 (1.21 - 1.38)

15
Appendix 5: Looking Forward: Mortality (n = 4,508)
Site
Initial Hospitalization
Mortality (unadjusted)
Initial Hospitalization
Mortality (adjusted) 95% CI
One Month Mortality
(unadjusted)
One Month Mortality
(adjusted) 95% CI
180-Day Mortality
(unadjusted)
180-Day Mortality
(adjusted) 95% CI A 1.7% 2.5% (1.1% - 4.5%) 5.4% 7.7% (5.1% - 10.7%) 20.4% 25.2% a,e,h (21.0% - 29.4%) B 3.0% 2.4% (0.8% - 4.9%) 6.5% 6.1% (3.2% - 10.0%) 21.4% 22.5% c (17.1% - 29.4%) C 2.9% 3.0% (1.9% - 4.3%) 6.4% 6.6% (4.9% - 8.4%) 17.6% 18.3% (15.4% - 20.8%) D 2.4% 2.3% (1.2% - 3.7%) 7.0% 7.1% (5.1% - 9.5%) 20.9% 22.0% b (18.5% - 25.6%) E 3.7% 4.0% (2.6% - 5.9%) 6.7% 6.7% (5.0% - 8.8%) 19.0% 20.0% c (17.0% - 23.5%) F 3.5% 3.2% (2.3% - 4.1%) 5.2% 4.7% (3.7% - 5.7%) 17.6% 15.5% (13.9% - 17.2%)
a significantly different from site F at p<0.001
b significantly different from site F at p<0.01
c significantly different from site F at p<0.05
d significantly different from site E at p<0.01
e significantly different from site E at p<0.05
f significantly different from site C at p<0.001
g significantly different from site C at p<0.05
h significantly different from site C at p<0.01
Statistical testing reported for 180-day adjusted results only.

16
Appendix 5: Pairwise Comparison p-Values for Outcomes
Looking Forward: Total Hospital Days Site A B C D E A B 0.2434 C 0.2759 0.5557 D 0.8476 0.2010 0.1823 E 0.2335 0.5945 0.9162 0.1765 F 0.0000‡ 0.0000‡ 0.0000‡ 0.0000‡ 0.0000‡
Looking Forward: Indexed Total Direct Costs Site A B C D E A B 0.4169 C 0.0127* 0.4794 D 0.4026 0.1883 0.0004‡ E 0.0276* 0.5910 0.7864 0.0031† F 0.0000‡ 0.0000‡ 0.0000‡ 0.0000‡ 0.0000‡
Looking Forward: 180-Day Mortality Site A B C D E A B 0.4775 C 0.0074† 0.2215 D 0.2571 0.8894 0.0939 E 0.0440* 0.4873 0.4359 0.4023 F 0.0000‡ 0.0260* 0.0808 0.0013† 0.0281*
Looking Back: Total Hospital Days Site A B C D E A B 0.7336 C 0.3422 0.3329 D 0.1977 0.6122 0.0203*E 0.1250 0.1839 0.5842 0.0046†F 0.0000‡ 0.0000‡ 0.0000‡ 0.0000‡ 0.0000‡
Looking Back: Indexed Total Direct Costs Site A B C D E A B 0.9461 C 0.1406 0.3674 D 0.7349 0.8999 0.0736E 0.0197* 0.1592 0.4541 0.0064†F 0.0000‡ 0.0035† 0.0047† 0.0000‡ 0.0172*
*p<0.05, †p<0.01, ‡p<0.001.

17
Appendix 6: Analyses Including Lab Variables as Covariates Appendix 6: “Looking Back”: Utilization (n = 1,097)
Site
180-Day Total Hospital
Days (unadjusted)
180-Day Total
Hospital Days
(adjusted) 95% CI A 12.86 12.01 a (9.20 - 15.64) C 11.90 12.87 a,g (10.53 - 15.62) D 7.83 8.55 a (6.59 - 10.81) E 13.21 15.17 (9.31 - 23.76) F 23.55 22.44 (20.45 - 24.72)
Site
180-Day Indexed Total Direct Costs (unadjusted)
180-Day Indexed
Total Direct Costs
(adjusted) 95% CI A 1.27 0.97 b (0.61 - 1.41) C 1.12 1.27 c,g (0.99 - 1.65) D 0.66 0.78 a (0.55 - 1.00) E 1.30 1.35 (0.65 - 2.14) F 1.75 1.71 (1.55 - 1.90)
Appendix 6: Looking Forward: Utilization (n = 2,706)
Site
Initial Hospitalization Length of Stay (unadjusted)
Initial Hospitalization Length of Stay
(adjusted) 95% CI
180-Day Total
Hospital Days
(unadjusted)
180-Day Total
Hospital Days
(adjusted) 95% CI A 4.47 4.69 (3.97 - 5.73) 8.49 8.95 a (7.58 - 10.50) C 5.15 5.16 (4.69 - 5.62) 8.68 8.76 a (7.90 - 9.64) D 4.39 4.79 (4.27 - 5.33) 7.15 7.84 a (6.92 - 8.98) E 4.56 4.55 (3.54 - 5.95) 8.46 9.44 b (6.47 - 12.87) F 7.85 7.55 (7.20 - 7.88) 15.32 14.81 (13.94 - 15.61)
Site
Initial Hospitalization Indexed Total Direct Costs (unadjusted)
Initial Hospitalization Indexed Total Direct Costs (adjusted) 95% CI
180-Day Indexed Total Direct Costs (unadjusted)
180-Day Indexed Total Direct Costs (adjusted) 95% CI
A 0.73 0.66 (0.55 - 0.71) 0.77 0.66 a,g (0.56 - 0.79) C 0.96 0.97 (0.87 - 1.07) 0.88 0.87 a (0.77 - 0.97) D 0.65 0.73 (0.64 - 0.83) 0.58 0.60 a,f (0.51 - 0.70) E 0.77 0.55 (0.43 - 0.72) 0.74 0.68 a (0.44 - 0.98) F 1.14 1.16 (1.09 - 1.24) 1.19 1.23 (1.14 - 1.31)

18
Appendix 6: Looking Forward: Mortality (n = 2,706)
Site
Initial Hospitalization
Mortality (unadjusted)
Initial Hospitalization
Mortality (adjusted) 95% CI
One Month Mortality
(unadjusted)
One Month Mortality
(adjusted) 95% CI
180-Day Mortality
(unadjusted)
180-Day Mortality
(adjusted) 95% CI A 2.4% 3.0% (0.7% - 6.1%) 6.1% 7.1% (3.4% - 11.0%) 20.7% 22.8% (17.7% - 29.0%) C 2.5% 2.8% (1.4% - 4.4%) 5.3% 5.8% (3.9% - 7.9%) 17.9% 19.5% (16.6% - 23.0%) D 2.1% 4.1% (1.4% - 7.3%) 8.2% 13.3% (8.7% - 18.5%) 22.3% 29.2% a,h (24.0% - 34.8%) E 14.8% 12.6% (3.9% - 24.8%) 18.5% 11.3% (5.4% - 19.9%) 25.9% 23.5% (14.2% - 35.5%) F 3.8% 3.3% (2.3% - 4.0%) 5.8% 5.1% (4.0% - 6.2%) 19.5% 17.6% (15.7% - 19.6%)
a significantly different from site F at p<0.001
b significantly different from site F at p<0.01
c significantly different from site F at p<0.05
d significantly different from site E at p<0.01
e significantly different from site E at p<0.05
f significantly different from site C at p<0.001
g significantly different from site C at p<0.05
h significantly different from site C at p<0.01
Statistical testing reported for 180-day adjusted results only.

19
Appendix 6: Pairwise Comparison p-Values for Outcomes
Looking Forward: Total Hospital Days Site A C D E A C 0.8336 D 0.2327 0.1741 E 0.7706 0.6862 0.3447 F 0.0000‡ 0.0000‡ 0.0000‡ 0.0014†
Looking Forward: Indexed Total Direct Costs Site A C D E A C 0.0109* D 0.3931 0.0001‡ E 0.9173 0.1908 0.5850 F 0.0000‡ 0.0000‡ 0.0000‡ 0.0001‡
Looking Forward: 180-Day Mortality Site A C D E A C 0.3367 D 0.1113 0.0013† E 0.9064 0.4889 0.3627 F 0.0943 0.3217 0.0001‡ 0.2931
Looking Back: Total Hospital Days Site A C D E A C 0.6806 D 0.0657 0.0111* E 0.4138 0.5467 0.0823 F 0.0000‡ 0.0000‡ 0.0000‡ 0.0557
Looking Back: Indexed Total Direct Costs Site A C D E A C 0.2894 D 0.3960 0.0270* E 0.3807 0.8441 0.1666 F 0.0012† 0.0283* 0.0000‡ 0.3618
*p<0.05, †p<0.01, ‡p<0.001

![VARIATIONS GOLDBERG [ARIA et 30 variations] · Title: VARIATIONS GOLDBERG [ARIA et 30 variations] Author: Bach, Johann Sebastian - Arranger: Montreuille, Pierre - Publisher: Montreuille,](https://img.dokumen.tips/doc/110x75/610885d0028fe95f64358299/variations-goldberg-aria-et-30-variations-title-variations-goldberg-aria-et.jpg)