Embed Size (px)
Citation preview

1Frank Wood’s Business Accounting 2 Solutions Manual Hong Kong Edition Third Edition © Pearson Education Asia Limited 2007
Question Question Question Question Question Question Question 1-2A1-2A1-2A1-2A1-2A
(a) Kam’s books Bills Payable
20X7 $ 20X7 $Apr 21 Bank 4,160 Jan 21 T Victor Ltd 2,900 " 21 T Victor Ltd: Bill dishonoured 2,900 " 21 C Bellamy & Co 4,160 7,060 7,060
Bank
20X7 $ Apr 21 Bills payable 4,160
T Victor Ltd
20X7 $ 20X7 $Jan 21 Bills payable 2,900 Jan 21 Purchases 2,900
Apr 21 Bills payable: Bill dishonoured 2,900 " 28 Noting charges 10
C Bellamy & Co
20X7 $ 20X7 $Jan 21 Bills payable 4,160 Jan 21 Purchases 4,160
Noting Charges
20X7 $Apr 28 T Victor Ltd 10
(b) T Victor Ltd’s books Bills Receivable
20X7 $ 20X7 $Jan 21 P Kam 2,900 Jan 29 Bank 2,900
Bank
20X7 $ 20X7 $Jan 29 Bills receivable 2,900 Jan 29 Discounting charges 110 Apr 21 P Kam: Bill dishonoured 2,900 " 28 P Kam: Noting charges 10
P Kam
20X7 $ 20X7 $Jan 21 Sales 2,900 Jan 21 Bills receivable 2,900
Apr 21 Bank: Bill dishonoured 2,900 " 28 Bank: Noting charges 10
20X7 $ 20X7 $Apr 21 Bank 4,160 Jan 21 T Victor Ltd 2,900 " 21 T Victor Ltd: Bill dishonoured 2,900 " 21 C Bellamy & Co 4,160
20X7 $ Apr 21 Bills payable 4,160
20X7 $ 20X7 $ Jan 21 Purchases
Apr 21 Bills payable: Bill dishonoured 2,900 " 28 Noting charges 10
20X7 $ 20X7 $ Jan 21 Purchases
20X7 $ 20X7 $ Jan 29 Bank
20X7 $ 20X7 $Jan 29 Bills receivable 2,900 Jan 29 Discounting charges 110 Apr 21 P Kam: Bill dishonoured 2,900 " 28 P Kam: Noting charges 10
20X7 $ 20X7 $ Jan 21 Bills receivable
2 Frank Wood’s Business Accounting 2 Solutions Manual Hong Kong Edition Third Edition © Pearson Education Asia Limited 2007
Discounting Charges
20X7 $Jan 29 Bank 110
(c) C Bellamy & Co’s books Bills Receivable
20X7 $ 20X7 $Jan 21 P Kam 4,160 Apr 21 Bank 4,160
Bank
20X7 $Apr 21 Bills receivable 4,160
P Kam
20X7 $ 20X7 $Jan 21 Sales 4,160 Jan 21 Bills receivable 4,160
Question Question Question Question Question Question Question Question 1-3A1-3A1-3A1-3A1-3A
(a) Ng’s accounts Dr Cr $ $ Jan 1 Purchases 420 Kwok 420
Jan 1 Kwok 420 Bills payable 420
Feb 29 Goods destroyed 3,600 Cost of goods sold 3,600
Apr 1 Insurance company 3,000 Goods destroyed 3,000
Apr 4 Bills payable 420 Kwok 420
Apr 4 Kwok 420 Interest charges 10 Bills payable 430
Apr 9 Bank 3,000 Insurance company 3,000
May 7 Bills payable 430 Bank 430
20X7 $ 20X7 $Jan 21 P Kam 4,160 Apr 21 Bank 4,160
20X7 $ 20X7 $ Jan 21 Bills receivable
3Frank Wood’s Business Accounting 2 Solutions Manual Hong Kong Edition Third Edition © Pearson Education Asia Limited 2007
(b) Kwok’s accounts Dr Cr $ $ Jan 1 Ng 420 Sales 420
Jan 1 Bills receivable 420 Ng 420
Jan 1 Bank 412 Discounting charges 8 Bills receivable 420
Apr 4 Ng 420 Bank 420
Apr 4 Bills receivable 430 Ng 420 Interest receivable 10
May 7 Bank 430 Bills receivable 430
Question Question Question Question Question Question Question Question 1-4A1-4A1-4A1-4A1-4A
R So’s books P Tong
20X0 $ 20X0 $Jan 5 Sales 320 Jan 5 Bills receivable 320
Apr 8 Kowloon Discount Co 323 Apr 14 Bills receivable 333 " 14 Interest receivable 10 333 333
Bills Receivable
20X0 $ 20X0 $Jan 5 P Tong 320 Jan 6 Kowloon Discount Co 320
Apr 14 P Tong 333 May 18 Bank 333
Kowloon Discount Co
20X0 $ 20X0 $Jan 6 Bills receivable 320 Jan 6 Bank 304 " 6 Discounting charges 16 320 320
Apr 8 Bank 323 Apr 8 P Tong 323
Note: It is assumed that the $3 expenses are chargeable to Tong.
20X0 $ 20X0 $ Jan 5 Bills receivable
Apr 8 Kowloon Discount Co 323 Apr 14 Bills receivable 333
20X0 $ 20X0 $ Jan 6 Kowloon Discount Co
May 18 Bank
20X0 $ 20X0 $Jan 6 Bills receivable 320 Jan 6 Bank 304 " 6 Discounting charges 16
Apr 8 P Tong
4 Frank Wood’s Business Accounting 2 Solutions Manual Hong Kong Edition Third Edition © Pearson Education Asia Limited 2007
Question Question Question Question Question Question Question Question 1-5A1-5A1-5A1-5A1-5A
X’s books Y
20X2 $ 20X2 $Jun 16 Bills receivable (Bill No 2) 150 Jun 1 Purchases 860 " 20 Bills payable (Bill No 3) 720 " 20 Interest expenses 10Sept 17 Bank 150 Sept 17 Bills receivable (Bill No 2) 150 1,020 1,020
Z
20X2 $ 20X2 $Jun 1 Sales 570 Jun 1 Bills receivable (Bill No 1) 400Sept 17 Bills receivable (Bill No 2) 150 " 14 Bills receivable (Bill No 2) 150 Sept 20 Bank 85
Bills Receivable
20X2 $ 20X2 $Jun 1 Z 400 Jun 16 Y 150 " 14 Z 150 Sept 1 Bank 400Sept 17 Y 150 " 17 Z 150 700 700
Bills Payable
20X2 $ 20X2 $Sept 20 Bank 720 Jun 20 Y 720
Interest Expenses
20X2 $Jun 20 Y 10
Bank
20X2 $ 20X2 $Sept 1 Bills receivable (Bill No 1) 400 Sept 17 Y 150 " 20 Z 85 " 20 Bills payable (Bill No 3) 720
Question Question Question Question Question Question Question Question 1-7A1-7A1-7A1-7A1-7A
(a) Dora’s books
(i) Mok
20X5 $ 20X5 $Jun 1 Balance b/d 15,000 Jun 7 Bills receivable (A) 10,000 " 7 Bills receivable (B) 5,000 15,000 15,000
20X2 $ 20X2 $Jun 16 Bills receivable (Bill No 2) 150 Jun 1 Purchases 860 " 20 Bills payable (Bill No 3) 720 " 20 Interest expenses 10Sept 17 Bank 150 Sept 17 Bills receivable (Bill No 2) 150
20X2 $ 20X2 $Jun 1 Sales 570 Jun 1 Bills receivable (Bill No 1) 400Sept 17 Bills receivable (Bill No 2) 150 " 14 Bills receivable (Bill No 2) 150 Sept 20 Bank 85
20X2 $ 20X2 $Jun 1 Z 400 Jun 16 Y 150 " 14 Z 150 Sept 1 Bank 400Sept 17 Y 150 " 17 Z 150
20X2 $ 20X2 $Sept 20 Bank 720 Jun 20 Y 720
20X2 $ 20X2 $Sept 1 Bills receivable (Bill No 1) 400 Sept 17 Y 150 " 20 Z 85 " 20 Bills payable (Bill No 3) 720
20X5 $ 20X5 $Jun 1 Balance b/d 15,000 Jun 7 Bills receivable (A) 10,000 " 7 Bills receivable (B) 5,000
5Frank Wood’s Business Accounting 2 Solutions Manual Hong Kong Edition Third Edition © Pearson Education Asia Limited 2007
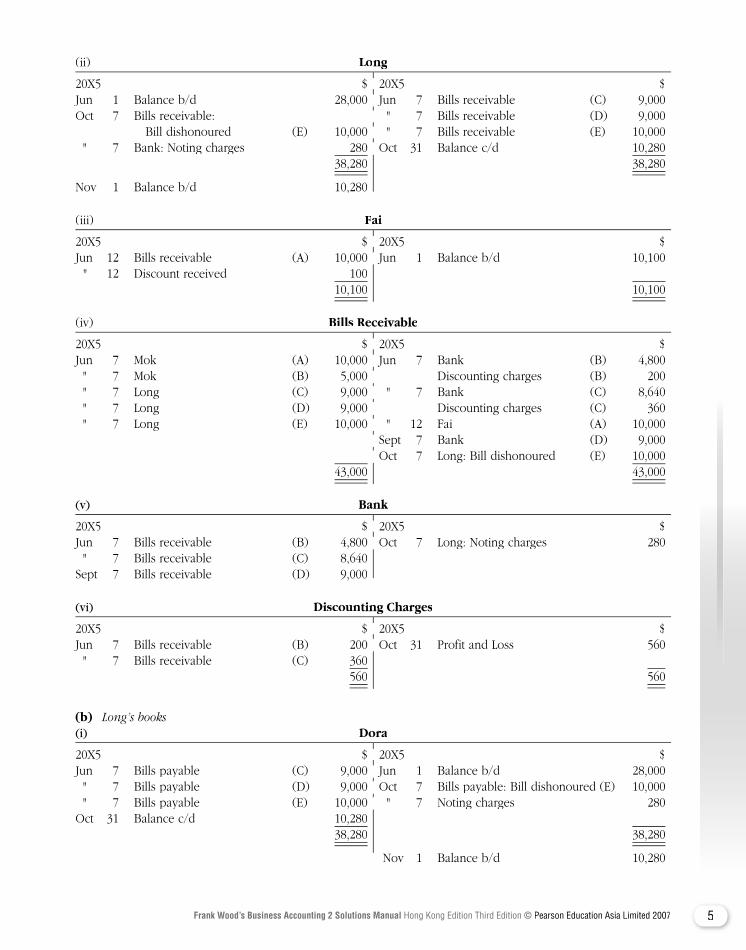
(ii) Long
20X5 $ 20X5 $Jun 1 Balance b/d 28,000 Jun 7 Bills receivable (C) 9,000Oct 7 Bills receivable: " 7 Bills receivable (D) 9,000 Bill dishonoured (E) 10,000 " 7 Bills receivable (E) 10,000 " 7 Bank: Noting charges 280 Oct 31 Balance c/d 10,280 38,280 38,280
Nov 1 Balance b/d 10,280
(iii) Fai
20X5 $ 20X5 $Jun 12 Bills receivable (A) 10,000 Jun 1 Balance b/d 10,100 " 12 Discount received 100 10,100 10,100
(iv) Bills Receivable
20X5 $ 20X5 $Jun 7 Mok (A) 10,000 Jun 7 Bank (B) 4,800 " 7 Mok (B) 5,000 Discounting charges (B) 200 " 7 Long (C) 9,000 " 7 Bank (C) 8,640 " 7 Long (D) 9,000 Discounting charges (C) 360 " 7 Long (E) 10,000 " 12 Fai (A) 10,000 Sept 7 Bank (D) 9,000 Oct 7 Long: Bill dishonoured (E) 10,000 43,000 43,000
(v) Bank
20X5 $ 20X5 $Jun 7 Bills receivable (B) 4,800 Oct 7 Long: Noting charges 280 " 7 Bills receivable (C) 8,640Sept 7 Bills receivable (D) 9,000
(vi) Discounting Charges
20X5 $ 20X5 $Jun 7 Bills receivable (B) 200 Oct 31 Profit and Loss 560 " 7 Bills receivable (C) 360 560 560
(b) Long’s books(i) Dora
20X5 $ 20X5 $Jun 7 Bills payable (C) 9,000 Jun 1 Balance b/d 28,000 " 7 Bills payable (D) 9,000 Oct 7 Bills payable: Bill dishonoured (E) 10,000 " 7 Bills payable (E) 10,000 " 7 Noting charges 280 Oct 31 Balance c/d 10,280 38,280 38,280
Nov 1 Balance b/d 10,280
20X5 $ 20X5 $Jun 1 Balance b/d 28,000 Jun 7 Bills receivable (C) 9,000Oct 7 Bills receivable: " 7 Bills receivable (D) 9,000 Bill dishonoured (E) 10,000 " 7 Bills receivable (E) 10,000 " 7 Bank: Noting charges 280 Oct 31 Balance c/d 10,280
20X5 $ 20X5 $Jun 12 Bills receivable (A) 10,000 Jun 1 Balance b/d 10,100
20X5 $ 20X5 $Jun 7 Mok (A) 10,000 Jun 7 Bank (B) 4,800 " 7 Mok (B) 5,000 Discounting charges (B) 200 " 7 Long (C) 9,000 " 7 Bank (C) 8,640 " 7 Long (D) 9,000 Discounting charges (C) 360 " 7 Long (E) 10,000 " 12 Fai (A) 10,000 Sept 7 Bank (D) 9,000 Oct 7 Long: Bill dishonoured (E) 10,000
20X5 $ 20X5 $Jun 7 Bills receivable (B) 4,800 Oct 7 Long: Noting charges 280
20X5 $ 20X5 $Jun 7 Bills receivable (B) 200 Oct 31 Profit and Loss 560
20X5 $ 20X5 $Jun 7 Bills payable (C) 9,000 Jun 1 Balance b/d 28,000 " 7 Bills payable (D) 9,000 Oct 7 Bills payable: Bill dishonoured (E) 10,000 " 7 Bills payable (E) 10,000 " 7 Noting charges 280
Nov 1 Balance b/d 10,280
6 Frank Wood’s Business Accounting 2 Solutions Manual Hong Kong Edition Third Edition © Pearson Education Asia Limited 2007
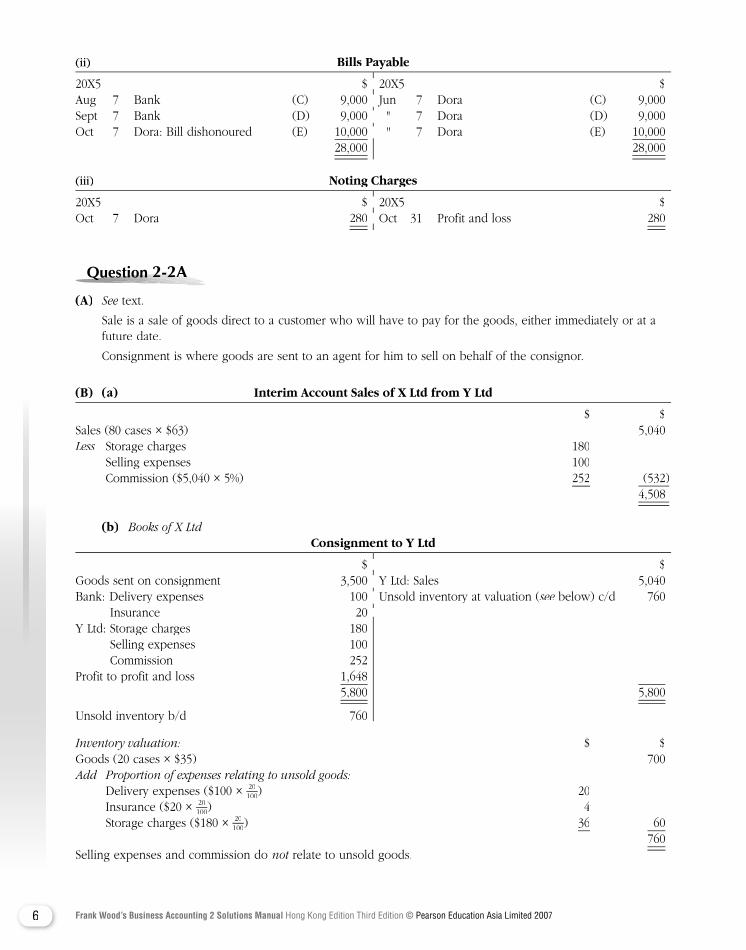
(ii) Bills Payable Bills Payable Bills Pa
20X5 $ 20X5 $Aug 7 Bank (C) 9,000 Jun 7 Dora (C) 9,000Sept 7 Bank (D) 9,000 " 7 Dora (D) 9,000Oct 7 Dora: Bill dishonoured (E) 10,000 " 7 Dora (E) 10,000 28,000 28,000
(iii) Noting Charges
20X5 $ 20X5 $Oct 7 Dora 280 Oct 31 Profit and loss 280
Question Question Question Question Question Question Question Question 2-2A2-2A2-2A2-2A2-2A
(A) See text.See text.See
Sale is a sale of goods direct to a customer who will have to pay for the goods, either immediately or at a future date.
Consignment is where goods are sent to an agent for him to sell on behalf of the consignor.
(B) (a) Interim Account Sales of X Ltd from Y Ltd
$ $Sales (80 cases × $63) 5,040Less Storage charges 180Less Storage charges 180Less Selling expenses 100 Commission ($5,040 × 5%) 252 (532 ) 4,508
(b) Books of X Ltd Consignment to Y Ltd
$ $Goods sent on consignment 3,500 Y Ltd: Sales 5,040Bank: Delivery expenses 100 Unsold inventory at valuation (see below) c/d 760 see below) c/d 760 see Insurance 20 Y Ltd: Storage charges 180 Selling expenses 100 Commission 252Profit to profit and loss 1,648 5,800 5,800
Unsold inventory b/d 760
Inventory valuation: $ $Goods (20 cases × $35) 700Add Proportion of expenses relating to unsold goods: Delivery expenses ($100 × 20
100) 20 Insurance ($20 × 20
100) 4 Storage charges ($180 × 20
100) 36 60 760Selling expenses and commission do not relate to unsold goods.not relate to unsold goods.not
20X5 $ 20X5 $Aug 7 Bank (C) 9,000 Jun 7 Dora (C) 9,000Sept 7 Bank (D) 9,000 " 7 Dora (D) 9,000Oct 7 Dora: Bill dishonoured (E) 10,000 " 7 Dora (E) 10,000
20X5 $ 20X5 $ Oct 31 Profit and loss
$ $Goods sent on consignment 3,500 Y Ltd: Sales 5,040Bank: Delivery expenses 100 Unsold inventory at valuation ( Insurance 20
7Frank Wood’s Business Accounting 2 Solutions Manual Hong Kong Edition Third Edition © Pearson Education Asia Limited 2007
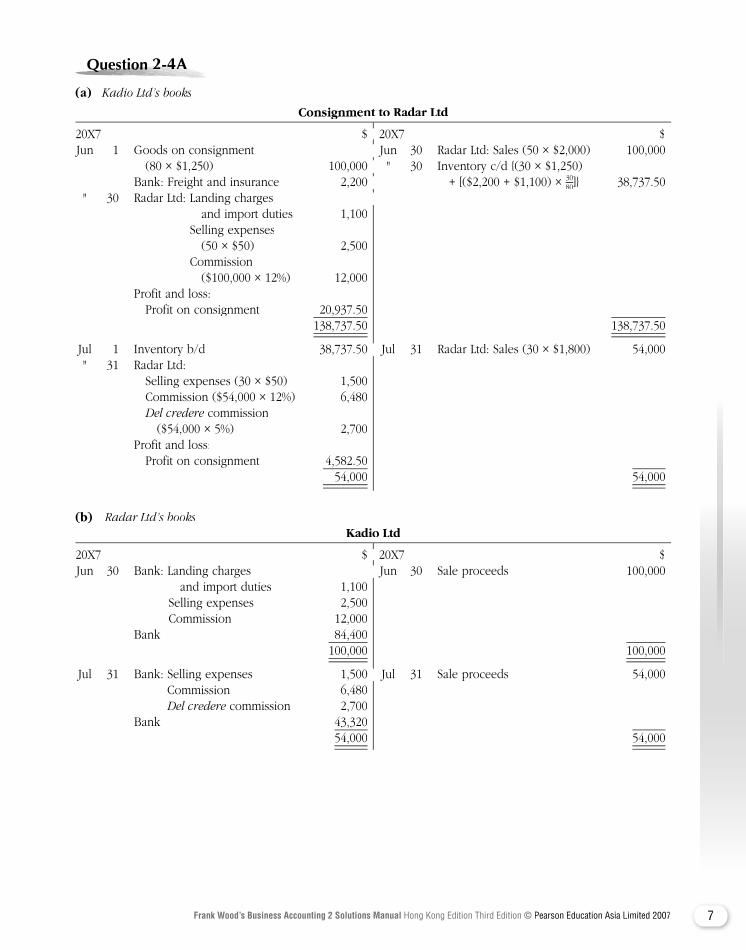
Question Question Question Question Question Question Question Question 2-4A2-4A2-4A2-4A2-4A
(a) Kadio Ltd’s books
Consignment to Radar Ltd
20X7 $ 20X7 $ Jun 1 Goods on consignment Jun 30 Radar Ltd: Sales (50 × $2,000) 100,000 (80 × $1,250) 100,000 " 30 Inventory c/d {(30 × $1,250) Bank: Freight and insurance 2,200 + [($2,200 + $1,100) × 30
80]} 38,737.50 " 30 Radar Ltd: Landing charges and import duties 1,100 Selling expenses (50 × $50) 2,500 Commission ($100,000 × 12%) 12,000 Profit and loss: Profit on consignment 20,937.50 138,737.50 138,737.50
Jul 1 Inventory b/d 38,737.50 Jul 31 Radar Ltd: Sales (30 × $1,800) 54,000 " 31 Radar Ltd: Selling expenses (30 × $50) 1,500 Commission ($54,000 × 12%) 6,480 Del credere commission Del credere commission Del credere ($54,000 × 5%) 2,700 Profit and loss: Profit on consignment 4,582.50 54,000 54,000
(b) Radar Ltd’s books Kadio Ltd
20X7 $ 20X7 $ Jun 30 Bank: Landing charges Jun 30 Sale proceeds 100,000 and import duties 1,100 Selling expenses 2,500 Commission 12,000 Bank 84,400 100,000 100,000
Jul 31 Bank: Selling expenses 1,500 Jul 31 Sale proceeds 54,000 Commission 6,480 Del credere commission 2,700Del credere commission 2,700Del credere Bank 43,320 54,000 54,000
20X7 $ 20X7 $ Jun 1 Goods on consignment Jun 30 Radar Ltd: Sales (50 × $2,000) 100,000 (80 × $1,250) 100,000 " 30 Inventory c/d {(30 × $1,250) Bank: Freight and insurance 2,200 + [($2,200 + $1,100) × " 30 Radar Ltd: Landing charges
Jul 1 Inventory b/d 38,737.50 Jul 31 Radar Ltd: Sales (30 × $1,800) 54,000
20X7 $ 20X7 $ Jun 30 Bank: Landing charges Jun 30 Sale proceeds 100,000
Jul 31 Bank: Selling expenses 1,500 Jul 31 Sale proceeds 54,000

8 Frank Wood’s Business Accounting 2 Solutions Manual Hong Kong Edition Third Edition © Pearson Education Asia Limited 2007
Question Question Question Question Question Question Question Question 2-6A2-6A2-6A2-6A2-6A
(a) (i) Books of Good Win Limited Goods Sent on Consignment Account
20X9 $ 20X8 $ Sept 30 Trading account 200,000 Oct 1 Consignment account 200,000
(ii) Consignment to Advent Company Account
20X8 $ 20X9 $ Oct 1 Goods sent on consignment 200,000 Jan 1 Bank: Insurance compensation 1,200 " 1 Bank (carriage, freight and Sept 30 Advent Company 285,000 insurance) 5,000 " 30 Closing stock (see working) 8,200see working) 8,200see20X9 Sept 30 Advent Company: Distribution expenses 9,500 Import charges 1,900 Commission 14,250 " 30 Profit and loss account 63,750 294,400 294,400
(iii) Advent Company Current Account
20X9 $ 20X9 $ Sept 30 Consignment to Advent Company 285,000 Aug 31 Bank 150,000 Sept 30 Consignment to Advent Company: Distribution expenses 9,500 Import charges 1,900 Commission 14,250 " 30 Balance c/d 109,350 285,000 285,000
Working: $Craft products, cost per unit 100.00Add Add Add Attributable cost per unit: Carriage, freight and insurance costs paid by Good Win Limited ($5,000 ÷ 2,000) 2.50Total unit cost 102.50
Closing stock [(2,000 − 20 − 1,900) units × $102.50] 8,200.00
(b) Consignment means goods sold through an agent who takes on the responsibility to sell goods, collect debts and store goods on behalf of the owner (i.e. consignor). In return, the agent earns commission. Consignment of goods to an agent (i.e. consignee) does not constitute a sale by the consignor, merely a transfer of location of the goods concerned. Goods on consignment never belongs to the consignee; they are owned by the consignor until sold.
20X9 $ 20X8 $ Oct 1 Consignment account
20X8 $ 20X9 $ Oct 1 Goods sent on consignment 200,000 Jan 1 Bank: Insurance compensation 1,200 " 1 Bank (carriage, freight and Sept 30 Advent Company 285,000 insurance) 5,000 " 30 Closing stock (
20X9 $ 20X9 $ Sept 30 Consignment to Advent Company 285,000 Aug 31 Bank 150,000 Sept 30 Consignment to Advent Company: Distribution expenses 9,500 Import charges 1,900 Commission 14,250 " 30 Balance c/d 109,350
9Frank Wood’s Business Accounting 2 Solutions Manual Hong Kong Edition Third Edition © Pearson Education Asia Limited 2007
Goods on sale or return means goods transferred from the supplier to the purchaser; they belong to the supplier until they are sold. In other words, the purchaser can return any unsold goods to the supplier at his discretion. This means that the unsold goods do not belong to the purchaser but to the supplier. Therefore, unsold goods kept by the purchaser should not be included in his closing stock.
(c) In a consignment sale, the consignor usually bears the risk of bad debts. However, if both the consignor and the consignee agree, the consignor can shift the bad debt risk to the consignee by paying extra commission to the consignee. This extra commission is known as del credere commission.del credere commission.del credere
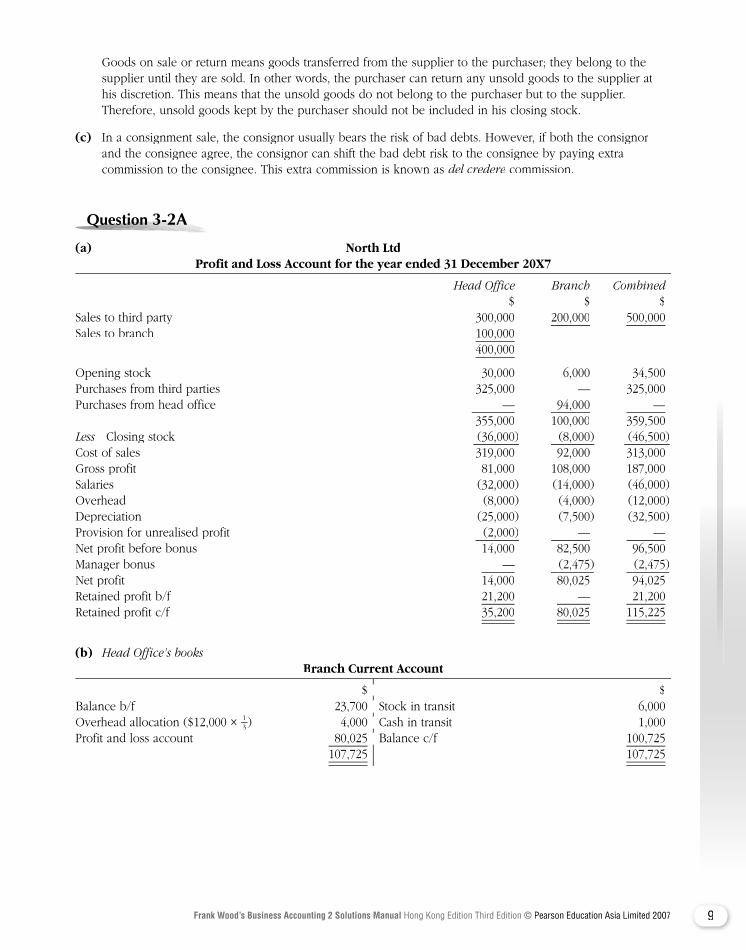
Question Question Question Question Question Question Question Question 3-2A3-2A3-2A3-2A3-2A
(a) North Ltd Profit and Loss Account for the year ended 31 December 20X7
Head Office Branch Combined $ $ $Sales to third party 300,000 200,000 500,000Sales to branch 100,000 400,000
Opening stock 30,000 6,000 34,500Purchases from third parties 325,000 — 325,000Purchases from head office — 94,000 — 355,000 100,000 359,500Less Closing stock Less Closing stock Less (36,000 ) (8,000 ) (46,500 )Cost of sales 319,000 92,000 313,000Gross profit 81,000 108,000 187,000Salaries (32,000 ) (14,000 ) (46,000 )Overhead (8,000 ) (4,000 ) (12,000 )Depreciation (25,000 ) (7,500 ) (32,500 )Provision for unrealised profit (2,000 ) — — — —Net profit before bonus 14,000 82,500 96,500Manager bonus — (2,475 ) (2,475 )Net profit 14,000 80,025 94,025 Retained profit b/f 21,200 — 21,200Retained profit c/f 35,200 80,025 115,225
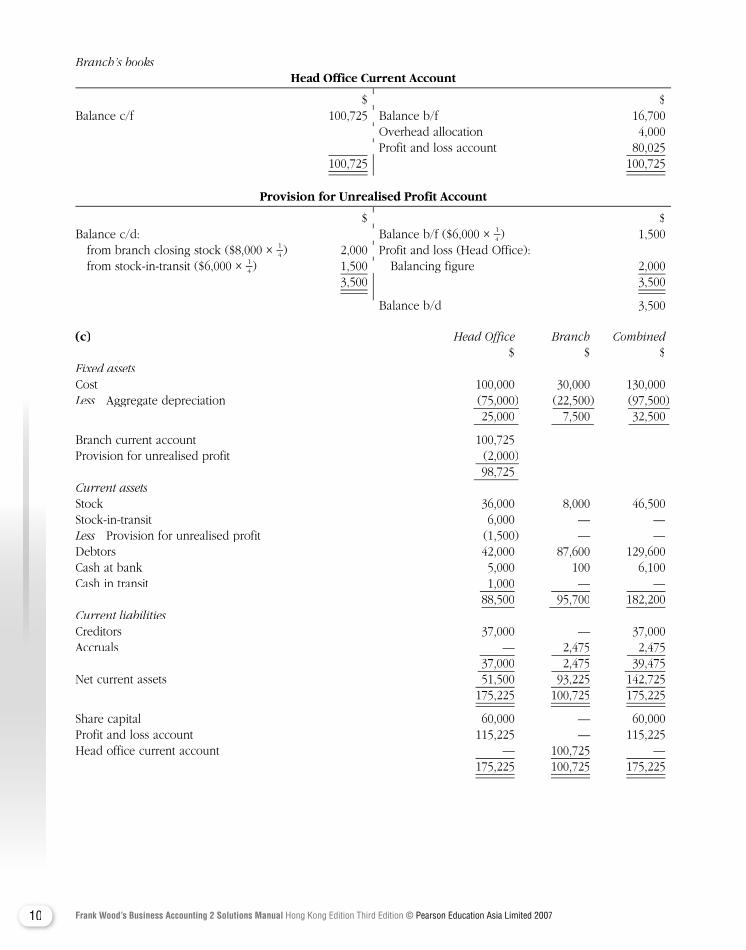
(b) Head Office’s books Branch Current Account
$ $Balance b/f 23,700 Stock in transit 6,000Overhead allocation ($12,000 × 1
3 ) 4,000 Cash in transit 1,000Profit and loss account 80,025 Balance c/f 100,725 107,725 107,725
$ $Balance b/f 23,700 Stock in transit 6,000
) 4,000 Cash in transit 1,000Profit and loss account 80,025 Balance c/f 100,725
10 Frank Wood’s Business Accounting 2 Solutions Manual Hong Kong Edition Third Edition © Pearson Education Asia Limited 2007
Branch’s books Head Office Current Account Head Office Current Account Head Of
$ $Balance c/f 100,725 Balance b/f 16,700 Overhead allocation 4,000 Profit and loss account 80,025 100,725 100,725
Provision for Unrealised Profit Account
$ $Balance c/d: Balance b/f ($6,000 × 1
4 ) 1,500 from branch closing stock ($8,000 × 1
4 ) 2,000 Profit and loss (Head Office): from stock-in-transit ($6,000 × 1
4 ) 1,500 Balancing figure 2,000 3,500 3,500
Balance b/d 3,500
(c) Head Office Branch Combined $ $ $Fixed assetsCost 100,000 30,000 130,000Less Aggregate depreciation Less Aggregate depreciation Less (75,000 ) (22,500 ) (97,500 ) 25,000 7,500 32,500
Branch current account 100,725Provision for unrealised profit (2,000 ) 98,725 Current assetsStock 36,000 8,000 46,500Stock-in-transit 6,000 — —Less Provision for unrealised profit (1,500 ) — —Less Provision for unrealised profit (1,500 ) — —LessDebtors 42,000 87,600 129,600Cash at bank 5,000 100 6,100Cash in transit 1,000 — — — — 88,500 95,700 182,200Current liabilitiesCreditors 37,000 — 37,000Accruals — 2,475 2,475 37,000 2,475 39,475Net current assets 51,500 93,225 142,725 175,225 100,725 175,225
Share capital 60,000 — 60,000Profit and loss account 115,225 — 115,225Head office current account — 100,725 — 175,225 100,725 175,225
$ $Balance c/f 100,725 Balance b/f 16,700 Overhead allocation 4,000 Profit and loss account 80,025
$ $Balance c/d: Balance b/f ($6,000 ×
) 2,000 Profit and loss (Head Office): ) 1,500 Balancing figure 2,000
Balance b/d 3,500

11Frank Wood’s Business Accounting 2 Solutions Manual Hong Kong Edition Third Edition © Pearson Education Asia Limited 2007
Workings: Opening stock Closing stock $ $Head office 30,000 36,000Stock-in-transit — 6,000Less Unrealised profit ($6,000 × Less Unrealised profit ($6,000 × Less 1
4 ) — (1,500)Branch 6,000 8,000Less Unrealised profit: ($6,000 × Less Unrealised profit: ($6,000 × Less 1
4 ) (1,500) —
($8,000 × 14 ) — (2,000)
34,500 46,500
Question Question Question Question Question Question Question Question 3-5A3-5A3-5A3-5A3-5A
(a) (i) Branch Stock (Selling Price) Branch Stock (Selling Price) Branch Stock
$000 $000Balance b/d 75 Returns 30Goods to branch 600 Cash sales 120Branch debtors: Returns 8 Branch debtors 437 Stock deficiency to branch adjustment 6 Balance c/d 90 683 683
Balance b/d 90
(ii) Goods Sent to Branch (Cost Price)
$000 $000Returns from branch 20 Branch stock 400Head office trading account 380 400 400
(iii) Branch Adjustment (Profit Loading)
$000 $000Returns from branch 10 Unrealised profit b/d 25Branch stock deficiency 6 Goods to branch 200Branch profit and loss 179Unrealised profit c/d 30 225 225
(iv) Branch DebtorsBranch DebtorsBranch
$000 $000Balance b/d 66 Branch stock: Returns 8Branch stock 437 Bank 390 Discounts allowed 9 Bad debts 15 Balance c/d 81 503 503
Balance b/d 81
$000 $000Balance b/d 75 Returns 30Goods to branch 600 Cash sales 120Branch debtors: Returns 8 Branch debtors 437 Stock deficiency to branch adjustment 6 Balance c/d 90
$000 $000Returns from branch 20 Branch stock 400
$000 $000Returns from branch 10 Unrealised profit b/d 25Branch stock deficiency 6 Goods to branch 200
$000 $000Balance b/d 66 Branch stock: Returns 8Branch stock 437 Bank 390 Discounts allowed 9 Bad debts 15 Balance c/d 81
12 Frank Wood’s Business Accounting 2 Solutions Manual Hong Kong Edition Third Edition © Pearson Education Asia Limited 2007
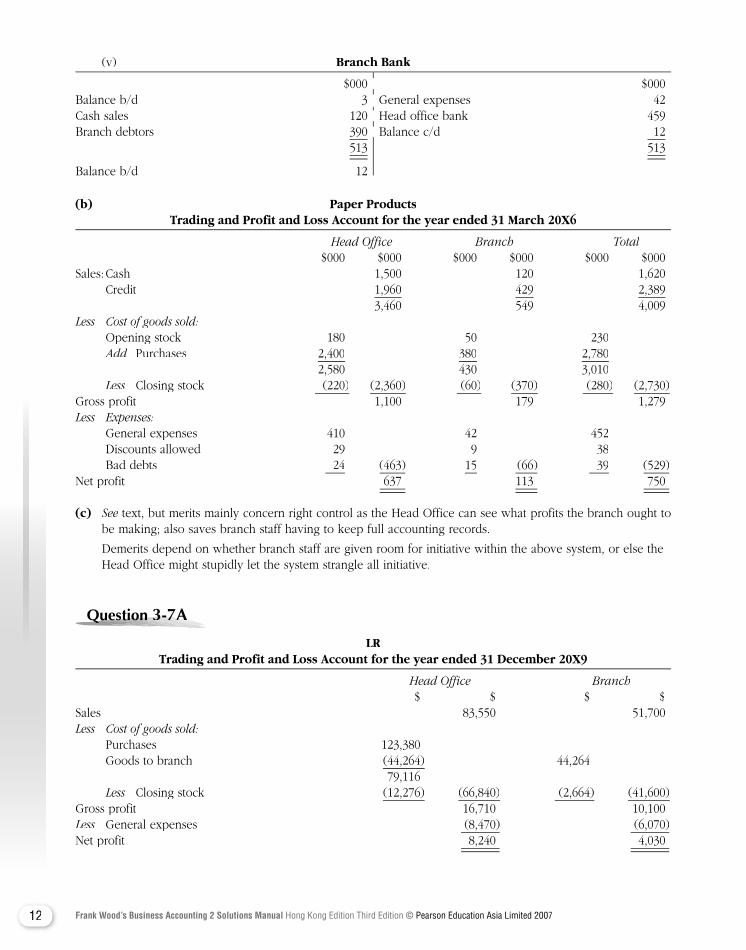
(v) Branch Bank
$000 $000Balance b/d 3 General expenses 42Cash sales 120 Head office bank 459Branch debtors 390 Balance c/d 12 513 513
Balance b/d 12
(b) Paper Products Trading and Profit and Loss Account for the year ended 31 March 20X6
Head Office Branch Total $000 $000 $000 $000 $000 $000Sales: Cash 1,500 120 1,620 Credit 1,960 429 2,389 3,460 549 4,009Less Cost of goods sold: Opening stock 180 50 230
Add Purchases Add Purchases Add 2,400 380 2,780 2,580 430 3,010
Less Closing stock Less Closing stock Less (220 ) (2,360 ) (60 ) (370 ) (280 ) (2,730 )Gross profit 1,100 179 1,279Less Expenses: General expenses 410 42 452 Discounts allowed 29 9 38 Bad debts 24 (463 ) 15 (66 ) 39 (529 )Net profit 637 113 750
(c) See text, but merits mainly concern right control as the Head Office can see what profits the branch ought to See text, but merits mainly concern right control as the Head Office can see what profits the branch ought to Seebe making; also saves branch staff having to keep full accounting records.
Demerits depend on whether branch staff are given room for initiative within the above system, or else the Head Office might stupidly let the system strangle all initiative.
Question Question Question Question Question Question Question Question 3-7A3-7A3-7A3-7A3-7A
LR Trading and Profit and Loss Account for the year ended 31 December 20X9
Head Office Branch $ $ $ $Sales 83,550 51,700Less Cost of goods sold: Purchases 123,380 Goods to branch (44,264 ) 44,264 79,116
Less Closing stock Less Closing stock Less (12,276 ) (66,840 ) (2,664 ) (41,600 )Gross profit 16,710 10,100Less General expenses (8,470 ) (6,070 )Less General expenses (8,470 ) (6,070 )LessNet profit 8,240 4,030
$000 $000Balance b/d 3 General expenses 42Cash sales 120 Head office bank 459Branch debtors 390 Balance c/d 12
13Frank Wood’s Business Accounting 2 Solutions Manual Hong Kong Edition Third Edition © Pearson Education Asia Limited 2007
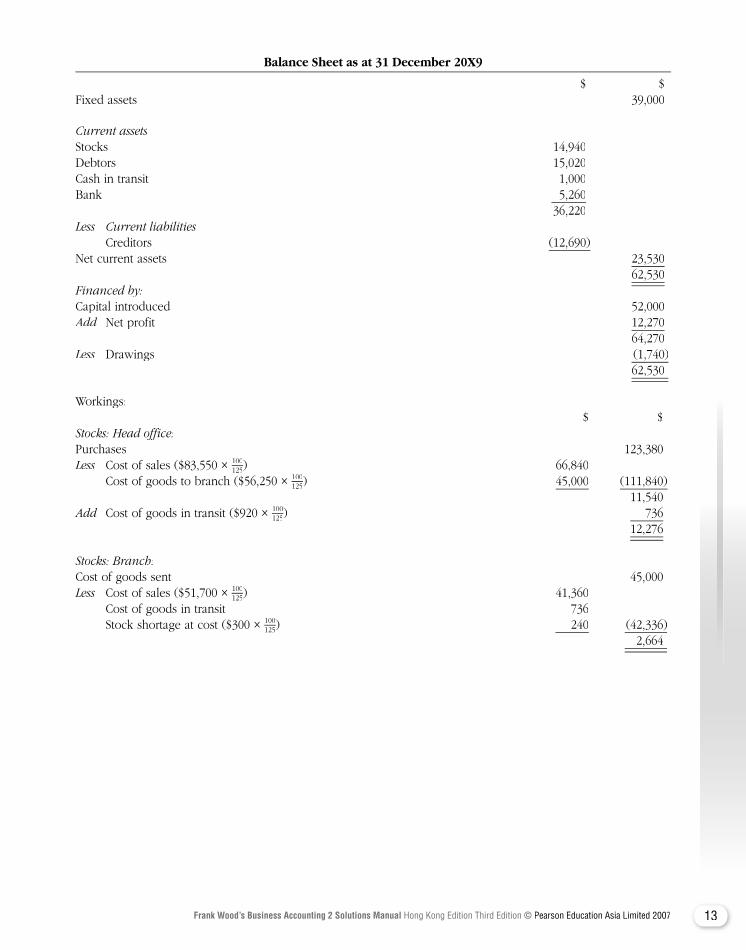
Balance Sheet as at 31 December 20X9
$ $Fixed assets 39,000
Current assetsStocks 14,940Debtors 15,020Cash in transit 1,000Bank 5,260 36,220Less Current liabilities
Creditors (12,690)Net current assets 23,530 62,530Financed by:Capital introduced 52,000Add Net profit Add Net profit Add 12,270 64,270Less Drawings (1,740)Less Drawings (1,740)Less 62,530
Workings: $ $Stocks: Head office:Purchases 123,380Less Cost of sales ($83,550 × Less Cost of sales ($83,550 × Less 100
125) 66,840 Cost of goods to branch ($56,250 × 100
125) 45,000 (111,840) 11,540Add Cost of goods in transit ($920 × Add Cost of goods in transit ($920 × Add 100
125) 736 12,276
Stocks: Branch:Cost of goods sent 45,000Less Cost of sales ($51,700 × 100
125) 41,360 Cost of goods in transit 736 Stock shortage at cost ($300 × 100
125) 240 (42,336) 2,664

14 Frank Wood’s Business Accounting 2 Solutions Manual Hong Kong Edition Third Edition © Pearson Education Asia Limited 2007
Question Question Question Question Question Question Question Question 3-9A3-9A3-9A3-9A3-9A
(a) Star Stores Trading and Profit and Loss Accounts for the year ended 31 Decembeer 20X9
Head Office Branch $000 $000 $000 $000Sales 1,200 570Goods transferred to branch 360 1,560 570Less Cost of goods sold: Opening stock 80 30
Add Purchases 880Add Purchases 880Add Transfer of goods from head office — — — 300 960 330
Less Closing stock Less Closing stock Less (100 ) (860 ) (48 ) (282 )Gross profit 700 288Less Administrative expenses 380 30Less Administrative expenses 380 30Less Distribution costs 157 172 Increase in provision for profit included in branch stock* 13 (550 ) — (202 ) — (202 ) —Net profit 150 86
* ($48,000 × 16 ) − ($30,000 × 1
6 ) + ($60,000 × 16 )
(b) Balance Sheet as at 31 December 20X9
$000 $000 $000 Accumulated NetFixed assets Cost depreciation book valuePlant and equipment 330 150 180Motor vehicles 700 400 300 1,030 550 480Current assetsStock ($100,000 + $48,000 + $60,000 − $18,000) 190Debtors and prepayments 206Bank and cash ($25,000 + $2,000 + $15,000) 42 438
Less Current liabilities Creditors and accruals (196) 242
722
Capital: Balance at 1.1.20X9 550Add Net profit Add Net profit Add 236 786Less Drawings (64) 722
15Frank Wood’s Business Accounting 2 Solutions Manual Hong Kong Edition Third Edition © Pearson Education Asia Limited 2007
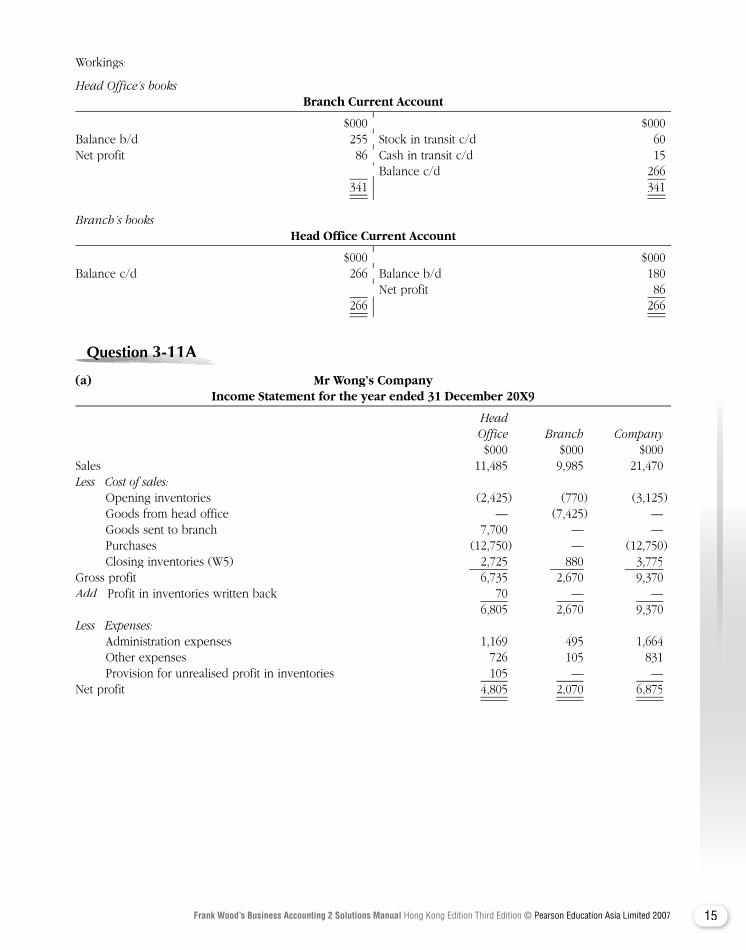
Workings:
Head Office’s books Branch Current Account
$000 $000Balance b/d 255 Stock in transit c/d 60Net profit 86 Cash in transit c/d 15 Balance c/d 266
341 341
Branch’s books Head Office Current Account Head Office Current Account Head Of
$000 $000Balance c/d 266 Balance b/d 180 Net profit 86
266 266
Question Question Question Question Question Question Question 3-11A3-11A3-11A3-11A3-11A3-11A
(a) Mr Wong’s Company Income Statement for the year ended 31 December 20X9
Head Office Branch Company $000 $000 $000Sales 11,485 9,985 21,470Less Cost of sales: Opening inventories (2,425) (770) (3,125) Goods from head office — (7,425) — Goods sent to branch 7,700 — — Purchases (12,750) — (12,750) Closing inventories (W5) 2,725 880 3,775Gross profit 6,735 2,670 9,370Add Profit in inventories written back 70 — — 6,805 2,670 9,370Less Expenses: Administration expenses 1,169 495 1,664 Other expenses 726 105 831 Provision for unrealised profit in inventories 105 — —Net profit 4,805 2,070 6,875
$000 $000Balance b/d 255 Stock in transit c/d 60Net profit 86 Cash in transit c/d 15 Balance c/d 266
$000 $000Balance c/d 266 Balance b/d 180 Net profit 86
16 Frank Wood’s Business Accounting 2 Solutions Manual Hong Kong Edition Third Edition © Pearson Education Asia Limited 2007
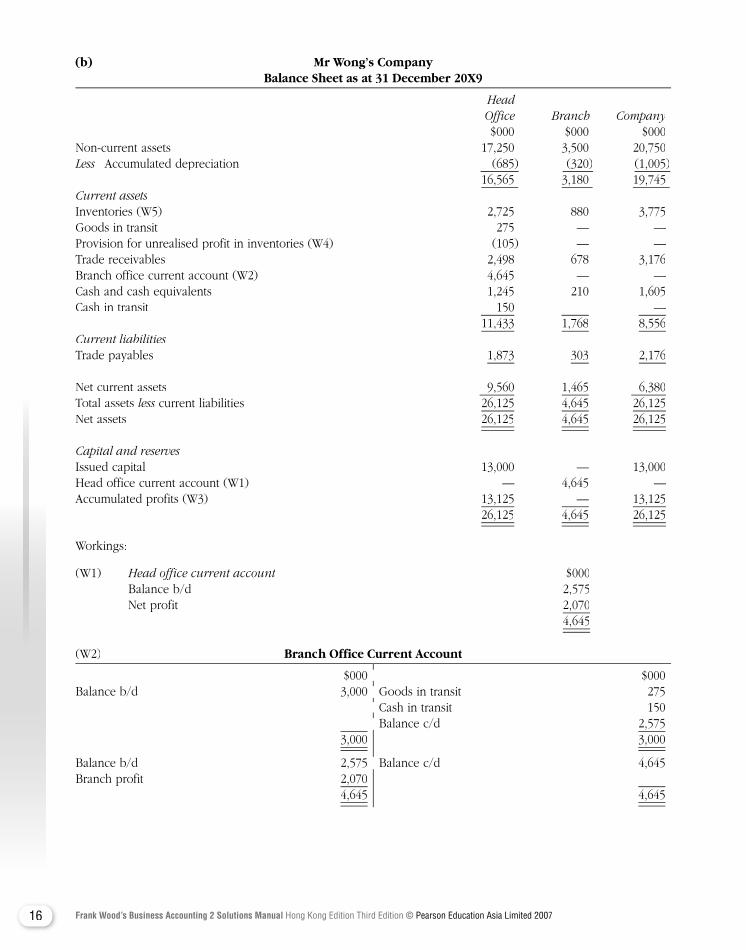
(b) Mr Wong’s Company Balance Sheet as at 31 December 20X9
Head Office Branch Company $000 $000 $000Non-current assets 17,250 3,500 20,750Less Accumulated depreciation (685) (320) (1,005) 16,565 3,180 19,745 Current assetsInventories (W5) 2,725 880 3,775Goods in transit 275 — —Provision for unrealised profit in inventories (W4) (105) — —Trade receivables 2,498 678 3,176Branch office current account (W2) 4,645 — —Cash and cash equivalents 1,245 210 1,605Cash in transit 150 — — 11,433 1,768 8,556Current liabilitiesTrade payables 1,873 303 2,176
Net current assets 9,560 1,465 6,380Total assets less current liabilities 26,125 4,645 26,125less current liabilities 26,125 4,645 26,125lessNet assets 26,125 4,645 26,125
Capital and reservesIssued capital 13,000 — 13,000Head office current account (W1) — 4,645 —Accumulated profits (W3) 13,125 — 13,125 26,125 4,645 26,125
Workings:
(W1) Head office current account $000Head office current account $000Head office current account Balance b/d 2,575 Net profit 2,070 4,645
(W2) Branch Office Current Account
$000 $000Balance b/d 3,000 Goods in transit 275 Cash in transit 150 Balance c/d 2,575
3,000 3,000
Balance b/d 2,575 Balance c/d 4,645Branch profit 2,070
4,645 4,645
$000 $000Balance b/d 3,000 Goods in transit 275 Cash in transit 150 Balance c/d 2,575
Balance b/d 2,575 Balance c/d 4,645
17Frank Wood’s Business Accounting 2 Solutions Manual Hong Kong Edition Third Edition © Pearson Education Asia Limited 2007
(W3) Head office income statement $000Head office income statement $000Head office income statement Balance b/d 6,250 Branch profit 2,070 Head office profit 4,805 13,125 (W4) Calculation of unrealised profit in inventories at branch and goods in transit ($275,000 + $880,000) × 10
110 = $105,000
(W5) Unrealised profit in closing inventories $000Unrealised profit in closing inventories $000Unrealised profit in closing inventories Closing inventories: Head office 2,725 Branch 880 Goods in transit 275 3,880 Less Profit in inventories (105)Less Profit in inventories (105)Less 3,775
Question Question Question Question Question Question Question Question 4-2A4-2A4-2A4-2A4-2A
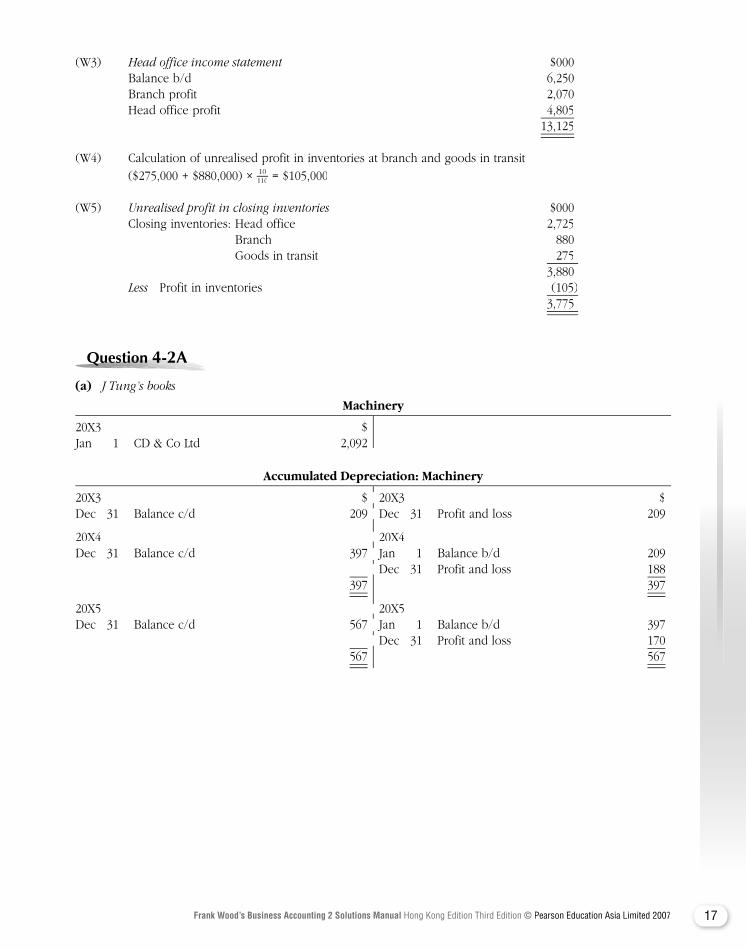
(a) J Tung’s books
Machinery
20X3 $Jan 1 CD & Co Ltd 2,092
Accumulated Depreciation: Machinery
20X3 $ 20X3 $Dec 31 Balance c/d 209 Dec 31 Profit and loss 209
20X4 20X4Dec 31 Balance c/d 397 Jan 1 Balance b/d 209 Dec 31 Profit and loss 188 397 397
20X5 20X5Dec 31 Balance c/d 567 Jan 1 Balance b/d 397 Dec 31 Profit and loss 170 567 567
20X3 $ 20X3 $Dec 31 Balance c/d 209 Dec 31
20X4 20X4Dec 31 Balance c/d 397 Jan 1 Balance b/d 209 Dec 31 Profit and loss 188
20X5 20X5Dec 31 Balance c/d 567 Jan 1 Balance b/d 397 Dec 31 Profit and loss 170
18 Frank Wood’s Business Accounting 2 Solutions Manual Hong Kong Edition Third Edition © Pearson Education Asia Limited 2007
CD & Co Ltd
20X3 $ 20X3 $Jan 1 Bank 600 Jan 1 Machinery 2,092Dec 31 Bank 600 Dec 31 HP interest ($1,492 × 10%) 149Dec 31 Balance c/d 1,041 2,241 2,241
20X4 20X4 Dec 31 Bank 600 Jan 1 Balance b/d 1,041Dec 31 Balance c/d 545 Dec 31 HP interest ($1,041 × 10%) 104 1,145 1,145
20X5 20X5Dec 31 Bank 600 Jan 1 Balance b/d 545 Dec 31 HP interest ($545 × 10%) 55 600 600
(b) Balance Sheet (extract) as at 31 December 20X3
$ $Non-current assets Non-current assets Non-current assetsMachinery at cost 2,092Less Accumulated depreciation Less Accumulated depreciation Less (209) 1,883 Current liabilitiesOwing on HP 496
Non-current liabilitiesOwing on HP 545
Question Question Question Question Question Question Question Question 4-4A4-4A4-4A4-4A4-4A
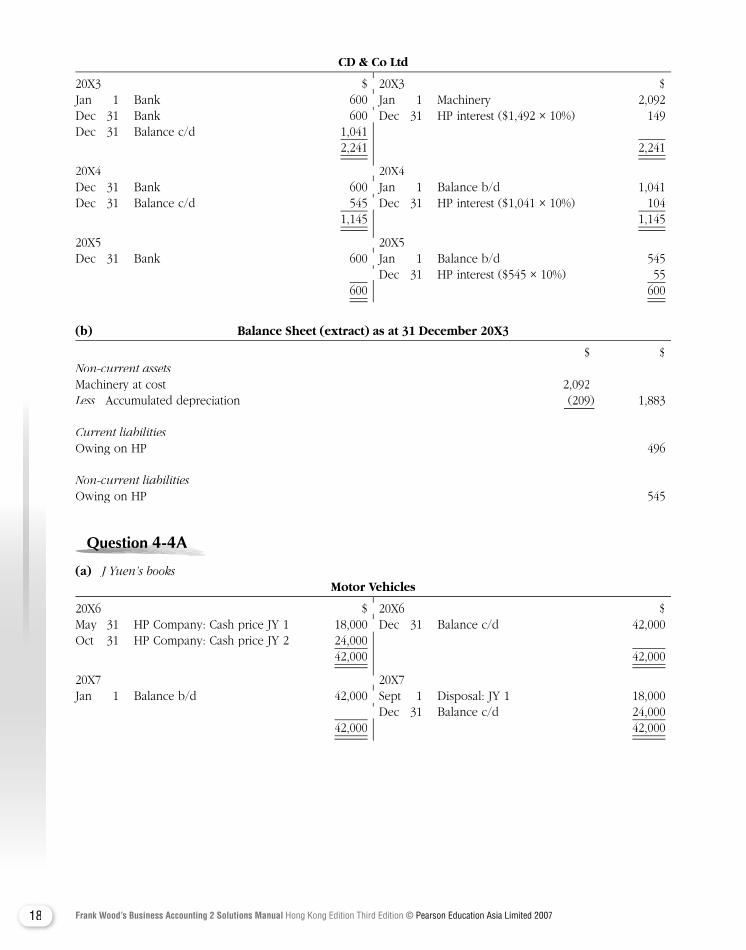
(a) J Yuen’s books Motor Vehicles
20X6 $ 20X6 $May 31 HP Company: Cash price JY 1 18,000 Dec 31 Balance c/d 42,000Oct 31 HP Company: Cash price JY 2 24,000 42,000 42,000
20X7 20X7Jan 1 Balance b/d 42,000 Sept 1 Disposal: JY 1 18,000 Dec 31 Balance c/d 24,000 42,000 42,000
20X3 $ 20X3 $Jan 1 Bank 600 Jan 1 Machinery 2,092Dec 31 Bank 600 Dec 31 HP interest ($1,492 × 10%) 149
20X4 20X4 Dec 31 Bank 600 Jan 1 Balance b/d 1,041Dec 31 Balance c/d 545 Dec 31 HP interest ($1,041 × 10%) 104
20X5 20X5Dec 31 Bank 600 Jan 1 Balance b/d 545 Dec 31 HP interest ($545 × 10%) 55
20X6 $ 20X6 $May 31 HP Company: Cash price JY 1 18,000 Dec 31 Balance c/d 42,000
20X7 20X7Jan 1 Balance b/d 42,000 Sept 1 Disposal: JY 1 18,000 Dec 31 Balance c/d 24,000
19Frank Wood’s Business Accounting 2 Solutions Manual Hong Kong Edition Third Edition © Pearson Education Asia Limited 2007
(b) Accumulated Depreciation: Motor Vehicles
20X6 $ 20X6 $Dec 31 Balance c/d 2,900 Dec 31 Profit and loss: JY 1 ($18,000 × 20% × 7
12) 2,100 JY 2 ($24,000 × 20% × 2
12) 800 2,900 2,900
20X7 20X7Sept 1 Disposal: JY 1 4,500 Jan 1 Balance b/d 2,900Dec 31 Balance c/d 5,600 Sept 1 Profit and loss: JY 1 ($18,000 × 20% × 8
12) 2,400 JY 2 ($24,000 × 20%) 4,800 10,100 10,100
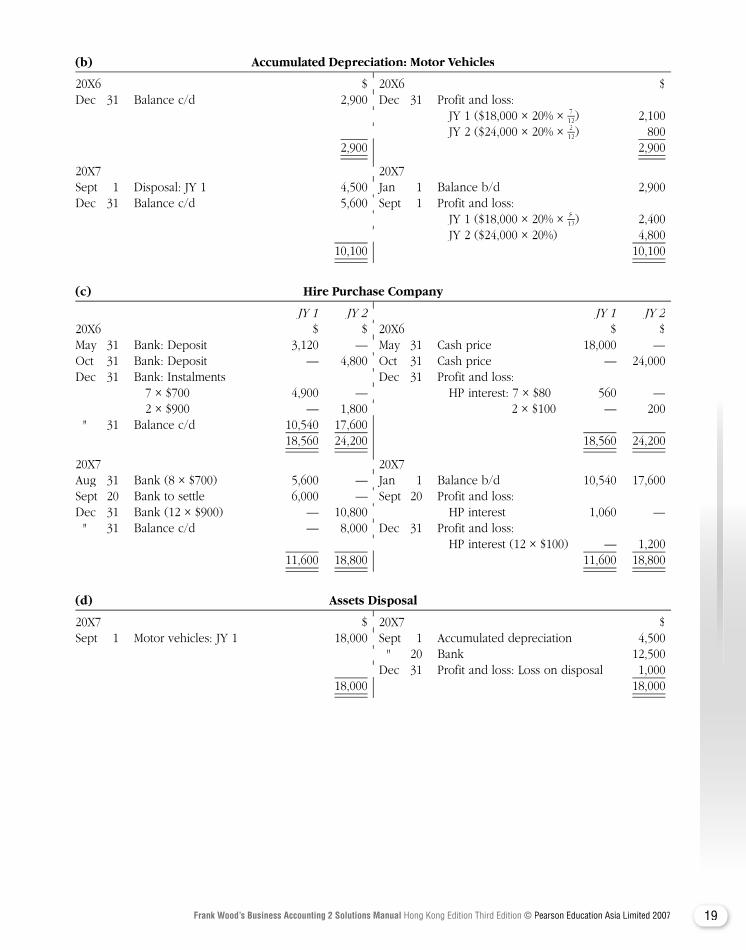
(c) Hire Purchase Company
JY 1 JY 2 JY 1 JY 220X6 $ $ 20X6 $ $May 31 Bank: Deposit 3,120 — May 31 Cash price 18,000 —Oct 31 Bank: Deposit — 4,800 Oct 31 Cash price — 24,000Dec 31 Bank: Instalments Dec 31 Profit and loss: 7 × $700 4,900 — HP interest: 7 × $80 560 — 2 × $900 — 1,800 2 × $100 — 200 " 31 Balance c/d 10,540 17,600 18,560 24,200 18,560 24,200
20X7 20X7 Aug 31 Bank (8 × $700) 5,600 — Jan 1 Balance b/d 10,540 17,600Sept 20 Bank to settle 6,000 — Sept 20 Profit and loss:Dec 31 Bank (12 × $900) — 10,800 HP interest 1,060 — " 31 Balance c/d — 8,000 Dec 31 Profit and loss: HP interest (12 × $100) — 1,200 11,600 18,800 11,600 18,800
(d) Assets Disposal
20X7 $ 20X7 $Sept 1 Motor vehicles: JY 1 18,000 Sept 1 Accumulated depreciation 4,500 " 20 Bank 12,500 Dec 31 Profit and loss: Loss on disposal 1,000 18,000 18,000
20X6 $ 20X6 $Dec 31 Balance c/d 2,900 Dec 31 Profit and loss: JY 1 ($18,000 × 20% × JY 2 ($24,000 × 20% ×
20X7 20X7Sept 1 Disposal: JY 1 4,500 Jan 1 Balance b/d 2,900Dec 31 Balance c/d 5,600 Sept 1 Profit and loss: JY 1 ($18,000 × 20% × JY 2 ($24,000 × 20%) 4,800
JY 1 JY 2 JY 1 JY 220X6 $ $ 20X6 $ $May 31 Bank: Deposit 3,120 — May 31 Cash price 18,000 —Oct 31 Bank: Deposit — 4,800 Oct 31 Cash price — 24,000Dec 31 Bank: Instalments Dec 31 Profit and loss: 7 × $700 4,900 — HP interest: 7 × $80 560 — 2 × $900 — 1,800 2 × $100 — 200
20X7 20X7 Aug 31 Bank (8 × $700) 5,600 — Jan 1 Balance b/d 10,540 17,600Sept 20 Bank to settle 6,000 — Sept 20 Profit and loss:Dec 31 Bank (12 × $900) — 10,800 HP interest 1,060 — " 31 Balance c/d — 8,000 Dec 31 Profit and loss: HP interest (12 × $100) — 1,200
20X7 $ 20X7 $Sept 1 Motor vehicles: JY 1 18,000 Sept 1 Accumulated depreciation 4,500 " 20 Bank 12,500 Dec 31 Profit and loss: Loss on disposal 1,000

20 Frank Wood’s Business Accounting 2 Solutions Manual Hong Kong Edition Third Edition © Pearson Education Asia Limited 2007
Question Question Question Question Question Question Question Question 4-7A4-7A4-7A4-7A4-7A
Object Ltd Trading and Profit and Loss Account for the year ended 31 August 20X6
$ $Hire purchase sales 540,000Cash sales 71,000 611,000Less Cost of goods sold: Opening stock 15,000 Purchases 342,000 Stock repossessed 2,500 359,500
Less Closing stock (W1) Less Closing stock (W1) Less (12,000) (347,500) 263,500Add Profit on repossessed goods (W2) 700Add Profit on repossessed goods (W2) 700Add 264,200Less Provision for unrealised profit (W3) Less Provision for unrealised profit (W3) Less (99,792)Gross profit 164,408Less Administration and shop expenses 130,000Less Administration and shop expenses 130,000Less Depreciation 15,000 (145,000)Net profit for the year 19,408
Balance Sheet as at 31 August 20X6
$ $ $Non-current assetsPremises and equipment at cost 100,000Less Accumulated depreciation Less Accumulated depreciation Less (60,000) 40,000
Current assetsStock 12,000Debtors (W4) 223,560Less Provision for unrealised profit (W3) (99,360) 124,200Bank and cash 6,208 142,408Current liabilitiesTrade creditors (80,000)Net current assets 62,408 102,408
Capital and reservesIssued share capital, fully paid 75,000Profit and loss account ($8,000 + $19,408) 27,408 102,408

21Frank Wood’s Business Accounting 2 Solutions Manual Hong Kong Edition Third Edition © Pearson Education Asia Limited 2007
Workings: (W1) $ $ $ Opening stock 15,000 Purchases 342,000 357,000 Cash sales 71,000
Less Sale of repossessed stock Less Sale of repossessed stock Less (3,500) 67,500 Accordingly: Cash sales: Cost ($67,500 × 100
150) 45,000 HP sales: Cost ($540,000 × 100
180) 300,000 (345,000) Closing stock 12,000
(W2) Repossession
$ $Debtors 3,240 Provision for unrealised profit 1,440Profit to trading account 700 Purchases 2,500
3,940 3,940
(W3) Provision for Unrealised Profit
$ $Repossessions ($3,240 × 80
180) 1,440 Balance b/d 1,008Balance c/d ($223,560 × 80
180) 99,360 Trading account 99,792100,800 100,800
(W4) HP Debtors
$ $Balance b/d 2,268 Cash 315,468HP sales 540,000 Repossessions 3,240 Balance c/d 223,560
542,268 542,268
Question Question Question Question Question Question Question Question 4-9A4-9A4-9A4-9A4-9A
(a) (i) Machine
$1.1.X7 HP Loan 20,000
(ii) Accumulated Depreciation: Machinery Accumulated Depreciation: Machinery Accumulated Deprecia
$ $31.12.X7 Balance c/d 4,000 31.12.X7 Profit and loss 4,000
31.12.X8 Balance c/d 8,000 1.1.X8 Balance b/d 4,000 31.12.X8 Profit and loss 4,000 8,000 8,000
31.12.X9 Balance c/d 12,000 1.1.X9 Balance b/d 8,000 31.12.X9 Profit and loss 4,000 12,000 12,000
$ $Debtors 3,240 Provision for unrealised profit 1,440Profit to trading account 700 Purchases 2,500
$ $) 1,440 Balance b/d 1,008) 99,360 Trading account 99,792
$ $Balance b/d 2,268 Cash 315,468HP sales 540,000 Repossessions 3,240 Balance c/d 223,560
$ $ 31.12.X7 Profit and loss
31.12.X8 Balance c/d 8,000 1.1.X8 Balance b/d 4,000 31.12.X8 Profit and loss 4,000
31.12.X9 Balance c/d 12,000 1.1.X9 Balance b/d 8,000 31.12.X9 Profit and loss 4,000
22 Frank Wood’s Business Accounting 2 Solutions Manual Hong Kong Edition Third Edition © Pearson Education Asia Limited 2007
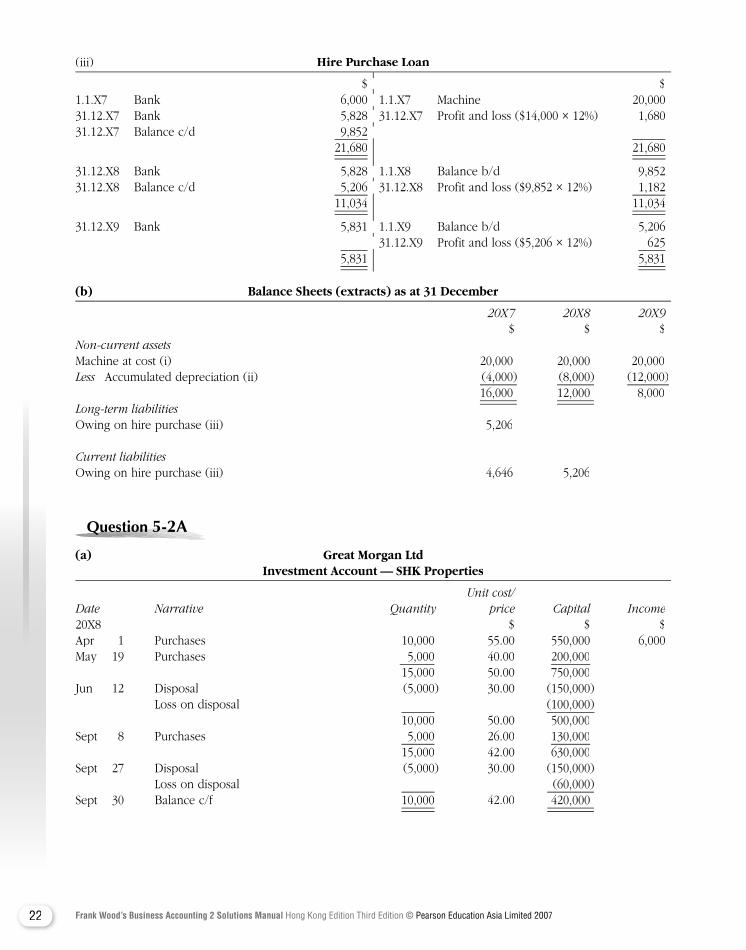
(iii) Hire Purchase Loan Hire Purchase Loan Hire P
$ $1.1.X7 Bank 6,000 1.1.X7 Machine 20,00031.12.X7 Bank 5,828 31.12.X7 Profit and loss ($14,000 × 12%) 1,680 31.12.X7 Balance c/d 9,852 21,680 21,680
31.12.X8 Bank 5,828 1.1.X8 Balance b/d 9,85231.12.X8 Balance c/d 5,206 31.12.X8 Profit and loss ($9,852 × 12%) 1,182 11,034 11,034
31.12.X9 Bank 5,831 1.1.X9 Balance b/d 5,206 31.12.X9 Profit and loss ($5,206 × 12%) 625 5,831 5,831
(b) Balance Sheets (extracts) as at 31 December
20X7 20X8 20X9 $ $ $Non-current assets Machine at cost (i) 20,000 20,000 20,000Less Accumulated depreciation (ii) (4,000) (8,000) Less Accumulated depreciation (ii) (4,000) (8,000) Less (12,000) 16,000 12,000 8,000Long-term liabilitiesOwing on hire purchase (iii) 5,206
Current liabilitiesOwing on hire purchase (iii) 4,646 5,206
Question Question Question Question Question Question Question Question 5-2A5-2A5-2A5-2A5-2A
(a) Great Morgan Ltd Investment Account — SHK Properties
Unit cost/Date Narrative Quantity price Capital Income20X8 $ $ $Apr 1 Purchases 10,000 55.00 550,000 6,000May 19 Purchases 5,000 40.00 200,000 15,000 50.00 750,000Jun 12 Disposal (5,000) 30.00 (150,000) Loss on disposal (100,000) 10,000 50.00 500,000Sept 8 Purchases 5,000 26.00 130,000 15,000 42.00 630,000Sept 27 Disposal (5,000) 30.00 (150,000) Loss on disposal (60,000)Sept 30 Balance c/f 10,000 42.00 420,000
$ $1.1.X7 Bank 6,000 1.1.X7 Machine 20,00031.12.X7 Bank 5,828 31.12.X7 Profit and loss ($14,000 × 12%) 1,680 31.12.X7 Balance c/d 9,852
31.12.X8 Bank 5,828 1.1.X8 Balance b/d 9,85231.12.X8 Balance c/d 5,206 31.12.X8 Profit and loss ($9,852 × 12%) 1,182
31.12.X9 Bank 5,831 1.1.X9 Balance b/d 5,206 31.12.X9 Profit and loss ($5,206 × 12%) 625
23Frank Wood’s Business Accounting 2 Solutions Manual Hong Kong Edition Third Edition © Pearson Education Asia Limited 2007
(b) List of listed investments at 30 September 20X8:
Name of security Quantity Unit cost Cost Unit price Market value $ $ $ $
SHK Properties 10,000 42.00 420,000 27.00 270,000Henderson Land 10,000 38.00 380,000 26.50 265,000New World 10,000 26.40 264,000 10.40 104,000Cheung Kong 10,000 43.00 430,000 35.90 359,000 1,494,000 998,000
HK Telecom 10,000 13.90 139,000 15.10 151,000HK Electric 10,000 22.80 228,000 26.70 267,000China Light 10,000 34.10 341,000 37.00 370,000HK & China Gas 10,000 7.50 75,000 9.50 95,000HK & China Gas 20Y0 Warrant 500 0.00 — 0.35 — 0.35 — 175 783,000 883,175
Citibank 1,000 US$47.00 366,600 US$48.00 374,400American Online 1,000 US$97.00 756,600 US$99.50 776,100AT&T 1,000 US$62.50 487,500 US$59.00 460,200 1,610,700 1,610,700 3,887,700 3,491,875
(c) Market value Cost of investment Provision for diminution at 30 Sept 20X8 at 30 Sept 20X8 in value of investments
$ $ $Local listed investment — Property stocks 998,000 1,494,000 496,000Local listed investment — Utility stocks 883,175 783,000 —Overseas investment — Listed stocks 1,610,700 1,610,700 —Unlisted investment 300,000 300,000 —
3,791,875 4,187,700 496,000
Since the unlisted investments were purchased on 30 September 20X8, it was presumed that the purchase price represented the market value.
(d) Notes to the accountsInvestments $Investments $Investments
Shares listed in Hong Kong, at cost 2,277,000Less Provision for diminution in value Less Provision for diminution in value Less (496,000)
Shares listed in Hong Kong, at written down value 1,781,000 Shares listed in overseas, at cost 1,610,700 Listed shares 3,391,700 Unlisted shares, at cost 300,000 3,691,700
Market value of listed investments 3,491,875
24 Frank Wood’s Business Accounting 2 Solutions Manual Hong Kong Edition Third Edition © Pearson Education Asia Limited 2007
Question Question Question Question Question Question Question Question 6-2A6-2A6-2A6-2A6-2A6-2A
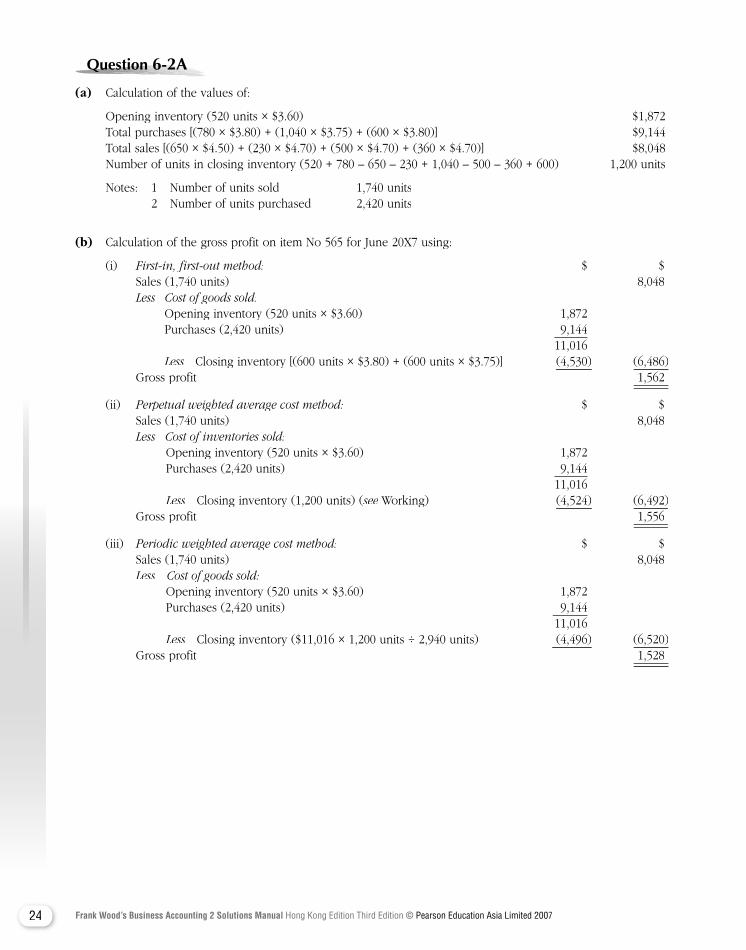
(a) Calculation of the values of:
Opening inventory (520 units × $3.60) $1,872 Total purchases [(780 × $3.80) + (1,040 × $3.75) + (600 × $3.80)] $9,144 Total sales [(650 × $4.50) + (230 × $4.70) + (500 × $4.70) + (360 × $4.70)] $8,048 Number of units in closing inventory (520 + 780 – 650 – 230 + 1,040 – 500 – 360 + 600) 1,200 units
Notes: 1 Number of units sold 1,740 units 2 Number of units purchased 2,420 units
(b) Calculation of the gross profit on item No 565 for June 20X7 using:
(i) First-in, first-out method: $ $ Sales (1,740 units) 8,048 Less Cost of goods sold: Opening inventory (520 units × $3.60) 1,872 Purchases (2,420 units) 9,144 11,016 Less Closing inventory [(600 units × $3.80) + (600 units × $3.75)] Less Closing inventory [(600 units × $3.80) + (600 units × $3.75)] Less (4,530) (6,486) Gross profit 1,562
(ii) Perpetual weighted average cost method: $ $ Sales (1,740 units) 8,048 Less Cost of inventories sold: Opening inventory (520 units × $3.60) 1,872 Purchases (2,420 units) 9,144 11,016 Less Closing inventory (1,200 units) (Less Closing inventory (1,200 units) (Less see Working) (4,524) (6,492) Gross profit 1,556
(iii) Periodic weighted average cost method: $ $ Sales (1,740 units) 8,048 Less Less Less Cost of goods sold: Opening inventory (520 units × $3.60) 1,872 Purchases (2,420 units) 9,144 11,016 Less Closing inventory ($11,016 × 1,200 units ÷ 2,940 units) Less Closing inventory ($11,016 × 1,200 units ÷ 2,940 units) Less (4,496) (6,520) Gross profit 1,528

25Frank Wood’s Business Accounting 2 Solutions Manual Hong Kong Edition Third Edition © Pearson Education Asia Limited 2007
Working:Perpetual weighted average cost method
Date Units Unit price Amount $ $ Jun 1 Opening inventory b/d 520 3.60 1,872 5 Purchases 780 3.80 2,964 1,300 3.72 4,836 9 Sales (650 ) 3.72 (2,418 ) 650 3.72 2,418 11 Sales (230 ) 3.72 (856 ) 420 3.72 1,562 16 Purchases 1,040 3.75 3,900 1,460 3.74 5,462 22 Sales (500 ) 3.74 (1,871 ) 960 3.74 3,591 25 Sales (360 ) 3.74 (1,347 ) 600 3.74 2,244 29 Purchases 600 3.80 2,280 30 Closing inventory c/d 1,200 3.77 4,524
Question Question Question Question Question Question Question Question 8-4A8-4A8-4A8-4A8-4A
(Dates omitted)(a) Ordinary Share Capital
$ $Forfeited shares (5,000 × $1) 5,000 Balance b/d 500,000Balance c/d 595,000 Application and allotment (100,000 × $0.70) 70,000 First and final call 30,000 600,000 600,000
Balance c/d 600,000 Balance b/d 595,000 Amber Ltd 5,000 600,000 600,000
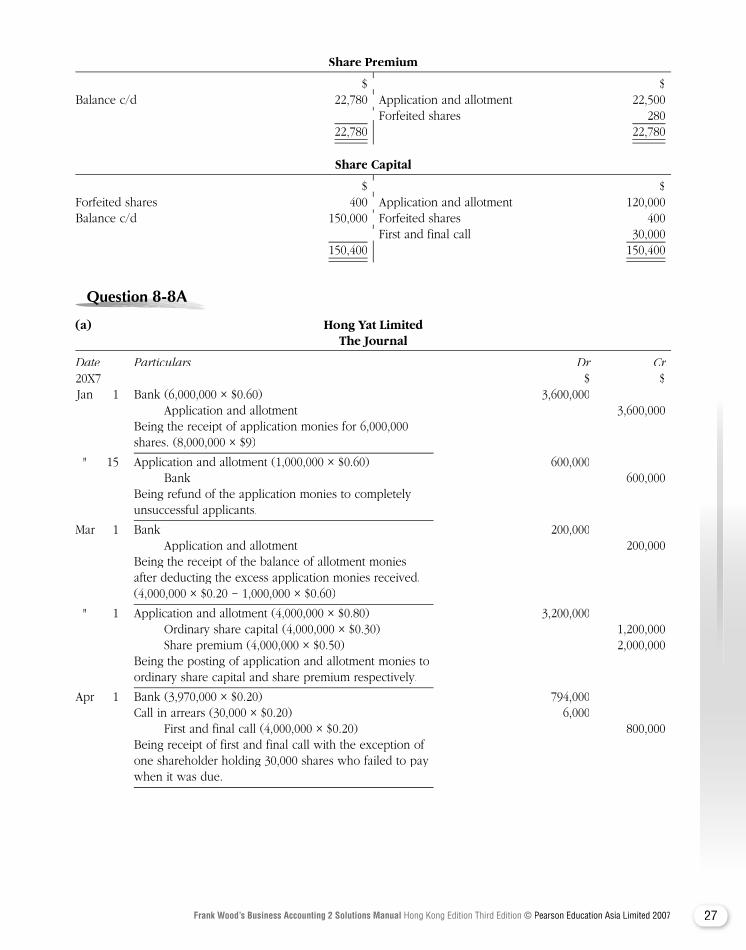
(b) Share Premium
$ $Balance c/d 52,500 Application and allotment (100,000 × $0.50) 50,000 Forfeited shares 2,500 52,500 52,500
(c) Application and Allotment
$ $Bank refunds (75,000 × $0.65) 48,750 Bank (200,000 × $0.65) 130,000Bank refunds re 3 for 4 allotment Bank (100,000 × $0.55) 55,000 (25,000 × $0.65) 16,250Ordinary share capital 70,000Share premium 50,000 185,000 185,000
$ $Forfeited shares (5,000 × $1) 5,000 Balance b/d 500,000Balance c/d 595,000 Application and allotment (100,000 × $0.70) 70,000 First and final call 30,000
Balance c/d 600,000 Balance b/d 595,000 Amber Ltd 5,000
$ $Balance c/d 52,500 Application and allotment (100,000 × $0.50) 50,000 Forfeited shares 2,500
$ $Bank refunds (75,000 × $0.65) 48,750 Bank (200,000 × $0.65) 130,000Bank refunds re 3 for 4 allotment Bank (100,000 × $0.55) 55,000

26 Frank Wood’s Business Accounting 2 Solutions Manual Hong Kong Edition Third Edition © Pearson Education Asia Limited 2007
(d) First and Final Call
$ $Ordinary share capital (100,000 × $0.30) 30,000 Bank (95,000 × $0.30) 28,500 Forfeited shares (5,000 × $0.30) 1,500
30,000 30,000
(e) Forfeited Shares
$ $First and final call 1,500 Ordinary share capital 5,000Amber Ltd 1,000Share premium {5,000 × [$(0.65 + 0.55 – 0.50 + 0.80) – $1]} 2,500
5,000 5,000
(f) Amber Ltd(f) Amber Ltd(f) Am
$ $Ordinary share capital 5,000 Bank (5,000 × $0.80) 4,000 Forfeited shares: Discount on reissue 1,000
5,000 5,000
Question Question Question Question Question Question Question Question 8-6A8-6A8-6A8-6A8-6A
Grobigg Ltd Application and Allotment
$ $Bank: Return of unsuccessful application Bank (180,000 × $0.75) 135,000 monies (8,000 × $0.75) 6,000 Bank: Balance due on allotment 13,500Share capital: Due on application and allotment (150,000 × $0.80) 120,000Share premium (150,000 × $0.15) 22,500
148,500 148,500
First and Final Call
$ $Share capital (150,000 × $0.20) 30,000 Bank (149,600 × $0.20) 29,920 Forfeited shares 80
30,000 30,000
Forfeited Shares
$ $First and final call 80 Share capital 400Share capital 400 Bank (400 × $0.90) 360Share premium {400 × [$(0.75 + 0.20 – 0.15 + 0.90) – $1]} 280
760 760
$ $Ordinary share capital (100,000 × $0.30) 30,000 Bank (95,000 × $0.30) 28,500 Forfeited shares (5,000 × $0.30) 1,500
$ $First and final call 1,500 Ordinary share capital 5,000
$ $Ordinary share capital 5,000 Bank (5,000 × $0.80) 4,000 Forfeited shares:
$ $Bank: Return of unsuccessful application Bank (180,000 × $0.75) 135,000 monies (8,000 × $0.75) 6,000 Bank: Balance due on allotment 13,500
$ $Share capital (150,000 × $0.20) 30,000 Bank (149,600 × $0.20) 29,920 Forfeited shares 80
$ $First and final call 80 Share capital 400Share capital 400 Bank (400 × $0.90) 360
27Frank Wood’s Business Accounting 2 Solutions Manual Hong Kong Edition Third Edition © Pearson Education Asia Limited 2007
Share Premium
$ $Balance c/d 22,780 Application and allotment 22,500 Forfeited shares 280
22,780 22,780
Share Capital
$ $Forfeited shares 400 Application and allotment 120,000Balance c/d 150,000 Forfeited shares 400 First and final call 30,000
150,400 150,400
Question Question Question Question Question Question Question Question 8-8A8-8A8-8A8-8A8-8A
(a) Hong Yat Limited The Journal
Date Particulars Dr Cr20X7 $ $ Jan 1 Bank (6,000,000 × $0.60) 3,600,000 Application and allotment 3,600,000 Being the receipt of application monies for 6,000,000 shares. (8,000,000 × $9)
" 15 Application and allotment (1,000,000 × $0.60) 600,000 Bank 600,000 Being refund of the application monies to completely unsuccessful applicants.
Mar 1 Bank 200,000 Application and allotment 200,000 Being the receipt of the balance of allotment monies after deducting the excess application monies received. (4,000,000 × $0.20 − 1,000,000 × $0.60)
" 1 Application and allotment (4,000,000 × $0.80) 3,200,000 Ordinary share capital (4,000,000 × $0.30) 1,200,000 Share premium (4,000,000 × $0.50) 2,000,000 Being the posting of application and allotment monies to ordinary share capital and share premium respectively.
Apr 1 Bank (3,970,000 × $0.20) 794,000 Call in arrears (30,000 × $0.20) 6,000 First and final call (4,000,000 × $0.20) 800,000 Being receipt of first and final call with the exception of one shareholder holding 30,000 shares who failed to pay when it was due.
$ $Balance c/d 22,780 Application and allotment 22,500 Forfeited shares 280
$ $Forfeited shares 400 Application and allotment 120,000Balance c/d 150,000 Forfeited shares 400 First and final call 30,000

28 Frank Wood’s Business Accounting 2 Solutions Manual Hong Kong Edition Third Edition © Pearson Education Asia Limited 2007
Hong Yat Limited The Journal
Date Particulars Dr Cr20X7 $ $ " 1 First and final call 800,000 Ordinary share capital 800,000 Being the posting of the first and final call monies to ordinary share capital.
May 31 Forfeited shares (30,000 × $0.20) 6,000 Call in arrears 6,000 Being the transfer of outstanding amount on 30,000 shares to forfeited shares.
" 31 Ordinary share capital (30,000 × $0.50) 15,000 Forfeited shares 15,000 Being the cancellation of 30,000 forfeited shares.
Jun 6 Bank (30,000 × $0.50) 15,000 Forfeited shares 15,000 Being the reissue of the 30,000 forfeited shares at $15,000 fully paid.
" 6 Forfeited shares ($15,000 + $9,000) 24,000 Ordinary share capital [30,000 × ($0.60 − $0.50 + $0.20 + $0.20)] 15,000 Share premium {[($0.60 + $0.20 − $0.50 + $0.50) − $0.50] × 30,000} 9,000 Being the posting of the relevant amount to the ordinary share capital and share premium. (profit on re-issue of forfeited shares)
(b) Advantages: • No fixed annual charges (dividends) are payable. • Ordinary shares do not have a maturity date for repayment. • It reduces the gearing level of the company.
29Frank Wood’s Business Accounting 2 Solutions Manual Hong Kong Edition Third Edition © Pearson Education Asia Limited 2007
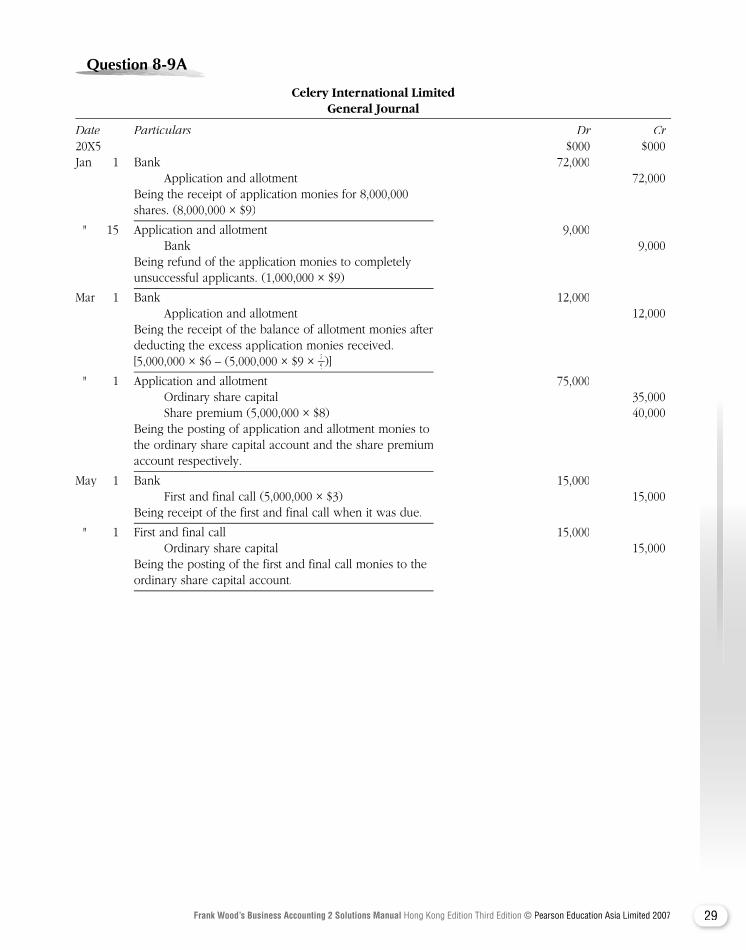
Question Question Question Question Question Question Question Question 8-9A8-9A8-9A8-9A8-9A
Celery International Limited General Journal
Date Particulars Dr Cr20X5 $000 $000Jan 1 Bank 72,000 Application and allotment 72,000 Being the receipt of application monies for 8,000,000 shares. (8,000,000 × $9)
" 15 Application and allotment 9,000 Bank 9,000 Being refund of the application monies to completely unsuccessful applicants. (1,000,000 × $9)
Mar 1 Bank 12,000 Application and allotment 12,000 Being the receipt of the balance of allotment monies after deducting the excess application monies received. [5,000,000 × $6 – (5,000,000 × $9 × 2
5 )]
" 1 Application and allotment 75,000 Ordinary share capital 35,000 Share premium (5,000,000 × $8) 40,000 Being the posting of application and allotment monies to the ordinary share capital account and the share premium account respectively.
May 1 Bank 15,000 First and final call (5,000,000 × $3) 15,000 Being receipt of the first and final call when it was due.
" 1 First and final call 15,000 Ordinary share capital 15,000 Being the posting of the first and final call monies to the ordinary share capital account.
30 Frank Wood’s Business Accounting 2 Solutions Manual Hong Kong Edition Third Edition © Pearson Education Asia Limited 2007
Question Question Question Question Question Question Question Question 9-2A9-2A9-2A9-2A9-2A
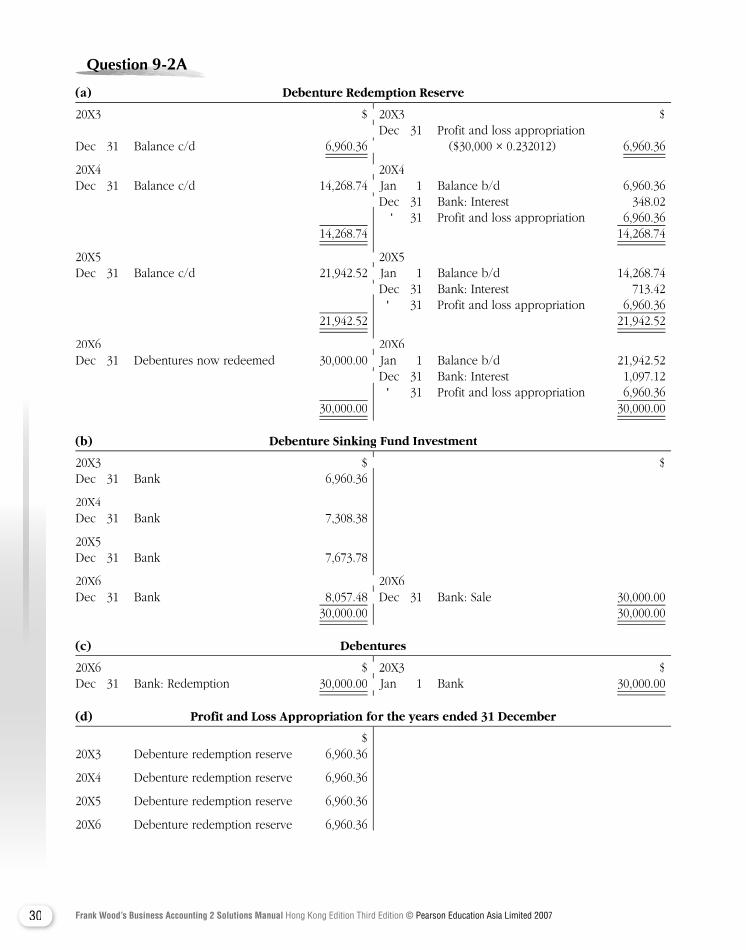
(a) Debenture Redemption Reserve
20X3 $ 20X3 $ Dec 31 Profit and loss appropriation Dec 31 Balance c/d 6,960.36 ($30,000 × 0.232012) 6,960.36
20X4 20X4 Dec 31 Balance c/d 14,268.74 Jan 1 Balance b/d 6,960.36 Dec 31 Bank: Interest 348.02 " 31 Profit and loss appropriation 6,960.36 14,268.74 14,268.74
20X5 20X5 Dec 31 Balance c/d 21,942.52 Jan 1 Balance b/d 14,268.74 Dec 31 Bank: Interest 713.42 " 31 Profit and loss appropriation 6,960.36 21,942.52 21,942.52
20X6 20X6 Dec 31 Debentures now redeemed 30,000.00 Jan 1 Balance b/d 21,942.52 Dec 31 Bank: Interest 1,097.12 " 31 Profit and loss appropriation 6,960.36 30,000.00 30,000.00
(b) Debenture Sinking Fund Investment
20X3 $ $ Dec 31 Bank 6,960.36
20X4 Dec 31 Bank 7,308.38
20X5 Dec 31 Bank 7,673.78
20X6 20X6 Dec 31 Bank 8,057.48 Dec 31 Bank: Sale 30,000.00 30,000.00 30,000.00
(c) Debentures
20X6 $ 20X3 $ Dec 31 Bank: Redemption 30,000.00 Jan 1 Bank 30,000.00
(d) Profit and Loss Appropriation for the years ended 31 December
$20X3 Debenture redemption reserve 6,960.36
20X4 Debenture redemption reserve 6,960.36
20X5 Debenture redemption reserve 6,960.36
20X6 Debenture redemption reserve 6,960.36
20X3 $ 20X3 $ Dec 31 Profit and loss appropriation
($30,000 × 0.232012)
20X4 20X4 Dec 31 Balance c/d 14,268.74 Jan 1 Balance b/d 6,960.36 Dec 31 Bank: Interest 348.02
20X5 20X5 Dec 31 Balance c/d 21,942.52 Jan 1 Balance b/d 14,268.74 Dec 31 Bank: Interest 713.42
20X6 20X6 Dec 31 Debentures now redeemed 30,000.00 Jan 1 Balance b/d 21,942.52 Dec 31 Bank: Interest 1,097.12
20X3 $ $
20X6 20X6 Dec 31 Bank 8,057.48 Dec 31 Bank: Sale 30,000.00
20X6 $ 20X3 $ Jan 1 Bank
31Frank Wood’s Business Accounting 2 Solutions Manual Hong Kong Edition Third Edition © Pearson Education Asia Limited 2007
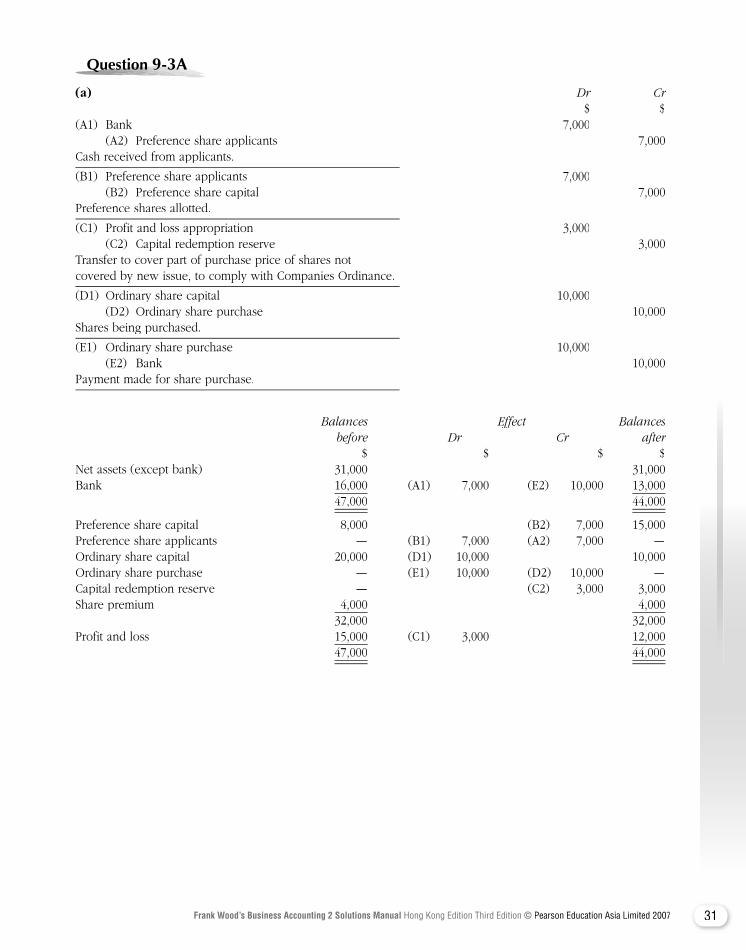
Question Question Question Question Question Question Question Question 9-3A9-3A9-3A9-3A9-3A
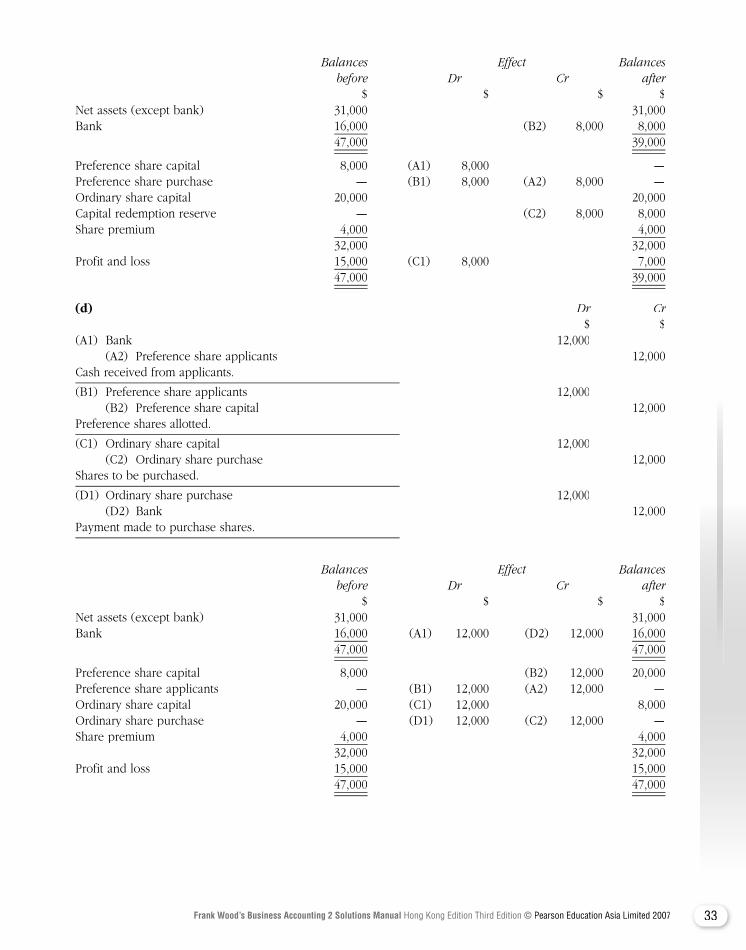
(a) Dr Cr $ $(A1) Bank 7,000 (A2) Preference share applicants 7,000Cash received from applicants.
(B1) Preference share applicants 7,000 (B2) Preference share capital 7,000Preference shares allotted.
(C1) Profit and loss appropriation 3,000 (C2) Capital redemption reserve 3,000Transfer to cover part of purchase price of shares not covered by new issue, to comply with Companies Ordinance.
(D1) Ordinary share capital 10,000 (D2) Ordinary share purchase 10,000Shares being purchased.
(E1) Ordinary share purchase 10,000 (E2) Bank 10,000Payment made for share purchase.
Balances Effect Balances before Dr Cr after $ $ $ $Net assets (except bank) 31,000 31,000Bank 16,000 (A1) 7,000 (E2) 10,000 13,000 47,000 44,000
Preference share capital 8,000 (B2) 7,000 15,000Preference share applicants — (B1) 7,000 (A2) 7,000 —Ordinary share capital 20,000 (D1) 10,000 10,000Ordinary share purchase — (E1) 10,000 (D2) 10,000 —Capital redemption reserve — (C2) 3,000 3,000Share premium 4,000 4,000 32,000 32,000Profit and loss 15,000 (C1) 3,000 12,000 47,000 44,000
32 Frank Wood’s Business Accounting 2 Solutions Manual Hong Kong Edition Third Edition © Pearson Education Asia Limited 2007
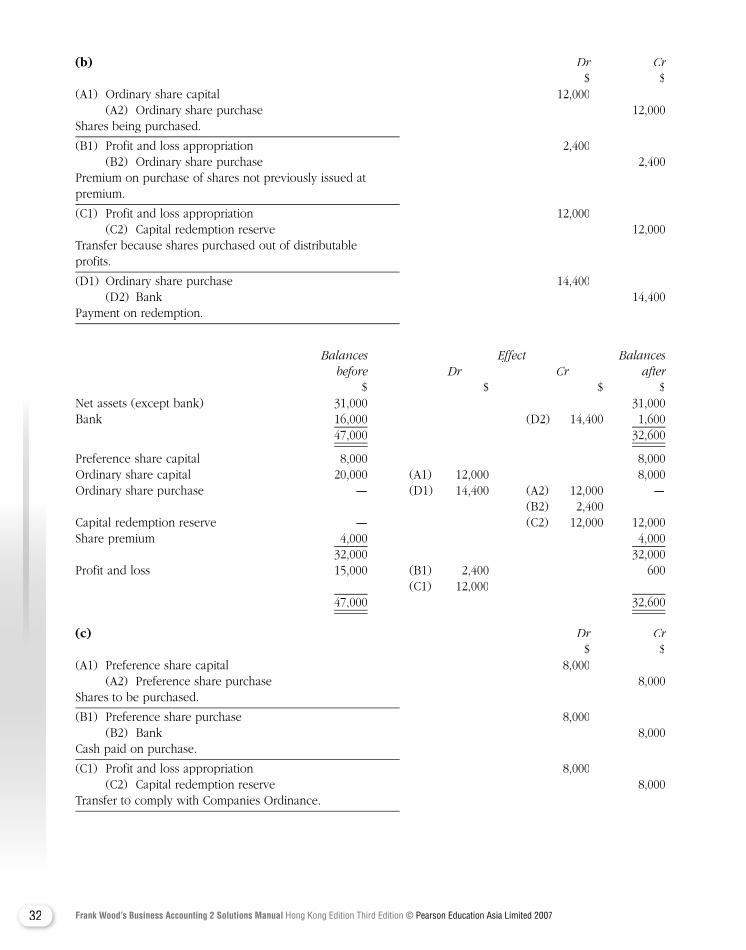
(b) Dr Cr $ $(A1) Ordinary share capital 12,000 (A2) Ordinary share purchase 12,000Shares being purchased.
(B1) Profit and loss appropriation 2,400 (B2) Ordinary share purchase 2,400Premium on purchase of shares not previously issued at premium.
(C1) Profit and loss appropriation 12,000 (C2) Capital redemption reserve 12,000Transfer because shares purchased out of distributable profits.
(D1) Ordinary share purchase 14,400 (D2) Bank 14,400Payment on redemption.
Balances Effect Balances before Dr Cr after $ $ $ $Net assets (except bank) 31,000 31,000Bank 16,000 (D2) 14,400 1,600 47,000 32,600
Preference share capital 8,000 8,000Ordinary share capital 20,000 (A1) 12,000 8,000Ordinary share purchase — (D1) 14,400 (A2) 12,000 — (B2) 2,400Capital redemption reserve — (C2) 12,000 12,000Share premium 4,000 4,000 32,000 32,000Profit and loss 15,000 (B1) 2,400 600 (C1) 12,000 47,000 32,600
(c) Dr Cr $ $(A1) Preference share capital 8,000 (A2) Preference share purchase 8,000Shares to be purchased.
(B1) Preference share purchase 8,000 (B2) Bank 8,000Cash paid on purchase.
(C1) Profit and loss appropriation 8,000 (C2) Capital redemption reserve 8,000Transfer to comply with Companies Ordinance.
33Frank Wood’s Business Accounting 2 Solutions Manual Hong Kong Edition Third Edition © Pearson Education Asia Limited 2007
Balances Effect Balances before Dr Cr after $ $ $ $Net assets (except bank) 31,000 31,000Bank 16,000 (B2) 8,000 8,000 47,000 39,000
Preference share capital 8,000 (A1) 8,000 —Preference share purchase — (B1) 8,000 (A2) 8,000 —Ordinary share capital 20,000 20,000Capital redemption reserve — (C2) 8,000 8,000Share premium 4,000 4,000 32,000 32,000Profit and loss 15,000 (C1) 8,000 7,000 47,000 39,000
(d) Dr Cr $ $(A1) Bank 12,000 (A2) Preference share applicants 12,000Cash received from applicants.
(B1) Preference share applicants 12,000 (B2) Preference share capital 12,000Preference shares allotted.
(C1) Ordinary share capital 12,000 (C2) Ordinary share purchase 12,000Shares to be purchased.
(D1) Ordinary share purchase 12,000 (D2) Bank 12,000Payment made to purchase shares.
Balances Effect Balances before Dr Cr after $ $ $ $Net assets (except bank) 31,000 31,000Bank 16,000 (A1) 12,000 (D2) 12,000 16,000 47,000 47,000
Preference share capital 8,000 (B2) 12,000 20,000Preference share applicants — (B1) 12,000 (A2) 12,000 —Ordinary share capital 20,000 (C1) 12,000 8,000Ordinary share purchase — (D1) 12,000 (C2) 12,000 —Share premium 4,000 4,000 32,000 32,000Profit and loss 15,000 15,000 47,000 47,000
34 Frank Wood’s Business Accounting 2 Solutions Manual Hong Kong Edition Third Edition © Pearson Education Asia Limited 2007
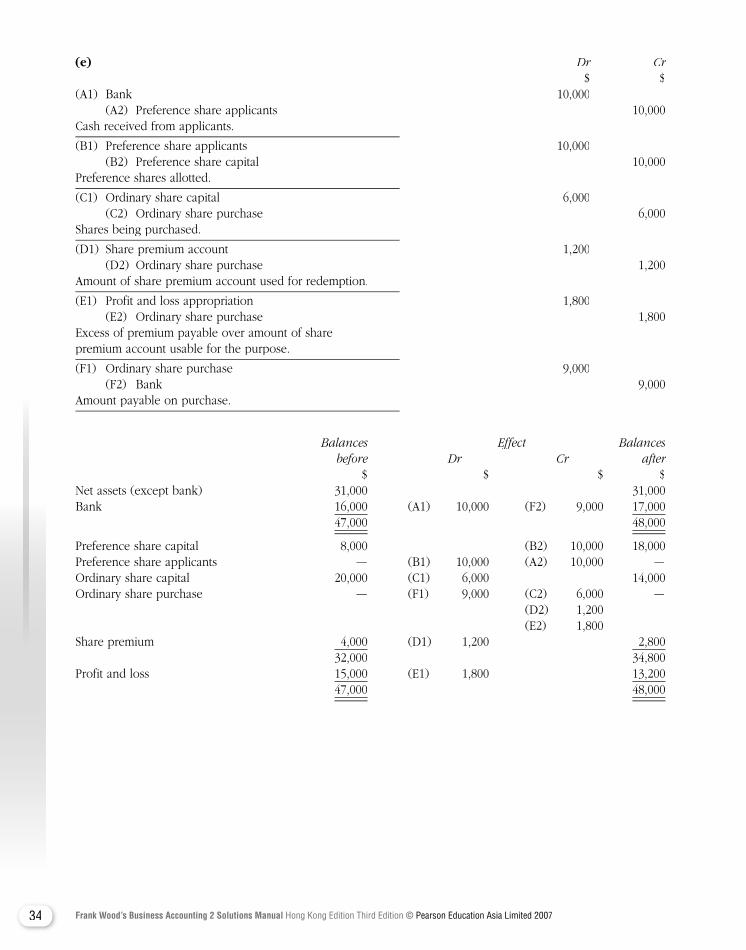
(e) Dr Cr $ $(A1) Bank 10,000 (A2) Preference share applicants 10,000Cash received from applicants.
(B1) Preference share applicants 10,000 (B2) Preference share capital 10,000Preference shares allotted.
(C1) Ordinary share capital 6,000 (C2) Ordinary share purchase 6,000Shares being purchased.
(D1) Share premium account 1,200 (D2) Ordinary share purchase 1,200Amount of share premium account used for redemption.
(E1) Profit and loss appropriation 1,800 (E2) Ordinary share purchase 1,800Excess of premium payable over amount of share premium account usable for the purpose.
(F1) Ordinary share purchase 9,000 (F2) Bank 9,000Amount payable on purchase.
Balances Effect Balances before Dr Cr after $ $ $ $Net assets (except bank) 31,000 31,000Bank 16,000 (A1) 10,000 (F2) 9,000 17,000 47,000 48,000
Preference share capital 8,000 (B2) 10,000 18,000Preference share applicants — (B1) 10,000 (A2) 10,000 —Ordinary share capital 20,000 (C1) 6,000 14,000Ordinary share purchase — (F1) 9,000 (C2) 6,000 — (D2) 1,200 (E2) 1,800 Share premium 4,000 (D1) 1,200 2,800 32,000 34,800Profit and loss 15,000 (E1) 1,800 13,200 47,000 48,000
35Frank Wood’s Business Accounting 2 Solutions Manual Hong Kong Edition Third Edition © Pearson Education Asia Limited 2007
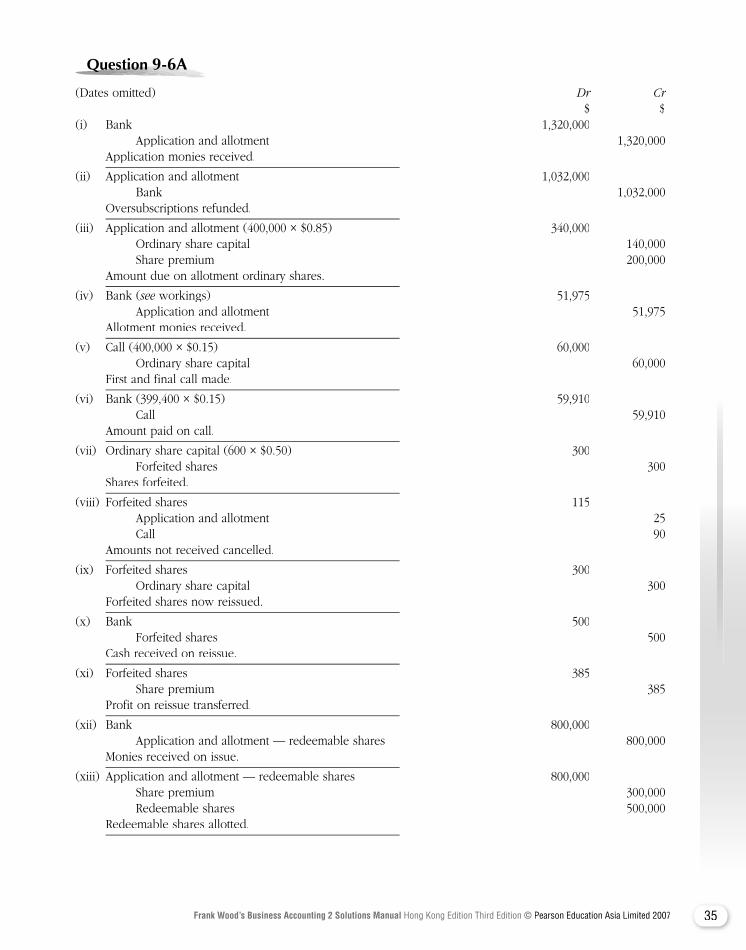
Question Question Question Question Question Question Question Question 9-6A9-6A9-6A9-6A9-6A
(Dates omitted) Dr Cr $ $(i) Bank 1,320,000 Application and allotment 1,320,000 Application monies received.
(ii) Application and allotment 1,032,000 Bank 1,032,000 Oversubscriptions refunded.
(iii) Application and allotment (400,000 × $0.85) 340,000 Ordinary share capital 140,000 Share premium 200,000 Amount due on allotment ordinary shares.
(iv) Bank (see workings) 51,975see workings) 51,975see Application and allotment 51,975 Allotment monies received.
(v) Call (400,000 × $0.15) 60,000 Ordinary share capital 60,000 First and final call made.
(vi) Bank (399,400 × $0.15) 59,910 Call 59,910 Amount paid on call.
(vii) Ordinary share capital (600 × $0.50) 300 Forfeited shares 300 Shares forfeited.
(viii) Forfeited shares 115 Application and allotment 25 Call 90 Amounts not received cancelled.
(ix) Forfeited shares 300 Ordinary share capital 300 Forfeited shares now reissued.
(x) Bank 500 Forfeited shares 500 Cash received on reissue.
(xi) Forfeited shares 385 Share premium 385 Profit on reissue transferred.
(xii) Bank 800,000 Application and allotment — redeemable shares 800,000 Monies received on issue.
(xiii) Application and allotment — redeemable shares 800,000 Share premium 300,000 Redeemable shares 500,000 Redeemable shares allotted.
36 Frank Wood’s Business Accounting 2 Solutions Manual Hong Kong Edition Third Edition © Pearson Education Asia Limited 2007
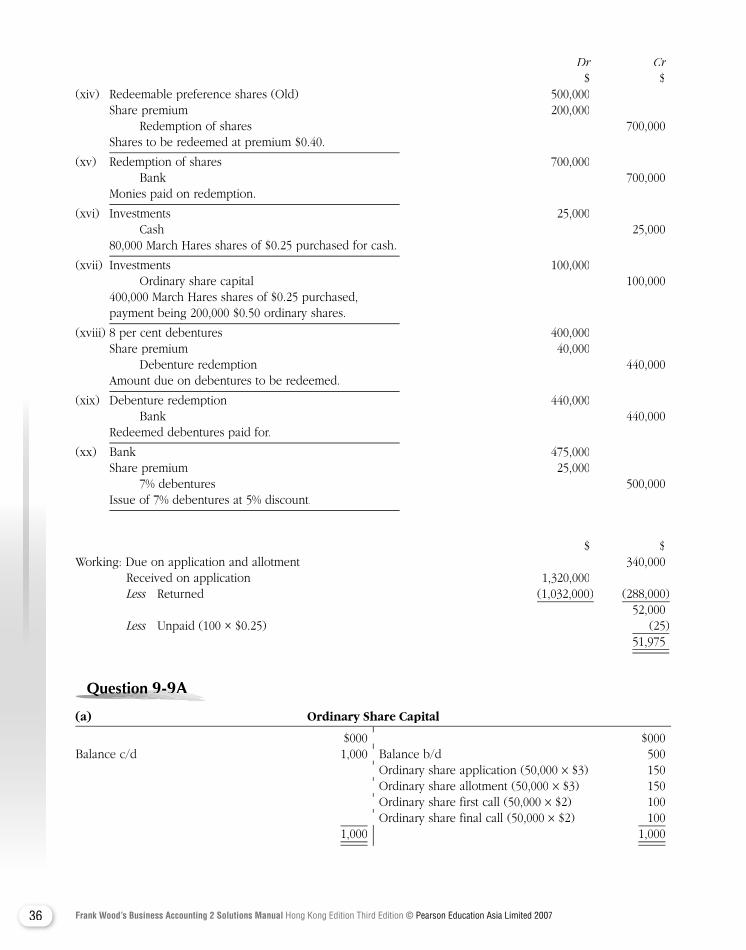
Dr Cr $ $(xiv) Redeemable preference shares (Old) 500,000 Share premium 200,000 Redemption of shares 700,000 Shares to be redeemed at premium $0.40.
(xv) Redemption of shares 700,000 Bank 700,000 Monies paid on redemption.
(xvi) Investments 25,000 Cash 25,000 80,000 March Hares shares of $0.25 purchased for cash.
(xvii) Investments 100,000 Ordinary share capital 100,000 400,000 March Hares shares of $0.25 purchased, payment being 200,000 $0.50 ordinary shares.
(xviii) 8 per cent debentures 400,000 Share premium 40,000 Debenture redemption 440,000 Amount due on debentures to be redeemed.
(xix) Debenture redemption 440,000 Bank 440,000 Redeemed debentures paid for.
(xx) Bank 475,000 Share premium 25,000 7% debentures 500,000 Issue of 7% debentures at 5% discount.
$ $Working: Due on application and allotment 340,000 Received on application 1,320,000
Less Returned Less Returned Less (1,032,000) (288,000) 52,000
Less Unpaid (100 × $0.25) (25)Less Unpaid (100 × $0.25) (25)Less 51,975
Question Question Question Question Question Question Question Question 9-9A9-9A9-9A9-9A9-9A
(a) Ordinary Share Capital
$000 $000Balance c/d 1,000 Balance b/d 500 Ordinary share application (50,000 × $3) 150 Ordinary share allotment (50,000 × $3) 150 Ordinary share first call (50,000 × $2) 100 Ordinary share final call (50,000 × $2) 100
1,000 1,000
$000 $000Balance c/d 1,000 Balance b/d 500 Ordinary share application (50,000 Ordinary share allotment (50,000 Ordinary share first call (50,000 Ordinary share final call (50,000

37Frank Wood’s Business Accounting 2 Solutions Manual Hong Kong Edition Third Edition © Pearson Education Asia Limited 2007
(b) and (c) Ordinary Share Application and Allotment
$000 $000Bank (10,000 × $3) 30 Bank (85,000 × $3) 255Ordinary share capital 300 Bank [(50,000 × $8) − $75,000] 325Share premium (50,000 × $5) 250
580 580
(d) Share Premium
$000 $000Balance c/d 305 Ordinary share allotment 250 Investments — own shares 55
305 305
(e) Ordinary Share — First Call(e) Ordinary Share — First Call(e) Ordinary
$000 $000Ordinary share capital 100 Bank 100
(f) Ordinary Share — Final Call(f) Ordinary Share — Final Call(f) Ordinary
$000 $000Ordinary share capital 100 Bank 90 Investments — own shares 10 100 100
(g) Investments — Own Shares
$000 $000Ordinary share — final call 10 Bank (5,000 × $13) 65Share premium 55
65 65
$000 $000 $3) 30 Bank (85,000
Ordinary share capital 300 Bank [(50,000
$000 $000Balance c/d 305 Ordinary share allotment 250 Investments — own shares 55
$000 $000 Bank
$000 $000Ordinary share capital 100 Bank 90 Investments — own shares 10
$000 $000Ordinary share — final call 10 Bank (5,000 Share premium 55
38 Frank Wood’s Business Accounting 2 Solutions Manual Hong Kong Edition Third Edition © Pearson Education Asia Limited 2007
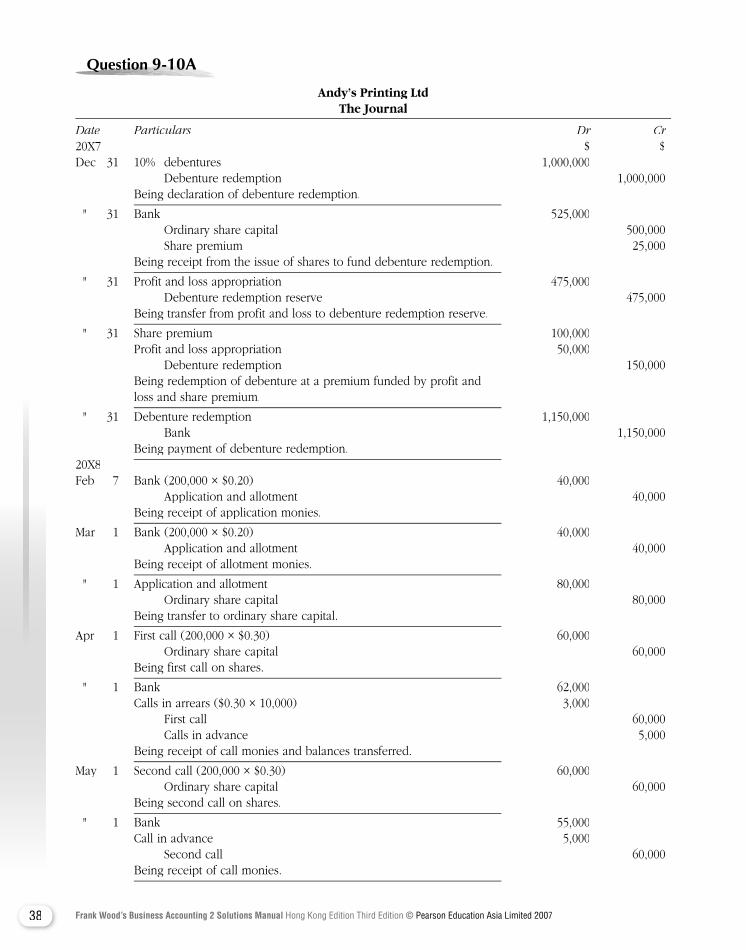
Question Question Question Question Question Question Question 9-10A9-10A9-10A9-10A9-10A9-10A
Andy’s Printing Ltd The Journal
Date Particulars Dr Cr20X7 $ $Dec 31 10% debentures 1,000,000 Debenture redemption 1,000,000 Being declaration of debenture redemption.
" 31 Bank 525,000 Ordinary share capital 500,000 Share premium 25,000 Being receipt from the issue of shares to fund debenture redemption.
" 31 Profit and loss appropriation 475,000 Debenture redemption reserve 475,000 Being transfer from profit and loss to debenture redemption reserve.
" 31 Share premium 100,000 Profit and loss appropriation 50,000 Debenture redemption 150,000 Being redemption of debenture at a premium funded by profit and loss and share premium.
" 31 Debenture redemption 1,150,000 Bank 1,150,000 Being payment of debenture redemption.20X8Feb 7 Bank (200,000 × $0.20) 40,000 Application and allotment 40,000 Being receipt of application monies.
Mar 1 Bank (200,000 × $0.20) 40,000 Application and allotment 40,000 Being receipt of allotment monies.
" 1 Application and allotment 80,000 Ordinary share capital 80,000 Being transfer to ordinary share capital.
Apr 1 First call (200,000 × $0.30) 60,000 Ordinary share capital 60,000 Being first call on shares.
" 1 Bank 62,000 Calls in arrears ($0.30 × 10,000) 3,000 First call 60,000 Calls in advance 5,000 Being receipt of call monies and balances transferred.
May 1 Second call (200,000 × $0.30) 60,000 Ordinary share capital 60,000 Being second call on shares.
" 1 Bank 55,000 Call in advance 5,000 Second call 60,000 Being receipt of call monies.
39Frank Wood’s Business Accounting 2 Solutions Manual Hong Kong Edition Third Edition © Pearson Education Asia Limited 2007
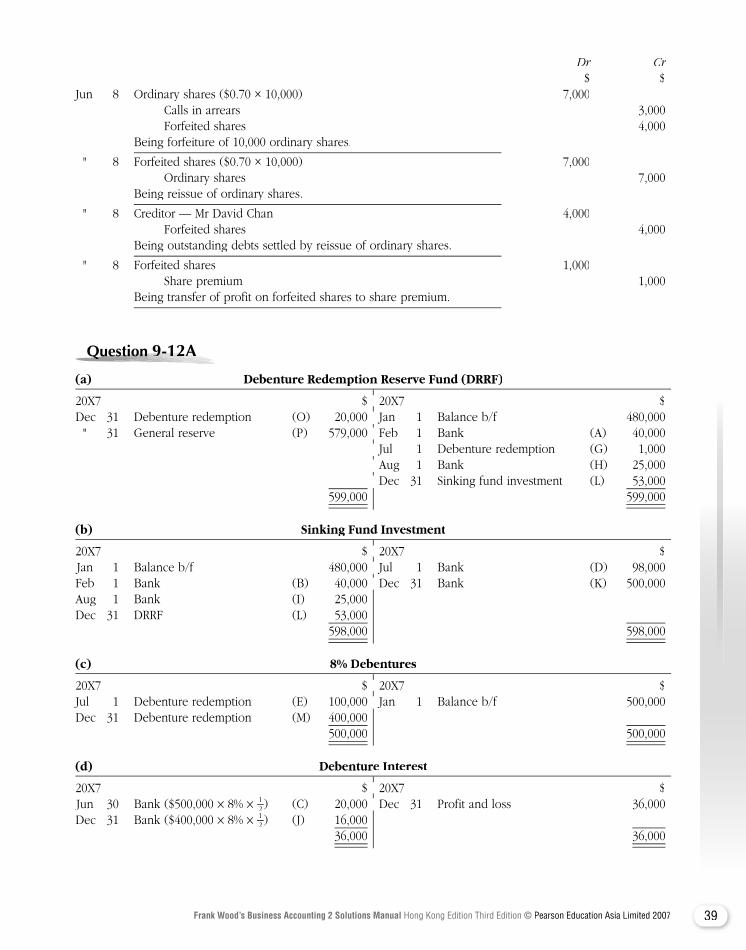
Dr Cr $ $Jun 8 Ordinary shares ($0.70 × 10,000) 7,000 Calls in arrears 3,000 Forfeited shares 4,000 Being forfeiture of 10,000 ordinary shares.
" 8 Forfeited shares ($0.70 × 10,000) 7,000 Ordinary shares 7,000 Being reissue of ordinary shares.
" 8 Creditor — Mr David Chan 4,000 Forfeited shares 4,000 Being outstanding debts settled by reissue of ordinary shares.
" 8 Forfeited shares 1,000 Share premium 1,000 Being transfer of profit on forfeited shares to share premium.
Question Question Question Question Question Question Question 9-12A9-12A9-12A9-12A9-12A9-12A
(a) Debenture Redemption Reserve Fund (DRRF)
20X7 $ 20X7 $ Dec 31 Debenture redemption (O) 20,000 Jan 1 Balance b/f 480,000
" 31 General reserve (P) 579,000 Feb 1 Bank (A) 40,000 Jul 1 Debenture redemption (G) 1,000 Aug 1 Bank (H) 25,000 Dec 31 Sinking fund investment (L) 53,000 599,000 599,000
(b) Sinking Fund Investment
20X7 $ 20X7 $ Jan 1 Balance b/f 480,000 Jul 1 Bank (D) 98,000 Feb 1 Bank (B) 40,000 Dec 31 Bank (K) 500,000 Aug 1 Bank (I) 25,000 Dec 31 DRRF (L) 53,000 598,000 598,000
(c) 8% Debentures
20X7 $ 20X7 $Jul 1 Debenture redemption (E) 100,000 Jan 1 Balance b/f 500,000Dec 31 Debenture redemption (M) 400,000 500,000 500,000
(d) Debenture Interest
20X7 $ 20X7 $ Jun 30 Bank ($500,000 × 8% × 1
2 ) (C) 20,000 Dec 31 Profit and loss 36,000 Dec 31 Bank ($400,000 × 8% × 1
2 ) (J) 16,000 36,000 36,000
20X7 $ 20X7 $ Dec 31 Debenture redemption (O) 20,000 Jan 1 Balance b/f 480,000
31 General reserve (P) 579,000 Feb 1 Bank (A) 40,000 Jul 1 Debenture redemption (G) 1,000 Aug 1 Bank (H) 25,000 Dec 31 Sinking fund investment (L) 53,000
20X7 $ 20X7 $ Jan 1 Balance b/f 480,000 Jul 1 Bank (D) 98,000 Feb 1 Bank (B) 40,000 Dec 31 Bank (K) 500,000
20X7 $ 20X7 $Jul 1 Debenture redemption (E) 100,000 Jan 1 Balance b/f 500,000
20X7 $ 20X7 $) (C) 20,000 Dec 31 Profit and loss 36,000
40 Frank Wood’s Business Accounting 2 Solutions Manual Hong Kong Edition Third Edition © Pearson Education Asia Limited 2007
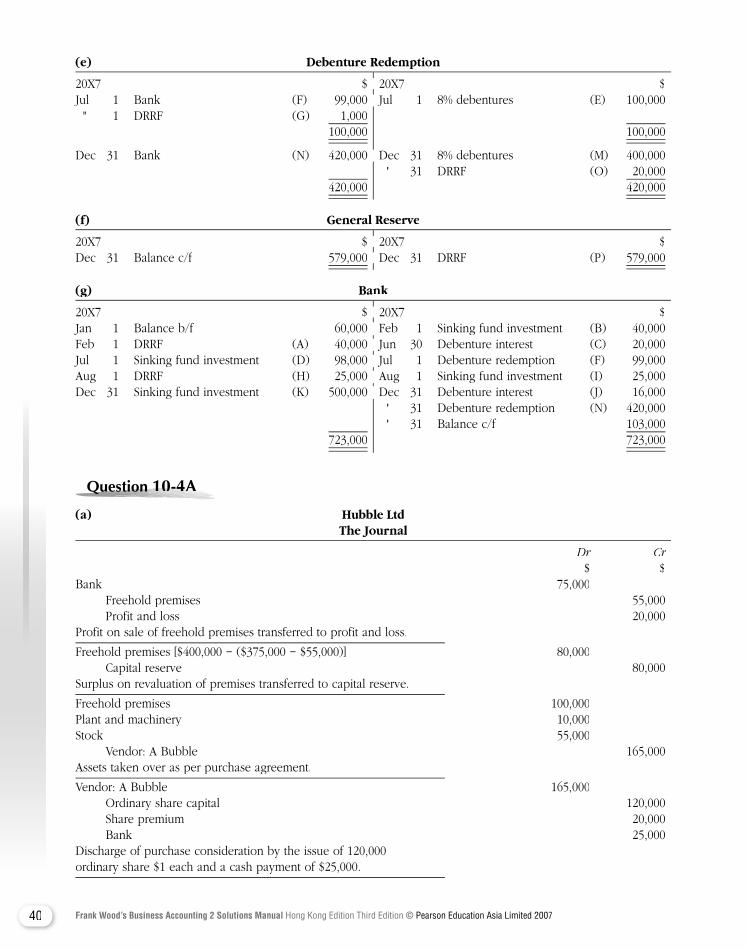
(e) Debenture Redemption
20X7 $ 20X7 $Jul 1 Bank (F) 99,000 Jul 1 8% debentures (E) 100,000
" 1 DRRF (G) 1,000 100,000 100,000
Dec 31 Bank (N) 420,000 Dec 31 8% debentures (M) 400,000 " 31 DRRF (O) 20,000 420,000 420,000
(f) General Reserve
20X7 $ 20X7 $ Dec 31 Balance c/f 579,000 Dec 31 DRRF (P) 579,000
(g) Bank
20X7 $ 20X7 $Jan 1 Balance b/f 60,000 Feb 1 Sinking fund investment (B) 40,000Feb 1 DRRF (A) 40,000 Jun 30 Debenture interest (C) 20,000Jul 1 Sinking fund investment (D) 98,000 Jul 1 Debenture redemption (F) 99,000Aug 1 DRRF (H) 25,000 Aug 1 Sinking fund investment (I) 25,000Dec 31 Sinking fund investment (K) 500,000 Dec 31 Debenture interest (J) 16,000 " 31 Debenture redemption (N) 420,000 " 31 Balance c/f 103,000 723,000 723,000
Question Question Question Question Question Question Question 10-4A10-4A10-4A10-4A10-4A10-4A
(a) Hubble Ltd The Journal
Dr Cr $ $Bank 75,000 Freehold premises 55,000 Profit and loss 20,000Profit on sale of freehold premises transferred to profit and loss.
Freehold premises [$400,000 − ($375,000 − $55,000)] 80,000 Capital reserve 80,000Surplus on revaluation of premises transferred to capital reserve.
Freehold premises 100,000Plant and machinery 10,000Stock 55,000 Vendor: A Bubble 165,000Assets taken over as per purchase agreement.
Vendor: A Bubble 165,000 Ordinary share capital 120,000 Share premium 20,000 Bank 25,000Discharge of purchase consideration by the issue of 120,000 ordinary share $1 each and a cash payment of $25,000.
20X7 $ 20X7 $Jul 1 Bank (F) 99,000 Jul 1 8% debentures (E) 100,000
Dec 31 Bank (N) 420,000 Dec 31 8% debentures (M) 400,000
20X7 $ 20X7 $ Dec 31 DRRF (P)
20X7 $ 20X7 $Jan 1 Balance b/f 60,000 Feb 1 Sinking fund investment (B) 40,000Feb 1 DRRF (A) 40,000 Jun 30 Debenture interest (C) 20,000Jul 1 Sinking fund investment (D) 98,000 Jul 1 Debenture redemption (F) 99,000Aug 1 DRRF (H) 25,000 Aug 1 Sinking fund investment (I) 25,000Dec 31 Sinking fund investment (K) 500,000 Dec 31 Debenture interest (J) 16,000
41Frank Wood’s Business Accounting 2 Solutions Manual Hong Kong Edition Third Edition © Pearson Education Asia Limited 2007
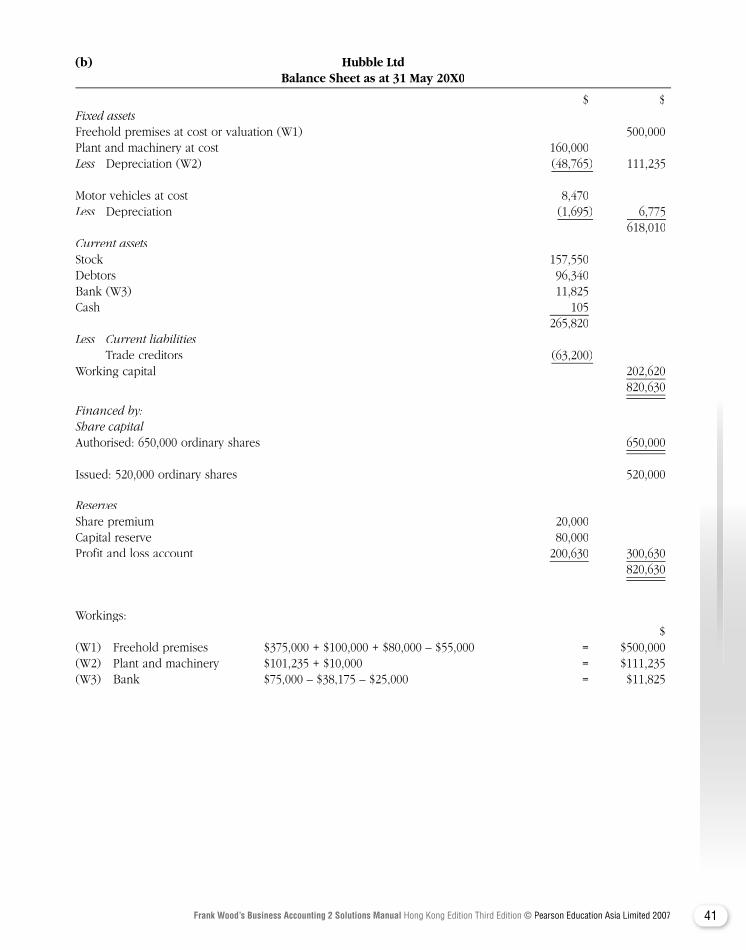
(b) Hubble Ltd Balance Sheet as at 31 May 20X0
$ $Fixed assetsFreehold premises at cost or valuation (W1) 500,000Plant and machinery at cost 160,000Less Depreciation (W2) Less Depreciation (W2) Less (48,765) 111,235 Motor vehicles at cost 8,470Less Depreciation (1,695) 6,775 618,010Current assetsStock 157,550Debtors 96,340Bank (W3) 11,825Cash 105 265,820Less Current liabilities Trade creditors (63,200)Working capital 202,620 820,630
Financed by:Share capitalAuthorised: 650,000 ordinary shares 650,000 Issued: 520,000 ordinary shares 520,000
ReservesShare premium 20,000Capital reserve 80,000Profit and loss account 200,630 300,630 820,630
Workings: $ (W1) Freehold premises $375,000 + $100,000 + $80,000 – $55,000 = $500,000(W2) Plant and machinery $101,235 + $10,000 = $111,235(W3) Bank $75,000 – $38,175 – $25,000 = $11,825

42 Frank Wood’s Business Accounting 2 Solutions Manual Hong Kong Edition Third Edition © Pearson Education Asia Limited 2007
Question Question Question Question Question Question Question 10-5A10-5A10-5A10-5A10-5A10-5A
VU Limited
Pre-incorporation Post-incorporation 1.4.20X9 to 30.6.20X9 1.7.20X9 to 31.3.20Y0 $ $ $ $Sales 30,000 95,000Less Cost of sales (A) Less Cost of sales (A) Less (20,779) (59,221) 9,221 35,779Less Depreciation (B) 555 1,665 Directors’ fees — 500 Administration expenses (B) 2,210 6,630 Sales commission (C) 1,050 3,325 Interest on purchase consideration (B) 1,400 467 Distribution costs:
Variable (C) 900 2,850 Fixed (B) 625 1,875
Debenture interest — — — 1,600 (6,740) (18,912)Net profit for the period 2,481 16,867
Less Goodwill written off (D) 1,000 — Preliminary expenses written off (D) 1,481 169 Proposed dividend 7,560 2,481 (7,729)Retained profit carried forward Retained profit carried forward 9,138
Notes:(A) See workings below. (B) Time basis. (C) Pro rata to sales. (D) The goodwill is written off against the pre-
incorporation profit of $2,481, as are preliminary expenses (so far as possible).
The split of cost of sales is rather tricky. The answer will be demonstrated in an arithmetical, rather than algebraic, fashion:
Sales are: Pre-incorporation $30,000 = 24% Post-incorporation $95,000 = 76%
As post-incorporation cost of sales fell by 10%, then the relationship between pre- and post-incorporation cost of sales is:
Pre-incorporation 24.0 Post-incorporation 76% – ( 1
10 of 76%) 68.4 92.4
∴ Pre-incorporation cost of sales is $80,000 × 10092.4 × 24
100 = $20,779

43Frank Wood’s Business Accounting 2 Solutions Manual Hong Kong Edition Third Edition © Pearson Education Asia Limited 2007
Question Question Question Question Question Question Question 10-6A10-6A10-6A10-6A10-6A10-6A
(a) The reasons for the conversion of a partnership into a limited company may be:• to limit the liabilities of the partners up to the amount of capital issued; or• to allow flexibility in raising capital, such as the issue of ordinary shares to potential investors, the issue of preference shares, the issue of convertible bonds, the issue of debentures etc.; or• to permit over 20 investors to invest in the business.
(b) Fok Enterprise Ltd Balance Sheet as at 30 June 20X6
$ $Fixed assetsLand and building (Note 1) 1,500,000Office equipment 48,000Less Provision for depreciation (24,000) 24,000 1,524,000Goodwill (Note 2) 203,600
Current assetsStock (Note 1) 201,500Debtors 140,500Cash at bank (Note 4) 37,200 379,200Less Current liabilities Creditors (106,800)Net current assets 272,400 2,000,000
Financed by:Issued share capital1,000,000 Ordinary shares of $1 each, fully paid (Note 3) 1,000,000
ReservesShare premium (Note 3) 1,000,000 2,000,000
Note 1These assets are stated at revaluation.
Note 2 $ $Note 2 $ $Note 2Purchase consideration 2,032,000Less Net assets purchased:
Land and building 1,500,000 Office equipment 48,000 Provision for depreciation (24,000) Stock 201,500 Debtors 140,500 Cash at bank 69,200 Creditors (106,800) (1,828,400)Goodwill 203,600
44 Frank Wood’s Business Accounting 2 Solutions Manual Hong Kong Edition Third Edition © Pearson Education Asia Limited 2007
Note 3 $Purchase consideration funded by:
Issue of 1,000,000 ordinary shares for $2 (par $1 + premium $1) 2,000,000Cash (balancing figure) 32,000
Total purchase consideration 2,032,000
Note 4 $Cash at bank (acquired from partnership) 69,200Partial payment of consideration (Note 3) (32,000)Balance c/f 37,200
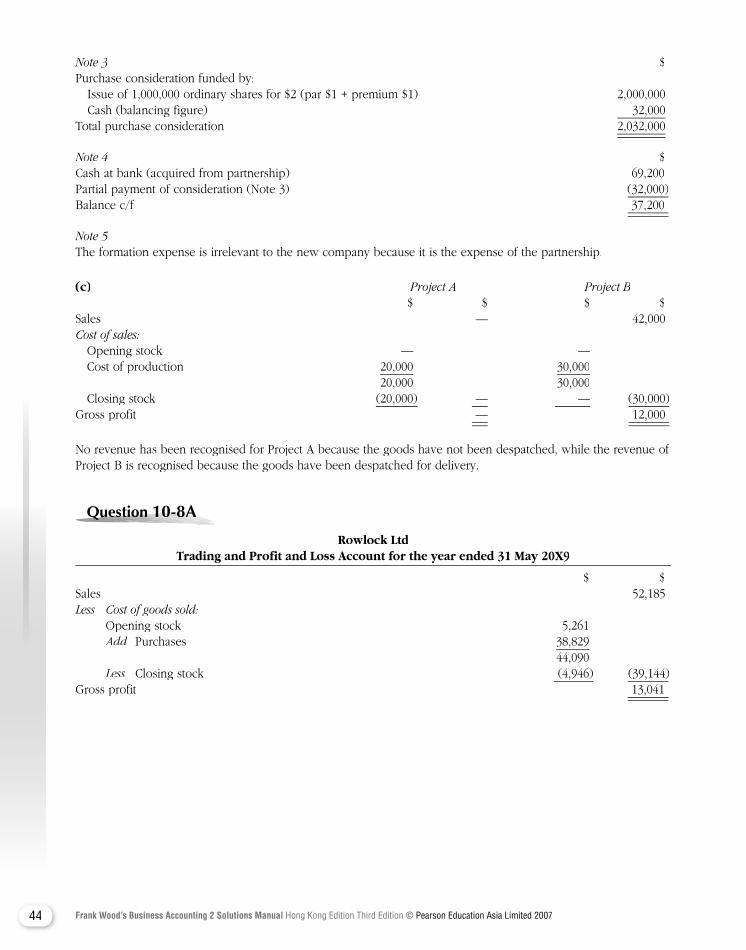
Note 5The formation expense is irrelevant to the new company because it is the expense of the partnership.
(c) Project A Project B $ $ $ $Sales — 42,000Cost of sales: Opening stock — — Cost of production 20,000 30,000 20,000 30,000 Closing stock (20,000) — — (30,000) — (30,000) —Gross profit — — — 12,000
No revenue has been recognised for Project A because the goods have not been despatched, while the revenue of Project B is recognised because the goods have been despatched for delivery.
Question Question Question Question Question Question Question 10-8A10-8A10-8A10-8A10-8A10-8A
Rowlock Ltd Trading and Profit and Loss Account for the year ended 31 May 20X9
$ $Sales 52,185Less Cost of goods sold:
Opening stock 5,261Add Purchases 38,829
44,090Less Closing stock (4,946) (39,144)
Gross profit 13,041
45Frank Wood’s Business Accounting 2 Solutions Manual Hong Kong Edition Third Edition © Pearson Education Asia Limited 2007
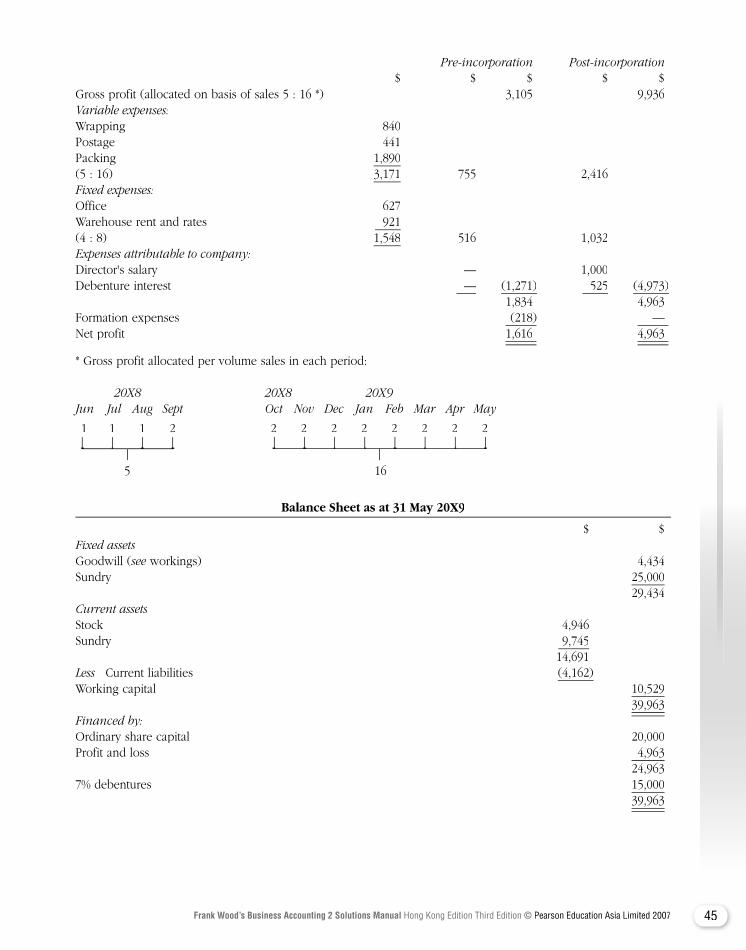
Pre-incorporation Post-incorporation $ $ $ $ $Gross profit (allocated on basis of sales 5 : 16 *) 3,105 9,936Variable expenses:Wrapping 840Postage 441Packing 1,890(5 : 16) 3,171 755 2,416 Fixed expenses:Office 627Warehouse rent and rates 921(4 : 8) 1,548 516 1,032Expenses attributable to company:Director's salary — 1,000Debenture interest — (1,271) 525 (4,973) 1,834 4,963Formation expenses (218) — Net profit 1,616 4,963
* Gross profit allocated per volume sales in each period:
20X8 20X8 20X9 Jun Jul Aug Sept Oct Nov Dec Jan Feb Mar Apr May
1 1 1 2 2 2 2 2 2 2 2 2
5 16
Balance Sheet as at 31 May 20X9
$ $Fixed assetsGoodwill (see workings) 4,434see workings) 4,434seeSundry 25,000 29,434Current assetsStock 4,946Sundry 9,745 14,691Less Current liabilities (4,162)Working capital 10,529 39,963Financed by:Ordinary share capital 20,000Profit and loss 4,963 24,9637% debentures 15,000 39,963
46 Frank Wood’s Business Accounting 2 Solutions Manual Hong Kong Edition Third Edition © Pearson Education Asia Limited 2007
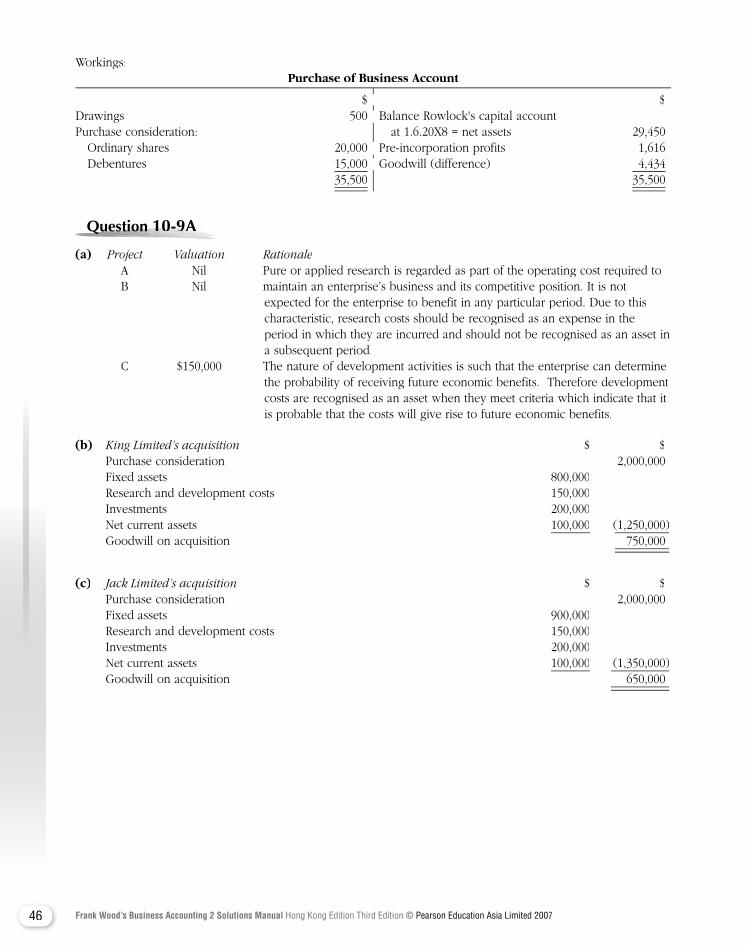
Workings: Purchase of Business Account Purchase of Business Account Purchase of
$ $Drawings 500 Balance Rowlock's capital account Purchase consideration: at 1.6.20X8 = net assets 29,450
Ordinary shares 20,000 Pre-incorporation profits 1,616Debentures 15,000 Goodwill (difference) 4,434
35,500 35,500
Question Question Question Question Question Question Question 10-9A10-9A10-9A10-9A10-9A10-9A
(a) Project Valuation Rationale A Nil Pure or applied research is regarded as part of the operating cost required to B Nil maintain an enterprise’s business and its competitive position. It is not
expected for the enterprise to benefit in any particular period. Due to this characteristic, research costs should be recognised as an expense in the period in which they are incurred and should not be recognised as an asset in a subsequent period.
C $150,000 The nature of development activities is such that the enterprise can determine the probability of receiving future economic benefits. Therefore development costs are recognised as an asset when they meet criteria which indicate that it is probable that the costs will give rise to future economic benefits.
(b) King Limited’s acquisition $ $ Purchase consideration 2,000,000 Fixed assets 800,000 Research and development costs 150,000 Investments 200,000 Net current assets 100,000 (1,250,000) Goodwill on acquisition 750,000
(c) Jack Limited’s acquisition $ $ Purchase consideration 2,000,000 Fixed assets 900,000 Research and development costs 150,000 Investments 200,000 Net current assets 100,000 (1,350,000) Goodwill on acquisition 650,000
$ $Drawings 500 Balance Rowlock's capital account
Ordinary shares 20,000 Pre-incorporation profits 1,616Debentures 15,000 Goodwill (difference) 4,434
47Frank Wood’s Business Accounting 2 Solutions Manual Hong Kong Edition Third Edition © Pearson Education Asia Limited 2007
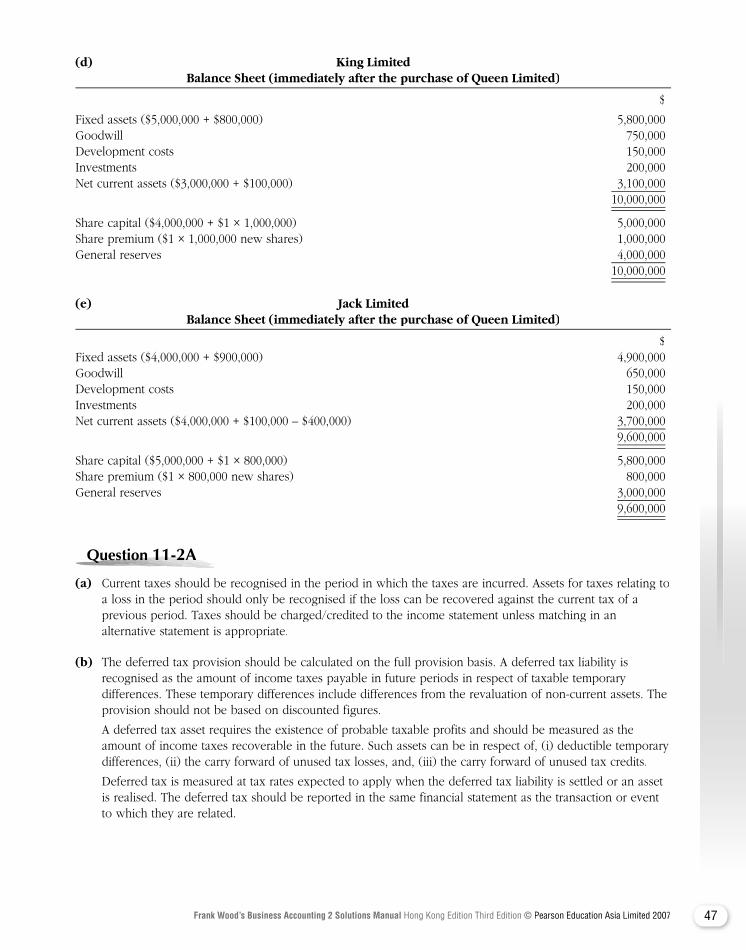
(d) King Limited Balance Sheet (immediately after the purchase of Queen Limited)
$
Fixed assets ($5,000,000 + $800,000) 5,800,000Goodwill 750,000Development costs 150,000Investments 200,000Net current assets ($3,000,000 + $100,000) 3,100,000 10,000,000
Share capital ($4,000,000 + $1 × 1,000,000) 5,000,000Share premium ($1 × 1,000,000 new shares) 1,000,000General reserves 4,000,000 10,000,000
(e) Jack Limited Balance Sheet (immediately after the purchase of Queen Limited)
$Fixed assets ($4,000,000 + $900,000) 4,900,000Goodwill 650,000Development costs 150,000Investments 200,000Net current assets ($4,000,000 + $100,000 – $400,000) 3,700,000 9,600,000
Share capital ($5,000,000 + $1 × 800,000) 5,800,000Share premium ($1 × 800,000 new shares) 800,000General reserves 3,000,000 9,600,000
Question Question Question Question Question Question Question 11-2A11-2A11-2A11-2A11-2A11-2A
(a) Current taxes should be recognised in the period in which the taxes are incurred. Assets for taxes relating to a loss in the period should only be recognised if the loss can be recovered against the current tax of a previous period. Taxes should be charged/credited to the income statement unless matching in an alternative statement is appropriate.
(b) The deferred tax provision should be calculated on the full provision basis. A deferred tax liability is recognised as the amount of income taxes payable in future periods in respect of taxable temporary differences. These temporary differences include differences from the revaluation of non-current assets. The provision should not be based on discounted figures.
A deferred tax asset requires the existence of probable taxable profits and should be measured as the amount of income taxes recoverable in the future. Such assets can be in respect of, (i) deductible temporary differences, (ii) the carry forward of unused tax losses, and, (iii) the carry forward of unused tax credits.
Deferred tax is measured at tax rates expected to apply when the deferred tax liability is settled or an asset is realised. The deferred tax should be reported in the same financial statement as the transaction or event to which they are related.
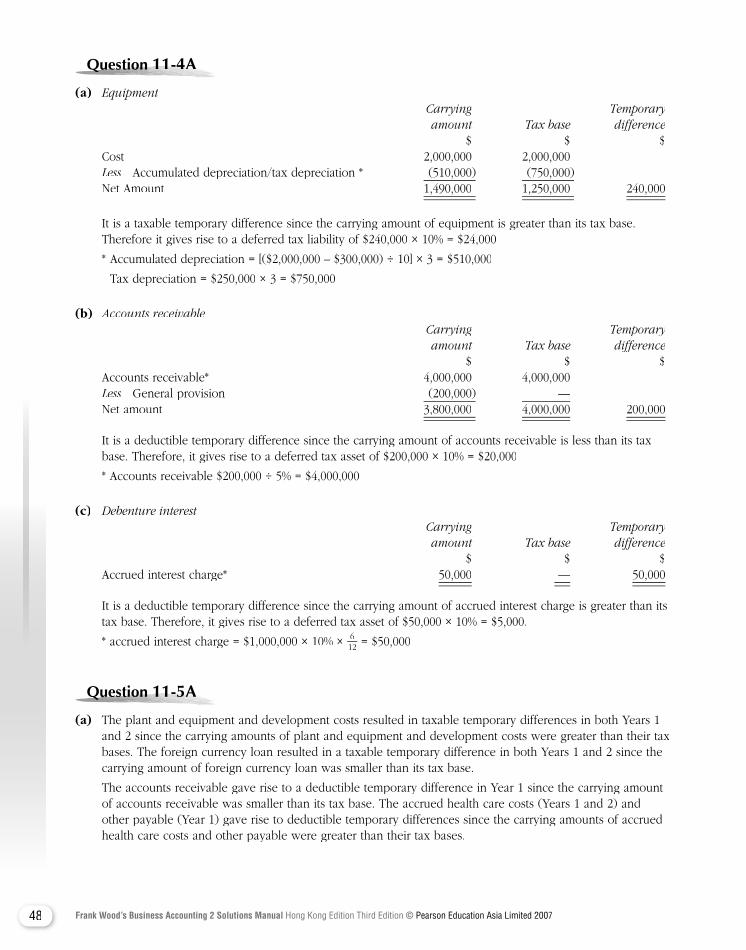
48 Frank Wood’s Business Accounting 2 Solutions Manual Hong Kong Edition Third Edition © Pearson Education Asia Limited 2007
Question Question Question Question Question Question Question 11-4A11-4A11-4A11-4A11-4A11-4A
(a) Equipment Carrying Temporary
amount Tax base difference $ $ $ Cost 2,000,000 2,000,000
Less Accumulated depreciation/tax depreciation * (510,000) (750,000) Net Amount 1,490,000 1,250,000 240,000
It is a taxable temporary difference since the carrying amount of equipment is greater than its tax base. Therefore it gives rise to a deferred tax liability of $240,000 × 10% = $24,000
* Accumulated depreciation = [($2,000,000 – $300,000) ÷ 10] × 3 = $510,000
Tax depreciation = $250,000 × 3 = $750,000
(b) Accounts receivable Carrying Temporary
amount Tax base difference $ $ $ Accounts receivable* 4,000,000 4,000,000
Less General provision (200,000) — Less General provision (200,000) — Less Net amount 3,800,000 4,000,000 200,000
It is a deductible temporary difference since the carrying amount of accounts receivable is less than its tax base. Therefore, it gives rise to a deferred tax asset of $200,000 × 10% = $20,000
* Accounts receivable $200,000 ÷ 5% = $4,000,000
(c) Debenture interest Carrying Temporary
amount Tax base difference $ $ $ Accrued interest charge* 50,000 — 50,000
It is a deductible temporary difference since the carrying amount of accrued interest charge is greater than its tax base. Therefore, it gives rise to a deferred tax asset of $50,000 × 10% = $5,000.
* accrued interest charge = $1,000,000 × 10% × 612 = $50,000
Question Question Question Question Question Question Question 11-5A11-5A11-5A11-5A11-5A11-5A
(a) The plant and equipment and development costs resulted in taxable temporary differences in both Years 1 and 2 since the carrying amounts of plant and equipment and development costs were greater than their tax bases. The foreign currency loan resulted in a taxable temporary difference in both Years 1 and 2 since the carrying amount of foreign currency loan was smaller than its tax base.
The accounts receivable gave rise to a deductible temporary difference in Year 1 since the carrying amount of accounts receivable was smaller than its tax base. The accrued health care costs (Years 1 and 2) and other payable (Year 1) gave rise to deductible temporary differences since the carrying amounts of accrued health care costs and other payable were greater than their tax bases.

49Frank Wood’s Business Accounting 2 Solutions Manual Hong Kong Edition Third Edition © Pearson Education Asia Limited 2007
(b) Deferred tax expense and liability
YEAR 1 Carrying Temporary amount Tax base difference
$000 $000 $000 Plant and equipment 58,000 35,000 23,000 Investments 30,000 30,000 — Development costs 800 — 800 Inventory 1,200 1,200 — Accounts receivable 340 360 (20) Bank 150 150 —
Total assets 90,490 66,710 23,780
Foreign currency loan 11,000 12,500 1,500 Accrued health care costs 1,000 — (1,000) Accounts payable 620 620 — Income tax payable 2,030 2,030 — Other payable 10 — (10)
Total liabilities 14,660 15,150 490 Share capital 38,000 38,000 Retained earnings 37,830 13,560
Equity 75,830 51,560Total liabilities and equity 90,490 66,710
Temporary differences Temporary differences Temporary differences 24,270
Taxable temporary differences = $23,000,000 + $800,000 + $1,500,000 = $25,300,000 Deductible temporary differences = $20,000 + $1,000,000 + $10,000 = $1,030,000 $000 Deferred tax liability ($25,300,000 × 10%) 2,530
Less Deferred tax asset ($1,030,000 × 10%) (103)Less Deferred tax asset ($1,030,000 × 10%) (103)Less Net deferred tax liability 2,427
The journal entry for Year 1 would be: Dr Cr $000 $000 Income statement — deferred tax expense 2,427 Deferred tax liability 2,427 Record deferred tax liability for Year 1.
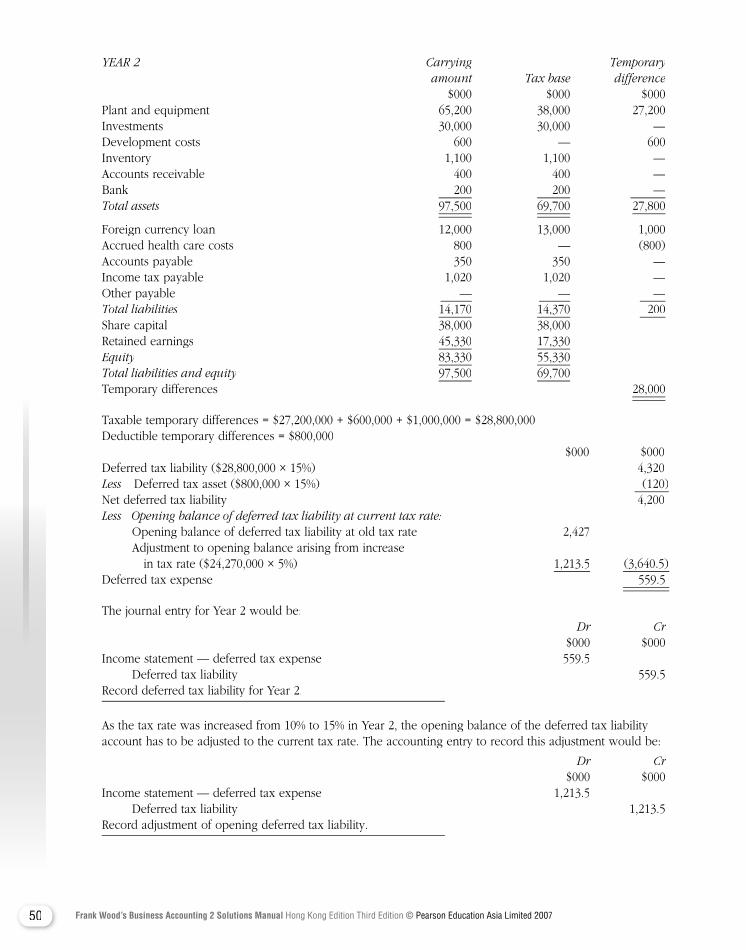
50 Frank Wood’s Business Accounting 2 Solutions Manual Hong Kong Edition Third Edition © Pearson Education Asia Limited 2007
YEAR 2 Carrying Temporary amount Tax base difference $000 $000 $000 Plant and equipment 65,200 38,000 27,200 Investments 30,000 30,000 — Development costs 600 — 600 Inventory 1,100 1,100 — Accounts receivable 400 400 — Bank 200 200 —
Total assets 97,500 69,700 27,800
Foreign currency loan 12,000 13,000 1,000 Accrued health care costs 800 — (800) Accounts payable 350 350 — Income tax payable 1,020 1,020 — Other payable — — —
Total liabilities 14,170 14,370 200 Share capital 38,000 38,000 Retained earnings 45,330 17,330
Equity 83,330 55,330Equity 83,330 55,330EquityTotal liabilities and equity 97,500 69,700
Temporary differences Temporary differences Temporary differences 28,000
Taxable temporary differences = $27,200,000 + $600,000 + $1,000,000 = $28,800,000 Deductible temporary differences = $800,000 $000 $000 Deferred tax liability ($28,800,000 × 15%) 4,320
Less Deferred tax asset ($800,000 × 15%) Less Deferred tax asset ($800,000 × 15%) Less (120) Net deferred tax liability 4,200
Less Opening balance of deferred tax liability at current tax rate: Opening balance of deferred tax liability at old tax rate 2,427 Adjustment to opening balance arising from increase in tax rate ($24,270,000 × 5%) 1,213.5 (3,640.5) Deferred tax expense 559.5
The journal entry for Year 2 would be: Dr Cr $000 $000 Income statement — deferred tax expense 559.5 Deferred tax liability 559.5 Record deferred tax liability for Year 2.
As the tax rate was increased from 10% to 15% in Year 2, the opening balance of the deferred tax liability account has to be adjusted to the current tax rate. The accounting entry to record this adjustment would be:
Dr Cr $000 $000 Income statement — deferred tax expense 1,213.5 Deferred tax liability 1,213.5 Record adjustment of opening deferred tax liability.
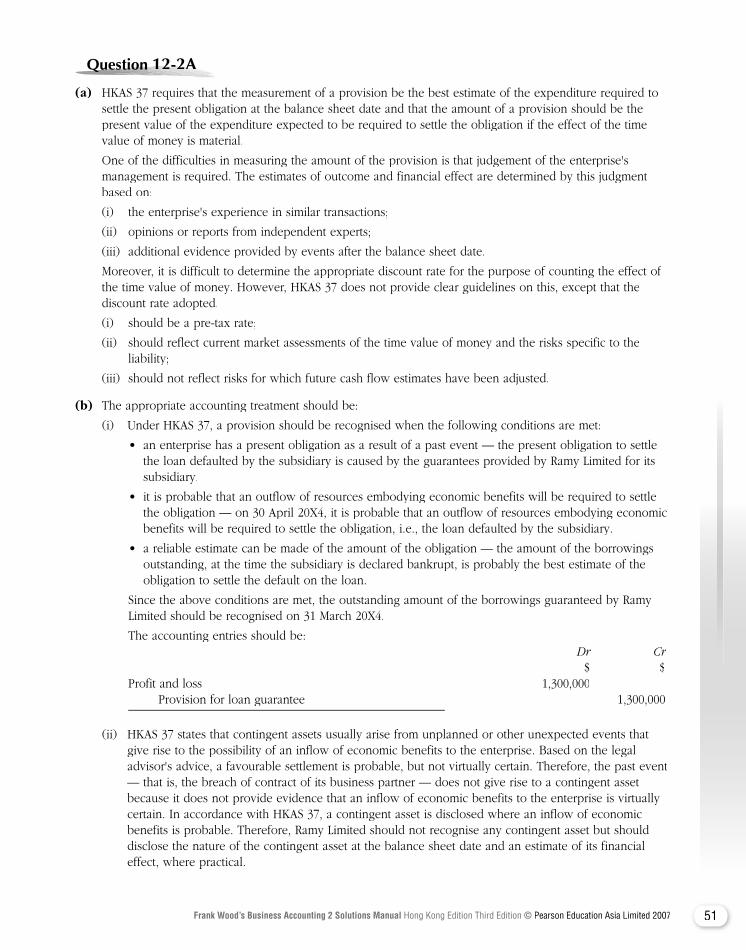
51Frank Wood’s Business Accounting 2 Solutions Manual Hong Kong Edition Third Edition © Pearson Education Asia Limited 2007
Question Question Question Question Question Question Question 12-2A12-2A12-2A12-2A12-2A12-2A
(a) HKAS 37 requires that the measurement of a provision be the best estimate of the expenditure required to settle the present obligation at the balance sheet date and that the amount of a provision should be the present value of the expenditure expected to be required to settle the obligation if the effect of the time value of money is material.
One of the difficulties in measuring the amount of the provision is that judgement of the enterprise's management is required. The estimates of outcome and financial effect are determined by this judgment based on:
(i) the enterprise's experience in similar transactions;
(ii) opinions or reports from independent experts;
(iii) additional evidence provided by events after the balance sheet date.
Moreover, it is difficult to determine the appropriate discount rate for the purpose of counting the effect of the time value of money. However, HKAS 37 does not provide clear guidelines on this, except that the discount rate adopted.
(i) should be a pre-tax rate;
(ii) should reflect current market assessments of the time value of money and the risks specific to the liability;
(iii) should not reflect risks for which future cash flow estimates have been adjusted.
(b) The appropriate accounting treatment should be:
(i) Under HKAS 37, a provision should be recognised when the following conditions are met:
• an enterprise has a present obligation as a result of a past event — the present obligation to settle the loan defaulted by the subsidiary is caused by the guarantees provided by Ramy Limited for its subsidiary.
• it is probable that an outflow of resources embodying economic benefits will be required to settle the obligation — on 30 April 20X4, it is probable that an outflow of resources embodying economic benefits will be required to settle the obligation, i.e., the loan defaulted by the subsidiary.
• a reliable estimate can be made of the amount of the obligation — the amount of the borrowings outstanding, at the time the subsidiary is declared bankrupt, is probably the best estimate of the obligation to settle the default on the loan.
Since the above conditions are met, the outstanding amount of the borrowings guaranteed by Ramy Limited should be recognised on 31 March 20X4.
The accounting entries should be: Dr Cr $ $ Profit and loss 1,300,000 Provision for loan guarantee 1,300,000
(ii) HKAS 37 states that contingent assets usually arise from unplanned or other unexpected events that give rise to the possibility of an inflow of economic benefits to the enterprise. Based on the legal advisor's advice, a favourable settlement is probable, but not virtually certain. Therefore, the past event — that is, the breach of contract of its business partner — does not give rise to a contingent asset because it does not provide evidence that an inflow of economic benefits to the enterprise is virtually certain. In accordance with HKAS 37, a contingent asset is disclosed where an inflow of economic benefits is probable. Therefore, Ramy Limited should not recognise any contingent asset but should disclose the nature of the contingent asset at the balance sheet date and an estimate of its financial effect, where practical.

52 Frank Wood’s Business Accounting 2 Solutions Manual Hong Kong Edition Third Edition © Pearson Education Asia Limited 2007
(iii) Under HKAS 37, a provision should be recognised when the following conditions are met:
• an enterprise has a present obligation as a result of a past event — the decision to close the division has been communicated to the customers and employees; this is an obligating event which creates a valid expectation that the division will be closed.
• it is probable that an outflow of resources embodying economic benefits will be required to settle the obligation — therefore, the resource outflow relating to the costs of carrying out the division's closure is probable.
• a reliable estimate can be made of the amount of the obligation — since the redundancy notices were sent to the division’s staff and assuming the redundancy plan has already been fixed, the management of Ramy Limited should be able to estimate the amount of redundancy costs reliably.
Since the above conditions have been met, Ramy Limited is required to make a provision for the redundancy costs of $3 million at the balance sheet date:
Dr Cr $ $ Profit and loss 3,000,000 Provision for loan guarantee 3,000,000
Question Question Question Question Question Question Question 13-3A13-3A13-3A13-3A13-3A13-3A
(a) Realisation
$ $ Goodwill 50,000 Rags Ltd 239,600Non-current assets 190,000 Loss on realisation 70,400Inventory 21,000Work in progress 3,000Accounts receivable 25,000Bank 18,000Preliminary expenses 3,000 310,000 310,000
Sundry Shareholders
$ $Accumulated losses 80,000 Ordinary share capital 200,000Loss on realisation 70,400 Preference share capital 100,000Rags Ltd: Share ($9,600 + $90,000 + $50,000) 149,600 300,000 300,000
$ $ Goodwill 50,000 Rags Ltd 239,600Non-current assets 190,000 Loss on realisation 70,400
$ $Accumulated losses 80,000 Ordinary share capital 200,000Loss on realisation 70,400 Preference share capital 100,000
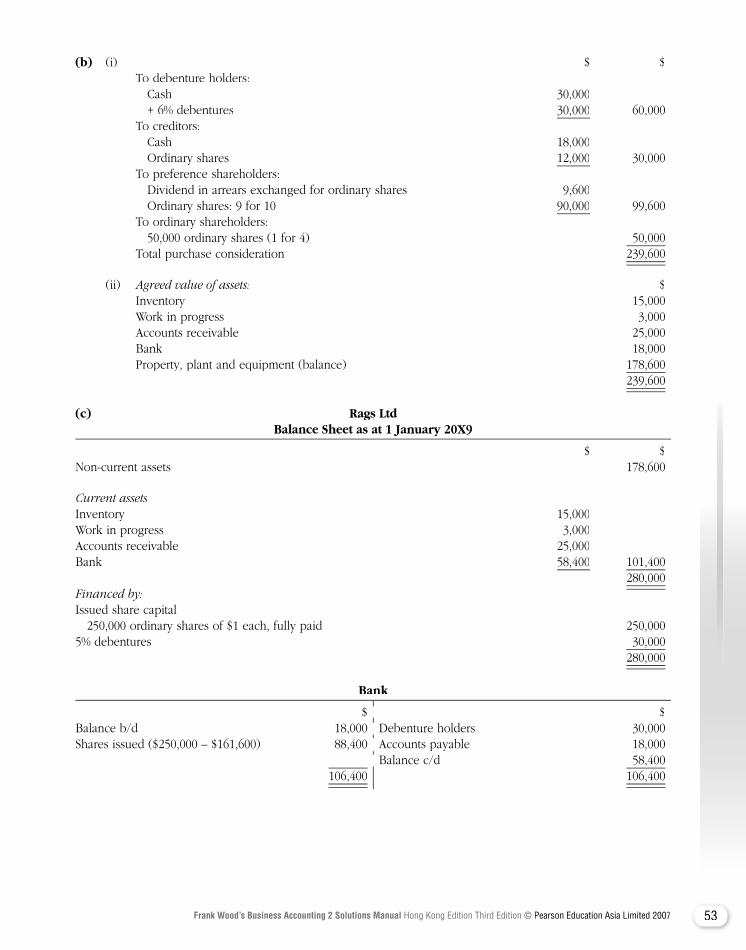
53Frank Wood’s Business Accounting 2 Solutions Manual Hong Kong Edition Third Edition © Pearson Education Asia Limited 2007
(b) (i) $ $ To debenture holders: Cash 30,000 + 6% debentures 30,000 60,000 To creditors: Cash 18,000 Ordinary shares 12,000 30,000 To preference shareholders: Dividend in arrears exchanged for ordinary shares 9,600 Ordinary shares: 9 for 10 90,000 99,600 To ordinary shareholders: 50,000 ordinary shares (1 for 4) 50,000 Total purchase consideration 239,600
(ii) Agreed value of assets: $ Inventory 15,000 Work in progress 3,000 Accounts receivable 25,000 Bank 18,000 Property, plant and equipment (balance) 178,600 239,600
(c) Rags Ltd Balance Sheet as at 1 January 20X9
$ $Non-current assets 178,600
Current assetsInventory 15,000Work in progress 3,000Accounts receivable 25,000Bank 58,400 101,400 280,000Financed by:Issued share capital 250,000 ordinary shares of $1 each, fully paid 250,0005% debentures 30,000 280,000
Bank
$ $Balance b/d 18,000 Debenture holders 30,000Shares issued ($250,000 – $161,600) 88,400 Accounts payable 18,000 Balance c/d 58,400 106,400 106,400
$ $Balance b/d 18,000 Debenture holders 30,000Shares issued ($250,000 – $161,600) 88,400 Accounts payable 18,000 Balance c/d 58,400
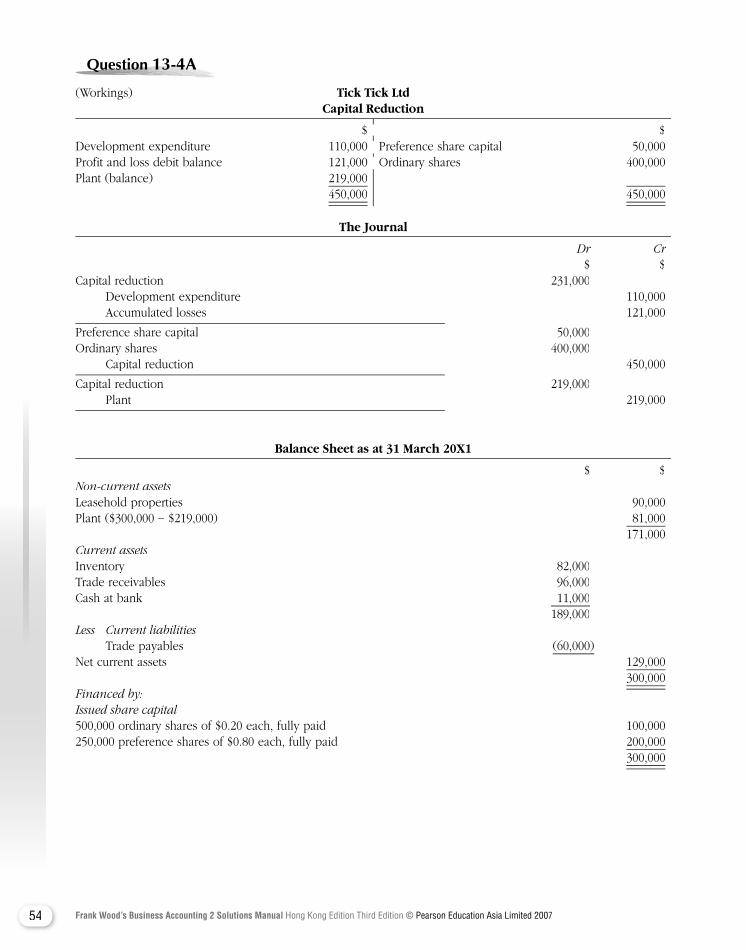
54 Frank Wood’s Business Accounting 2 Solutions Manual Hong Kong Edition Third Edition © Pearson Education Asia Limited 2007
Question Question Question Question Question Question Question 13-4A13-4A13-4A13-4A13-4A13-4A
(Workings) Tick Tick Ltd Capital Reduction
$ $Development expenditure 110,000 Preference share capital 50,000Profit and loss debit balance 121,000 Ordinary shares 400,000Plant (balance) 219,000 450,000 450,000
The Journal
Dr Cr $ $Capital reduction 231,000 Development expenditure 110,000 Accumulated losses 121,000
Preference share capital 50,000Ordinary shares 400,000 Capital reduction 450,000
Capital reduction 219,000 Plant 219,000
Balance Sheet as at 31 March 20X1
$ $Non-current assets Non-current assets Non-current assetsLeasehold properties 90,000Plant ($300,000 − $219,000) 81,000 171,000Current assetsInventory 82,000Trade receivables 96,000Cash at bank 11,000 189,000Less Current liabilities Trade payables (60,000)Net current assets 129,000 300,000Financed by:Issued share capital500,000 ordinary shares of $0.20 each, fully paid 100,000250,000 preference shares of $0.80 each, fully paid 200,000 300,000
$ $Development expenditure 110,000 Preference share capital 50,000Profit and loss debit balance 121,000 Ordinary shares 400,000
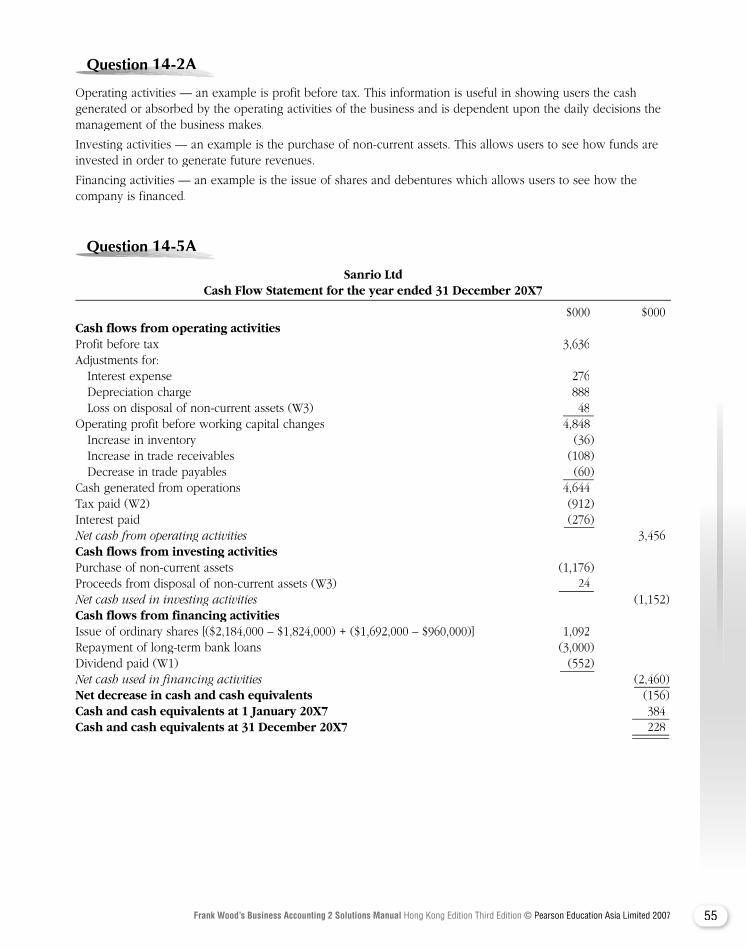
55Frank Wood’s Business Accounting 2 Solutions Manual Hong Kong Edition Third Edition © Pearson Education Asia Limited 2007
Question Question Question Question Question Question Question 14-2A14-2A14-2A14-2A14-2A14-2A
Operating activities — an example is profit before tax. This information is useful in showing users the cash generated or absorbed by the operating activities of the business and is dependent upon the daily decisions the management of the business makes.
Investing activities — an example is the purchase of non-current assets. This allows users to see how funds are invested in order to generate future revenues.
Financing activities — an example is the issue of shares and debentures which allows users to see how the company is financed.
Question Question Question Question Question Question Question 14-5A14-5A14-5A14-5A14-5A14-5A
Sanrio Ltd Cash Flow Statement for the year ended 31 December 20X7
$000 $000Cash flows from operating activitiesProfit before tax 3,636Adjustments for: Interest expense 276 Depreciation charge 888 Loss on disposal of non-current assets (W3) 48Operating profit before working capital changes 4,848 Increase in inventory (36) Increase in trade receivables (108) Decrease in trade payables (60)Cash generated from operations 4,644 Tax paid (W2) (912)Interest paid (276)Net cash from operating activities 3,456Net cash from operating activities 3,456Net cash from operating activitiesCash flows from investing activitiesPurchase of non-current assets (1,176)Proceeds from disposal of non-current assets (W3) 24 Net cash used in investing activities (1,152)Net cash used in investing activities (1,152)Net cash used in investing activitiesCash flows from financing activitiesIssue of ordinary shares [($2,184,000 – $1,824,000) + ($1,692,000 – $960,000)] 1,092Repayment of long-term bank loans (3,000)Dividend paid (W1) (552)Net cash used in financing activities Net cash used in financing activities Net cash used in financing activities (2,460)Net decrease in cash and cash equivalents (156)Cash and cash equivalents at 1 January 20X7 384Cash and cash equivalents at 31 December 20X7 228
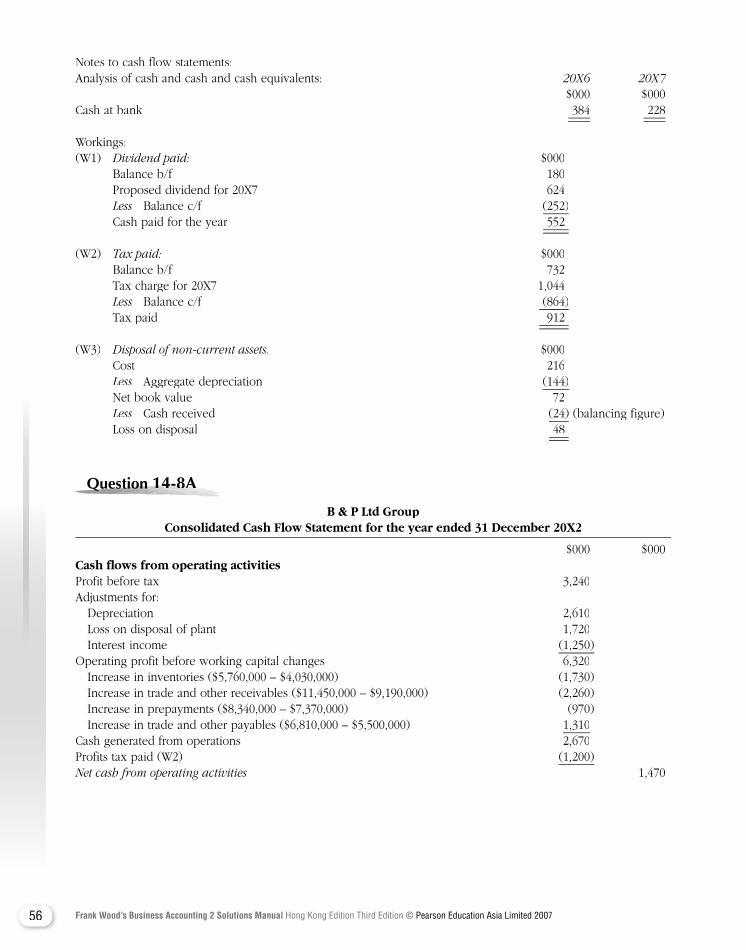
56 Frank Wood’s Business Accounting 2 Solutions Manual Hong Kong Edition Third Edition © Pearson Education Asia Limited 2007
Notes to cash flow statements:Analysis of cash and cash and cash equivalents: 20X6 20X7 $000 $000Cash at bank 384 228
Workings:(W1) Dividend paid: $000 Balance b/f 180 Proposed dividend for 20X7 624
Less Balance c/f (252)Less Balance c/f (252)Less Cash paid for the year 552
(W2) Tax paid: $000 Balance b/f 732 Tax charge for 20X7 1,044
Less Balance c/f (864)Less Balance c/f (864)Less Tax paid 912
(W3) Disposal of non-current assets: $000 Cost 216
Less Aggregate depreciation (144) Net book value 72
Less Cash received (24) (balancing figure)Less Cash received (24) (balancing figure)Less Loss on disposal 48
Question Question Question Question Question Question 14-8A14-8A14-8A14-8A14-8A14-8A
B & P Ltd Group Consolidated Cash Flow Statement for the year ended 31 December 20X2
$000 $000Cash flows from operating activitiesProfit before tax 3,240Adjustments for: Depreciation 2,610 Loss on disposal of plant 1,720 Interest income (1,250)Operating profit before working capital changes 6,320 Increase in inventories ($5,760,000 – $4,030,000) (1,730) Increase in trade and other receivables ($11,450,000 – $9,190,000) (2,260) Increase in prepayments ($8,340,000 – $7,370,000) (970) Increase in trade and other payables ($6,810,000 – $5,500,000) 1,310Cash generated from operations 2,670Profits tax paid (W2) (1,200)Net cash from operating activities 1,470Net cash from operating activities 1,470Net cash from operating activities
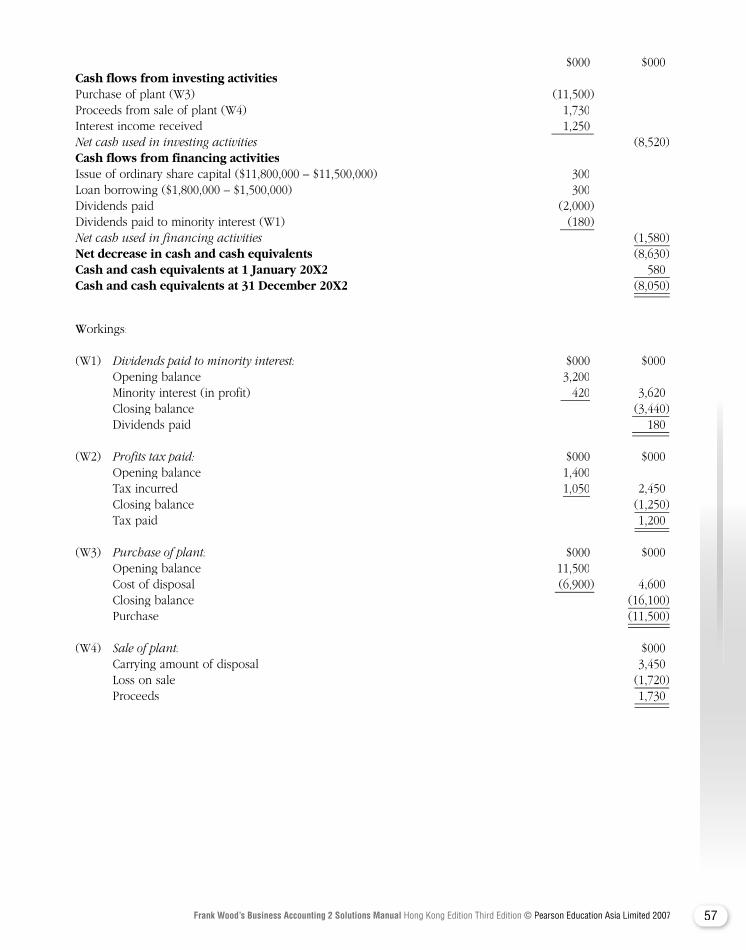
57Frank Wood’s Business Accounting 2 Solutions Manual Hong Kong Edition Third Edition © Pearson Education Asia Limited 2007
$000 $000Cash flows from investing activitiesPurchase of plant (W3) (11,500)Proceeds from sale of plant (W4) 1,730Interest income received 1,250 Net cash used in investing activities (8,520)Cash flows from financing activitiesIssue of ordinary share capital ($11,800,000 – $11,500,000) 300Loan borrowing ($1,800,000 – $1,500,000) 300Dividends paid (2,000)Dividends paid to minority interest (W1) (180)Net cash used in financing activities (1,580)Net decrease in cash and cash equivalents (8,630)Cash and cash equivalents at 1 January 20X2 580Cash and cash equivalents at 31 December 20X2 (8,050)
Workings: (W1) Dividends paid to minority interest: $000 $000 Opening balance 3,200 Minority interest (in profit) 420 3,620 Closing balance (3,440) Dividends paid 180
(W2) Profits tax paid: $000 $000 Opening balance 1,400 Tax incurred 1,050 2,450 Closing balance (1,250)
Tax paid 1,200
(W3) Purchase of plant: $000 $000 Opening balance 11,500 Cost of disposal (6,900) 4,600 Closing balance (16,100) Purchase (11,500)
(W4) Sale of plant: $000 Carrying amount of disposal 3,450 Loss on sale (1,720) Proceeds 1,730
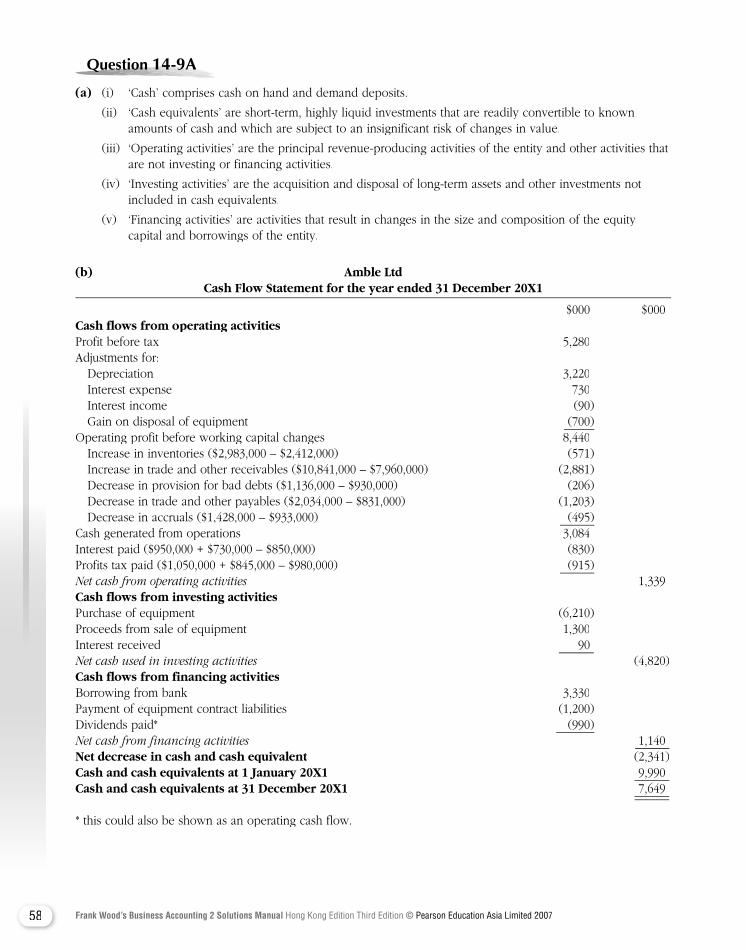
58 Frank Wood’s Business Accounting 2 Solutions Manual Hong Kong Edition Third Edition © Pearson Education Asia Limited 2007
Question Question Question Question Question Question Question 14-9A14-9A14-9A14-9A14-9A14-9A
(a) (i) ‘Cash’ comprises cash on hand and demand deposits.
(ii) ‘Cash equivalents’ are short-term, highly liquid investments that are readily convertible to known amounts of cash and which are subject to an insignificant risk of changes in value.
(iii) ‘Operating activities’ are the principal revenue-producing activities of the entity and other activities that are not investing or financing activities.
(iv) ‘Investing activities’ are the acquisition and disposal of long-term assets and other investments not included in cash equivalents.
(v) ‘Financing activities’ are activities that result in changes in the size and composition of the equity capital and borrowings of the entity.
(b) Amble Ltd Cash Flow Statement for the year ended 31 December 20X1
$000 $000Cash flows from operating activitiesProfit before tax 5,280Adjustments for: Depreciation 3,220 Interest expense 730 Interest income (90) Gain on disposal of equipment (700)Operating profit before working capital changes 8,440 Increase in inventories ($2,983,000 – $2,412,000) (571) Increase in trade and other receivables ($10,841,000 – $7,960,000) (2,881) Decrease in provision for bad debts ($1,136,000 – $930,000) (206) Decrease in trade and other payables ($2,034,000 – $831,000) (1,203) Decrease in accruals ($1,428,000 – $933,000) (495)Cash generated from operations 3,084Interest paid ($950,000 + $730,000 – $850,000) (830)Profits tax paid ($1,050,000 + $845,000 – $980,000) (915)Net cash from operating activities 1,339Net cash from operating activities 1,339Net cash from operating activitiesCash flows from investing activities Purchase of equipment (6,210)Proceeds from sale of equipment 1,300Interest received 90 Net cash used in investing activities (4,820)Cash flows from financing activitiesBorrowing from bank 3,330Payment of equipment contract liabilities (1,200)Dividends paid* (990)Net cash from financing activities 1,140 Net decrease in cash and cash equivalent (2,341)Net decrease in cash and cash equivalent (2,341)Net decrease in cash and cash equivalentCash and cash equivalents at 1 January 20X1 9,990Cash and cash equivalents at 31 December 20X1 7,649
* this could also be shown as an operating cash flow.
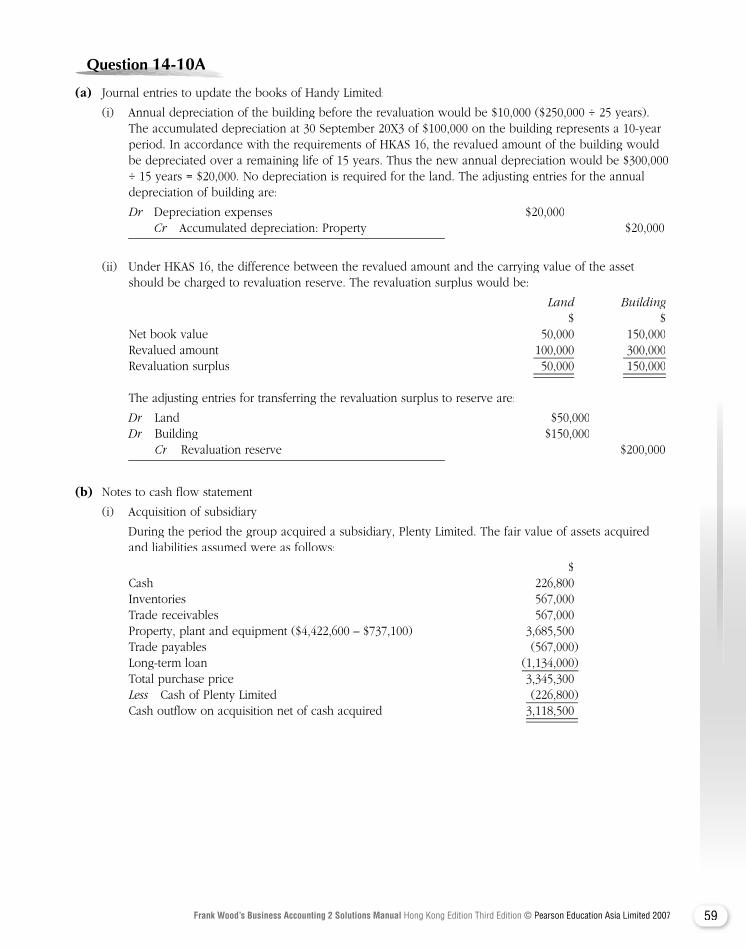
59Frank Wood’s Business Accounting 2 Solutions Manual Hong Kong Edition Third Edition © Pearson Education Asia Limited 2007
Question Question Question Question Question Question 14-10A14-10A14-10A14-10A14-10A14-10A
(a) Journal entries to update the books of Handy Limited:
(i) Annual depreciation of the building before the revaluation would be $10,000 ($250,000 ÷ 25 years). The accumulated depreciation at 30 September 20X3 of $100,000 on the building represents a 10-year period. In accordance with the requirements of HKAS 16, the revalued amount of the building would be depreciated over a remaining life of 15 years. Thus the new annual depreciation would be $300,000 ÷ 15 years = $20,000. No depreciation is required for the land. The adjusting entries for the annual depreciation of building are:
Dr Depreciation expenses $20,000Dr Depreciation expenses $20,000Dr Cr Accumulated depreciation: Property $20,000Cr Accumulated depreciation: Property $20,000Cr
(ii) Under HKAS 16, the difference between the revalued amount and the carrying value of the asset should be charged to revaluation reserve. The revaluation surplus would be:
Land Building $ $ Net book value 50,000 150,000 Revalued amount 100,000 300,000 Revaluation surplus 50,000 150,000
The adjusting entries for transferring the revaluation surplus to reserve are:
Dr Land $50,000Dr Land $50,000DrDr Building $150,000Dr Building $150,000Dr
Cr Revaluation reserve $200,000Cr Revaluation reserve $200,000Cr
(b) Notes to cash flow statement
(i) Acquisition of subsidiary
During the period the group acquired a subsidiary, Plenty Limited. The fair value of assets acquired and liabilities assumed were as follows:
$ Cash 226,800 Inventories 567,000 Trade receivables 567,000 Property, plant and equipment ($4,422,600 – $737,100) 3,685,500 Trade payables (567,000) Long-term loan (1,134,000) Total purchase price 3,345,300 Less Cash of Plenty Limited (226,800)Less Cash of Plenty Limited (226,800)Less Cash outflow on acquisition net of cash acquired 3,118,500
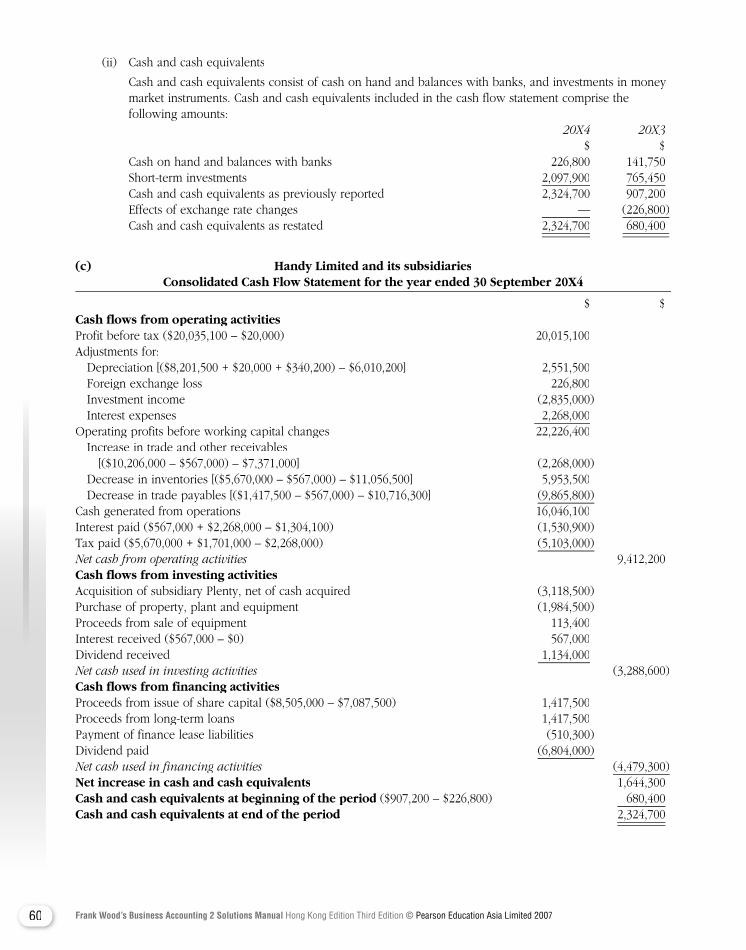
60 Frank Wood’s Business Accounting 2 Solutions Manual Hong Kong Edition Third Edition © Pearson Education Asia Limited 2007
(ii) Cash and cash equivalents
Cash and cash equivalents consist of cash on hand and balances with banks, and investments in money market instruments. Cash and cash equivalents included in the cash flow statement comprise the following amounts:
20X4 20X3 $ $ Cash on hand and balances with banks 226,800 141,750 Short-term investments 2,097,900 765,450 Cash and cash equivalents as previously reported 2,324,700 907,200 Effects of exchange rate changes — (226,800) Cash and cash equivalents as restated 2,324,700 680,400
(c) Handy Limited and its subsidiaries Consolidated Cash Flow Statement for the year ended 30 September 20X4
$ $Cash flows from operating activitiesProfit before tax ($20,035,100 – $20,000) 20,015,100Adjustments for: Depreciation [($8,201,500 + $20,000 + $340,200) – $6,010,200] 2,551,500 Foreign exchange loss 226,800 Investment income (2,835,000) Interest expenses 2,268,000Operating profits before working capital changes 22,226,400 Increase in trade and other receivables [($10,206,000 – $567,000) – $7,371,000] (2,268,000) Decrease in inventories [($5,670,000 – $567,000) – $11,056,500] 5,953,500 Decrease in trade payables [($1,417,500 – $567,000) – $10,716,300] (9,865,800)Cash generated from operations 16,046,100Interest paid ($567,000 + $2,268,000 – $1,304,100) (1,530,900)Tax paid ($5,670,000 + $1,701,000 – $2,268,000) (5,103,000)Net cash from operating activities 9,412,200Net cash from operating activities 9,412,200Net cash from operating activitiesCash flows from investing activitiesAcquisition of subsidiary Plenty, net of cash acquired (3,118,500)Purchase of property, plant and equipment (1,984,500)Proceeds from sale of equipment 113,400Interest received ($567,000 – $0) 567,000Dividend received 1,134,000Net cash used in investing activities (3,288,600)Net cash used in investing activities (3,288,600)Net cash used in investing activitiesCash flows from financing activitiesProceeds from issue of share capital ($8,505,000 – $7,087,500) 1,417,500Proceeds from long-term loans 1,417,500Payment of finance lease liabilities (510,300)Dividend paid (6,804,000)Net cash used in financing activities (4,479,300)Net increase in cash and cash equivalents 1,644,300Cash and cash equivalents at beginning of the period ($907,200 – $226,800) 680,400Cash and cash equivalents at end of the period 2,324,700
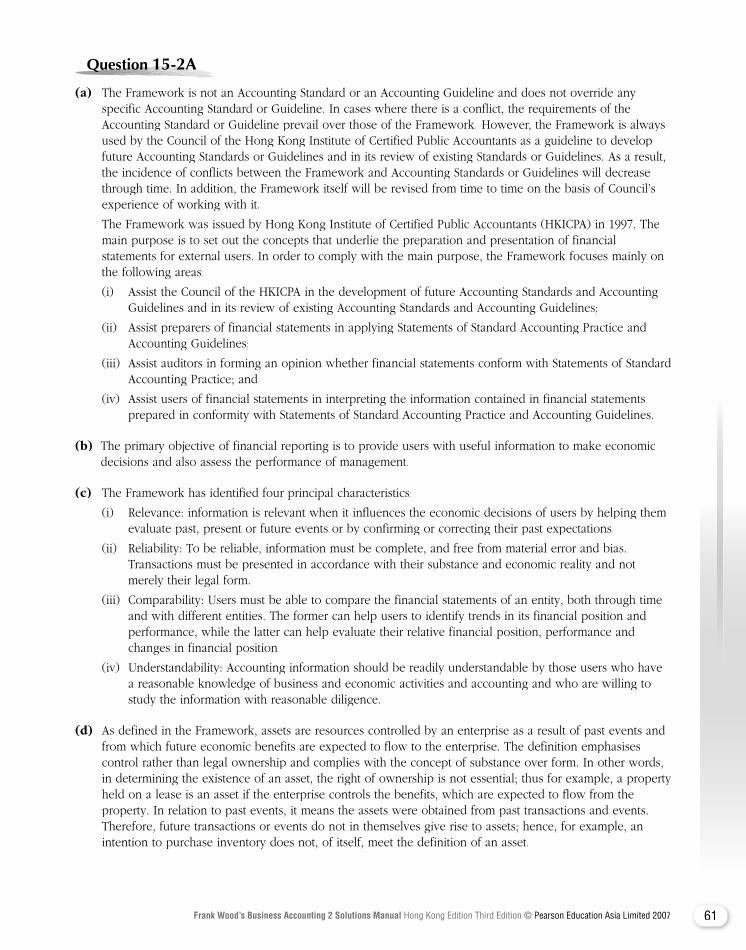
61Frank Wood’s Business Accounting 2 Solutions Manual Hong Kong Edition Third Edition © Pearson Education Asia Limited 2007
Question Question Question Question Question Question Question 15-2A15-2A15-2A15-2A15-2A15-2A
(a) The Framework is not an Accounting Standard or an Accounting Guideline and does not override any specific Accounting Standard or Guideline. In cases where there is a conflict, the requirements of the Accounting Standard or Guideline prevail over those of the Framework. However, the Framework is always used by the Council of the Hong Kong Institute of Certified Public Accountants as a guideline to develop future Accounting Standards or Guidelines and in its review of existing Standards or Guidelines. As a result, the incidence of conflicts between the Framework and Accounting Standards or Guidelines will decrease through time. In addition, the Framework itself will be revised from time to time on the basis of Council’s experience of working with it.
The Framework was issued by Hong Kong Institute of Certified Public Accountants (HKICPA) in 1997. The main purpose is to set out the concepts that underlie the preparation and presentation of financial statements for external users. In order to comply with the main purpose, the Framework focuses mainly on the following areas:
(i) Assist the Council of the HKICPA in the development of future Accounting Standards and Accounting Guidelines and in its review of existing Accounting Standards and Accounting Guidelines;
(ii) Assist preparers of financial statements in applying Statements of Standard Accounting Practice and Accounting Guidelines;
(iii) Assist auditors in forming an opinion whether financial statements conform with Statements of Standard Accounting Practice; and
(iv) Assist users of financial statements in interpreting the information contained in financial statements prepared in conformity with Statements of Standard Accounting Practice and Accounting Guidelines.
(b) The primary objective of financial reporting is to provide users with useful information to make economic decisions and also assess the performance of management.
(c) The Framework has identified four principal characteristics:
(i) Relevance: information is relevant when it influences the economic decisions of users by helping them evaluate past, present or future events or by confirming or correcting their past expectations.
(ii) Reliability: To be reliable, information must be complete, and free from material error and bias. Transactions must be presented in accordance with their substance and economic reality and not merely their legal form.
(iii) Comparability: Users must be able to compare the financial statements of an entity, both through time and with different entities. The former can help users to identify trends in its financial position and performance, while the latter can help evaluate their relative financial position, performance and changes in financial position.
(iv) Understandability: Accounting information should be readily understandable by those users who have a reasonable knowledge of business and economic activities and accounting and who are willing to study the information with reasonable diligence.
(d) As defined in the Framework, assets are resources controlled by an enterprise as a result of past events and from which future economic benefits are expected to flow to the enterprise. The definition emphasises control rather than legal ownership and complies with the concept of substance over form. In other words, in determining the existence of an asset, the right of ownership is not essential; thus for example, a property held on a lease is an asset if the enterprise controls the benefits, which are expected to flow from the property. In relation to past events, it means the assets were obtained from past transactions and events. Therefore, future transactions or events do not in themselves give rise to assets; hence, for example, an intention to purchase inventory does not, of itself, meet the definition of an asset.
62 Frank Wood’s Business Accounting 2 Solutions Manual Hong Kong Edition Third Edition © Pearson Education Asia Limited 2007
The Framework also defines liabilities as present obligations of the enterprise arising from past events, the settlement of which are expected to result in an outflow from the enterprise of resources embodying economic benefits. As seen from the definition, the Framework stresses that the essential characteristic of a liability is that the enterprise has a present obligation. An obligation may be a legal obligation or a constructive obligation. A legal obligation is an obligation that derives from a contract, legislation, or other operation of law. For example, a legal obligation arises when an enterprise signs a purchase contract with one of its suppliers. A constructive obligation is an obligation that derives from an enterprise's actions. Through past practice or published policies, the enterprise creates a valid expectation on the part of other parties that it will accept certain responsibilities. For example, an enterprise that promises to raise employees’ salaries and makes this known to its employees creates a constructive obligation.
The importance of definitions of assets and liabilities in the balance sheet and income statement can be summarised in the following points:
(i) The definitions can identify when an enterprise recognises assets and liabilities in the balance sheet.
(ii) Assets and liabilities can be used to determine the equity interest, which is the residual of assets less liabilities.
(iii) The recognition of assets and liabilities also indicates a corresponding recognition of expenses and income.
(iv) The definitions of assets and liabilities can minimise the effects of off-balance sheet financing.
Question Question Question Question Question Question Question 15-3A15-3A15-3A15-3A15-3A15-3A
(a) HKAS 18 defines revenue as ‘the gross inflow of economic benefits during the period arising in the course of the ordinary activities of an entity when those inflows result in increases in equity, other than increases relating to contributions from equity participants’.
(i) When there is an agreement between the entity and the buyer of the asset, revenue shall be measured at the fair value of the consideration received or receivable, taking into consideration the amount of any trade discounts and volume rebates allowed by the entity.
(ii) When goods or services are exchanged or swapped for goods and services which are of dissimilar nature and value, the revenue is measured at the fair value of the goods or services received, adjusted by the amount of any cash or cash equivalents transferred.
(b) (i) HKAS 18 specifies that revenue from the sale of goods should be recognised when all the following criteria have been met:
(1) the enterprise has transferred to the buyer the significant risks and rewards of ownership of the goods;
(2) the enterprise retains neither continuing managerial involvement to the degree usually associated with ownership nor effective control over the goods sold;
(3) it is probable that the economic benefits associated with the transaction will flow to the enterprise;
(4) the amount of revenue can be measured reliably; and
(5) the costs incurred or to be incurred in respect of the transaction can be measured reliably.
(ii) HKAS 18 specifies that revenue arising from the use by others of enterprise assets yielding interest, royalties and dividends should be recognised when:
(1) it is probable that the economic benefits associated with the transaction will flow to the enterprise; and
(2) the amount of the revenue can be measured reliably.
63Frank Wood’s Business Accounting 2 Solutions Manual Hong Kong Edition Third Edition © Pearson Education Asia Limited 2007
(c) (1) In accordance with the requirements of HKAS 18, the initial fee of the rights from the franchise for $160,000 should be treated as a deferred item and should be recognised in future periods of four years as revenue. The annual fee of $50,000 should be recorded as revenue for each year. Therefore, the amount of revenue to be recognised as revenue for this transaction for the year ended 30 September 20X5 shall be $90,000 ($160,000 ÷ 4 + $50,000).
(3) In accordance with HKAS 18, subscriptions received on 1 February 20X5 for which magazines have not yet been delivered to the customers should be treated as deferred revenue. An amount of $42,000 ($252,000 × 6 ÷ 36) should be recognised as revenue for the year ended 30 September 20X5 and the balance of $210,000 should be recognised as a liability.
Question Question Question Question Question Question Question 15-4A15-4A15-4A15-4A15-4A15-4A
(a) Prior period errors, defined by HKAS 8, are omissions from, and misstatements in, the entity’s financial statements for one or more prior periods arising from a failure to use, or misuse of, reliable information that was available when financial statements for those periods were authorised for issue and could reasonably be expected to have been obtained and taken into account in the preparation and presentation of those financial statements.
Prior period errors include the effects of mathematical mistakes, mistakes in applying accounting policies, oversights or misinterpretations of facts, and fraud.
HKAS 8 requires an enterprise to disclose the following information:
(1) the nature of the prior period error;
(2) for each prior period presented, to the extent practicable, the amount of the correction:
(i) for each financial statement line item affected; and
(ii) for basic and diluted earnings per share, if HKAS 33 applies;
(3) the amount of the correction at the beginning of the earliest prior period presented; and
(4) the circumstances that led to the existence of that condition and a description of how and from when the error has been corrected, if retrospective restatement is impracticable for a particular prior period.
(b) (i) The major issue concerning the lease of an office premise is whether the lease payments should be capitalised (and amortised) or expensed as incurred. HKAS 17 Leases requires that a finance lease Leases requires that a finance lease Leasesshould be recognised as an asset and a liability, while operating lease payments should be expensed on a straight-line basis over the lease term.
Whether the lease concerned is a finance lease or an operating lease should be judged on its economic substance rather than its legal form. A number of indicators lead to a lease being classified as a finance lease and these are given in HKAS 17 indicators of a finance lease that are applicable in the context of this lease are:
— the lease term is the major part of the economic life of the asset; and
— the present value of the minimum lease payments amounts to at least substantially the fair value of the leased asset at the inception of the lease.
In the case of this non-cancellable lease, a lease period of five years for the office premise that a new office block development will certainty not be for the major part of economic life of the office premise.
64 Frank Wood’s Business Accounting 2 Solutions Manual Hong Kong Edition Third Edition © Pearson Education Asia Limited 2007
It appears that the present value of lease payments for five years, using the best lending rate of 4% as the discount factor ($150,000 + $150,000 × 3.630 = $694,500), is unlikely to be substantially close to the fair value ($3 million) of the office premise.
Based on the limited information given in question, this lease should be classified as an operating lease; the annual lease payment ($150,000) should be charged to profit and loss account in each year over the lease period. Dazie Limited should disclose the total of future minimum lease payments, lease payments recognised for the year and description of significant leasing arrangements.
If the lease is an operating lease rather than a finance lease, then both the assets and liabilties of the company are overstated for the year ended 31 December 20X4. However, the amounts of misstatements of assets and liabilities balances represent only 1.7% ($694,500 ÷ $40,400,000 = 1.7%) of total assets for the year ended 31 December 20X4. The amount of error involved is not material; however, it is necessary to correct it because the accounting treatment for this item is not in line with HKAS 17.
(ii) The main issue of this case is whether the sale of the specialist equipment is a material related party transaction.
According to HKAS 24, two or more parties are considered to be related if they are subject to common control or common significant influence; and if one party has the ability to control or exercise significant influence over the other party in making financial and operating decisions. One of the key management of Dazie Limited, Mr Joe Woo, has an equity interest of 35% in Aberson Limited. Aberson Limited and Dazie Limited appear to have a related party relationship because both companies are subject to common significant influence, exercised by Joe Woo, over financial and operating decisions. Joe Woo controls Dazie Limited through his position as a director and the 35% equity interest in Aberson Limited is presumed to constitute significant influence.
Based on the discussion so far, the sale of specialist equipment to Aberson Limited should be accounted for as a related party transaction which is so material that disclosure is required to ensure proper understanding of this transaction. The loss on disposal of specialist equipment for $530,000 represents 13.77% ($530,000 ÷ $3,850,000) of profit before tax for the year ended 31 December 20X4 and therefore is a material item. According to HKAS 24, the following information should be disclosed in a note to the financial statements for the year ended 31 December 20X4:
— the related party relationship;
— key management personnel compensation;
— the amount of transaction involved;
— the outstanding amount due from Aberson Limited;
— the terms and conditions of the transactions;
— the nature of the consideration to be provided in settlement; and
— details of any guarantees given or received.
Even though the amount required to be disclosed is material in relation to the profit before tax, no prior year adjustment is required as the non-disclosure of items above does not affect the operating results of the company.
65Frank Wood’s Business Accounting 2 Solutions Manual Hong Kong Edition Third Edition © Pearson Education Asia Limited 2007
Question Question Question Question Question Question Question 15-6A15-6A15-6A15-6A15-6A15-6A
(a) The initial measurement of the cost at which the plant would be capitalised is calculated as follows:
$ $Purchase price
Purchase price of plant 1,920,000Less Trade discount ($1,920,000 × 15%) (288,000) 1,632,000
Directly attributable costs Shipping costs and handling charges 22,000 Costs of pre-production testing 100,000 122,000 Installation costs of electrical cable ($112,000 – $48,000) 64,000 Costs of concrete reinforcement 36,000 Labour costs allocated to site preparation 60,000 160,000
Initial estimate of dismantling, removing and restoring costs Dismantling costs 120,000 Restoration costs 24,000 144,000
Total initial cost of plant Total initial cost of plant Total initial cost of plant 2,058,000
In accordance with HKAS 16, the cost of a tangible non-current assest comprises its purchase price and any other costs directly attributable to bringing the asset into a working condition for its intended use.
Therefore, the initial cost of a tangible non-current asset, specified in HKAS 16, includes:
1 The purchase price of the tangible non-current asset should include any transport and handling costs and non-refundable taxes; however, trade discounts and rebates should be deducted from it. If the payment is deferred beyond normal credit terms, this should be taken into account either by the use of discounting or substituting a cash equivalent price.
2 The directly attributable costs, which bring the asset to the location and condition necessary for intended use by management, may include installation costs and site preparation costs; and professional fees such as legal fees, architects’ fees, etc.
3 The initial estimate of the costs of dismantling and removing the item and restoring the site on which it is located. This is the obligation which an entity may incur when the item is acquired or as a consequence of having used an item during a particular period for purposes other than to produce inventories during the period.
(b) In accordance with HKAS 16, circumstances in which subsequent expenditure on those assets being capitalised should depend on whether the expenditure incurred will result in a probable future economic benefit in excess of the amount originally assessed for the asset. All other subsequent expenditure should be recognised in the income statement as it is incurred.
66 Frank Wood’s Business Accounting 2 Solutions Manual Hong Kong Edition Third Edition © Pearson Education Asia Limited 2007
Examples of circumstances where subsequent expenditure should be capitalised are:
• A modification to the asset that enhances the production capacity of an asset.
• The upgrading of an asset that will improve the quality of production or output.
• An improvement of the existing production process which results in cost savings.
• A major component of an asset that has been treated separately is replaced or restored; for example, new engines for a machine.
• A major overhaul of an asset that restores its previous life; therefore, the consumption of the previous economic benefits has been reflected by past depreciation charges.
(Any two points)
(c) In accordance with HKAS 16, after initial recognition, an item of tangible non-current asset shall be measured by applying either the cost method or revaluation method:
(i) Cost method — an item of property, plant and equipment shall be carried at its costs less any accumulated depreciation and any accumulated impairment losses.
(ii) Revaluation method — an item of property, plant and equipment shall be carried at a revalued amount, being its fair value at the date of the revaluation less any subsequent accumulated depreciation and subsequent accumulated impairment losses.
An entity allocates, on a systematic basis, the amount initially recognised, that is, the depreciable amount of an item of property, plant and equipment over its useful life. The depreciation method used shall reflect the pattern in which the asset’s future economic benefits are expected to be consumed by the entity.
If the recoverable amount of an item of property, plant and equipment is less than its carrying amount, the carrying amount of the property, plant and equipment shall be reduced to its recoverable amount; and that reduction is an impairment loss.
Question Question Question Question Question Question Question 16-2A16-2A16-2A16-2A16-2A16-2A
(a) HKAS 40 requires that investment properties be included in the balance sheet at their fair value and are not subject to annual depreciation.
The accounting treatment of investment properties is different from property, plant and equipment, as stated in HKAS 16, where general property is recorded at cost and subject to annual depreciation. The reasons for the different accounting treatment between investment properties and owner-occupied properties are:
(i) The major reasons for owning investment properties are the expected rental return and benefits from capital appreciation. The purpose of owning investment properties is similar to that of holding trading securities; therefore, presenting investment properties at their fair value can reflect the intention of holding investment properties.
(ii) Investment properties are not held for consumption in normal course of business; in particular, they are not used for the production of goods for sale or for providing services to customer or for administrative purposes. The underlying reason for providing annual depreciation is ‘matching’ costs with related revenue generated from owner-occupied properties, plant and equipment.
(iii) Investment properties are held as an investment for subsequent disposal for capital gains. For the purpose of making an appropriate economic decision in this context, it is the current values of the investment and the changes in them that are more important than their original costs.
67Frank Wood’s Business Accounting 2 Solutions Manual Hong Kong Edition Third Edition © Pearson Education Asia Limited 2007
(b) Before 1 July 20X4, the apartment block was not owner-occupied but held to earn rentals and therefore was an investment property under HKAS 40. Under HKAS 40, gains and losses arising from a change in fair values should be included in net profit or loss for the year.
From 1 July 20X4 onward, the apartment block was accounted for as an item of property, plant and equipment because it was rented to a subsidiary; therefore, the re-classification from investment property to property, plant and equipment is required. HKAS 40 states that, for a transfer from investment property carried at fair value to owner-occupied property, the property's deemed cost for subsequent accounting shall be its fair value at the date of change in use. Therefore, the carrying value of property, plant and equipment at 1 July 20X4 shall be its fair value at that date.
Under HKAS 16, gains and losses arising from a change in fair values should not be included in net profit or loss for the year but should be treated as movements in the revaluation reserve. The $3m ‘revaluation surplus’ in 20X5 represents 7% of total assets (and 70% of profit before taxation) and is therefore material. In accordance with HKAS 16, annual depreciation should be provided for the property, plant and equipment over its remaining useful life from 1 July 20X4.
The journal entries for 20X4 and 20X5 are as follows:
$000 $000
30/6/X4 Dr Investment properties 2,000Dr Investment properties 2,000Dr Cr Profit and loss — surplus on revaluation 2,000Cr Profit and loss — surplus on revaluation 2,000Cr To charge the change in value of investment property to profit and loss.
1/7/X4 Dr Property, plant and equipment 9,000Dr Property, plant and equipment 9,000Dr Cr Investment properties 9,000Cr Investment properties 9,000Cr To record the transfer from investment properties to property, plant and equipment.
30/6/X5 Dr Profit and loss — increase in value of properties 3,000Dr Profit and loss — increase in value of properties 3,000Dr Cr Revaluation reserve 3,000Cr Revaluation reserve 3,000Cr To credit the increase in value of property, plant and equipment to equity.
30/6/X5 Dr Profit and loss — depreciation expenses 600Dr Profit and loss — depreciation expenses 600Dr Cr Provision for depreciation 600Cr Provision for depreciation 600Cr To provide the annual depreciation for property, plant and equipment.

68 Frank Wood’s Business Accounting 2 Solutions Manual Hong Kong Edition Third Edition © Pearson Education Asia Limited 2007
Question Question Question Question Question Question Question 16-5A16-5A16-5A16-5A16-5A16-5A
(a) HKFRS 1 First-time Adoption of Hong Kong Financial Reporting Standards gives guidelines to an entity in First-time Adoption of Hong Kong Financial Reporting Standards gives guidelines to an entity in First-time Adoption of Hong Kong Financial Reporting Standardspreparing its first HKFRS financial statements. Its main objective is to provide high quality information that is transparent for users and comparable over all periods presented. In addition, it also provides a suitable starting point for accounting under HKFRSs.
HKFRS 1 should apply when an entity adopts HKFRSs for the first time as the basis for preparing its financial statements and interim financial reports. It does not apply to subsequent financial statements that are prepared under HKFRSs.
(b) HKFRS 1 requires an entity to do the following in the opening HKFRs balance sheet:
(i) recognise all assets and liabilities whose recognition is required by HKFRSs;
(ii) do not recognise items are assets or liabilities if HKFRSs do not allow such recognition;
(iii) reclassify items that it recognised under previous Generally Accepted Accounting Principles (GAAP) as one type of asset, liability or component of equity, but are a different type of asset, liability or component of equity under HKFRSs; and
(iv) apply HKFRSs in measuring all recognised assets and liabilities.
(c) Since the company intends to adopt for the first time HKFRS financial statements for the year ended 31 December 20X5, the date of transition to HKFRSs is 1 January 20X4.
Richfield Limited — opening balance sheet as at 1 January 20X4
$000 $000Non-current assets
Property, plant and equipment 7,500 Investment properties 4,000 Goodwill (Note 1) 2,500 14,000
Current assets Inventory 2,500 Trade and other receivables 1,400 Cash and bank 800 4,700 18,700
Financed by: Issued share capital 4,000 Retained earnings (Note 5) 10,020 Other reserves (Note 2) 1,300 15,320
Current liabilities Trade and other payables 1,000 Other provisions (Note 3) 480 1,480
Non-current liabilitiesLong-term loans 1,100
Deferred tax (Note 4) 800 1,900 18,700
69Frank Wood’s Business Accounting 2 Solutions Manual Hong Kong Edition Third Edition © Pearson Education Asia Limited 2007
Notes:
1 Goodwill should be increased. The cumulative amortisation charge of $1,000,000 is to be written back to goodwill since it does not qualify for recognition under HKFRSs.
2 The investment property revaluation reserve of $1,200,000 should be transferred to retained earnings since it should not be included in other reserves under HKFRSs.
3 The contingent liabilities should be transferred to retained earnings since it does not qualify for recognition under HKFRSs.
4 Deferred tax should be restated to their HKFRS-based valuation of $800,000.
5 Retained earnings after adjustments
$000 $000 Balance as per balance sheet 7,420 Adjustments for: Goodwill 1,000 Investment property revaluation reserve 1,200 Contingent liabilities 500 Deferred tax (100) 2,600 10,020
Question Question Question Question Question Question Question 16-6A16-6A16-6A16-6A16-6A16-6A
(a) As defined in HKAS 36 Impairment of Assets, an impairment loss is the amount by which the carrying amount of an asset exceeds its recoverable amount. The recoverable amount is the higher of an asset’s fair value less costs to sell and its value in use. In other words, the impairment loss is simply the difference between the carrying amount of an asset and the higher of its fair value less costs to sell and its value in use.
When looking for the possible existence of impairment to an asset, the entity should consider the following indicators:
(i) Significant decrease in market value of an asset.
(ii) Adverse effect of significant changes in the legal, economic or technological environment during the period or in the near future.
(iii) Increase in market interest rates or the market rates of return which are likely to increase the discount rates and materially decrease the recoverable value of an asset.
(iv) Carrying amount of the net assets of the entity is more than its market capitalisation.
(v) Evidence is available of obsolescence or physical damage of an asset.
(vi) Significant changes with an adverse effect on the entity have occurred or are expected to occur in the near future in relation to the use of an asset.
(vii) Evidence from internal reporting which indicates that the economic performance of an asset is, or will be, worse than expected.
(b) After the identification and determination of impairment loss of an asset, the carrying amount of the asset should be reduced to its recoverable amount. The amount of the reduction is an impairment loss, and should be recognised as an expense in the income statement immediately. However, the impairment loss on a revalued asset should be recognised directly against any revaluation surplus for the asset to the extent that the impairment loss does not exceed the amount in the revaluation surplus for that same asset.
70 Frank Wood’s Business Accounting 2 Solutions Manual Hong Kong Edition Third Edition © Pearson Education Asia Limited 2007
(c) Cash-generating unit
(i) The research centre is a corporate asset, which can only provide services to the company. As a result, it cannot generate its own cash inflows. Therefore, it is not a cash-generating unit.
(ii) Each retail store has its own customer base and has its own identifiable cash inflows from selling clothes to customers. Therefore, each store is an individual cash-generating unit.
(iii) Since the materials produced by Plant X could not be sold in an active market, it cannot generate independent cash inflows. Therefore, Plant X is not a separate cash-generating unit.
It is likely that Y is a separate cash-generating unit since Y sells its products to customers, with the materials used for production in Plant Y coming from Plant X. Therefore, Plants X and Y together are the smallest identifiable group of assets that generates cash inflows which are largely independent of cash flows generated by other assets.
Question Question Question Question Question Question Question 16-8A16-8A16-8A16-8A16-8A16-8A
(a) (i) Research phase
‘Research’, as defined by HKAS 38, is the original and planned investigation undertaken with the prospect of gaining new scientific or technical knowledge and understanding.
Examples of research activities are:
(1) activities aimed at obtaining new knowledge;
(2) the search for, evaluation and final selection of, applications of research findings or other knowledge;
(3) the search for alternatives for materials, devices, products, processes, systems or services; and
(4) the formulation, design, evaluation and final selection of possible alternatives for new development of improved materials, devices, products, processes, systems or services.
(Any 2 examples)
(ii) Development phase
‘Development’ is defined by HKAS 38 as the application of research findings or other knowledge to a plan or design for the production of new or substantially improved materials, devices, products, processes, systems or services prior to the commencement of commercial production or use.
Examples of development activities are:
(1) the design, construction and testing of pre-production or pre-use prototypes and models;
(2) the design of tools, jigs, moulds and dies involving new technology;
(3) the design, construction and operation of a pilot plant that is not of a scale economically feasible for commercial production; and
(4) the design, construction and testing of a chosen alternative for new developments of improved materials, devices, products, processes, systems or services.
(Any 2 examples)
(b) (i) The costs of the development projects to be capitalised as an intangible assets are:
$000 Staff salaries 200 Materials 20 Overhead costs 30 Depreciation of equipment used for the research 20 270
71Frank Wood’s Business Accounting 2 Solutions Manual Hong Kong Edition Third Edition © Pearson Education Asia Limited 2007
(ii) The justifications of the calculation should include discussions on the following areas:
(1) HKAS 38 requires that an intangible asset be recognised if and only if it is probable that the future economic benefits that are attributable to the asset will flow to the enterprise and the cost of the asset can be measured reliably.
There is no uncertainty regarding the measurement of costs incurred for the development project illustrated in the question. However, the development costs incurred before 1 December 20X3 should not be capitalised as an intangible asset because the enterprise could only demonstrate that, on 1 December 20X3, it would be feasible for the company to make the product ready to sell to customers and the product was proved to be marketable and profitable.
(2) Since there are uncertainties on whether future economic benefits will flow into the enterprise as a result of specific research expenditure, in accordance with the requirements of HKAS 38, no intangible asset arising from research should be recognised.
Examples of such expenditure incurred to provide future economic benefits to an enterprise but for which no intangible assets are created that can be recognised include start-up costs, expenditure on training activities, advertising and promotion. Therefore, the costs of market research and promotional activities should be recognised as an expense rather than capitalised as an intangible asset. Hence, the cost on market research and promotional activities of $30,000 for this purpose is excluded from the calculation above.
(3) HKAS 38 specifies that an intangible asset arising from development expenditure should be recognised if and only if an enterprise can demonstrate all of the following criteria are met:
— the technical feasibility of completing the intangible asset so that it will be available for use or sale;
— its intention to complete the intangible asset and use or sell it;
— its ability to use or sell the intangible asset;
— the intangible asset will generate probable future economic benefits;
— the availability of adequate resources to complete the development project that can make the asset or product ready for use or for sale; and
— its ability to measure the expenditure attributable to the intangible asset during its development reliably.
(4) On 31 December 20X3, the development costs of $270,000 are recognised as an intangible asset. These are the expenditure incurred since the date when the recognition criteria (given above) were met: that is, development costs, except for the costs for market research and promotional activities, incurred from 1 December to 31 December 20X3.
72 Frank Wood’s Business Accounting 2 Solutions Manual Hong Kong Edition Third Edition © Pearson Education Asia Limited 2007
Question Question Question Question Question Question Question 17-2A17-2A17-2A17-2A17-2A17-2A
(a) (Internal use)
Danielle Limited Trading and Profit and Loss Account for the year ended 31 December 20X9
$ $ $Sales 880,000Less Returns inwards (19,550) 860,450Less Cost of sales: Inventories, 1 January 20X9 220,500
Add Purchases 405,600Less Returns outwards (15,800) 389,800
610,300Less Inventories, 31 December 20X9 (210,840) (399,460)
Gross profit 460,990Distribution costs:Hire of motor vehicles 9,470General distribution expenses 11,300Wages and salaries 134,690Motor expenses 12,400Depreciation: Plant and machinery 30,000 197,860Administrative expenses:Discounts allowed 5,040Hire of motor vehicles 5,710General administrative expenses 15,800Wages and salaries 89,720Directors’ remuneration 42,000Motor expenses 6,200Auditors’ remuneration 3,000Depreciation: Plant and machinery 25,000 192,470Less Discounts received Less Discounts received Less (3,890) 188,580 (386,440) 74,550Licence fees receivable 5,100 79,650Bank interest receivable 1,850Profit on ordinary activities before taxation 81,500Tax on profit on ordinary activities (28,350)Profit on ordinary activities after taxation 53,150Undistributed profits from last year 29,370 82,520Transfer to general reserve 15,000Proposed ordinary dividend 50,000 (65,000)Profits carried to next year 17,520
73Frank Wood’s Business Accounting 2 Solutions Manual Hong Kong Edition Third Edition © Pearson Education Asia Limited 2007
(b) Published income statement using the nature of expense method in accordance with HKAS 1:
Danielle Limited Income Statement for the year ended 31 December 20X9
$Revenue 860,450Cost of sales (399,460)Gross profit 460,990Other income ($5,100 + $1,850) 6,950Distribution costs (197,860)Administrative expenses (188,580)Profit before tax 81,500Income tax expense (28,350)Profit for the year 53,150
Dividends: Proposed ordinary dividend 50,000
Question Question Question Question Question Question Question 17-4A17-4A17-4A17-4A17-4A17-4A
(a) In accordance with HKAS 1, an income statement can be prepared either by the nature of expense method or the function of expense method. Under the nature of expense method, expenses are classified into raw materials and consumables, staff costs, depreciation and amortisation expense, and other operating expenses. Under the function of expense method, expenses are classified into cost of sales, distribution costs, administrative expenses and other operating expenses. Both methods produce the same operating results.
(b) The appropriate accounting treatments of items are as follows: (1) to (3)
(1) it is a current year error and is required to be adjusted in the income statement.
The journal entries are:
Dr Cr $000 $000 Administrative expenses 600 Investment 600
Tax payable ($600,000 × 17.5%) 105 Income tax expense 105
(2) It is an non-adjusting post-balance sheet event since the fire broke out on 15 January 20X9. Adjustment in the income statement is not required but disclosure of the event should be made as a note to the financial statements.

74 Frank Wood’s Business Accounting 2 Solutions Manual Hong Kong Edition Third Edition © Pearson Education Asia Limited 2007
(3) The proposed final dividend of $300,000 should not be shown as a liability in the balance sheet as it was proposed after the balance sheet date. It should be shown as a note to the financial statements. Alternatively, it may be shown as a component of shareholders’ equity. Under either treatment, the proposed final dividend will be shown on the face of the income statement.
(c) Sky Trading Ltd Income Statement for the year ended 31 December 20X8
$000Revenue 32,000Cost of sales (16,000)Gross profit 16,000Other income 350Distribution costs (2,600)Administrative expenses ($1,800,000 + $600,000) (2,400)Finance costs (130)Profit before tax 11,220 Income tax expense ($2,100,000 – $105,000) (1,995)Profit for the year 9,225
Dividends: Interim dividend paid 150 Final dividend proposed 300 450
Question Question Question Question Question Question Question 18-2A18-2A18-2A18-2A18-2A18-2A
(a) (For internal use) Payne Peerbrook Limited Trading and Profit and Loss Account for the year ended 31 December 20X8
$ $ $Sales 449,110Less Returns inwards (11,380) 437,730Less Cost of sales: Inventories, 1 January 20X8 107,143
Add Purchases 218,940 Carriage inwards 2,475
328,558Less Inventory, 31 December 20X8 (144,081)
184,477 Wages 3,096 Depreciation: Plant and machinery 7,000 (194,573)Gross profit 243,157Distribution costs:Warehouse wages 39,722Wages and salaries: Sales staff 28,161Motor expenses 12,300General distribution expenses 8,061Depreciation: Plant and machinery 21,000 Motor vehicles 6,000 115,244
75Frank Wood’s Business Accounting 2 Solutions Manual Hong Kong Edition Third Edition © Pearson Education Asia Limited 2007
$ $ $Administrative expenses:Wages and salaries 34,778Motor expenses 4,100General administrative expenses 7,914Debenture interest 10,000Directors’ remuneration 18,450Bad debts 3,050Discounts allowed 5,164Depreciation: Plant and machinery 7,000 Motor vehicles 2,000 92,456Less Discounts received (4,092) 88,364 (203,608) 39,549Other operating income: Royalties receivable 4,179Profit on ordinary activities before taxation 43,728Tax on profit on ordinary activities (14,150)Profit on ordinary activities after taxation 29,578Undistributed profits from last year 19,343 48,921Preference dividend 5,000Proposed ordinary dividend 10,000 (15,000)Undistributed profits carried forward to next year 33,921
(b) (For publication) Payne Peerbrook Limited Income Statement for the year ended 31 December 20X8
$Revenue ($437,730 – $5,164) 432,566Cost of sales ($194,573 – $4,092) (190,481)Gross profit 242,085Other revenue 4,179Distribution expenses (115,244)Administrative expenses (87,292)Profit before taxation 43,728Taxation (14,150)Net profit for the year 29,578
Dividends: Preference dividend paid 5,000 Proposed ordinary dividend 10,000 15,000
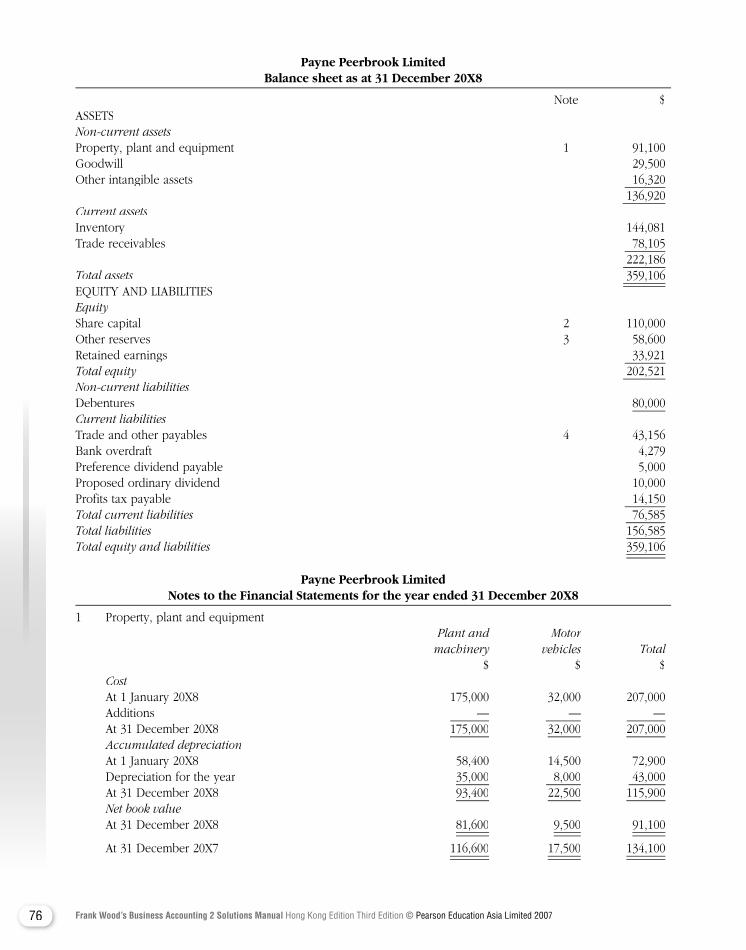
76 Frank Wood’s Business Accounting 2 Solutions Manual Hong Kong Edition Third Edition © Pearson Education Asia Limited 2007
Payne Peerbrook Limited Balance sheet as at 31 December 20X8
Note $ASSETSNon-current assetsProperty, plant and equipment 1 91,100Goodwill 29,500Other intangible assets 16,320 136,920Current assetsInventory 144,081Trade receivables 78,105 222,186Total assets 359,106EQUITY AND LIABILITIESEquityShare capital 2 110,000Other reserves 3 58,600Retained earnings 33,921Total equity 202,521Non-current liabilitiesDebentures 80,000Current liabilities Current liabilities Current liabilitiesTrade and other payables 4 43,156Bank overdraft 4,279Preference dividend payable 5,000Proposed ordinary dividend 10,000Profits tax payable 14,150Total current liabilities 76,585Total liabilities 156,585Total liabilities 156,585Total liabilitiesTotal equity and liabilities 359,106
Payne Peerbrook Limited Notes to the Financial Statements for the year ended 31 December 20X8
1 Property, plant and equipment Plant and Motor machinery vehicles Total $ $ $
Cost At 1 January 20X8 175,000 32,000 207,000 Additions — — — At 31 December 20X8 175,000 32,000 207,000
Accumulated depreciationAt 1 January 20X8 58,400 14,500 72,900
Depreciation for the year 35,000 8,000 43,000 At 31 December 20X8 93,400 22,500 115,900
Net book value At 31 December 20X8 81,600 9,500 91,100
At 31 December 20X7 116,600 17,500 134,100
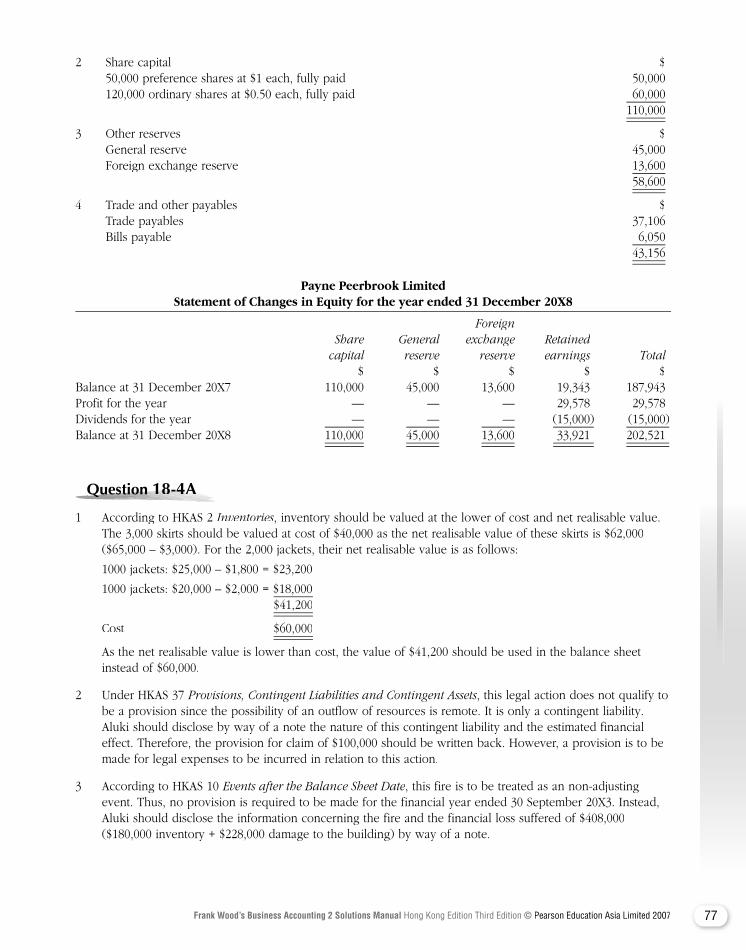
77Frank Wood’s Business Accounting 2 Solutions Manual Hong Kong Edition Third Edition © Pearson Education Asia Limited 2007
2 Share capital $ 50,000 preference shares at $1 each, fully paid 50,000 120,000 ordinary shares at $0.50 each, fully paid 60,000 110,000
3 Other reserves $ General reserve 45,000 Foreign exchange reserve 13,600 58,600
4 Trade and other payables $ Trade payables 37,106 Bills payable 6,050 43,156
Payne Peerbrook Limited Statement of Changes in Equity for the year ended 31 December 20X8
Foreign Share General exchange Retained capital reserve reserve earnings Total $ $ $ $ $Balance at 31 December 20X7 110,000 45,000 13,600 19,343 187,943Profit for the year — — — 29,578 29,578Dividends for the year — — — (15,000 ) (15,000 )Balance at 31 December 20X8 110,000 45,000 13,600 33,921 202,521
Question Question Question Question Question Question Question 18-4A18-4A18-4A18-4A18-4A18-4A
1 According to HKAS 2 Inventories, inventory should be valued at the lower of cost and net realisable value. The 3,000 skirts should be valued at cost of $40,000 as the net realisable value of these skirts is $62,000 ($65,000 – $3,000). For the 2,000 jackets, their net realisable value is as follows:
1000 jackets: $25,000 – $1,800 = $23,200
1000 jackets: $20,000 – $2,000 = $18,000 $41,200
Cost $60,000
As the net realisable value is lower than cost, the value of $41,200 should be used in the balance sheet instead of $60,000.
2 Under HKAS 37 Provisions, Contingent Liabilities and Contingent Assets, this legal action does not qualify to be a provision since the possibility of an outflow of resources is remote. It is only a contingent liability. Aluki should disclose by way of a note the nature of this contingent liability and the estimated financial effect. Therefore, the provision for claim of $100,000 should be written back. However, a provision is to be made for legal expenses to be incurred in relation to this action.
3 According to HKAS 10 Events after the Balance Sheet Date, this fire is to be treated as an non-adjusting event. Thus, no provision is required to be made for the financial year ended 30 September 20X3. Instead, Aluki should disclose the information concerning the fire and the financial loss suffered of $408,000 ($180,000 inventory + $228,000 damage to the building) by way of a note.
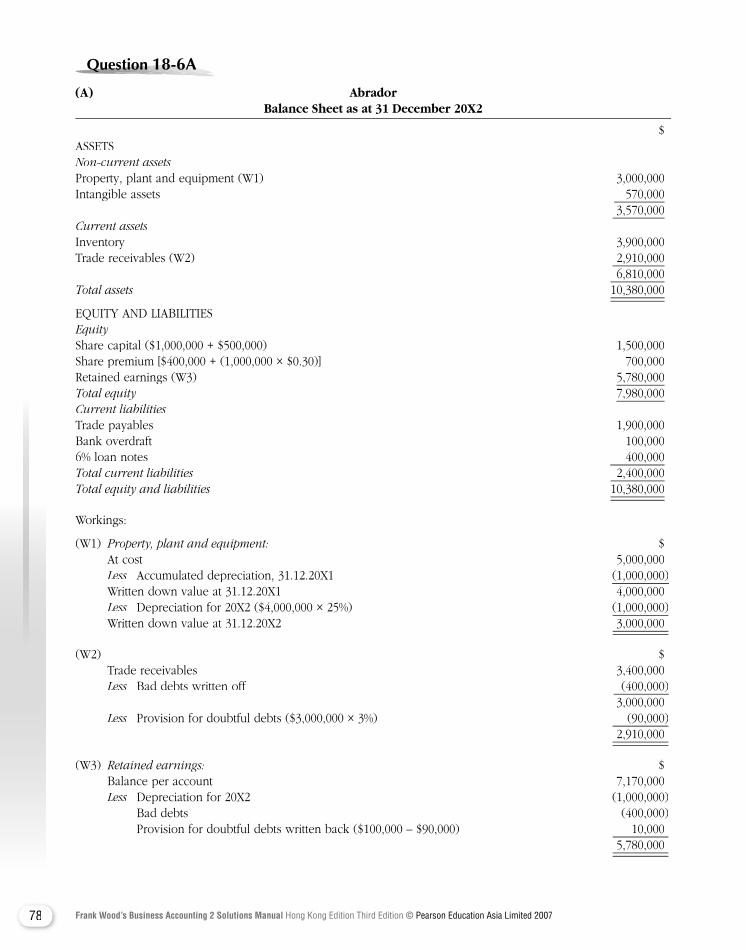
78 Frank Wood’s Business Accounting 2 Solutions Manual Hong Kong Edition Third Edition © Pearson Education Asia Limited 2007
Question Question Question Question Question Question Question 18-6A18-6A18-6A18-6A18-6A18-6A18-6A
(A) Abrador Balance Sheet as at 31 December 20X2
$ASSETS Non-current assetsProperty, plant and equipment (W1) 3,000,000Intangible assets 570,000 3,570,000Current assetsInventory 3,900,000Trade receivables (W2) 2,910,000 6,810,000Total assets Total assets Total assets 10,380,000
EQUITY AND LIABILITIESEquityShare capital ($1,000,000 + $500,000) 1,500,000Share premium [$400,000 + (1,000,000 × $0.30)] 700,000Retained earnings (W3) 5,780,000Total equity Total equity Total equity 7,980,000Current liabilitiesTrade payables 1,900,000Bank overdraft 100,0006% loan notes 400,000Total current liabilities 2,400,000Total equity and liabilities 10,380,000
Workings:
(W1) Property, plant and equipment: $ At cost 5,000,000
Less Accumulated depreciation, 31.12.20X1 (1,000,000) Written down value at 31.12.20X1 4,000,000
Less Depreciation for 20X2 ($4,000,000 × 25%) (1,000,000) Written down value at 31.12.20X2 3,000,000
(W2) $Trade receivables 3,400,000Less Bad debts written off (400,000)
3,000,000Less Provision for doubtful debts ($3,000,000 × 3%) (90,000)
2,910,000
(W3) Retained earnings: $ Balance per account 7,170,000
Less Depreciation for 20X2 (1,000,000)Less Depreciation for 20X2 (1,000,000)Less Bad debts (400,000) Provision for doubtful debts written back ($100,000 – $90,000) 10,000 5,780,000
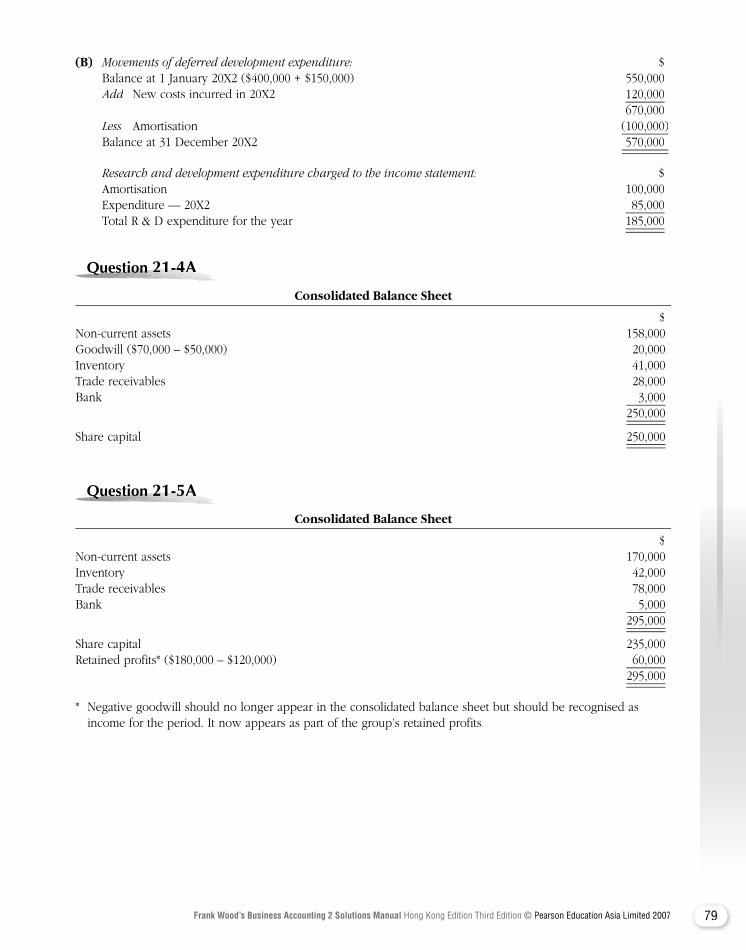
79Frank Wood’s Business Accounting 2 Solutions Manual Hong Kong Edition Third Edition © Pearson Education Asia Limited 2007
(B) Movements of deferred development expenditure: $ Balance at 1 January 20X2 ($400,000 + $150,000) 550,000
Add New costs incurred in 20X2 120,000 670,000
Less Amortisation (100,000) Balance at 31 December 20X2 570,000
Research and development expenditure charged to the income statement: $ Amortisation 100,000 Expenditure — 20X2 85,000 Total R & D expenditure for the year 185,000
Question Question Question Question Question Question Question 21-4A21-4A21-4A21-4A21-4A21-4A
Consolidated Balance Sheet
$Non-current assets 158,000Goodwill ($70,000 – $50,000) 20,000Inventory 41,000Trade receivables 28,000Bank 3,000 250,000
Share capital 250,000
Question Question Question Question Question Question Question 21-5A21-5A21-5A21-5A21-5A21-5A
Consolidated Balance Sheet
$Non-current assets 170,000Inventory 42,000Trade receivables 78,000Bank 5,000 295,000
Share capital 235,000Retained profits* ($180,000 – $120,000) 60,000 295,000
* Negative goodwill should no longer appear in the consolidated balance sheet but should be recognised as income for the period. It now appears as part of the group’s retained profits.

80 Frank Wood’s Business Accounting 2 Solutions Manual Hong Kong Edition Third Edition © Pearson Education Asia Limited 2007
Question Question Question Question Question Question Question 21-8A21-8A21-8A21-8A21-8A21-8A
Consolidated Balance Sheet
$Non-current assets 66,000Inventory 15,200Trade receivables 19,900Bank 6,100 107,200
Share capital 100,000Retained profits* 1,200Minority interest ($18,000 × 1
3 ) 6,000 107,200
* Negative goodwill: ($18,000 × 12,00018,000 ) – $10,800 = $1,200
Question Question Question Question Question Question Question 21-9A21-9A21-9A21-9A21-9A21-9A
Consolidated Balance Sheet
$Non-current assets 57,000Goodwill [$18,000 – ($20,000 × 75%)] 3,000Inventory 11,000Trade receivables 17,000Bank 7,000 95,000
Share capital 90,000Minority interest ($20,000 × 25%) 5,000 95,000
Question Question Question Question Question Question 21-12A21-12A21-12A21-12A21-12A21-12A
Consolidated Balance Sheet
$Non-current assets 147,000Goodwill [$38,000 – ($42,000 × 24,000
28,000 )] 2,000Current assets 51,000 200,000
Share capital 100,000Retained profits ($56,000 + $18,000*) 74,000General reserve 20,000Minority interest ($42,000 × 4,000
28,000 ) 6,000 200,000
* Negative goodwill: $48,000 – $30,000 = $18,000
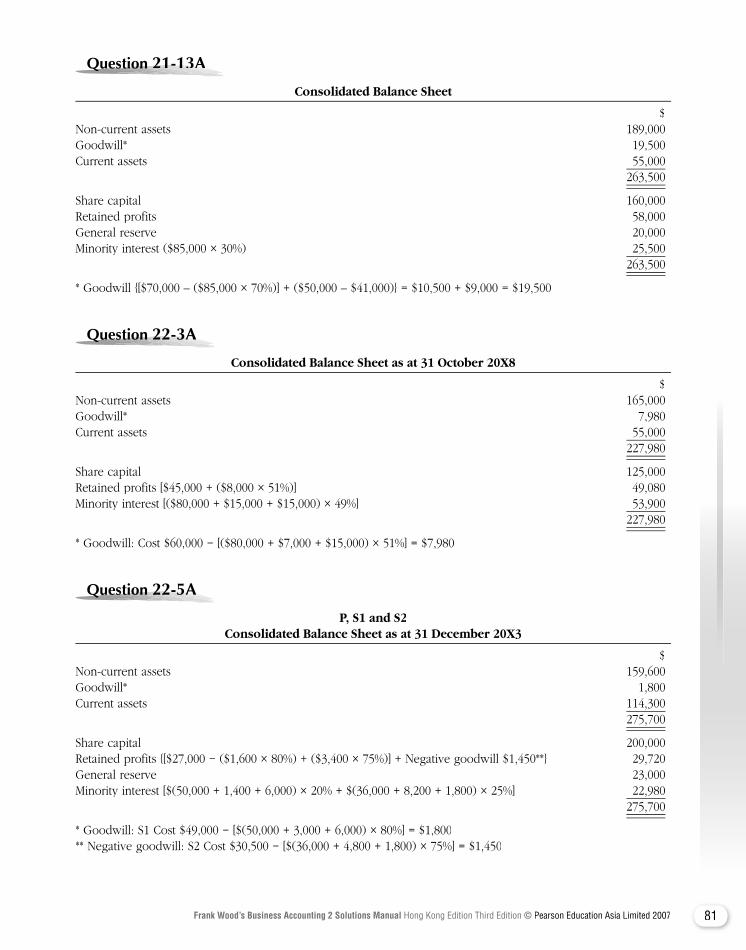
81Frank Wood’s Business Accounting 2 Solutions Manual Hong Kong Edition Third Edition © Pearson Education Asia Limited 2007
Question Question Question Question Question Question 21-13A21-13A21-13A21-13A21-13A21-13A
Consolidated Balance Sheet
$Non-current assets 189,000Goodwill* 19,500Current assets 55,000 263,500
Share capital 160,000Retained profits 58,000General reserve 20,000Minority interest ($85,000 × 30%) 25,500 263,500
* Goodwill {[$70,000 – ($85,000 × 70%)] + ($50,000 – $41,000)} = $10,500 + $9,000 = $19,500
Question Question Question Question Question Question Question 22-3A22-3A22-3A22-3A22-3A22-3A
Consolidated Balance Sheet as at 31 October 20X8
$Non-current assets 165,000Goodwill* 7,980Current assets 55,000 227,980
Share capital 125,000Retained profits [$45,000 + ($8,000 × 51%)] 49,080Minority interest [($80,000 + $15,000 + $15,000) × 49%] 53,900 227,980
* Goodwill: Cost $60,000 − [($80,000 + $7,000 + $15,000) × 51%] = $7,980
Question Question Question Question Question Question Question 22-5A22-5A22-5A22-5A22-5A22-5A
P, S1 and S2 Consolidated Balance Sheet as at 31 December 20X3
$Non-current assets 159,600Goodwill* 1,800Current assets 114,300 275,700
Share capital 200,000Retained profits {[$27,000 − ($1,600 × 80%) + ($3,400 × 75%)] + Negative goodwill $1,450**} 29,720General reserve 23,000Minority interest [$(50,000 + 1,400 + 6,000) × 20% + $(36,000 + 8,200 + 1,800) × 25%] 22,980 275,700
* Goodwill: S1 Cost $49,000 − [$(50,000 + 3,000 + 6,000) × 80%] = $1,800** Negative goodwill: S2 Cost $30,500 − [$(36,000 + 4,800 + 1,800) × 75%] = $1,450
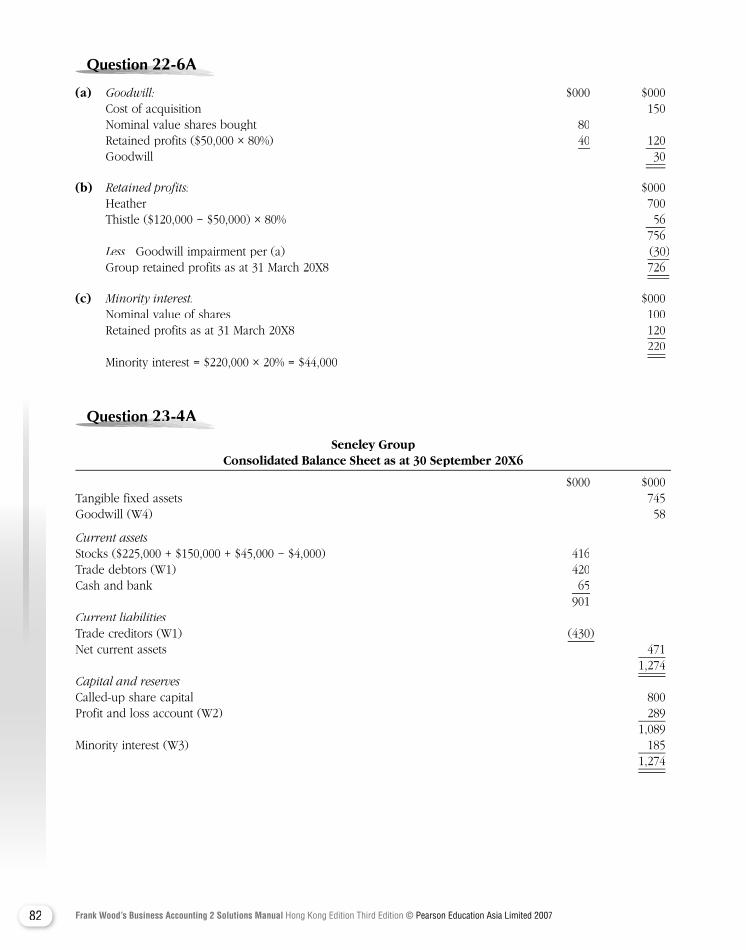
82 Frank Wood’s Business Accounting 2 Solutions Manual Hong Kong Edition Third Edition © Pearson Education Asia Limited 2007
Question Question Question Question Question Question Question 22-6A22-6A22-6A22-6A22-6A22-6A22-6A22-6A
(a) Goodwill: $000 $000Cost of acquisition 150
Nominal value shares bought 80 Retained profits ($50,000 × 80%) 40 120 Goodwill 30
(b) Retained profits: $000Heather 700
Thistle ($120,000 − $50,000) × 80% 56 756
Less Goodwill impairment per (a) (30)Less Goodwill impairment per (a) (30)Less Group retained profits as at 31 March 20X8 726
(c) Minority interest: $000 Nominal value of shares 100 Retained profits as at 31 March 20X8 120 220 Minority interest = $220,000 × 20% = $44,000
Question Question Question Question Question Question Question 23-4A23-4A23-4A23-4A23-4A23-4A
Seneley Group Consolidated Balance Sheet as at 30 September 20X6
$000 $000Tangible fixed assets 745Goodwill (W4) 58
Current assetsStocks ($225,000 + $150,000 + $45,000 − $4,000) 416Trade debtors (W1) 420Cash and bank 65 901Current liabilitiesTrade creditors (W1) (430 )Net current assets 471 1,274Capital and reservesCalled-up share capital 800Profit and loss account (W2) 289 1,089Minority interest (W3) 185 1,274
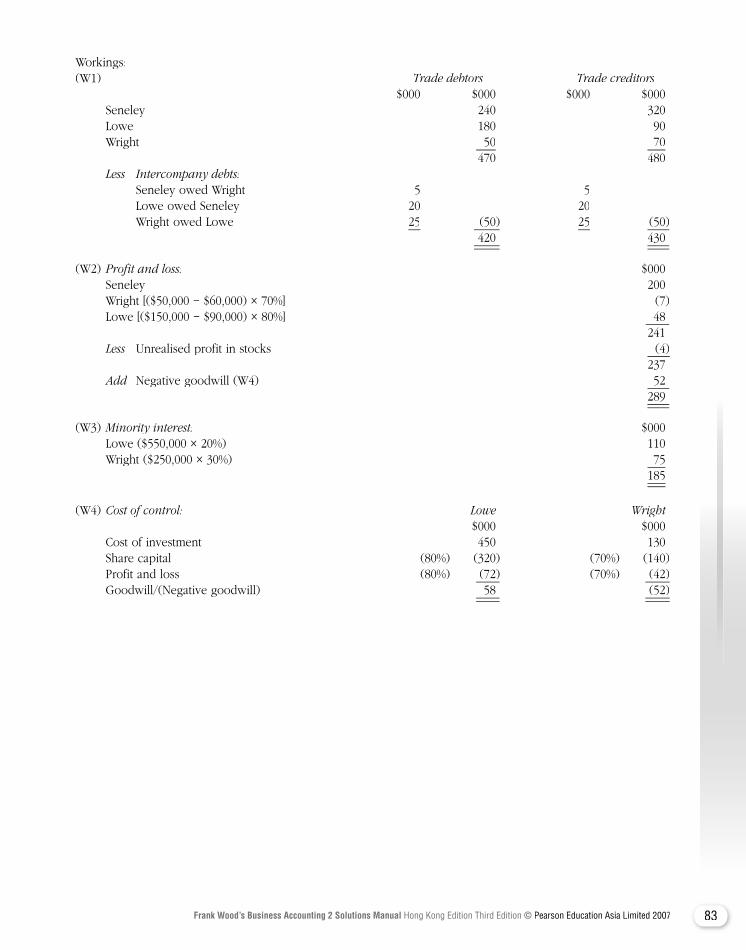
83Frank Wood’s Business Accounting 2 Solutions Manual Hong Kong Edition Third Edition © Pearson Education Asia Limited 2007
Workings:(W1) Trade debtors Trade creditors $000 $000 $000 $000 Seneley 240 320 Lowe 180 90 Wright 50 70 470 480
Less Intercompany debts: Seneley owed Wright 5 5 Lowe owed Seneley 20 20 Wright owed Lowe 25 (50 ) 25 (50 ) 420 430
(W2) Profit and loss: $000 Seneley 200 Wright [($50,000 − $60,000) × 70%] (7 ) Lowe [($150,000 − $90,000) × 80%] 48 241
Less Unrealised profit in stocks Less Unrealised profit in stocks Less (4 ) 237
Add Negative goodwill (W4) 52Add Negative goodwill (W4) 52Add 289
(W3) Minority interest: $000 Lowe ($550,000 × 20%) 110 Wright ($250,000 × 30%) 75 185
(W4) Cost of control: Lowe Wright $000 $000 Cost of investment 450 130 Share capital (80%) (320 ) (70%) (140 ) Profit and loss (80%) (72 ) (70%) (42 ) Goodwill/(Negative goodwill) 58 (52 )
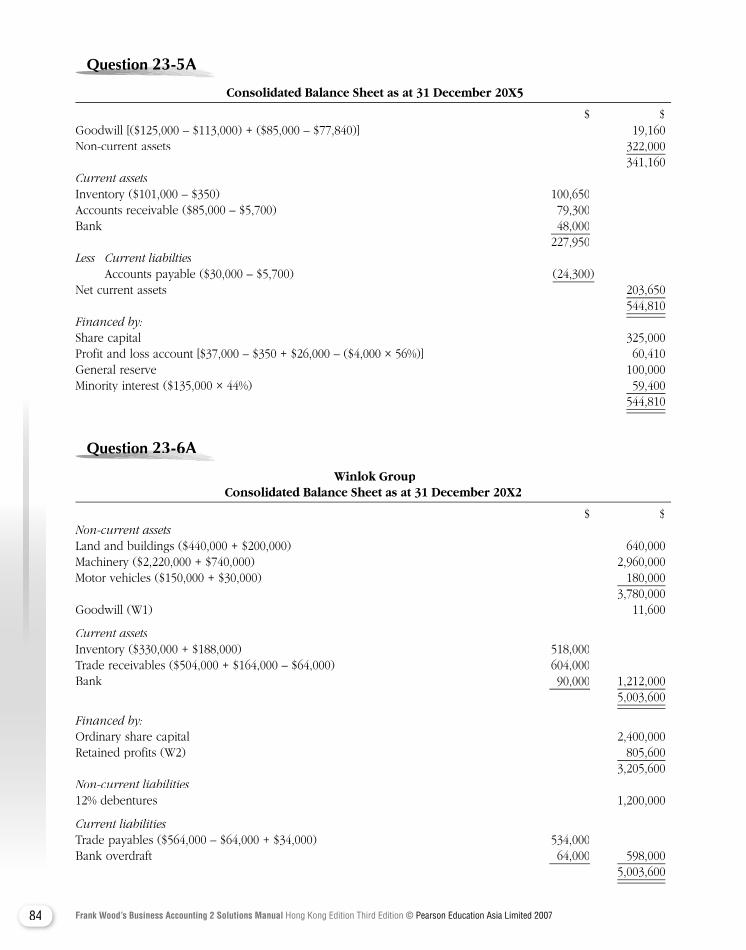
84 Frank Wood’s Business Accounting 2 Solutions Manual Hong Kong Edition Third Edition © Pearson Education Asia Limited 2007
Question Question Question Question Question Question Question 23-5A23-5A23-5A23-5A23-5A23-5A
Consolidated Balance Sheet as at 31 December 20X5
$ $Goodwill [($125,000 – $113,000) + ($85,000 – $77,840)] 19,160Non-current assets 322,000 341,160Current assetsInventory ($101,000 – $350) 100,650Accounts receivable ($85,000 – $5,700) 79,300Bank 48,000 227,950Less Current liabilties Accounts payable ($30,000 – $5,700) (24,300)Net current assets 203,650 544,810Financed by:Share capital 325,000Profit and loss account [$37,000 – $350 + $26,000 – ($4,000 × 56%)] 60,410General reserve 100,000Minority interest ($135,000 × 44%) 59,400 544,810
Question Question Question Question Question Question Question 23-6A23-6A23-6A23-6A23-6A23-6A
Winlok Group Consolidated Balance Sheet as at 31 December 20X2
$ $Non-current assets Non-current assets Non-current assetsLand and buildings ($440,000 + $200,000) 640,000Machinery ($2,220,000 + $740,000) 2,960,000Motor vehicles ($150,000 + $30,000) 180,000 3,780,000Goodwill (W1) 11,600
Current assetsInventory ($330,000 + $188,000) 518,000Trade receivables ($504,000 + $164,000 – $64,000) 604,000Bank 90,000 1,212,000 5,003,600
Financed by:Ordinary share capital 2,400,000Retained profits (W2) 805,600 3,205,600Non-current liabilities12% debentures 1,200,000
Current liabilitiesTrade payables ($564,000 – $64,000 + $34,000) 534,000Bank overdraft 64,000 598,000 5,003,600
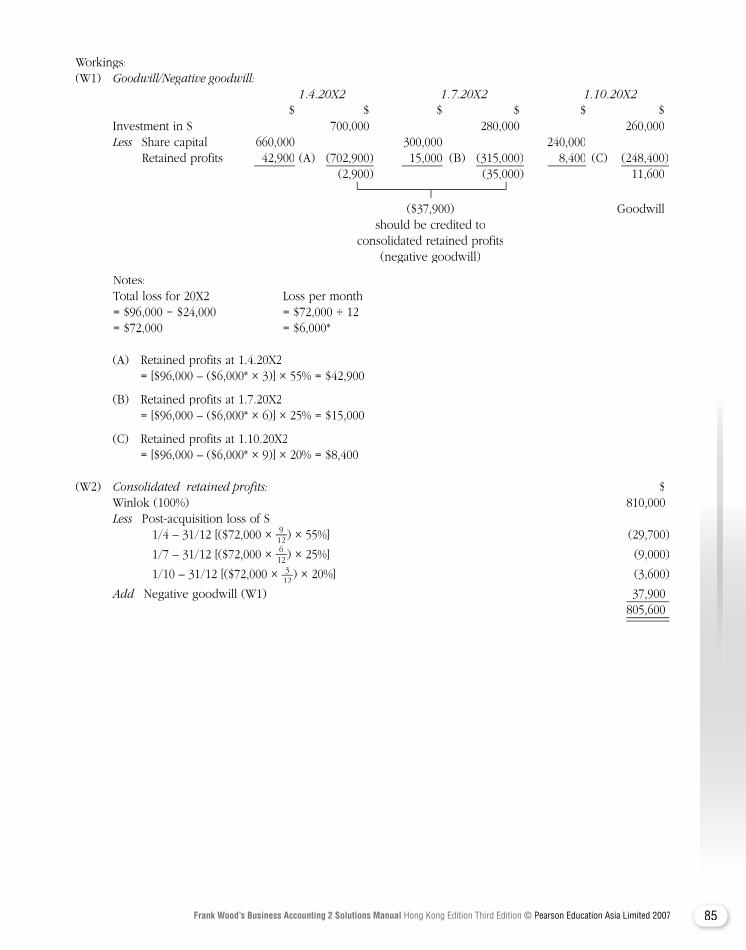
85Frank Wood’s Business Accounting 2 Solutions Manual Hong Kong Edition Third Edition © Pearson Education Asia Limited 2007
Workings:(W1) Goodwill/Negative goodwill: 1.4.20X2 1.7.20X2 1.10.20X2 $ $ $ $ $ $ Investment in S 700,000 280,000 260,000
Less Share capital 660,000 300,000 240,000 Retained profits 42,900 (A) (702,900) 15,000 (B) (315,000) 8,400 (C) (248,400) (2,900) (35,000) 11,600
($37,900) Goodwill should be credited to consolidated retained profits (negative goodwill)
Notes: Total loss for 20X2 Loss per month = $96,000 − $24,000 = $72,000 ÷ 12 = $72,000 = $6,000*
(A) Retained profits at 1.4.20X2 = [$96,000 – ($6,000* × 3)] × 55% = $42,900
(B) Retained profits at 1.7.20X2 = [$96,000 – ($6,000* × 6)] × 25% = $15,000
(C) Retained profits at 1.10.20X2 = [$96,000 – ($6,000* × 9)] × 20% = $8,400
(W2) Consolidated retained profits: $ Winlok (100%) 810,000
Less Post-acquisition loss of S: 1/4 – 31/12 [($72,000 × 9
12 ) × 55%] (29,700)
1/7 – 31/12 [($72,000 × 612 ) × 25%] (9,000)
1/10 – 31/12 [($72,000 × 312
) × 20%] (3,600)
Add Negative goodwill (W1) 37,900 805,600
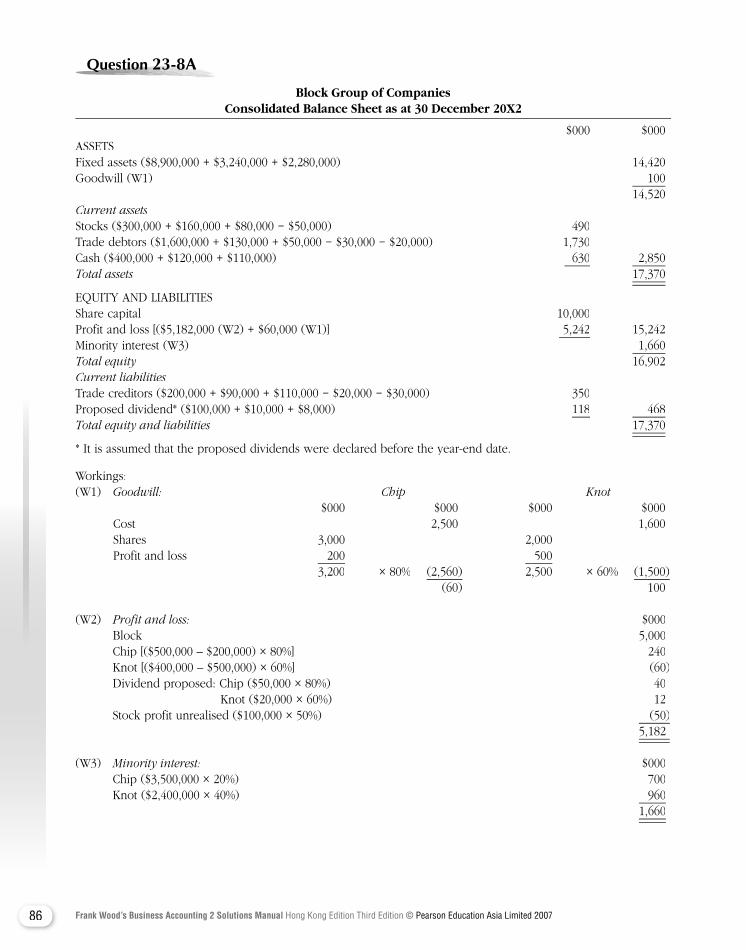
86 Frank Wood’s Business Accounting 2 Solutions Manual Hong Kong Edition Third Edition © Pearson Education Asia Limited 2007
Question Question Question Question Question Question Question 23-8A23-8A23-8A23-8A23-8A23-8A
Block Group of Companies Consolidated Balance Sheet as at 30 December 20X2
$000 $000ASSETS Fixed assets ($8,900,000 + $3,240,000 + $2,280,000) 14,420Goodwill (W1) 100 14,520Current assetsStocks ($300,000 + $160,000 + $80,000 − $50,000) 490Trade debtors ($1,600,000 + $130,000 + $50,000 − $30,000 − $20,000) 1,730Cash ($400,000 + $120,000 + $110,000) 630 2,850Total assets Total assets Total assets 17,370
EQUITY AND LIABILITIESShare capital 10,000Profit and loss [($5,182,000 (W2) + $60,000 (W1)] 5,242 15,242Minority interest (W3) 1,660Total equity Total equity Total equity 16,902Current liabilitiesTrade creditors ($200,000 + $90,000 + $110,000 − $20,000 − $30,000) 350Proposed dividend* ($100,000 + $10,000 + $8,000) 118 468Total equity and liabilities Total equity and liabilities Total equity and liabilities 17,370
* It is assumed that the proposed dividends were declared before the year-end date.
Workings: (W1) Goodwill: Chip Knot $000 $000 $000 $000 Cost 2,500 1,600 Shares 3,000 2,000 Profit and loss 200 500 3,200 × 80% (2,560) 2,500 × 60% (1,500) (60) 100
(W2) Profit and loss: $000 Block 5,000 Chip [($500,000 – $200,000) × 80%] 240 Knot [($400,000 – $500,000) × 60%] (60) Dividend proposed: Chip ($50,000 × 80%) 40 Knot ($20,000 × 60%) 12 Stock profit unrealised ($100,000 × 50%) (50) 5,182
(W3) Minority interest: $000 Chip ($3,500,000 × 20%) 700 Knot ($2,400,000 × 40%) 960 1,660
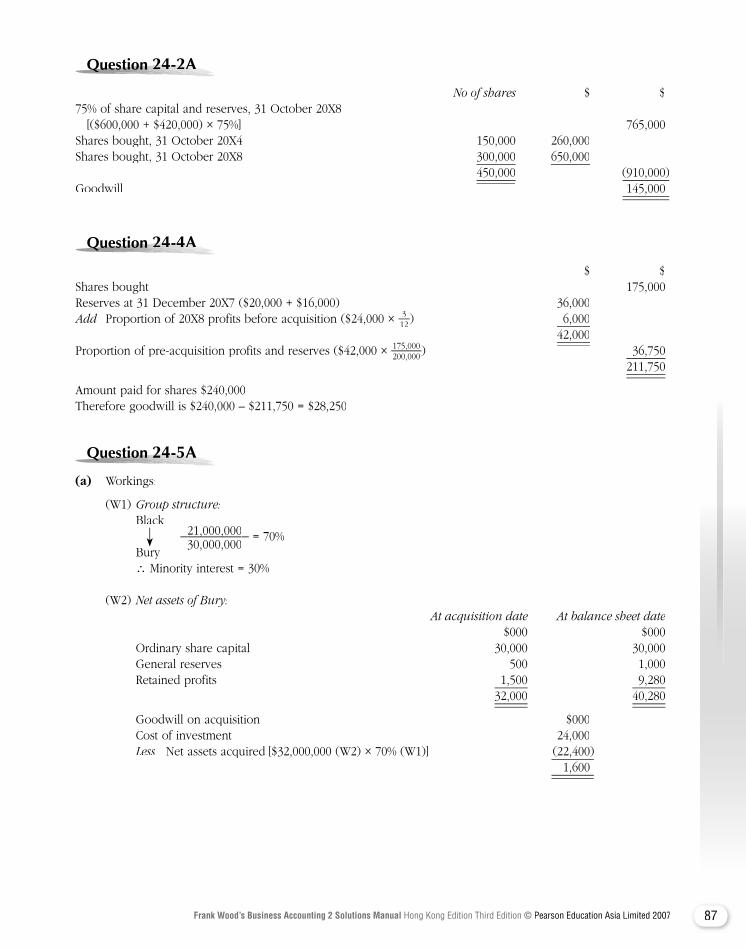
87Frank Wood’s Business Accounting 2 Solutions Manual Hong Kong Edition Third Edition © Pearson Education Asia Limited 2007
Question Question Question Question Question Question Question 24-2A24-2A24-2A24-2A24-2A24-2A24-2A24-2A
No of shares $ $75% of share capital and reserves, 31 October 20X8 [($600,000 + $420,000) × 75%] 765,000Shares bought, 31 October 20X4 150,000 260,000Shares bought, 31 October 20X8 300,000 650,000 450,000 (910,000 )Goodwill Goodwill 145,000
Question Question Question Question Question Question Question 24-4A24-4A24-4A24-4A24-4A24-4A
$ $Shares bought 175,000Reserves at 31 December 20X7 ($20,000 + $16,000) 36,000Add Proportion of 20X8 profits before acquisition ($24,000 × Add Proportion of 20X8 profits before acquisition ($24,000 × Add 3
12 ) 6,000 42,000Proportion of pre-acquisition profits and reserves ($42,000 × 175,000
200,000 ) 36,750) 36,750 211,750
Amount paid for shares $240,000Therefore goodwill is $240,000 – $211,750 = $28,250
Question Question Question Question Question Question Question 24-5A24-5A24-5A24-5A24-5A24-5A
(a) Workings:
(W1) Group structure: Black 21,000,00021,000,000
30,000,000 = 70%
Bury ∴ Minority interest = 30%
(W2) Net assets of Bury: At acquisition date At balance sheet date $000 $000 Ordinary share capital 30,000 30,000 General reserves 500 1,000 Retained profits 1,500 9,280 32,000 40,280
Goodwill on acquisition $000 Cost of investment 24,000 Less Net assets acquired [$32,000,000 (W2) × 70% (W1)] (22,400) 1,600
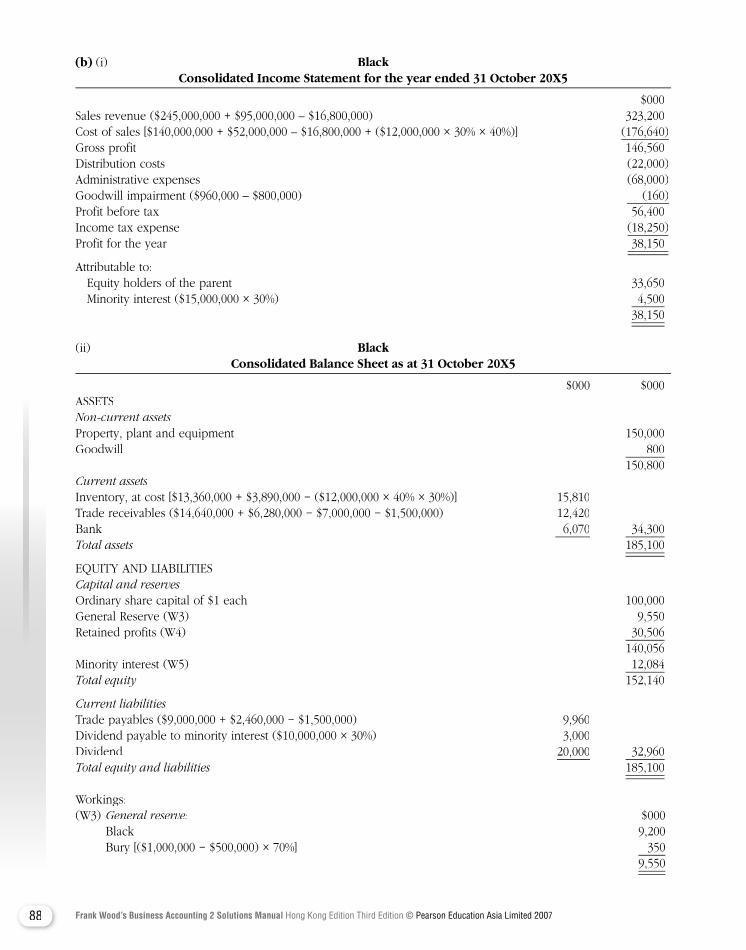
88 Frank Wood’s Business Accounting 2 Solutions Manual Hong Kong Edition Third Edition © Pearson Education Asia Limited 2007
(b) (i) Black Consolidated Income Statement for the year ended 31 October 20X5
$000 Sales revenue ($245,000,000 + $95,000,000 – $16,800,000) 323,200Cost of sales [$140,000,000 + $52,000,000 – $16,800,000 + ($12,000,000 × 30% × 40%)] (176,640)Gross profit 146,560Distribution costs (22,000)Administrative expenses (68,000)Goodwill impairment ($960,000 – $800,000) (160)Profit before tax 56,400Income tax expense (18,250)Profit for the year 38,150
Attributable to: Equity holders of the parent 33,650 Minority interest ($15,000,000 × 30%) 4,500 38,150
(ii) Black Consolidated Balance Sheet as at 31 October 20X5
$000 $000ASSETSNon-current assetsProperty, plant and equipment 150,000Goodwill 800 150,800Current assetsInventory, at cost [$13,360,000 + $3,890,000 − ($12,000,000 × 40% × 30%)] 15,810Trade receivables ($14,640,000 + $6,280,000 − $7,000,000 − $1,500,000) 12,420Bank 6,070 34,300Total assets 185,100
EQUITY AND LIABILITIESCapital and reservesOrdinary share capital of $1 each 100,000General Reserve (W3) 9,550Retained profits (W4) 30,506 140,056Minority interest (W5) 12,084Total equity 152,140
Current liabilitiesTrade payables ($9,000,000 + $2,460,000 − $1,500,000) 9,960Dividend payable to minority interest ($10,000,000 × 30%) 3,000Dividend 20,000 32,960Total equity and liabilities 185,100
Workings:(W3) General reserve: $000 Black 9,200 Bury [($1,000,000 − $500,000) × 70%] 350 9,550
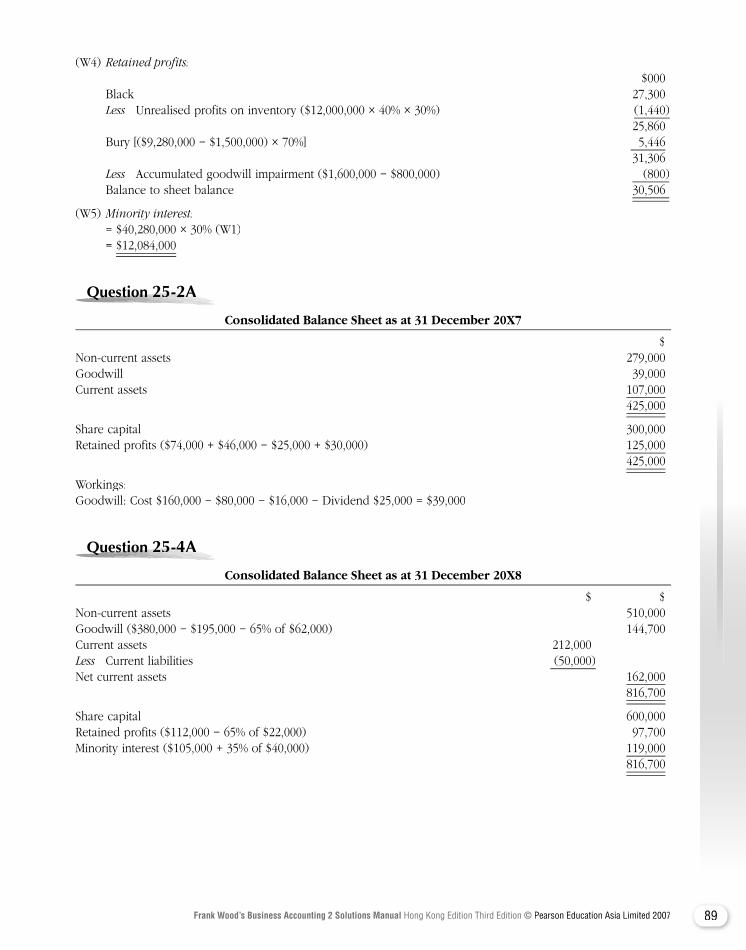
89Frank Wood’s Business Accounting 2 Solutions Manual Hong Kong Edition Third Edition © Pearson Education Asia Limited 2007
(W4) Retained profits: $000 Black 27,300
Less Unrealised profits on inventory ($12,000,000 × 40% × 30%) (1,440) 25,860 Bury [($9,280,000 − $1,500,000) × 70%] 5,446 31,306
Less Accumulated goodwill impairment ($1,600,000 − $800,000) (800) Balance to sheet balance 30,506
(W5) Minority interest: = $40,280,000 × 30% (W1) = $12,084,000
Question Question Question Question Question Question Question 25-2A25-2A25-2A25-2A25-2A25-2A
Consolidated Balance Sheet as at 31 December 20X7
$Non-current assets 279,000Goodwill 39,000Current assets 107,000
425,000
Share capital 300,000Retained profits ($74,000 + $46,000 − $25,000 + $30,000) 125,000
425,000
Workings:Goodwill: Cost $160,000 − $80,000 − $16,000 − Dividend $25,000 = $39,000
Question Question Question Question Question Question Question 25-4A25-4A25-4A25-4A25-4A25-4A
Consolidated Balance Sheet as at 31 December 20X8
$ $Non-current assets 510,000Goodwill ($380,000 − $195,000 − 65% of $62,000) 144,700Current assets 212,000Less Current liabilities (50,000)Net current assets 162,000 816,700
Share capital 600,000Retained profits ($112,000 − 65% of $22,000) 97,700Minority interest ($105,000 + 35% of $40,000) 119,000 816,700
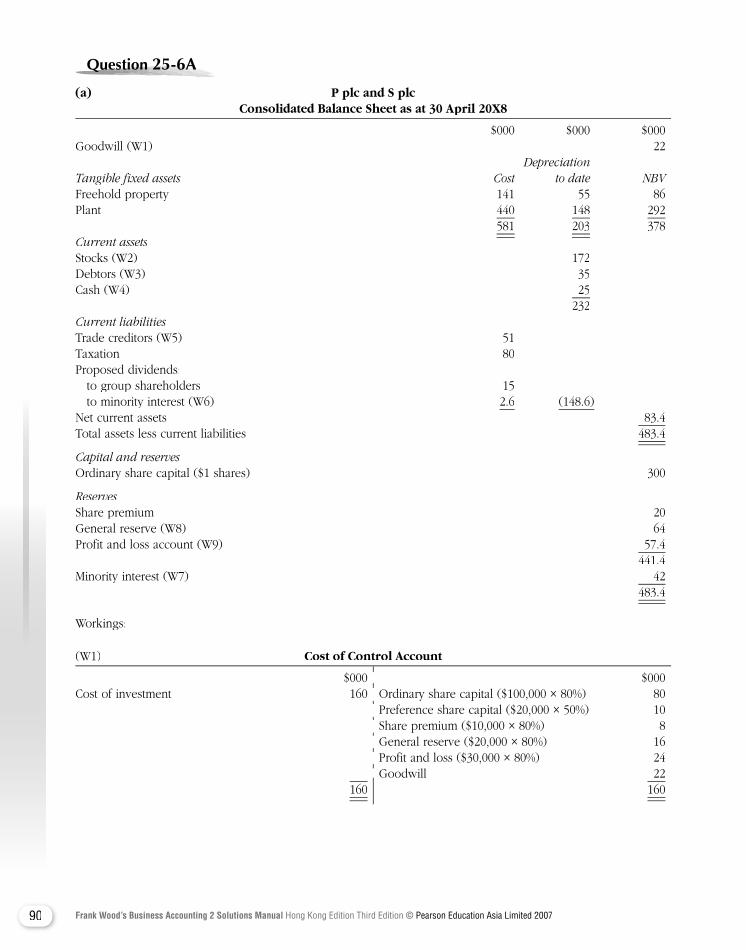
90 Frank Wood’s Business Accounting 2 Solutions Manual Hong Kong Edition Third Edition © Pearson Education Asia Limited 2007
Question Question Question Question Question Question Question 25-6A25-6A25-6A25-6A25-6A25-6A
(a) P plc and S plc Consolidated Balance Sheet as at 30 April 20X8
$000 $000 $000Goodwill (W1) 22 DepreciationTangible fixed assets Cost to date NBVFreehold property 141 55 86Plant 440 148 292 581 203 378Current assetsStocks (W2) 172Debtors (W3) 35Cash (W4) 25 232Current liabilitiesTrade creditors (W5) 51Taxation 80Proposed dividends: to group shareholders 15 to minority interest (W6) 2.6 (148.6 )Net current assets 83.4Total assets less current liabilities 483.4
Capital and reservesOrdinary share capital ($1 shares) 300
ReservesShare premium 20General reserve (W8) 64Profit and loss account (W9) 57.4 441.4Minority interest (W7) 42 483.4
Workings:
(W1) Cost of Control Account
$000 $000Cost of investment 160 Ordinary share capital ($100,000 × 80%) 80 Preference share capital ($20,000 × 50%) 10 Share premium ($10,000 × 80%) 8 General reserve ($20,000 × 80%) 16 Profit and loss ($30,000 × 80%) 24 Goodwill 22
160 160
$000 $000Cost of investment 160 Ordinary share capital ($100,000 × 80%) 80 Preference share capital ($20,000 × 50%) 10 Share premium ($10,000 × 80%) 8 General reserve ($20,000 × 80%) 16 Profit and loss ($30,000 × 80%) 24 Goodwill 22
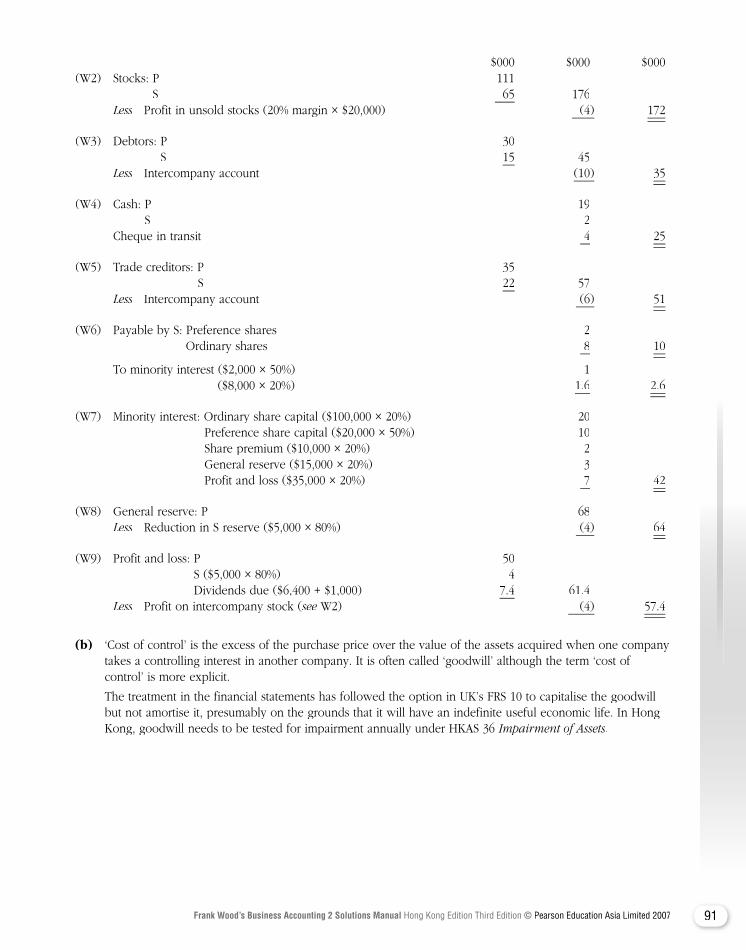
91Frank Wood’s Business Accounting 2 Solutions Manual Hong Kong Edition Third Edition © Pearson Education Asia Limited 2007
$000 $000 $000(W2) Stocks: P 111 S 65 176
Less Profit in unsold stocks (20% margin × $20,000) Less Profit in unsold stocks (20% margin × $20,000) Less (4 ) 172
(W3) Debtors: P 30 S 15 45
Less Intercompany account Less Intercompany account Less (10 ) 35
(W4) Cash: P 19 S 2 Cheque in transit 4 25
(W5) Trade creditors: P 35 S 22 57
Less Intercompany account Less Intercompany account Less (6 ) 51
(W6) Payable by S: Preference shares 2 Ordinary shares 8 10
To minority interest ($2,000 × 50%) 1 ($8,000 × 20%) 1.6 2.6
(W7) Minority interest: Ordinary share capital ($100,000 × 20%) 20 Preference share capital ($20,000 × 50%) 10 Share premium ($10,000 × 20%) 2 General reserve ($15,000 × 20%) 3 Profit and loss ($35,000 × 20%) 7 42
(W8) General reserve: P 68Less Reduction in S reserve ($5,000 × 80%) Less Reduction in S reserve ($5,000 × 80%) Less (4 ) 64
(W9) Profit and loss: P 50 S ($5,000 × 80%) 4 Dividends due ($6,400 + $1,000) 7.4 61.4
Less Profit on intercompany stock (Less Profit on intercompany stock (Less see W2) see W2) see (4 ) 57.4
(b) ‘Cost of control’ is the excess of the purchase price over the value of the assets acquired when one company takes a controlling interest in another company. It is often called ‘goodwill’ although the term ‘cost of control’ is more explicit.
The treatment in the financial statements has followed the option in UK’s FRS 10 to capitalise the goodwill but not amortise it, presumably on the grounds that it will have an indefinite useful economic life. In Hong Kong, goodwill needs to be tested for impairment annually under HKAS 36 Impairment of Assets.
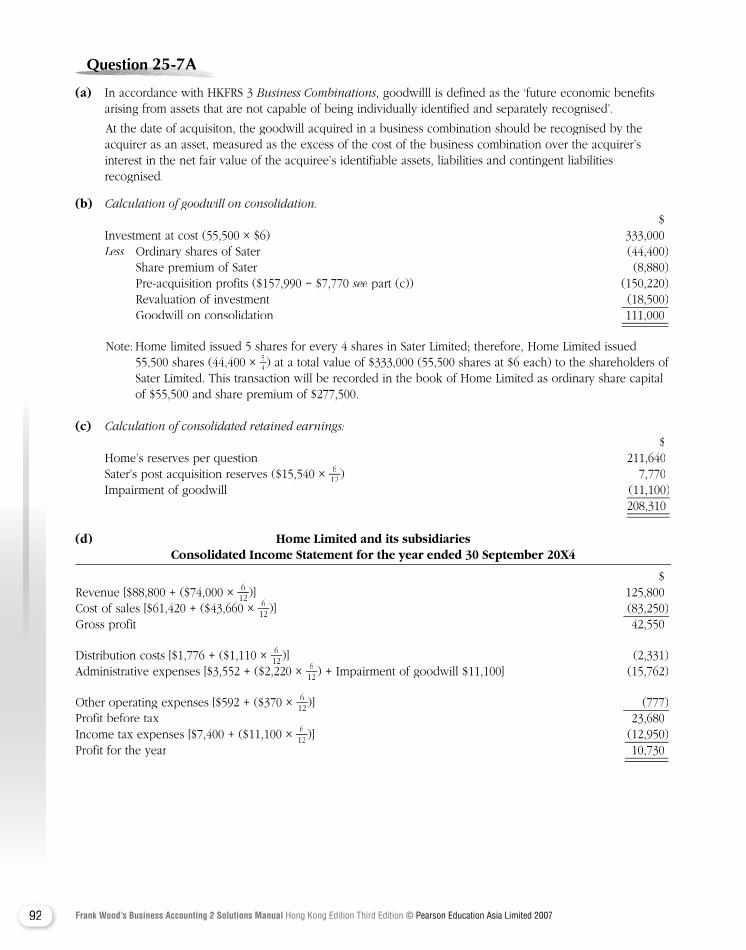
92 Frank Wood’s Business Accounting 2 Solutions Manual Hong Kong Edition Third Edition © Pearson Education Asia Limited 2007
Question Question Question Question Question Question Question 25-7A25-7A25-7A25-7A25-7A25-7A
(a) In accordance with HKFRS 3 Business Combinations, goodwilll is defined as the ‘future economic benefits arising from assets that are not capable of being individually identified and separately recognised’.
At the date of acquisiton, the goodwill acquired in a business combination should be recognised by the acquirer as an asset, measured as the excess of the cost of the business combination over the acquirer’s interest in the net fair value of the acquiree’s identifiable assets, liabilities and contingent liabilities recognised.
(b) Calculation of goodwill on consolidation: $
Investment at cost (55,500 × $6) 333,000Less Ordinary shares of Sater (44,400)
Share premium of Sater (8,880) Pre-acquisition profits ($157,990 − $7,770 see part (c)) (150,220)see part (c)) (150,220)see Revaluation of investment (18,500) Goodwill on consolidation 111,000
Note: Home limited issued 5 shares for every 4 shares in Sater Limited; therefore, Home Limited issued 55,500 shares (44,400 × 5
4 ) at a total value of $333,000 (55,500 shares at $6 each) to the shareholders of Sater Limited. This transaction will be recorded in the book of Home Limited as ordinary share capital of $55,500 and share premium of $277,500.
(c) Calculation of consolidated retained earnings: $ Home’s reserves per question 211,640 Sater’s post acquisition reserves ($15,540 × 6 Home’s reserves per question 211,640
6 Home’s reserves per question 211,640
12 ) 7,770 Impairment of goodwill (11,100) 208,310
(d) Home Limited and its subsidiaries Consolidated Income Statement for the year ended 30 September 20X4
$Revenue [$88,800 + ($74,000 × 6
12 )] 125,800Cost of sales [$61,420 + ($43,660 × 6
12 )] (83,250)Gross profit 42,550
Distribution costs [$1,776 + ($1,110 × 612 )] (2,331)
Administrative expenses [$3,552 + ($2,220 × 612 ) + Impairment of goodwill $11,100] (15,762)
Other operating expenses [$592 + ($370 × 612 )] (777)
Profit before tax 23,680Income tax expenses [$7,400 + ($11,100 × 6
12 )] (12,950)Profit for the year 10,730
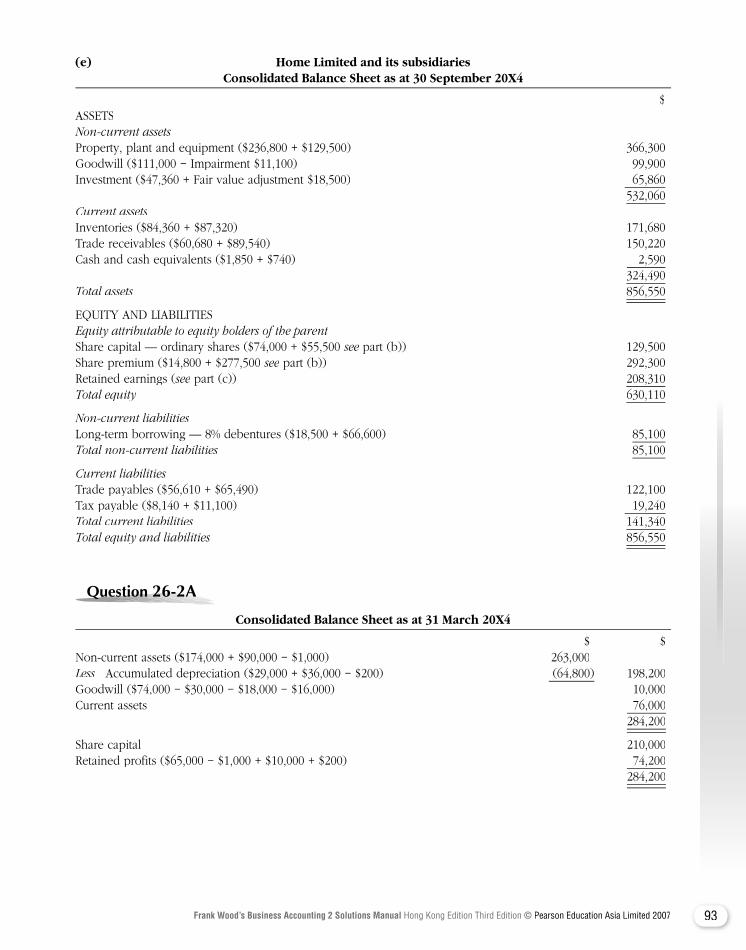
93Frank Wood’s Business Accounting 2 Solutions Manual Hong Kong Edition Third Edition © Pearson Education Asia Limited 2007
(e) Home Limited and its subsidiaries Consolidated Balance Sheet as at 30 September 20X4
$ASSETSNon-current assetsProperty, plant and equipment ($236,800 + $129,500) 366,300Goodwill ($111,000 − Impairment $11,100) 99,900Investment ($47,360 + Fair value adjustment $18,500) 65,860
532,060Current assetsInventories ($84,360 + $87,320) 171,680Trade receivables ($60,680 + $89,540) 150,220Cash and cash equivalents ($1,850 + $740) 2,590 324,490Total assets 856,550
EQUITY AND LIABILITIESEquity attributable to equity holders of the parentShare capital — ordinary shares ($74,000 + $55,500 see part (b)) 129,500see part (b)) 129,500seeShare premium ($14,800 + $277,500 see part (b)) 292,300see part (b)) 292,300seeRetained earnings (see part (c)) see part (c)) see 208,310Total equity 630,110
Non-current liabilitiesLong-term borrowing — 8% debentures ($18,500 + $66,600) 85,100Total non-current liabilities 85,100
Current liabilitiesTrade payables ($56,610 + $65,490) 122,100Tax payable ($8,140 + $11,100) 19,240Total current liabilities 141,340Total current liabilities 141,340Total current liabilitiesTotal equity and liabilities 856,550
Question Question Question Question Question Question Question 26-2A26-2A26-2A26-2A26-2A26-2A
Consolidated Balance Sheet as at 31 March 20X4
$ $Non-current assets ($174,000 + $90,000 − $1,000) 263,000Less Accumulated depreciation ($29,000 + $36,000 − $200) Less Accumulated depreciation ($29,000 + $36,000 − $200) Less (64,800) 198,200Goodwill ($74,000 − $30,000 − $18,000 − $16,000) 10,000Current assets 76,000 284,200
Share capital 210,000Retained profits ($65,000 − $1,000 + $10,000 + $200) 74,200 284,200
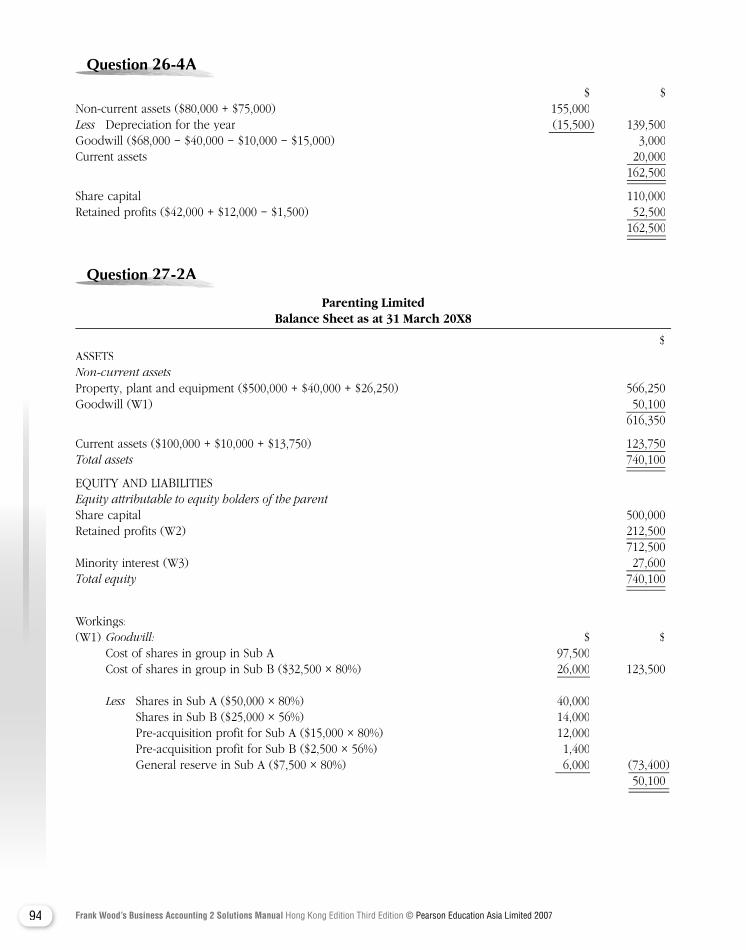
94 Frank Wood’s Business Accounting 2 Solutions Manual Hong Kong Edition Third Edition © Pearson Education Asia Limited 2007
Question Question Question Question Question Question Question 26-4A26-4A26-4A26-4A26-4A26-4A
$ $Non-current assets ($80,000 + $75,000) 155,000Less Depreciation for the year (15,500) 139,500Goodwill ($68,000 − $40,000 − $10,000 − $15,000) 3,000Current assets 20,000 162,500
Share capital 110,000Retained profits ($42,000 + $12,000 − $1,500) 52,500 162,500
Question Question Question Question Question Question Question 27-2A27-2A27-2A27-2A27-2A27-2A
Parenting Limited Balance Sheet as at 31 March 20X8
$ASSETSNon-current assetsProperty, plant and equipment ($500,000 + $40,000 + $26,250) 566,250Goodwill (W1) 50,100 616,350
Current assets ($100,000 + $10,000 + $13,750) 123,750Total assets Total assets Total assets 740,100
EQUITY AND LIABILITIESEquity attributable to equity holders of the parentShare capital 500,000Retained profits (W2) 212,500 712,500Minority interest (W3) 27,600Total equity Total equity Total equity 740,100
Workings:(W1) Goodwill: $ $ Cost of shares in group in Sub A 97,500 Cost of shares in group in Sub B ($32,500 × 80%) 26,000 123,500
Less Shares in Sub A ($50,000 × 80%) 40,000Less Shares in Sub A ($50,000 × 80%) 40,000Less Shares in Sub B ($25,000 × 56%) 14,000 Pre-acquisition profit for Sub A ($15,000 × 80%) 12,000 Pre-acquisition profit for Sub B ($2,500 × 56%) 1,400 General reserve in Sub A ($7,500 × 80%) 6,000 (73,400 ) 50,100
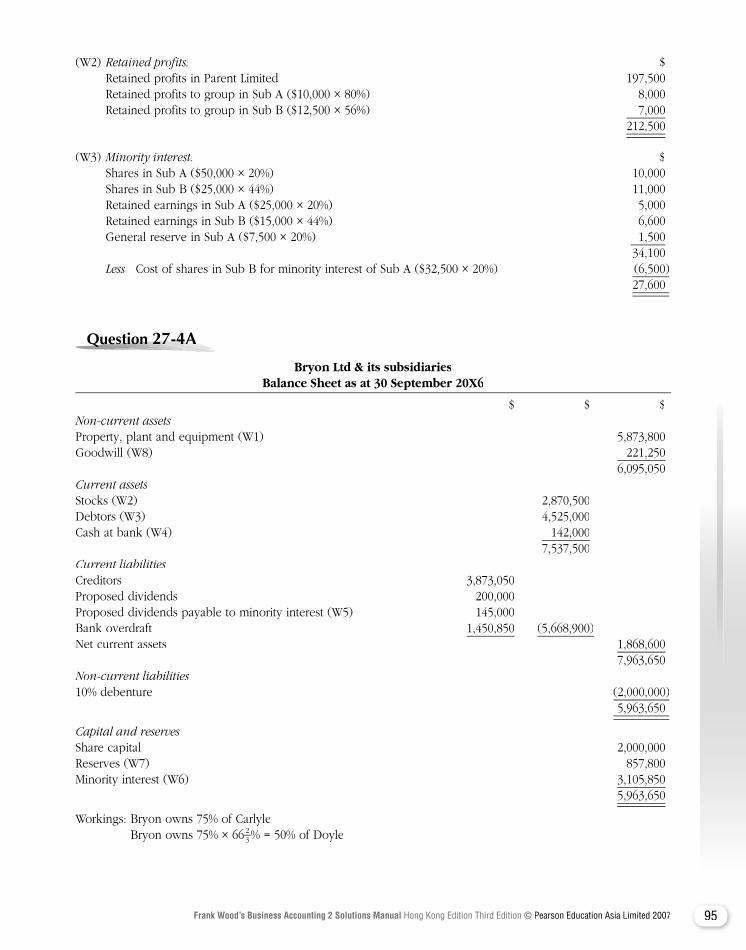
95Frank Wood’s Business Accounting 2 Solutions Manual Hong Kong Edition Third Edition © Pearson Education Asia Limited 2007
(W2) Retained profits: $ Retained profits in Parent Limited 197,500 Retained profits to group in Sub A ($10,000 × 80%) 8,000 Retained profits to group in Sub B ($12,500 × 56%) 7,000 212,500
(W3) Minority interest: $ Shares in Sub A ($50,000 × 20%) 10,000 Shares in Sub B ($25,000 × 44%) 11,000 Retained earnings in Sub A ($25,000 × 20%) 5,000 Retained earnings in Sub B ($15,000 × 44%) 6,600 General reserve in Sub A ($7,500 × 20%) 1,500 34,100
Less Cost of shares in Sub B for minority interest of Sub A ($32,500 × 20%) (6,500 ) 27,600
Question Question Question Question Question Question Question 27-4A27-4A27-4A27-4A27-4A27-4A
Bryon Ltd & its subsidiaries Balance Sheet as at 30 September 20X6
$ $ $Non-current assetsProperty, plant and equipment (W1) 5,873,800Goodwill (W8) 221,250 6,095,050Current assetsStocks (W2) 2,870,500Debtors (W3) 4,525,000Cash at bank (W4) 142,000 7,537,500Current liabilitiesCreditors 3,873,050Proposed dividends 200,000Proposed dividends payable to minority interest (W5) 145,000Bank overdraft 1,450,850 (5,668,900)Net current assets 1,868,600 7,963,650Non-current liabilities10% debenture (2,000,000) 5,963,650
Capital and reservesShare capital 2,000,000Reserves (W7) 857,800Minority interest (W6) 3,105,850 5,963,650
Workings: Bryon owns 75% of Carlyle Bryon owns 75% × 66 2
3% = 50% of Doyle
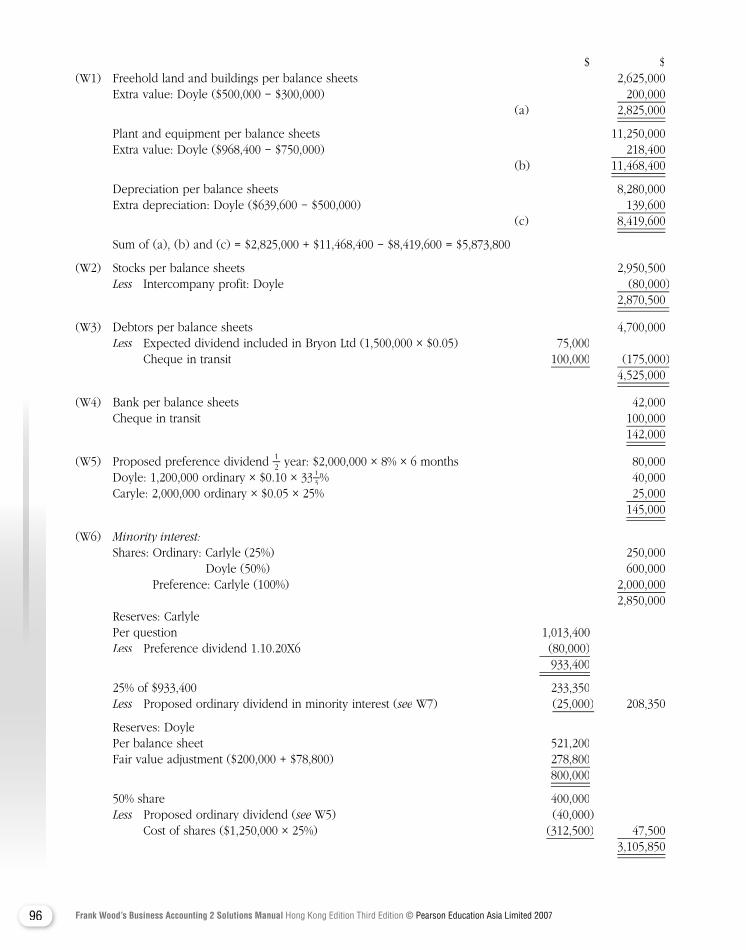
96 Frank Wood’s Business Accounting 2 Solutions Manual Hong Kong Edition Third Edition © Pearson Education Asia Limited 2007
$ $(W1) Freehold land and buildings per balance sheets 2,625,000 Extra value: Doyle ($500,000 − $300,000) 200,000 (a) 2,825,000
Plant and equipment per balance sheets 11,250,000 Extra value: Doyle ($968,400 − $750,000) 218,400 (b) 11,468,400
Depreciation per balance sheets 8,280,000 Extra depreciation: Doyle ($639,600 − $500,000) 139,600 (c) 8,419,600
Sum of (a), (b) and (c) = $2,825,000 + $11,468,400 − $8,419,600 = $5,873,800
(W2) Stocks per balance sheets 2,950,500Less Intercompany profit: Doyle (80,000)Less Intercompany profit: Doyle (80,000)Less
2,870,500
(W3) Debtors per balance sheets 4,700,000Less Expected dividend included in Bryon Ltd (1,500,000 × $0.05) 75,000Less Expected dividend included in Bryon Ltd (1,500,000 × $0.05) 75,000Less
Cheque in transit 100,000 (175,000) 4,525,000
(W4) Bank per balance sheets 42,000 Cheque in transit 100,000 142,000
(W5) Proposed preference dividend 12 year: $2,000,000 × 8% × 6 months 80,000
Doyle: 1,200,000 ordinary × $0.10 × 33 13% 40,000
Caryle: 2,000,000 ordinary × $0.05 × 25% 25,000 145,000
(W6) Minority interest: Shares: Ordinary: Carlyle (25%) 250,000 Doyle (50%) 600,000 Preference: Carlyle (100%) 2,000,000 2,850,000 Reserves: Carlyle Per question 1,013,400
Less Preference dividend 1.10.20X6 (80,000)Less Preference dividend 1.10.20X6 (80,000)Less 933,400
25% of $933,400 233,350Less Proposed ordinary dividend in minority interest (Less Proposed ordinary dividend in minority interest (Less see W7) see W7) see (25,000) 208,350
Reserves: DoylePer balance sheet 521,200
Fair value adjustment ($200,000 + $78,800) 278,800 800,000
50% share 400,000Less Proposed ordinary dividend (Less Proposed ordinary dividend (Less see W5) (40,000) see W5) (40,000) see
Cost of shares ($1,250,000 × 25%) (312,500) 47,500 3,105,850
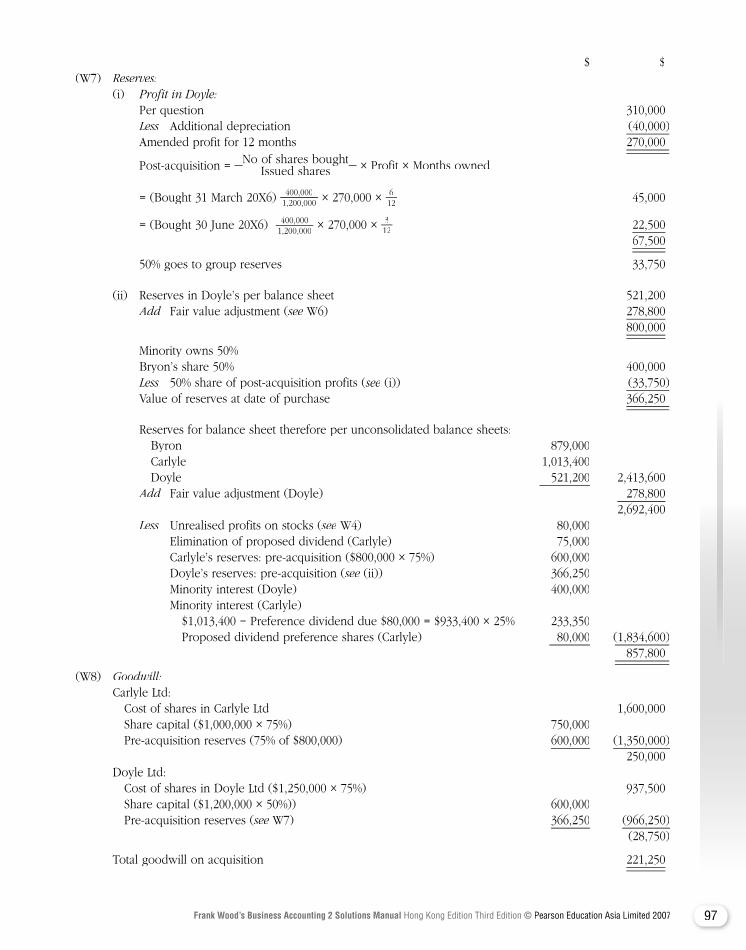
97Frank Wood’s Business Accounting 2 Solutions Manual Hong Kong Edition Third Edition © Pearson Education Asia Limited 2007
$ $(W7) Reserves: (i) Profit in Doyle: Per question 310,000 Less Additional depreciation (40,000) Amended profit for 12 months 270,000
Post-acquisition = No of shares boughtNo of shares boughtIssued shares
No of shares boughtIssued shares
No of shares bought × Profit × Months owned
= (Bought 31 March 20X6) 400,0001,200,000 × 270,000 × 6
12 45,000
= (Bought 30 June 20X6) 400,0001,200,000 × 270,000 × 3
12 22,500 67,500
50% goes to group reserves 33,750
(ii) Reserves in Doyle’s per balance sheet 521,200 Add Fair value adjustment (see W6) 278,800see W6) 278,800see 800,000
Minority owns 50% Bryon’s share 50% 400,000 Less 50% share of post-acquisition profits (Less 50% share of post-acquisition profits (Less see (i)) (33,750 )see (i)) (33,750 )see Value of reserves at date of purchase 366,250
Reserves for balance sheet therefore per unconsolidated balance sheets: Byron 879,000 Carlyle 1,013,400 Doyle 521,200 2,413,600 Add Fair value adjustment (Doyle) 278,800 2,692,400 Less Unrealised profits on stocks (see W4) 80,000see W4) 80,000see Elimination of proposed dividend (Carlyle) 75,000 Carlyle’s reserves: pre-acquisition ($800,000 × 75%) 600,000 Doyle’s reserves: pre-acquisition (see (ii)) 366,250see (ii)) 366,250see Minority interest (Doyle) 400,000 Minority interest (Carlyle) $1,013,400 − Preference dividend due $80,000 = $933,400 × 25% 233,350 Proposed dividend preference shares (Carlyle) 80,000 (1,834,600) 857,800
(W8) Goodwill: Carlyle Ltd: Cost of shares in Carlyle Ltd 1,600,000 Share capital ($1,000,000 × 75%) 750,000 Pre-acquisition reserves (75% of $800,000) 600,000 (1,350,000) 250,000 Doyle Ltd: Cost of shares in Doyle Ltd ($1,250,000 × 75%) 937,500 Share capital ($1,200,000 × 50%)) 600,000 Pre-acquisition reserves (see W7) see W7) see 366,250 (966,250) (28,750)
Total goodwill on acquisition 221,250
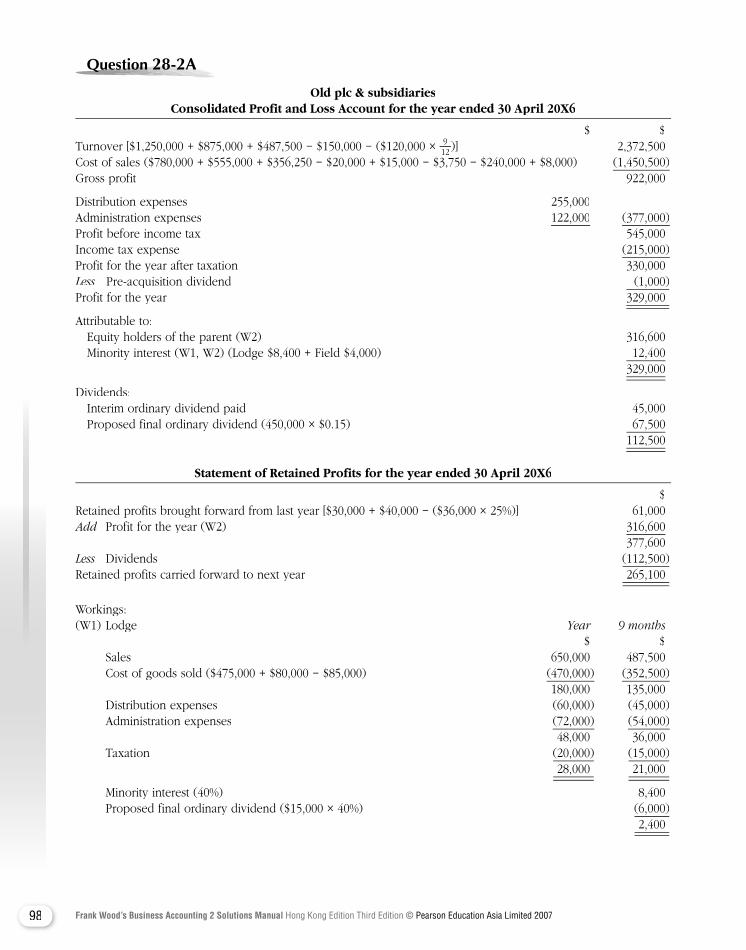
98 Frank Wood’s Business Accounting 2 Solutions Manual Hong Kong Edition Third Edition © Pearson Education Asia Limited 2007
Question Question Question Question Question Question Question 28-2A28-2A28-2A28-2A28-2A28-2A
Old plc & subsidiaries Consolidated Profit and Loss Account for the year ended 30 April 20X6
$ $Turnover [$1,250,000 + $875,000 + $487,500 − $150,000 − ($120,000 × 9
12 )] 2,372,500Cost of sales ($780,000 + $555,000 + $356,250 − $20,000 + $15,000 − $3,750 − $240,000 + $8,000) (1,450,500)Gross profit 922,000
Distribution expenses 255,000Administration expenses 122,000 (377,000)Profit before income tax 545,000Income tax expense (215,000)Profit for the year after taxation 330,000Less Pre-acquisition dividend (1,000)Less Pre-acquisition dividend (1,000)LessProfit for the year 329,000
Attributable to: Equity holders of the parent (W2) 316,600 Minority interest (W1, W2) (Lodge $8,400 + Field $4,000) 12,400 329,000
Dividends: Interim ordinary dividend paid 45,000 Proposed final ordinary dividend (450,000 × $0.15) 67,500 112,500
Statement of Retained Profits for the year ended 30 April 20X6
$Retained profits brought forward from last year [$30,000 + $40,000 − ($36,000 × 25%)] 61,000Add Profit for the year (W2) Add Profit for the year (W2) Add 316,600 377,600Less Dividends (112,500)Retained profits carried forward to next year 265,100
Workings: (W1) Lodge Year 9 months $ $ Sales 650,000 487,500 Cost of goods sold ($475,000 + $80,000 − $85,000) (470,000) (352,500) 180,000 135,000 Distribution expenses (60,000) (45,000) Administration expenses (72,000) (54,000) 48,000 36,000 Taxation (20,000) (15,000) 28,000 21,000
Minority interest (40%) 8,400 Proposed final ordinary dividend ($15,000 × 40%) (6,000) 2,400
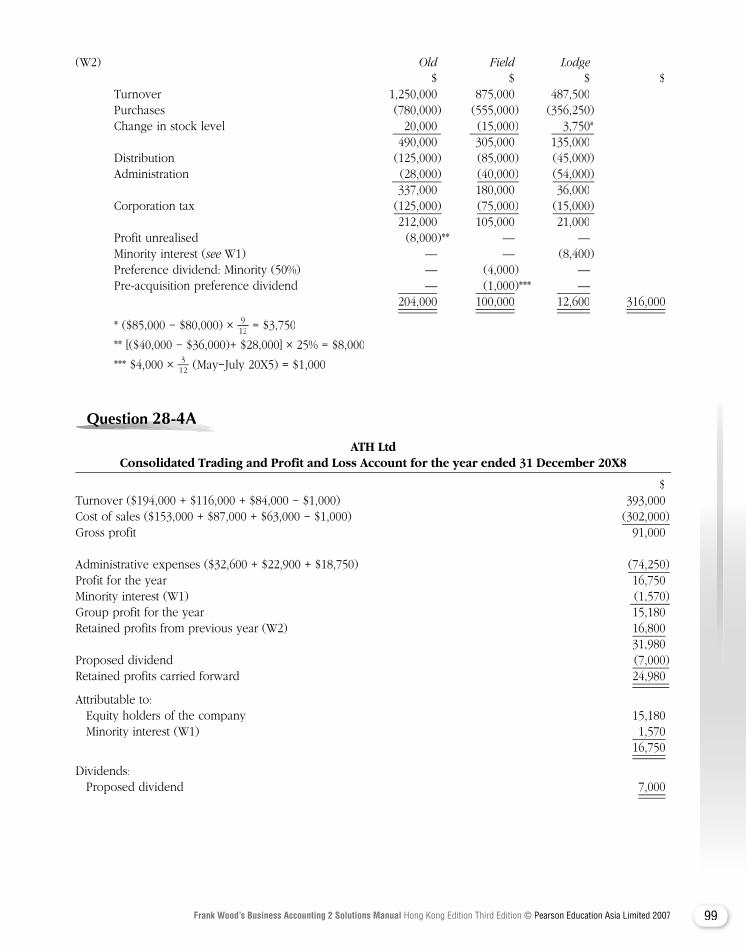
99Frank Wood’s Business Accounting 2 Solutions Manual Hong Kong Edition Third Edition © Pearson Education Asia Limited 2007
(W2) Old Field Lodge $ $ $ $ Turnover 1,250,000 875,000 487,500 Purchases (780,000) (555,000) (356,250) Change in stock level 20,000 (15,000) 3,750* 490,000 305,000 135,000 Distribution (125,000) (85,000) (45,000) Administration (28,000) (40,000) (54,000) 337,000 180,000 36,000 Corporation tax (125,000) (75,000) (15,000) 212,000 105,000 21,000 Profit unrealised (8,000)** — — Minority interest (see W1) — — (8,400)see W1) — — (8,400)see Preference dividend: Minority (50%) — (4,000) — Pre-acquisition preference dividend — (1,000)*** — 204,000 100,000 12,600 316,000
* ($85,000 − $80,000) × 912 = $3,750
** [($40,000 − $36,000)+ $28,000] × 25% = $8,000
*** $4,000 × 312 (May−July 20X5) = $1,000
Question Question Question Question Question Question Question 28-4A28-4A28-4A28-4A28-4A28-4A
ATH Ltd Consolidated Trading and Profit and Loss Account for the year ended 31 December 20X8
$Turnover ($194,000 + $116,000 + $84,000 − $1,000) 393,000Cost of sales ($153,000 + $87,000 + $63,000 − $1,000) (302,000)Gross profit 91,000
Administrative expenses ($32,600 + $22,900 + $18,750) (74,250)Profit for the year 16,750Minority interest (W1) (1,570)Group profit for the year 15,180Retained profits from previous year (W2) 16,800 31,980Proposed dividend (7,000)Retained profits carried forward 24,980
Attributable to: Equity holders of the company 15,180 Minority interest (W1) 1,570 16,750
Dividends: Proposed dividend 7,000
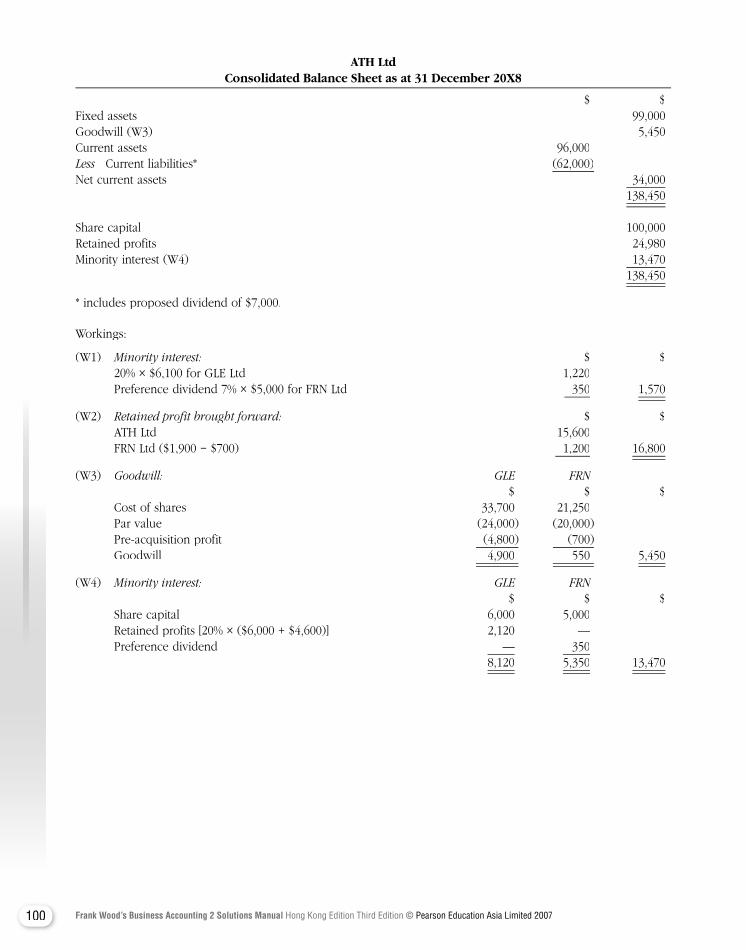
100 Frank Wood’s Business Accounting 2 Solutions Manual Hong Kong Edition Third Edition © Pearson Education Asia Limited 2007
ATH Ltd Consolidated Balance Sheet as at 31 December 20X8
$ $Fixed assets 99,000Goodwill (W3) 5,450Current assets 96,000Less Current liabilities* (62,000)Net current assets 34,000 138,450 Share capital 100,000Retained profits 24,980Minority interest (W4) 13,470 138,450
* includes proposed dividend of $7,000.
Workings:
(W1) Minority interest: $ $ 20% × $6,100 for GLE Ltd 1,220 Preference dividend 7% × $5,000 for FRN Ltd 350 1,570
(W2) Retained profit brought forward: $ $ ATH Ltd 15,600 FRN Ltd ($1,900 − $700) 1,200 16,800
(W3) Goodwill: GLE FRN $ $ $ Cost of shares 33,700 21,250 Par value (24,000) (20,000) Pre-acquisition profit (4,800) (700) Goodwill 4,900 550 5,450
(W4) Minority interest: GLE FRN GLE FRN GLE FRN $ $ $ Share capital 6,000 5,000 Retained profits [20% × ($6,000 + $4,600)] 2,120 — Preference dividend — 350 8,120 5,350 13,470
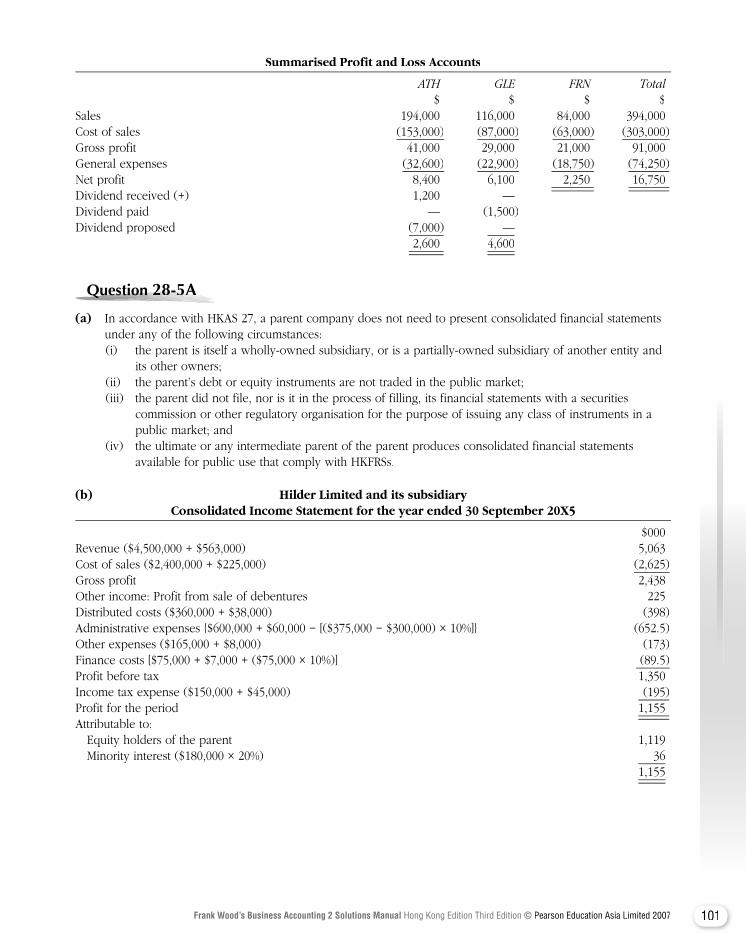
101Frank Wood’s Business Accounting 2 Solutions Manual Hong Kong Edition Third Edition © Pearson Education Asia Limited 2007
Summarised Profit and Loss Accounts
ATH GLE FRN Total $ $ $ $Sales 194,000 116,000 84,000 394,000Cost of sales (153,000) (87,000) (63,000) (303,000)Gross profit 41,000 29,000 21,000 91,000General expenses (32,600) (22,900) (18,750) (74,250)Net profit 8,400 6,100 2,250 16,750 Dividend received (+) 1,200 —Dividend paid — (1,500)Dividend proposed (7,000) — 2,600 4,600
Question Question Question Question Question Question Question 28-5A28-5A28-5A28-5A28-5A28-5A
(a) In accordance with HKAS 27, a parent company does not need to present consolidated financial statements under any of the following circumstances:
(i) the parent is itself a wholly-owned subsidiary, or is a partially-owned subsidiary of another entity and its other owners;
(ii) the parent’s debt or equity instruments are not traded in the public market; (iii) the parent did not file, nor is it in the process of filling, its financial statements with a securities
commission or other regulatory organisation for the purpose of issuing any class of instruments in a public market; and
(iv) the ultimate or any intermediate parent of the parent produces consolidated financial statements available for public use that comply with HKFRSs.
(b) Hilder Limited and its subsidiary Consolidated Income Statement for the year ended 30 September 20X5
$000Revenue ($4,500,000 + $563,000) 5,063Cost of sales ($2,400,000 + $225,000) (2,625 )Gross profit 2,438Other income: Profit from sale of debentures 225Distributed costs ($360,000 + $38,000) (398 )Administrative expenses {$600,000 + $60,000 − [($375,000 − $300,000) × 10%]} (652.5 )Other expenses ($165,000 + $8,000) (173 )Finance costs [$75,000 + $7,000 + ($75,000 × 10%)] (89.5 )Profit before tax 1,350Income tax expense ($150,000 + $45,000) (195 )Profit for the period 1,155 Attributable to: Equity holders of the parent 1,119 Minority interest ($180,000 × 20%) 36 1,155
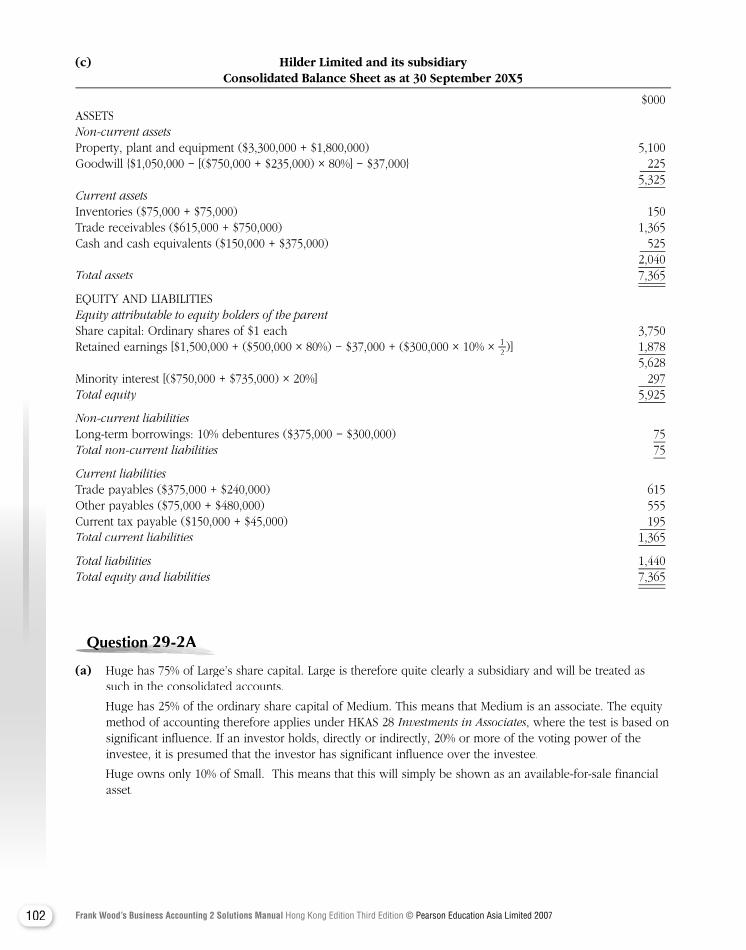
102 Frank Wood’s Business Accounting 2 Solutions Manual Hong Kong Edition Third Edition © Pearson Education Asia Limited 2007
(c) Hilder Limited and its subsidiary Consolidated Balance Sheet as at 30 September 20X5
$000ASSETSNon-current assetsProperty, plant and equipment ($3,300,000 + $1,800,000) 5,100Goodwill {$1,050,000 − [($750,000 + $235,000) × 80%] − $37,000} 225 5,325Current assetsInventories ($75,000 + $75,000) 150Trade receivables ($615,000 + $750,000) 1,365Cash and cash equivalents ($150,000 + $375,000) 525 2,040Total assets Total assets Total assets 7,365
EQUITY AND LIABILITIESEquity attributable to equity holders of the parentShare capital: Ordinary shares of $1 each 3,750Retained earnings [$1,500,000 + ($500,000 × 80%) − $37,000 + ($300,000 × 10% × 1
2 )] 1,878 5,628Minority interest [($750,000 + $735,000) × 20%] 297Total equity Total equity Total equity 5,925
Non-current liabilitiesLong-term borrowings: 10% debentures ($375,000 − $300,000) 75Total non-current liabilities 75
Current liabilitiesTrade payables ($375,000 + $240,000) 615Other payables ($75,000 + $480,000) 555Current tax payable ($150,000 + $45,000) 195Total current liabilities 1,365
Total liabilities 1,440Total equity and liabilities 7,365
Question Question Question Question Question Question Question 29-2A29-2A29-2A29-2A29-2A29-2A
(a) Huge has 75% of Large’s share capital. Large is therefore quite clearly a subsidiary and will be treated as such in the consolidated accounts.
Huge has 25% of the ordinary share capital of Medium. This means that Medium is an associate. The equity method of accounting therefore applies under HKAS 28 Investments in Associates, where the test is based on significant influence. If an investor holds, directly or indirectly, 20% or more of the voting power of the investee, it is presumed that the investor has significant influence over the investee.
Huge owns only 10% of Small. This means that this will simply be shown as an available-for-sale financial asset.
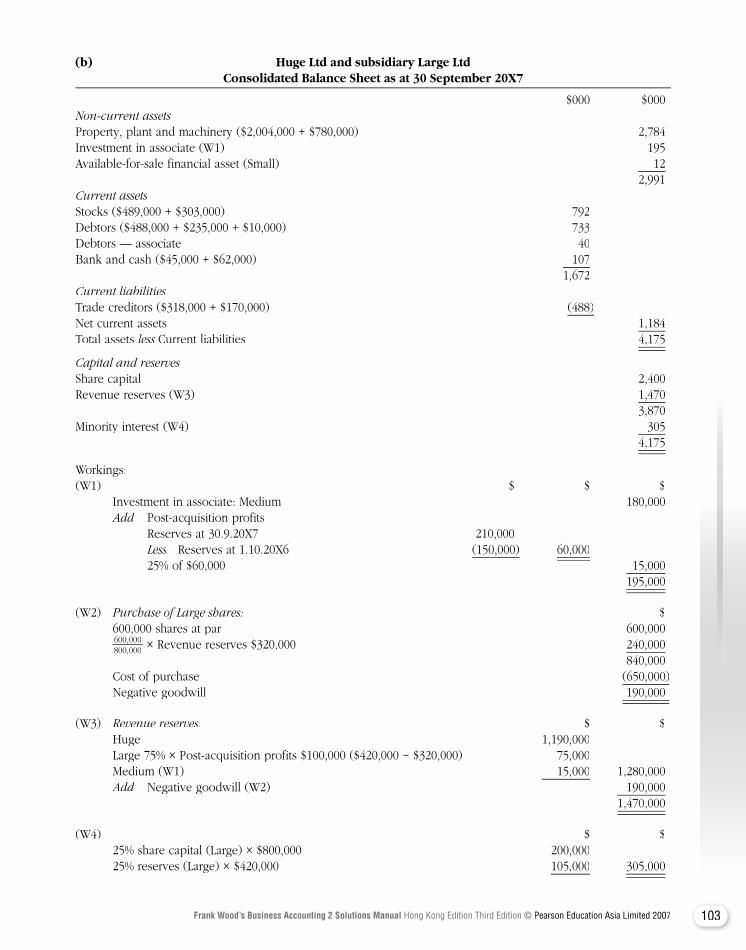
103Frank Wood’s Business Accounting 2 Solutions Manual Hong Kong Edition Third Edition © Pearson Education Asia Limited 2007
(b) Huge Ltd and subsidiary Large Ltd Consolidated Balance Sheet as at 30 September 20X7
$000 $000Non-current assets Non-current assets Non-current assetsProperty, plant and machinery ($2,004,000 + $780,000) 2,784Investment in associate (W1) 195Available-for-sale financial asset (Small) 12 2,991Current assetsStocks ($489,000 + $303,000) 792Debtors ($488,000 + $235,000 + $10,000) 733Debtors — associate 40Bank and cash ($45,000 + $62,000) 107 1,672Current liabilitiesTrade creditors ($318,000 + $170,000) (488)Net current assets 1,184Total assets less Current liabilities 4,175
Capital and reservesShare capital 2,400Revenue reserves (W3) 1,470 3,870Minority interest (W4) 305 4,175
Workings:(W1) $ $ $ Investment in associate: Medium 180,000
Add Post-acquisition profitsAdd Post-acquisition profitsAdd Reserves at 30.9.20X7 210,000 Less Reserves at 1.10.20X6 (150,000) 60,000 25% of $60,000 15,000 25% of $60,000 15,000 195,000
(W2) Purchase of Large shares: $ 600,000 shares at par 600,000
600,000 600,000 shares at par 600,000
600,000 600,000 shares at par 600,000
800,000 × Revenue reserves $320,000 240,000 840,000 Cost of purchase (650,000) Negative goodwill 190,000
(W3) Revenue reserves: $ $ Huge 1,190,000 Large 75% × Post-acquisition profits $100,000 ($420,000 − $320,000) 75,000 Medium (W1) 15,000 1,280,000
Add Negative goodwill (W2) 190,000Add Negative goodwill (W2) 190,000Add 1,470,000
(W4) $ $ 25% share capital (Large) × $800,000 200,000 25% reserves (Large) × $420,000 105,000 305,000
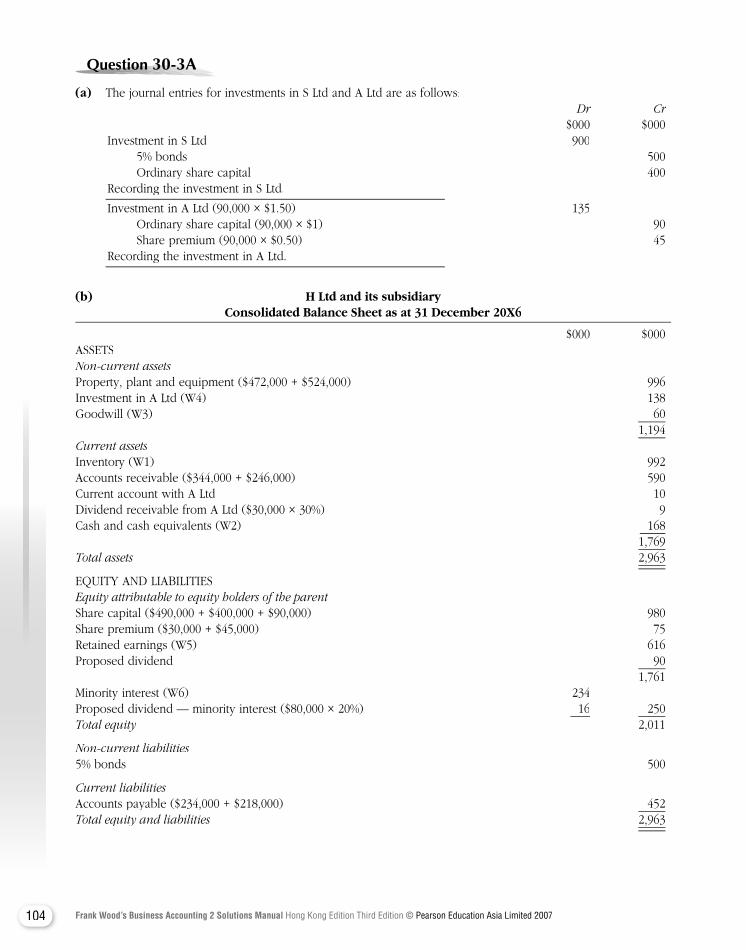
104 Frank Wood’s Business Accounting 2 Solutions Manual Hong Kong Edition Third Edition © Pearson Education Asia Limited 2007
Question Question Question Question Question Question Question 30-3A30-3A30-3A30-3A30-3A30-3A30-3A30-3A
(a) The journal entries for investments in S Ltd and A Ltd are as follows: Dr Cr $000 $000Investment in S Ltd 900 5% bonds 500 Ordinary share capital 400Recording the investment in S Ltd.
Investment in A Ltd (90,000 × $1.50) 135 Ordinary share capital (90,000 × $1) 90 Share premium (90,000 × $0.50) 45Recording the investment in A Ltd.
(b) H Ltd and its subsidiary Consolidated Balance Sheet as at 31 December 20X6
$000 $000ASSETSNon-current assetsProperty, plant and equipment ($472,000 + $524,000) 996Investment in A Ltd (W4) 138Goodwill (W3) 60 1,194Current assetsInventory (W1) 992Accounts receivable ($344,000 + $246,000) 590Current account with A Ltd 10Dividend receivable from A Ltd ($30,000 × 30%) 9Cash and cash equivalents (W2) 168 1,769Total assets Total assets Total assets 2,963
EQUITY AND LIABILITIESEquity attributable to equity holders of the parentShare capital ($490,000 + $400,000 + $90,000) 980Share premium ($30,000 + $45,000) 75Retained earnings (W5) 616Proposed dividend 90 1,761Minority interest (W6) 234Proposed dividend — minority interest ($80,000 × 20%) 16 250Total equity Total equity Total equity 2,011
Non-current liabilities5% bonds 500
Current liabilitiesAccounts payable ($234,000 + $218,000) 452 Total equity and liabilities Total equity and liabilities Total equity and liabilities 2,963
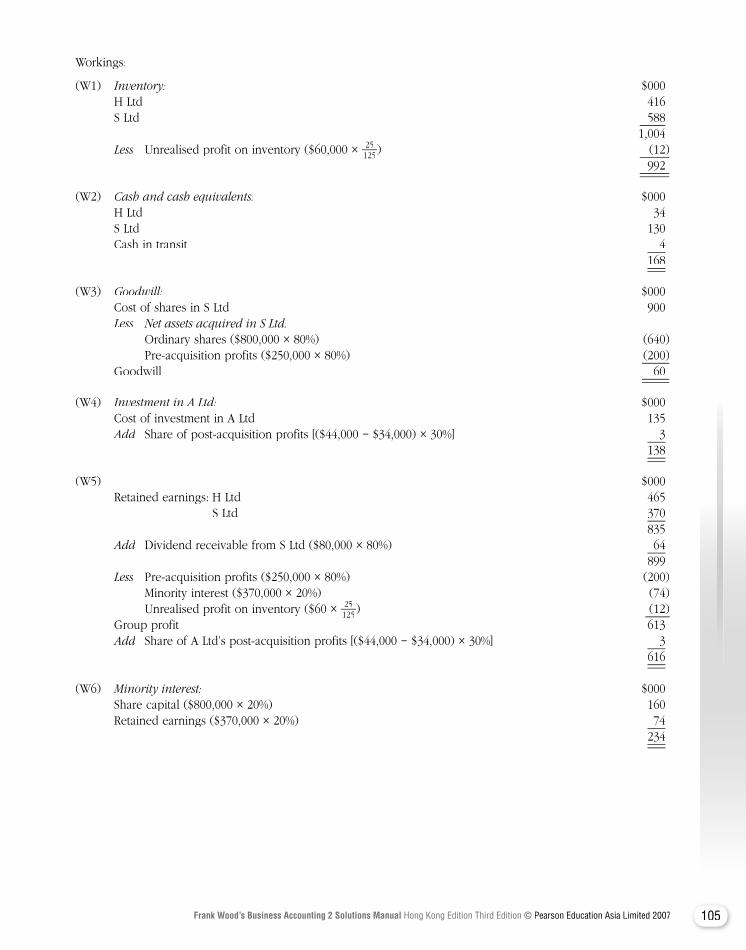
105Frank Wood’s Business Accounting 2 Solutions Manual Hong Kong Edition Third Edition © Pearson Education Asia Limited 2007
Workings:
(W1) Inventory: $000 H Ltd 416 S Ltd 588 1,004
Less Unrealised profit on inventory ($60,000 × Less Unrealised profit on inventory ($60,000 × Less 25125) (12)
992
(W2) Cash and cash equivalents: $000 H Ltd 34 S Ltd 130 Cash in transit 4 168
(W3) Goodwill: $000 Cost of shares in S Ltd 900
Less Net assets acquired in S Ltd: Ordinary shares ($800,000 × 80%) (640) Pre-acquisition profits ($250,000 × 80%) (200) Goodwill 60
(W4) Investment in A Ltd: $000 Cost of investment in A Ltd 135
Add Share of post-acquisition profits [($44,000 − $34,000) × 30%] 3Add Share of post-acquisition profits [($44,000 − $34,000) × 30%] 3Add 138
(W5) $000 Retained earnings: H Ltd 465 S Ltd 370 835
Add Dividend receivable from S Ltd ($80,000 × 80%) 64 899
Less Pre-acquisition profits ($250,000 × 80%) (200)Less Pre-acquisition profits ($250,000 × 80%) (200)Less Minority interest ($370,000 × 20%) (74) Unrealised profit on inventory ($60 × 25
125) (12) Group profit 613
Add Share of A Ltd’s post-acquisition profits [($44,000 − $34,000) × 30%] 3 616
(W6) Minority interest: $000 Share capital ($800,000 × 20%) 160 Retained earnings ($370,000 × 20%) 74 234
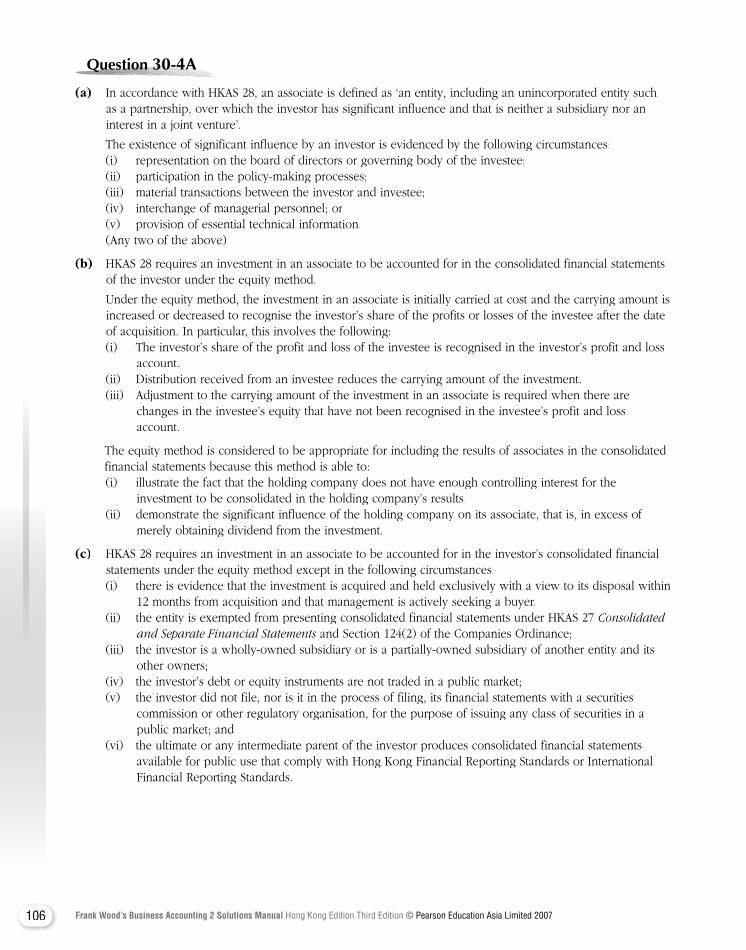
106 Frank Wood’s Business Accounting 2 Solutions Manual Hong Kong Edition Third Edition © Pearson Education Asia Limited 2007
Question Question Question Question Question Question Question 30-4A30-4A30-4A30-4A30-4A30-4A
(a) In accordance with HKAS 28, an associate is defined as ‘an entity, including an unincorporated entity such as a partnership, over which the investor has significant influence and that is neither a subsidiary nor an interest in a joint venture’.
The existence of significant influence by an investor is evidenced by the following circumstances: (i) representation on the board of directors or governing body of the investee; (ii) participation in the policy-making processes; (iii) material transactions between the investor and investee; (iv) interchange of managerial personnel; or (v) provision of essential technical information. (Any two of the above)
(b) HKAS 28 requires an investment in an associate to be accounted for in the consolidated financial statements of the investor under the equity method.
Under the equity method, the investment in an associate is initially carried at cost and the carrying amount is increased or decreased to recognise the investor’s share of the profits or losses of the investee after the date of acquisition. In particular, this involves the following:
(i) The investor’s share of the profit and loss of the investee is recognised in the investor’s profit and loss account.
(ii) Distribution received from an investee reduces the carrying amount of the investment. (iii) Adjustment to the carrying amount of the investment in an associate is required when there are
changes in the investee’s equity that have not been recognised in the investee’s profit and loss account.
The equity method is considered to be appropriate for including the results of associates in the consolidated financial statements because this method is able to:
(i) illustrate the fact that the holding company does not have enough controlling interest for the investment to be consolidated in the holding company’s results.
(ii) demonstrate the significant influence of the holding company on its associate, that is, in excess of merely obtaining dividend from the investment.
(c) HKAS 28 requires an investment in an associate to be accounted for in the investor’s consolidated financial statements under the equity method except in the following circumstances:
(i) there is evidence that the investment is acquired and held exclusively with a view to its disposal within 12 months from acquisition and that management is actively seeking a buyer.
(ii) the entity is exempted from presenting consolidated financial statements under HKAS 27 Consolidated and Separate Financial Statements and Section 124(2) of the Companies Ordinance;and Separate Financial Statements and Section 124(2) of the Companies Ordinance;and Separate Financial Statements
(iii) the investor is a wholly-owned subsidiary or is a partially-owned subsidiary of another entity and its other owners;
(iv) the investor’s debt or equity instruments are not traded in a public market; (v) the investor did not file, nor is it in the process of filing, its financial statements with a securities
commission or other regulatory organisation, for the purpose of issuing any class of securities in a public market; and
(vi) the ultimate or any intermediate parent of the investor produces consolidated financial statements available for public use that comply with Hong Kong Financial Reporting Standards or International Financial Reporting Standards.

107Frank Wood’s Business Accounting 2 Solutions Manual Hong Kong Edition Third Edition © Pearson Education Asia Limited 2007
(d) Investment in associate as at 30 June 20X5: $ $Share of net assets other than goodwill
Ordinary share capital as at 30 June 20X5 2,250,000 Retained profits as at 30 June 20X5 1,125,000 3,375,000
Share of 30% of net assets as at 30 June 20X5 1,012,500
Premium on acquisition of associate Purchase consideration 2,500,000 Share capital at date of acquisition 2,250,000 Retained profits at date of acquisition 875,000 3,125,000 Share of 30% of net assets at date of acquisition (937,500) Share of 30% of net assets at date of acquisition (937,500) 1,562,500
Share of net assets at year-end plus premium = $1,012,500 + $1,562,500 = $2,575,000
(e) Home Limited and its subsidiaries Consolidated Income Statement for the year ended 30 June 20X5
$Revenue 6,250,000Cost of sales 4,200,000 Gross profit 2,050,000Distribution costs (292,200 )Administrative costs (487,500 )Other expenses (195,300 )Share of profit of associates ($150,000 × 30%) 45,000Profit before tax 1,120,000Taxation [$187,500 + ($37,500 × 30%)] (198,750 )Profit for the year 921,250
Attributable to: Equity holders of the parent 846,250 Minority interests 75,000 921,250
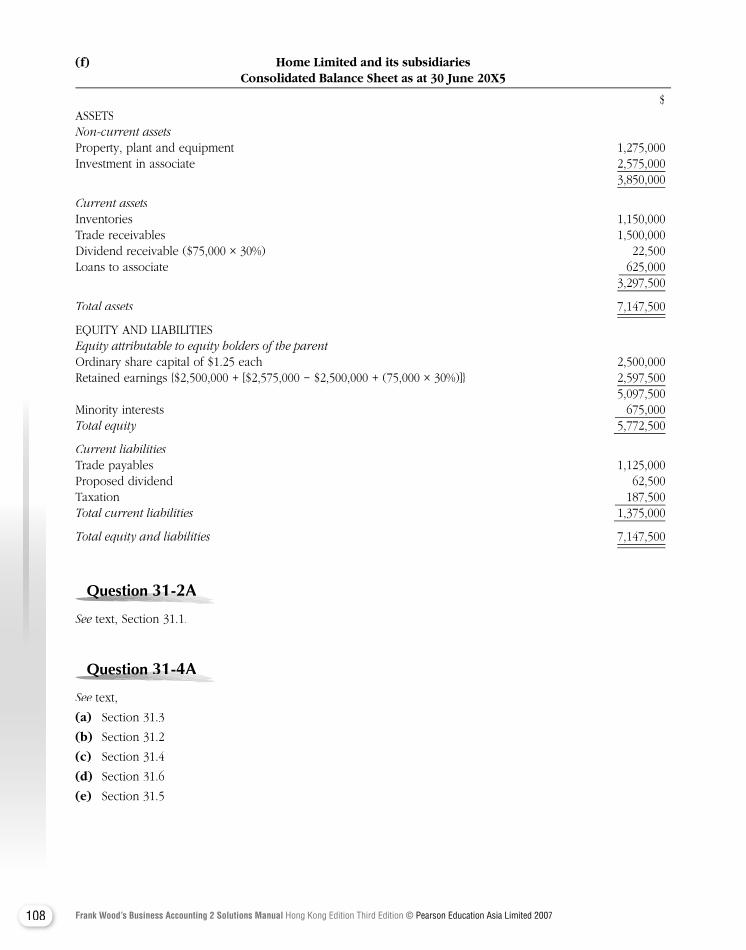
108 Frank Wood’s Business Accounting 2 Solutions Manual Hong Kong Edition Third Edition © Pearson Education Asia Limited 2007
(f) Home Limited and its subsidiaries Consolidated Balance Sheet as at 30 June 20X5
$ASSETSNon-current assetsProperty, plant and equipment 1,275,000Investment in associate 2,575,000 3,850,000
Current assetsInventories 1,150,000Trade receivables 1,500,000Dividend receivable ($75,000 × 30%) 22,500Loans to associate 625,000 3,297,500
Total assets 7,147,500
EQUITY AND LIABILITIESEquity attributable to equity holders of the parentOrdinary share capital of $1.25 each 2,500,000Retained earnings {$2,500,000 + [$2,575,000 − $2,500,000 + (75,000 × 30%)]} 2,597,500 5,097,500Minority interests 675,000Total equity 5,772,500
Current liabilitiesTrade payables 1,125,000Proposed dividend 62,500Taxation 187,500Total current liabilities 1,375,000
Total equity and liabilities 7,147,500
Question Question Question Question Question Question Question 31-2A31-2A31-2A31-2A31-2A31-2A
See text, Section 31.1.See text, Section 31.1.See
Question Question Question Question Question Question Question 31-4A31-4A31-4A31-4A31-4A31-4A
See text, See text, See
(a) Section 31.3
(b) Section 31.2
(c) Section 31.4
(d) Section 31.6
(e) Section 31.5
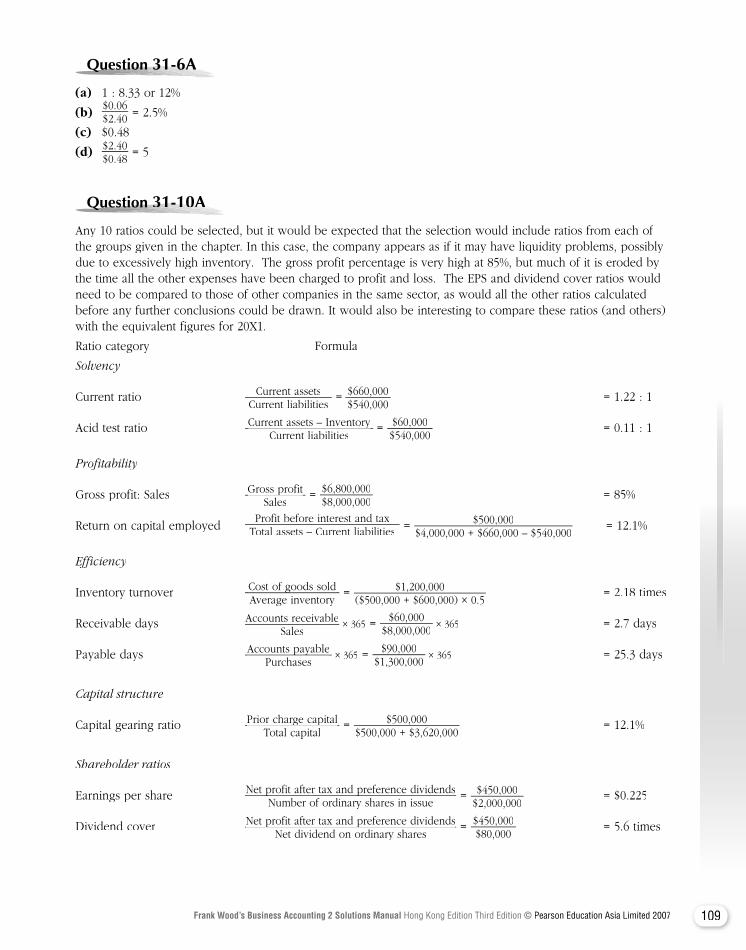
109Frank Wood’s Business Accounting 2 Solutions Manual Hong Kong Edition Third Edition © Pearson Education Asia Limited 2007
Question Question Question Question Question Question Question 31-6A31-6A31-6A31-6A31-6A31-6A
(a) 1 : 8.33 or 12%
(b)$0.06$2.40 = 2.5%
(c) $0.48
(d) $2.40$0.48
= 5
Question Question Question Question Question Question 31-10A31-10A31-10A31-10A31-10A31-10A31-10A
Any 10 ratios could be selected, but it would be expected that the selection would include ratios from each of the groups given in the chapter. In this case, the company appears as if it may have liquidity problems, possibly due to excessively high inventory. The gross profit percentage is very high at 85%, but much of it is eroded by the time all the other expenses have been charged to profit and loss. The EPS and dividend cover ratios would need to be compared to those of other companies in the same sector, as would all the other ratios calculated before any further conclusions could be drawn. It would also be interesting to compare these ratios (and others) with the equivalent figures for 20X1.
Ratio category Formula
Solvency
Current ratio Current assetsCurrent liabilities
= $660,000$540,000
= 1.22 : 1
Acid test ratio Current assets – InventoryCurrent assets – InventoryCurrent liabilities
= $60,000$540,000
= 0.11 : 1
Profitability
Gross profit: Sales Gross profitGross profitSales
= $6,800,000$8,000,000
= 85%
Return on capital employed Profit before interest and tax
Total assets – Current liabilities = $500,000$4,000,000 + $660,000 – $540,000
= 12.1%
Efficiency
Inventory turnover Cost of goods sold Cost of goods sold Average inventory
= $1,200,000($500,000 + $600,000) × 0.5
= 2.18 times
Receivable days Accounts receivableSales
× 365 = $60,000$8,000,000
× 365 = 2.7 days
Payable days Accounts payableAccounts payablePurchases
× 365 = $90,000$1,300,000
× 365 = 25.3 days
Capital structure
Capital gearing ratio Prior charge capitalPrior charge capitalTotal capital
= $500,000$500,000 + $3,620,000
= 12.1%
Shareholder ratios
Earnings per share Net profit after tax and preference dividendsNet profit after tax and preference dividendsNumber of ordinary shares in issue
= $450,000$2,000,000
= $0.225
Dividend cover Net profit after tax and preference dividendsNet profit after tax and preference dividendsNet dividend on ordinary shares
= $450,000$80,000
= 5.6 times
110 Frank Wood’s Business Accounting 2 Solutions Manual Hong Kong Edition Third Edition © Pearson Education Asia Limited 2007
Question Question Question Question Question Question 31-11A31-11A31-11A31-11A31-11A31-11A31-11A
(A) (a) Use of financial ratios
Ratios can be grouped into certain categories, each of which reflects a particular aspect of financial performance or position.
(i) Profitability
Profitability ratios are used to assess the company’s performance and its efficiency of operation. These ratios show the relationship between profit and resources employed in the operation.
(ii) Management efficiency
Management efficiency ratios can be used as an evaluation of how effectively a company’s management employs the assets to generate revenue.
(iii) Liquidity
Liquidity ratios are a set of ratios used to evaluate a company’s ability to meet its short-term obligations and thus ensure short-term survival.
(iv) Capital structure
Capital structure is concerned with how the net assets of a company are financed by a mixture of shareholders’ capital and long-term loan capital. Capital structure ratios test the long-term solvency of a company.
(b) Limitations of ratio analysis
Quality of financial statements
Ratios are based on financial statements, and the results of ratio analysis depend on the quality of these underlying statements. Ratios will inherit the limitations of the financial statements on which they are based. Poor quality and unreliable financial statements can only lead to poor quality analysis and interpretation.
Restricted vision of ratios
It is important not to rely on ratios exclusively and thereby lose sight of information contained in the underlying financial statements. Some items reported in these statements can be of vital importance in assessing a company’s financial position. For example, the total sales, capital employed and profit figures may be useful in assessing changes in absolute size which occur over time, or differences in scale between businesses. Ratios do not provide such information.
Basis of comparison
Ratios require a basis of comparison in order to be useful, and it is important that one is comparing like with like. When comparing businesses, however, no two businesses will be identical, and the greater the differences between the businesses being compared, the greater the limitations of ratio analysis. Furthermore, when comparing businesses, differences in such matters as accounting policies, financing policies and financial year ends will add to the problem of evaluation.
Balance sheet ratios
Because the balance sheet is only a ‘snapshot’ of the business at a particular moment in time, any ratios based on balance sheet figures may not be representative of the financial position of the business for the year as a whole.
(Marks will be given for other relevant points.)
111Frank Wood’s Business Accounting 2 Solutions Manual Hong Kong Edition Third Edition © Pearson Education Asia Limited 2007
(B) (a) 20X9 20Y0
(i) Net profit margin $1,828,000$18,904,000
= 9.7% $2,084,000$22,730,000
= 9.2%
(ii) ROCE $1,828,000$22,066,000
= 8.3% $2,084,000$27,886,000
= 7.5%
(iii) Current ratio $10,106,000$3,270,000
= 3.1 $15,400,000$10,348,000
= 1.5
(iv) Gearing ratio $2,440,000$22,066,000
= 11.1% $7,348,000$27,886,000
= 26.4%
(v) Trade receivables turnover $5,080,000$18,904,000
× 365 = 98.1 days $8,560,000$22,730,000
× 365 = 137.5 days
(vi) Net asset turnover $18,904,000$19,626,000
= 1.0 times $22,730,000$20,538,000
= 1.1 times
(Marks will be awarded to acceptable alternative definitions of ratios.)
(b) The net profit margin was slightly lower in 20Y0 than in 20X9. Although there was an increase in sales in 20Y0, this was not sufficient to compensate and could not prevent a slight fall in the ROCE in 20Y0. The lower net profit margin and increase in sales may well be due to the new contract. The net assets of the company increased in 20Y0, but not in proportion to the increase in turnover. Hence, the net asset turnover ratio increased slightly over the period. The increase in assets during 20Y0 appears to have been funded largely by an increase in borrowing. However, the gearing ratio is still low, indicating possible unused debt capacity.
The major cause for concern has been the dramatic decline in liquidity during 20Y0. The current ratio has more than halved during the period. There has also been a similar decrease in the acid test ratio from 1.6 in 20X9 to 0.8 in 20Y0. The balance sheet shows that the company now has a large overdraft, and the trade and other payables outstanding have nearly doubled in 20Y0.
The trade receivables outstanding and inventories have increased much more than appears to be warranted by the increase in sales. This may be due to the terms of the contract which has been negotiated and may be difficult to influence. If this is the case, the company should consider increasing the company’s long-term funding to accommodate the contract’s requirements.
Question Question Question Question Question Question 31-12A31-12A31-12A31-12A31-12A31-12A
(a) (i) Gross profit margin (iv) Return on capital employed
= Gross profitGross profitSales
= Profit before interest and taxCapital employed
(ii) Net profit margin (v) Return on shareholders’ capital
= Profit before interest and taxSales
= Profit before taxShare capital and reserves
(iii) Interest cover (vi) Gearing ratio
= Profit before interest and taxInterest expense
= Long-term debtLong-term debtEquity capital employed
112 Frank Wood’s Business Accounting 2 Solutions Manual Hong Kong Edition Third Edition © Pearson Education Asia Limited 2007
(b) (c) (d) (e) (f)
Operational activities: Existing Strategy A Strategy A Strategy B Strategy B
Financing arrangements: Existing Existing Refinancing Existing Refinancing
$ $ $ $ $Sales 100,000 99,000 99,000 117,000 117,000Less Cost of goods sold Less Cost of goods sold Less (60,000) (56,700) (56,700) (74,100) (74,100)Gross profit 40,000 42,300 42,300 42,900 42,900Operating expenses (20,000) (19,000) (19,000) (22,000) (22,000)Profit before interest and tax 20,000 23,300 23,300 20,900 20,900Interest (10,000) (10,000) (4,000) (10,000) (4,000)Net profit before tax 10,000 (13,300) 19,300 10,900 16,900
(i) Gross margin 40.00% 42.73% 42.73% 36.67% 36.67%(ii) Net profit margin 20.00% 23.53% 23.53% 17.86% 17.86%(iii) Interest cover 2.00 2.33 5.83 2.09 5.23(iv) Return on capital employed 10.00% 11.65% 11.65% 10.45% 10.45%(v) Return on shareholders’ capital 10.00% 13.30% 12.87% 10.90% 11.27%(vi) Gearing ratio 100.00% 100.00% 33.33% 100.00% 33.33%
Financing arrangements:
Existing $Existing $ExistingShare capital 100,00010% debentures 100,000Capital employed 200,000
Refinancing
Share capital ($100,000 + $25,000) 125,000Share premium ($1 × 25,000) 25,000Shareholders’ capital 150,0008% long-term bank loan 50,000Capital employed 200,000
(g) (i) Shareholders would prefer the combination of Strategy A without changing the existing financing structure because the return on shareholders’ capital (13.30%) is the highest and there is no need for shareholders to inject further capital upon rights issue.
(ii) Actually the bank only has two choices: either Strategy A or Strategy B because the existing financing arrangement does not involve the bank. Among the two strategies, bank would prefer Strategy A together with a change in the existing capital structure.
The bank is more willing to lend to a limited company with higher paid-up capital as the shareholders might have a deeper commitment to the business. Furthermore, the interest cover is 5.83 times, this makes the bank feeling more comfortable to the repayment capability of the borrower.
113Frank Wood’s Business Accounting 2 Solutions Manual Hong Kong Edition Third Edition © Pearson Education Asia Limited 2007
Question Question Question Question Question Question 31-14A31-14A31-14A31-14A31-14A31-14A
(a)
(i) Acid test ratio: (Current assets – Inventories) ÷ Current liabilities
20X5 ($3,880,000 – $2,500,000) ÷ $2,080,000 = 0.6620X5 ($3,880,000 – $2,500,000) ÷ $2,080,000 = 0.6620X5
20X4 ($3,000,000 – $2,100,000) ÷ $1,800,000 = 0.520X4 ($3,000,000 – $2,100,000) ÷ $1,800,000 = 0.520X4
(ii) Asset turnover ratio: Sales ÷ (Total assets – Current liabilities)
20X5 ($6,000,000 ÷ $6,800,000) = 0.8820X5 ($6,000,000 ÷ $6,800,000) = 0.8820X5
20X4 ($4,800,000 ÷ $5,200,000) = 0.9220X4 ($4,800,000 ÷ $5,200,000) = 0.9220X4
(iii) Current ratio: Current assets ÷ Current liabilities
20X5 ($3,880,000 ÷ $2,080,000) = 1.8720X5 ($3,880,000 ÷ $2,080,000) = 1.8720X5
20X4 ($3,000,000 ÷ $1,800,000) = 1.6720X4 ($3,000,000 ÷ $1,800,000) = 1.6720X4
(iv) Debtors’ collection period (in days): (Accounts receivable ÷ Sales) × 365
20X5 ($1,080,000 ÷ $6,000,000) × 365 = 65.7 days20X5 ($1,080,000 ÷ $6,000,000) × 365 = 65.7 days20X5
20X4 ($800,000 ÷ $4,800,000) × 365 = 60.83 days20X4 ($800,000 ÷ $4,800,000) × 365 = 60.83 days20X4
(v) Gross profit margin: (Gross profit ÷ Sales) × 100
20X5 ($3,200,000 ÷ 6,000,000) × 100 = 53.33%20X5 ($3,200,000 ÷ 6,000,000) × 100 = 53.33%20X5
20X4 ($2,160,000 ÷ 4,800,000) × 100 = 45%20X4 ($2,160,000 ÷ 4,800,000) × 100 = 45%20X4
(vi) Net profit (after taxation) margin: (Profit after taxation ÷ Sales) × 100
20X5 ($1,600,000 ÷ $6,000,000) × 100 = 26.67%20X5 ($1,600,000 ÷ $6,000,000) × 100 = 26.67%20X5
20X4 ($928,000 ÷ $4,800,000) × 100 = 19.33%20X4 ($928,000 ÷ $4,800,000) × 100 = 19.33%20X4
(vii) Return (after taxation) on owners’ equity: (Profit after taxation ÷ Owners’ equity) × 100
20X5 ($1,600,000 ÷ $6,800,000) × 100 = 23.53%20X5 ($1,600,000 ÷ $6,800,000) × 100 = 23.53%20X5
20X4 ($928,000 ÷ $5,200,000) × 100 = 17.85%20X4 ($928,000 ÷ $5,200,000) × 100 = 17.85%20X4
(b) Profitability
The asset turnover ratio of the company declined slightly from 0.92 in 20X4 to 0.88 in 20X5, which indicated that the company was less efficient in managing its assets to generate sales.
Despite the lower asset turnover ratio, the company achieved both a higher gross profit margin and a higher net profit margin in 20X5, which indicated that the company had been successful in securing a higher selling price and/or negotiating better terms from suppliers as well as exercising more efficient cost control.
As a result, the company was running more profitably at a return on owners’ equity of 23.53% in 20X5, as compared with the same ratio of 17.85% in 20X4.
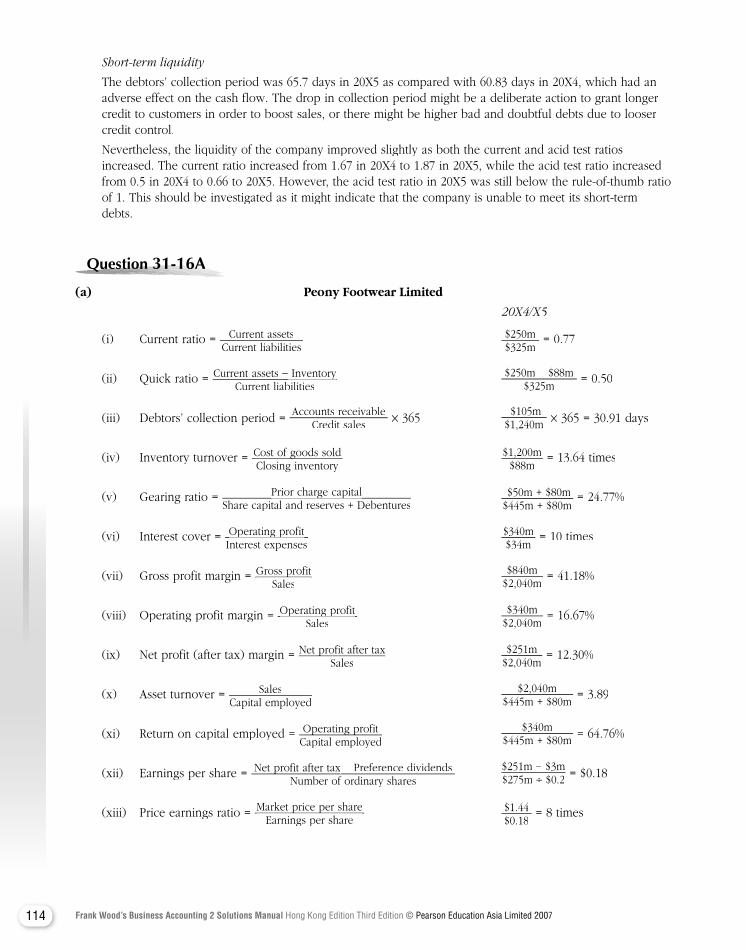
114 Frank Wood’s Business Accounting 2 Solutions Manual Hong Kong Edition Third Edition © Pearson Education Asia Limited 2007
Short-term liquidity
The debtors’ collection period was 65.7 days in 20X5 as compared with 60.83 days in 20X4, which had an adverse effect on the cash flow. The drop in collection period might be a deliberate action to grant longer credit to customers in order to boost sales, or there might be higher bad and doubtful debts due to looser credit control.
Nevertheless, the liquidity of the company improved slightly as both the current and acid test ratios increased. The current ratio increased from 1.67 in 20X4 to 1.87 in 20X5, while the acid test ratio increased from 0.5 in 20X4 to 0.66 to 20X5. However, the acid test ratio in 20X5 was still below the rule-of-thumb ratio of 1. This should be investigated as it might indicate that the company is unable to meet its short-term debts.
Question Question Question Question Question Question 31-16A31-16A31-16A31-16A31-16A31-16A31-16A
(a) Peony Footwear Limited
20X4/X5
(i) Current ratio = Current assetsCurrent liabilities
$250m$325m
= 0.77
(ii) Quick ratio = Current assets − Inventory InventoryCurrent liabilities
$250m − $88m$325m
= 0.50
(iii) Debtors’ collection period = Accounts receivableCredit sales × 365 $105m
$1,240m × 365 = 30.91 days
(iv) Inventory turnover = Cost of goods soldCost of goods soldClosing inventory
$1,200m$88m
= 13.64 times
(v) Gearing ratio = Prior charge capitalPrior charge capitalShare capital and reserves + Debentures
$50m + $80m$445m + $80m
= 24.77%
(vi) Interest cover = Operating profitOperating profitInterest expenses
$340m$34m
= 10 times
(vii) Gross profit margin = Gross profitGross profitSales
$840m$2,040m
= 41.18%
(viii) Operating profit margin = Operating profitOperating profitSales
$340m$2,040m
= 16.67%
(ix) Net profit (after tax) margin = Net profit after taxNet profit after taxSales
$251m$2,040m
= 12.30%
(x) Asset turnover = SalesCapital employed
$2,040m$445m + $80m
= 3.89
(xi) Return on capital employed = Operating profitOperating profitCapital employed
$340m$445m + $80m = 64.76%
(xii) Earnings per share = Net profit after tax Net profit after tax − Preference dividendsNumber of ordinary shares
$251m − $3m$275m ÷ $0.2 = $0.18
(xiii) Price earnings ratio = Market price per shareMarket price per shareEarnings per share
$1.44$0.18
= 8 times
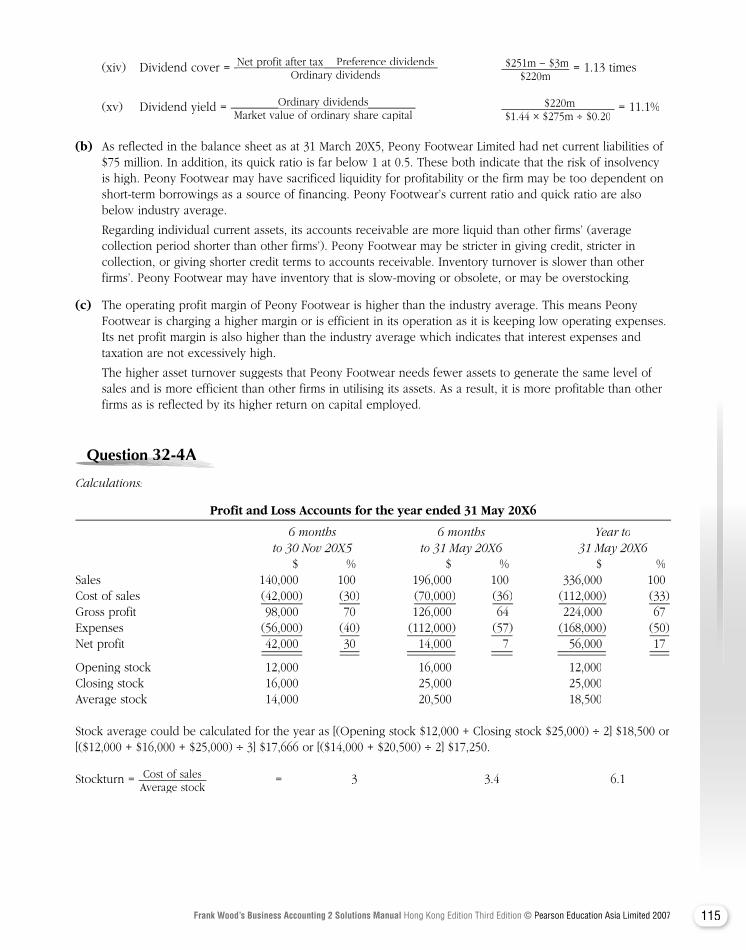
115Frank Wood’s Business Accounting 2 Solutions Manual Hong Kong Edition Third Edition © Pearson Education Asia Limited 2007
(xiv) Dividend cover = Net profit after tax Net profit after tax − Preference dividendsOrdinary dividends
$251m − $3m$220m
= 1.13 times
(xv) Dividend yield = Ordinary dividendsOrdinary dividendsMarket value of ordinary share capital
$220m$1.44 × $275m ÷ $0.20
= 11.1%
(b) As reflected in the balance sheet as at 31 March 20X5, Peony Footwear Limited had net current liabilities of $75 million. In addition, its quick ratio is far below 1 at 0.5. These both indicate that the risk of insolvency is high. Peony Footwear may have sacrificed liquidity for profitability or the firm may be too dependent on short-term borrowings as a source of financing. Peony Footwear’s current ratio and quick ratio are also below industry average.
Regarding individual current assets, its accounts receivable are more liquid than other firms’ (average collection period shorter than other firms’). Peony Footwear may be stricter in giving credit, stricter in collection, or giving shorter credit terms to accounts receivable. Inventory turnover is slower than other firms’. Peony Footwear may have inventory that is slow-moving or obsolete, or may be overstocking.
(c) The operating profit margin of Peony Footwear is higher than the industry average. This means Peony Footwear is charging a higher margin or is efficient in its operation as it is keeping low operating expenses. Its net profit margin is also higher than the industry average which indicates that interest expenses and taxation are not excessively high.
The higher asset turnover suggests that Peony Footwear needs fewer assets to generate the same level of sales and is more efficient than other firms in utilising its assets. As a result, it is more profitable than other firms as is reflected by its higher return on capital employed.
Question Question Question Question Question Question Question 32-4A32-4A32-4A32-4A32-4A32-4A
Calculations:
Profit and Loss Accounts for the year ended 31 May 20X6
6 months 6 months Year to to 30 Nov 20X5 to 31 May 20X6 31 May 20X6 $ % $ % $ %Sales 140,000 100 196,000 100 336,000 100Cost of sales (42,000) (30) (70,000) (36) (112,000) (33)Gross profit 98,000 70 126,000 64 224,000 67Expenses (56,000) (40) (112,000) (57) (168,000) (50)Net profit 42,000 30 14,000 7 56,000 17
Opening stock 12,000 16,000 12,000Closing stock 16,000 25,000 25,000Average stock 14,000 20,500 18,500
Stock average could be calculated for the year as [(Opening stock $12,000 + Closing stock $25,000) ÷ 2] $18,500 or [($12,000 + $16,000 + $25,000) ÷ 3] $17,666 or [($14,000 + $20,500) ÷ 2] $17,250.
Stockturn = Cost of salesAverage stock
= 3 3.4 6.1

116 Frank Wood’s Business Accounting 2 Solutions Manual Hong Kong Edition Third Edition © Pearson Education Asia Limited 2007
Influence of New Premises
New premises Existing business 6 months to 31 May 20X6 $ % $ % $ %Sales 70,000 100 126,000 100 196,000 100Cost of sales (28,000 ) (40 ) (42,000 ) (33 ) (70,000 ) (36)Gross profit 42,000 60 84,000 67 126,000 64Expenses (21,000 ) (30 ) (91,000 ) (72 ) (112,000 ) (57)Net profit/(loss) 21,000 30 (7,000 ) (5 ) 14,000 7
Opening stock — 16,000 16,000Closing stock 10,000 15,000 25,000Average stock 5,000 15,500 20,500Stockturn 5.6 2.7 3.4
Note: The new premises’ average stock is probably understated since it is assumed that stock builds up gradually over the period from zero to $10,000. In reality it may have held $10,000 throughout the period of trading.
Report to Martha
The analysis of the results which are shown above indicates a major query associated with the expenses of the existing business in the second half of the year. Gross profit margin has declined by 3 percentage points compared with the first half year but the expenses have increased from 40 per cent to 72 per cent of sales. Even if it is assumed that expenses are largely fixed for rent, rates, etc. the absolute level has increased from $56,000 to $91,000, i.e. by $35,000 or 62.5 per cent in the six-month period. This is in a period when, for the existing business, sales reduced from $140,000 to $126,000, i.e. by 10 per cent.
The stockturn figure indicates some improvement in the second half which is mainly attributable to the new business. This may not be an entirely acceptable measure until a further full half-year’s funding had been completed.
The return on capital employed is as follows (using the capital employed balance at the end of the period):
6 months to 30 Nov 20X5 6 months to 31 May 20X6 12 months to 31 May 20X6Capital employed $90,000 $104,000 $104,000Net profit $42,000 $14,000 $56,000Return 47% 13% 54%
Despite the decline in profits during the second half of the year, the return on capital employed is high at 54 per cent. Future trends in gross profit margins and the level of expenses need to be examined.
Question Question Question Question Question Question Question 32-6A32-6A32-6A32-6A32-6A32-6A
(a) Witton Way Ltd The following six ratios could be calculated in answering this part of the question, but other relevant ratios
would be acceptable: 20X5 20X6(i) Gross profit ratio Gross profitGross profit
Sales× 100
$1,850,000$1,850,000$7,650,000
× 100 = 24.2% $2,070,000$11,500,000
× 100 = 18%
(ii) Return on capital employedProfit before tax + Long-term loan interestProfit before tax + Long-term loan interest
Share capital + Reserves + Loans and other borrowings
$1,650,000 + $50,000$5,900,000 + $5,000,000 + $350,000
= 15.1%
× 100$1,550,000 + $350,000
$5,900,000 + $5,700,000 + $3,350,000
= 12.7%
× 100
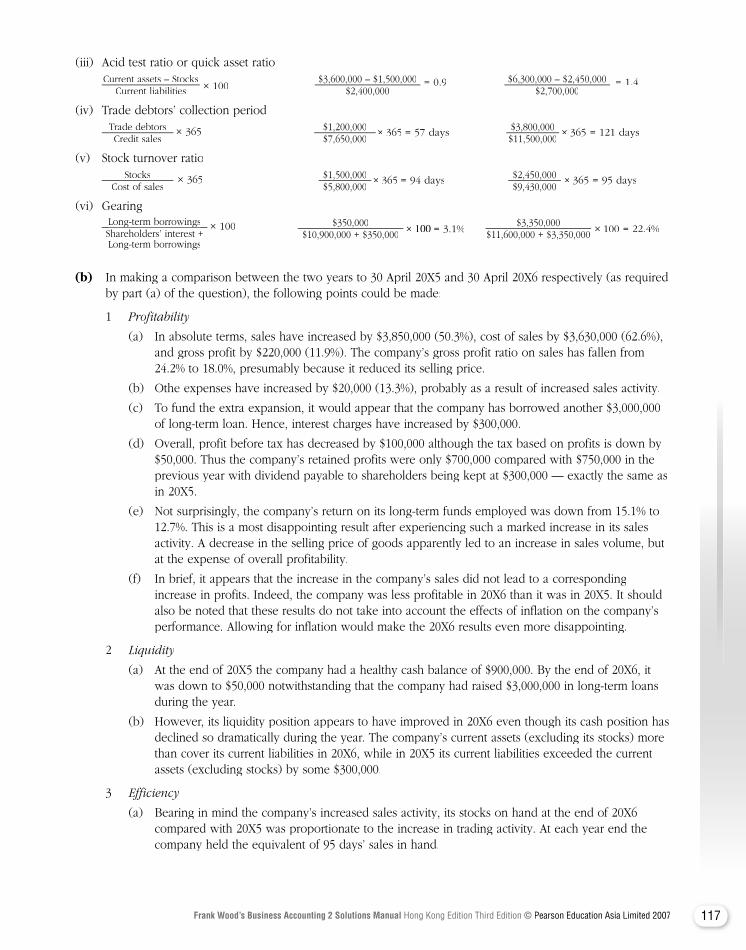
117Frank Wood’s Business Accounting 2 Solutions Manual Hong Kong Edition Third Edition © Pearson Education Asia Limited 2007
(iii) Acid test ratio or quick asset ratio Current assets – Stocks
Current liabilities × 100$3,600,000 – $1,500,000
$2,400,000= 0.9 $6,300,000 – $2,450,000
$2,700,000= 1.4
(iv) Trade debtors’ collection period Trade debtors
Credit sales× 365 $1,200,000
$7,650,000× 365 = 57 days $3,800,000
$11,500,000× 365 = 121 days
(v) Stock turnover ratio Stocks
Cost of sales× 365 $1,500,000
$5,800,000× 365 = 94 days $2,450,000
$9,430,000× 365 = 95 days
(vi) Gearing Long-term borrowingsLong-term borrowings
Shareholders’ interest +Long-term borrowings
× 100 $350,000$10,900,000 + $350,000 × 100 = 3.1%
$3,350,000$11,600,000 + $3,350,000 × 100 = 22.4%
(b) In making a comparison between the two years to 30 April 20X5 and 30 April 20X6 respectively (as required by part (a) of the question), the following points could be made:
1 Profitability
(a) In absolute terms, sales have increased by $3,850,000 (50.3%), cost of sales by $3,630,000 (62.6%), and gross profit by $220,000 (11.9%). The company’s gross profit ratio on sales has fallen from 24.2% to 18.0%, presumably because it reduced its selling price.
(b) Othe expenses have increased by $20,000 (13.3%), probably as a result of increased sales activity.
(c) To fund the extra expansion, it would appear that the company has borrowed another $3,000,000 of long-term loan. Hence, interest charges have increased by $300,000.
(d) Overall, profit before tax has decreased by $100,000 although the tax based on profits is down by $50,000. Thus the company’s retained profits were only $700,000 compared with $750,000 in the previous year with dividend payable to shareholders being kept at $300,000 — exactly the same as in 20X5.
(e) Not surprisingly, the company’s return on its long-term funds employed was down from 15.1% to 12.7%. This is a most disappointing result after experiencing such a marked increase in its sales activity. A decrease in the selling price of goods apparently led to an increase in sales volume, but at the expense of overall profitability.
(f) In brief, it appears that the increase in the company’s sales did not lead to a corresponding increase in profits. Indeed, the company was less profitable in 20X6 than it was in 20X5. It should also be noted that these results do not take into account the effects of inflation on the company’s performance. Allowing for inflation would make the 20X6 results even more disappointing.
2 Liquidity
(a) At the end of 20X5 the company had a healthy cash balance of $900,000. By the end of 20X6, it was down to $50,000 notwithstanding that the company had raised $3,000,000 in long-term loans during the year.
(b) However, its liquidity position appears to have improved in 20X6 even though its cash position has declined so dramatically during the year. The company’s current assets (excluding its stocks) more than cover its current liabilities in 20X6, while in 20X5 its current liabilities exceeded the current assets (excluding stocks) by some $300,000.
3 Efficiency
(a) Bearing in mind the company’s increased sales activity, its stocks on hand at the end of 20X6 compared with 20X5 was proportionate to the increase in trading activity. At each year end the company held the equivalent of 95 days’ sales in hand.
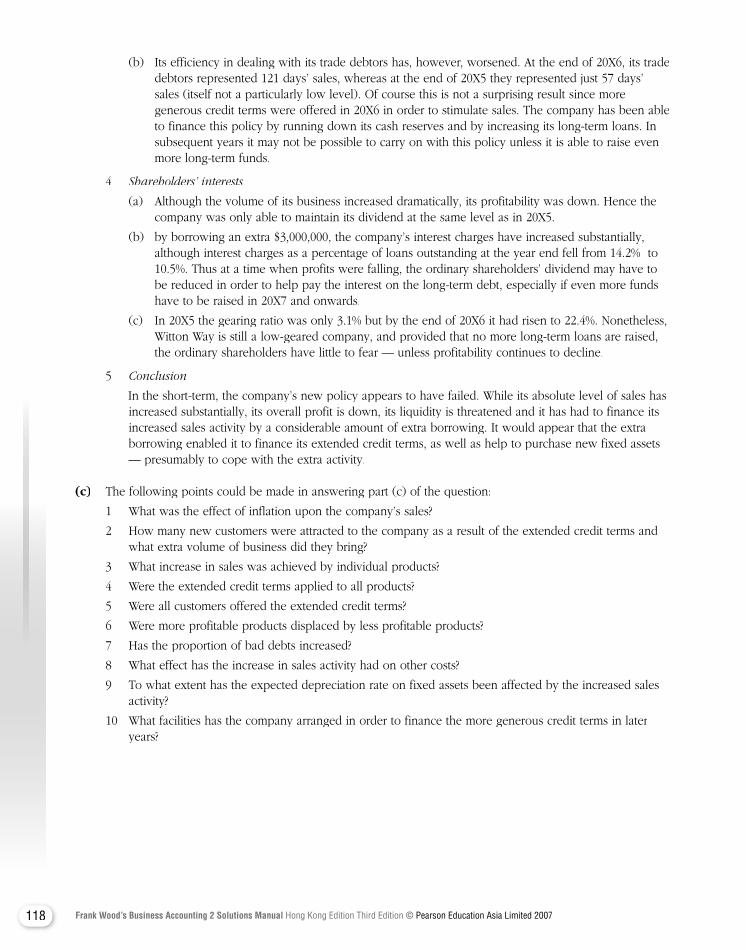
118 Frank Wood’s Business Accounting 2 Solutions Manual Hong Kong Edition Third Edition © Pearson Education Asia Limited 2007
(b) Its efficiency in dealing with its trade debtors has, however, worsened. At the end of 20X6, its trade debtors represented 121 days’ sales, whereas at the end of 20X5 they represented just 57 days’ sales (itself not a particularly low level). Of course this is not a surprising result since more generous credit terms were offered in 20X6 in order to stimulate sales. The company has been able to finance this policy by running down its cash reserves and by increasing its long-term loans. In subsequent years it may not be possible to carry on with this policy unless it is able to raise even more long-term funds.
4 Shareholders’ interests
(a) Although the volume of its business increased dramatically, its profitability was down. Hence the company was only able to maintain its dividend at the same level as in 20X5.
(b) by borrowing an extra $3,000,000, the company’s interest charges have increased substantially, although interest charges as a percentage of loans outstanding at the year end fell from 14.2% to 10.5%. Thus at a time when profits were falling, the ordinary shareholders’ dividend may have to be reduced in order to help pay the interest on the long-term debt, especially if even more funds have to be raised in 20X7 and onwards.
(c) In 20X5 the gearing ratio was only 3.1% but by the end of 20X6 it had risen to 22.4%. Nonetheless, Witton Way is still a low-geared company, and provided that no more long-term loans are raised, the ordinary shareholders have little to fear — unless profitability continues to decline.
5 Conclusion
In the short-term, the company’s new policy appears to have failed. While its absolute level of sales has increased substantially, its overall profit is down, its liquidity is threatened and it has had to finance its increased sales activity by a considerable amount of extra borrowing. It would appear that the extra borrowing enabled it to finance its extended credit terms, as well as help to purchase new fixed assets — presumably to cope with the extra activity.
(c) The following points could be made in answering part (c) of the question:
1 What was the effect of inflation upon the company’s sales?
2 How many new customers were attracted to the company as a result of the extended credit terms and what extra volume of business did they bring?
3 What increase in sales was achieved by individual products?
4 Were the extended credit terms applied to all products?
5 Were all customers offered the extended credit terms?
6 Were more profitable products displaced by less profitable products?
7 Has the proportion of bad debts increased?
8 What effect has the increase in sales activity had on other costs?
9 To what extent has the expected depreciation rate on fixed assets been affected by the increased sales activity?
10 What facilities has the company arranged in order to finance the more generous credit terms in later years?
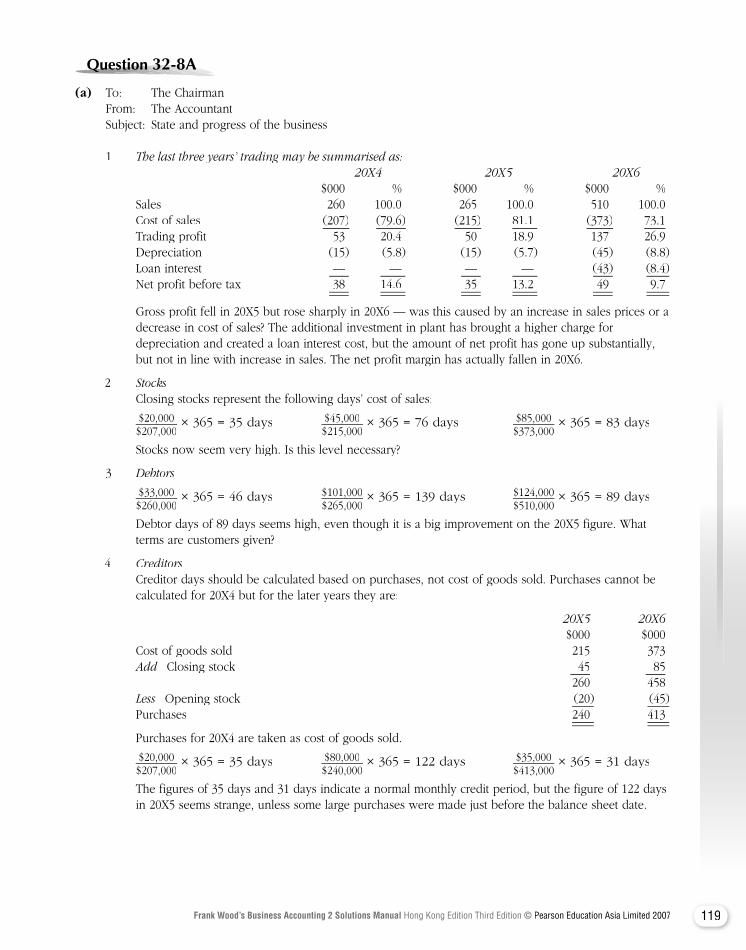
119Frank Wood’s Business Accounting 2 Solutions Manual Hong Kong Edition Third Edition © Pearson Education Asia Limited 2007
Question Question Question Question Question Question Question 32-8A32-8A32-8A32-8A32-8A32-8A32-8A
(a) To: The Chairman From: The Accountant Subject: State and progress of the business
1 The last three years’ trading may be summarised as: 20X4 20X5 20X6 $000 % $000 % $000 % Sales 260 100.0 265 100.0 510 100.0 Cost of sales (207) (79.6 ) (215) 81.1 (373) 73.1 Trading profit 53 20.4 50 18.9 137 26.9 Depreciation (15) (5.8 ) (15) (5.7 ) (45) (8.8 ) Loan interest — — — — (43) (8.4 ) Net profit before tax 38 14.6 35 13.2 49 9.7
Gross profit fell in 20X5 but rose sharply in 20X6 — was this caused by an increase in sales prices or a decrease in cost of sales? The additional investment in plant has brought a higher charge for depreciation and created a loan interest cost, but the amount of net profit has gone up substantially, but not in line with increase in sales. The net profit margin has actually fallen in 20X6.
2 Stocks Closing stocks represent the following days’ cost of sales:
$20,000$207,000
× 365 = 35 days $45,000$215,000
× 365 = 76 days $85,000$373,000
× 365 = 83 days
Stocks now seem very high. Is this level necessary?
3 Debtors
$33,000$260,000
× 365 = 46 days $101,000$265,000
× 365 = 139 days $124,000$510,000
× 365 = 89 days
Debtor days of 89 days seems high, even though it is a big improvement on the 20X5 figure. What terms are customers given?
4 CreditorsCreditor days should be calculated based on purchases, not cost of goods sold. Purchases cannot be calculated for 20X4 but for the later years they are:
20X5 20X6 $000 $000 Cost of goods sold 215 373 Add Closing stock 45 85 260 458 Less Opening stock (20) (45) Purchases 240 413
Purchases for 20X4 are taken as cost of goods sold.
$20,000$207,000
× 365 = 35 days $80,000$240,000
× 365 = 122 days $35,000$413,000
× 365 = 31 days
The figures of 35 days and 31 days indicate a normal monthly credit period, but the figure of 122 days in 20X5 seems strange, unless some large purchases were made just before the balance sheet date.
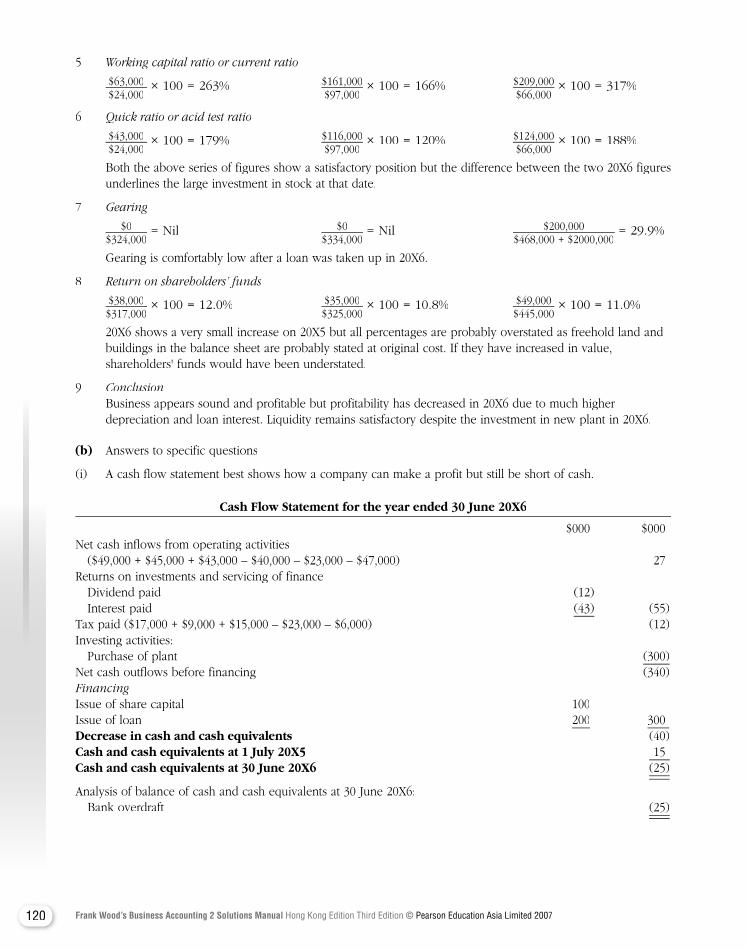
120 Frank Wood’s Business Accounting 2 Solutions Manual Hong Kong Edition Third Edition © Pearson Education Asia Limited 2007
5 Working capital ratio or current ratio
$63,000$24,000
× 100 = 263% $161,000$97,000
× 100 = 166% $209,000$66,000
× 100 = 317%
6 Quick ratio or acid test ratio
$43,000$24,000
× 100 = 179% $116,000$97,000
× 100 = 120% $124,000$66,000
× 100 = 188%
Both the above series of figures show a satisfactory position but the difference between the two 20X6 figures underlines the large investment in stock at that date.
7 Gearing
$0$324,000
= Nil $0$334,000
= Nil $200,000$468,000 + $2000,000
= 29.9%
Gearing is comfortably low after a loan was taken up in 20X6.
8 Return on shareholders’ funds
$38,000$317,000
× 100 = 12.0% $35,000$325,000
× 100 = 10.8% $49,000$445,000
× 100 = 11.0%
20X6 shows a very small increase on 20X5 but all percentages are probably overstated as freehold land and buildings in the balance sheet are probably stated at original cost. If they have increased in value, shareholders' funds would have been understated.
9 Conclusion Business appears sound and profitable but profitability has decreased in 20X6 due to much higher
depreciation and loan interest. Liquidity remains satisfactory despite the investment in new plant in 20X6.
(b) Answers to specific questions
(i) A cash flow statement best shows how a company can make a profit but still be short of cash.
Cash Flow Statement for the year ended 30 June 20X6
$000 $000Net cash inflows from operating activities ($49,000 + $45,000 + $43,000 – $40,000 – $23,000 – $47,000) 27Returns on investments and servicing of finance Dividend paid (12) Interest paid (43) (55)Tax paid ($17,000 + $9,000 + $15,000 – $23,000 – $6,000) (12)Investing activities: Purchase of plant (300)Net cash outflows before financing (340)FinancingIssue of share capital 100Issue of loan 200 300 Decrease in cash and cash equivalents (40)Cash and cash equivalents at 1 July 20X5 15Cash and cash equivalents at 30 June 20X6 (25)
Analysis of balance of cash and cash equivalents at 30 June 20X6: Bank overdraft (25)
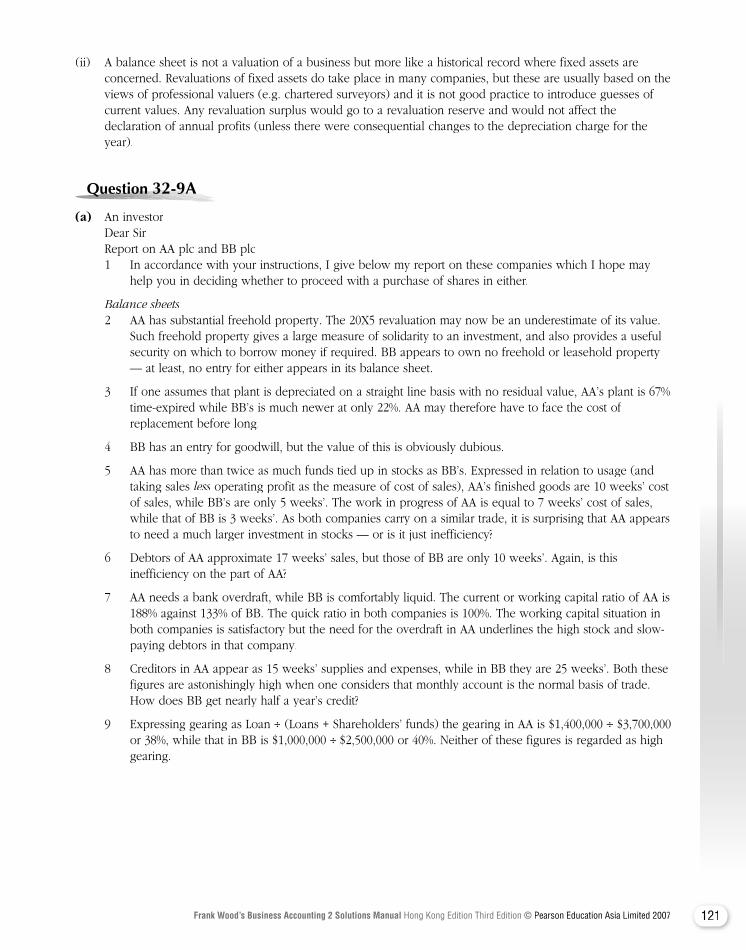
121Frank Wood’s Business Accounting 2 Solutions Manual Hong Kong Edition Third Edition © Pearson Education Asia Limited 2007
(ii) A balance sheet is not a valuation of a business but more like a historical record where fixed assets are concerned. Revaluations of fixed assets do take place in many companies, but these are usually based on the views of professional valuers (e.g. chartered surveyors) and it is not good practice to introduce guesses of current values. Any revaluation surplus would go to a revaluation reserve and would not affect the declaration of annual profits (unless there were consequential changes to the depreciation charge for the year).
Question Question Question Question Question Question Question 32-9A32-9A32-9A32-9A32-9A32-9A
(a) An investor Dear Sir Report on AA plc and BB plc 1 In accordance with your instructions, I give below my report on these companies which I hope may
help you in deciding whether to proceed with a purchase of shares in either.
Balance sheets 2 AA has substantial freehold property. The 20X5 revaluation may now be an underestimate of its value.
Such freehold property gives a large measure of solidarity to an investment, and also provides a useful security on which to borrow money if required. BB appears to own no freehold or leasehold property — at least, no entry for either appears in its balance sheet.
3 If one assumes that plant is depreciated on a straight line basis with no residual value, AA’s plant is 67% time-expired while BB’s is much newer at only 22%. AA may therefore have to face the cost of replacement before long.
4 BB has an entry for goodwill, but the value of this is obviously dubious.
5 AA has more than twice as much funds tied up in stocks as BB’s. Expressed in relation to usage (and taking sales less operating profit as the measure of cost of sales), AA’s finished goods are 10 weeks’ cost less operating profit as the measure of cost of sales), AA’s finished goods are 10 weeks’ cost lessof sales, while BB’s are only 5 weeks’. The work in progress of AA is equal to 7 weeks’ cost of sales, while that of BB is 3 weeks’. As both companies carry on a similar trade, it is surprising that AA appears to need a much larger investment in stocks — or is it just inefficiency?
6 Debtors of AA approximate 17 weeks’ sales, but those of BB are only 10 weeks’. Again, is this inefficiency on the part of AA?
7 AA needs a bank overdraft, while BB is comfortably liquid. The current or working capital ratio of AA is 188% against 133% of BB. The quick ratio in both companies is 100%. The working capital situation in both companies is satisfactory but the need for the overdraft in AA underlines the high stock and slow-paying debtors in that company.
8 Creditors in AA appear as 15 weeks’ supplies and expenses, while in BB they are 25 weeks’. Both these figures are astonishingly high when one considers that monthly account is the normal basis of trade. How does BB get nearly half a year’s credit?
9 Expressing gearing as Loan ÷ (Loans + Shareholders’ funds) the gearing in AA is $1,400,000 ÷ $3,700,000 or 38%, while that in BB is $1,000,000 ÷ $2,500,000 or 40%. Neither of these figures is regarded as high gearing.
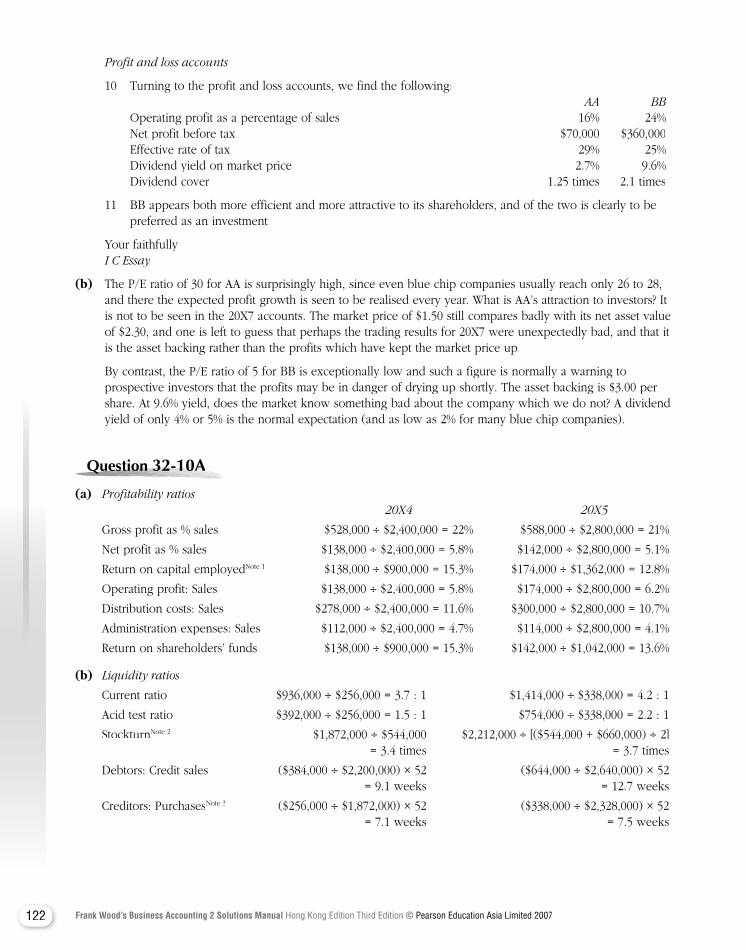
122 Frank Wood’s Business Accounting 2 Solutions Manual Hong Kong Edition Third Edition © Pearson Education Asia Limited 2007
Profit and loss accounts
10 Turning to the profit and loss accounts, we find the following: AA BB Operating profit as a percentage of sales 16% 24% Net profit before tax $70,000 $360,000 Effective rate of tax 29% 25% Dividend yield on market price 2.7% 9.6% Dividend cover 1.25 times 2.1 times
11 BB appears both more efficient and more attractive to its shareholders, and of the two is clearly to be preferred as an investment.
Your faithfullyI C Essay
(b) The P/E ratio of 30 for AA is surprisingly high, since even blue chip companies usually reach only 26 to 28, and there the expected profit growth is seen to be realised every year. What is AA’s attraction to investors? It is not to be seen in the 20X7 accounts. The market price of $1.50 still compares badly with its net asset value of $2.30, and one is left to guess that perhaps the trading results for 20X7 were unexpectedly bad, and that it is the asset backing rather than the profits which have kept the market price up.
By contrast, the P/E ratio of 5 for BB is exceptionally low and such a figure is normally a warning to prospective investors that the profits may be in danger of drying up shortly. The asset backing is $3.00 per share. At 9.6% yield, does the market know something bad about the company which we do not? A dividend yield of only 4% or 5% is the normal expectation (and as low as 2% for many blue chip companies).
Question Question Question Question Question Question 32-10A32-10A32-10A32-10A32-10A32-10A
(a) Profitability ratios 20X4 20X5
Gross profit as % sales $528,000 ÷ $2,400,000 = 22% $588,000 ÷ $2,800,000 = 21%
Net profit as % sales $138,000 ÷ $2,400,000 = 5.8% $142,000 ÷ $2,800,000 = 5.1%
Return on capital employedNote 1 $138,000 ÷ $900,000 = 15.3% $174,000 ÷ $1,362,000 = 12.8%
Operating profit: Sales $138,000 ÷ $2,400,000 = 5.8% $174,000 ÷ $2,800,000 = 6.2%
Distribution costs: Sales $278,000 ÷ $2,400,000 = 11.6% $300,000 ÷ $2,800,000 = 10.7%
Administration expenses: Sales $112,000 ÷ $2,400,000 = 4.7% $114,000 ÷ $2,800,000 = 4.1%
Return on shareholders’ funds $138,000 ÷ $900,000 = 15.3% $142,000 ÷ $1,042,000 = 13.6%
(b) Liquidity ratios
Current ratio $936,000 ÷ $256,000 = 3.7 : 1 $1,414,000 ÷ $338,000 = 4.2 : 1
Acid test ratio $392,000 ÷ $256,000 = 1.5 : 1 $754,000 ÷ $338,000 = 2.2 : 1
StockturnNote 2 $1,872,000 ÷ $544,000 $2,212,000 ÷ [($544,000 + $660,000) ÷ 2] = 3.4 times = 3.7 times
Debtors: Credit sales ($384,000 ÷ $2,200,000) × 52 ($644,000 ÷ $2,640,000) × 52 = 9.1 weeks = 12.7 weeks
Creditors: PurchasesNote 3 ($256,000 ÷ $1,872,000) × 52 ($338,000 ÷ $2,328,000) × 52 = 7.1 weeks = 7.5 weeks
123Frank Wood’s Business Accounting 2 Solutions Manual Hong Kong Edition Third Edition © Pearson Education Asia Limited 2007
Notes:1 Capital includes shareholders’ funds and debentures and operating profit is to be used instead of profit
before tax.2 Opening stock is not known for 20X4. Therefore the 20X4 ratio is calculated based on closing stock figure, as
this is the only alternative. The 20X4 ratio should therefore be viewed with a great deal of scepticism.3 Calculation of purchases for 20X5 is Opening stock $544,000 + Purchases ? – Closing stock $660,000 =
$2,212,000. By arithmetical deduction, purchases are therefore $2,328,000. Purchases for 20X4 are taken (opening stock not being known) as the same as cost of sales.
Comments
(i) Profitability
Debentures of $320,000 have been issued during the year. The profit and loss account has thus had to bear an extra charge of $32,000 interest. If the rate of interest was 10 per cent, this would mean the debentures were issued on 1 January 20X5, thus financing a full year's expansion.
The extra sales generated of 16.7 per cent have been at the cost of cutting the gross profit percentage from 22 per cent to 21 per cent.
The operating profit percentage has improved from 5.8 per cent to 6.2 per cent, possibly due partly to the fixed element in distribution and administration costs and also improved efficiency by the use of the extra loan capital being invested in better equipment.
The return on capital employed, based on operating profit, has fallen from 15.3 per cent to 12.8 per cent. This is because the profit generated from an increase in sales at a lower rate of profitability has not been sufficient to compensate for the extra capital employed.
Possibly the programme of expansion was only partly completed during 20X5 with benefits not capable of being shown up until 20X6 and later. Similar remarks also would apply to the return on shareholders’ funds.
(ii) Liquidity
Both the current ratio and the acid test (or quick) ratio have improved. This will be largely due to cash received from the issue of debentures.
The debtors are taking much longer to pay: 12.7 weeks instead of 9.1 weeks as previously. This raises the question as to the creditworthiness of the firms to whom the extra sales have been made. Every sensible effort should be made to reverse the trend in the debtors turnover ratio.
There is a large cash balance which does not seem to be making a return on its funds. This should be utilised more fully. Of course plans may have already been made to use the cash balance profitably.
Question Question Question Question Question Question 32-11A32-11A32-11A32-11A32-11A32-11A
Ratios are used to assess managerial performance, and managers may be tempted to focus on producing ‘good’ ratio results, rather than on producing the ‘best’ performance for the company and its shareholders. Thus, short-termism may be adopted in order that profits are maximised in the short term.
For example, a policy may be adopted to purchase expensive assets that remain 90% unused, rather than renting them when required, as renting would reduce the profit of the company more than the depreciation charge on the assets. Another example would be whether or not to invest in a new production facility. If the company does, it will appear less profitable in the period up to when the new facility becomes productive and, thereafter, it will start becoming more profitable. A further example would be a form of ‘window dressing’ whereby debtors are encouraged by discounts, or even coerced to settle their balances immediately before the end of the financial period — this could have the effect of customers moving their business elsewhere.
124 Frank Wood’s Business Accounting 2 Solutions Manual Hong Kong Edition Third Edition © Pearson Education Asia Limited 2007
By their nature, accounting ratios take a short-term view. Shareholders are interested in the longer term. A knowledgeable reader of the financial statements will be able to apply the ratios to the longer-term horizon, and it is the knowledgeable reader that managers should be concerned about. By adopting a short-term focus, managers may actually be subject to harsher and more informed criticism than would have been the case had they focused upon the longer-term interests of the company.
Question Question Question Question Question Question 32-13A32-13A32-13A32-13A32-13A32-13A32-13A
From the ratios provided, you can obtain various indicators of whether the Eastown branch is being properly managed:
Return on capital employed: The better return of the Eastown branch suggests it is being well managed — it is earning $6 more (i.e. 37.5 per cent more) per $100 invested than the overall average. However, some caution is needed in that analysis — while a consistent basis for the figures in the ratio is probable (as all the branches are in the same company), there is no guarantee that all have similar assets, either in nature or in age. Unless all the branches have similar asset profiles, the ratio result will be distorted. Further information will be needed.
Gross profit: The Eastown branch is over 15 per cent lower than the overall average (at 38 per cent compared with 45 per cent). This suggets Eastown is not being managed as well as other branches. However, this could have arisen because the Eastown branch has been competing locally and has had to cut prices and offer incentives to retain and or expand its customer base. Further information will be needed.
Selling and promotion costs: Sales: The Eastown branch is spending 50 per cent more per $100 of sales on promotion. While this could be an indicator of poor management, it is consistent with the suggestion made above under gross profit, that the branch may have been competing locally (but, of course, promotion costs do not directly impact gross profit). Further information will be needed.
Wages/Sales: Eastown is spending 35.7 per cent more on wages per $100 of sales than the average (19 per cent vs. 14 per cent) — another possible indicator of poor management. However, it is also consistent with an attempt to retain and/or expand its customer base through an increased level of service (as a result of employing more staff). Further information will be needed.
Debtors turnover: Eastown allows its customers 21 per cent more time to settle their accounts than the average (63 days vs. 52 days) — another possible indicator of poor management. However, it is also consistent with an attempt to retain and/or expand its customer base by allowing customers longer credit periods. Further information will be needed.
Stock turnover: Turning over stock almost 25 per cent quicker than the average (37 days vs. 49 days) suggests good management of this aspect of working capital. However, it may be caused by inefficient buying policies that are causing stock shortage and loss of customers. Further information will be needed.
Overall: The ratios indicate a higher cost and lower profit profile exists at Eastown compared with the average. This may indicate poorer management, or may be due to the environment in which the branch is operating — it may, for example, be in competition with a price-cutting competitor.
Control over debtors appears weak, but may be due to a need to compete. The only positive ratio result is the lower stock turnover period. However, it could actually be an indication that mismanagement is occurring.
The ratios in themselves are insufficient to draw any firm conclusions regarding the quality of management of the branch. However, they do indicate questions that should be asked and points that should be raised if an objective view on the quality of the branch’s management is to be reached.
125Frank Wood’s Business Accounting 2 Solutions Manual Hong Kong Edition Third Edition © Pearson Education Asia Limited 2007
Question Question Question Question Question Question 32-15A32-15A32-15A32-15A32-15A32-15A
Report on the trend of three partnerships and a comparison of their respective performance and position as indicated in key ratios provided.
Partnership N:
This partnership has a stable level of profitability with a slight and undramatic percentage increase in profit per $ of sales and 3.3% increase in the ROCE. There does not appear to be any indication of liquidity problems with again a fairly stable position in 20X4 and 20X5. The only concern could be with the 5-day increase in the amount of credit provided to the partnership customers. This should be reviewed to ascertain whether it is a deliberate policy of the partners to attract business or a sign of poor credit control. This could affect the liquidity of the partnership in the future.
Partnership P:
There has been a slight decline in the level of profitability achieved by this partnership and this will need to be investigated to ensure that it does not continue. The level of liquidity is also in decline and this should be reviewed as a matter of urgency to ensure that the cash position of the partnership does not threaten its future. The partnership has increased significantly the amount of time that goods remain in inventory. The increase in stock holding of 10 days should be investigated to assess whether this is based on a change in the inventory holding policy of the partnership or a result of weak stock control.
Partnership C:
The partnership is in a weak liquidity position but there appears to be some sign of improvement and efforts should be made to discover if this improvement will continue. There is an improving receivables collection period and a decrease in the inventory holding period which are both signs of positive management action. This is further evidenced by the improving profitability ratios but these are essential improvements because the partnership is developing from a very weak position. Overall this partnership is improving its financial performance and position but this is almost certainly an essential development for its continued existence.
Comparison of the three partnerships:
Overall the partnerships appear to operate in a business sector of low levels of profitability but a review of sector average would be required to confirm this. Partnership C appears to be the weakest at this point in time but the other partnerships could perhaps learn from their efforts to improve their financial situation. Partnership N appears to be in the best position and the other partnerships should look at what they do differently to ascertain why they are in such a relatively strong position. It is perhaps the partners of Partnership P who should be most concerned because they appear to be proceeding in the wrong direction. It would be most useful if averages of the relevant business sector could be provided to assist in further analysis of the partnerships’ financial performances and positions.
126 Frank Wood’s Business Accounting 2 Solutions Manual Hong Kong Edition Third Edition © Pearson Education Asia Limited 2007
Question Question Question Question Question Question 32-17A32-17A32-17A32-17A32-17A32-17A
(a) Income Statements
Revised 2nd Quarter Revised 3rd Quarter $000 $000Sales 290 280Opening inventory 150 140Purchases 190 210 340 350Less Closing inventory Less Closing inventory Less (140) (180) Cost of sales 200 170 Gross profit 90 110Less Overhead (70) (80)Less Overhead (70) (80)LessNet profit/(loss) 20 30
Balance Sheets
Revised 2nd Quarter Revised 3rd Quarter $000 $000Non-current assets 120 140Current assetsInventory 140 180Trade receivables 110 150Cash 20 —
270 330Current liabilitiesTrade payables 70 70Bank overdraft — 50 70 120Net current assets 200 210
320 350
Share capital 100 100Retained profits 220 250
320 350
(b) Revised 2nd Quarter Revised 3rd QuarterProfitability
Gross profit ratio 31.0% 39.3%
Net profit margin 6.9% 10.7%
Return on share capital 20.0% 30.0%
Return on non-current assets employed 16.7% 21.4%
Liquidity
Current ratio 3.9 : 1 2.8 : 1
Liquid ratio 1.9 : 1 1.3 : 1
Asset management
Trade payables payment period 28 days 30 days
Trade receivables collection period 29 days 42 days
Inventory turnover 1.38 times 1.06 times
127Frank Wood’s Business Accounting 2 Solutions Manual Hong Kong Edition Third Edition © Pearson Education Asia Limited 2007
(c) Profitability
Gross profit of Azur Ltd has slightly declined from 33.3% to 31.0% in the second quarter despite an increase in sales by 20.8% ($290,000 vs. $240,000). The inefficiency might be due to the staff not being familiar with the operation of the new machines.
The gross profit margin improved significantly in the third quarter from 31.0% to 39.3% with better utilisation of new machines.
The efficiency in the utilisation of non-current assets has been recovered to the normal range (i.e. above 20%) after a disruption in the second quarter.
Liquidity
Azur Ltd’s liquidity was strong in the first quarter but it seems a bit excessive.
The liquidity has been reduced with the expansion of operations through purchases of new machines and inventories. It is evidenced by the occurrence of bank overdraft in the third quarter.
Asset management
With an increase in sales in the second quarter, the trade receivables collection period has not changed much. However, in the third quarter, the trade receivables collection period lengthened from 29 days to 42 days. The management should tighten its control on debt collection to avoid the occurrence of bad debts.
With the increase in operating activities, Azur Ltd has increased its inventory turnover from 1.19 times to 1.38 times in the second quarter, but declined in the third quarter. With an increase in inventory balance and a declining inventory turnover ratio, a careful review of the quality of inventories is required in order to get rid of obsolete inventories as soon as possible.
The company has been lengthening the period of payment of its trade payables from 24 days in the first quarter to 30 days in the third quarter.
Question Question Question Question Question Question Question 35-2A35-2A35-2A35-2A35-2A35-2A
(i) t, v (ii) n (iii) b, d, h, o, y
(iv) c, g, i, p, q, u, z (v) e, f, j, l, m, r, s, w, x (vi) a, k
Question Question Question Question Question Question Question 35-3A35-3A35-3A35-3A35-3A35-3A
(a) Cost behaviour refers to the manner in which costs arise, e.g. whether they are fixed for a period; whether they change in proportion to the level of activity, etc. Analysis of total cost refers to the elements of specific total costs.
(b) • Factory power and lighting: would have a fixed element (light) and a variable element (power), and therefore semi-variable; however, would normally be classified as indirect factory expenses unless it was clear how much was incurred in producing each unit of the products, in which case, it could be split partly between direct costs and partly as indirect overheads.
• Production line workers’ wages: a variable cost; would be analysed as a direct cost.
• Sales manager’s salary: a fixed cost; would be analysed as a selling and distribution expense.
• Office rent: a fixed cost; would be analysed as an indirect administrative expense.
128 Frank Wood’s Business Accounting 2 Solutions Manual Hong Kong Edition Third Edition © Pearson Education Asia Limited 2007
Question Question Question Question Question Question Question 35-5A35-5A35-5A35-5A35-5A35-5A
$ $Raw materials consumed ($11,400 + $209,000 – $15,600) 204,800 Carriage on raw materials 1,800Direct labour ($150,000 × 60%) 90,000Royalties (this is a direct expense) 400 297,000Prime cost (a)Factory overheadFactory indirect labour ($150,000 × 40%) 60,000Rent and rates: Factory block 4,900Travelling expenses: Factory workers 200Depreciation of factory machinery 1,800Other factory indirect expenses 6,000 72,900Production cost (b) 369,900Administrative expenses Administrative expenses Administrative expensesWages and salaries 26,000Rent and rates: Administration block 1,100Travelling expenses: Administrative staff 300Depreciation: Cars of administrative staff 400 Office machinery 200Other administrative expenses 4,000 32,000Selling and distribution expensesSalaries: Sales force 15,000Carriage costs on deliveries 1,100Rent and rates: Sales department and showrooms 1,000Travelling expenses: Sales staff 3,400Depreciation: Sales staff’s cars 500 Delivery vehicles 300Other selling expenses 1,000 22,300Finance costsInterest costs 800Total cost (c) 425,000
129Frank Wood’s Business Accounting 2 Solutions Manual Hong Kong Edition Third Edition © Pearson Education Asia Limited 2007
Question Question Question Question Question Question Question 36-3A36-3A36-3A36-3A36-3A36-3A
Year 1 (A) Marginal cost (B) Absorption cost $000 $000 $000 $000Sales (36,000 × $64) 2,304 2,304Less Variable costs: Direct labour ($16 × 40,000) 640 640 Direct materials ($12 × 40,000) 480 480 Variable overheads ($20 × 40,000) 800 800Total variable cost 1,920 1,920Less Closing inventory valuation in (A)Less Closing inventory valuation in (A)Less
4,00040,000 × $1,920,000 (192)
1,728Fixed overhead 64 64 1,984Less Closing inventory valuation in (B)Less Closing inventory valuation in (B)Less
4,00040,000 × $1,984,000 (198.4 )
Total costs (1,792) (1,785.6 )Gross profit 512 518.4
Year 2 Year 2 Year 2 (A) Marginal cost (B) Absorption cost $000 $000 $000 $000Sales (40,000 × $64) 2,560 2,560Less Variable costs: Direct labour ($16 × 45,000) 720 720 Direct materials ($12 × 45,000) 540 540 Variable overheads ($20 × 45,000) 900 900Total variable cost 2,160 2,160Less Closing inventory valuation in (A)
9,00045,000 × $2,160,000 (432 )
1,728Fixed overheads 64 64 2,224Less Closing inventory valuation in (B)Less Closing inventory valuation in (B)Less
9,00045,000 × $2,224,000 (444.8 )
1,779.2Add Opening inventory b/d 192 198.4Total costs (1,984 ) (1977.6 )Gross profit 576 582.4

130 Frank Wood’s Business Accounting 2 Solutions Manual Hong Kong Edition Third Edition © Pearson Education Asia Limited 2007
Year 3 (A) Marginal cost (B) Absorption cost
$000 $000 $000 $000Sales (60,000 × $64) 3,840 3,840Less Variable costs: Direct labour ($16 × 51,000) 816 816 Direct materials ($12 × 51,000) 612 612 Variable overheads ($20 × 51,000) 1,020 1,020Total variable cost 2,448 2,448Less Closing inventory valuation (A) Less Closing inventory valuation (A) Less (— ) 2,448Fixed overheads 64 64 2,512Less Closing inventory valuation (B) Less Closing inventory valuation (B) Less ( — ) 2,512Add Opening inventory b/d Add Opening inventory b/d Add 432 444.8Total costs (2,944) (2,956.8 )Gross profit 896 883.2
Question Question Question Question Question Question Question 36-4A36-4A36-4A36-4A36-4A36-4A
Answers to be drafted by students in proper memo form.
Introduction:
Marginal cost is $3.20 + $4.80 + $1.60 = $9.60
Selling price − Marginal cost = Contribution to overheads and profit.
Projects which give negative contributions should be rejected.
A change in volume can only be favourable where total contributions with new project are greater than total contributions without new project.
1 Total contributions with new project
$14.8 − $9.6 = $5.20 × 240,000 = $1,248,000
Total contributions without new project
$15 − $9.60 = $5.40 × 200,000 = $1,080,000
Therefore accept reduction in selling price to $14.80.
131Frank Wood’s Business Accounting 2 Solutions Manual Hong Kong Edition Third Edition © Pearson Education Asia Limited 2007
At $14.80 At $15Proof $ $Proof $ $Proof
Direct materials 768,000 640,000 Direct labour 1,152,000 960,000 Indirect manufacturing costs Variable 384,000 320,000 Fixed 160,000 160,000 Selling and distribution 80,000 80,000 Administrative expenses 120,000 120,000 Finance 40,000 40,000 2,704,000 2,320,000
Sales 3,552,000 3,000,000 Net profit 848,000 680,000
2 $ $ Total contributions with new project ($15.40 − $9.60 = $5.80 × 160,000) 928,000
Add Savings in finance costs Add Savings in finance costs Add 4,000 932,000
Total contributions without new project ($15 − $9.60 = $5.40 × 200,000) 1,080,000
Therefore reject new project.
Proof (i) At $15 net profit is $680,000
(ii) At $15.40 $ $ Direct materials (160,000 × $3.20) 512,000 Direct labour (160,000 × $4.80) 768,000 Indirect manufacturing costs: Variable (160,000 × $1.60) 256,000 Fixed 160,000 Selling and distribution 80,000 Administrative expenses 120,000 Finance ($40,000 − $4,000) 36,000 1,932,000 Sales (160,000 × $15.40) 2,464,000 Net profit 532,000
3 Marginal cost is $9.60: the extra order at $9.80 would therefore be worthwhile.
4 Marginal cost is $9.60: the extra order at $9.20 should be rejected.
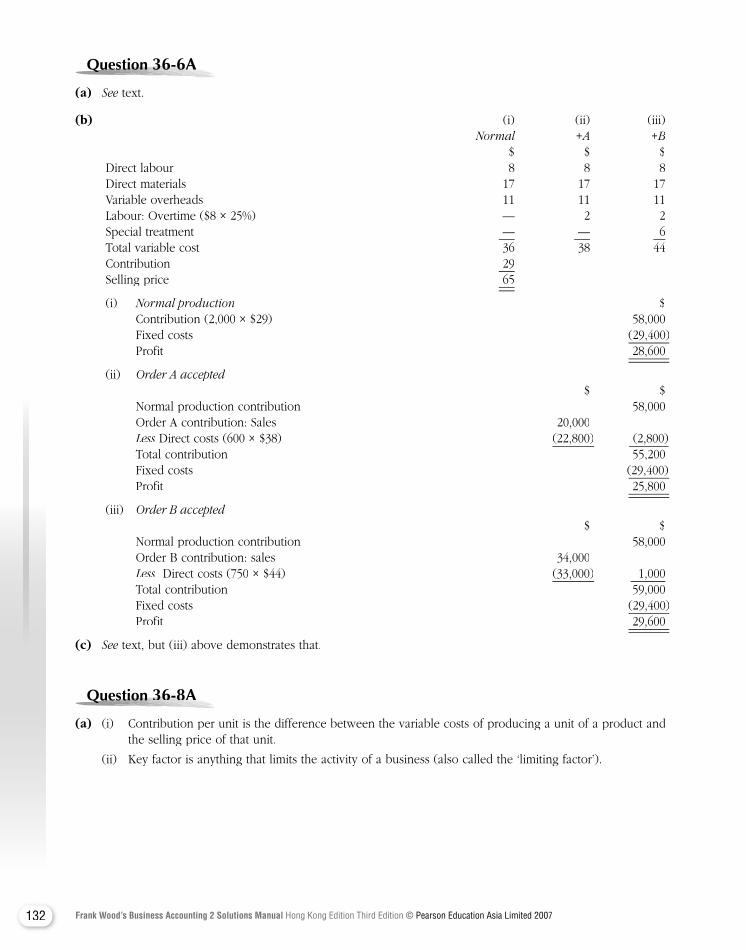
132 Frank Wood’s Business Accounting 2 Solutions Manual Hong Kong Edition Third Edition © Pearson Education Asia Limited 2007
Question Question Question Question Question Question Question 36-6A36-6A36-6A36-6A36-6A36-6A
(a) See text.See text.See
(b) (i) (ii) (iii) Normal +A +B $ $ $ Direct labour 8 8 8 Direct materials 17 17 17 Variable overheads 11 11 11 Labour: Overtime ($8 × 25%) — 2 2 Special treatment — — 6 — 6 — Total variable cost 36 38 44 Contribution 29 Selling price 65
(i) Normal production $ Contribution (2,000 × $29) 58,000 Fixed costs (29,400) Profit 28,600
(ii) Order A accepted Order A accepted Order A accepted $ $ Normal production contribution 58,000 Order A contribution: Sales 20,000 Less Direct costs (600 Less Direct costs (600 Less × $38) (22,800) (2,800) Total contribution 55,200 Fixed costs (29,400) Profit 25,800
(iii) Order B accepted Order B accepted Order B accepted $ $ Normal production contribution 58,000 Order B contribution: sales 34,000 Less Direct costs (750 Less Direct costs (750 Less × $44) (33,000) 1,000 Total contribution 59,000 Fixed costs (29,400) Profit 29,600
(c) See text, but (iii) above demonstrates that.See text, but (iii) above demonstrates that.See
Question Question Question Question Question Question Question 36-8A 36-8A 36-8A 36-8A 36-8A 36-8A
(a) (i) Contribution per unit is the difference between the variable costs of producing a unit of a product and the selling price of that unit.
(ii) Key factor is anything that limits the activity of a business (also called the ‘limiting factor’).
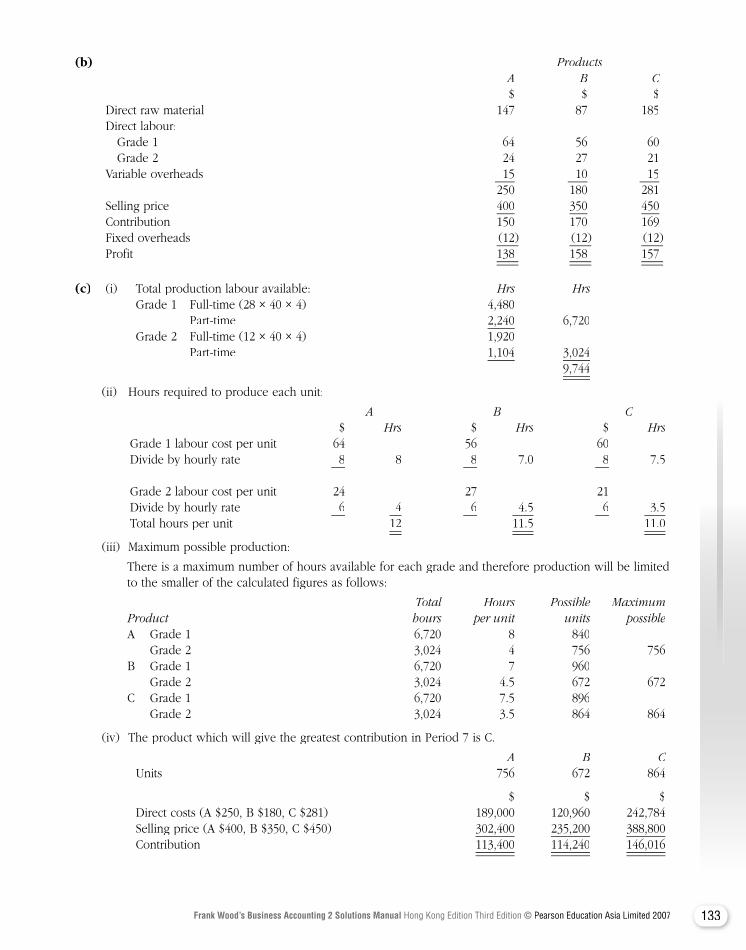
133Frank Wood’s Business Accounting 2 Solutions Manual Hong Kong Edition Third Edition © Pearson Education Asia Limited 2007
(b) Products A B C $ $ $ Direct raw material 147 87 185 Direct labour: Grade 1 64 56 60 Grade 2 24 27 21 Variable overheads 15 10 15 250 180 281 Selling price 400 350 450 Contribution 150 170 169 Fixed overheads (12) (12) (12) Profit 138 158 157
(c) (i) Total production labour available: Hrs Hrs Hrs Hrs Hrs Hrs Grade 1 Full-time (28 × 40 × 4) 4,480 Part-time 2,240 6,720 Grade 2 Full-time (12 × 40 × 4) 1,920 Part-time 1,104 3,024 9,744
(ii) Hours required to produce each unit:
A B C $ Hrs $ Hrs $ Hrs Hrs $ Hrs $ Hrs Hrs Grade 1 labour cost per unit 64 56 60 Divide by hourly rate 8 8 8 7.0 8 7.5 Grade 2 labour cost per unit 24 27 21 Divide by hourly rate 6 4 6 4.5 6 3.5 Total hours per unit 12 11.5 11.0
(iii) Maximum possible production:
There is a maximum number of hours available for each grade and therefore production will be limited to the smaller of the calculated figures as follows:
Total Hours Possible Maximum Product hours per unit units possible A Grade 1 6,720 8 840 Grade 2 3,024 4 756 756 B Grade 1 6,720 7 960 Grade 2 3,024 4.5 672 672 C Grade 1 6,720 7.5 896 Grade 2 3,024 3.5 864 864
(iv) The product which will give the greatest contribution in Period 7 is C.
A B C Units 756 672 864
$ $ $ Direct costs (A $250, B $180, C $281) 189,000 120,960 242,784 Selling price (A $400, B $350, C $450) 302,400 235,200 388,800 Contribution 113,400 114,240 146,016
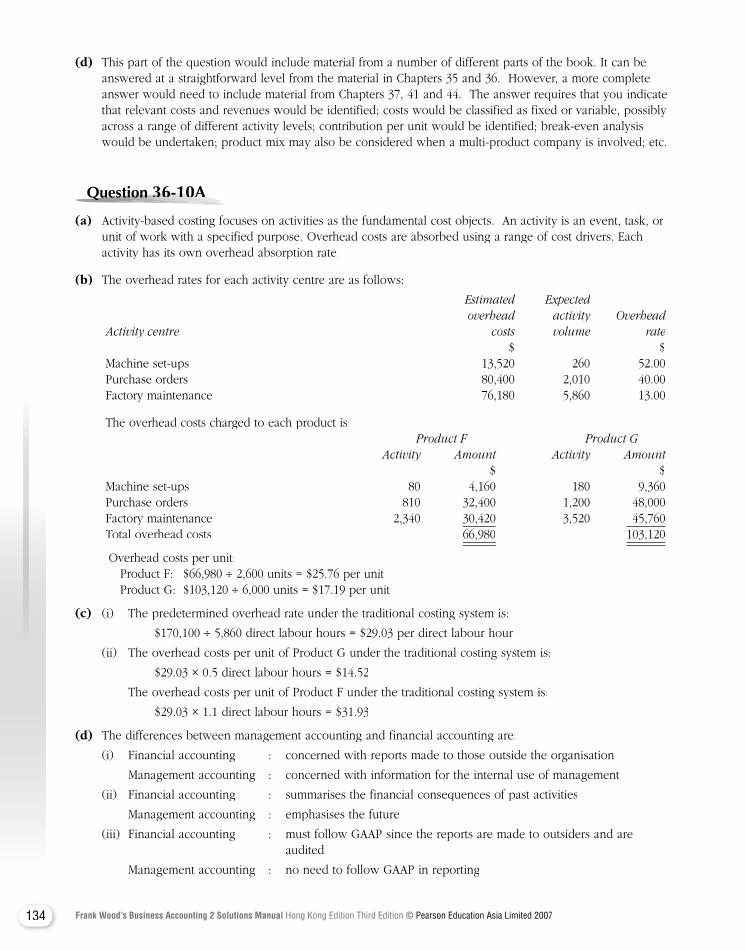
134 Frank Wood’s Business Accounting 2 Solutions Manual Hong Kong Edition Third Edition © Pearson Education Asia Limited 2007
(d) This part of the question would include material from a number of different parts of the book. It can be answered at a straightforward level from the material in Chapters 35 and 36. However, a more complete answer would need to include material from Chapters 37, 41 and 44. The answer requires that you indicate that relevant costs and revenues would be identified; costs would be classified as fixed or variable, possibly across a range of different activity levels; contribution per unit would be identified; break-even analysis would be undertaken; product mix may also be considered when a multi-product company is involved; etc.
Question Question Question Question Question Question 36-10A36-10A36-10A36-10A36-10A36-10A36-10A
(a) Activity-based costing focuses on activities as the fundamental cost objects. An activity is an event, task, or unit of work with a specified purpose. Overhead costs are absorbed using a range of cost drivers. Each activity has its own overhead absorption rate.
(b) The overhead rates for each activity centre are as follows:
Estimated Expected overhead activity Overhead Activity centre costs volume rate $ $ Machine set-ups 13,520 260 52.00 Purchase orders 80,400 2,010 40.00 Factory maintenance 76,180 5,860 13.00
The overhead costs charged to each product is: Product F Product G Activity Amount Activity Amount $ $ Machine set-ups 80 4,160 180 9,360 Purchase orders 810 32,400 1,200 48,000 Factory maintenance 2,340 30,420 3,520 45,760 Total overhead costs 66,980 103,120
Overhead costs per unit: Product F: $66,980 ÷ 2,600 units = $25.76 per unit Product G: $103,120 ÷ 6,000 units = $17.19 per unit
(c) (i) The predetermined overhead rate under the traditional costing system is:
$170,100 ÷ 5,860 direct labour hours = $29.03 per direct labour hour
(ii) The overhead costs per unit of Product G under the traditional costing system is:
$29.03 × 0.5 direct labour hours = $14.52
The overhead costs per unit of Product F under the traditional costing system is:
$29.03 × 1.1 direct labour hours = $31.93
(d) The differences between management accounting and financial accounting are:
(i) Financial accounting : concerned with reports made to those outside the organisation
Management accounting : concerned with information for the internal use of management
(ii) Financial accounting : summarises the financial consequences of past activities
Management accounting : emphasises the future
(iii) Financial accounting : must follow GAAP since the reports are made to outsiders and are audited
Management accounting : no need to follow GAAP in reporting
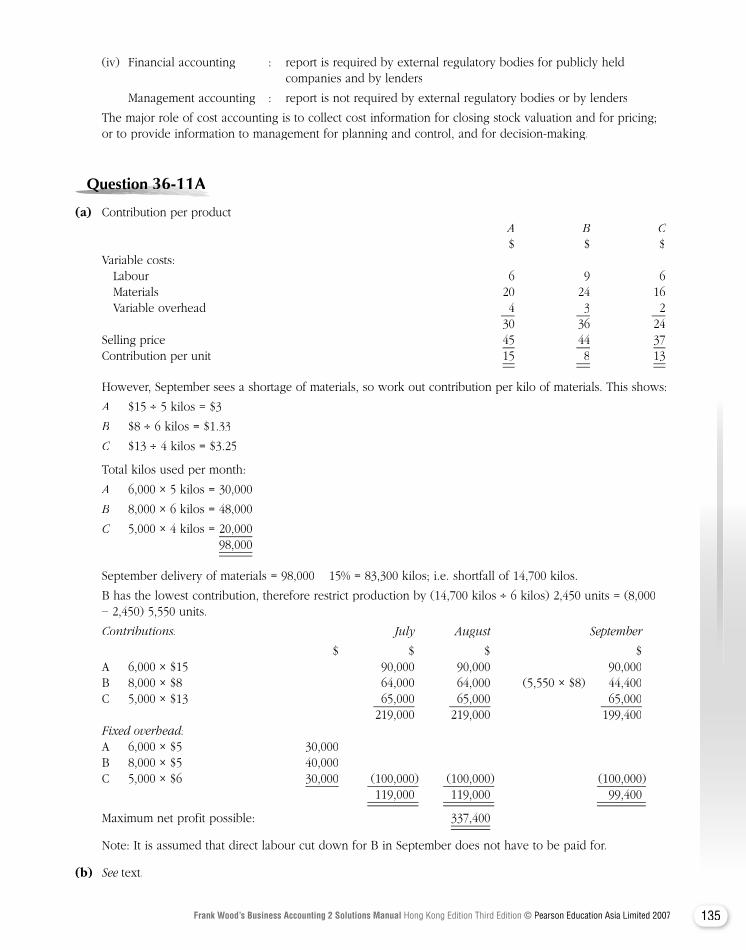
135Frank Wood’s Business Accounting 2 Solutions Manual Hong Kong Edition Third Edition © Pearson Education Asia Limited 2007
(iv) Financial accounting : report is required by external regulatory bodies for publicly held companies and by lenders
Management accounting : report is not required by external regulatory bodies or by lenders
The major role of cost accounting is to collect cost information for closing stock valuation and for pricing; or to provide information to management for planning and control, and for decision-making.
Question Question Question Question Question Question Question 36-11A36-11A36-11A36-11A36-11A36-11A
(a) Contribution per product A B C $ $ $ Variable costs: Labour 6 9 6 Materials 20 24 16 Variable overhead 4 3 2 30 36 24 Selling price 45 44 37 Contribution per unit 15 8 13
However, September sees a shortage of materials, so work out contribution per kilo of materials. This shows:
A $15 ÷ 5 kilos = $3
B $8 B $8 B ÷ 6 kilos = $1.33
C $13 C $13 C ÷ 4 kilos = $3.25
Total kilos used per month:
A 6,000 × 5 kilos = 30,000
B 8,000 B 8,000 B × 6 kilos = 48,000
C 5,000 C 5,000 C × 4 kilos = 20,000 98,000
September delivery of materials = 98,000 − 15% = 83,300 kilos; i.e. shortfall of 14,700 kilos.
B has the lowest contribution, therefore restrict production by (14,700 kilos ÷ 6 kilos) 2,450 units = (8,000 − 2,450) 5,550 units.
Contributions: July August September
$ $ $ $ A 6,000 × $15 90,000 90,000 90,000 B 8,000 × $8 64,000 64,000 (5,550 × $8) 44,400 C 5,000 × $13 65,000 65,000 65,000 219,000 219,000 199,400 Fixed overhead: A 6,000 × $5 30,000 B 8,000 × $5 40,000 C 5,000 × $6 30,000 (100,000) (100,000) (100,000) 119,000 119,000 99,400
Maximum net profit possible: 337,400
Note: It is assumed that direct labour cut down for B in September does not have to be paid for.
(b) See text.
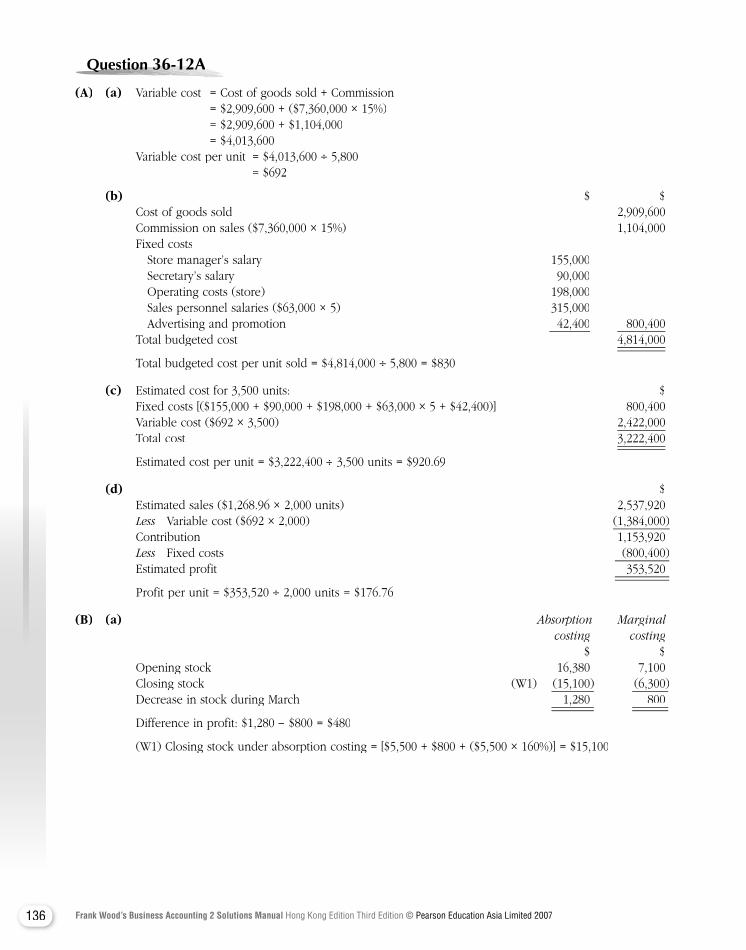
136 Frank Wood’s Business Accounting 2 Solutions Manual Hong Kong Edition Third Edition © Pearson Education Asia Limited 2007
Question Question Question Question Question Question 36-12A36-12A36-12A36-12A36-12A36-12A36-12A
(A) (a) Variable cost = Cost of goods sold + Commission = $2,909,600 + ($7,360,000 × 15%) = $2,909,600 + $1,104,000 = $4,013,600 Variable cost per unit = $4,013,600 ÷ 5,800 = $692
(b) $ $ Cost of goods sold 2,909,600 Commission on sales ($7,360,000 × 15%) 1,104,000 Fixed costs Store manager’s salary 155,000 Secretary’s salary 90,000 Operating costs (store) 198,000 Sales personnel salaries ($63,000 × 5) 315,000 Advertising and promotion 42,400 800,400 Total budgeted cost 4,814,000
Total budgeted cost per unit sold = $4,814,000 ÷ 5,800 = $830
(c) Estimated cost for 3,500 units: $ Fixed costs [($155,000 + $90,000 + $198,000 + $63,000 × 5 + $42,400)] 800,400 Variable cost ($692 × 3,500) 2,422,000 Total cost 3,222,400
Estimated cost per unit = $3,222,400 ÷ 3,500 units = $920.69
(d) $ Estimated sales ($1,268.96 × 2,000 units) 2,537,920 Less Variable cost ($692 Less Variable cost ($692 Less × 2,000) (1,384,000) Contribution 1,153,920 Less Fixed costs (800,400)Less Fixed costs (800,400)Less Estimated profit 353,520
Profit per unit = $353,520 ÷ 2,000 units = $176.76
(B) (a) Absorption Marginal Absorption Marginal costing costing $ $ Opening stock 16,380 7,100 Closing stock (W1) (15,100) (6,300) Decrease in stock during March 1,280 800
Difference in profit: $1,280 − $800 = $480
(W1) Closing stock under absorption costing = [$5,500 + $800 + ($5,500 × 160%)] = $15,100
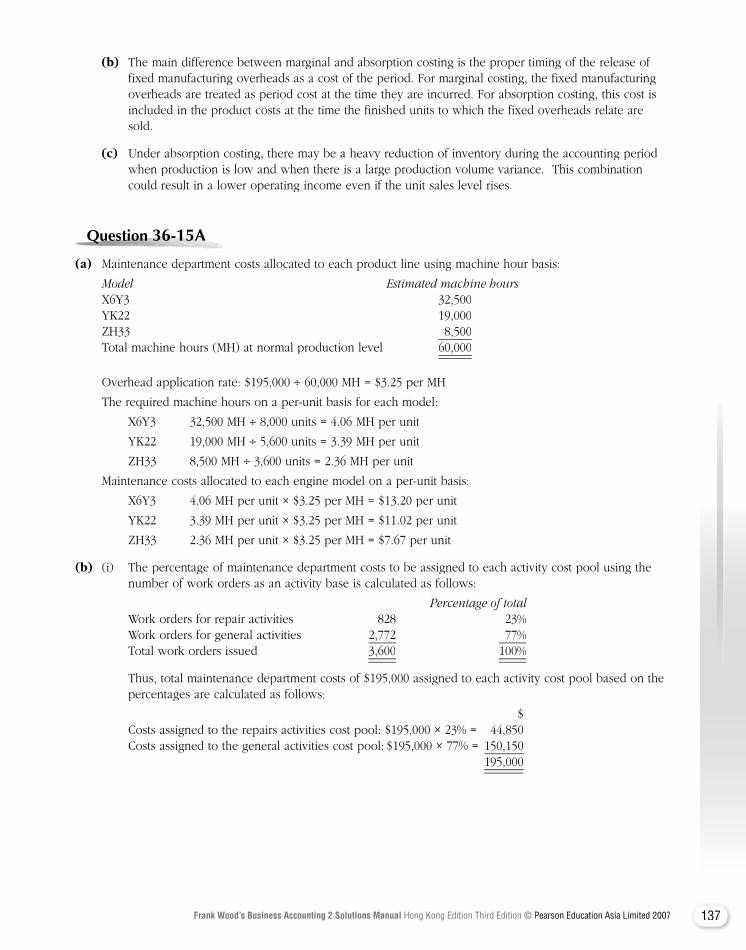
137Frank Wood’s Business Accounting 2 Solutions Manual Hong Kong Edition Third Edition © Pearson Education Asia Limited 2007
(b) The main difference between marginal and absorption costing is the proper timing of the release of fixed manufacturing overheads as a cost of the period. For marginal costing, the fixed manufacturing overheads are treated as period cost at the time they are incurred. For absorption costing, this cost is included in the product costs at the time the finished units to which the fixed overheads relate are sold.
(c) Under absorption costing, there may be a heavy reduction of inventory during the accounting period when production is low and when there is a large production volume variance. This combination could result in a lower operating income even if the unit sales level rises.
Question Question Question Question Question Question 36-15A36-15A36-15A36-15A36-15A36-15A36-15A
(a) Maintenance department costs allocated to each product line using machine hour basis:
Model Estimated machine hours X6Y3 32,500 YK22 19,000 ZH33 8,500 Total machine hours (MH) at normal production level 60,000
Overhead application rate: $195,000 ÷ 60,000 MH = $3.25 per MH
The required machine hours on a per-unit basis for each model:
X6Y3 32,500 MH ÷ 8,000 units = 4.06 MH per unit
YK22 19,000 MH ÷ 5,600 units = 3.39 MH per unit
ZH33 8,500 MH ÷ 3,600 units = 2.36 MH per unit
Maintenance costs allocated to each engine model on a per-unit basis:
X6Y3 4.06 MH per unit × $3.25 per MH = $13.20 per unit
YK22 3.39 MH per unit × $3.25 per MH = $11.02 per unit
ZH33 2.36 MH per unit × $3.25 per MH = $7.67 per unit
(b) (i) The percentage of maintenance department costs to be assigned to each activity cost pool using the number of work orders as an activity base is calculated as follows:
Percentage of total Work orders for repair activities 828 23% Work orders for general activities 2,772 77% Total work orders issued 3,600 100%
Thus, total maintenance department costs of $195,000 assigned to each activity cost pool based on the percentages are calculated as follows:
$ Costs assigned to the repairs activities cost pool: $195,000 × 23% = 44,850 Costs assigned to the general activities cost pool: $195,000 × 77% = 150,150 195,000
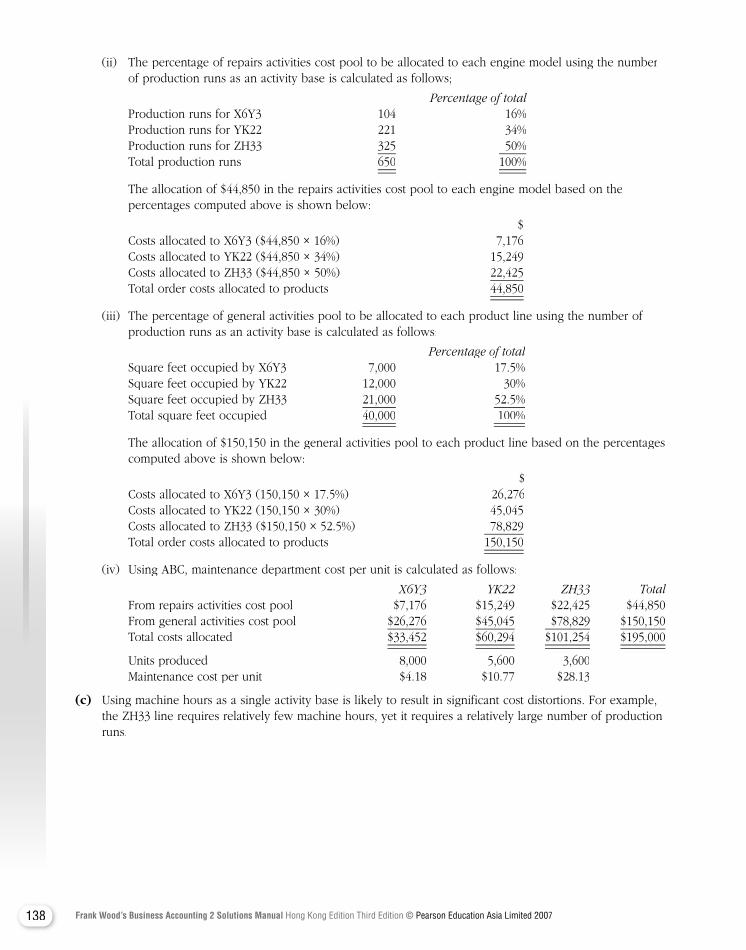
138 Frank Wood’s Business Accounting 2 Solutions Manual Hong Kong Edition Third Edition © Pearson Education Asia Limited 2007
(ii) The percentage of repairs activities cost pool to be allocated to each engine model using the number of production runs as an activity base is calculated as follows;
Percentage of total Production runs for X6Y3 104 16% Production runs for YK22 221 34% Production runs for ZH33 325 50% Total production runs 650 100%
The allocation of $44,850 in the repairs activities cost pool to each engine model based on the percentages computed above is shown below:
$ Costs allocated to X6Y3 ($44,850 × 16%) 7,176 Costs allocated to YK22 ($44,850 × 34%) 15,249 Costs allocated to ZH33 ($44,850 × 50%) 22,425 Total order costs allocated to products 44,850
(iii) The percentage of general activities pool to be allocated to each product line using the number of production runs as an activity base is calculated as follows:
Percentage of total Square feet occupied by X6Y3 7,000 17.5% Square feet occupied by YK22 12,000 30% Square feet occupied by ZH33 21,000 52.5% Total square feet occupied 40,000 100%
The allocation of $150,150 in the general activities pool to each product line based on the percentages computed above is shown below:
$ Costs allocated to X6Y3 (150,150 × 17.5%) 26,276 Costs allocated to YK22 (150,150 × 30%) 45,045 Costs allocated to ZH33 ($150,150 × 52.5%) 78,829 Total order costs allocated to products 150,150
(iv) Using ABC, maintenance department cost per unit is calculated as follows:
X6Y3 YK22 ZH33 Total From repairs activities cost pool $7,176 $15,249 $22,425 $44,850 From general activities cost pool $26,276 $45,045 $78,829 $150,150 Total costs allocated $33,452 $60,294 $101,254 $195,000
Units produced 8,000 5,600 3,600 Maintenance cost per unit $4.18 $10.77 $28.13
(c) Using machine hours as a single activity base is likely to result in significant cost distortions. For example, the ZH33 line requires relatively few machine hours, yet it requires a relatively large number of production runs.
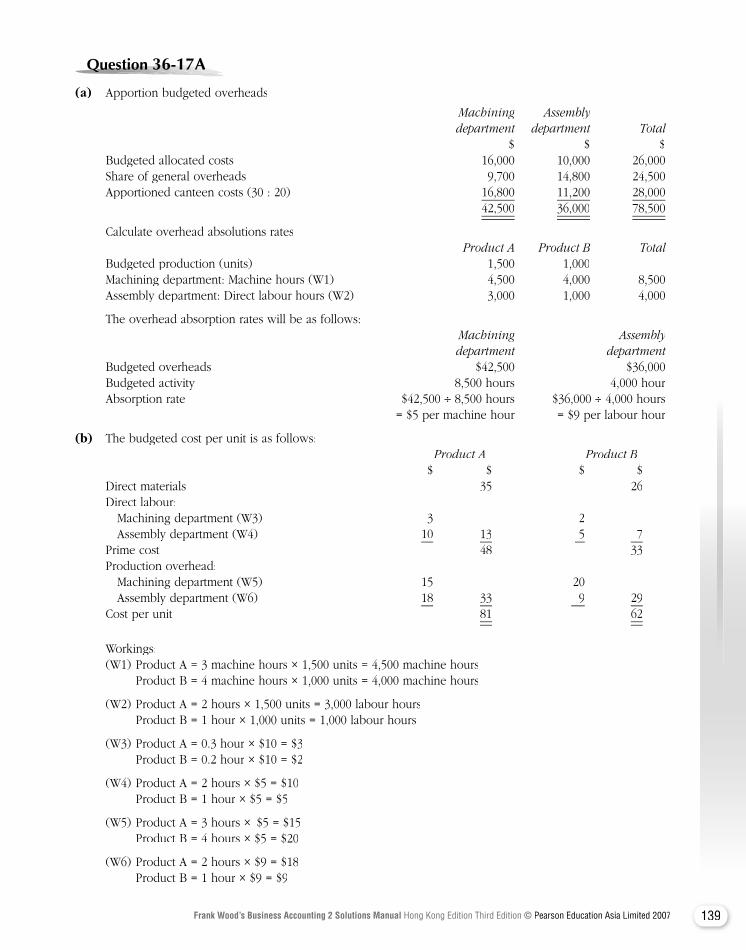
139Frank Wood’s Business Accounting 2 Solutions Manual Hong Kong Edition Third Edition © Pearson Education Asia Limited 2007
Question Question Question Question Question Question 36-17A36-17A36-17A36-17A36-17A36-17A36-17A
(a) Apportion budgeted overheads
Machining Assembly department department Total $ $ $ Budgeted allocated costs 16,000 10,000 26,000 Share of general overheads 9,700 14,800 24,500 Apportioned canteen costs (30 : 20) 16,800 11,200 28,000 42,500 36,000 78,500
Calculate overhead absolutions rates Product A Product B Total Budgeted production (units) 1,500 1,000 Machining department: Machine hours (W1) 4,500 4,000 8,500 Assembly department: Direct labour hours (W2) 3,000 1,000 4,000
The overhead absorption rates will be as follows: Machining Assembly department department Budgeted overheads $42,500 $36,000 Budgeted activity 8,500 hours 4,000 hour Absorption rate $42,500 ÷ 8,500 hours $36,000 ÷ 4,000 hours = $5 per machine hour = $9 per labour hour
(b) The budgeted cost per unit is as follows: Product A Product B $ $ $ $ Direct materials 35 26 Direct labour: Machining department (W3) 3 2 Assembly department (W4) 10 13 5 7 Prime cost 48 33 Production overhead: Machining department (W5) 15 20 Assembly department (W6) 18 33 9 29 Cost per unit 81 62
Workings: (W1) Product A = 3 machine hours × 1,500 units = 4,500 machine hours Product B = 4 machine hours × 1,000 units = 4,000 machine hours
(W2) Product A = 2 hours × 1,500 units = 3,000 labour hours Product B = 1 hour × 1,000 units = 1,000 labour hours
(W3) Product A = 0.3 hour × $10 = $3 Product B = 0.2 hour × $10 = $2
(W4) Product A = 2 hours × $5 = $10 Product B = 1 hour × $5 = $5
(W5) Product A = 3 hours × $5 = $15 Product B = 4 hours × $5 = $20
(W6) Product A = 2 hours × $9 = $18 Product B = 1 hour × $9 = $9

140 Frank Wood’s Business Accounting 2 Solutions Manual Hong Kong Edition Third Edition © Pearson Education Asia Limited 2007
Question Question Question Question Question Question Question 37-4A37-4A37-4A37-4A37-4A37-4A
Production Service departments departments P Q R S T F G $ $ $ $ $ $ $Indirect labour 15,000 21,000 9,000 18,000 12,000 20,000 18,000Other expenses 2,000 3,000 4,000 4,500 1,500 8,000 10,000 17,000 24,000 13,000 22,500 13,500 28,000 28,000Apportionment of costs:Department F 4,200 2,800 — 11,200 5,600 (28,000 ) 4,200 32,200Department G 6,440 4,830 9,660 8,050 3,220 — (32,200 ) 27,640 31,630 22,660 41,750 22,320 — —
(a) Overhead rates per direct labour hour:
Department R $22,6608,000 = $2.83
Department T $22,3205,000 = $4.46
(b) Overhead rates per machine hour:
Department P $27,6407,000 = $3.95
Department Q $31,6309,000 = $3.51
Department S $41,75014,000 = $2.98
Question Question Question Question Question Question Question 37-5A37-5A37-5A37-5A37-5A37-5A
Job Cost Sheet, Job 701, Department R
$Direct materials 345Direct labour (105 × $8) 840Factory overhead (105 × $2.83) 297.15 1,482.15
Job Cost Sheet, Job 702, Department T
$Direct materials 3,240Direct labour (540 × $10) 5,400Factory overhead (540 × $4.46) 2,408.40 11,048.40
Job Cost Sheet, Job 703, Department P
$Direct materials 1,560Direct labour (400 × $6) 2,400Factory overhead (280 × $3.95) 1,106 5,066
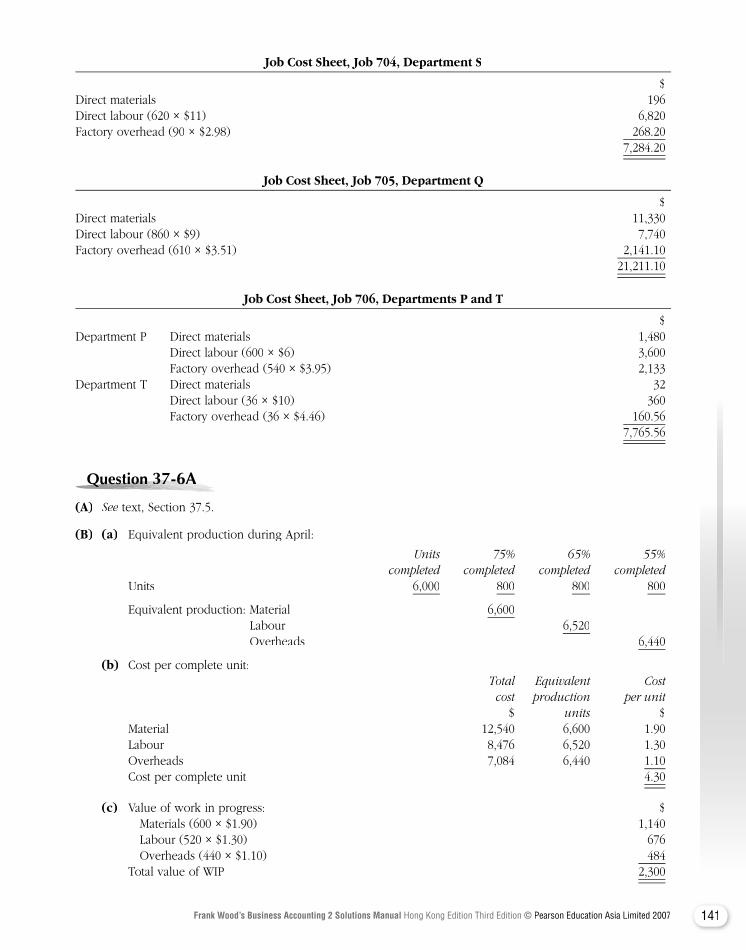
141Frank Wood’s Business Accounting 2 Solutions Manual Hong Kong Edition Third Edition © Pearson Education Asia Limited 2007
Job Cost Sheet, Job 704, Department S
$Direct materials 196Direct labour (620 × $11) 6,820Factory overhead (90 × $2.98) 268.20 7,284.20
Job Cost Sheet, Job 705, Department Q
$Direct materials 11,330Direct labour (860 × $9) 7,740Factory overhead (610 × $3.51) 2,141.10 21,211.10
Job Cost Sheet, Job 706, Departments P and T
$Department P Direct materials 1,480 Direct labour (600 × $6) 3,600 Factory overhead (540 × $3.95) 2,133Department T Direct materials 32 Direct labour (36 × $10) 360 Factory overhead (36 × $4.46) 160.56 7,765.56
Question Question Question Question Question Question Question 37-6A37-6A37-6A37-6A37-6A37-6A
(A) See text, Section 37.5.See text, Section 37.5.See
(B) (a) Equivalent production during April:
Units 75% 65% 55% completed completed completed completed Units 6,000 800 800 800
Equivalent production: Material 6,600 Labour 6,520 Overheads 6,440
(b) Cost per complete unit: Total Equivalent Cost cost production per unit $ units $units $units Material 12,540 6,600 1.90 Labour 8,476 6,520 1.30 Overheads 7,084 6,440 1.10 Cost per complete unit 4.30
(c) Value of work in progress: $ Materials (600 × $1.90) 1,140 Labour (520 × $1.30) 676 Overheads (440 × $1.10) 484 Total value of WIP 2,300
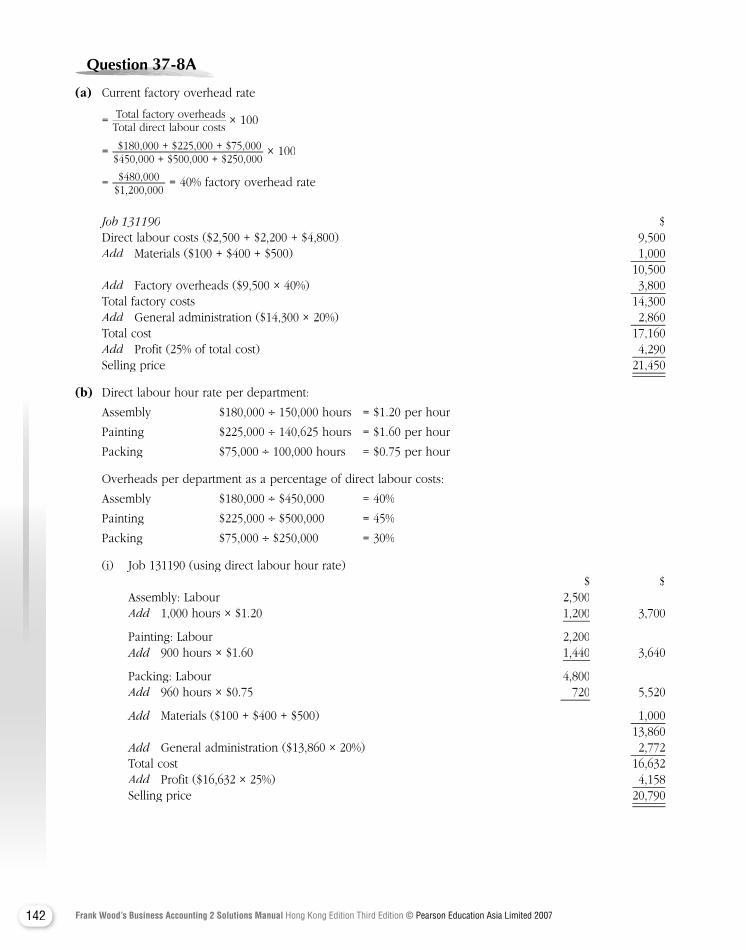
142 Frank Wood’s Business Accounting 2 Solutions Manual Hong Kong Edition Third Edition © Pearson Education Asia Limited 2007
Question Question Question Question Question Question Question 37-8A37-8A37-8A37-8A37-8A37-8A
(a) Current factory overhead rate
= Total factory overheads Total factory overheadsTotal direct labour costs
× 100
= $180,000 + $225,000 + $75,000$450,000 + $500,000 + $250,000
× 100
= $480,000$1,200,000
= 40% factory overhead rate
Job 131190 $Job 131190 $Job 131190 Direct labour costs ($2,500 + $2,200 + $4,800) 9,500
Add Materials ($100 + $400 + $500) Add Materials ($100 + $400 + $500) Add 1,000 10,500
Add Factory overheads ($9,500 Add Factory overheads ($9,500 Add × 40%) 3,800 Total factory costs 14,300
Add General administration ($14,300 Add General administration ($14,300 Add × 20%) 2,860 Total cost 17,160
Add Profit (25% of total cost) 4,290Add Profit (25% of total cost) 4,290Add Selling price 21,450
(b) Direct labour hour rate per department:
Assembly $180,000 ÷ 150,000 hours = $1.20 per hour
Painting $225,000 ÷ 140,625 hours = $1.60 per hour
Packing $75,000 ÷ 100,000 hours = $0.75 per hour
Overheads per department as a percentage of direct labour costs:
Assembly $180,000 ÷ $450,000 = 40%
Painting $225,000 ÷ $500,000 = 45%
Packing $75,000 ÷ $250,000 = 30%
(i) Job 131190 (using direct labour hour rate) $ $ Assembly: Labour 2,500 Add 1,000 hours Add 1,000 hours Add × $1.20 1,200 3,700
Painting: Labour 2,200 Add 900 hours Add 900 hours Add × $1.60 1,440 3,640
Packing: Labour 4,800 Add 960 hours Add 960 hours Add × $0.75 720 5,520
Add Materials ($100 + $400 + $500) Add Materials ($100 + $400 + $500) Add 1,000 13,860 Add General administration ($13,860 Add General administration ($13,860 Add × 20%) 2,772 Total cost 16,632 Add Profit ($16,632 Add Profit ($16,632 Add × 25%) 4,158 Selling price 20,790

143Frank Wood’s Business Accounting 2 Solutions Manual Hong Kong Edition Third Edition © Pearson Education Asia Limited 2007
(ii) Job 131190 (using percentage direct labour costs) $ $ Assembly: Labour 2,500 Add 40% Add 40% Add 1,000 3,500 Painting: Labour 2,200 Add 45% Add 45% Add 990 3,190 Packing: Labour 4,800 Add 30% Add 30% Add 1,440 6,240 12,930 Add General administration ($12,930 Add General administration ($12,930 Add × 20%) 2,586 Total cost 15,516 Add Profit ($15,516 Add Profit ($15,516 Add × 25%) 3,879 Selling price 19,395
(c) It depends on where there are direct relationships to overheads. The number of hours worked method is more appropriate in (b) (i) and (ii). However, the machine hours method for its two departments has not yet been investigated.
(d) There is no set answer. Basically, the absorption rate may be too high, making for an uncompetitive selling price; or too low, making the product too cheap and uneconomic.
Question Question Question Question Question Question Question 37-10A37-10A37-10A37-10A37-10A37-10A
(a) A B C Total $ $ $ $ Power 55 : 30 : 15 66,000 36,000 18,000 120,000 Rent, etc. 30 : 20 : 10 45,000 30,000 15,000 90,000 Insurance 22 : 16 : 2 11,000 8,000 1,000 20,000 Depreciation 22 : 16 : 2 44,000 32,000 4,000 80,000 Indirect materials 23,000 35,000 57,000 115,000 Indirect wages 21,000 34,000 55,000 110,000 210,000 175,000 150,000 535,000
Direct wages 140,000 200,000 125,000
Percentage absorption rate 150% 87.5% 120%
(b) Selling price of Job No 347 $ $ Dept A Materials 152 Direct wages 88 Overhead (150% of $88) 132 372
Dept B Materials 85 Direct wages 192 Overhead (87.5% of $192) 168 445
Dept C Materials 52 Direct wages 105 Overhead (120% of $105) 126 283 Total production cost 1,100
Add 30% 330Add 30% 330Add Selling price 1,430
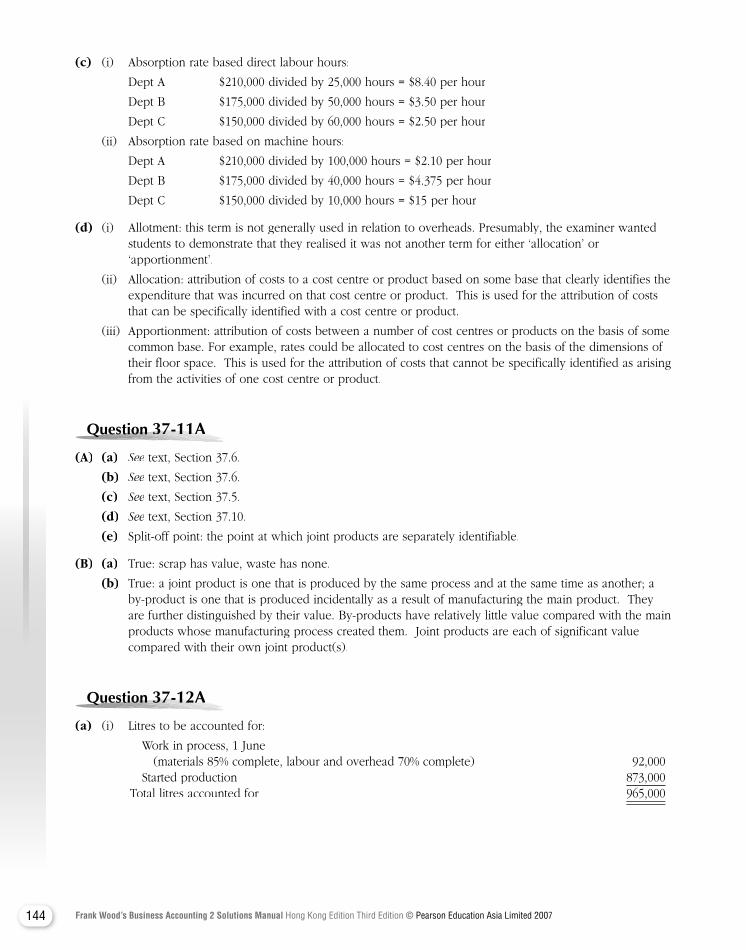
144 Frank Wood’s Business Accounting 2 Solutions Manual Hong Kong Edition Third Edition © Pearson Education Asia Limited 2007
(c) (i) Absorption rate based direct labour hours:
Dept A $210,000 divided by 25,000 hours = $8.40 per hour
Dept B $175,000 divided by 50,000 hours = $3.50 per hour
Dept C $150,000 divided by 60,000 hours = $2.50 per hour
(ii) Absorption rate based on machine hours:
Dept A $210,000 divided by 100,000 hours = $2.10 per hour
Dept B $175,000 divided by 40,000 hours = $4.375 per hour
Dept C $150,000 divided by 10,000 hours = $15 per hour
(d) (i) Allotment: this term is not generally used in relation to overheads. Presumably, the examiner wanted students to demonstrate that they realised it was not another term for either ‘allocation’ or ‘apportionment’.
(ii) Allocation: attribution of costs to a cost centre or product based on some base that clearly identifies the expenditure that was incurred on that cost centre or product. This is used for the attribution of costs that can be specifically identified with a cost centre or product.
(iii) Apportionment: attribution of costs between a number of cost centres or products on the basis of some common base. For example, rates could be allocated to cost centres on the basis of the dimensions of their floor space. This is used for the attribution of costs that cannot be specifically identified as arising from the activities of one cost centre or product.
Question Question Question Question Question Question 37-11A37-11A37-11A37-11A37-11A37-11A
(A) (a) See text, Section 37.6.See text, Section 37.6.See
(b) See text, Section 37.6.See text, Section 37.6.See
(c) See text, Section 37.5.See text, Section 37.5.See
(d) See text, Section 37.10.See text, Section 37.10.See
(e) Split-off point: the point at which joint products are separately identifiable.
(B) (a) True: scrap has value, waste has none.
(b) True: a joint product is one that is produced by the same process and at the same time as another; a by-product is one that is produced incidentally as a result of manufacturing the main product. They are further distinguished by their value. By-products have relatively little value compared with the main products whose manufacturing process created them. Joint products are each of significant value compared with their own joint product(s).
Question Question Question Question Question Question 37-12A37-12A37-12A37-12A37-12A37-12A
(a) (i) Litres to be accounted for:
Work in process, 1 June (materials 85% complete, labour and overhead 70% complete) 92,000 Started production 873,000 Total litres accounted for 965,000
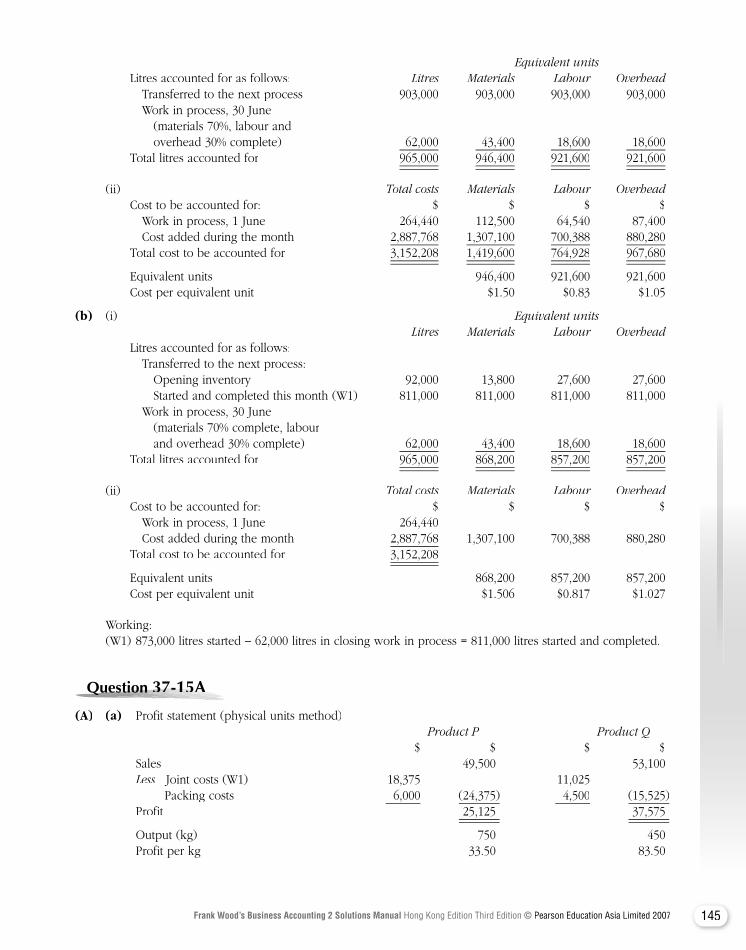
145Frank Wood’s Business Accounting 2 Solutions Manual Hong Kong Edition Third Edition © Pearson Education Asia Limited 2007
Equivalent units Equivalent units Litres accounted for as follows: Litres Materials Labour Overhead Transferred to the next process 903,000 903,000 903,000 903,000 Work in process, 30 June (materials 70%, labour and overhead 30% complete) 62,000 43,400 18,600 18,600 Total litres accounted for 965,000 946,400 921,600 921,600
(ii) Total costs Materials Labour Overhead Cost to be accounted for: $ $ $ $ Work in process, 1 June 264,440 112,500 64,540 87,400 Cost added during the month 2,887,768 1,307,100 700,388 880,280 Total cost to be accounted for 3,152,208 1,419,600 764,928 967,680
Equivalent units 946,400 921,600 921,600 Cost per equivalent unit $1.50 $0.83 $1.05
(b) (i) Equivalent units (i) Equivalent units (i) Litres Materials Labour Overhead Litres accounted for as follows: Transferred to the next process: Opening inventory 92,000 13,800 27,600 27,600 Started and completed this month (W1) 811,000 811,000 811,000 811,000 Work in process, 30 June (materials 70% complete, labour and overhead 30% complete) 62,000 43,400 18,600 18,600 Total litres accounted for 965,000 868,200 857,200 857,200
(ii) Total costs Materials Labour Overhead Cost to be accounted for: $ $ $ $ Work in process, 1 June 264,440 Cost added during the month 2,887,768 1,307,100 700,388 880,280 Total cost to be accounted for 3,152,208
Equivalent units 868,200 857,200 857,200 Cost per equivalent unit $1.506 $0.817 $1.027
Working:(W1) 873,000 litres started − 62,000 litres in closing work in process = 811,000 litres started and completed.
Question Question Question Question Question Question 37-15A37-15A37-15A37-15A37-15A37-15A37-15A
(A) (a) Profit statement (physical units method) Product P Product Q $ $ $ $Sales 49,500 53,100Less Joint costs (W1) 18,375 11,025 Less Joint costs (W1) 18,375 11,025 Less Packing costs 6,000 (24,375 ) 4,500 (15,525 )Profit 25,125 37,575
Output (kg) 750 450Profit per kg 33.50 83.50
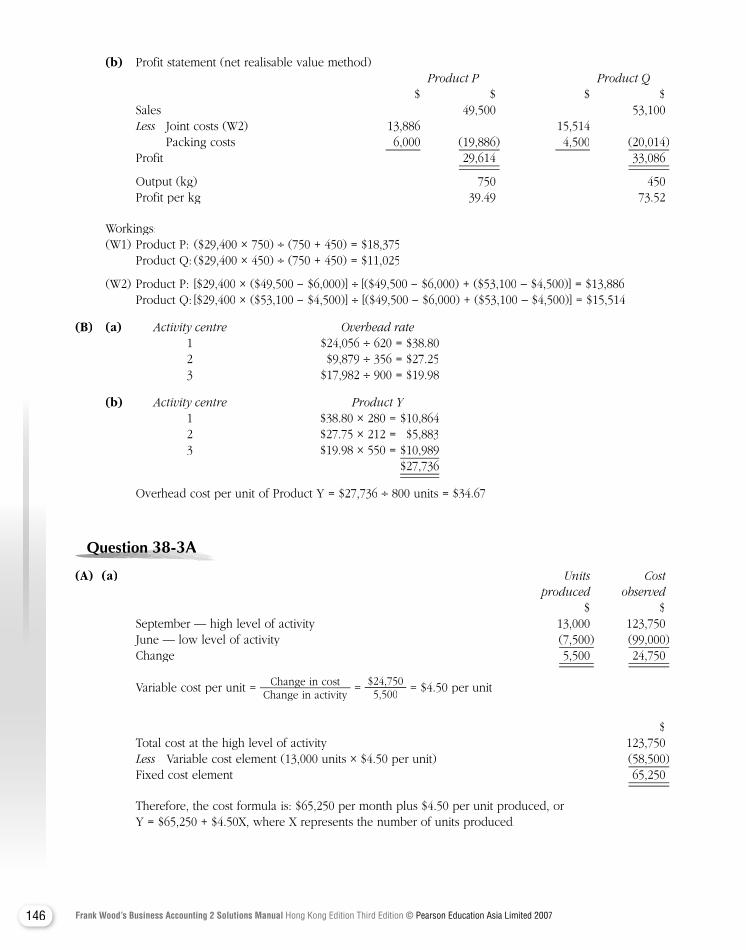
146 Frank Wood’s Business Accounting 2 Solutions Manual Hong Kong Edition Third Edition © Pearson Education Asia Limited 2007
(b) Profit statement (net realisable value method) Product P Product Q $ $ $ $
Sales 49,500 53,100Less Joint costs (W2) 13,886 15,514 Less Joint costs (W2) 13,886 15,514 Less
Packing costs 6,000 (19,886 ) 4,500 (20,014 ) Profit 29,614 33,086
Output (kg) 750 450 Profit per kg 39.49 73.52
Workings: (W1) Product P: ($29,400 × 750) ÷ (750 + 450) = $18,375 Product Q: ($29,400 × 450) ÷ (750 + 450) = $11,025
(W2) Product P: [$29,400 × ($49,500 − $6,000)] ÷ [($49,500 − $6,000) + ($53,100 − $4,500)] = $13,886 Product Q: [$29,400 × ($53,100 − $4,500)] ÷ [($49,500 − $6,000) + ($53,100 − $4,500)] = $15,514
(B) (a) Activity centre Overhead rate 1 $24,056 ÷ 620 = $38.80 2 $9,879 ÷ 356 = $27.25 3 $17,982 ÷ 900 = $19.98
(b) Activity centre Product Y Activity centre Product Y Activity centre Product Y 1 $38.80 × 280 = $10,864 2 $27.75 × 212 = $5,883 3 $19.98 × 550 = $10,989 $27,736
Overhead cost per unit of Product Y = $27,736 ÷ 800 units = $34.67
Question Question Question Question Question Question Question 38-3A38-3A38-3A38-3A38-3A38-3A
(A) (a) Units Cost produced observed $ $ September — high level of activity 13,000 123,750 June — low level of activity (7,500 ) (99,000 ) Change 5,500 24,750
Variable cost per unit = Change in costChange in costChange in activity
= $24,7505,500
= $4.50 per unit
$ Total cost at the high level of activity 123,750 Less Variable cost element (13,000 units × $4.50 per unit) (58,500 )Less Variable cost element (13,000 units × $4.50 per unit) (58,500 )Less Fixed cost element 65,250
Therefore, the cost formula is: $65,250 per month plus $4.50 per unit produced, or Y = $65,250 + $4.50 X, where X represents the number of units produced.
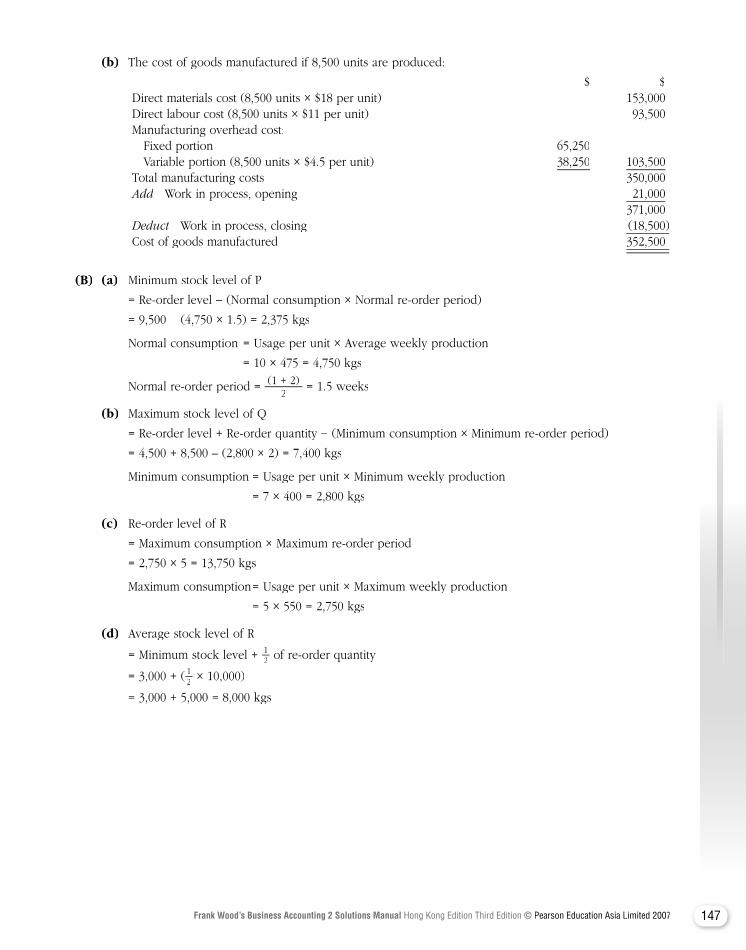
147Frank Wood’s Business Accounting 2 Solutions Manual Hong Kong Edition Third Edition © Pearson Education Asia Limited 2007
(b) The cost of goods manufactured if 8,500 units are produced:
$ $ Direct materials cost (8,500 units × $18 per unit) 153,000 Direct labour cost (8,500 units × $11 per unit) 93,500 Manufacturing overhead cost: Fixed portion 65,250 Variable portion (8,500 units × $4.5 per unit) 38,250 103,500 Total manufacturing costs 350,000 Add Work in process, opening 21,000Add Work in process, opening 21,000Add 371,000 Deduct Work in process, closing (18,500 )Deduct Work in process, closing (18,500 )Deduct Cost of goods manufactured 352,500
(B) (a) Minimum stock level of P
= Re-order level − (Normal consumption × Normal re-order period)
= 9,500 − (4,750 × 1.5) = 2,375 kgs
Normal consumption = Usage per unit × Average weekly production
= 10 × 475 = 4,750 kgs
Normal re-order period = (1 + 2)2
= 1.5 weeks
(b) Maximum stock level of Q
= Re-order level + Re-order quantity − (Minimum consumption × Minimum re-order period)
= 4,500 + 8,500 – (2,800 × 2) = 7,400 kgs
Minimum consumption = Usage per unit × Minimum weekly production
= 7 × 400 = 2,800 kgs
(c) Re-order level of R
= Maximum consumption × Maximum re-order period
= 2,750 × 5 = 13,750 kgs
Maximum consumption = Usage per unit × Maximum weekly production
= 5 × 550 = 2,750 kgs
(d) Average stock level of R
= Minimum stock level + 12 of re-order quantity
= 3,000 + ( 12 × 10,000)
= 3,000 + 5,000 = 8,000 kgs
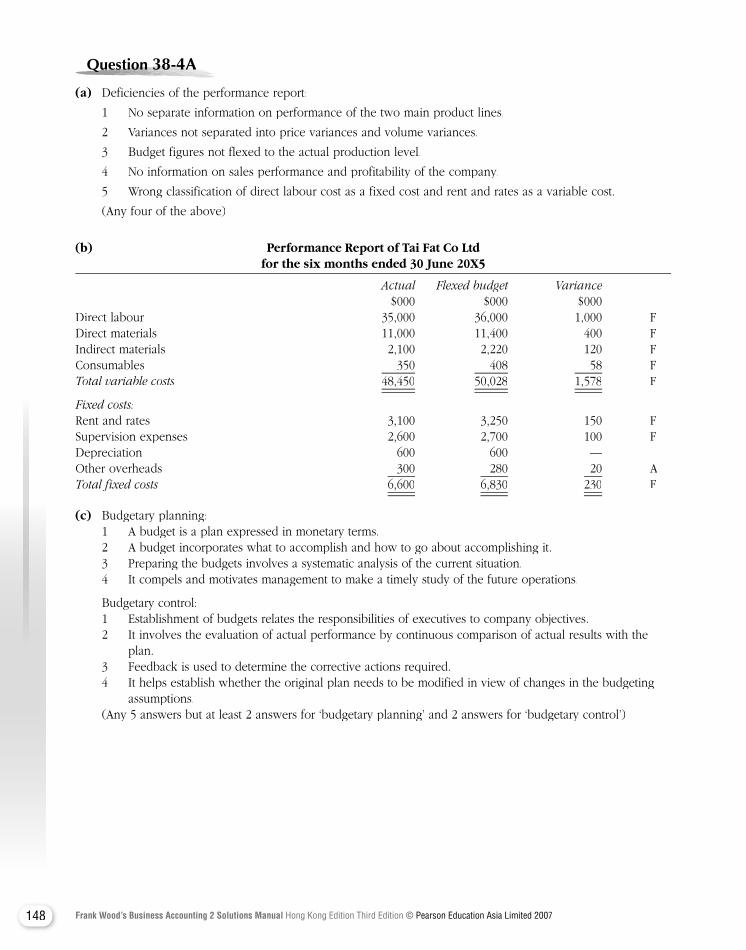
148 Frank Wood’s Business Accounting 2 Solutions Manual Hong Kong Edition Third Edition © Pearson Education Asia Limited 2007
Question Question Question Question Question Question Question 38-4A38-4A38-4A38-4A38-4A38-4A
(a) Deficiencies of the performance report:
1 No separate information on performance of the two main product lines.
2 Variances not separated into price variances and volume variances.
3 Budget figures not flexed to the actual production level.
4 No information on sales performance and profitability of the company.
5 Wrong classification of direct labour cost as a fixed cost and rent and rates as a variable cost.
(Any four of the above)
(b) Performance Report of Tai Fat Co Ltd for the six months ended 30 June 20X5
Actual Flexed budget Variance$000 $000 $000
Direct labour 35,000 36,000 1,000 FDirect materials 11,000 11,400 400 FIndirect materials 2,100 2,220 120 FConsumables 350 408 58 FTotal variable costs 48,450 50,028 1,578 F
Fixed costs:Rent and rates 3,100 3,250 150 FSupervision expenses 2,600 2,700 100 F Depreciation 600 600 — Other overheads 300 280 20 ATotal fixed costs 6,600 6,830 230 F
(c) Budgetary planning: 1 A budget is a plan expressed in monetary terms. 2 A budget incorporates what to accomplish and how to go about accomplishing it. 3 Preparing the budgets involves a systematic analysis of the current situation. 4 It compels and motivates management to make a timely study of the future operations.
Budgetary control:1 Establishment of budgets relates the responsibilities of executives to company objectives.2 It involves the evaluation of actual performance by continuous comparison of actual results with the
plan.3 Feedback is used to determine the corrective actions required.4 It helps establish whether the original plan needs to be modified in view of changes in the budgeting
assumptions. (Any 5 answers but at least 2 answers for ‘budgetary planning’ and 2 answers for ‘budgetary control’)
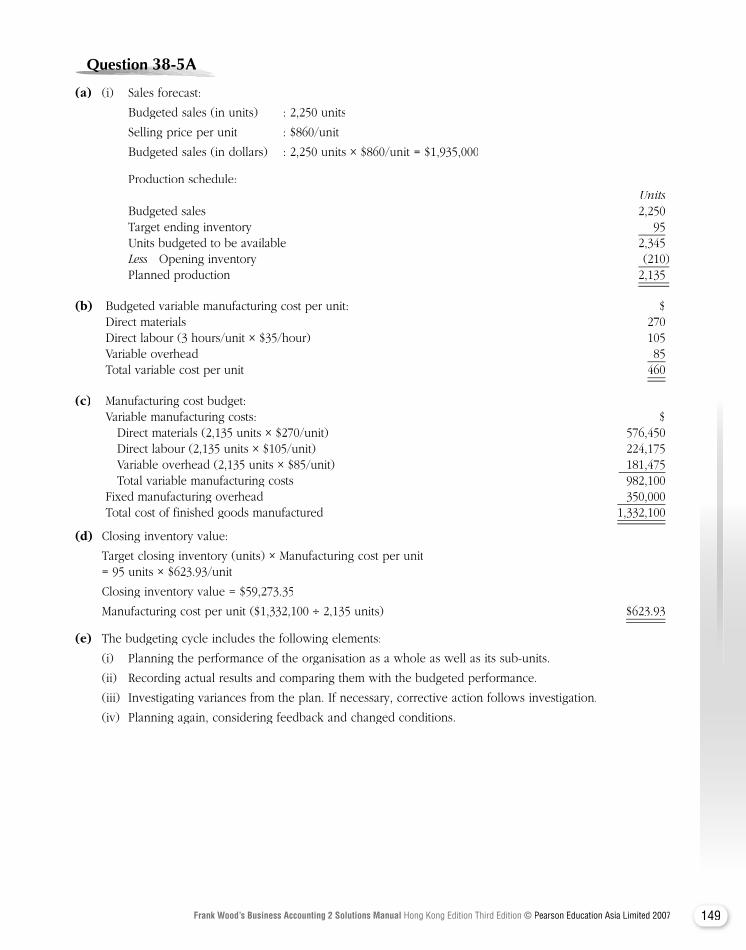
149Frank Wood’s Business Accounting 2 Solutions Manual Hong Kong Edition Third Edition © Pearson Education Asia Limited 2007
Question Question Question Question Question Question Question 38-5A38-5A38-5A38-5A38-5A38-5A
(a) (i) Sales forecast:
Budgeted sales (in units) : 2,250 units
Selling price per unit : $860/unit
Budgeted sales (in dollars) : 2,250 units × $860/unit = $1,935,000
Production schedule: Units Budgeted sales 2,250 Target ending inventory 95 Units budgeted to be available 2,345 Less Opening inventory (210 )Less Opening inventory (210 )Less Planned production 2,135
(b) Budgeted variable manufacturing cost per unit: $ Direct materials 270 Direct labour (3 hours/unit × $35/hour) 105 Variable overhead 85 Total variable cost per unit 460
(c) Manufacturing cost budget: Variable manufacturing costs: $ Direct materials (2,135 units × $270/unit) 576,450 Direct labour (2,135 units × $105/unit) 224,175 Variable overhead (2,135 units × $85/unit) 181,475 Total variable manufacturing costs 982,100 Fixed manufacturing overhead 350,000 Total cost of finished goods manufactured 1,332,100
(d) Closing inventory value:
Target closing inventory (units) × Manufacturing cost per unit = 95 units × $623.93/unit
Closing inventory value = $59,273.35
Manufacturing cost per unit ($1,332,100 ÷ 2,135 units) $623.93
(e) The budgeting cycle includes the following elements:
(i) Planning the performance of the organisation as a whole as well as its sub-units.
(ii) Recording actual results and comparing them with the budgeted performance.
(iii) Investigating variances from the plan. If necessary, corrective action follows investigation.
(iv) Planning again, considering feedback and changed conditions.
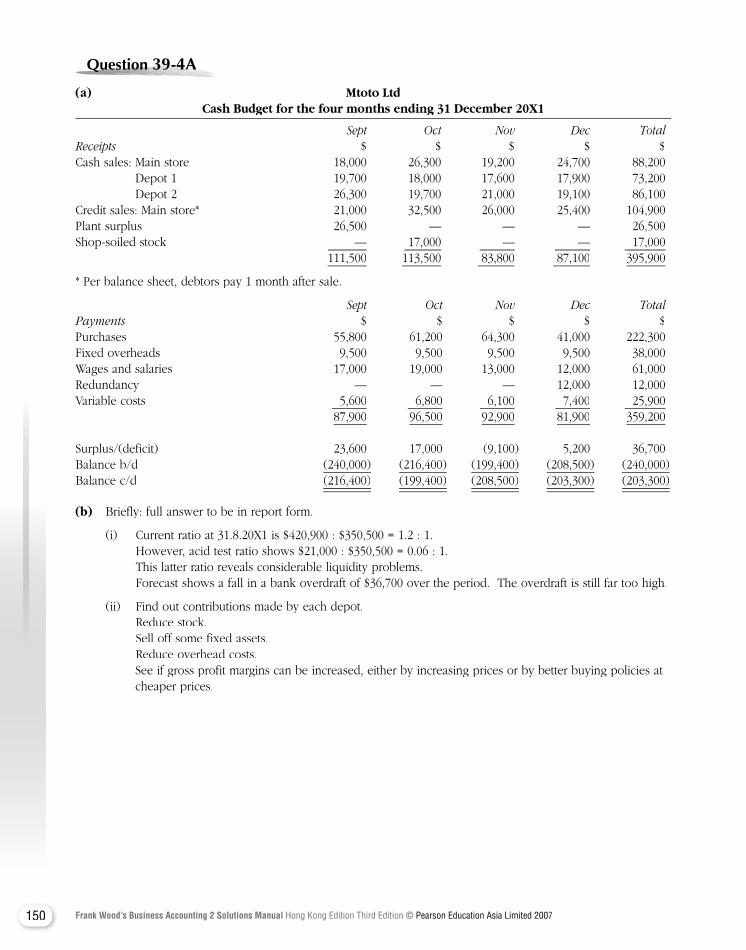
150 Frank Wood’s Business Accounting 2 Solutions Manual Hong Kong Edition Third Edition © Pearson Education Asia Limited 2007
Question Question Question Question Question Question Question 39-4A39-4A39-4A39-4A39-4A39-4A
(a) Mtoto Ltd Cash Budget for the four months ending 31 December 20X1
Sept Oct Nov Dec TotalReceipts $ $ $ $ $Receipts $ $ $ $ $ReceiptsCash sales: Main store 18,000 26,300 19,200 24,700 88,200 Depot 1 19,700 18,000 17,600 17,900 73,200 Depot 2 26,300 19,700 21,000 19,100 86,100Credit sales: Main store* 21,000 32,500 26,000 25,400 104,900Plant surplus 26,500 — — — 26,500Shop-soiled stock — — — 17,000 — — — — 17,000 111,500 113,500 83,800 87,100 395,900
* Per balance sheet, debtors pay 1 month after sale.
Sept Oct Nov Dec TotalPayments $ $ $ $ $Payments $ $ $ $ $PaymentsPurchases 55,800 61,200 64,300 41,000 222,300Fixed overheads 9,500 9,500 9,500 9,500 38,000Wages and salaries 17,000 19,000 13,000 12,000 61,000Redundancy — — — 12,000 12,000Variable costs 5,600 6,800 6,100 7,400 25,900 87,900 96,500 92,900 81,900 359,200 Surplus/(deficit) 23,600 17,000 (9,100) 5,200 36,700Balance b/d (240,000) (216,400) (199,400) (208,500) (240,000)Balance c/d (216,400) (199,400) (208,500) (203,300) (203,300)
(b) Briefly: full answer to be in report form.
(i) Current ratio at 31.8.20X1 is $420,900 : $350,500 = 1.2 : 1. However, acid test ratio shows $21,000 : $350,500 = 0.06 : 1. This latter ratio reveals considerable liquidity problems. Forecast shows a fall in a bank overdraft of $36,700 over the period. The overdraft is still far too high.
(ii) Find out contributions made by each depot. Reduce stock. Sell off some fixed assets. Reduce overhead costs. See if gross profit margins can be increased, either by increasing prices or by better buying policies at
cheaper prices.
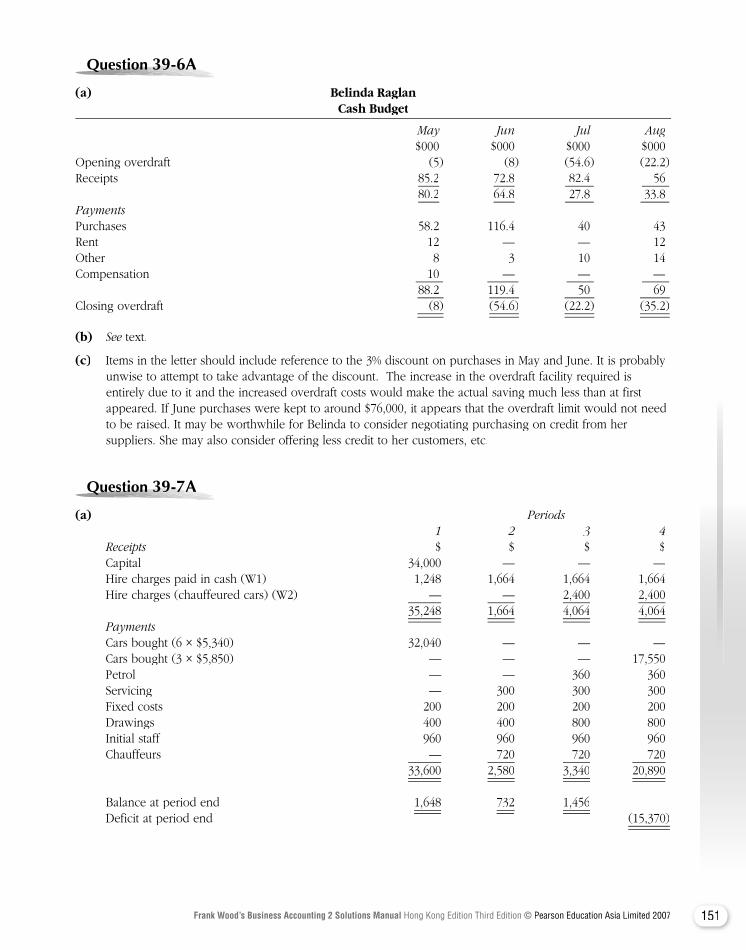
151Frank Wood’s Business Accounting 2 Solutions Manual Hong Kong Edition Third Edition © Pearson Education Asia Limited 2007
Question Question Question Question Question Question Question 39-6A39-6A39-6A39-6A39-6A39-6A
(a) Belinda Raglan Cash Budget
May Jun Jul Aug $000 $000 $000 $000Opening overdraft (5 ) (8 ) (54.6 ) (22.2 )Receipts 85.2 72.8 82.4 56 80.2 64.8 27.8 33.8 PaymentsPurchases 58.2 116.4 40 43Rent 12 — — 12Other 8 3 10 14Compensation 10 — — — 88.2 119.4 50 69Closing overdraft (8 ) (54.6 ) (22.2 ) (35.2 )
(b) See text.See text.See
(c) Items in the letter should include reference to the 3% discount on purchases in May and June. It is probably unwise to attempt to take advantage of the discount. The increase in the overdraft facility required is entirely due to it and the increased overdraft costs would make the actual saving much less than at first appeared. If June purchases were kept to around $76,000, it appears that the overdraft limit would not need to be raised. It may be worthwhile for Belinda to consider negotiating purchasing on credit from her suppliers. She may also consider offering less credit to her customers, etc.
Question Question Question Question Question Question Question 39-7A39-7A39-7A39-7A39-7A39-7A
(a) Periods 1 2 3 4 Receipts $ $ $ $ Receipts $ $ $ $ Receipts Capital 34,000 — — — Hire charges paid in cash (W1) 1,248 1,664 1,664 1,664 Hire charges (chauffeured cars) (W2) — — 2,400 2,400 35,248 1,664 4,064 4,064
Payments Cars bought (6 × $5,340) 32,040 — — — Cars bought (3 × $5,850) — — — 17,550 Petrol — — 360 360 Servicing — 300 300 300 Fixed costs 200 200 200 200 Drawings 400 400 800 800 Initial staff 960 960 960 960 Chauffeurs — 720 720 720 33,600 2,580 3,340 20,890 Balance at period end 1,648 732 1,456 Deficit at period end Deficit at period end Deficit at period end Deficit at period end (15,370)
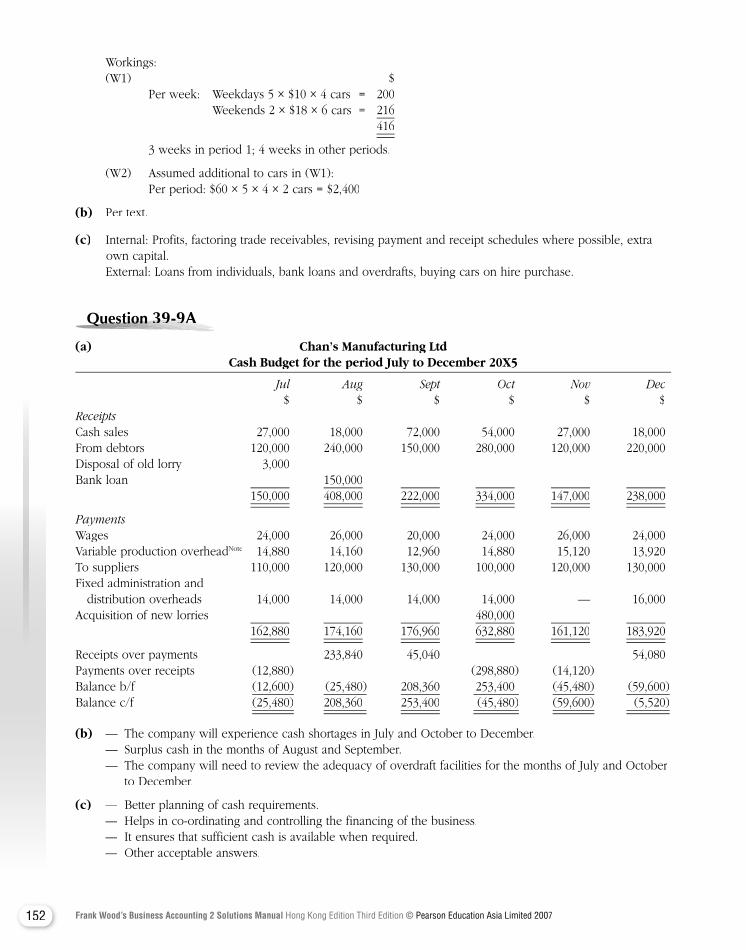
152 Frank Wood’s Business Accounting 2 Solutions Manual Hong Kong Edition Third Edition © Pearson Education Asia Limited 2007
Workings: (W1) $ Per week: Weekdays 5 × $10 × 4 cars = 200 Weekends 2 × $18 × 6 cars = 216 416
3 weeks in period 1; 4 weeks in other periods.
(W2) Assumed additional to cars in (W1): Per period: $60 × 5 × 4 × 2 cars = $2,400
(b) Per text.
(c) Internal: Profits, factoring trade receivables, revising payment and receipt schedules where possible, extra own capital.
External: Loans from individuals, bank loans and overdrafts, buying cars on hire purchase.
Question Question Question Question Question Question Question 39-9A39-9A39-9A39-9A39-9A39-9A
(a) Chan’s Manufacturing Ltd Cash Budget for the period July to December 20X5
Jul Aug Sept Oct Nov Dec $ $ $ $ $ $ReceiptsCash sales 27,000 18,000 72,000 54,000 27,000 18,000From debtors 120,000 240,000 150,000 280,000 120,000 220,000Disposal of old lorry 3,000Bank loan 150,000 150,000 408,000 222,000 334,000 147,000 238,000
PaymentsWages 24,000 26,000 20,000 24,000 26,000 24,000Variable production overheadNote 14,880 14,160 12,960 14,880 15,120 13,920To suppliers 110,000 120,000 130,000 100,000 120,000 130,000Fixed administration and distribution overheads 14,000 14,000 14,000 14,000 — 16,000Acquisition of new lorries 480,000 162,880 174,160 176,960 632,880 161,120 183,920
Receipts over payments 233,840 45,040 54,080Payments over receipts (12,880) (298,880) (14,120)Balance b/f (12,600) (25,480) 208,360 253,400 (45,480) (59,600)Balance c/f (25,480) 208,360 253,400 (45,480) (59,600) (5,520)
(b) — The company will experience cash shortages in July and October to December. — Surplus cash in the months of August and September. — The company will need to review the adequacy of overdraft facilities for the months of July and October
to December.
(c) — Better planning of cash requirements. — Helps in co-ordinating and controlling the financing of the business. — It ensures that sufficient cash is available when required. — Other acceptable answers.
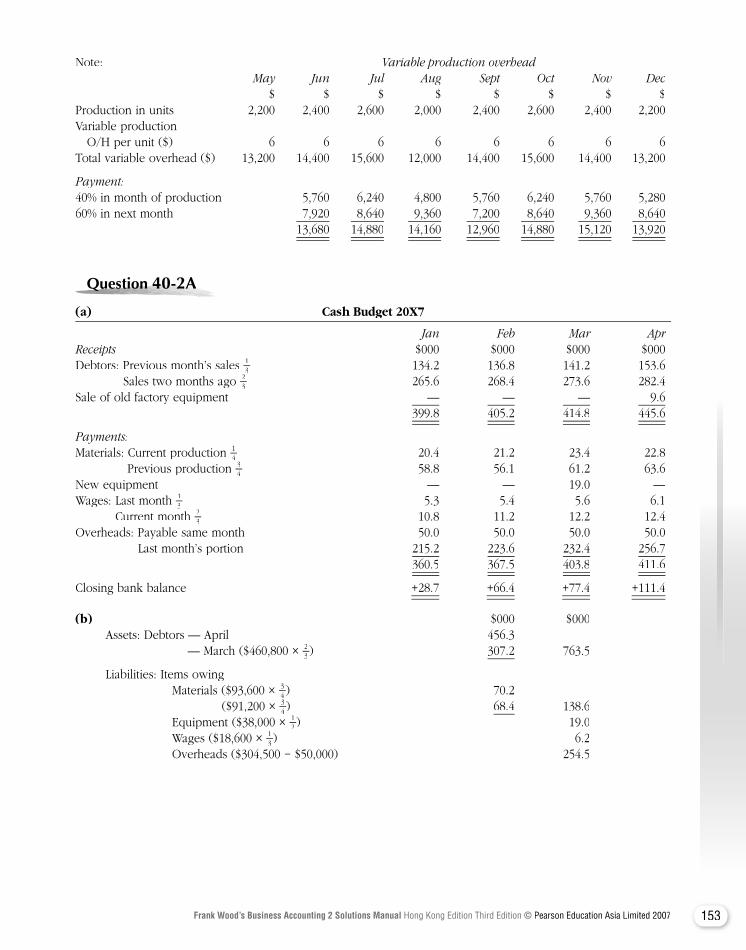
153Frank Wood’s Business Accounting 2 Solutions Manual Hong Kong Edition Third Edition © Pearson Education Asia Limited 2007
Note: Variable production overhead May Jun Jul Aug Sept Oct Nov Dec $ $ $ $ $ $ $ $Production in units 2,200 2,400 2,600 2,000 2,400 2,600 2,400 2,200Variable production O/H per unit ($) 6 6 6 6 6 6 6 6Total variable overhead ($) 13,200 14,400 15,600 12,000 14,400 15,600 14,400 13,200
Payment:40% in month of production 5,760 6,240 4,800 5,760 6,240 5,760 5,28060% in next month 7,920 8,640 9,360 7,200 8,640 9,360 8,640 13,680 14,880 14,160 12,960 14,880 15,120 13,920
Question Question Question Question Question Question Question 40-2A40-2A40-2A40-2A40-2A40-2A
(a) Cash Budget 20X7
Jan Feb Mar AprReceipts $000 $000 $000 $000Receipts $000 $000 $000 $000ReceiptsDebtors: Previous month’s sales 1
3 134.2 136.8 141.2 153.6 Sales two months ago 2
3 265.6 268.4 273.6 282.4Sale of old factory equipment — — — 9.6 399.8 405.2 414.8 445.6
Payments:Materials: Current production 1
4 20.4 21.2 23.4 22.8 Previous production 3
4 58.8 56.1 61.2 63.6New equipment — — 19.0 —Wages: Last month 1
3 5.3 5.4 5.6 6.1 Current month 2
3 10.8 11.2 12.2 12.4Overheads: Payable same month 50.0 50.0 50.0 50.0 Last month’s portion 215.2 223.6 232.4 256.7 360.5 367.5 403.8 411.6
Closing bank balance +28.7 +66.4 +77.4 +111.4
(b) $000 $000 Assets: Debtors — April 456.3 — March ($460,800 × 2
3 ) 307.2 763.5
Liabilities: Items owing Materials ($93,600 × 3
4 ) 70.2 ($91,200 × 3
4 ) 68.4 138.6 Equipment ($38,000 × 1
2 ) 19.0 Wages ($18,600 × 1
3 ) 6.2 Overheads ($304,500 − $50,000) 254.5
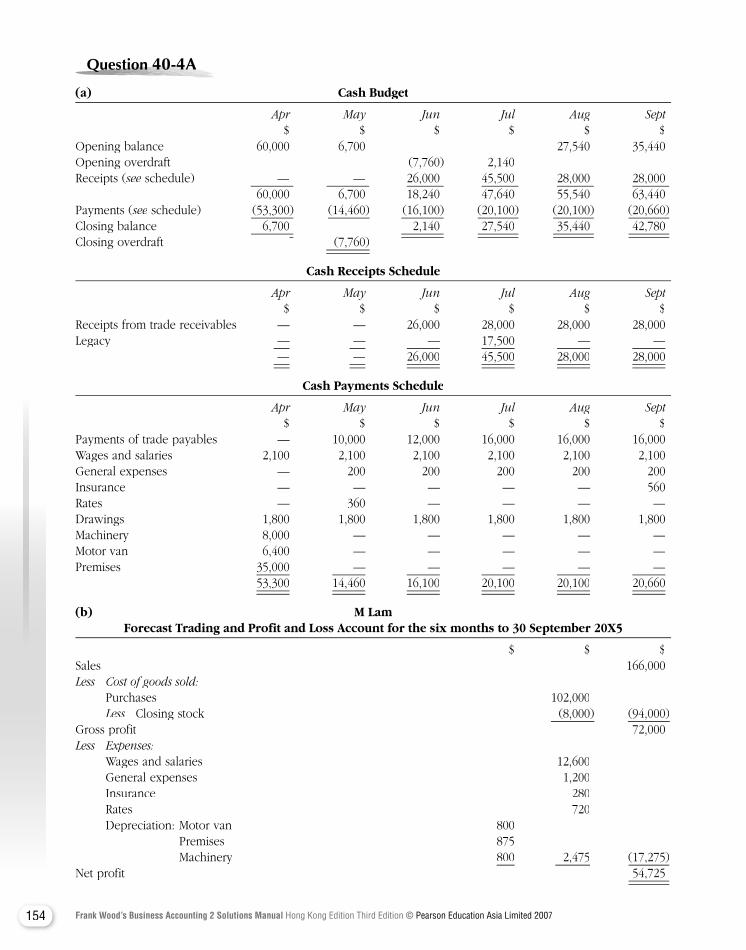
154 Frank Wood’s Business Accounting 2 Solutions Manual Hong Kong Edition Third Edition © Pearson Education Asia Limited 2007
Question Question Question Question Question Question Question 40-4A40-4A40-4A40-4A40-4A40-4A
(a) Cash Budget
Apr May Jun Jul Aug Sept $ $ $ $ $ $Opening balance 60,000 6,700 27,540 35,440Opening overdraft (7,760) 2,140Receipts (see schedule) see schedule) see — — 26,000 45,500 28,000 28,000 60,000 6,700 18,240 47,640 55,540 63,440Payments (see schedule) (53,300) see schedule) (53,300) see (14,460) (16,100) (20,100) (20,100) (20,660)Closing balance 6,700 2,140 27,540 35,440 42,780 Closing overdraft Closing overdraft (7,760)
Cash Receipts Schedule
Apr May Jun Jul Aug Sept $ $ $ $ $ $Receipts from trade receivables — — 26,000 28,000 28,000 28,000Legacy — — — 17,500 — —
— — 26,000 45,500 28,000 28,000
Cash Payments Schedule
Apr May Jun Jul Aug Sept $ $ $ $ $ $Payments of trade payables — 10,000 12,000 16,000 16,000 16,000Wages and salaries 2,100 2,100 2,100 2,100 2,100 2,100General expenses — 200 200 200 200 200Insurance — — — — — 560Rates — 360 — — — —Drawings 1,800 1,800 1,800 1,800 1,800 1,800Machinery 8,000 — — — — —Motor van 6,400 — — — — —Premises 35,000 — — — — —
53,300 14,460 16,100 20,100 20,100 20,660
(b) M Lam Forecast Trading and Profit and Loss Account for the six months to 30 September 20X5
$ $ $Sales 166,000Less Cost of goods sold:
Purchases 102,000Less Closing stock (8,000) (94,000)
Gross profit 72,000Less Expenses:
Wages and salaries 12,600 General expenses 1,200 Insurance 280 Rates 720 Depreciation: Motor van 800 Premises 875 Machinery 800 2,475 (17,275)Net profit 54,725
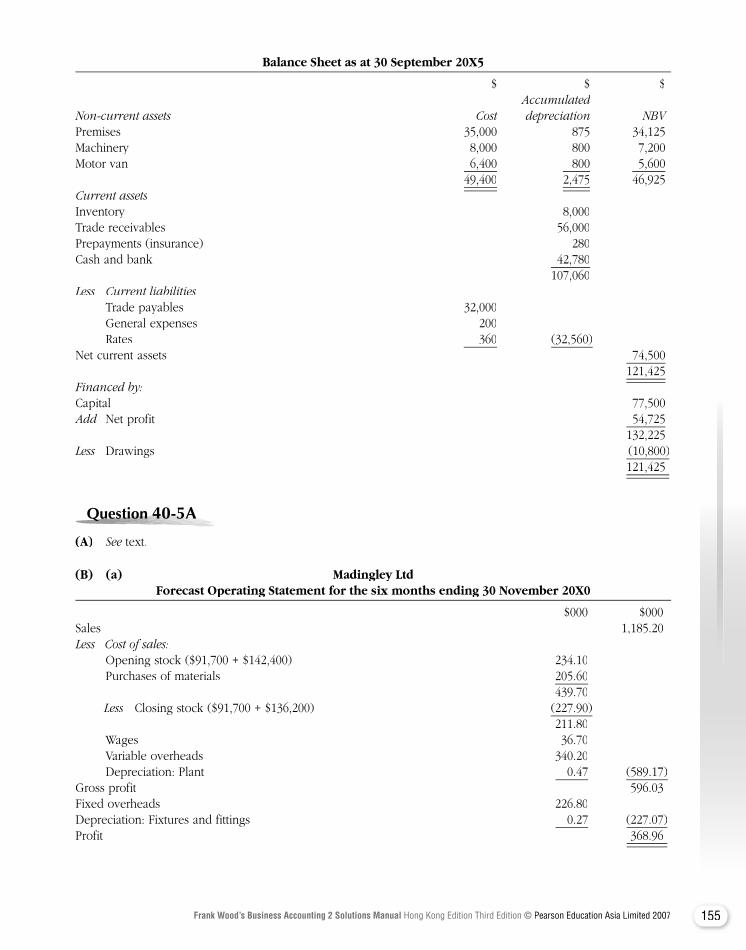
155Frank Wood’s Business Accounting 2 Solutions Manual Hong Kong Edition Third Edition © Pearson Education Asia Limited 2007
Balance Sheet as at 30 September 20X5
$ $ $ AccumulatedNon-current assets Cost depreciation NBVPremises 35,000 875 34,125Machinery 8,000 800 7,200Motor van 6,400 800 5,600 49,400 2,475 46,925Current assetsInventory 8,000Trade receivables 56,000Prepayments (insurance) 280Cash and bank 42,780 107,060Less Current liabilities
Trade payables 32,000 General expenses 200 Rates 360 (32,560)Net current assets 74,500 121,425Financed by:Capital 77,500Add Net profit 54,725 132,225Less Drawings (10,800) 121,425
Question Question Question Question Question Question Question 40-5A40-5A40-5A40-5A40-5A40-5A
(A) See text.See text.See
(B) (a) Madingley Ltd Forecast Operating Statement for the six months ending 30 November 20X0
$000 $000Sales 1,185.20Less Cost of sales: Opening stock ($91,700 + $142,400) 234.10 Purchases of materials 205.60 439.70 Less Closing stock ($91,700 + $136,200) Less Closing stock ($91,700 + $136,200) Less (227.90) 211.80 Wages 36.70 Variable overheads 340.20 Depreciation: Plant 0.47 (589.17)Gross profit 596.03Fixed overheads 226.80Depreciation: Fixtures and fittings 0.27 (227.07)Profit 368.96
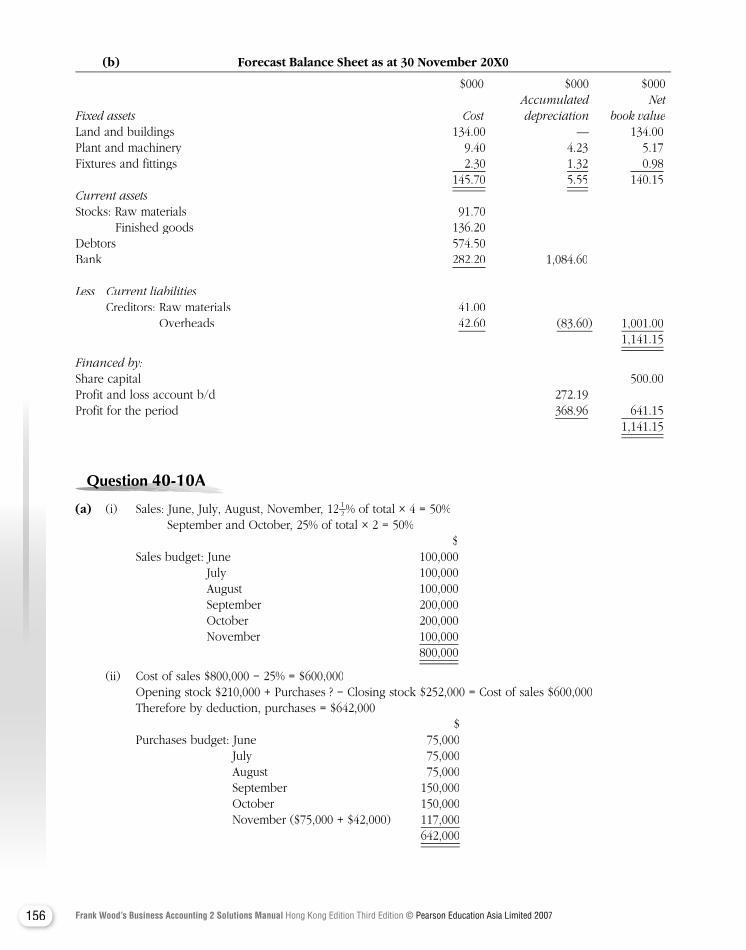
156 Frank Wood’s Business Accounting 2 Solutions Manual Hong Kong Edition Third Edition © Pearson Education Asia Limited 2007
(b) Forecast Balance Sheet as at 30 November 20X0
$000 $000 $000 Accumulated Net Fixed assets Cost depreciation book valueLand and buildings 134.00 — 134.00Plant and machinery 9.40 4.23 5.17Fixtures and fittings 2.30 1.32 0.98 145.70 5.55 140.15Current assetsStocks: Raw materials 91.70 Finished goods 136.20Debtors 574.50Bank 282.20 1,084.60 Less Current liabilities Creditors: Raw materials 41.00 Overheads 42.60 (83.60) 1,001.00 1,141.15
Financed by:Share capital 500.00Profit and loss account b/d 272.19Profit for the period 368.96 641.15 1,141.15
Question Question Question Question Question Question 40-10A40-10A40-10A40-10A40-10A40-10A40-10A
(a) (i) Sales: June, July, August, November, 12 12% of total × 4 = 50%
September and October, 25% of total × 2 = 50% $ Sales budget: June 100,000 July 100,000 August 100,000 September 200,000 October 200,000 November 100,000 800,000
(ii) Cost of sales $800,000 − 25% = $600,000 Opening stock $210,000 + Purchases ? − Closing stock $252,000 = Cost of sales $600,000 Therefore by deduction, purchases = $642,000 $ Purchases budget: June 75,000 July 75,000 August 75,000 September 150,000 October 150,000 November ($75,000 + $42,000) 117,000 642,000
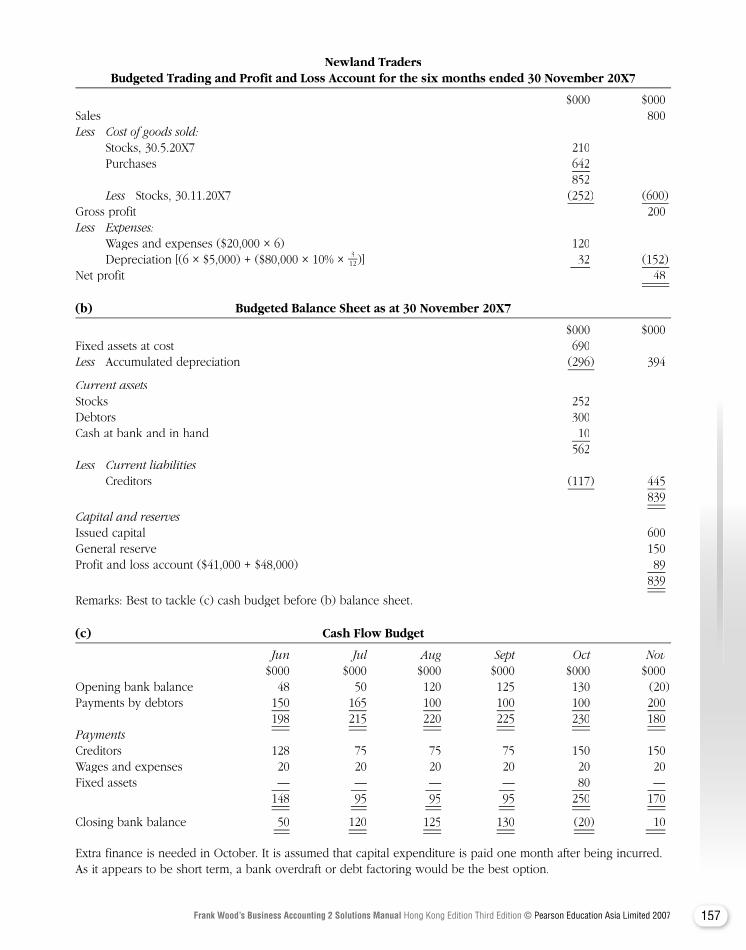
157Frank Wood’s Business Accounting 2 Solutions Manual Hong Kong Edition Third Edition © Pearson Education Asia Limited 2007
Newland Traders Budgeted Trading and Profit and Loss Account for the six months ended 30 November 20X7
$000 $000Sales 800Less Cost of goods sold: Stocks, 30.5.20X7 210 Purchases 642 852
Less Stocks, 30.11.20X7 (252) (600)Gross profit 200Less Expenses: Wages and expenses ($20,000 × 6) 120 Depreciation [(6 × $5,000) + ($80,000 × 10% × 3
12)] 32 (152)Net profit 48
(b) Budgeted Balance Sheet as at 30 November 20X7
$000 $000Fixed assets at cost 690Less Accumulated depreciation Less Accumulated depreciation Less (296) 394
Current assetsStocks 252Debtors 300Cash at bank and in hand 10 562Less Current liabilities Creditors (117) 445 839
Capital and reservesIssued capital 600General reserve 150Profit and loss account ($41,000 + $48,000) 89 839
Remarks: Best to tackle (c) cash budget before (b) balance sheet.
(c) Cash Flow Budget
Jun Jul Aug Sept Oct Nov $000 $000 $000 $000 $000 $000Opening bank balance 48 50 120 125 130 (20)Payments by debtors 150 165 100 100 100 200 198 215 220 225 230 180PaymentsCreditors 128 75 75 75 150 150Wages and expenses 20 20 20 20 20 20Fixed assets — — — — 80 — 148 95 95 95 250 170
Closing bank balance 50 120 125 130 (20) 10
Extra finance is needed in October. It is assumed that capital expenditure is paid one month after being incurred. As it appears to be short term, a bank overdraft or debt factoring would be the best option.

158 Frank Wood’s Business Accounting 2 Solutions Manual Hong Kong Edition Third Edition © Pearson Education Asia Limited 2007
Question Question Question Question Question Question 40-12A40-12A40-12A40-12A40-12A40-12A40-12A
(A) (a) At a current operating level of 160,000 units, the company will not have to turn away any of its regular customers in order to fill the special order. If it wishes to earn operating profit at $5 per unit, it needs to earn a contribution margin per unit of $5.
$ $ Direct materials 13 Direct labour 8 Variable overhead ($21 × 2
3 ) 14 Additional shipping costs per unit 3 38 Contribution margin per unit 5 Selling price 43
Thus, the selling price per unit of the special order is $43, as shown above.
(b) In order for the company to increase its operating income by $200,000 above what it would be without the order, the contribution margin per unit included with the special order must be $5 per unit more than the normal contribution margin, that is, $200,000 ÷ 40,000 units = $5/unit.
Thus, the selling price of the special order must cover the additional shipping costs, and an extra profit of $5, that is, $56 + $3 + $5 = $64.
Therefore, a selling price of $64 is required.
(c) I do not agree with the statement. Some of the total unit costs incurred in the manufacture of a product may be fixed costs, and thus will not make a difference between the make and buy alternatives. These fixed costs are irrelevant to the make or buy decision. The key comparison is between purchase costs and the costs that will be saved if the company purchases the products from outside.
(B) (a) Completing the opening work in process: 22,000 units × (100% − 60%) 8,800 Units started and completed X Closing work in process: 18,000 units × 75% 13,500 Equivalent units of production 46,500
Units started and completed, X = 46,500 − 8,800 − 13,500 = 24,200 units Units started = Units started and completed + Closing work in progress = 24,200 + 18,000 = 42,200 units
(b) Weighted average method Units transferred to next department (22,000 + 24,200) 46,200
Closing work in process: 18,000 units × 75% 13,500 59,700
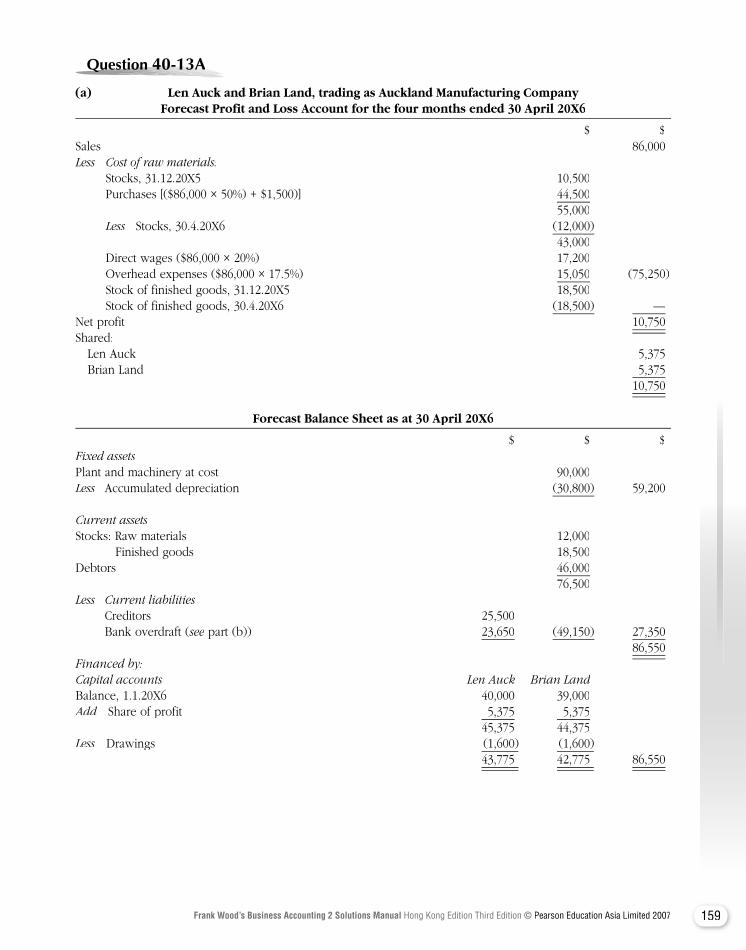
159Frank Wood’s Business Accounting 2 Solutions Manual Hong Kong Edition Third Edition © Pearson Education Asia Limited 2007
Question Question Question Question Question Question 40-13A40-13A40-13A40-13A40-13A40-13A40-13A
(a) Len Auck and Brian Land, trading as Auckland Manufacturing Company Forecast Profit and Loss Account for the four months ended 30 April 20X6
$ $Sales 86,000Less Cost of raw materials: Stocks, 31.12.20X5 10,500 Purchases [($86,000 × 50%) + $1,500)] 44,500 55,000
Less Stocks, 30.4.20X6 Less Stocks, 30.4.20X6 Less (12,000) 43,000 Direct wages ($86,000 × 20%) 17,200 Overhead expenses ($86,000 × 17.5%) 15,050 (75,250) Stock of finished goods, 31.12.20X5 18,500 Stock of finished goods, 30.4.20X6 (18,500) —Net profit 10,750Shared: Len Auck 5,375 Brian Land 5,375 10,750
Forecast Balance Sheet as at 30 April 20X6
$ $ $Fixed assetsPlant and machinery at cost 90,000Less Accumulated depreciation (30,800) 59,200
Current assetsStocks: Raw materials 12,000 Finished goods 18,500Debtors 46,000 76,500Less Current liabilities Creditors 25,500 Bank overdraft (see part (b)) see part (b)) see 23,650 (49,150) 27,350 86,550Financed by:Capital accounts Len Auck Brian LandBalance, 1.1.20X6 40,000 39,000Add Share of profit 5,375 5,375Add Share of profit 5,375 5,375Add 45,375 44,375Less Drawings (1,600) (1,600)Less Drawings (1,600) (1,600)Less 43,775 42,775 86,550
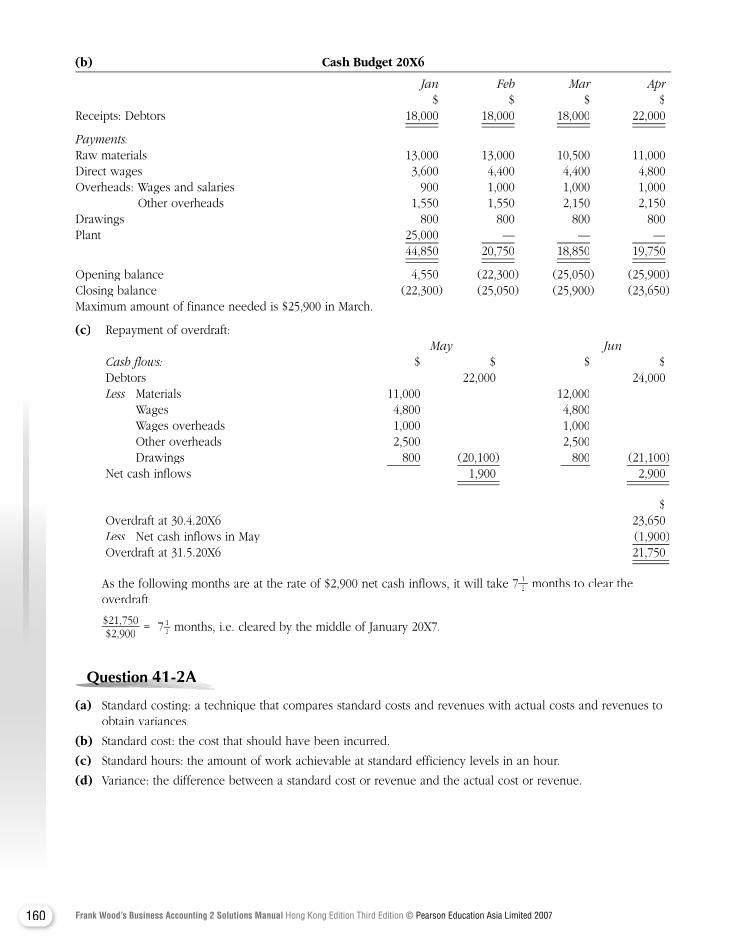
160 Frank Wood’s Business Accounting 2 Solutions Manual Hong Kong Edition Third Edition © Pearson Education Asia Limited 2007
(b) Cash Budget 20X6
Jan Feb Mar Apr $ $ $ $Receipts: Debtors 18,000 18,000 18,000 22,000
Payments:Raw materials 13,000 13,000 10,500 11,000Direct wages 3,600 4,400 4,400 4,800Overheads: Wages and salaries 900 1,000 1,000 1,000 Other overheads 1,550 1,550 2,150 2,150Drawings 800 800 800 800Plant 25,000 — — — 44,850 20,750 18,850 19,750
Opening balance 4,550 (22,300) (25,050) (25,900)Closing balance (22,300) (25,050) (25,900) (23,650)Maximum amount of finance needed is $25,900 in March.
(c) Repayment of overdraft: May Jun
Cash flows: $ $ $ $ Debtors 22,000 24,000
Less Materials 11,000 12,000Less Materials 11,000 12,000Less Wages 4,800 4,800 Wages overheads 1,000 1,000 Other overheads 2,500 2,500 Drawings 800 (20,100) 800 (21,100) Net cash inflows 1,900 2,900
$ Overdraft at 30.4.20X6 23,650
Less Net cash inflows in May (1,900)Less Net cash inflows in May (1,900)Less Overdraft at 31.5.20X6 21,750
As the following months are at the rate of $2,900 net cash inflows, it will take 7 12 months to clear the
overdraft:
$21,750$2,900 = 7 1
2 months, i.e. cleared by the middle of January 20X7.
Question Question Question Question Question Question Question 41-2A41-2A41-2A41-2A41-2A41-2A
(a) Standard costing: a technique that compares standard costs and revenues with actual costs and revenues to obtain variances.
(b) Standard cost: the cost that should have been incurred.
(c) Standard hours: the amount of work achievable at standard efficiency levels in an hour.
(d) Variance: the difference between a standard cost or revenue and the actual cost or revenue.
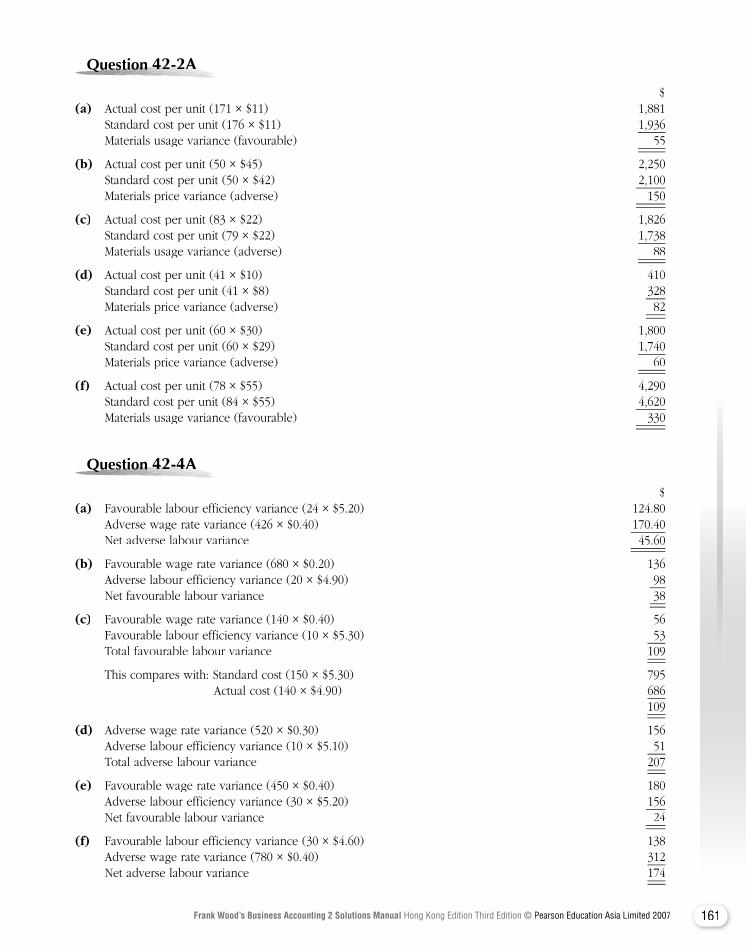
161Frank Wood’s Business Accounting 2 Solutions Manual Hong Kong Edition Third Edition © Pearson Education Asia Limited 2007
Question Question Question Question Question Question Question 42-2A42-2A42-2A42-2A42-2A42-2A
$(a) Actual cost per unit (171 × $11) 1,881 Standard cost per unit (176 × $11) 1,936 Materials usage variance (favourable) 55
(b) Actual cost per unit (50 × $45) 2,250 Standard cost per unit (50 × $42) 2,100 Materials price variance (adverse) 150
(c) Actual cost per unit (83 × $22) 1,826 Standard cost per unit (79 × $22) 1,738 Materials usage variance (adverse) 88
(d) Actual cost per unit (41 × $10) 410 Standard cost per unit (41 × $8) 328 Materials price variance (adverse) 82
(e) Actual cost per unit (60 × $30) 1,800 Standard cost per unit (60 × $29) 1,740 Materials price variance (adverse) 60
(f) Actual cost per unit (78 × $55) 4,290 Standard cost per unit (84 × $55) 4,620 Materials usage variance (favourable) 330
Question Question Question Question Question Question Question 42-4A42-4A42-4A42-4A42-4A42-4A
$(a) Favourable labour efficiency variance (24 × $5.20) 124.80 Adverse wage rate variance (426 × $0.40) 170.40 Net adverse labour variance 45.60
(b) Favourable wage rate variance (680 × $0.20) 136 Adverse labour efficiency variance (20 × $4.90) 98 Net favourable labour variance 38
(c) Favourable wage rate variance (140 × $0.40) 56 Favourable labour efficiency variance (10 × $5.30) 53 Total favourable labour variance 109
This compares with: Standard cost (150 × $5.30) 795 Actual cost (140 × $4.90) 686 109
(d) Adverse wage rate variance (520 × $0.30) 156 Adverse labour efficiency variance (10 × $5.10) 51 Total adverse labour variance 207
(e) Favourable wage rate variance (450 × $0.40) 180 Adverse labour efficiency variance (30 × $5.20) 156 Net favourable labour variance 24
(f) Favourable labour efficiency variance (30 × $4.60) 138 Adverse wage rate variance (780 × $0.40) 312 Net adverse labour variance 174
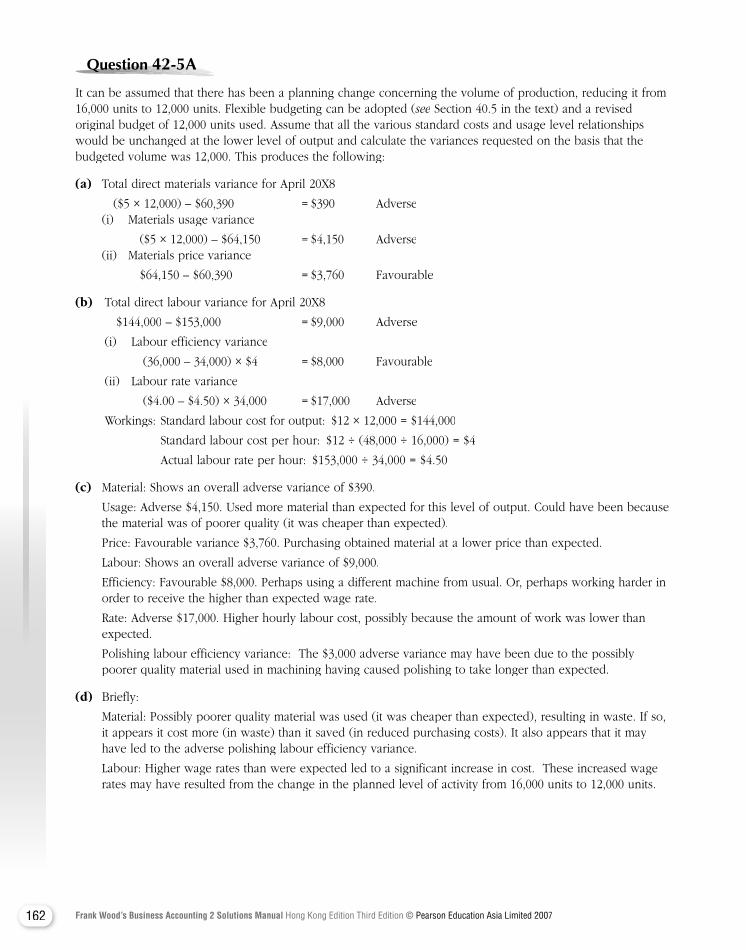
162 Frank Wood’s Business Accounting 2 Solutions Manual Hong Kong Edition Third Edition © Pearson Education Asia Limited 2007
Question Question Question Question Question Question Question 42-5A42-5A42-5A42-5A42-5A42-5A42-5A42-5A
It can be assumed that there has been a planning change concerning the volume of production, reducing it from 16,000 units to 12,000 units. Flexible budgeting can be adopted (see Section 40.5 in the text) and a revised see Section 40.5 in the text) and a revised seeoriginal budget of 12,000 units used. Assume that all the various standard costs and usage level relationships would be unchanged at the lower level of output and calculate the variances requested on the basis that the budgeted volume was 12,000. This produces the following:
(a) Total direct materials variance for April 20X8
($5 × 12,000) – $60,390 = $390 Adverse (i) Materials usage variance
($5 × 12,000) – $64,150 = $4,150 Adverse (ii) Materials price variance
$64,150 – $60,390 = $3,760 Favourable
(b) Total direct labour variance for April 20X8
$144,000 – $153,000 = $9,000 Adverse
(i) Labour efficiency variance
(36,000 – 34,000) × $4 = $8,000 Favourable
(ii) Labour rate variance
($4.00 – $4.50) × 34,000 = $17,000 Adverse
Workings: Standard labour cost for output: $12 × 12,000 = $144,000
Standard labour cost per hour: $12 ÷ (48,000 ÷ 16,000) = $4
Actual labour rate per hour: $153,000 ÷ 34,000 = $4.50
(c) Material: Shows an overall adverse variance of $390.
Usage: Adverse $4,150. Used more material than expected for this level of output. Could have been because the material was of poorer quality (it was cheaper than expected).
Price: Favourable variance $3,760. Purchasing obtained material at a lower price than expected.
Labour: Shows an overall adverse variance of $9,000.
Efficiency: Favourable $8,000. Perhaps using a different machine from usual. Or, perhaps working harder in order to receive the higher than expected wage rate.
Rate: Adverse $17,000. Higher hourly labour cost, possibly because the amount of work was lower than expected.
Polishing labour efficiency variance: The $3,000 adverse variance may have been due to the possibly poorer quality material used in machining having caused polishing to take longer than expected.
(d) Briefly:
Material: Possibly poorer quality material was used (it was cheaper than expected), resulting in waste. If so, it appears it cost more (in waste) than it saved (in reduced purchasing costs). It also appears that it may have led to the adverse polishing labour efficiency variance.
Labour: Higher wage rates than were expected led to a significant increase in cost. These increased wage rates may have resulted from the change in the planned level of activity from 16,000 units to 12,000 units.
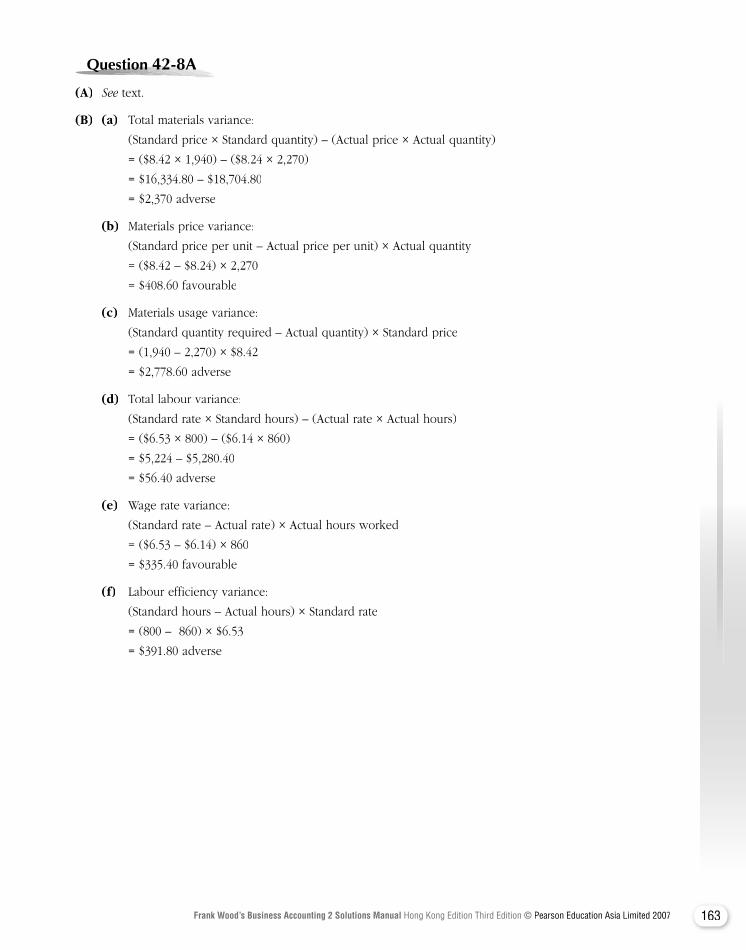
163Frank Wood’s Business Accounting 2 Solutions Manual Hong Kong Edition Third Edition © Pearson Education Asia Limited 2007
Question Question Question Question Question Question Question 42-8A42-8A42-8A42-8A42-8A42-8A
(A) See text.See text.See
(B) (a) Total materials variance:
(Standard price × Standard quantity) – (Actual price × Actual quantity)
= ($8.42 × 1,940) – ($8.24 × 2,270)
= $16,334.80 – $18,704.80
= $2,370 adverse
(b) Materials price variance:
(Standard price per unit – Actual price per unit) × Actual quantity
= ($8.42 – $8.24) × 2,270
= $408.60 favourable
(c) Materials usage variance:
(Standard quantity required – Actual quantity) × Standard price
= (1,940 – 2,270) × $8.42
= $2,778.60 adverse
(d) Total labour variance:
(Standard rate × Standard hours) – (Actual rate × Actual hours)
= ($6.53 × 800) – ($6.14 × 860)
= $5,224 – $5,280.40
= $56.40 adverse
(e) Wage rate variance:
(Standard rate – Actual rate) × Actual hours worked
= ($6.53 – $6.14) × 860
= $335.40 favourable
(f) Labour efficiency variance:
(Standard hours – Actual hours) × Standard rate
= (800 – 860) × $6.53
= $391.80 adverse
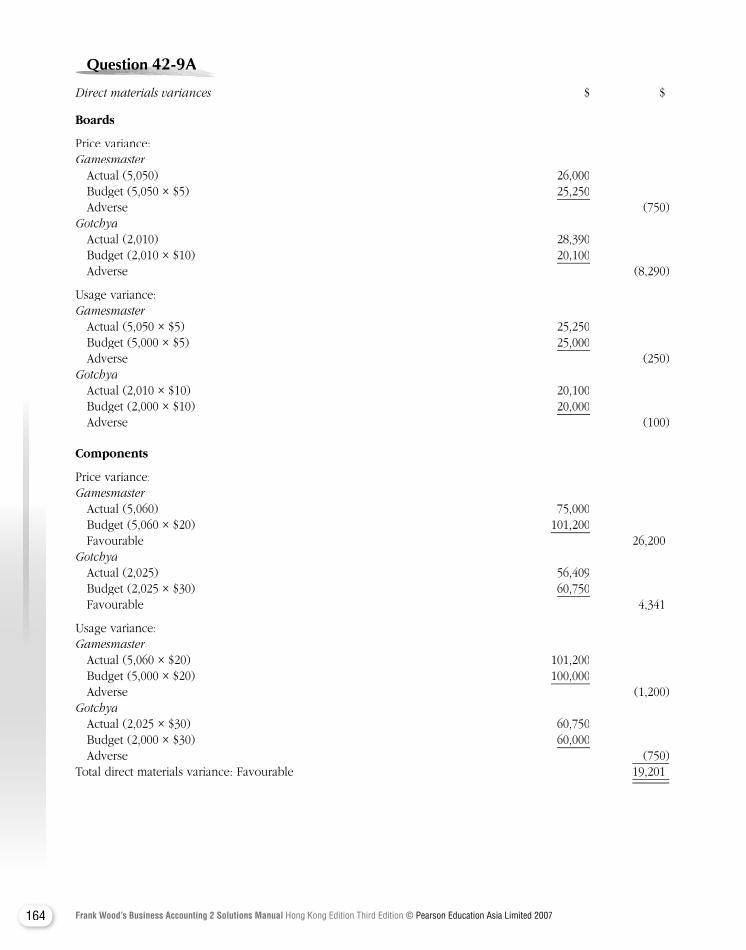
164 Frank Wood’s Business Accounting 2 Solutions Manual Hong Kong Edition Third Edition © Pearson Education Asia Limited 2007
Question Question Question Question Question Question Question 42-9A42-9A42-9A42-9A42-9A42-9A
Direct materials variances $ $ Direct materials variances $ $ Direct materials variances
Boards
Price variance: Gamesmaster Actual (5,050) 26,000 Budget (5,050 × $5) 25,250 Adverse (750 )Gotchya Actual (2,010) 28,390 Budget (2,010 × $10) 20,100 Adverse (8,290 )
Usage variance:Gamesmaster Actual (5,050 × $5) 25,250 Budget (5,000 × $5) 25,000 Adverse (250 )Gotchya Actual (2,010 × $10) 20,100 Budget (2,000 × $10) 20,000 Adverse (100 )
Components
Price variance:Gamesmaster Actual (5,060) 75,000 Budget (5,060 × $20) 101,200 Favourable 26,200Gotchya Actual (2,025) 56,409 Budget (2,025 × $30) 60,750 Favourable 4,341
Usage variance:Gamesmaster Actual (5,060 × $20) 101,200 Budget (5,000 × $20) 100,000 Adverse (1,200 )Gotchya Actual (2,025 × $30) 60,750 Budget (2,000 × $30) 60,000 Adverse (750 )Total direct materials variance: Favourable 19,201
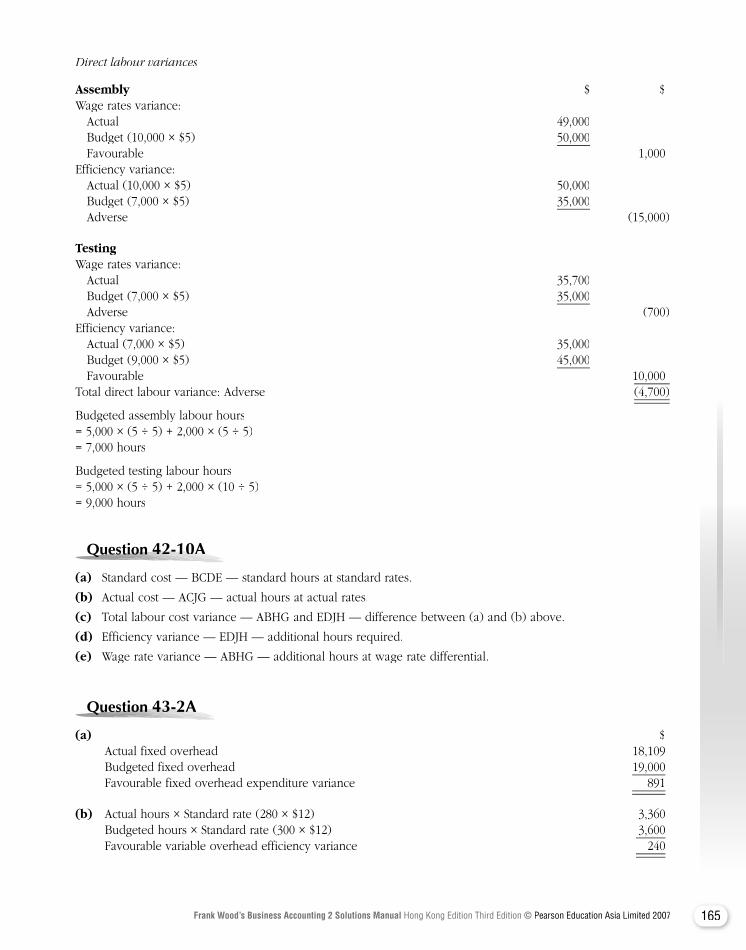
165Frank Wood’s Business Accounting 2 Solutions Manual Hong Kong Edition Third Edition © Pearson Education Asia Limited 2007
Direct labour variances
Assembly $ $Assembly $ $AssemblyWage rates variance: Actual 49,000 Budget (10,000 × $5) 50,000 Favourable 1,000Efficiency variance: Actual (10,000 × $5) 50,000 Budget (7,000 × $5) 35,000 Adverse (15,000 )
TestingWage rates variance: Actual 35,700 Budget (7,000 × $5) 35,000 Adverse (700 )Efficiency variance: Actual (7,000 × $5) 35,000 Budget (9,000 × $5) 45,000 Favourable 10,000Total direct labour variance: Adverse (4,700 )
Budgeted assembly labour hours= 5,000 × (5 ÷ 5) + 2,000 × (5 ÷ 5)= 7,000 hours
Budgeted testing labour hours= 5,000 × (5 ÷ 5) + 2,000 × (10 ÷ 5)= 9,000 hours
Question Question Question Question Question Question 42-10A42-10A42-10A42-10A42-10A42-10A
(a) Standard cost — BCDE — standard hours at standard rates.
(b) Actual cost — ACJG — actual hours at actual rates.
(c) Total labour cost variance — ABHG and EDJH — difference between (a) and (b) above.
(d) Efficiency variance — EDJH — additional hours required.
(e) Wage rate variance — ABHG — additional hours at wage rate differential.
Question Question Question Question Question Question Question 43-2A43-2A43-2A43-2A43-2A43-2A
(a) $ Actual fixed overhead 18,109 Budgeted fixed overhead 19,000 Favourable fixed overhead expenditure variance 891
(b) Actual hours × Standard rate (280 × $12) 3,360 Budgeted hours × Standard rate (300 × $12) 3,600 Favourable variable overhead efficiency variance 240

166 Frank Wood’s Business Accounting 2 Solutions Manual Hong Kong Edition Third Edition © Pearson Education Asia Limited 2007
$(c) Actual overhead 28,000 Overhead applied to production (13,800 × $2) 27,600 Adverse variable overhead expenditure variance 400
(d) Actual overhead 11,400 Overhead applied to production (6,000 × $2) 12,000 Favourable variable overhead expenditure variance 600
(e) Actual fixed overhead 88,700 Budgeted fixed overhead 84,100 Adverse fixed overhead expenditure variance 4,600
(f) Actual hours × Standard rate (20,000 × $10) 200,000 Budgeted hours (14,600 × 1.33) × Standard rate $10 194,467 Adverse variable overhead efficiency variance 5,333
Question Question Question Question Question Question Question 43-4A43-4A43-4A43-4A43-4A43-4A
The variable overhead rate is:
$80,000$80,00060,000
= $1.33 per direct labour hour or $80,000$80,000240,000
= $0.33 per unit
The fixed overhead rate is:
$120,000$120,00060,000
= $2 per direct labour hour or $120,000$120,000240,000
= $0.50 per unit
The variances are:
Variable overhead(i) Expenditure variance $Expenditure variance $Expenditure variance Actual overhead 78,000 Overhead applied to production (64,000 × $1.33) 85,333 Favourable expenditure variance 7,333
(ii) Efficiency variance Actual hours × Standard rate (64,000 × $1.33) 85,333 Budgeted hours × Standard rate (236,000 units which should be produced in 236,000 ÷ 4 = 59,000 hours × $1.33) 78,667 Adverse efficiency variance 6,666Net favourable variable overhead variance 667
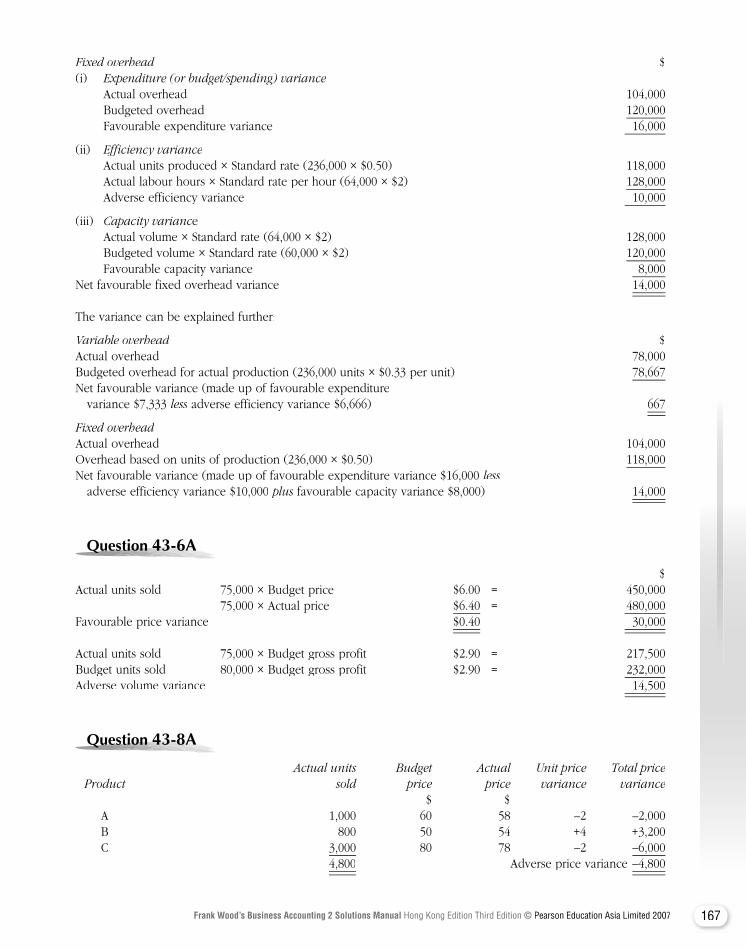
167Frank Wood’s Business Accounting 2 Solutions Manual Hong Kong Edition Third Edition © Pearson Education Asia Limited 2007
Fixed overhead $(i) Expenditure (or budget/spending) variance Actual overhead 104,000 Budgeted overhead 120,000 Favourable expenditure variance 16,000
(ii) Efficiency variance Actual units produced × Standard rate (236,000 × $0.50) 118,000 Actual labour hours × Standard rate per hour (64,000 × $2) 128,000 Adverse efficiency variance 10,000
(iii) Capacity variance Actual volume × Standard rate (64,000 × $2) 128,000 Budgeted volume × Standard rate (60,000 × $2) 120,000 Favourable capacity variance 8,000Net favourable fixed overhead variance 14,000 The variance can be explained further:
Variable overhead $Variable overhead $Variable overheadActual overhead 78,000Budgeted overhead for actual production (236,000 units × $0.33 per unit) 78,667Net favourable variance (made up of favourable expenditure variance $7,333 less adverse efficiency variance $6,666) less adverse efficiency variance $6,666) less 667
Fixed overheadActual overhead 104,000Overhead based on units of production (236,000 × $0.50) 118,000Net favourable variance (made up of favourable expenditure variance $16,000 less adverse efficiency variance $10,000 plus favourable capacity variance $8,000) plus favourable capacity variance $8,000) plus 14,000
Question Question Question Question Question Question Question 43-6A43-6A43-6A43-6A43-6A43-6A
$Actual units sold 75,000 × Budget price $6.00 = 450,000 75,000 × Actual price $6.40 = 480,000Favourable price variance $0.40 30,000 Actual units sold 75,000 × Budget gross profit $2.90 = 217,500Budget units sold 80,000 × Budget gross profit $2.90 = 232,000Adverse volume variance 14,500
Question Question Question Question Question Question Question 43-8A43-8A43-8A43-8A43-8A43-8A
Actual units Budget Actual Unit price Total price Product sold price price variance variance
$ $ A 1,000 60 58 –2 –2,000 B 800 50 54 +4 +3,200 C 3,000 80 78 –2 –6,000 4,800 Adverse price variance –4,800
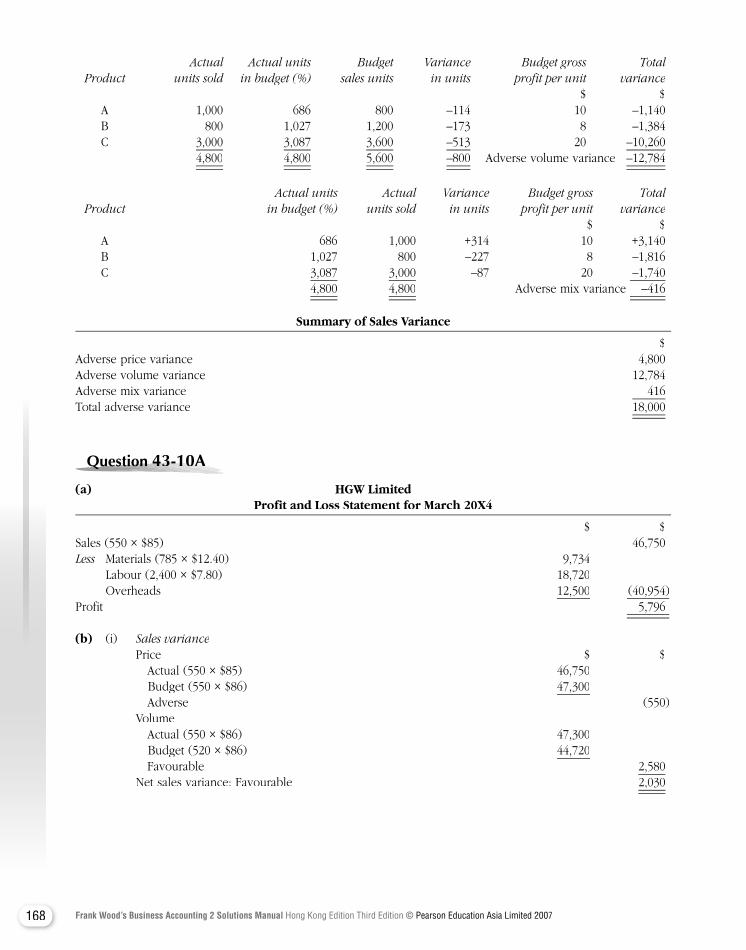
168 Frank Wood’s Business Accounting 2 Solutions Manual Hong Kong Edition Third Edition © Pearson Education Asia Limited 2007
Actual Actual units Budget Variance Budget gross Total Product units sold in budget (%) sales units in units profit per unit variance $ $ A 1,000 686 800 –114 10 –1,140 B 800 1,027 1,200 –173 8 –1,384 C 3,000 3,087 3,600 –513 20 –10,260 4,800 4,800 5,600 –800 Adverse volume variance –12,784
Actual units Actual Variance Budget gross Total Product in budget (%) units sold in units profit per unit variance $ $ A 686 1,000 +314 10 +3,140 B 1,027 800 –227 8 –1,816 C 3,087 3,000 –87 20 –1,740 4,800 4,800 Adverse mix variance –416
Summary of Sales Variance
$Adverse price variance 4,800Adverse volume variance 12,784Adverse mix variance 416Total adverse variance 18,000
Question Question Question Question Question Question 43-10A43-10A43-10A43-10A43-10A43-10A43-10A
(a) HGW Limited Profit and Loss Statement for March 20X4
$ $Sales (550 × $85) 46,750Less Materials (785 × $12.40) 9,734 Labour (2,400 × $7.80) 18,720 Overheads 12,500 (40,954)Profit 5,796 (b) (i) Sales variance Price $ $ Actual (550 × $85) 46,750
Budget (550 × $86) 47,300 Adverse (550) Volume Actual (550 × $86) 47,300
Budget (520 × $86) 44,720 Favourable 2,580 Net sales variance: Favourable 2,030
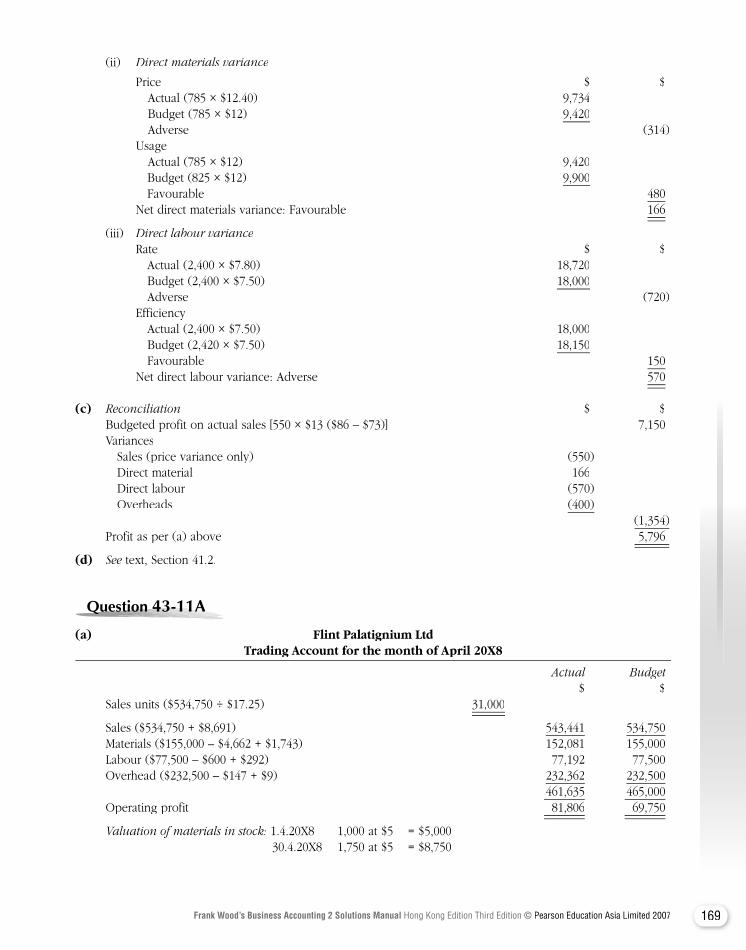
169Frank Wood’s Business Accounting 2 Solutions Manual Hong Kong Edition Third Edition © Pearson Education Asia Limited 2007
(ii) Direct materials variance
Price $ $ Actual (785 × $12.40) 9,734 Budget (785 × $12) 9,420 Adverse (314)
Usage Actual (785 × $12) 9,420 Budget (825 × $12) 9,900 Favourable 480 Net direct materials variance: Favourable 166
(iii) Direct labour variance Rate $ $ Actual (2,400 × $7.80) 18,720 Budget (2,400 × $7.50) 18,000 Adverse (720) Efficiency Actual (2,400 × $7.50) 18,000 Budget (2,420 × $7.50) 18,150 Favourable 150 Net direct labour variance: Adverse 570
(c) Reconciliation $ $ Budgeted profit on actual sales [550 × $13 ($86 – $73)] 7,150 Variances Sales (price variance only) (550) Direct material 166 Direct labour (570) Overheads (400) (1,354) Profit as per (a) above 5,796
(d) See text, Section 41.2.See text, Section 41.2.See
Question Question Question Question Question Question 43-11A43-11A43-11A43-11A43-11A43-11A43-11A
(a) Flint Palatignium Ltd Trading Account for the month of April 20X8
Actual Budget $ $ Sales units ($534,750 ÷ $17.25) 31,000
Sales ($534,750 + $8,691) 543,441 534,750 Materials ($155,000 – $4,662 + $1,743) 152,081 155,000 Labour ($77,500 – $600 + $292) 77,192 77,500 Overhead ($232,500 – $147 + $9) 232,362 232,500 461,635 465,000 Operating profit 81,806 69,750
Valuation of materials in stock: 1.4.20X8 1,000 at $5 = $5,000 30.4.20X8 1,750 at $5 = $8,750
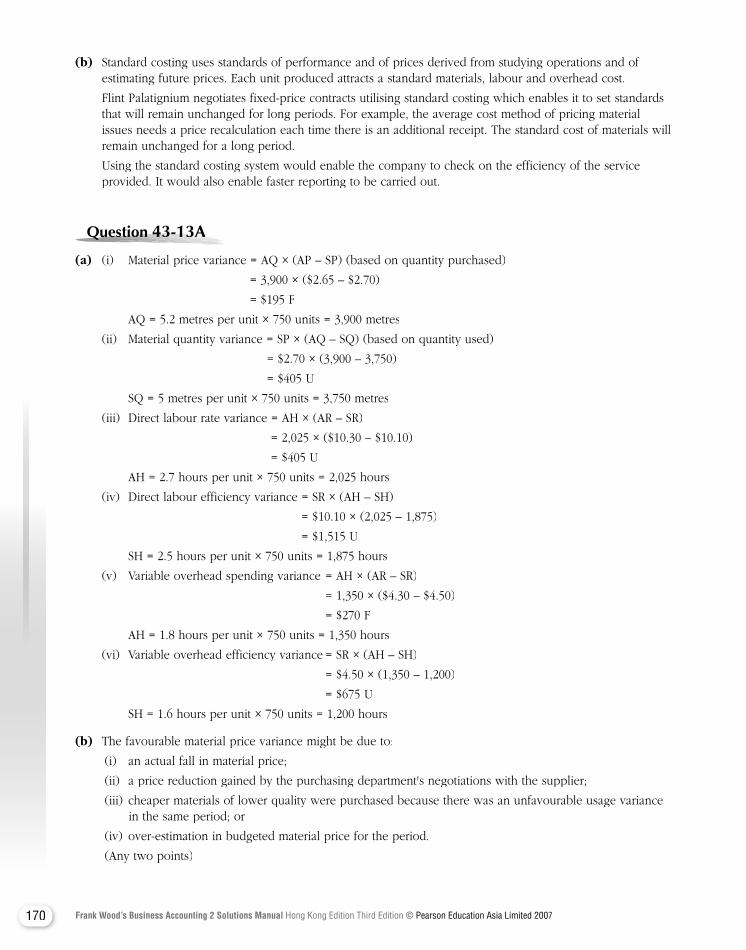
170 Frank Wood’s Business Accounting 2 Solutions Manual Hong Kong Edition Third Edition © Pearson Education Asia Limited 2007
(b) Standard costing uses standards of performance and of prices derived from studying operations and of estimating future prices. Each unit produced attracts a standard materials, labour and overhead cost.
Flint Palatignium negotiates fixed-price contracts utilising standard costing which enables it to set standards that will remain unchanged for long periods. For example, the average cost method of pricing material issues needs a price recalculation each time there is an additional receipt. The standard cost of materials will remain unchanged for a long period.
Using the standard costing system would enable the company to check on the efficiency of the service provided. It would also enable faster reporting to be carried out.
Question Question Question Question Question Question 43-13A43-13A43-13A43-13A43-13A43-13A43-13A
(a) (i) Material price variance = AQ × (AP – SP) (based on quantity purchased)
= 3,900 × ($2.65 – $2.70)
= $195 F
AQ = 5.2 metres per unit × 750 units = 3,900 metres
(ii) Material quantity variance = SP × (AQ – SQ) (based on quantity used)
= $2.70 × (3,900 – 3,750)
= $405 U
SQ = 5 metres per unit × 750 units = 3,750 metres
(iii) Direct labour rate variance = AH × (AR – SR)
= 2,025 × ($10.30 – $10.10)
= $405 U
AH = 2.7 hours per unit × 750 units = 2,025 hours
(iv) Direct labour efficiency variance = SR × (AH – SH)
= $10.10 × (2,025 – 1,875)
= $1,515 U
SH = 2.5 hours per unit × 750 units = 1,875 hours
(v) Variable overhead spending variance = AH × (AR – SR)
= 1,350 × ($4.30 – $4.50)
= $270 F
AH = 1.8 hours per unit × 750 units = 1,350 hours
(vi) Variable overhead efficiency variance = SR × (AH – SH)
= $4.50 × (1,350 – 1,200)
= $675 U
SH = 1.6 hours per unit × 750 units = 1,200 hours
(b) The favourable material price variance might be due to:
(i) an actual fall in material price;
(ii) a price reduction gained by the purchasing department's negotiations with the supplier;
(iii) cheaper materials of lower quality were purchased because there was an unfavourable usage variance in the same period; or
(iv) over-estimation in budgeted material price for the period.
(Any two points)
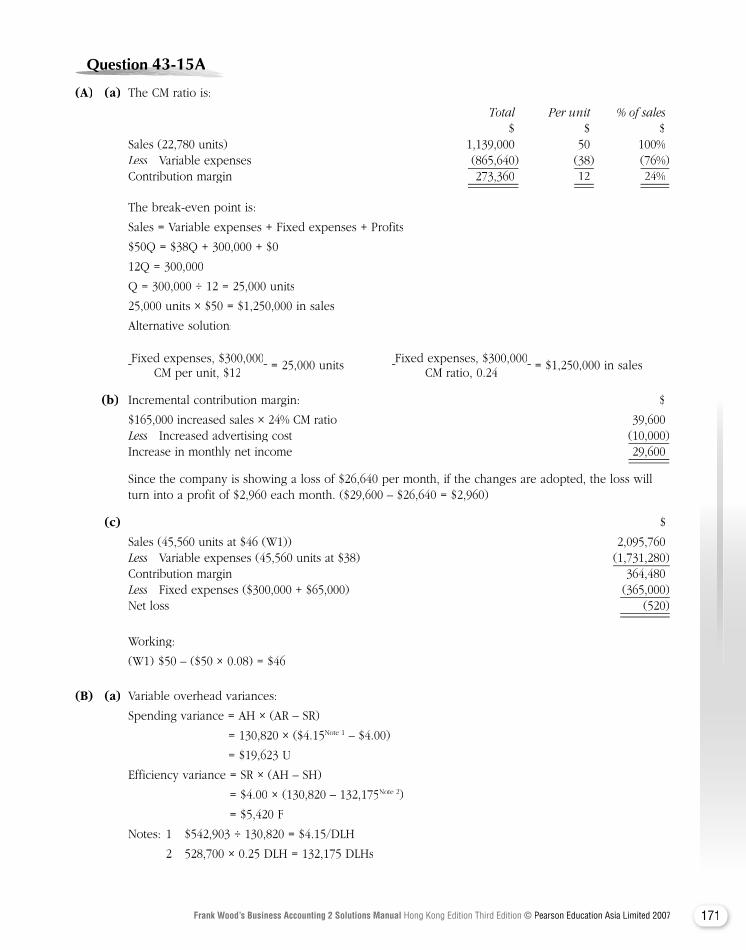
171Frank Wood’s Business Accounting 2 Solutions Manual Hong Kong Edition Third Edition © Pearson Education Asia Limited 2007
Question Question Question Question Question Question 43-15A43-15A43-15A43-15A43-15A43-15A43-15A
(A) (a) The CM ratio is:
Total Per unit % of sales $ $ $ Sales (22,780 units) 1,139,000 50 100% Less Variable expenses (865,640 ) (38 ) (76% )Less Variable expenses (865,640 ) (38 ) (76% )Less Contribution margin 273,360 12 24%
The break-even point is:
Sales = Variable expenses + Fixed expenses + Profits
$50Q = $38Q + 300,000 + $0
12Q = 300,000
Q = 300,000 ÷ 12 = 25,000 units
25,000 units × $50 = $1,250,000 in sales
Alternative solution:
Fixed expenses, $300,000Fixed expenses, $300,000CM per unit, $12
= 25,000 units Fixed expenses, $300,000Fixed expenses, $300,000CM ratio, 0.24
= $1,250,000 in sales
(b) Incremental contribution margin: $
$165,000 increased sales × 24% CM ratio 39,600 Less Increased advertising cost (10,000 )Less Increased advertising cost (10,000 )Less Increase in monthly net income 29,600
Since the company is showing a loss of $26,640 per month, if the changes are adopted, the loss will turn into a profit of $2,960 each month. ($29,600 – $26,640 = $2,960)
(c) $
Sales (45,560 units at $46 (W1)) 2,095,760 Less Variable expenses (45,560 units at $38) Less Variable expenses (45,560 units at $38) Less (1,731,280 ) Contribution margin 364,480 Less Fixed expenses ($300,000 + $65,000) (365,000 )Less Fixed expenses ($300,000 + $65,000) (365,000 )Less Net loss (520 )
Working:
(W1) $50 – ($50 × 0.08) = $46
(B) (a) Variable overhead variances:
Spending variance = AH × (AR – SR)
= 130,820 × ($4.15Note 1 – $4.00)
= $19,623 U
Efficiency variance = SR × (AH – SH)
= $4.00 × (130,820 – 132,175Note 2)
= $5,420 F
Notes: 1 $542,903 ÷ 130,820 = $4.15/DLH
2 528,700 × 0.25 DLH = 132,175 DLHs
172 Frank Wood’s Business Accounting 2 Solutions Manual Hong Kong Edition Third Edition © Pearson Education Asia Limited 2007
(b) Fixed overhead variances:
Budget variance = Actual fixed overhead – Budgeted fixed overhead
= $879,360 – ($1.80 × 499,800)
= $879,360 – $899,640
= $20,280 F
Volume variance = Fixed rate × (Budgeted volume – Actual production in standard hours)
= $7.20 × (124,950 – 132,175)
= $52,020 F
Question Question Question Question Question Question Question 44-3A44-3A44-3A44-3A44-3A44-3A
(a) (i) $24,000 (ii) $36,000 (iii) $44,000 (iv) $30,000
(b) (i) $18,000 (ii) $48,000 (iii) $33,000
Question Question Question Question Question Question Question 44-5A44-5A44-5A44-5A44-5A44-5A
(a) Loss $2,000
(b) Profit $12,000
(c) Neither profit nor loss
(d) Profit $6,000
(e) Profit $9,000
Question Question Question Question Question Question Question 44-7A44-7A44-7A44-7A44-7A44-7A
(a) and (b) Workings: Changes
Current (i) (ii) (iii) (iv)Sales volume (units) 1,000 1,100 1,000 1,000 1,000Selling price ($) 2 2 2.20 2 2Sales ($) 2,000 2,200 2,200 2,000 2,000 Variable cost ($) 1,000 1,100 1,000 900 1,000Fixed costs ($) 500 500 500 500 450Profit ($) 500 600 700 600 550

173Frank Wood’s Business Accounting 2 Solutions Manual Hong Kong Edition Third Edition © Pearson Education Asia Limited 2007
Break-even charts:
(i) 10% increase in volume
(ii) 10% increase in unit selling price
(iii) 10% decrease in unit variable cost
0
500
1,000
1,500
2,000
2,500
Increase in profit: $200
Sales
Costs
200 400 600Units produced and sold
800 1,000 1,200
Breakeven point = 417 units
($)
0
500
1,000
1,500
2,000
2,500
Increase in profit: $100
Sales
Costs
200 400 600Units produced and sold
800 1,000 1,200
Breakeven point = 455 units
($)
0
500
1,000
1,500
2,000
2,500
Increase in profit: $100
Breakeven point = 500 units
Sales
Costs
($)
200 400 600Units produced and sold
800 1,000 1,200
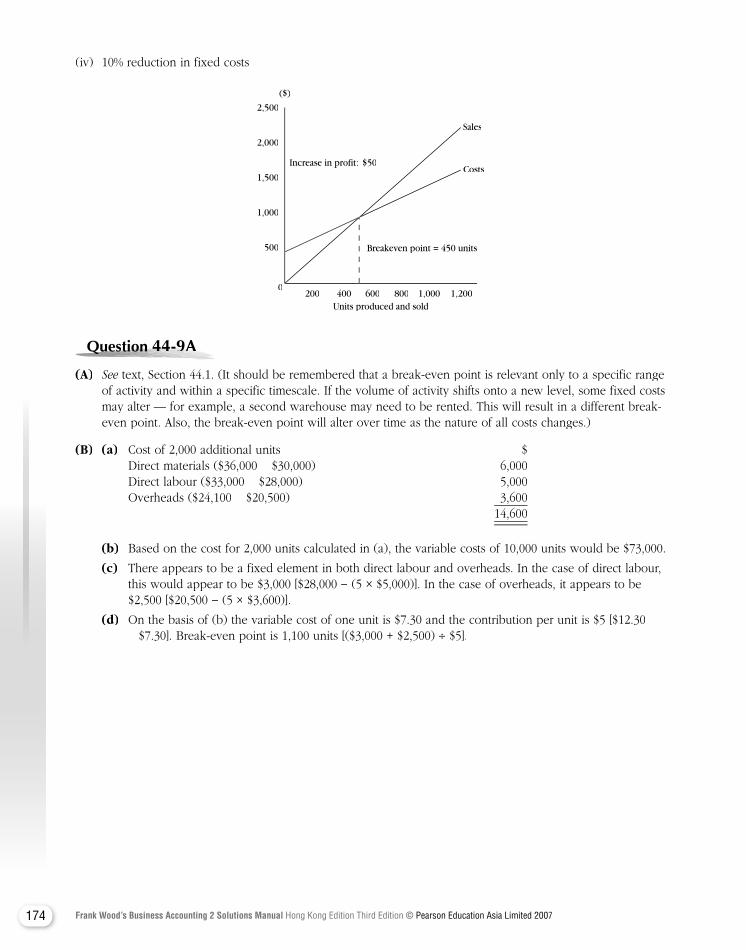
174 Frank Wood’s Business Accounting 2 Solutions Manual Hong Kong Edition Third Edition © Pearson Education Asia Limited 2007
(iv) 10% reduction in fixed costs
Question Question Question Question Question Question Question 44-9A44-9A44-9A44-9A44-9A44-9A
(A) See text, Section 44.1. (It should be remembered that a break-even point is relevant only to a specific range See text, Section 44.1. (It should be remembered that a break-even point is relevant only to a specific range Seeof activity and within a specific timescale. If the volume of activity shifts onto a new level, some fixed costs may alter — for example, a second warehouse may need to be rented. This will result in a different break-even point. Also, the break-even point will alter over time as the nature of all costs changes.)
(B) (a) Cost of 2,000 additional units $ Direct materials ($36,000 − $30,000) 6,000 Direct labour ($33,000 − $28,000) 5,000 Overheads ($24,100 − $20,500) 3,600 14,600
(b) Based on the cost for 2,000 units calculated in (a), the variable costs of 10,000 units would be $73,000.
(c) There appears to be a fixed element in both direct labour and overheads. In the case of direct labour, this would appear to be $3,000 [$28,000 − (5 × $5,000)]. In the case of overheads, it appears to be $2,500 [$20,500 − (5 × $3,600)].
(d) On the basis of (b) the variable cost of one unit is $7.30 and the contribution per unit is $5 [$12.30 − $7.30]. Break-even point is 1,100 units [($3,000 + $2,500) ÷ $5].
0
500
1,000
1,500
2,000
2,500
Increase in profit: $50
Sales
Costs
200 400 600Units produced and sold
800 1,000 1,200
Breakeven point = 450 units
($)
175Frank Wood’s Business Accounting 2 Solutions Manual Hong Kong Edition Third Edition © Pearson Education Asia Limited 2007
Question Question Question Question Question Question 44-10A44-10A44-10A44-10A44-10A44-10A44-10A
(a) Monarch Ltd Profit Statements
Original Options statement (1) (2) (3) Sales units (W1) 60,000 78,000 62,000 75,000Unit selling price $30 $27 $30 $30
$000 $000 $000 $000Sales 1,800 2,106 1,860 2,250Direct materials 480 585 496 577.5Direct labour 240 312 248 300Variable overheads 240 312 248 300 960 1,209 992 1,177.5Contribution 840 897 868 1,072.5Fixed costs: Production cost 260 290 260 285 Administration 90 95 90 94 Selling, marketing and distribution 100 110 127 147 450 495 477 526Profit 390 402 391 546.5
Contribution per unit ($) 14 11.50 14 14.30
(W1) Contribution = $840,000 for 60,000 units = $14 each. Contribution + Total variable cost = Selling price, therefore $14 + $16 = $30.
Monarch Ltd Profit Statements
Original Managing statement director’s option (4)Sales units 60,000 78,000Unit selling price $30 $29
$000 $000Sales 1,800 (F) 2,262
Direct materials 480 (+30% × 93.75%) 585Direct labour 240 (+30%) 312Variable overhead 240 (+30%) 312 960 (E) 1,209Contribution 840 (C) 1,053
Fixed costs: Production cost 260 417 Administration 90 — Selling, marketing and distribution 100 150
450 (B) 567Profit 390 (A) 486
Contribution per unit ($) 14 (D) 13.50
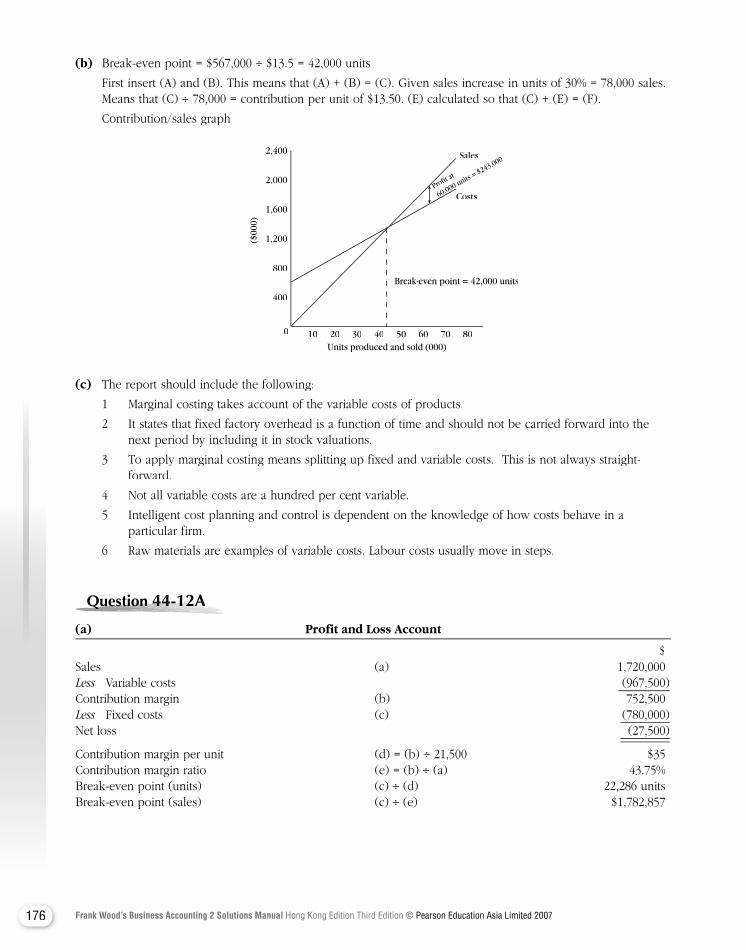
176 Frank Wood’s Business Accounting 2 Solutions Manual Hong Kong Edition Third Edition © Pearson Education Asia Limited 2007
(b) Break-even point = $567,000 ÷ $13.5 = 42,000 units
First insert (A) and (B). This means that (A) + (B) = (C). Given sales increase in units of 30% = 78,000 sales. Means that (C) ÷ 78,000 = contribution per unit of $13.50. (E) calculated so that (C) + (E) = (F).
Contribution/sales graph
0
400
800
1,200
1,600
2,000
2,400
Break-even point = 42,000 units
Sales
CostsProfit a
t
60,000 units = $243,000
($00
0)
2010 4030 50Units produced and sold (000)
60 70 80
Profit at
(c) The report should include the following:
1 Marginal costing takes account of the variable costs of products.
2 It states that fixed factory overhead is a function of time and should not be carried forward into the next period by including it in stock valuations.
3 To apply marginal costing means splitting up fixed and variable costs. This is not always straight-forward.
4 Not all variable costs are a hundred per cent variable.
5 Intelligent cost planning and control is dependent on the knowledge of how costs behave in a particular firm.
6 Raw materials are examples of variable costs. Labour costs usually move in steps.
Question Question Question Question Question Question 44-12A44-12A44-12A44-12A44-12A44-12A
(a) Profit and Loss Account
$Sales (a) 1,720,000Less Variable costs Less Variable costs Less (967,500)Contribution margin (b) 752,500Less Fixed costs (c) (780,000)Net loss (27,500)
Contribution margin per unit (d) = (b) ÷ 21,500 $35Contribution margin ratio (e) = (b) ÷ (a) 43.75%Break-even point (units) (c) ÷ (d) 22,286 unitsBreak-even point (sales) (c) ÷ (e) $1,782,857
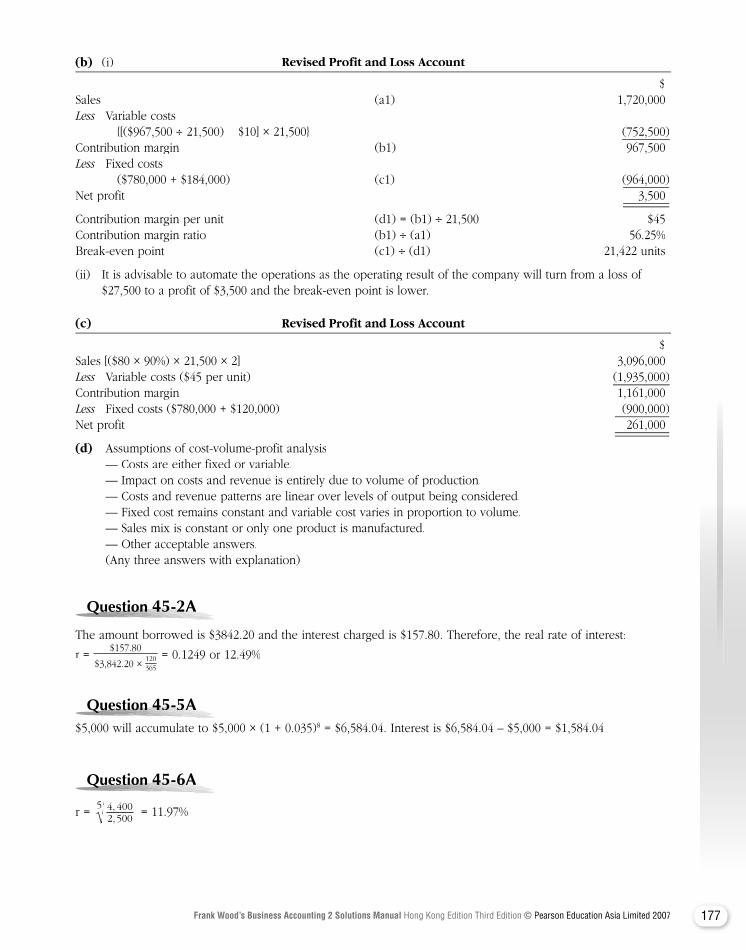
177Frank Wood’s Business Accounting 2 Solutions Manual Hong Kong Edition Third Edition © Pearson Education Asia Limited 2007
(b) (i) Revised Profit and Loss Account
$Sales (a1) 1,720,000Less Variable costs Less Variable costs Less {[($967,500 ÷ 21,500) − $10] × 21,500} (752,500)Contribution margin (b1) 967,500Less Fixed costs Less Fixed costs Less ($780,000 + $184,000) (c1) (964,000)Net profit 3,500
Contribution margin per unit (d1) = (b1) ÷ 21,500 $45Contribution margin ratio (b1) ÷ (a1) 56.25%Break-even point (c1) ÷ (d1) 21,422 units
(ii) It is advisable to automate the operations as the operating result of the company will turn from a loss of $27,500 to a profit of $3,500 and the break-even point is lower.
(c) Revised Profit and Loss Account
$Sales [($80 × 90%) × 21,500 × 2] 3,096,000Less Variable costs ($45 per unit) Less Variable costs ($45 per unit) Less (1,935,000)Contribution margin 1,161,000Less Fixed costs ($780,000 + $120,000) (900,000)Less Fixed costs ($780,000 + $120,000) (900,000)LessNet profit 261,000
(d) Assumptions of cost-volume-profit analysis — Costs are either fixed or variable. — Impact on costs and revenue is entirely due to volume of production. — Costs and revenue patterns are linear over levels of output being considered. — Fixed cost remains constant and variable cost varies in proportion to volume. — Sales mix is constant or only one product is manufactured. — Other acceptable answers. (Any three answers with explanation)
Question Question Question Question Question Question Question 45-2A45-2A45-2A45-2A45-2A45-2A
The amount borrowed is $3842.20 and the interest charged is $157.80. Therefore, the real rate of interest:
r = $157.80
$3,842.20 × 120365
= 0.1249 or 12.49%
Question Question Question Question Question Question Question 45-5A45-5A45-5A45-5A45-5A45-5A$5,000 will accumulate to $5,000 × (1 + 0.035)8 = $6,584.04. Interest is $6,584.04 – $5,000 = $1,584.04
Question Question Question Question Question Question Question 45-6A45-6A45-6A45-6A45-6A45-6A
r = 4, 4002,500
5 = 11.97%
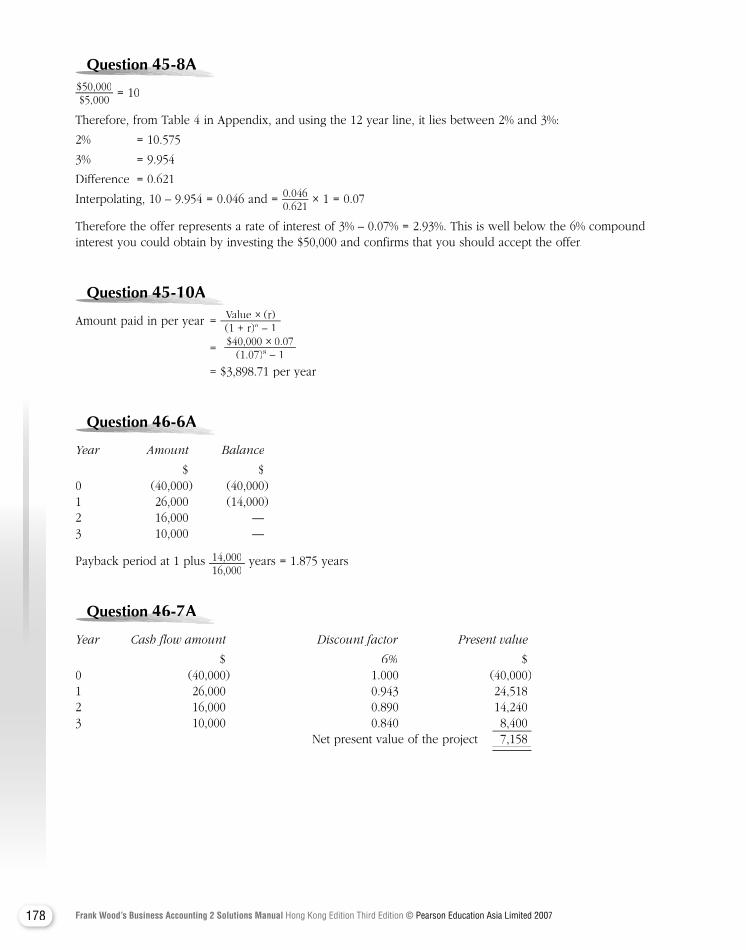
178 Frank Wood’s Business Accounting 2 Solutions Manual Hong Kong Edition Third Edition © Pearson Education Asia Limited 2007
Question Question Question Question Question Question Question 45-8A45-8A45-8A45-8A45-8A45-8A$50,000$5,000
= 10
Therefore, from Table 4 in Appendix, and using the 12 year line, it lies between 2% and 3%:
2% = 10.575
3% = 9.954
Difference = 0.621
Interpolating, 10 – 9.954 = 0.046 and = 0.0460.621
× 1 = 0.07
Therefore the offer represents a rate of interest of 3% – 0.07% = 2.93%. This is well below the 6% compound interest you could obtain by investing the $50,000 and confirms that you should accept the offer.
Question Question Question Question Question Question 45-10A45-10A45-10A45-10A45-10A45-10A45-10A
Amount paid in per year = Value × (r)(1 + r)n – 1
= $40,000 × 0.07(1.07)8 – 1
= $3,898.71 per year
Question Question Question Question Question Question Question 46-6A46-6A46-6A46-6A46-6A46-6A
Year Amount Balance
$ $0 (40,000) (40,000)1 26,000 (14,000)2 16,000 —3 10,000 —
Payback period at 1 plus 14,00016,000
years = 1.875 years
Question Question Question Question Question Question Question 46-7A46-7A46-7A46-7A46-7A46-7A
Year Cash flow amount Discount factor Present value
$ 6% $0 (40,000) 1.000 (40,000)1 26,000 0.943 24,5182 16,000 0.890 14,2403 10,000 0.840 8,400 Net present value of the project 7,158

179Frank Wood’s Business Accounting 2 Solutions Manual Hong Kong Edition Third Edition © Pearson Education Asia Limited 2007
Question Question Question Question Question Question Question 46-8A46-8A46-8A46-8A46-8A46-8A
Discount Present Discount PresentYear Amount factor value factor value $ 16% $ 18% $0 (40,000 ) 1.000 (40,000 ) 1.000 (40,000 )1 26,000 0.862 22,412 0.847 22,0222 16,000 0.743 11,888 0.718 11,4883 10,000 0.641 6,410 0.609 6,090 710 (400 )
16% discount rate gives NPV of 710 18% discount rate gives negative NPV of 400 1,110The IRR is 710
1,110 × 2% = 1.28% + 16% = 17.28%
Question Question Question Question Question Question Question 46-9A46-9A46-9A46-9A46-9A46-9A
From Table 4 in Apppendix, the present value of an annuity of $1 for three years at 6% is 2.673. The NPV accounting to the answer to Question 46-7A is $7,158. Therefore the annualised amount is:$7,1582.673
= $2,677.89.
Question Question Question Question Question Question 46-10A46-10A46-10A46-10A46-10A46-10A
Average return = $90,000
Average investment = ($128,000 + $8,000) ÷ 2 = $68,000
Accounting rate of return = $90,000$68,000
× 100
= 132.353%
Question Question Question Question Question Question 46-11A46-11A46-11A46-11A46-11A46-11A46-11A
Discount Present Discount PresentYear Amount factor value factor value $ 80% $ 90% $0 (128,000 ) 1.000 (128,000 ) 1.000 (128,000 )1 114,000 0.556 63,384 0.526 59,9642 114,000 0.309 35,226 0.277 31,5783 114,000 0.171 19,494 0.146 16,6444 114,000 0.095 10,830 0.077 8,7785 122,000 0.053 6,466 0.040 4,880 7,400 (6,156 )
80% discount rate gives NPV of 7,400 90% discount rate gives negative NPV of 6,156 13,556The IRR is 7,400
13,556 × 10% = 5.46% + 80% = 85.46%
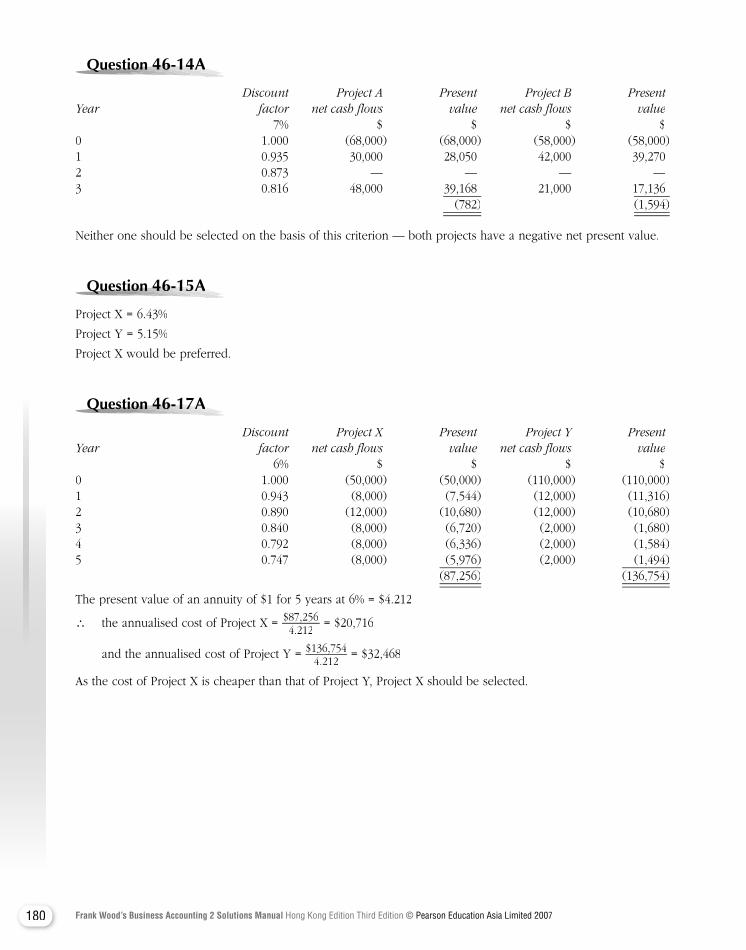
180 Frank Wood’s Business Accounting 2 Solutions Manual Hong Kong Edition Third Edition © Pearson Education Asia Limited 2007
Question Question Question Question Question Question 46-14A46-14A46-14A46-14A46-14A46-14A46-14A
Discount Project A Present Project B PresentYear factor net cash flows value net cash flows value 7% $ $ $ $0 1.000 (68,000 ) (68,000 ) (58,000 ) (58,000 )1 0.935 30,000 28,050 42,000 39,2702 0.873 — — — —3 0.816 48,000 39,168 21,000 17,136 (782 ) (1,594 )
Neither one should be selected on the basis of this criterion — both projects have a negative net present value.
Question Question Question Question Question Question 46-15A46-15A46-15A46-15A46-15A46-15A46-15A
Project X = 6.43%
Project Y = 5.15%
Project X would be preferred.
Question Question Question Question Question Question 46-17A46-17A46-17A46-17A46-17A46-17A46-17A
Discount Project X Present Project Y PresentYear factor net cash flows value net cash flows value 6% $ $ $ $0 1.000 (50,000 ) (50,000 ) (110,000 ) (110,000 )1 0.943 (8,000 ) (7,544 ) (12,000 ) (11,316 )2 0.890 (12,000 ) (10,680 ) (12,000 ) (10,680 )3 0.840 (8,000 ) (6,720 ) (2,000 ) (1,680 )4 0.792 (8,000 ) (6,336 ) (2,000 ) (1,584 )5 0.747 (8,000 ) (5,976 ) (2,000 ) (1,494 ) (87,256 ) (136,754 )
The present value of an annuity of $1 for 5 years at 6% = $4.212
∴ the annualised cost of Project X = $87,2564.212
= $20,716
and the annualised cost of Project Y = $136,7544.212
= $32,468
As the cost of Project X is cheaper than that of Project Y, Project X should be selected.
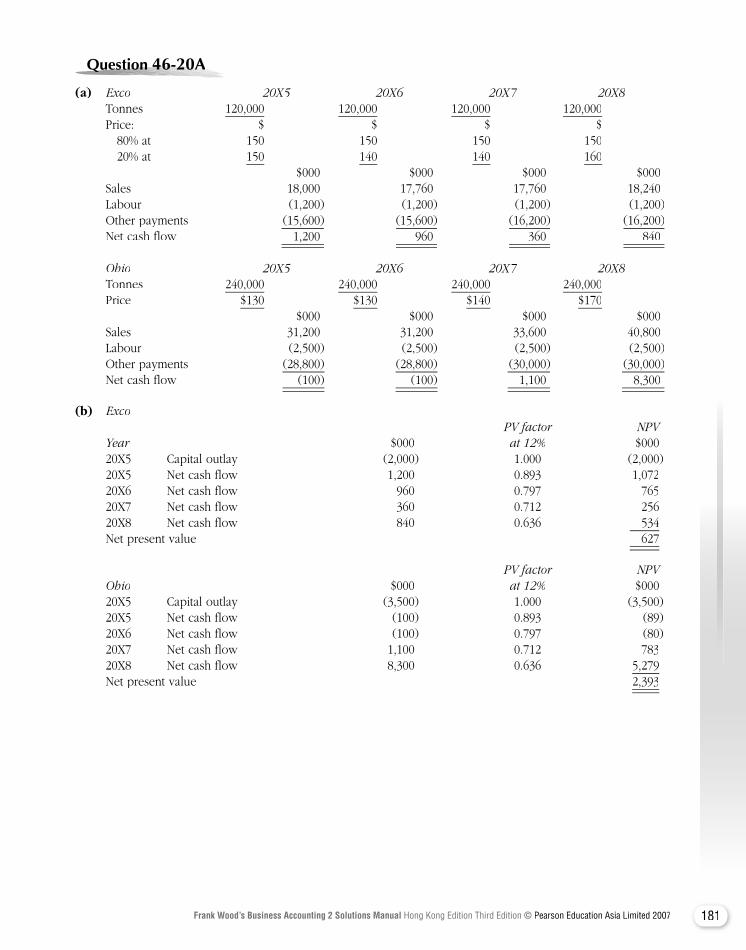
181Frank Wood’s Business Accounting 2 Solutions Manual Hong Kong Edition Third Edition © Pearson Education Asia Limited 2007
Question Question Question Question Question Question 46-20A46-20A46-20A46-20A46-20A46-20A
(a) Exco 20X5 20X6 20X7 20X8 Tonnes 120,000 120,000 120,000 120,000 Price: $ $ $ $ 80% at 150 150 150 150 20% at 150 140 140 160 $000 $000 $000 $000 Sales 18,000 17,760 17,760 18,240 Labour (1,200) (1,200) (1,200) (1,200) Other payments (15,600) (15,600) (16,200) (16,200) Net cash flow 1,200 960 360 840
Ohio 20X5 20X6 20X7 20X8 Tonnes 240,000 240,000 240,000 240,000 Price $130 $130 $140 $170 $000 $000 $000 $000 Sales 31,200 31,200 33,600 40,800 Labour (2,500) (2,500) (2,500) (2,500) Other payments (28,800) (28,800) (30,000) (30,000) Net cash flow (100) (100) 1,100 8,300
(b) Exco PV factor NPVYear $000 at 12% $00020X5 Capital outlay (2,000) 1.000 (2,000)20X5 Net cash flow 1,200 0.893 1,07220X6 Net cash flow 960 0.797 76520X7 Net cash flow 360 0.712 25620X8 Net cash flow 840 0.636 534Net present value 627
PV factor NPVOhio $000 at 12% $00020X5 Capital outlay (3,500) 1.000 (3,500)20X5 Net cash flow (100) 0.893 (89)20X6 Net cash flow (100) 0.797 (80)20X7 Net cash flow 1,100 0.712 78320X8 Net cash flow 8,300 0.636 5,279Net present value 2,393
182 Frank Wood’s Business Accounting 2 Solutions Manual Hong Kong Edition Third Edition © Pearson Education Asia Limited 2007
(c) The calculations of net present values indicate that the Ohio investment produces a higher NPV over the four-year period. In order to determine whether this represents a reasonable decision, the management would need to consider the reliability of estimates used — on volumes, sales forces and costs. Exco involves a lower capital outlay, which is expected to produce a payback just before the end of the second year (20X6). Ohio does not achieve payback until almost four months through the fourth year (20X8). Ohio only really comes into profit in the fourth year. If these fourth-year estimates are reliable, and may extend into future periods after 20X8, then Ohio is clearly preferable. The method of using net present value is entirely appropriate, assuming that the cost of capital figure has been reliably estimated. However, the NPV can only be valued if the information on which it is based is accurate. Great care must be taken to assess the sensitivity of the data to changes in the inputs in order to be aware of the underlying risks involved.
Question Question Question Question Question Question 46-21A46-21A46-21A46-21A46-21A46-21A46-21A
Rovers Football Club Exhibit A Jimmy Jam
Year 0 1 2 3 4 5 $ $ $ $ $ $Incremental receipts — 200,000 200,000 200,000 200,000 200,000Salary — (50,000) (50,000) (50,000) (50,000) (50,000)Transfer fee (200,000) — — — — — (200,000) 150,000 150,000 150,000 150,000 150,000
Exhibit B Johnny Star
Year 0 1 2 $ $ $Incremental receipts — 400,000 400,000Salary — (200,000) (200,000)Transfer fee (100,000) — — (100,000) 200,000 200,000
Exhibit C
Jimmy Jam Johnny StarYear Cash flow PV factor NPV Cash flow PV factor NPV $ at 12% $ $ at 12% $ 0 (200,000) 1.000 (200,000) (100,000) 1.000 (100,000) 1 150,000 0.893 133,950 200,000 0.893 178,600 2 150,000 0.797 119,550 200,000 0.797 159,400 3 150,000 0.712 106,800 238,000 4 150,000 0.636 95,400 5 150,000 0.567 85,050 340,750
183Frank Wood’s Business Accounting 2 Solutions Manual Hong Kong Edition Third Edition © Pearson Education Asia Limited 2007
Report to Rovers Football Club
The proposed transactions have been evaluated in Exhibits A, B and C to calculate the likely returns from the two players. On the figures quoted, both transactions produce a positive net present value using an interest rate of 12%, with the Jimmy Jam proposal providing the higher of the two. However, the club should consider the fact that the Johnny Star proposal provides a payback in the first year whereas the Jimmy Jam transfer would not achieve payback until after four months through Year 2.
If Jimmy Jam is successful, his five-year contract will provide benefits for three years more than Johnny Star. In both cases the whole proposal hinges on the validity of the assumed increase in revenue and the probability that the players will be fit to play and be popular with the crowds.