Embed Size (px)
Citation preview

PROGRAM ON THE GLOBAL DEMOGRAPHY OF AGING
Working Paper Series
Longitudinal Aging Study in India: Vision, Design, Implementation,
and Some Early Results
P. Arokiasamy, D. Bloom, J. Lee, K. Feeney, and M. Ozolins
November 2011
PGDA Working Paper No. 82 http://www.hsph.harvard.edu/pgda/working.htm
The views expressed in this paper are those of the author(s) and not necessarily those of the Harvard Initiative for Global Health. The Program on the Global Demography of Aging receives funding from the National Institute on Aging, Grant No. 1 P30 AG024409-06.

1
Longitudinal Aging Study in India: Vision, Design, Implementation, and Some Early Results*
P. Arokiasamy1, D. Bloom2, J. Lee3, K. Feeney3, and M. Ozolins4
November 2011
* An early version of this paper was presented in March 2011 at the Indian National Science Academy in New Delhi, India at a conference on “Aging in Asia”. The authors are indebted to the conference participants and to Larry Rosenberg for helpful comments. This research has been supported by NIA Grants R21AG032572 and P30AG024409. 1 International Institute of Population Sciences, Mumbai India. 2 Harvard School of Public Health. 3 RAND Corporation. 3 RAND Corporation. 4 Boston College School of Law.

2
Longitudinal Aging Study in India:
Vision, Design, Implementation, and Some Early Results
P. Arokiasamy, D. Bloom, J. Lee, K. Feeney, and M. Ozolins
Abstract
India is poised to experience a dramatic rise in its aging population in coming decades, yet comprehensive research and effective policy to confront this transition are lacking. According to projections constructed by the United Nations Population Division, the share of Indians aged 60 and over will increase from 8% today to 19% by 2050 (representing 323 million people, more than the entire US population in 2011). This demographic shift will pose significant challenges. India’s traditional reliance on private family networks to provide older people with care, companionship, and financial support will be stressed not only by the increasing number of aging Indians who rely on it, but also by changing household dynamics and patterns of spatial mobility among younger family members. The Longitudinal Aging Study in India (LASI) is intended to inform the design and expansion of a new generation of institutions – public and private – for the care and support of India’s population of older people by providing comprehensive data to the scientific and policy community. LASI is an evidence base for analyzing the (1) health, (2) economic and financial resources, and (3) living arrangements and social connections of older Indians. It enhances opportunities for cross-national analysis by adding India to the growing number of countries with harmonized data on their older populations. LASI surveys will be carried out every two years, providing longitudinal data to support research and policy development. This paper provides an overview of the conception and content of the 2010 LASI pilot survey that was conducted in four states: Punjab, Rajasthan, Karnataka, and Kerala. We highlight key aspects of the field work, such as response rates and interview duration, and discuss the breadth and quality of the economic, health, and social data collected. We pay close attention to the cultural and geographic diversity LASI is able to capture, and bring to light interesting patterns in, and relationships among, measures of health, social connectedness, labor force participation, and hardship among the elderly.

3
Section 1: Foundations for the Longitudinal Aging Study in India 1.1 The context: global population aging The world’s population is undergoing a dramatic shift in age structure, with rapid population aging among its most notable characteristics (Bloom, 2011a). The world’s population aged 60 and older is currently 760 million people, representing 11% of total population. By 2050, it is expected that 22% of total population, or 2.0 billion people, will be aged 60 and older. Moreover, the world’s proportion of individuals aged 80 or over is projected to more than double from now until 2050, rising from 1.5% to over 4%. This is equivalent to a 10-fold increase in the 60+ population and a 27-fold increase in the 80+ population, significantly larger demographic movements than the 3.7-fold increase the global population is expected to have experienced between 1950 and 2050. Population aging is a global phenomenon that all countries face, but global averages can mask considerable heterogeneity both across and within regions. Countries are at various stages of the process: the share of the 60+ population ranges from under 5% in a number of African and Gulf countries to over 20% in several European and East Asian countries. However, there is much less heterogeneity with respect to time trends; population aging will take place in all regions and countries going forward. These trends have given rise to increased public thinking and dialogue on the issue of population aging. Some researchers suggest that population aging has substantial capacity to diminish the productive capacities of national economies. Other studies suggest that any negative effects on economic growth are likely to be no more than modest (Bloom, Canning, and Fink, 2010; Boersch-Supan and Ludwig, 2010). Regardless of the effect on the economy as a whole, population aging will lead to increased need for elder care and support, at a time when, in developing societies, traditional family-based care is becoming less the norm than in the past. In addition, a higher share of older people will affect budget expenditures (less for education, but more for health care) and may affect tax rates. 1.2 Population aging in India: trends and challenges With 1.21 billion inhabitants counted in its 2011 census, India is the second most populous country in the world. Currently, the 60+ population accounts for 8% of India’s national population, translating into roughly 93 million people. By 2050, its 60+ population share is projected to climb to 19%, or approximately 323 million people. The elderly dependency ratio (the number of persons aged 60 or older per person aged 15 to 59) will rise dramatically from 0.12 to 0.31, largely as a result of fertility decline and increasing life expectancy. At the same time, India’s older population will be subject to a higher rate of noncommunicable diseases, a higher share of women in the workforce (and thus less able to care for the elderly), children who are less likely to live near their parents, and a lack of policies to deal these issues (Bloom, 2011b).5
Several forces are driving India’s changing age structure, including an upward trend in life expectancy and falling fertility. An Indian born in 1950 could expect to live for 37 years, whereas today India’s life expectancy at birth has risen to 65 years; by 2050 it is projected to increase to
5 James (2011) points out that the history of long-term population predictions for India has been marked by major inaccuracies.

4
74 years. Fertility rates in India have declined sharply, from nearly 6 children per woman in 1950 to 2.6 children per woman in 2010. India has also been experiencing a breakdown of the traditional extended family structure; currently, India’s older people are largely cared for privately, but these family networks are coming under stress from a variety of sources (Bloom, Mahal, Rosenberg, and Sevilla, 2010; Pal, 2007). India is in the early stages of establishing government programs to support an aging population. Many Indians have limited access to health care, and with increased numbers of older people, demands on the health system will increase (Yip & Mahal, 2008; WHO, 2012.) Less than 10% of the Indian population has health insurance (either public or private), and roughly 72% of all health care spending is out-of-pocket expenditure. India’s aging population is particularly at risk, as it is excluded from the health insurance scheme for the poor, which covers only those aged 65 or younger. Older Indians also face economic insecurity; 90% of them have no pension. According to official statistics, labor force participation remains high (39%) among those aged 60 and older and is especially high (45%) among the same age group in rural areas (see Registrar General, 2001 and Alam 2004). These high participation rates reflect an overwhelming reliance on the agriculture and informal sectors, which account for more than 90% of all employment in India. They also reflect the inadequacy of existing social safety nets for older people (Bloom, Mahal, Rosenberg, and Sevilla, 2010). In addition, more than two-thirds of India’s elderly live in rural areas, limiting their access to modern financial institutions and instruments such as banks and insurance schemes. With India in the early stages of a transition to an older society, little is known about the economic, social, and public-health implications of this transition. Until recently, no efforts were under way to establish a broad, nationally representative dataset specifically covering the status of older people. However, such data are needed to conduct analyses of population aging and to formulate mid- and long-term policies to address the challenges it presents. The Longitudinal Aging Study in India (LASI) is an effort to help fill this gap by implementing a large-scale, nationally representative, longitudinal survey on aging, health, and retirement in India. LASI’s longitudinal character is key: by carrying out the survey over an extended period, researchers will be able to assemble a dataset that shows the changes India’s older population is undergoing, and at the same time have access to up-to-date data. The survey results and subsequent data analyses will be disseminated to the research community and policymakers. LASI joins several existing sister surveys of the seminal Health and Retirement Study (HRS), a longitudinal survey of Americans aged 50 and older conducted by the Institute for Social Research (ISR) at the University of Michigan and supported by the National Institute on Aging (NIA). Through in-depth interviews, HRS measures health and its determinants and consequences over the later portions of the life cycle, and integrates three major domains of life into a common survey: health, economics, and social circumstances. Some of the hallmarks of HRS include: a science-based agenda, methodological innovations, respect for local knowledge, and public access to de-identified data. HRS has inspired similar studies outside the US, including LASI; current and planned HRS-type studies cover over 25 countries on four continents (Lee, 2010). One striking feature of the HRS-type surveys is the possibility of pooling data from different countries to assess the effects of differing institutions on behavior and outcomes. This is possible due to the effort that has gone into harmonizing HRS-type survey

5
instruments. Taken as a whole, the HRS family offers many unique opportunities to widen and deepen existing research on the nature and implications of population aging.6
Section 2: Longitudinal Aging Study in India (LASI) 2.1 Design and vision In this section, we discuss the design and sampling frame for the LASI pilot, highlighting some of the unique features that allow researchers using the data to begin to identify and answer important questions about population aging in India. We also evaluate the validity of the fieldwork by comparing the LASI pilot sample to that of other surveys in India. To capture the demographic, economic, health, and cultural diversity in India, the LASI pilot focused on two north Indian states (Punjab and Rajasthan) and two south Indian states (Karnataka and Kerala). Rajasthan and Karnataka were included to provide some overlap with SAGE. Punjab is an economically developed state, while Rajasthan is relatively poor. Kerala, which is known for its relatively developed health care system, has undergone rapid social development and is included as a potential harbinger of how other Indian states might evolve (Pal & Palacios, 2008). The LASI instrument was developed in English and translated into the dominant local language in each of the four states: Punjabi (Punjab), Hindi (Rajasthan), Kannada (Karnataka), and Malayalam (Kerala). The LASI questionnaire was also designed to collect information conceptually comparable to HRS and its sister surveys on aging in other countries.7 The instrument is thus comprised of a household survey, which was collected only once for each household by interviewing a selected key informant (i.e., a knowledgeable adult age 18 or older, ideally the head of household)8
about household finances and living conditions for those in the household; an individual survey, which was collected for each age-eligible respondent at least 45 years of age and their spouse (regardless of age); and a biomarker module, also collected for each consenting age-eligible respondent and their spouse.
The household survey consists of five sections: a household roster detailing basic demographic information about each household member; a questionnaire about the housing and neighborhood environment, including questions about access to water, neighborhood conditions, and other attributes of the physical residence; income of all family members from labor and non-labor sources; assets and debts of the household; and consumption and expenditure of the household on food and non-food items, including items that were exchanged in kind, gifted, or home grown.
6 Another source of valuable micro-data on older populations is the Study on Global AGEing and Adult Health, or SAGE, developed by the World Health Organization Multi-Country Studies Unit. However, SAGE covers only six countries (China, Ghana, India, Mexico, Russian Federation, and South Africa), it is not focused exclusively on older people, and it does not provide as much opportunity for analyzing economic and financial data as the HRS family of surveys. 7 These include the Health and Retirement Study (HRS) in the United States, the English Longitudinal Survey of Ageing (ELSA), the Chinese Health and Retirement Longitudinal Survey (CHRLS), the Indonesian Family Life Survey (IFLS), the Korean Longitudinal Study of Aging (KLoSA), the Japanese Study of Aging and Retirement (JSTAR), and the Study of Health, Aging, and Retirement in Europe (SHARE), which covers 15 European countries. 8 It was assumed that the majority of key informants would be respondents who would answer the individual questionnaire as well.

6
The individual survey consists of seven sections: demographics, family and social networks, health, health care utilization, work and employment, pension and retirement, and one experimental section.9
An important component of the health section of the survey is a biomarker module collected by the interview team. Given the lack of health care services in India, biological markers (e.g., anthropometrics, blood pressure, and dried blood spots) and performance measures (e.g., gait speed, grip strength, balance, lung function, and vision) allow researchers to assess the health of LASI’s sample population. The dried blood spot collection, for example, allows for up to 35 different assays, including four that the LASI team initially plans to test: C-reactive protein (CRP, a marker of inflammation), glycosylated hemoglobin (HbA1c, a marker of glucose metabolism), hemoglobin (Hb, a marker of anemia), and Epstein-Barr virus (EBV) antibodies (a marker of cell-mediated immune function).
2.2 Sampling plan, fieldwork, and administration Funded by the National Institute of Aging, LASI is a partnership between the Harvard School of Public Health, the International Institute for Population Sciences in Mumbai, India, and the RAND Corporation. Also involved in LASI are two other Indian institutions, the National AIDS Research Institute (NARI) and the Indian Academy of Geriatrics (IAG), and the University of California - Los Angeles (UCLA) School of Medicine. The fieldwork in India was carried out by a network of Population Research Centers shown in Table 1. Fieldwork lasted from October to December 2010 across the four Indian states. The rapid turnaround from data collection to the analysis of the data was possible through use of state-of-the-art technology in data management and Computer Assisted Personal Interviewing (CAPI). These technologies improve both the efficiency of data collection/capture and data quality. CAPI also introduces additional innovations that allow the survey to adapt in real time to responses from the respondent, essentially creating (partially) customizable surveys for each individual interview. Table 1. Administration of the 2010 LASI Pilot Survey Karnataka Kerala Punjab Rajasthan Timeline From 29 October 1 November 14 November 14 November To 3 December 14 December 12 December 18 December Organization
Population Research Centre, Institute for Social and Economic Change, Bangalore
Population Research Centre, Department of Demography, University of Kerala, Thiruvananthapuram
Population Research Centre, Department of Economics, Himachal Pradesh University, Shimla
Population Research Centre, Department of Economics, University of Lucknow, Lucknow
Notes: LASI fieldwork was planned in order to avoid monsoon season, which typically lasts from June to September.
9 The experimental section consists of a module of questions on one of the following three topics, randomly assigned: economic expectations, anchoring vignettes, and social networks.

7
Using the 2001 Indian Census10
, we drew a representative sample from the four selected states. Age-qualifying individuals were drawn from a stratified, multistage, area probability sampling design, beginning with census community tracts. From each state, two districts were selected at random from the complete list of Census districts for 2001; eight primary sampling units (PSUs) were randomly selected from each district. PSUs were chosen to match the urban/rural share of the population. Twenty-five residential households were then selected through systematic random sampling from each PSU, from which an average of 16 households contained at least one age-eligible individual.
The LASI pilot achieved a household response rate of 88.5%, calculated as the ratio of consenting households to eligible households (as further adjusted for cases of no contact, missing eligibility information, or refusal to give eligibility information; see Table 2). The individual response rate (90.9%) and biomarker module response rate (89%) were calculated conditional on belonging to a household that consented to participate in the LASI interview. Eligible households were defined as those with at least one member 45 years of age or older, and eligible individuals were those who were 45 years of age or older or married to an individual who was.11
Among households and individuals that consented to start the LASI interview, not all individual or household modules were completed after initial consent was given. Table 2 tabulates the number of respondents and households that completed an individual or household interview; these 950 households and 1,683 individuals constitute the complete LASI pilot sample. Of the 1,683 individuals who completed an individual interview, 1,486 respondents12
were over 45 years of age. The 197 who were not age-eligible were female spouses of age-qualifying participants.
Table 2 also presents details about selected potentially sensitive questions. The response rate for the dried blood spot (DBS) collection reflects the share of respondents who specifically consented to give DBS. We also find a high rate of response to questions about the respondent’s satisfaction with their relationship with their spouse, which is asked in the family and social network module. Similarly, when respondents were asked in one of the three experimental modules to consider the probability that they would die in one year, 88% of respondents overall consented to answer, though there was considerable heterogeneity in response rates across states. We also include response rates to questions on household income and consumption. Given low literacy/numeracy and the prevalence of in-kind exchange,
10 The Indian Census is conducted every 10 years. The 2011 wave was recently released, so the first full LASI wave will be able to utilize the latest population sample during field work. 11 Eligible age for response rates was determined from the coverscreen household roster, which was reported by the household respondent, who was not always an individual respondent. The respondent who consented to the individual interview did self-report age in the demographics component of the module, effectively creating two possible age variables. On occasion some individuals who were listed as 45 years or older reported they were not and vice versa in the individual interview. For consistency, we calculate the response rates using ages reported in the coverscreen, though for the remaining analysis presented in the paper we rely on self-reported age.The results of all models were not sensitive to the age variable used. 12 Of the 1486 respondents who were identified in the coverscreen as being age 45 and older, 1451 confirmed that status in the individual interview. We use these 1451 as our analysis sample. The remaining 232 respondents consists of 230 who self-reported their age as less than 45 (of which 181 were also identified as less than age 45 in the coverscreen), and 2 who did not report an age. These 232 individuals were not included in the analysis sample.

8
specific valuations of income and expenditure sources may be difficult for some respondents. However, the figures in Table 2 show that most household-level respondents were able to provide a meaningful answer to such questions.13
13 The LASI data include imputed household income and expenditure, which were determined through a hotdeck imputation method. In calculating response rates, we consider only households for which no imputation was computed for missing monetary amounts. Cases in which expenditures are imputed are included in our regression analyses that use expenditure as a regressor, but not in regression analyses in which expenditure is the dependent variable.

9
Table 2. LASI Pilot Study, Response Rate Urban Rural Punjab Rajasthan Kerala Karnataka Total Household survey Sampled 485 1,062 375 371 395 406 1,547 Unable to contact 10 13 0 0 17 6 23 Contact established 475 1049 375 371 378 400 1,524
Age eligible 325 756 254 255 297 275 1,081 Not eligible 140 284 120 114 70 120 424 Unknown eligibility 10 9 1 2 11 5 19
Did not start interview 31 56 28 13 24 22 87 Started interview 294 700 226 242 273 253 994 Completed interview 281 669 222 230 261 237 950 Household Response Rate 85.2% 90.0% 88.6% 94.2% 84.0% 88.5% 88.5% Individual survey Total eligible 567 1,359 419 485 559 463 1,926
Age eligible 505 1,201 385 423 506 392 1,706 Spouse eligible 62 158 35 61 53 71 220
Started individual interview 492 1,259 410 436 483 422 1,751 Age eligible 439 1,109 375 380 436 357 1,548 Spouse eligible 53 150 35 56 47 65 203
Completed individual interview 472 1,211 402 417 462 402 1,683 Age eligible 419 1,067 368 363 418 337 1,486 Spouse eligible 53 144 34 54 44 65 197
Individual Response Rate 86.8% 92.6% 97.9% 89.9% 86.4% 91.1% 90.9% Biomarker module Total eligible 567 1359 419 485 559 463 1,926 Consented to start biomarker module 474 1241 398 436 480 401 1,715 Biomarker response rate (%) 83.6% 91.3% 95.0% 89.9% 85.9% 86.6% 89.0% Response rates for selected questions (%) Dried blood spot collection (biomarker module) 64.6 77.5 76.4 75.8 69.6 76.5 74.3 Satisfaction with spousal relationship (family and social networks) 93.4 93.9 97.3 90.6 89.0 99.7 93.8 Income (household questionnaire) 77.2 79.2 77.9 73.5 85.1 77.2 78.6 Consumption (households questionnaire) 79.4 82.8 92.3 73.9 80.8 80.6 81.8 "Probability" respondent will die in 1 year (expectations module) 87.3 88.0 94.7 89.1 71.6 98.5 87.8 Notes: Response rates are calculated by dividing the total number of individuals or households who consented to the interview by the total number of contacted, eligible individuals (including spouses under 45 years of age) or households as reported in the coverscreen household component of the interview. Households that were not contacted indicate cases when the interviewing team was unable to speak with an individual residing at the house either because no one was home, the family has moved, or for some other reason. Five contact attempts were suggested before classifying a household as "no contact." The household response rate across all states is thus calculated by dividing 994 households that initially consented by the sum of the number of no contacts (23), the contacted eligible households (1,081), and the 19 households with missing or refused age eligibility. Note that this reflects a conservative estimate to the response rate. The individual response across all states is calculated by dividing the 1,751 individuals who consented to start the individual interview by the 1,926 eligible household members listed in the coverscreen of the household roster once the survey began. Response rates for select questions pertain to respondents who were asked that specific question, not the total eligible persons listed in the coverscreen. This approach was chosen to best capture the effects of the sensitive nature of the questions. Thus the dried blood spot collection response rate captures the share of respondents who specifically agreed to participate. Response rates for income and consumption are among households and are the share of households that did not require imputation and had no missing income components queried about during the household module. The probability respondents will die in 1 year is a question from the expectations module, one of three experimental modules that was randomly assigned to respondents at the end of the individual interview. The question asked respondents to select a number of beans from a pile of ten beans to indicate how likely they were to die in the next year. Response rates for more standard survey questions were 98% and above; response rates of selected questions were chosen to showcase survey items with lower response rates.

10
Table 3 presents the total administration time and administration time by survey module. We first observe significant heterogeneity across states; some of this is due to geographic and demographic differences between states. For example, Kerala is a state with relatively high self-reported morbidity, so respondents took more time when answering questions related to their health. Among the household interviews, respondents in Rajasthan – a primarily rural state – spent more time answering questions about agricultural income or assets. Because of the length of the interview, some interviews were split over time: about 15% of the interviews occurred over a span of two or more days.14
Table 3. Mean Survey Duration by State of Key Survey Components (in minutes) Punjab Rajasthan Kerala Karnataka All
States Total time at HH 215.2 137.3 205.2 137.4 174.7
Household Module Total 41.9 29.1 37.6 24.6 33.4
Housing and environment 9.2 7.6 7.0 5.3 7.2 Consumption 12.3 7.6 13.1 7.3 10.1 Income 7.9 5.0 7.4 5.2 6.4 Agricultural income and assets 3.9 4.0 1.7 2.1 2.9 Financial assets and real estate 8.6 5.0 8.5 4.8 6.8
Number of interviews 222 230 261 237 950 Individual Module
Total 93.9 57.8 92.5 66.5 78.1 Demographics 9.5 5.7 6.7 5.6 6.9 Family and social network 15.0 11.2 13.1 8.9 12.1 Health 27.4 17.2 30.5 15.9 23.0 Health care utilization 4.7 2.7 4.8 3.0 3.8 Employment 7.2 2.5 7.3 4.8 5.5 Pension 4.2 1.1 2.7 2.0 2.5 Experimental: social connectedness 11.3 4.9 10.0 7.6 8.4 Experimental: expectations 5.9 3.5 6.2 3.0 4.7 Experimental: vignettes 4.8 1.5 4.1 1.7 3.1 Biomarker 18.9 14.2 21.0 22.3 19.1
Number of interviews 402 417 462 402 1683 Number of individual interviews per HH 1.8 1.8 1.8 1.7 1.8
Duration of interviews One day (n) 298 338 390 380 1406 Multiple days (n) 103 74 61 20 258 Interviews lasting multiple days (%) 25.7 18.0 13.5 5.0 15.5 Note: Total time at HH is the average time spent at a household, including the time spent conducting the household module and all individual modules (including the biomarker module). The mean duration of the household module was 33 minutes. For the individual interview, including the biomarker module, the mean duration was 78 minutes. Households had a mean of 1.8 respondents who completed individual interviews. 2.3 Profile of LASI respondents The LASI design and implementation was successful in creating a sample comparable to other nationally representative surveys conducted in India. In Table 4, we present the initial results of
14 Such a span took place when at some point during the interview, the interview team was asked to leave and come back on a different day.

11
the fieldwork through a comparison of the basic demographic indicators of LASI respondents to those of respondents from other surveys conducted in India: the National Sample Survey (NSS), the India Human Development Survey (IHDS), the World Health Survey (WHS), and the Study on Global AGEing and Adult Health (SAGE). As the other surveys have broader age inclusion categories, we restrict the comparison to individuals aged 45 and older only. We compare the distribution of demographic characteristics for those aged 45 and older across the four surveys, looking specifically at age, sex, urban-rural residence, marital status, and education. We expect some differences across these metrics, given the different sets of states surveyed. For example, LASI has a comparatively small sample size from four diverse states, including Kerala, which is exceptional because of the relatively high level of educational attainment among the population. This is reflected in Table 4: 22% of the LASI sample reports having some high school or more for their education, which is higher than the other datasets. With respect to this indicator, LASI is most comparable to SAGE (19%), which likely reflects the overlap in state coverage. Table 4 takes a closer look at the LASI pilot and SAGE results; the SAGE states of Karnataka and Rajasthan were included in the LASI pilot in part to measure the validity of the LASI sample against a more established survey, so we examine the validity of these states’ samples separately. In these two states we again see similar respondent populations, despite the small sample sizes in the LASI pilot. The LASI sample in Rajasthan is slightly older than that of SAGE, while in Karnataka the sample was slightly younger. LASI surveyed proportionally more women from Karnataka than did SAGE. The differences in education and marital status are negligible.

12
Table 4. External Validity: Comparison of LASI to Other Surveys on Select Demographic Indicators All States in Sample Rajasthan Karnataka LASI NSS IHDS WHS SAGE LASI SAGE LASI SAGE Survey year 2010 2004 2004-05 2003 2007-08 2010 2007-08 2010 2007-08 Total number individuals 1683 383338 215754 10750 12198 417 2374 402 1744 Number of individuals aged 45+ 1451 81146 45074 3706 7841 358 1587 315 1139 Age structure (%) among Respondents 45 Years and Older Age 45-54 44.3 44.1 44.9 41.7 48.7 43.1 49.9 49.5 52.3 Age 55-64 28.4 32.7 29.7 26.1 28.3 23.4 26.9 31.8 25.8 Age 65-74 17.8 17.4 17.9 18.1 16.4 21.8 16.3 14.0 15.2 Age 75+ 9.5 5.9 7.6 14.1 6.7 11.8 6.8 4.8 6.8 Sex (%) among Respondents 45 Years and Older Male 48.7 50.5 51.4 50.7 55.2 51.5 53.7 47.6 56.6 Female 51.3 49.5 48.6 49.4 44.8 48.5 46.3 52.4 43.5 Residence (%) among Respondents 45 Years and Older Urban 27.1 26.3 26.9 11.1 26.8 19.2 20.5 35.7 32.3 Rural 72.9 73.8 73.1 88.9 73.2 80.8 79.5 64.3 67.7 Marital Status (%) among Respondents 45 Years and Older Married 78.0 75.8 78.2 80.7 81.5 81.0 81.5 75.3 82.4 Never married 1.8 1.1 0.7 1.3 0.6 0.9 0.3 2.2 0.4 Divorced 1.2 0.6 0.5 0.7 0.6 1.4 0.7 0.6 0.5 Widowed 19.1 22.5 20.6 17.3 17.3 16.8 17.5 21.9 16.7 Education (%) among Respondents 45 Years and Older No education 48.2 58.6 53.2 63.4 47.6 79.1 62.7 42.6 48.1 <5 years 8.1 8.6 10.7 11.2 13.2 3.3 9.3 12.9 14.2 5-9 years 22.0 19.5 21.0 15.0 19.8 8.3 15.2 23.6 17.5 10+ years 21.7 13.4 15.1 10.5 19.4 9.2 12.7 20.9 20.2 Notes: For this table, we use the 1,451 respondents who self reported age of at least 45 years in the individual interview. LASI is the Longitudinal Study of Aging in India, NSS is the National Sample Survey, IHDS is the Indian Human Development Survey; WHS is the World Health Survey; and SAGE is the Study on Global AGEing and Adult Health. SAGE states include Assam, Karnataka, Maharashtra, Rajasthan, Uttar Pradesh, and West Bengal. The National Sample Survey (NSS) is a yearly, nationally representative, cross sectional survey of all Indian states conducted by the Indian government's Ministry of Statistics and Programme Implementation. The Indian Human Development Survey (IHDS) is a nationally representative survey among 33 states and territories conducted between 2004 and 2005 to assess the health of all household members, with special questions to assess children’s well-being. It is conducted by the University of Maryland. The World Health Survey (WHS) is a nationally representative survey conducted by the World Health Organization and was later reorganized as the SAGE survey to target aging populations and produce harmonized survey data with parallel efforts in Africa, Latin America, and Eastern Europe.
Section 3: What can we learn from LASI? 3.1 What does the aging population look like in India? The LASI pilot is able to provide researchers with a picture of life for aging Indians that reflects the significant regional and social variations within the country: even the most basic demographic indicators – such as education, marital status, and self-rated health – differ not only by gender and socioeconomic status within regions, but also across regions. Table 5 displays these demographic differences in the representative LASI sample of those aged 45 years and older as self-reported in the demographics module. Men and women both have a mean age of 58, and there is a slightly higher representation of men among rural populations, which make up 70% of the sample overall. Figure 1 shows a similar age distribution among men

13
and women, though there are more women than men in the 45 to 59 group, as well as more women among respondents 85 years and older. Men are also more likely to be married and women more likely to be widowed, an important demographic difference that reflects the traditional age gap between spouses in India. Educational attainment is also higher for men than women (5.1 vs. 3.4 years, which corresponds to 58% of men being able to read and write, compared with only 41% of women). We note, however, the considerable heterogeneity across states – Kerala stands out for its literate population (88.3%), compared with only 19% in Rajasthan.

14
Table 5: Demographic Characteristics by Gender and State in LASI Sample Men Women Punjab Rajasthan Kerala Karnataka N 706 745 365 358 413 315 Age (yrs) 58.1 57.9 56.9 59.0 60.4 55.3 [10.17] [11.26] [11.07] [11.26] [10.81] [8.86] Rural 75.7 71.8 70.6 82.4 75.8 63.9 [0.41] [0.44] [0.46] [0.33] [0.40] [0.48] Married 91.5 64.3 80.7 80.4 75.8 74.8 [0.28] [0.48] [0.39] [0.38] [0.42] [0.43] Widowed 6.3 31.9 18.4 17.2 18.9 22.6 [0.24] [0.46] [0.39] [0.36] [0.38] [0.42] Household Size (no. of persons) 5.3 5.3 5.1 6.5 4.4 4.9 [2.71] [2.97] [2.93] [2.88] [2.05] [2.84] Scheduled Caste 13.8 15.1 34.5 10.0 7.0 17.0 [0.34] [0.36] [0.48] [0.28] [0.24] [0.38] Scheduled Tribe 15.4 13.3 0.0 36.3 0.0 8.8 [0.36] [0.34] - [0.47] - [0.28] Other Backwards Caste 38.4 39.4 9.7 27.9 42.5 60.6 [0.48] [0.48] [0.30] [0.44] [0.49] [0.49]
None/Other Caste or Tribe 32.5 32.1 55.8 25.8 50.5 13.6 [0.46] [0.46] [0.50] [0.42] [0.49] [0.34] Hindu 75.6 75.7 30.2 84.6 71.1 89.6 [0.42] [0.43] [0.46] [0.34] [0.44] [0.31] Muslim 7.9 8.1 0.0 15.1 4.5 6.7 [0.26] [0.27] - [0.34] [0.21] [0.25] Christian 6.1 7.6 1.0 0.0 24.4 2.6 [0.24] [0.26] [0.10] - [0.41] [0.16] Sikh 8.2 7.4 60.2 0.0 0.0 0.0 [0.28] [0.26] [0.49] - - - Other religion 1.8 1.3 8.6 0.3 0.0 1.1 [0.13] [0.11] [0.28] [0.06] [0.00] [0.10] Education (yrs) 5.1 3.4 3.3 1.7 7.7 4.4 [5.10] [4.43] [4.45] [3.65] [3.70] [4.79] Literate 57.4 40.7 41.4 18.7 88.3 51.4 [0.49] [0.49] [0.49] [0.37] [0.31] [0.50] Labor Force Participation 71.3 26.2 47.1 55.7 32.9 53.8 [0.45] [0.44] [0.50] [0.48] [0.46] [0.50]
Per Capita Income (Rs) 41752 42123 53888 31354 68930 25272 [92649] [84883] [85304] [77059] [125534] [44460] Self-Rated Health 3.3 3.2 3.5 3.4 2.8 3.5 [0.80] [0.80] [0.78] [0.85] [0.72] [0.64] Poor or Fair Self-Rated Health 12.3 15.7 12.3 14.5 24.3 5.4 [0.32] [0.36] [0.33] [0.34] [0.42] [0.23]

15
Notes: This table only considers respondents who self reported age of at least 45 in the individual interview and provided an answer for each of the variables listed in the table. All numbers are reported as a percent unless otherwise noted; standard deviations are reported in brackets. LASI used a stratified sampling design that sampled respondents independently by state, rural-urban areas, and district. Means are weighted using either the pooled-state weight or the state-specific weight and the standard errors have been corrected for design effects of stratification. Labor force participation is a dummy variable for having worked in the last 12 months. It includes self-employment, employment by another, or agricultural work both paid and unpaid as reported in the household income module by a household financial respondent or as self-reported in the individual interview. Self-rated health asks respondents whether they feel their health in general is excellent (scored 5), very good (4), good (3), fair (2), or poor (1). Economic activity also differs by sex; 69% of men report working in the last year in either agricultural labor, for an employer, or self-employed work, compared to less than a quarter of women. Men tended also to have better self-rated health than women, and women were more likely to report poor or fair self-rated health. Generally, women in the sample were more likely to be widowed, less educated, have lower self-rated health, and to be not working, which is consistent with literature on India and other surveys. Figure 1. Population Pyramid for LASI Respondents
Note: Among respondents ages 45 years and older only. Table 5 also shows some important inter-state differences across the LASI sample. Kerala has an older sample, with a mean age of 60, while the other southern state in the LASI sample, Karnataka, has a comparatively young population (with a mean age of 56) compared to the other three states. Rajasthan tends to be more rural than the other states and Karnataka the least rural. Family demographics, such as household size and marital status, vary as well. The distribution of caste, tribe, and religion across the four states reflects the regional and socio-cultural variation that LASI has been able to capture. About one-third of the Rajasthan sample identifies itself as members of a scheduled tribe, while in Punjab, almost 60% of the population does not identify itself as a scheduled tribe, scheduled caste, or other backward caste. Each state also reflects the diversity in religious belief systems in India – the large Sikh population in Punjab and the sizable Christian population in Kerala, in addition to Hindus and Muslims that make up most of Karnataka and Rajasthan.

16
These four states reflect different patterns of social and economic well-being. For example, Kerala’s population has comparatively high educational attainment, attributable to a legacy of social development programs. Respondents from Kerala are older and report relatively low labor force participation and worse health than respondents from the other states. The higher prevalence of poor or fair self-rated health may indeed reflect high morbidity in the population, but high literacy rates and better access to health care services than other Indian states also contribute to a more health-literate population (Bloom, 2005). Conversely, Rajasthan, the poorest state in the sample, has the lowest mean years of education, at just below two years, yet the highest labor force participation, at 56%. This reflects the rural-based subsistence economy that requires all household members to engage in some work even at older ages. 3.2 Basic living conditions of older people in India While economic growth has been rapid, basic living conditions for many Indians, especially the aging, are still poor (Pal & Palacios, 2008; Husain & Ghosh, 2011). Table 6 reports indicators of hardship and vulnerability among the LASI pilot sample aged 45 and older, looking specifically at such indicators as drinking water, sanitation, basic household utilities, health, and food security. These are common markers used in the development literature to assess quality of life (Clark & Ning, 2007; Ahmed et al., 1991) Table 6 shows that almost 80% of LASI respondents live in households that do not have access to running water in the home, and 45% do not have access to an “improved water source”. Sixty percent live in households that do not have proper sewer systems. Nearly 60 percent also live in households that use poor quality cooking fuel, which can contribute to indoor air pollution and have adverse effects on older people who tend to be more bound to the home (World Bank, 2002). Over 90% of households in Rajasthan use low quality cooking fuel, compared with just 31% of households in the wealthier, more urbanized state of Punjab. Table 6 shows, however, that these conditions vary widely across states. In Kerala and Punjab, the great majority of respondents have access to a private toilet facility, while over 65% of respondents in Rajasthan do not.

17
Table 6. Select Indicators of Hardship and Vulnerability by State among Individuals 45 years and Older Punjab Rajasthan Kerala Karnataka All States N 365 358 413 315 1451 Household
Basic utilities No electricity in home 3.5 42.6 1.5 2.8 15.0 No running water in home 40.7 86.3 94.8 74.3 78.6 No access to improved water source 2.2 68.9 79.8 10.7 44.5
No private toilet facility 10.1 67.8 0.3 42.0 35.8 No access to improved sewerage disposal 48.7 88.1 5.7 75.2 59.0
Does not use good quality cooking fuel 31.0 88.0 52.4 43.5 57.9
No refrigerator in home 33.7 93.2 48.0 87.1 72.6 Individual
Living alone 10.8 6.4 17.3 16.7 12.8 Illiterate 61.4 79.7 11.1 46.5 50.3 Health insurance15 0.5 0.8 12.2 6.8 5.7 Difficulty with at least 1 ADL 9.5 7.0 20.1 14.1 12.7 Undiagnosed Hypertension 39.5 40.9 19.4 27.6 31.3
Urban 37.1 39.1 19.3 36.4 33.4 Rural 40.2 41.1 19.8 22.6 30.6 Men 46.0 38.5 19.7 26.1 31.5 Women 32.7 43.0 19.6 28.8 31.2 Under Age 60 39.4 39.6 20.0 20.4 28.6 Age 60 and Over 39.2 42.1 19.3 42.1 35.2
Food insecurity (last 12 months) 4.2 3.9 1.4 2.4 2.9 Underweight (BMI<18.5) 12.2 41.1 13.4 28.3 26.7
Notes: All numbers are in percent. The sample is restricted to respondents who reported they were at least 45 years old in the individual interview and provided a non-missing answer for each of the variables listed in the table, with the exception of hypertension variables. Hypertension prevalence was calculated only among respondents in the biomarker module. Improved water source includes piped water, tube well, and protected dug well. Sources of water not considered improved are unprotected wells, water from springs/rainwater/surface water, and tanker trucks. Access to improved sewage disposal includes piped sewer system or septic tanks. Dry toilets, pit latrines, or no facility are not included. Good quality cooking fuel includes coal, charcoal, natural gas, petroleum, kerosene, or electric. Activities of daily life (ADL) include using a toilet, bathing, dressing, eating, walking across a room, and getting out of bed. Undiagnosed hypertension is among all respondents, whether hypertensive or not. It is a binary indicator if hypertension is indicated from the biomarker module but the respondent reports never having received a diagnosis for high blood pressure or hypertension from a health professional. Lee et al (2011) includes an in-depth analysis of undiagnosed hypertension. Living alone is defined as living with one’s self only or with one’s spouse only (Dandekar, 1996). The surprisingly high figures for Kerala for lack of access to improved water sources and for not having running water in the home are consistent with other relevant reports about Kerala, e.g., International Institute for Population Sciences and Macro International (2007). Food insecurity is a binary indicator for respondents who report having lost weight due to hunger, not eaten for a whole day or gone hungry because there was not enough money to buy food, or otherwise reduced the size or frequency of meals because there was not enough money to buy food. Means are weighted using the state-specific or the pooled-state weights. Compounding poor living and environmental conditions are the health and economic concerns of the aging population in India. Thirteen percent of Indians in our sample report living alone, which often increases vulnerability to health and economic shocks (Chaudhuri & Kakoli, 2009). Living alone is most common in the southern states of Kerala (17%) and Karnataka (16%) and least common in Rajasthan, where there are larger families and more intergenerational 15 Of the respondents ages 45 and older who said they did not have health insurance, 46% said they did not have it because they did not know what it is (have never heard of it); 23% said they could not afford it; 16% did not feel that they needed it; 7% did not know where to purchase it; 3% reported being denied health insurance, and 5% listed some other reason for not obtaining health insurance.

18
residency. An essentially non-existent health insurance system and high rates of illiteracy also leave these aging individuals vulnerable: half of the LASI sample cannot read or write, though this masks the high educational attainment in Kerala and the 80% illiteracy rate in one of India’s poorest states, Rajasthan. 3.3 Measuring the Health of Aging Indians Self-reported disability rates, as measured by difficulty with at least one activity of daily life (ADL), average 13% across all states, with older people in Kerala reporting the most difficulty and those in Rajasthan the least. While there is some doubt about the validity of self-reported measures (Sen, 2002), other literature has shown that ADL and measures of disability in particular can be useful in understanding health burdens in this population along with other research that shows self-reported measures are reasonable to use in the developing country context (Subramanian et al., 2009). LASI relies on a wide spectrum of health measures, ranging from self-reports of general health (“In general, would you say your health is excellent, very good, good, fair, or poor?”) to queries about specific diagnoses (“Have you ever been diagnosed by a health professional with hypertension?”).Older respondents who are poor, uneducated, and lack access to healthcare may underreport health conditions that do not have severe symptoms associated with them. Conversely, with more literate populations found in areas with better access to health services, self-reports may more accurately reflect true prevalence rates. To understand the degree to which this bias can affect estimates, we present results in Table 6 from LASI’s biomarker module to illustrate the health burden among older Indians. Specifically, we report the share of our sample that had high blood pressure but did not report ever receiving a diagnosis for hypertension by a health professional. Thirty-one percent of the sample population had undiagnosed hypertension. In Rajasthan, 41% of respondents had undiagnosed hypertension, while in Kerala, only half that fraction registered undiagnosed hypertension. The high prevalence of these conditions points to the sizable incidence of noncommunicable diseases, the burden of conditions that go unrecognized and untreated, as well as the wide disparity in access to health services for aging Indians (Mahal et al., 2010; Alwan et al., 2010). Table 6 reports the results of self-reported food insecurity among respondents. These indicators may seem low, but they reflect substantial efforts on the part of the Indian government to reduce hunger and famine. A similar prevalence of food insecurity was reported in the National Sample Survey Data (Dev & Sharma, 2010), but these self-reported hunger rates may not reflect the food scarcity with which many older people live. Examining another measure, such as body mass index, illustrates that basic food provision is still a concern. Body mass index has proven to be an effective marker for chronic energy deficiency in developing countries (Chaudhuri, 2009; Ferro-Luzzi et al., 1992; Nube et al., 1998). Rajasthan has the highest prevalence of underweight individuals, yet lower rates of self-reported hunger and food shortage. Comparing these results to self-reported measures highlights the multiplicity of health concerns among the aging Indian population, and the difficulty in ascertaining accurate reports of disease burden. Tables 7 and 8 focus on LASI’s measure of difficulty with ADLs, with particular attention to a well-documented sex gradient (Sengupta & Agree, 2003). Self-reported ADLs have been shown to be good markers for the health status of Indians (Chen & Mahal, 2010). Table 7 shows the number of disabilities reported by men and women in LASI. Of those respondents who reported
19
difficulty with ADLs, most reported difficulty with only one or two of the activities. Women more often reported at least one difficulty with an ADL. Among women, the most common difficulties were with walking across a room and getting in and out of bed. Men also reported the most difficulty with walking across a room and getting in and out of bed, although at older ages getting dressed and walking across the room were the most common difficulties (see Table 8). Table 7. Distribution of Difficulty with ADLs by Sex among Respondents 45 years and Older Count of Difficult ADLs 0 1 2 3 4 5 6 Number of Respondents 1,236 95 42 19 12 14 14
Men (%) 88.8 5.8 2.3 0.9 0.9 1.0 0.4 Women (%) 84.2 7.0 2.9 2.1 1.0 1.2 1.7
Notes: Among respondents with only one ADL, the most common was getting in and out of bed; among respondents with two ADLs, the most frequent were getting in and out bed and using a toilet; among respondents with three ADLS the most commonly reported ADLs were difficulty walking across a room, bathing, and using a toilet; among respondents who reported difficulty with four ADLs the most frequent were walking across a room, bathing, using the toilet, and getting in and out of bed; and among those respondents with five ADLs, the most common were walking across a room, bathing, getting in and out of bed, and the same number of respondents reported difficulty with the remaining ADLs. The sample for this table is restricted to respondents who self-reported at least 45 years of age in the individual interview. Percent are weighted using the pooled-state weight.
Stratifying the associations we observe between sex and disability by age illustrates an even stronger sex disparity in health among aging Indians in our sample. Noticeably, about 50% of women aged 75 years or older report difficulty with at least one ADL, compared to only 24% of men. This disparity begins to widen among the sample at age 65, a group that includes many widows who are often left with little familial support (Sengupta & Agree, 2003). Moreover, Table 8 shows that this widening disparity in self-reported difficulty with ADLs does not just occur at the aggregate across all measures, but for each of the six activities asked about in LASI.

20
Table 8. Distribution of ADL by Sex and Age Difficulty with… Ages 45
years + 45 to 54
years old 55 to 64
years old 65 to 74
years old 75+ years
old
Any ADL Men 11.2 6.7 10.4 16.6 24.1 Women 15.9 9.9 10.1 22.9 48.4 Dressing Men 4.7 2.0 4.4 6.1 15.5 Women 4.3 2.2 1.9 2.3 24.6 Walking across a room Men 4.9 3.0 3.4 5.3 17.5 Women 7.8 4.2 3.5 11.8 29.0 Bathing Men 3.2 1.2 2.8 5.5 9.4 Women 5.8 2.7 2.4 7.4 26.3 Eating Men 2.2 0.9 1.4 5.1 4.3 Women 6.5 3.1 3.7 6.5 29.8 Getting in and out of bed Men 4.9 2.8 3.6 8.7 10.7 Women 8.9 5.5 5.1 12.8 28.8 Toiletting Men 3.9 1.2 4.1 6.6 10.1 Women 6.8 4.3 1.5 9.7 28.3 Notes: Respondents are asked if "due to health or memory problem" they have difficulty dressing themselves, walking across a room, bathing, eating foods, getting in and out of bed, and using the toilet. Responses are: yes, no, can't do, and don't want to do. Respondents who answered yes or that they cannot do the task were considered to have an ADL difficulty. Percents are weighted using the pooled-state weight among the sample of respondents that self reported an age of at least 45 years.
We delve deeper into the health measures in Table 9, where we examine the socioeconomic correlates of (1) self-reported health, (2) ADL disability, and (3) a cognitive function exam administered as part of LASI. We observe statistically significant differences in self-reported health by age group: older respondents report poorer self-rated health; so, too, do widows, respondents from Kerala, and the less educated. The results for difficulty with ADLs are reasonably similar, with the additional indication that women (but not widows or more educated respondents) are more likely to report difficulty with at least one ADL. Unlike self-reported health, we do not observe a statistically significant effect for education after controlling for other factors. Cognitive health is a growing concern among aging populations in developing countries yet remains understudied in India16
(Jotheeswaran et al., 2008; Prince, 1997). LASI includes measures of verbal and numerical fluency as well as episodic memory recall, domains that have been incorporated into cognitive tests validated and used among low-literacy aging populations in India (Ganguli et al., 1996; Mathuranath et al., 2009). Figure 2 and Table 9 examine the cognition of the aging population, focusing on episodic word recall. LASI combines two measures of word recall – immediate and delayed – to create a summary measure of total word recall that we use in our analysis.
16 Current studies of cognitive and mental health in India are based on small sample sizes from single cities, ignoring socio-cultural and regional variation. Moreover, many of these studies examine dementia and specific neuro-degenerative diseases, while ignoring possibly more prevalent and sub-clinical forms of cognitive health impairment.

21
Figure 2
Notes: The immediate word recall task asks respondents to recall as many words as they can from a list of ten words immediately after the interviewer reads them aloud. Delayed word recall asks respondents to name as many words as they can after completion of a cognitive functioning questionnaire. Both delayed and immediate word recall are scored with a maximum of 10 words. Total word recall is the sum of these two. Three lists of ten words were used, and were randomly assigned to a respondent. The first list was river, tree, temple, school, hospital, dog, cat, radio, chair, and gold; the second list was monkey, car, stone, doctor, phone, fire, road, silver, flower, and cow; the third list was elephant, bike, kite, teacher, house, water, job, book, market, and baby. The standard deviation for immediate word recall pooled across both men and women was 1.9, 2.0 for delayed recall, and 3.5 for total word recall. Data for the graph are limited to respondents who self-report age of at least 45. Statistics reported in the figure are weighted by the pooled-state weight.

22
Table 9. Demographic and Regional Variation in Self-Rated Health (Ordered Probit), Difficulty with ADLs (Probit), and Episodic Memory (Linear Regression) Respondent Characteristics Self-Rated Health Any ADL Episodic Memory
age 55- 64 -0.352 *** 0.094 -0.408 (-4.35) (0.85) (-1.68) ages 65 -74 -0.745 *** 0.628 *** -1.916 *** (-7.85) (4.75) (-7.77) ages 75+ -0.910 *** 1.144 *** -2.763 *** (-6.26) (7.91) (-7.76) Female -0.137 0.196 -0.725 *** (-1.90) (1.91) (-3.84) education (yrs) 0.023 * -0.009 0.329 *** (2.04) (-0.87) (10.07) Rajasthan 0.023 -0.189 -2.839 *** (0.17) (-0.93) (-5.37) Kerala -1.062 *** 0.524 * -4.254 *** (-8.26) (2.37) (-11.44) Karnataka -0.130 0.371 -2.161 *** (-1.16) (1.96) (-5.78) Rural -0.107 -0.016 -0.209 (-1.43) (-0.15) (-0.77) widow -0.191 * 0.139 -0.49 (-2.23) (1.25) (-1.52) constant -1.727 *** 11.35 ***
(-10.41) (24.23) cut 1 -3.000 ***
cons (-24.01) cut 2 -1.982 ***
cons (-18.37) cut 3 -0.457 ***
cons (-4.99) cut 4 1.375 ***
cons (10.86)
N 1446 1430 1408 F-stat 21.86*** 11.02*** 29.55***
Estimator ordered probit probit tobit
Table shows coefficients with t statistics in parentheses; * p<0.05, ** p<0.01, *** p<0.001 Note: Additional models were fit with caste and religion but were dropped because the coefficients of these variables were insignificant. Self-rated health asks respondents whether they feel their health in general is excellent (scored 5), very good (scored 4), good (scored 3), fair (scored 2), or poor (Scored 1). Any ADL is a dummy variable for respondents who have difficulty with one or more ADLs. Model is estimated among those respondents aged 45 years and older. The mean value for self-rated health was 3.3; 14.1% of respondents self reported difficulty with at least on ADL. LASI used a stratified sampling design which sampled respondents independently by state, rural-urban areas, and district. All multivariate models are unweighted and the standard errors have been corrected for design effects of stratification. The sample consists of those respondents who self reported an age of at least 45 years.
23
Unlike in studies in the United States and United Kingdom, women in India perform worse than men on measures of cognitive health (Lang, Llewellyn et al., 2008; Langa, Larson, et al., 2008) as shown in Figure 2. While women tend to be less educated and older than men in India, Table 9 shows that the female disadvantage in cognitive health persists even after controlling for these risk factors. Similar cognitive disparity between men and women has been found in other developing countries (Zunzunegui et al., 2008). Nevertheless, the factors that account for the cognitive shortfall among women deserve further exploration (Lee et al, 2011). Table 9 also reflects regional differences in our health measures, which cover both self-reported general health and self-reported disability, and one objective measure of health: episodic memory. Respondents from Kerala report worse health. This might be surprising given the extensive literature on Kerala’s health system, access to community insurance, low infant mortality, long life expectancy, and high levels of education. Reasons why older people from Kerala report worse health may include the following: (a) Although life expectancy is high, morbidity and disability rates are very high, as well; (b) People with better education and awareness, as in Kerala, may be more likely to report their ill health than people in poorer states; (c) Smoking and drinking are particularly prevalent in Kerala; (d) Kerala’s demographic transition preceded that of the rest of India and its elderly population is older than in other states: and (e) Kerala now suffers from high burdens of noncommunicable and cardiovascular diseases, including, of course, among its older population. Discussions of health and morbidity in Kerala appear in Suryanarayana, 2008, Rajan & James, 1993, and Kumar, 1993. Returning to Table 9, we see large differences between Kerala and the other states with regard to cognitive health as well, even after adjusting for education, which also reflects higher morbidity. Table 10 illustrates an important way in which many aging Indians rely on their family networks for support: paying for health care. Although India does have free, government-sponsored public healthcare, most Indians opt to use private services. Even the poorest often opt for private services (Gupta & Dasgupta, 2003) over government facilities. However, with longer lives, an increasing chronic disease burden, rising healthcare costs and a shortage of service facilities and workers in India, access to health care for this older population is increasingly tenuous. In the LASI data, over 80% of respondents indicated that they themselves or their family would have to pay for any sort of healthcare. We focus on this set of respondents below, fitting a multivariate model to better understand the determinants of family-reliance for healthcare costs17
.
17 Respondents are considered to “rely on family to pay” if they wholly (48.2%) or partially (12.9%) rely on the family to finance the costs, either out of pocket or through a family member’s insurance scheme (6.0%). Respondents not considered to rely on family indicated that they alone finance their healthcare out of pocket (38.9%)

24
Table 10. Who Pays For Healthcare? Respondent characteristics Relies on Family to Pay age 55- 64 0.112 (1.05) ages 65 -74 0.242 * (2.12) ages 75+ 0.463 ** (2.85) Female 0.437 *** (3.94) education (yrs) -0.033 * (-2.44) Rajasthan -1.069 *** (-4.10) Kerala -0.261 (-1.52) Karnataka -0.824 *** (-5.28) Rural -0.060 (-0.52) Scheduled Caste -0.299 (-1.83) Scheduled Tribe -0.211 (-0.70) Other Backwards Caste -0.252 * (-2.31) HH Consumption -0.225 (middle tertile) (-1.74) HH Consumption -0.304 * (highest tertile) (-2.08) Episodic Memory 1 -0.662 * (-2.23) Episodic Memory 2 -0.807 * (-2.59) Episodic Memory 3 -0.451 (-1.73) Any ADL disability -0.028 (-0.21) Chronic condition -0.023 (-0.24) Working -0.069 (-0.48) constant 1.399 *** (3.72) N 1311 F-stat 6.45 *** Estimator probit Coefficients are reported with t statistics in parentheses; * p<0.05, ** p<0.01, *** p<0.001 Notes: In this model, we create a categorical scheme for our measure of cognitive health using episodic memory recall. We derive four dummies: episodic memory 1 includes respondents (18%) who were able to recall 0 to 5 words out of 20; episodic memory 2 counts respondents with 6 to 10 words (54%); episodic memory 3 is for respondents who remember 11 to 15 words, and the final category (omitted) was for the 3% of respondents who could recall 16 or more of the words out of 20 possible. The sample is restricted to respondents who self-reported age at least 45; Chronic condition is self-reported diabetes, heart disease, lung disease, stroke, hypertension; Working is defined as any labor market activity in the last 12 months; and any ADL is a binary indicator for having difficulty with at least one ADL. LASI used a stratified sampling design

25
which sampled respondents independently by state, rural-urban areas, and district. All multivariate models are unweighted and the standard errors have been corrected for design effects of stratification.
The results reflect notable demographic and regional differences in health care accessibility in India. Older members are increasingly reliant on their family for support, as are women, perhaps because of more complex medical needs and little cash earning potential. By contrast, respondents with more education and higher household socioeconomic status are more likely to pay out of their own pocket, suggesting that those households that are responsible for the wellbeing of their aging family members are among the poorest. The specification also controls for respondent health; net of self-reported chronic diseases, the parameter estimates suggest that respondents with poor cognitive health (as measured by their episodic memory result) are also increasingly reliant on their family for care, perhaps because of their difficulty in accessing care, keeping track of finances and medication, and articulating needs. The regional associations should be interpreted with caution. While respondents from both Karnataka and Rajasthan are more likely to rely on their own out-of-pocket expenditures for health care, these two states have vastly different socioeconomic profiles. Karnataka is more affluent and in the South. Respondents from Rajasthan were 80% rural and had the lowest socioeconomic status across all our four states and almost no available health insurance; it is one of the poorest states in India, with the aging men and women largely paying their own medical expenses out of pocket. In Table 11 we study the relationship between the way respondents pay for healthcare and their consumption of health services. We look across a variety of healthcare service utilization-dependent variables, such as whether the respondent went to a health facility or saw a doctor if they were ill during the last 30 days18
, if the respondent was undiagnosed hypertensive, and if in the last two years the respondent reported having a cholesterol test. We focus on hypertension and cholesterol to contextualize healthcare use in India’s epidemiologic transition to a higher burden of noncommunicable disease.
Results show that respondents who rely on family to pay their healthcare bills are less likely to make use of healthcare services when ill, after controlling for a number of household and respondent-level characteristics. On the other hand, we do not see any association between the way in which healthcare is financed within the home and outcomes for chronic diseases. Perhaps this reflects low self-awareness of chronic disease conditions that could be less symptomatic among the aging population than a larger health shock, such as falling ill in the last month.
18 The question reads: “Within the past month, have you visited any medical facilities, pharmacists, or healthcare providers (this includes folk healers)?”

26
Table 11. Health Care Service Utilization Respondent characteristics
Doctor Visit When Ill
Undiagnosed Hypertension
Cholesterol Check
Family pays for healthcare -0.718 * 0.082 -0.018 (-2.50) (0.57) (-0.16) age 55- 64 0.44 -0.391 ** 0.411 * (1.13) (-2.90) (2.62) ages 65 -74 0.514 -0.503 *** 0.572 ** (1.24) (-4.71) (3.36) ages 75+ 1.034 * -0.369 0.644 ** (2.44) (-1.58) (3.22) female 0.105 -0.215 -0.001 (0.40) (-1.90) (-0.01) education (yrs) -0.0256 -0.019 0.030 (-0.63) (-1.33) (1.84) Rajasthan -1.164 * 0.705 ** 0.039 (-2.09) (2.92) (0.15) Kerala 0.163 -0.553 ** 0.904 *** (0.36) (-2.83) (3.81) Karnataka 0.608 0.179 -0.933 ** (1.48) (0.72) (-3.05) rural 0.186 0.115 -0.033 (0.63) (0.72) (-0.22) Scheduled Caste 0.378 0.193 -0.375 (0.93) (1.00) (-1.63) Scheduled Tribe -0.749 0.525 -0.098 (-1.02) (1.60) (-0.24) Other Backwards Caste 0.144 0.045 -0.096 (0.41) (0.31) (-0.67) HH Consumption (middle fertile) 0.353 -0.225 0.194 (1.15) (-1.53) (1.23) HH Consumption (highest tertile) 0.316 -0.387 * 0.473 * (0.70) (-2.12) (2.42) constant 0.112 0.857 * -2.236 *** (0.19) (2.35) (-7.54) N 136 650 1425 F-stat 1.54 7.75*** 9.49*** Estimator probit probit probit
Coefficients are reported with t statistics in parentheses; * p<0.05, ** p<0.01, *** p<0.001 Notes: The number of respondents included in each regression varies by the dependent variable. For the first model, which asks about health care utilization during a period of illness in the last 30 days, the sample is quite small because of the limited (30-day) time frame in the question: respondents are first asked if they were ill in the last 30 days, and only those who respond with “yes” were asked about health care utilization (including hospitals or doctor’s office). We chose to estimate the model only among the relevant sample so as not to introduce bias. For the model of undiagnosed hypertension, we limit the model here to only those respondents who have any sort of hypertension – either previously diagnosed by a medical professional, or measured in-field at the time of the interview by the LASI interview team. The model for treatment of chronic diseases is restricted to those respondents who reported a chronic disease (hypertension, heart disease, lung disease, stroke, diabetes, or arthritis) diagnosed by a health professional. Whether respondents had a cholesterol check in the last two years was asked of all respondents, so we did not limit our sample, aside from restricting it to all respondents 45 years of age or older; younger spouses were omitted. The sample is restricted to respondents who self-reported age as at least 45; LASI used a stratified sampling design which

27
sampled respondents independently by state, rural-urban areas, and district. All multivariate models are unweighted and the standard errors have been corrected for design effects of stratification. The results of these models reflect the traditional intra-household support system, but also suggest some important levers for implementing effective policy to ensure well-being in old age. Women tend to be more reliant on their family networks for access to health care. Older respondents tend to be reliant on their family members as well, which reflects loss of economic agency in the household and increasing burden of age-related morbidities, which may be costly to treat. Finally, we observe some interesting regional variation in the model. Respondents in Rajasthan and Kerala are much less likely to have family members who would pay for their health care, despite the larger household size in this state. We observe the same pattern in Karnataka, which is a comparatively more developed state. Another salient finding is that individuals who report working in the last year are more likely to rely on themselves for healthcare. (Note that this model excludes respondents who reported having their healthcare expenses paid by their employer or by an insurance company.) 3.4 Measuring Health: innovations in LASI LASI incorporates several innovations.19
Aside from diverse measures to assess the multiplicity of health concerns among an aging Indian population, the adoption of state-of-the-art survey methods is also a hallmark of the LASI survey. One example is the use of anchoring vignettes, which may permit refined analysis of many subjective survey responses. The World Health Organization has made extensive use of them in several of their Studies on Global AGEing and Adult Health (SAGE) surveys around the world (Kowal et al., 2010). Several of LASI’s sister surveys, such as CHARLS, also use anchoring vignettes to assess self-reported health conditions related to sleep, mobility, pain, and affect.
Anchoring vignettes allow researchers to correct for cross-person heterogeneity in the subjective nature of responses to some health questions. They do this by asking respondents to characterize a set of short hypothetical stories (vignettes) that describe fictional individuals with varying health problems. Respondents’ scoring of a common set of vignettes may allow researchers to standardize their answers to related self-health questions that naturally require somewhat subjective answers.20
However, vignettes can only serve their intended purpose if respondents can understand and make meaningful assessments of them. For example, a vignette that is intended to describe someone in extreme pain should be ranked by respondents as exhibiting a much higher level of pain than one that is intended to show very mild pain. If a respondent does not rank these vignettes in the intended order, the scoring of the vignettes should not be used to adjust the respondent’s answers to questions about severity of pain.
19 LASI also includes innovations that are not related to health. Among them are (a) some specific types of questions about assets and income; (b) use of a GIS database to support community-level analysis; (c) questions about water quality, sanitation, and crime in the neighborhood; and (d) questions about a broad range of psychological, social, and behavioral risk factors (e.g., measuring social connectedness in addition to traditional social network questions). 20 Note: The vignettes module in LASI is randomly assigned to one-third of the sample (n=463); it is one of three experimental modules in the survey. In addition to vignettes about pain and difficulty with mobility, other vignettes include sleep difficulty, concentration, shortness of breath, feeling sad/low/depressed, bathing, and personal relationships.

28
In the LASI pilot, a large fraction of respondents (roughly half) ranked the vignettes in an order that was different from the intended order. In these cases, it was therefore impossible to use the vignettes to adjust respondents’ answers. Studies that explore the reasons for unexpected results in vignette ranking and possible means for avoiding or remedying such situations include Delevande A, Gine X, McKenzie D. (2010), Gol-Propoczyk, H. (2010), Hopkins DI, King G. (2010), Lancasr E, Louviere J. (2006), and Mangham LJ, Hanson K, McPake B (2009). Using vignettes to shed light on respondents’ statements about pain and mobility, for example, is therefore limited to respondents whose vignette rankings corresponded to the expected order. But because this required us to ignore a large fraction of respondents, we caution against extrapolating these result to a larger population, particularly because respondents who ranked vignettes in an unexpected way may not be a random subset of all respondents and may have characteristics that differ from the entire sample. We did a multivariate analysis to try to find patterns that distinguish those whose answers we had to ignore from those that were usable, but we could not find any significant predictors. Using data restricted to respondents whose vignette rankings were in the expected order, Figure 3 shows the results of two anchoring vignettes for pain and mobility. Respondents are asked to rate the degree to which they experience bodily aches and pains and have trouble moving around, respectively. The vignettes suggest that respondents who have some degree of difficulty moving around and report some chronic pain tend to underreport the severity of it.21
The data imply that nearly one-fifth of respondents could have very severe pain or mobility problems, while less than 2% for each domain tends to report so originally. For both pain and mobility, the number of respondents who experience “none” is much higher than initially reported, while the number of respondents who have very severe problems within in either domain increases substantially.
21 Here, we are careful to distinguish between measures of disability and the questions in the vignette section, which may at first seem incongruent. The six questions about ADL ask specifically if the respondent is unable (without help) to do a series of tasks because of a “health or memory problem.” However, the vignettes ask much more generally about pain and mobility: an older person, for example, may have chronic back pain, but otherwise be able to move around by him or herself, use the toilet, eat a meal, bathe, and get dressed. Among older populations, this sort of pain is likely to be more prevalent than severe disabilities that prevent someone from functioning day to day.

29
Figure 3
Notes: The sample size is 232 for pain and 202 for mobility, among respondents who self-report age of at least 45 years. Responses are weighted using the pooled state-weight 3.5: Social and civic participation among the aged and aging Aside from the physical and economic well-being of the aging Indian population, LASI also provides a snapshot of daily life, particularly social and civic participation in local communities. The connection between social activity and support and health has long been documented. In this section we examine the way in which older people participate and contribute to their community by presenting descriptive statistics and the results from multivariate models of social and civic participation. The LASI pilot found that men tended to be more social than women and that the most common social activities22
for both sexes were visiting friends/relatives, attending cultural events or performances, and attending religious festivals and functions. Men were more likely than women to report eating outside the home, visiting a park or beach, and playing cards or games. Sex differences in social participation are present even when stratified by age. Overall, social participation declines for both men and women in the LASI sample as respondents age. For example, prevalence of visiting friends or relatives drops from 85% among women ages 45 to 54 to 58% among women ages 75 and older.
In the LASI sample, civic participation23
22 For social activities, LASI asks about going to the cinema, eating outside the house, going to a park or beach, playing cards or games, visiting relatives /friends, attending cultural performances/shows, and attending religious functions/events.
is much less common overall than social activity, but is more common among women than men. This is likely because LASI specifically asks about
23 LASI asks about respondents’ participation in farmers’ associations/environmental groups/political parties/senior citizen clubs; tenant groups, neighborhood watch, community/caste organizations; self-help group/NGO/Co-operative/mahila mandal; education, arts or music groups, evening classes; social clubs, sport clubs, exercise classes, and any other organizations which we consider civic participation.

30
mahila mandal, which is a women’s self-help and empowerment group. We also see limited evidence that women participate in caste and community organizations, as well other activities. Men participate in self-help and NGO groups/senior citizen clubs/farmers associations, and community and caste organizations. Table 12 shows the association between the demographic and socioeconomic characteristics and civic and social participation. Because civic participation was relatively low in the LASI sample, we estimate a probit model and regress a binary indicator for any civic participation on the list of covariates. Social activities are more common than civic participation. We look at social participation by regressing the number of social activities per month on the same list of covariates using OLS estimation. We see a significant association with age and civic participation only among respondents at least 75 years of age. Respondents with more years of education were also more likely to participate in their community, as were respondents in the two southern states, where there tends to be a stronger presence of NGOs and community-based organizations. An association between civic participation and health, as measured by difficulty with at least one ADL, is not apparent. The model for social participation shows a similar association with age: we see a statistically significant decrease in social participation in age only among respondents 75 years of age or older. After controlling for the full set of respondent characteristics, we no longer see a sex difference in civic participation. We do see a statistically significant decrease in social participation among women, but this is not attributable to lower educational attainment or older age. Respondents in Rajasthan and Kerala were less likely to participate in social activities compared with respondents in the other states.

31
Table 12. Demographic and Regional Variation in Social and Civic Participation among Indians 45 years or older Respondent characteristics Any Civic
Participation Social activities/
month age 55- 64 -0.117 0.119 (-0.81) (0.97) ages 65 -74 -0.201 0.003 (-1.11) (0.03) ages 75+ -0.924 ** -0.232 (-3.03) (-1.52) female 0.162 -0.142 (1.21) (-1.26) education (yrs) 0.050 *** 0.069 *** (3.68) (4.46) Rajasthan -0.123 -1.526 *** (-0.29) (-9.48) Kerala 1.193 ** -0.931 *** (3.07) (-5.18) Karnataka 1.101 ** -0.284 (3.03) (-1.26) rural 0.109 0.247 (0.92) (1.82) widow -0.020 -0.128 (-0.10) (-0.94) ADL disability count 0.000 -0.100 * (0.01) (-2.56) constant -2.491 *** 1.925 ***
(-7.39) (8.39)
N 1430 1429 R sq 0.1772 F-stat 11.18 *** 23.88 *** Estimator Probit OLS Table shows coefficients with t statistics in parentheses; * p<0.05, ** p<0.01, *** p<0.001 Notes: ADL disability count is the number of activities of daily life the respondent reports having difficulty with or being unable to do. Due to low participation in civic activities, we model the extensive margin; 9.0% of respondents reported any civic participation. Due to the high participation in social activities, we model the intensive margin as the number of social activities per month; 93.3% of respondents reported some social activity. The sample is restricted to respondents who self-reported age at least 45; LASI used a stratified sampling design which sampled respondents independently by state, rural-urban areas, and district. All multivariate models are unweighted and the standard errors have been corrected for design effects of stratification.
These models provide some evidence that aging Indians continue to stay involved in their communities as they age. They stop working for pay, are active outside the home, and participate in broader civic and social networks.

32
The LASI pilot suggests that research in civic and social networks in India is promising. Previous studies have supported the importance of civic and social participation for successful aging and health, and we see some evidence of that with the connection between difficulty with activities of daily life and social participation. (Moen et al, 1992; Berkman et al., 2000; Seeman & Crimmins, 2006) 3.6. Economic well-being of the aging LASI provides considerable information about the economic activity and well-being of India’s aging population. Workforce participation, for example, is central to supporting oneself in a country without social security or pensions, particularly as intergenerational support – once the traditional and widespread means of old age support in India – is becoming less common (Bloom, Mahal, Rosenberg, and Sevilla, 2010). Given that less than 11% of older people in India have access to some sort of pension or social security, economic activity is especially important. Additionally, private saving is often difficult or entirely infeasible for many Indians for several reasons: earnings are low, a significant portion of the economic activity is informal and may not be tied to cash exchange, and, given that 70% of the aging population in India lives in a rural area, bank accounts are often not available. (Uppal & Sarma, 2007) We examine labor force participation (defined as any employment, self-employment, or agricultural work in the last 12 months) in the LASI sample among respondents who are 45 or older. Table 13 presents five models of labor force participation. The first three model aggregate labor force participation across all sectors, first among all individuals and then separately among rural and urban. We then model agricultural labor force participation specifically in rural areas, and then compare that to our model of non-agricultural labor supply in both rural and urban areas The results show that older respondents are less likely to work, an association that is stronger in urban areas than rural ones. Women are less likely to report having worked, as are respondents who report some difficulty or disability with at least one ADL. The association between disability and economic activity points to the important relationship between health and economic well-being among the vulnerable and aging Indian population, although one cannot infer the direction of causality here. These findings are consistent with results of similar studies in India using data from multiple rounds of the National Sample Survey that find strong connections between health and work status (Bakshi et al., 2010). Studies from other developing countries, such as China, have found similar results – namely that health is a significant correlate of labor market participation among such socioeconomically disadvantaged populations.

33
Table 13 Demographic and Regional Variation in Binary Indicator for Any Employment in Past Year Respondent characteristics
All Work
Rural Urban Agricultural Work
Non-Agricultural
Workers
age 55- 64 -0.417 *** -0.374 ** -0.522 * -0.200 -0.357 **
(-4.23) (-3.42) (-2.33) (-1.94) (-3.29)
ages 65 -74 -0.689 *** -0.612 *** -0.966 ** -0.317 * -0.542 **
(-5.69) (-4.33) (-4.31) (-2.39) (-3.37)
ages 75+ -1.227 *** -1.103 *** -1.889 *** -0.737 *** -0.926 ***
(-6.47) (-5.31) (-4.42) (-3.62) (-4.26)
female -1.349 *** -1.282 *** -1.597 *** -0.858 *** -1.016 ***
(-14.27) (-14.26) (-5.66) (-9.89) (-7.91)
education (yrs) -0.007 0.002 -0.022 -0.022 0.029 *
(-0.57) (0.14) (-1.03) (-1.98) (2.45)
Rajasthan 0.427 ** 0.389 * 0.604 ** 0.531 ** -0.070
(2.80) (2.16) (3.34) (2.88) (-0.47)
Kerala -0.086 -0.286 0.341 -0.432 * 0.056
(-0.53) (-1.59) (1.54) (-2.10) (0.44)
Karnataka 0.300 0.355 0.270 0.528 ** -0.047
(1.89) (1.88) (1.52) (2.97) (-0.36)
rural 0.312 ** -0.488 ***
(2.97) (-5.41)
Scheduled Caste 0.211 0.108 0.473 -0.256 0.483 **
(1.53) (0.69) (1.88) (-1.69) (3.44)
Scheduled Tribe 0.093 0.071 -0.041 0.040 -0.199
(0.51) (0.38) (-0.09) (0.26) (-0.71)
Other Backwards Caste 0.093 0.038 0.243 -0.101 0.175
(0.98) (0.33) (2.13) (-0.94) (1.67) ADL disability count -0.150 ** -0.112 * -0.263 * -0.107 * -0.089
(-3.02) (-2.06) (-2.67) (-2.12) (-1.39)
constant 0.478 * 0.772 ** 0.582 0.108 -0.124
(2.62) (3.33) (2.15) (0.54) (-0.85)
N 1428 1023 405 1023 1428 F-stat 20.74*** 19.84*** 14.01 19.56*** 11.07*** Estimator probit probit probit probit probit
Table presents coefficients with t statistics are in parentheses; * p<0.05, ** p<0.01, *** p<0.001 Notes: Labor force participation is a dummy variable for having worked in the last 12 months. It includes self-employment, employment by another, or agricultural work both paid and unpaid as reported in the household income module by a household financial respondent or self-reported in the individual interview. The sample is restricted to respondents who self-reported as at least 45 years old; LASI used a stratified sampling design which sampled respondents independently by state, rural-urban areas, and district. All multivariate models are unweighted and the standard errors have been corrected for design effects of stratification. 44.6% of respondents were classified as working. ADL disability count is the number of activities of daily life the respondent has some difficulty with or cannot do.

34
We do not see employment differences by education or caste, the exception being respondents who self-identify as belonging to an “Other Backwards Caste,” who are more likely to be working if they live in urban areas. Respondents in Rajasthan are more likely to be working than respondents in other states, which may reflect the rural and informal subsistence labor market in one of India’s poorest states. This finding is consistent with the largely agricultural economies in Rajasthan and other rural areas, which are able to absorb older workers more consistently in comparison with manufacturing and other sorts of economies in developing countries (Nasir & Ali, 2000) It is also of note that education is not correlated with labor force participation among our sample aged 45 years and older, with the exception of the model for nonagricultural labor. Consistent with the literature, we see that respondents with more education are more likely to engage in nonagricultural labor than those with less, even after controlling for a variety of socioeconomic and regional indicators. However, our findings are somewhat inconsistent with results found elsewhere that suggest that educated individuals are more likely to accumulate savings and participate in formal labor sectors, leading to earlier withdrawal from the labor market. Our estimates reveal insignificant associations with education and all other forms of work across rural and urban sectors, However, the model below could mask the considerable regional heterogeneity within our population and across India: when we estimate the models without state dummies, we find statistically significant relationships between education and labor force participation not only in non-agricultural sectors, but also with work in rural areas (model 2) and agricultural work (model 4). In these three models without state dummies, more educated individuals were less likely to be working. The regional differences in availability of pension schemes, old age support, and labor markets account for the association between education and labor force participation in our sample. Given the lack of social security, pension, and health insurance available to most Indians, continued workforce participation is vital and buffers shocks to changes in household composition that can result from increasing urbanization and more common migration within India. However, working imposes a strain on aging individuals, and those who continue to work often do so out of desperation or necessity. Policy can direct resources and attention to the health of the aging workforce, so that individuals may stay healthy longer and be engaged in more productive work. We also examine household expenditure. Among households, we analyze the demographic and regional correlates of household consumption expenditure to provide a foundation for understanding socioeconomic gradients in the LASI sample and to some extent in India as well. Figure 4 displays the distribution of annual household expenditure (in rupees, and including imputed amounts) per equivalent adult across LASI respondents aged 45 and over. OECD equivalency scales are used to account for economies of scale in household production. Equivalent adults are calculated counting the first person age 18 or over as 1.0 equivalent adults, each additional person age 18 or over as 0.7 equivalent adults, and each person under age 18 as 0.5 equivalent adults.24
24 http://www.oecd.org/dataoecd/61/52/35411111.pdf
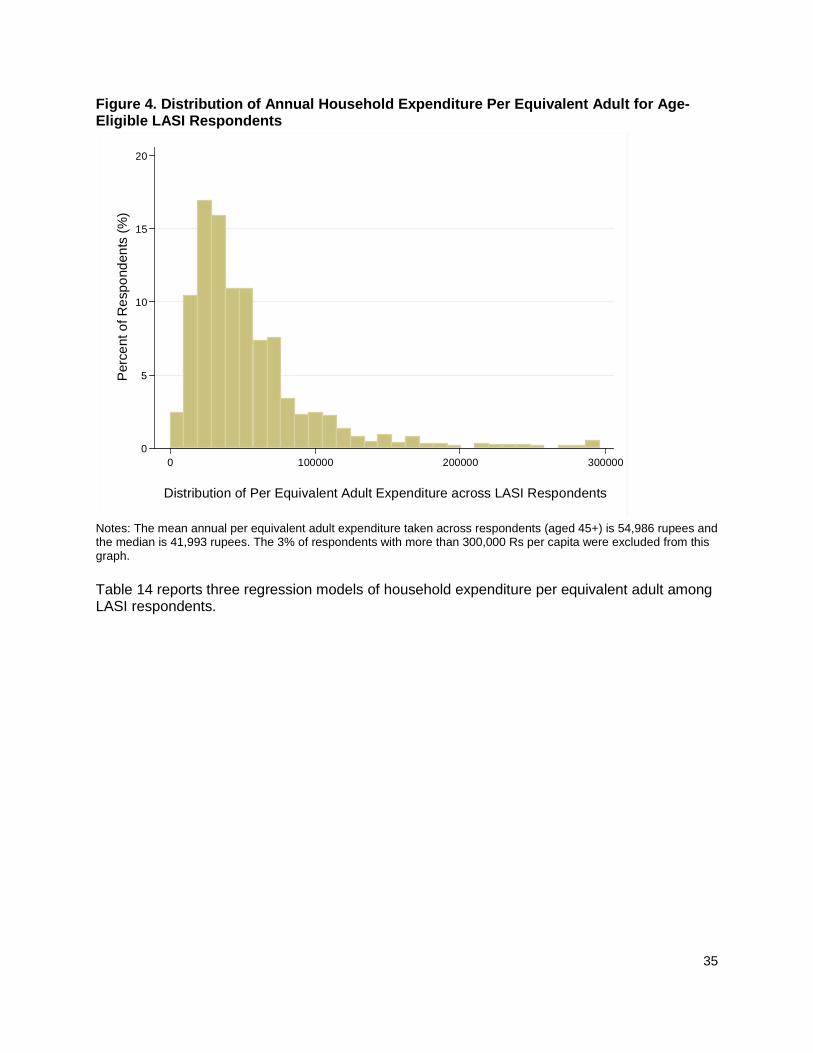
35
Figure 4. Distribution of Annual Household Expenditure Per Equivalent Adult for Age-Eligible LASI Respondents
0
5
10
15
20
Per
cent
of R
espo
nden
ts (%
)
0 100000 200000 300000
Distribution of Per Equivalent Adult Expenditure across LASI Respondents
Notes: The mean annual per equivalent adult expenditure taken across respondents (aged 45+) is 54,986 rupees and the median is 41,993 rupees. The 3% of respondents with more than 300,000 Rs per capita were excluded from this graph. Table 14 reports three regression models of household expenditure per equivalent adult among LASI respondents.

36
Table 14. Demographic and Regional Variation in Household Expenditure Per Equivalent Adult Household characteristics All Urban Rural
Rural HH -0.017 (-0.19) HH Size -0.026* -0.061 -0.012 (-2.62) (-1.86) (-1.15) Scheduled Caste -0.449*** -0.334* -0.488*** (-4.90) (-2.67) (-4.31) Scheduled Tribe -0.352 -0.889** -0.331 (-1.98) (-3.25) (-1.72) Other Backwards Caste -0.123 -0.103 -0.151 (-1.30) (-0.91) (-1.30) Rajasthan -0.261 -0.167 -0.315 (-1.90) (-1.16) (-1.79) Kerala -0.112 -0.023 -0.128 (-1.04) (-0.13) (-0.99) Karnataka 0.299* 0.514 0.207 (2.28) (1.97) (1.48) Youth Dependency Ratio -0.167* -0.180 -0.171* (-2.49) (-0.93) (-2.51) Elderly Dependency Ratio -0.017 -0.107 -0.006 (-0.31) (-0.65) (-0.11) Fraction of women in HH -0.315 -0.713* -0.164 (-1.98) (-2.21) (-1.09) Constant 11.31*** -0.167 11.19*** (75.51) (-1.16) (71.08)
N 730 207 523 R sq. 0.1681 0.2300 0.1536 F-stat 6.61*** 3.81 5.78*** Estimator OLS OLS OLS Table presents coefficients with t statistics in parentheses; * p<0.05, ** p<0.01, *** p<0.001 Notes: Dependent variable is log of household expenditure per equivalent adult household member. The unit of observation is the household, not the individual in these models. The youth dependency ratio is the number of household members 0 to 14 years of age divided by the number of household members 15 to 59 years of age. The elderly dependency ratio is the number of household members 60 years of age or older divided by the number of household members 15 to 59 years of age. The models also exclude households where expenditure was imputed. LASI used a stratified sampling design which sampled respondents independently by state, rural-urban areas, and district. All multivariate models are unweighted and the standard errors have been corrected for design effects of stratification. Standard errors are corrected for design effects and stratified on state, urban/rural residence, and district. Caste is the caste of the head of the household. Large households tend to have lower per capita expenditure, reflecting economies of scale within the household. Across the pooled urban and rural sample, scheduled castes, especially those in rural areas, have lower per capita consumption, reflecting in part the geographic isolation of rural communities. Other affiliations are also significant: scheduled tribes in urban areas also have statistically lower per capita consumption. This reflects a continued disadvantage for these groups despite many initiatives by the Indian government to improve their well-being (Subramanian et al., 2008).

37
Table 14 also reflects geographic differences in households’ per capita consumption. Households in Rajasthan have lower expenditures, especially in rural areas. To account for the effects of household composition by sex and age, we examine the fraction of women in the household and both the youth and elderly dependency ratio. The youth dependency ratio is the number of respondents under 15 years of age divided by the number of respondents of working age, which we define as ages 15 to 59. Our results show that a higher youth dependency ratio lowers per capita expenditure, presumably reflecting standard life cycle patterns of earnings and expenditure (Bloom, Canning, Fink, and Finlay, 2011). Interestingly, we do not see significant effects of the fraction of women or older people on expenditure. This finding is somewhat puzzling given the relatively low labor force participation rates of women and older household members. These two results suggest that older household members, as well as women, are contributing to the household economy in other ways not measured by labor force participation, or cash inflows. This may be especially true for rural households where much of the work is agricultural and subsistence-based, and women and older persons may be contributing mostly undocumented household labor. Indeed, in urban areas where this type of household work is less common, we see that the fraction of women in the household is significant and negative, reflecting their lower earnings (either cash or in-kind). Section 4. Conclusion LASI is well positioned to play a critical role in conducting research and informing policy as India continues substantial transitions in the demographic, economic, and epidemiologic domains. The fact that the LASI pilot achieved high response rates and that respondent demographics are similar to those of other nationally representative surveys within India lends validity to the survey’s results concerning the well-being of aging Indians. This paper highlights the wide geographic variability in health, social, and economic markers across India: even after adjusting for demographic differences, we still observe state-level variation across all three domains. Capturing the regional heterogeneity is critical for designing effective policy, and the main wave of LASI will expand on this by sampling 15 of India’s largest states. Our analysis focused on the well-being and economic status of aging Indians. While the country seeks to develop economically, basic living conditions and emerging health concerns are major problems. Our analysis reveals socioeconomic gradients across a variety of health domains, including both subjective and objective measures of self-rated health, disability, and cognitive functioning. With little institutional support, the aging population’s economic activity is of particular importance given the relative absence of social security and health insurance. Our findings show that aging family members continue to be contributing members of the household economy. Improving the health of aging Indians could foster higher labor force participation as well. The social and civic lives of older Indians are also key to understanding their contributions to communities. We have found that even the oldest individuals remain socially engaged and that aging women, especially, continue to contribute to civic life in their community. Early results from LASI suggest that older Indians are subject to a wide-ranging set of health, social, and financial insecurities, with a good deal of variation in myriad dimensions. Conduct of blood assays, expansion of the LASI sample, and collection of longitudinal data are the planned next steps in this effort. Such an evidence base should provide researchers with the raw

38
material they need to better understand aging in India and to design policies that will improve the experience.

39
REFERENCES Ahmed AU, Khan HA, Sampath RK (1991) “Poverty in Bangladesh: Measurement, Decomposition and Intertemporal Comparison” Journal of Development Studies 27(4):48-63. Alam M. 2004 " Ageing, Old Age Income Security and Reforms: An Exploration of Indian Situation" Economic and Political Weekly 39(33): 731-740. Alwan A, MacLean DR, Riley LM, d’Espaignet ET, Mathers D, Stevens GA, D Bettcher (2010) “Monitoring the surveillance of chronic non-communicable disease: progress and capacity in high-burden countries.” The Lancet 376:1861-68. Berkman L, Glass T, Brissette I, Seeman T (2000) “From Social Integration to Health: Durkheim in the new millennium” Social Science and Medicine 51, 843-857. Bakshi S, Pathak P (2010) “Who works at older ages? The correlates of economic activity and temporal changes in their effects: evidence from India” Working paper, Indian Statistical Institute Kolkata. Bloom DE (2011a) “7 Billion and Counting” Science 33: 562-569. Bloom DE (2011b) “India’s Baby Boomers: Dividend or Disaster?” Current History, April, 143-149. Bloom, DE (2005) “Education and Public Health: Mutual Challenges Worldwide: Guest Editor's Overview”, Comparative Education Review, November, Vol. 49, No. 4, 437–451. Bloom DE, Canning D, Fink G (2010) “Implications of Population Aging for Economic Growth” Oxford Review of Economic Policy, Vol. 26(4): 583-612. Bloom, DE, Canning D, Fink G, Finlay J (2011) “Micro Foundations of the Demographic Dividend”, paper presented at the International Union for the Scientific Study of Population Seminar on Demographics and Macroeconomic Performance, June 2010. Revision presented at the 2011 Annual Meetings of the Population Association of America. Bloom D, Mahal D, Rosenberg L, Sevilla J (2010) “Economic Security arrangements in the context of population aging in India” International Social Security Review 63: 3–4. Boersch-Supan, A., and A. Ludwig (2010). “Old Europe is Aging: Reforms and Reform Backlashes,” In: Shoven, J. (Ed.), Demography and the Economy, Chicago: University of Chicago Press, 169-204. Chaudhuri A (2009) “Spillover Impacts of a Reproductive Health Program on Elderly Women in Rural Bangladesh” Journal of Family Economic Issues 30:113-125. Chaudhuri A, Kakoli R (2009) “Gender Differences in living Arrangements Among Older Persons in India” Journal of Asian and African Studies 44(3):259-277. Chen B, Mahal A (2010) “Measuring the health of the Indian Elderly: Evidence from National Sample Survey Data.” Population Health Metrics 8(30).

40
Clark TA, Ning D (2007) “Towards a spatially disaggregated material-based hardship index for the cities of developing nations” International Development Planning and Review 29(10):69-92. Dandekar K (1996) The Elderly in India. New Delhi: SAGE. Delevande A, Gine X, McKenzie D. (2010). “Measuring subjective expectations in developing countries: A critical review and new evidence.” Journal of Development Economics, 94: 151-163. Dev MS, Sharma A (2010) “Food Security in India: Performance, Challenges and Policies” Working Paper, Oxfam India. Ferro-Luzzi A, Sette S, Franklin M, WPT James (2009) “A simplified approach of assessing adult chronic energy deficiency” European Journal of Clinical Nutrition 46:173-186. Ganguli M, Ratcliff G, Chandra V, Sharma SD, Gilby S, Pandav R, Belle S, Ryan C, Baker C, Seaberg E, Dekosky S (1996) “A Hindi Version of the MMSE: The development of a cognitive screening instrument for a largely illiterate rural population in India” International Journal of Geriatric Psychiatry 10:367 – 377. ] Gol_Propoczyk, H. (2010). “Age, Sex, and Race Effects in Anchoring Vignette Studies: methodological and Empirical Contributions.” Center for Demography and Econlogy, University of Wisconsin. Gupta I, P Dasgupta (2003). Health-seeking behavior in urban Delhi. An Exploratory Study, World Health and Population. Accessed online October 2011. Hopkins DI, King G. (2010) “Improving Anchoring Vignettes: Designing Surveys to Correct for Interpersonal Icomparability.” Public Opinion Quarterly, 74(2): 201-222 Husain Z, Ghosh S (2011) “Is Health Status of Elderly Worsening in India? A Comparison of Successive Rounds of the National Sample Survey Data” Journal of Biosocial Sciences 43. International Institute for Population Sciences and Macro International (2007) National Family Health Survey (NFHS-3), 2005-2006: India. Available at www.nfhsindia.org James, KS (2011) “India’s Demographic Change: Opportunities and Challenges” Science 29 July, Vol. 333 no. 6042, pp. 576-580. Jotheeswaran, A.T., Williams, J.D., & Prince, M.J. (2010). The Predictive Validity of the 10/66 Dementia Diagnosis in Chennair, India – a Three Year Follow Up Study of Cases Identifiable at Baseline. Alzheimer Disease and Associated Disorders, 24(3): 296-302. Kowal P, Kahn K, Ng N, Naidoo N, Abdullah S, Bawah A, Binka F, Chuc N, Debpuur C, Ezeh A, Gomez-Olive, Hakimi M, Hirve S, Hodgson A, Juvekar S, Kyobutungi C, Menken J, Minh HV, Sankoh O, Streatfield K, Wall S, Wliopo S, Byass P, Chatterji S, Tollman SM “Aging and adult health status in eight lower-income countries: the in depth WHO-SAGE collaboration” Global Health Action Supplement, World Health Organization.

41
Kumar BG (1993) “Quality of Life and Morbidity: A Reconstruction of Some of the Paradoxes from Kerala, India” Population and Development Review 19(1). Lancasr E, Louviere J. (2006): “Deleting Irrational response from discrete choice experiments: a case of investigating or imposing preferences?” Health Economics, 15:797-811 Lang IA, Llewellyn DJ, Langa KM, Wallace RB, Huppert FA, Melzer D (2008) “Neighborhood deprivation, individual socioeconomic status, and cognitive functioning in older people: analyses from the English Longitudinal Study of Aging” Journal of the American Geriatric Society 56:191-198. Langa KM, Larson EB, Karlawish JH, Cutler DM, Kabeto MU, Kim SY, Rosen AB (2008) “Trends in the prevalence and mortality of cognitive impairment in the United States: Is there evidence of a compression of cognitive morbidity?” Alzheimer’s & Dementia 4:134 – 144. Lee J (2010) “Data sets on pensions and health: Data collection and sharing for policy design”, International Social Security Review, Volume 63, Issue 3-4:197–222. Lee, J., Arokiasamy, P., Chandra, A., Hu, P., Liu, J., & Feeney, K. (2011) Markers and drivers: Cardiovascular health of middle-age and older adults, WR-888, RAND Corporation: Santa Monica, CA. Lee, J., Shih, R., Feeney, K., & Langa, K. (2011). Cognitive health of older Indians: Individual and geographic determinants of female disadvantage, WR-889, RAND Corporation: Santa Monica, CA. Mahal A, Karan A, Engelgau M (2010) The Economic Implications of Non-Communicable Disease for India. World Bank. Mangham LJ, Hanson K, McPake B. (2009) “How to do (or not to do)…Designing a discrete choice experiment for application in a low income country” Health Policy and Planning, 24:151-158. Mathuranath PS, Cherian PJ, Mather R, Kumar S, George A, Alexander A, Ranjith N, Sharma PS (2009) “Dementia in Kerala, South India: prevalence and influence of age, education and gender” International Journal of Geriatric Psychiatry 25: 290-97. Moen P, Dempster-McClain D, Williams RM (1992) “Successful Aging: A Life-course Perspective on Women’s Multiple Roles and Health” American Journal of Sociology 97: 1612-1638. Nube M, Asenso-Okyere WK, GJM van den Boom (1998) “Body mass index as indicator of standard of living in developing countries” European Journal of Clinical Nutrition 52:136-144. Pal S (2007) “Intergenerational Transfers and Elderly Coresidence with Adult Children in Rural India” IZA Discussion Paper No. 2847, University of Bonn, Germany. Pal S, Palacios R (2008) “Understanding Poverty among the Elderly in India; Implications for Social Pension Policy” IZA Discussion paper No. 3431, University of Bonn, Germany.

42
Prince M (1997) “The need for research on dementia in developing countries” Tropical Medicine and International Health 2(10):993-1000. Rajan SI, James KS (1993) “Kerala’s Health Status: Some Issues” Economic and Political Weekly 28(36): 1889-1892. Registrar General, Census of India 2001, Socioeconomic Tables, Office of the Registrar General, Government of India, New Delhi. Rieker PP, Bird CE (2005) “Rethinking Gender Differences in Health: Why we Need to Integrate Social and Biological Perspectives” Journals of Gerontology Series B 60B:40-47. Seeman T, Crimmins E (2006) “Social Environment Effects on Aging and Health” Annals of the New York Academy of Sciences 954, 88-117. Sen A (2002) “Health: perception versus observation” BMJ, 324(7342), 860–861 Sengupta M, Agree E (2003) “Gender, Health, Marriage and Mobility Difficulty among Older Adults in India” Asia-Pacific Population Journal 18(4): 53-65. Subramanian SV, Ackerson LK, Subramanyam MA, Sivaramakrishnan K (2008) “Health inequalities in India: The axes of stratification” The Brown Journal of World Affairs 14(2):127-138. Subramanian SV, Subramanyam MA, Selvaraj S, Kawachi I (2009) “Are self-reports of health and morbidities in developing countries misleading? Evidence from India” Social Science & Medicine 68: 260 – 265. Srivastava R, Sasikumar S K (2003) “An overview of migration in India, its impacts and key issues” Presented at the Regional Conference on Migration, Development and Pro-Poor Choices in Asia, Dhaka, June 22-24, 2003. Suryanarayana, M.H. (2008) “Morbidity Profiles of Kerala and All-India: An Economic Perspective” Working paper number 2008-007. Indira Gandhi Institute of Development Research, Mumbai. Available at http://www.igidr.ac.in/pdf/publication/WP-2008-007.pdf UN (2011) World Population Prospects: The 2010 Revision. New York, United Nations Population Division. WHO “WHO Medicines Strategy: Countries at the Core, 2004–2007” http://apps.who.int/medicinedocs/pdf/s5571e/s5571e.pdf (accessed Aug 17, 2011). World Bank (2002) India: Household Energy, Indoor Air Pollution, and Health. ESMAP/South Asia Environment and Social Development Unit, November. Yip W, Mahal A (2008) “The health care systems of China and India: Performance and future challenges” Health Affairs 27(4).

43
Zunzunegui MV, Alvarado BE, Beland F, Vissandjee B. (2008). “Explaining health differences between men and women in later life: A cross-city comparison in Latin America and the Caribbean” Social Science and Medicine 68: 235-242.