Embed Size (px)
Citation preview

Long-Term Trends in the Defense BudgetStephen Daggett
Specialist in Defense Policy and Budgets
May 5, 2010
CRS-2
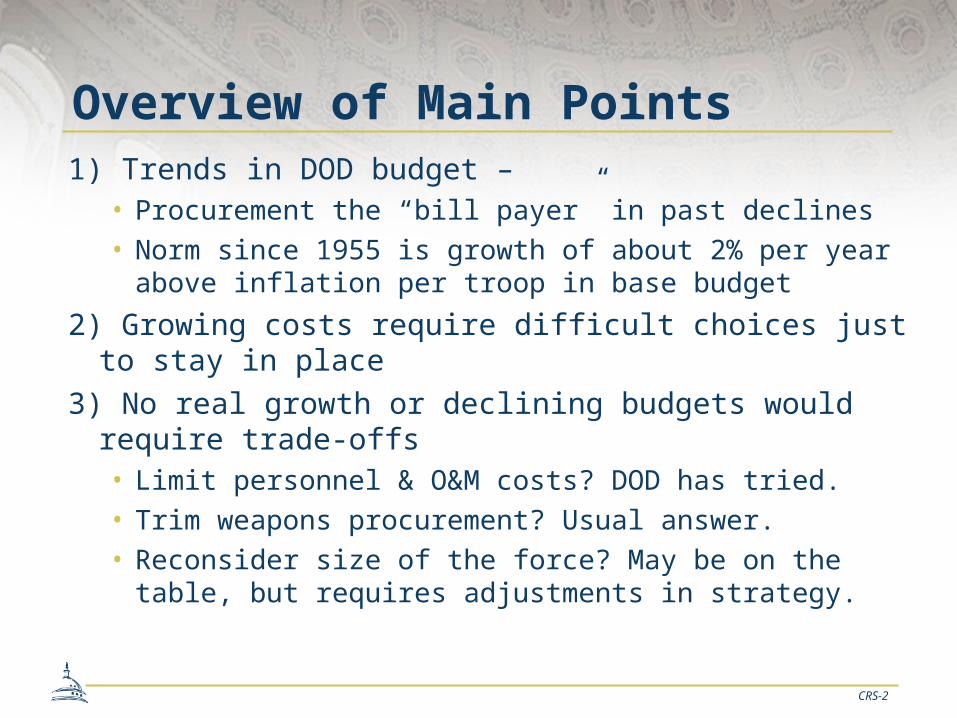
Overview of Main Points1) Trends in DOD budget –
• Procurement the “bill payer” in past declines• Norm since 1955 is growth of about 2% per year
above inflation per troop in base budget
2) Growing costs require difficult choices just to stay in place
3) No real growth or declining budgets would require trade-offs• Limit personnel & O&M costs? DOD has tried.• Trim weapons procurement? Usual answer.• Reconsider size of the force? May be on the table, but
requires adjustments in strategy.

CRS-3
DOD Discretionary Budget Authority and Outlays, FY1950-FY2015
0
100
200
300
400
500
600
700
FY1950 FY1960 FY1970 FY1980 FY1990 FY2000 FY2010
Fiscal Year
Co
nst
ant
FY
2011
$ i
n b
illi
on
s
Budget AuthorityOutlays
Note: FY2010-FY2015, Administration projection, includes projected war costs.

CRS-4
Total DOD Budget by Title, FY1948-FY2015:Procurement Has Been the “Bill Payer” in Past Declines (includes war costs)
0
50
100
150
200
250
300
FY1948 FY1958 FY1968 FY1978 FY1988 FY1998 FY2008
Fiscal Years
FY
2011
$ i
n B
illi
on
s
Military Personnel O&M
MilCon/Fam Hsing
Procurement
R&D
Note: FY2010-FY2015, Administration projection, includes projected war costs.

CRS-5
DOD Budget Authority per Active Duty Troop: FY1955-FY2015 (base budget)
0
50
100
150
200
250
300
350
400
1955 1965 1975 1985 1995 2005 2015
Fiscal Year
Co
nst
ant
FY
2011
$ in
000
s
BA Per Troop
Trend: +1.9% per year
Note: Base budget only, not including war costs

CRS-6
Six Factors Driving Up the Cost of Defense
1) Increase in personnel pay and benefits: FY1998-FY2009 = 45% above inflation
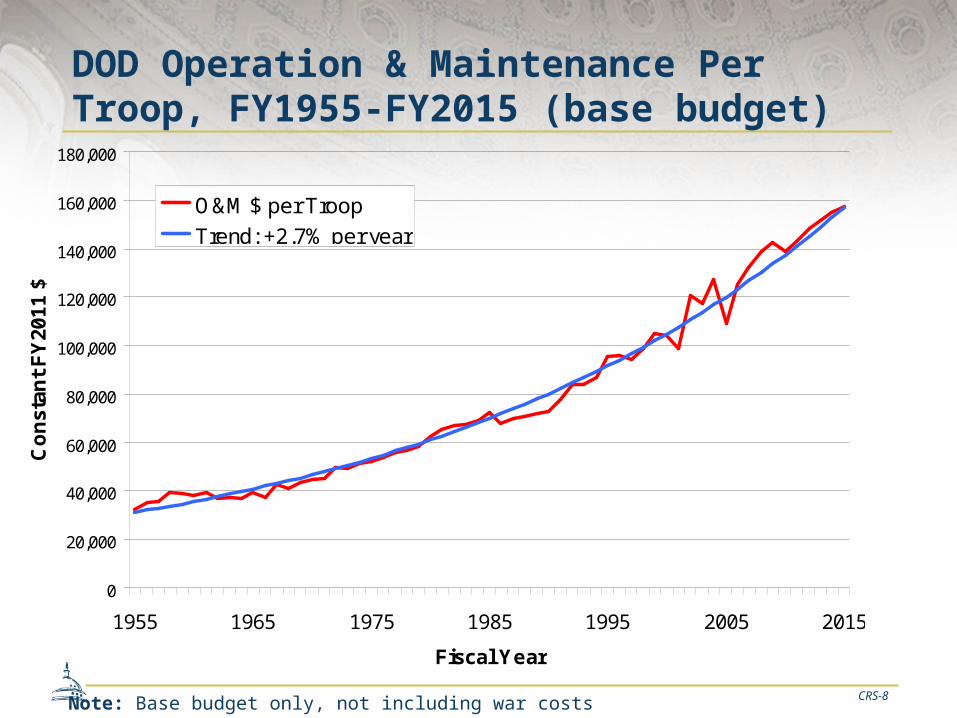
2) O&M grows 2.7% per year above base inflation
[1 & 2 discussed, 3-6 in additional slides]
3) Generational cost growth in weapons4) Underestimation of weapon costs5) Reorganization of Army/lessons of wars 6) Expanded range of threats/challenges

CRS-7
Military Personnel Compensation Per Active Duty Troop, FY1972-FY2009, Indexed to FY1972, Adjusted for Inflation Using CPI
80
100
120
140
160
FY1975 FY1980 FY1985 FY1990 FY1995 FY2000 FY2005
Fiscal Year
MilPers per Troop Index1972 = 100ECI from FY1982
CRS-8
DOD Operation & Maintenance Per Troop, FY1955-FY2015 (base budget)
0
20,000
40,000
60,000
80,000
100,000
120,000
140,000
160,000
180,000
1955 1965 1975 1985 1995 2005 2015
Fiscal Year
Co
nst
ant
FY
2011
$
O&M $ per Troop
Trend: +2.7% per year
Note: Base budget only, not including war costs

CRS-9
DOD Base Budget with No Real Growth: FY2010-FY2020*(constant FY2010 $ in billions)
Military Personnel
$141Billion26%
Military Personnel $151Billion
28%
Operation & Maintenance $186 Billion
34%
Operation & Maintenance$243 Billion
45%
Acquisition$127 Billion
24%Acquisition $186 Billion
35%
Other $17 Bn.Other $24 Bn.
$0
$100
$200
$300
$400
$500
FY2010 FY2020
*Assumes 0.7% annual growth in MilPers, 2.7% annual growth in O&M.

CRS-10
Alternatives if No Real Growth or Real Decline in Defense1) Reform pay & benefits system?
• E.g., less for retirement• Issue: Why take risk (current system worked)
2) Limit O&M & weapons costs? • DOD has tried repeatedly• Would be worse without continuing efforts
3) Reduce new weapons procurement? • Usual answer, but only for short term• Okay with force drawdown, but then must recover
4) Reconsider size of the force? • Difficult until withdrawals from Iraq/Afghanistan• Requires adjustments in strategy

CRS-11
Additional/Backup Slides

CRS-12
National Defense Outlays % GDP: FY1950-FY2016
0.0%
4.0%
8.0%
12.0%
FY1950 FY1960 FY1970 FY1980 FY1990 FY2000 FY2010
Fiscal Year
% G
DP
FY1952: 14.2%
FY1968:9.4%
FY1987: 6.2%
FY2011: 4.9%
FY2002: 3.0%
FY1980: 4.7%
FY1965: 7.4%
Note: FY2010-FY2015, Administration projection, includes projected war costs.

CRS-13
Weapons Recapitalization Rates: FY1985 vs. FY2008
1985 2008 ∆
Tactical Fighters 338 56 -282
Bombers 34 0 - 34
Other Fixed Wing 211 153 -58
Rotary Wing 354 373 +19
Missiles 87,113 13,471 -73,642
Tracked Combat Vehicles
2,414 1,258 -1,156
Tactical Vehicles 56,551 32,276 -24,275
Satellites (Unclassified) 10 1 -9
Ships 23 7 -16
Source: Adapted from Cecil Black, Boeing Corporation, January 2008
Procurement + R&D = $213 billion in FY1985, $244 billion in FY2008, both in FY2008 prices

CRS-14
GAO: Accuracy of Cost Estimates Grows Worse
2000 portfolio 2005 portfolio 2007 portfolio 2008 portfolio
Portfolio Size
Number of programs 75 91 95 96
Total planned commitments $805 Billion $1.5 Trillion $1.6 Trillion $1.6 Trillion
Commitments outstanding $390 Billion $905 Billion $875 Billion $786 Billion
Portfolio Performance Indicators
Change to total RDT&E costs from first estimate 27 percent 33 percent 40 percent 42 percent
Change in total acquisition cost from first estimate 6 percent 18 percent 26 percent 25 percent
Estimated total acquisition cost growth $43 Billion $206 Billion $301 Billion $296 Billion
Share of programs with 25 percent or more increase in program acquisition unit cost
37 percent 44 percent 44 percent 42 percent
Average schedule delay in delivering initial capabilities 16 months 17 months 21 months 22 months
Source: Annual GAO reviews of selected acquisition programs.

CRS-15
Increased Ground Force Requirements• 92,000 increase in Army and MC end-
strength = + $13 billion/year• Army “Modularization” = $52 billion ++• Lessons of the war:
• Force protection• Communications (every Marine in Anbar
to have a radio)• Transportation (trucks, helicopters)• National Guard combat units to be
equipped as part of rotation base

CRS-16Source: Department of Defense briefing slides, August 2004

CRS-17
2006 QDR Objective – Shift in Focus
DisruptiveTraditional
CatastrophicIrregular
Shape Choices
Defeat Terrorist
ExtremismCounter
WMD
DefendHomeland
Today's Capability Portfolio
“Shifting Our Weight”
Source: DOD briefing on 2006 Quadrennial Defense Review, February 3, 2006.

CRS-18
Breakdown of Increases in Military Pay and Benefits per Troop, FY1998 to FY2009
$33,518
$39,079
$4,174
$11,288
$3,387
$4,976
$2,630
$3,408
$11,442
$12,659
$5,484
$2,672
$0
$10,000
$20,000
$30,000
$40,000
$50,000
$60,000
$70,000
$80,000
FY1998 FY2009
Fiscal Year
Co
nst
ant
FY
2009
$
OTHER MILPERS
DEATH GRATUITIES/SURVIVOR BENEFITS/HAZARD INSURANCE
CONCURRENT RECEIPTACCRUAL/ SPECIALDISABILITY COMPENSATION
RETIREE 65- AND OVERHEALTH CARE ACCRUAL
RETIREMENT ACCRUAL ANDSOCIAL SECURITY TAXES
PERMANENT CHANGE OFSTATION TRAVEL
SPECIAL/INCENTIVE PAYAND ALLOWANCES
BASIC ALLOWANCE FORHOUSING
BASIC PAY/ SUBSISTENCE/SEPARATION PAY
$80,004
$55,208
Note: Base budget only, not including war costs

CRS-19
Breakdown of Increases in Military Pay and Benefits per Troop, FY1998 to FY2009
FY1998 FY2009 % Change
BASIC PAY/ SUBSISTENCE/ SEPARATION PAY $33,518 $39,079 +17%
BASIC ALLOWANCE FOR HOUSING $4,174 $11,288 +170%
SPECIAL/INCENTIVE PAY AND ALLOWANCES $3,387 $4,976 +47%
PERMANENT CHANGE OF STATION TRAVEL $2,630 $3,408 +30%
RETIREMENT ACCRUAL AND SOCIAL SECURITY $11,442 $12,659 +11%
RETIREE 65- AND OVER MEDICAL ACCRUAL $0 $5,484 NA
CONCURRENT RECEIPT ACCRUAL/ SPECIAL DISABILITY COMPENSATION $0 $2,672 NA
DEATH GRATUITIES/ SURVIVOR BENEFITS/ HAZARD INSURANCE $26 $106 +300%
OTHER MILPERS $104 $333 +221%
TOTAL ACTIVE DUTY MILITARY PERSONNEL PAY AND BENEFITS $55,280 $80,004 +45%
Note: Base budget only, not including war costs

CRS-20
Acquisition per Troop: FY1955-FY2013 (base budget only)
0
20,000
40,000
60,000
80,000
100,000
120,000
140,000
1955 1965 1975 1985 1995 2005
Fiscal Year
Co
ns
tan
t F
Y2
01
1 $
Acquisition $ per troop
Trend: +2.2% per year
Note: Base budget only, not including war costs