Embed Size (px)
Citation preview
Long-Term Sustainability of Mergers and Acquisitions as a Growth Driver A Case Study of Hospital Corporation of America
by Abrial Goen
A thesis presented to the Honors College of Middle Tennessee State University in partial
fulfillment of the requirements for graduation from the University Honors College
Spring 2019
i
Table of Contents
I. List of Tables iii
II. List of Figures iv
III. Signature Page v
IV. Acknowledgements vi
V. Abstract 1
VI. HCA Introduction 1
VII. Healthcare Industry Introduction 3
VIII. Healthcare Industry Drives Nashville Growth 5
IX. Problem Discussion 6
X. Hypothesis 7
XI. Methodology 8
a. Question 1 8
b. Question 2 10
c. Question 3 10
XII. Question 1 Analysis 11
XIII. Question 2 Analysis 21
a. Strengths 22
b. Weaknesses 23
c. Opportunities 24
d. Threats 25
XIV. Question 3 Analysis 26
a. Cash Flow Coverage Ratio 26
ii
b. Debt-to-Equity Ratio 28
c. Equity Multiplier 29
d. Capital Structure 30
e. Interest Coverage Ratio 31
XV. Conclusion 32
XVI. Works Cited 37
iii
List of Tables
§ Table 1 HCA Market Share and M&A Expenditures 14
§ Table 2 HCA Market Share and Revenue 16
§ Table 3 Cash Flow Coverage Ratio 27
§ Table 4 Debt-to-Equity Ratio 28
§ Table 5 Equity Multiplier 29
§ Table 6 Capital Structure 31
§ Table 7 Interest Coverage Ratio 31
iv
List of Figures
§ Figure 1 Correlation Coefficient Calculation 9
§ Figure 2 Cash Flow Coverage Ratio Calculation 11
§ Figure 3 Debt-to-Equity Ratio Calculation 11
§ Figure 4 Equity Multiplier Calculation 11
§ Figure 5 Interest Coverage Ratio Calculation 11
§ Figure 6 HCA M&A Expenditures 12
§ Figure 7 HCA Market Share 12
§ Figure 8 HCA Revenue vs. Market Share 15
§ Figure 9 HCA Revenue and Market Share 15
§ Figure 10 Acquisitions as a Percent of Revenue 19
§ Figure 11 Acquisition Expenditures 20
§ Figure 12 Stock Prices in Relation to Acquisition Announcement 21
v
Long-Term Sustainability of Mergers and Acquisitions as a Growth Driver A Case Study of Hospital Corporation of America
by Abrial Goen
APPROVED:
____________________________ Dr. Keith Gamble Jones College of Business ___________________________
Dr. John Vile Dean, University Honors College

vi
Acknowledgements
I would like to thank Dr. Keith Gamble for his enormous support as my advisor
throughout this process. His expertise in the field of finance and economics, along with
his continual encouragement, has helped me tremendously in completing this thesis. I
will continue to take all I have learned from him during the time of having him as my
advisor and apply it throughout my graduate studies and into my career.
1
Abstract
Hospital Corporation of America (HCA) is well-known in the healthcare industry
as being a giant in the hospital management sector. HCA’s current growth driver,
mergers and acquisitions (M&A), was examined in order to determine whether the
current growth strategy is sustainable. By measuring various financial metrics related to
growth, finding the correlation to metrics relating to M&A activity, and considering
qualitative evidence, analysis shows HCA's M&A activity has driven significant business
growth for the firm. After calculating a suite of financial ratios intended to measure the
financial health and sustainability of firms, it was determined that HCA's current growth
strategy cannot be continued indefinitely on a sustainable basis, nor does is maximize
shareholder value. Continued reliance on M&A activity for business growth is not
sustainable for HCA, as found through the establishment of HCA's current growth
strategy, and examination of the effects of this strategy financially.1
HCA Introduction
Hospital Corporation of America (HCA), a multi-functioning hospital company,
has dominated the healthcare industry since their beginning. HCA was founded in 1968
as one of the nation’s first hospital companies (Press Kit, n.d.). This was a time in which
the United States healthcare system was still being structured in many ways. Just three
years prior to the beginnings of HCA, president Lyndon B. Johnson signed into law the
Social Security Act of 1965 (Social Security, n.d., para. 2). This bill laid the foundation
for what is known today as Medicare and Medicaid. Prior to this bill, the jobless and
1 All financial data concerning HCA from public 10-K SEC filings unless otherwise stated
2
elderly struggled to have the necessary healthcare provided. Hospital Corporation of
America began as a single hospital called Parkview Hospital in Nashville, Tennessee
(Gilpin, 1998, para. 4). From there, HCA began the journey of massive expansion.
Merging frequently with other companies and acquiring additional hospitals, HCA
quickly became a familiar name amongst communities across the United States and
abroad.
HCA had their first initial public offering one short year later in 1969. Doing so
brought tremendous growth for the company by opening new avenues for financing that
could be used for further mergers and acquisitions (M&A) activity. The growth continued
through the ‘70s and ‘80s for HCA as they began to use many new and innovating
business practices to expand their business and accelerate growth. During 1981, HCA
acquired General Care Corporation, General Services, and Hospital Affiliates
International. By the end of the year, HCA owned an empire. With 349 hospitals and
49,000 beds under management, operating revenues were up $2.4 billion (Press Kit, n.d.).
The empire HCA continued to build was one never seen before. In 1994, HCA
grew to $20 billion in revenue, with 285,000 employees, but soon became the subject of a
fraud investigation. The investigation concerned the way the company handled Medicare
billing, which left millions of dollars in question. After settling in 2002, HCA agreed to
pay the United States (U.S.) government $631 million and $17.5 million to Medicaid
agencies, amongst other expenses, to settle the 1997 dispute (Appleby, 2002, para. 6).
From there, HCA rebranded in many ways and restructured their key executives and
board members. Another transition occurred for Hospital Corporation of America in
2006. The Frist family and several other investors joined together to take HCA private

3
again. The deal was completed at $33 billion, which was the largest LBO in history to be
completed at the time (Press Kit, n.d.). A short four years later, HCA decided to once
again take the company public. This Initial Public Offering (IPO) included 126.2 million
shares sold at $30 each, anticipating a $4.6-billion initial public offering. Although this
marked the largest private-equity backed IPO in United States history (Baldwin, 2011,
para. 2), there were many challenges on the horizon for HCA and the rest of the
healthcare industry. HCA began as a newly publicly traded company with debt totaling
$26 billion (Baldwin, 2011, para. 14). Another business challenge stemmed from the
newly signed Affordable Care Act in 2011. This legislation required Americans to buy
health insurance and required that an online health insurance exchange be available to
sell subsidized health insurance (Affordable Care Act, n.d., para. 1). Although this new
law presented an opportunity for companies like HCA, it was crucial for the company to
develop a strategy to adapt to the ever-changing healthcare landscape in the U.S.
Beginning as one of the first for-profit hospitals in the nation, HCA sought to
outperform other hospitals by using scale, financial strategy, and management expertise.
Today, HCA is the largest hospital company in the nation; it reached $43.6 billion in
revenue in 2017 alone. HCA’s operational and strategic decisions continue to drive
massive growth, showing they are a big spender when it comes to merger and acquisition
transactions, as I will continue to demonstrate as my research furthers.
Healthcare Industry Introduction
The healthcare industry has been recognized as the leading sector for merger and
acquisition activity since 2015. In short, the term merger and acquisition is defined as one

4
company choosing to merge with another company, or acquiring another company in its
entirety. In 2017 alone, 11 reported transactions involved sellers with net revenues $1
billion or greater (Skokie, 2018, para. 2). During 2018, we saw pivotal deals such as CVS
health completing its long-targeted acquisition of Aetna. This deal was completed at
roughly $70 billion, one of the largest deals in healthcare history (Lavito, 2018, para. 3).
Ultimately, we are seeing major healthcare giants taking advantage of the optimal market
conditions such as low interest rates and tax cuts, to use merger and acquisition activity to
carry out their financial and strategic goals to drive growth. Specifically, the hospital
sector of the healthcare industry is making most of this time to “give their systems greater
scale to reduce costs, offer additional care services, and create a larger foot print in the
local market” (RevCycle Intelligence, 2018, para. 5). In addition, hospitals are also
acquiring physician practices to increase their market share and “capture more of the
healthcare continuum” (RevCycle Intelligence, 2018, para. 15).
Another factor driving the ever-growing healthcare industry in the United States
is the rapidly growing old-age population. According to the U.S census website, by 2030,
all baby boomers will be over the age of 65. For the first time in U.S. history, older
people will outnumber children. This statistic means one in every five residents will be at
retirement age. It is questionable if the U.S has the healthcare infrastructure to support
such a large number of people over the age of 65 (U.S. Census Bureau, 2018, para. 1).
Despite this concern, healthcare companies have many challenges and opportunities
ahead. With these challenges and opportunities comes encouragement for companies like
Hospital Corporation of America to continue to drive growth from M&A activity.
5
Healthcare Industry Drives Nashville Growth
The healthcare industry has provided a huge source of income for Tennessee since
the mid 1900s. Companies have consistently taken advantage of the lower cost of real-
estate, the large pool of talent coming from major universities around the area, and the
upward trajectory Nashville has been on since the early 2000s. Companies like Hospital
Corporation of America have helped pave the way for such a boom. To further this
impact, the healthcare industry centered in Middle Tennessee contributes to the larger
healthcare industry across the United States and globally. According to the Nashville
Healthcare Council, Nashville healthcare industry generates more than $92 billion in
revenue and more than 570,000 jobs on a year to year basis. Locally, the Nashville
healthcare industry contributes an overall economic benefit of $46.7 billion and more
than 270,000 jobs to the economy annually. Seventeen publicly traded healthcare
companies are headquartered in Nashville. Healthcare in Nashville has also proven to
provide an industry of innovation. As the Healthcare Council points out, more than $1.6
billion in venture capital has been invested in Nashville healthcare companies from 2005-
2015 (Nashville: The Health Care Industry Capital, n.d., para. 7). As the statistics above
demonstrate, the Nashville Scene proves these points further by stating, “because of the
presence of the industry is so great, any changes made here are bound to send a ripple
through the greater healthcare market” (Haggard, 2018, para. 34). HCA beginning their
business in the Nashville area then expanding to other parts of the U.S, and eventually
internationally, is a prime example of the ripple sent through the greater healthcare
market, but is this sustainable?
6
Problem Discussion
As demonstrated above, Hospital Corporation of America has played a major role
in shaping the healthcare landscape into what it is today. Prior to its start, hospitals were
predominately non-profit or religiously affiliated, but HCA was a force of change. Even
further, HCA has contributed to the positive economic impact experienced in Nashville
over the last decade. Along with these factors, HCA has dominated the healthcare
industry, using M&A activity as their primary vehicle of growth. According to filings
found on sec.gov, in 2017 HCA spent $1.21 billion on merger and acquisition
transactions. By strategically growing through M&A activity, HCA has grown to a
network of 178 hospitals and 119 freestanding surgery centers in 20 states and the United
Kingdom (“Who We Are”, n.d.). These transactions have allowed HCA to grow to be a
large company with increasing revenues, while showing no signs of changing course and
continued completing merger and acquisition deals all through 2018. Clearly, HCA
believes that it is in their best interest to spend large quantities of capital each and every
year on these transactions. In addition, HCA must also believe it is through M&A
transactions that shareholder value will be maximized. It is through analysis that this
thesis will test how sustainable this growth is. For research purposes, sustainable growth
or sustainability will be defined as being able to grow continually in this way for
numerous years into the future while being able to meet all financial obligations and
maximize shareholder value in the long haul.
7
Hypothesis
These merger and acquisition transactions have been a very important factor in
relation to HCA’s impressive growth. Without these merger and acquisition transactions,
HCA would not have been able to grow at the rate or degree in which they have achieved.
Through my research, I hope to show that HCA owes its growth to accretive merger and
acquisition transactions, as proven by several measures of growth. By choosing to operate
as an investment firm first, and healthcare provider second, they have been able to grow
at a high rate and to a greater degree than any other major healthcare conglomerate. The
factors that have led to this hypothesis are many. HCA has a history of allocating vast
amounts of resources to merger and acquisition transactions within the healthcare sector.
During this time, HCA has grown both rapidly and steadily. Through the exploration of
this hypothesis, I will seek to answer many questions, including the following:
1. How are M&A transactions correlated to HCA’s growth?
Financial
a. What part of HCA’s growth is due to M&A transactions?
b. What correlation is there between market share and amount spent on
M&A transactions?
c. What correlation is there between market share growth and revenue
growth?
d. What correlation is there between the number of hospitals purchased and
revenue growth?
Strategic
8
e. What have company officers stated about the reasons for certain M&A
deals?
f. How have company officers justified expenditures for M&A deals?
g. How do the backgrounds of company officers and investors influence the
overall growth strategy of HCA?
h. How does HCA’s growth compare to competing firms?
i. How has the announcement of M&A activity affected the stock price?
2. What are the strengths, weaknesses, opportunities, and threats of HCA’s high-
volume M&A activity?
3. How sustainable is the growth HCA is experiencing due to M&A transaction?
a. What is HCA’s cash flow coverage ratio?
b. What is HCA’s debt to equity ratio?
c. What is HCA’s equity multiplier?
d. What is HCA’s capital structure?
e. What is HCA’s interest coverage ratio?
Methodology
Question 1:
In order to support my hypothesis, I plan to examine HCA both quantitatively and
qualitatively. For my quantitative research, I will analyze HCA’s recent merger and
acquisition activity. I will define which indicators will be used to quantify merger and
acquisition transactions. Indicators that will be used to quantify merger and acquisition
transactions will be number of merger and acquisition transactions, cost of individual
9
merger and acquisition transactions, total expenditures on merger and acquisition
transactions, and number of hospitals and hospital beds acquired. Indicators used to
measure growth will be change in revenue, goodwill gained, and change in market
share. I will further gather qualitative information in the form of quotes, press releases,
news articles, industry journals, excerpts from investor letters, and SEC filings. This
information will be found through CapIQ, HCA SEC filings and financial statements,
HCA investor documents, news outlets, and reputable industry media outlets. Research
will expand further to gauge the sustainability of HCA’s M&A activity by calculating the
acquisition expenditures to single basis point increase of market share and calculating the
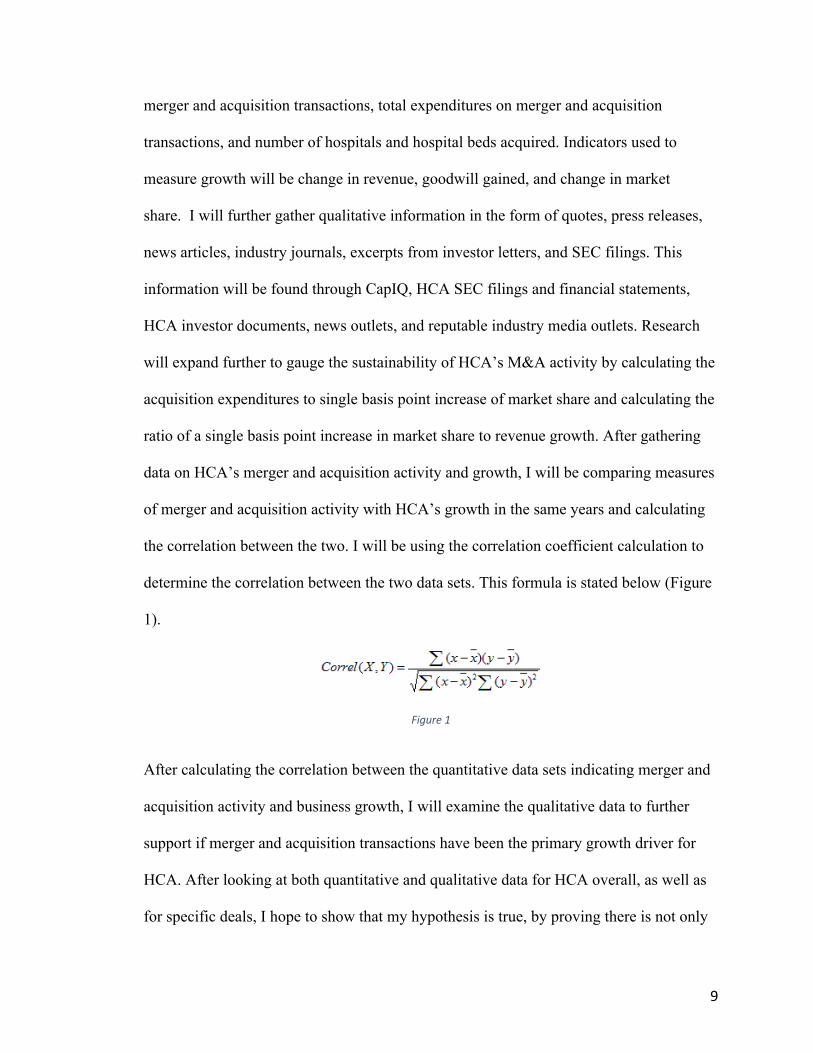
ratio of a single basis point increase in market share to revenue growth. After gathering
data on HCA’s merger and acquisition activity and growth, I will be comparing measures
of merger and acquisition activity with HCA’s growth in the same years and calculating
the correlation between the two. I will be using the correlation coefficient calculation to
determine the correlation between the two data sets. This formula is stated below (Figure
1).
Figure 1
After calculating the correlation between the quantitative data sets indicating merger and
acquisition activity and business growth, I will examine the qualitative data to further
support if merger and acquisition transactions have been the primary growth driver for
HCA. After looking at both quantitative and qualitative data for HCA overall, as well as
for specific deals, I hope to show that my hypothesis is true, by proving there is not only
10
correlation between merger and acquisition activity and business growth, but also
causation.
Question 2:
To determine the impact on stock price from the announcement of M&A
transactions, I will first specify the time of announcement, given from the press release
section of HCA’s website. The time frame to monitor the change in stock price will be 1
trading day before the announcement, the day of the announcement, and 1 trading day
after the announcement. To gain a better understanding of the impact of the
announcement, I will compare the performance of HCA’s stock against the Healthcare
S&P 500 (^HCX). This will help determine if HCA’s stock is up or down because of the
M&A announcement or if the market as a whole is up or down for that particular time
period.
Question 3:
In order to measure whether HCA’s current growth strategy through M&A
transactions is efficient and sustainable, I will calculate a series of financial ratios and
measures to gauge the impact these transactions have on the company’s financial health.
These ratios and measures can be calculated using information published in SEC filings,
among other public sources. By measuring the cash flow coverage ratio (Figure 2), debt-
to-equity ratio (Figure 3), the equity multiplier of HCA (Figure 4, understanding their
capital structure, and what their interest coverage ratio is (Figure 5), I will be able to
determine whether HCA’s current growth mechanisms are sustainable for future growth
and financial health.

11
Cash Flow Coverage Ratio = Operating Cash Flows / Total Debts
Figure 2
Figure 3
Equity Multiplier = Total Assets / Total Equity
Figure 4
Interest Coverage Ratio = Cash Flow from Operating Activities / Interest Expense
Figure 5
The above formulas will be used to calculate these ratios.
Question 1 Analysis:
While it is clear that HCA has achieved remarkable growth, it is important to
examine how the company’s growth relates to its M&A activity. HCA has spent billions
of dollars to acquire companies and contribute to their growth. In order to discover just
how related HCA’s business growth and M&A activity is, as well as determining the
efficiency of their M&A expenditures, this paper will examine various metrics relating to
HCA’s M&A activity and their growth. If there is a positive correlation between the
various metrics that can be supported by quantitative and qualitative evidence, one can be
confident in the causation of M&A activity to HCA’s overall growth.
12
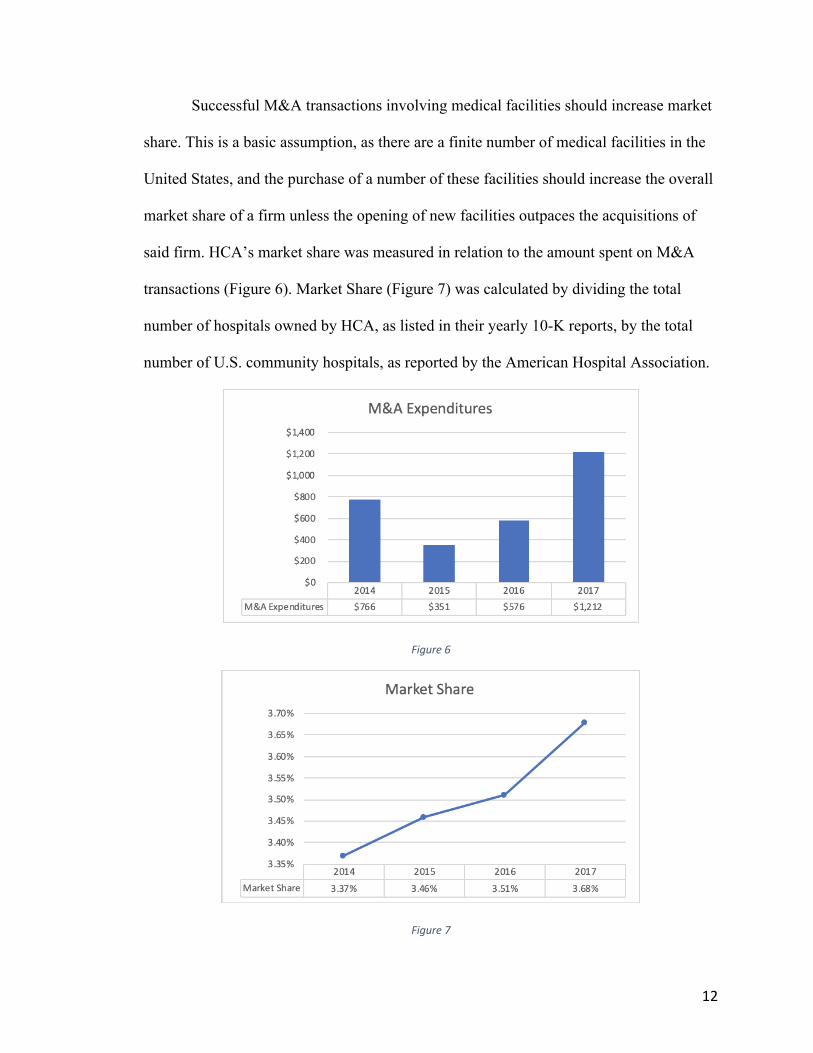
Successful M&A transactions involving medical facilities should increase market
share. This is a basic assumption, as there are a finite number of medical facilities in the
United States, and the purchase of a number of these facilities should increase the overall
market share of a firm unless the opening of new facilities outpaces the acquisitions of
said firm. HCA’s market share was measured in relation to the amount spent on M&A
transactions (Figure 6). Market Share (Figure 7) was calculated by dividing the total
number of hospitals owned by HCA, as listed in their yearly 10-K reports, by the total
number of U.S. community hospitals, as reported by the American Hospital Association.
Figure 6
Figure 7
13
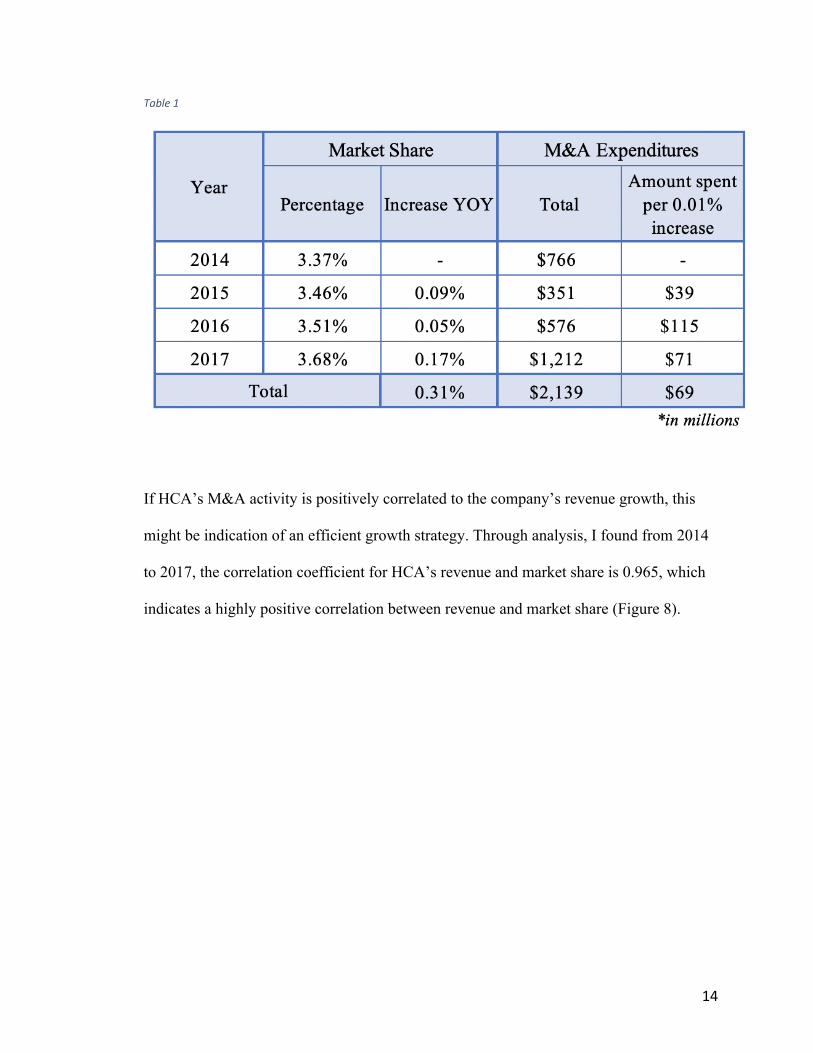
By examining the increase in HCA’s market share year-over-year as it relates to
its M&A expenditures, it can be determined that from 2014 to 2017, HCA spent an
average of $69 million for each incremental increase of 0.01% in market share. This
measure was determined by dividing the dollar amount of HCA’s acquisition
expenditures by the increase of market share, measured in basis points, from the same
period (Table 1). HCA has effectively been buying its market share instead of organically
growing and opening up new facilities in new markets. This allows the company to grow
quickly, cutting the amount of time spent building facilities, hiring staff, and navigating
the regulatory hurdles to opening new facilities. By purchasing medical facilities, HCA
also circumvents fighting competition for the service of a certain market. In purchasing
medical facilities, HCA is able to begin operations without the competition of the existing
facilities. But, for these massive expenditures to be effective, it must be shown that
HCA’s current rate of $69 million per basis point of market share can be justified by the
return on these expenditures.
14
Table 1
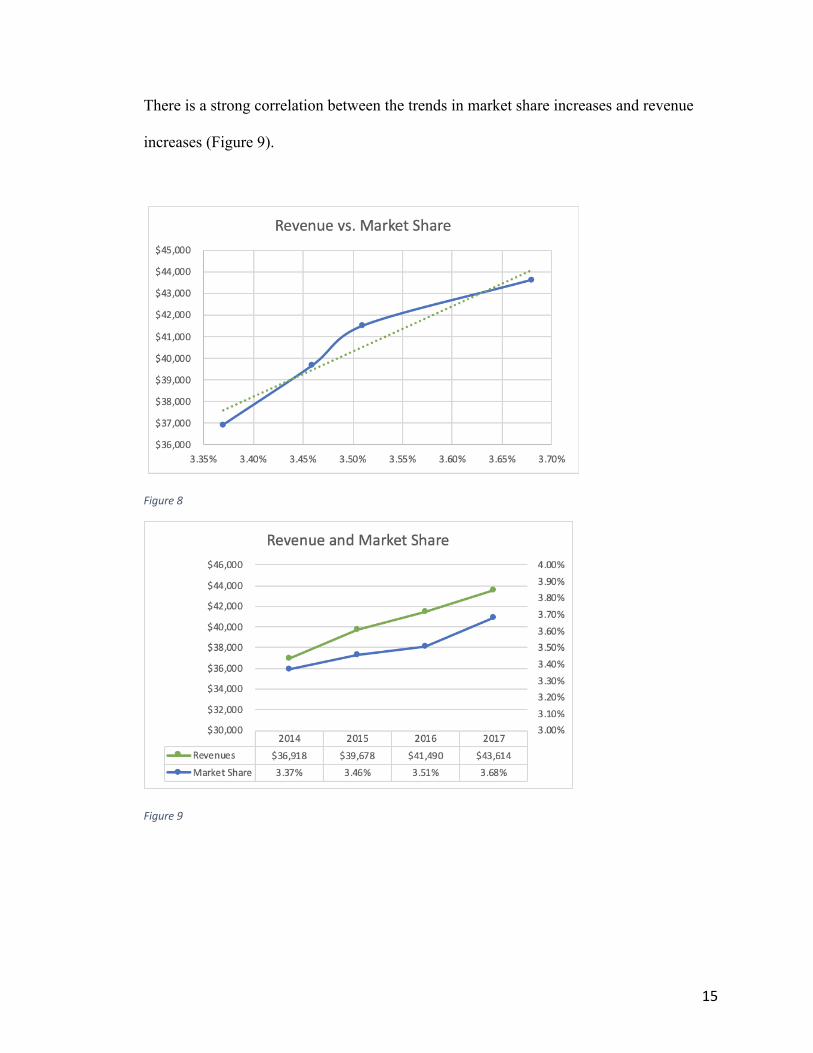
If HCA’s M&A activity is positively correlated to the company’s revenue growth, this
might be indication of an efficient growth strategy. Through analysis, I found from 2014
to 2017, the correlation coefficient for HCA’s revenue and market share is 0.965, which
indicates a highly positive correlation between revenue and market share (Figure 8).
15
There is a strong correlation between the trends in market share increases and revenue
increases (Figure 9).
Figure 8
Figure 9
16
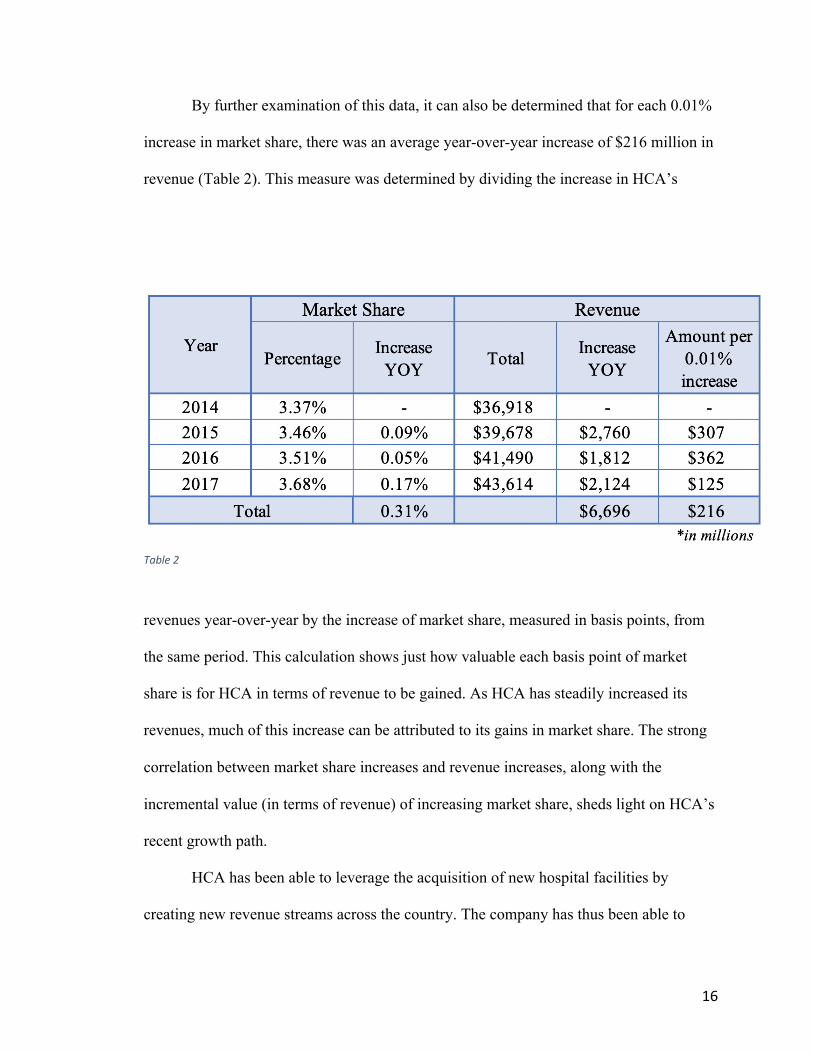
By further examination of this data, it can also be determined that for each 0.01%
increase in market share, there was an average year-over-year increase of $216 million in
revenue (Table 2). This measure was determined by dividing the increase in HCA’s
revenues year-over-year by the increase of market share, measured in basis points, from
the same period. This calculation shows just how valuable each basis point of market
share is for HCA in terms of revenue to be gained. As HCA has steadily increased its
revenues, much of this increase can be attributed to its gains in market share. The strong
correlation between market share increases and revenue increases, along with the
incremental value (in terms of revenue) of increasing market share, sheds light on HCA’s
recent growth path.
HCA has been able to leverage the acquisition of new hospital facilities by
creating new revenue streams across the country. The company has thus been able to
Table 2
17
benefit from economies of scale and from the sheer volume of services being paid. In
order to measure this relationship, one can examine the correlation between the number
of hospitals owned each year to revenues from the same period. From 2013 to 2018, the
correlation coefficient was 0.924, indicating a strong positive correlation. As HCA has
been able to acquire more hospitals they have also been able to create efficiencies within
the hospitals due to the corporation’s technology investments and scale.
When one looks at these three metrics in conjunction, it can be seen that HCA’s
acquisitions are highly correlated to revenue and market share growth. HCA has been
using large amounts of capital to purchase market share, in order to grow without the
need to open new facilities and compete with existing facilities. On average, for each
dollar spent on M&A transactions, the company’s revenues increased by over a factor of
three. Along with increase in market share and economies of scale has come value, but
does this benefit outweigh the cost? In addition, this analysis will continue to uncover the
sustainability of the rapid growth through M&A transactions. As I will discuss later, it is
a corporation’s responsibility to maximize shareholder value as a publicly traded
company. To begin to uncover if HCA is fulfilling their responsibility, I will exam how
the executives have justified these transactions, and if the background of the corporate
officers play a role in their decisions.
HCA has also publicly justified their M&A expenditures repeatedly. In their 10-K
reports, filed each year, HCA states that between 2014 and 2018 goodwill increased by
over $2.2 billion. When making public statements, company officers normally speak
about two main benefits of acquisitions in their public press releases, posted on their
investor relations webpage. The first is the expansion into new markets and complement
18
facilities in current markets. These statements underpin the metrics that show the strong
relationship between acquisitions and business growth. The second main point that
officers often state is how technology acquisitions will help current operations to be more
efficient. This displays the priority of company officers to increase the profitability of
newly acquired facilities and capitalize on economies of scale.
When examining HCA’s growth strategies, it is interesting to note certain events
in the company’s history as well as noting the past experience of several board members.
HCA has been bought out and eventually brought public three times. These transactions
were led by experienced investors and advised by well-known private equity funds. Five
out of thirteen of HCA’s board members are also investors or executives at investment
firms. As HCA has chosen a growth path driven by financial transactions, it is interesting
to note the company’s history and current influence by investors. HCA has been a vehicle
for healthcare investments, driven by career investors. It seems many executives have
played to their strengths as current and former investors when driving the growth of
HCA’s M&A activity. To understand if HCA has done the same, I will analyze how the
company has played to their strengths, grown through weaknesses, capitalized on
opportunities, and defended against threats to further sustain its operations.
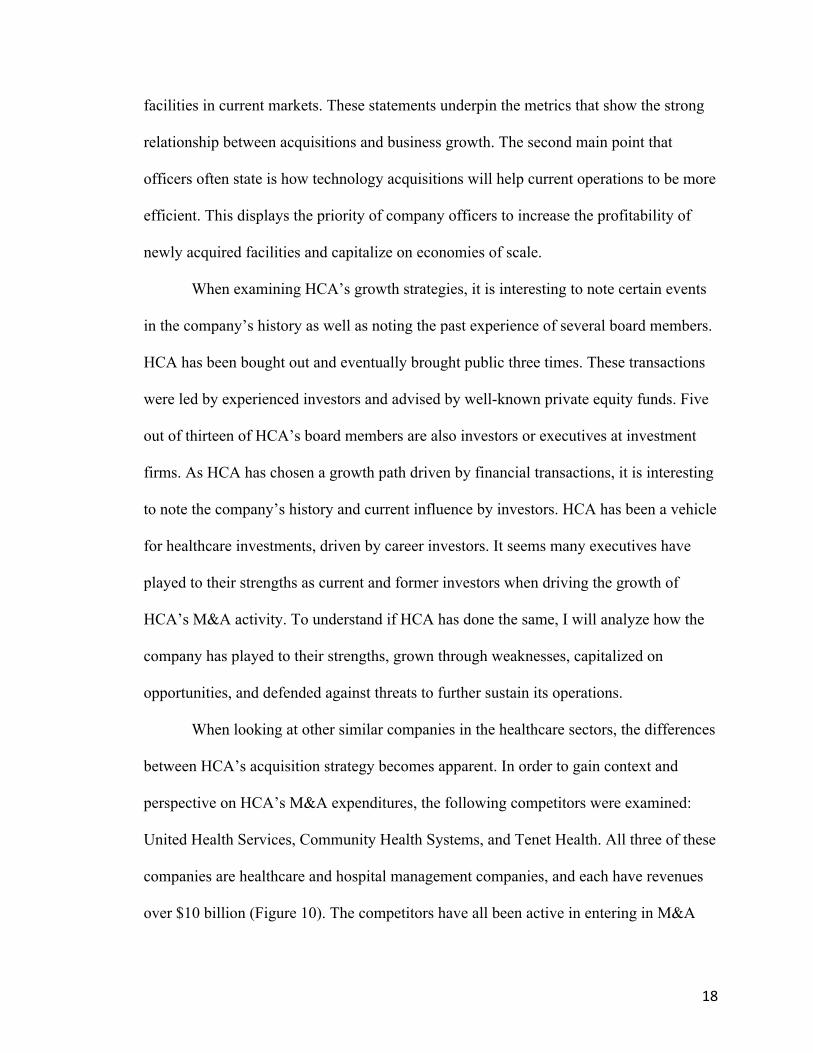
When looking at other similar companies in the healthcare sectors, the differences
between HCA’s acquisition strategy becomes apparent. In order to gain context and
perspective on HCA’s M&A expenditures, the following competitors were examined:
United Health Services, Community Health Systems, and Tenet Health. All three of these
companies are healthcare and hospital management companies, and each have revenues
over $10 billion (Figure 10). The competitors have all been active in entering in M&A
19
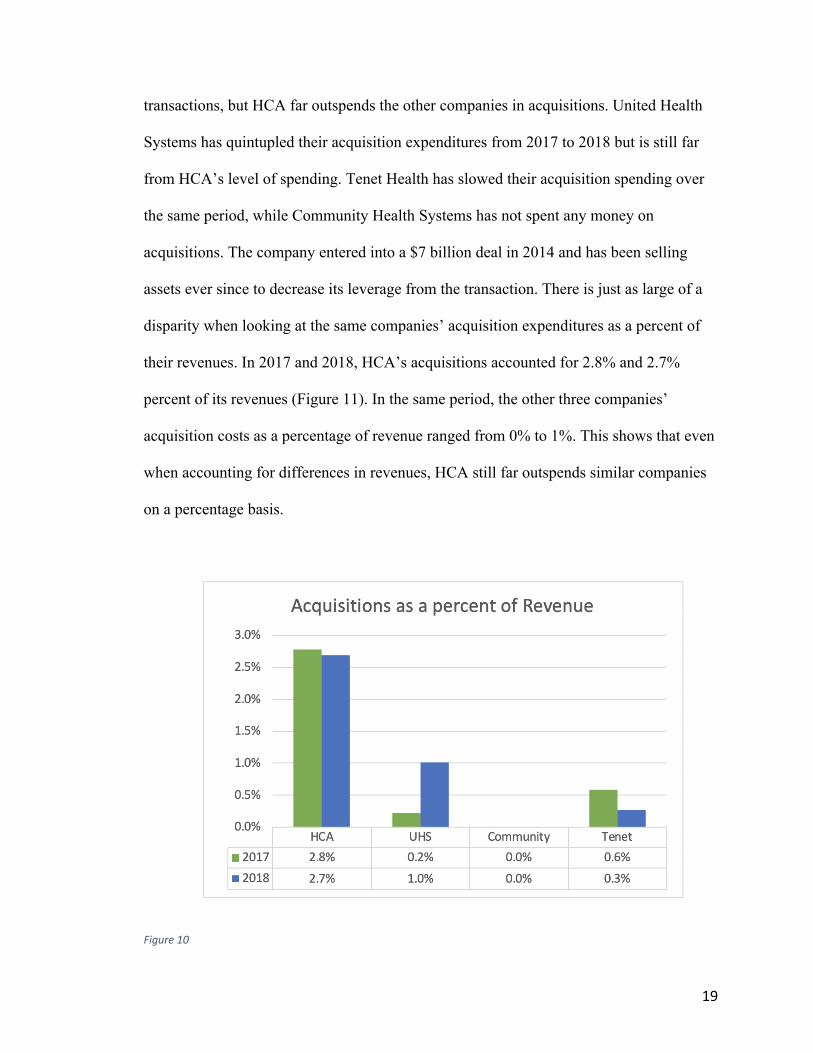
transactions, but HCA far outspends the other companies in acquisitions. United Health
Systems has quintupled their acquisition expenditures from 2017 to 2018 but is still far
from HCA’s level of spending. Tenet Health has slowed their acquisition spending over
the same period, while Community Health Systems has not spent any money on
acquisitions. The company entered into a $7 billion deal in 2014 and has been selling
assets ever since to decrease its leverage from the transaction. There is just as large of a
disparity when looking at the same companies’ acquisition expenditures as a percent of
their revenues. In 2017 and 2018, HCA’s acquisitions accounted for 2.8% and 2.7%
percent of its revenues (Figure 11). In the same period, the other three companies’
acquisition costs as a percentage of revenue ranged from 0% to 1%. This shows that even
when accounting for differences in revenues, HCA still far outspends similar companies
on a percentage basis.
Figure 10
20
Figure 11
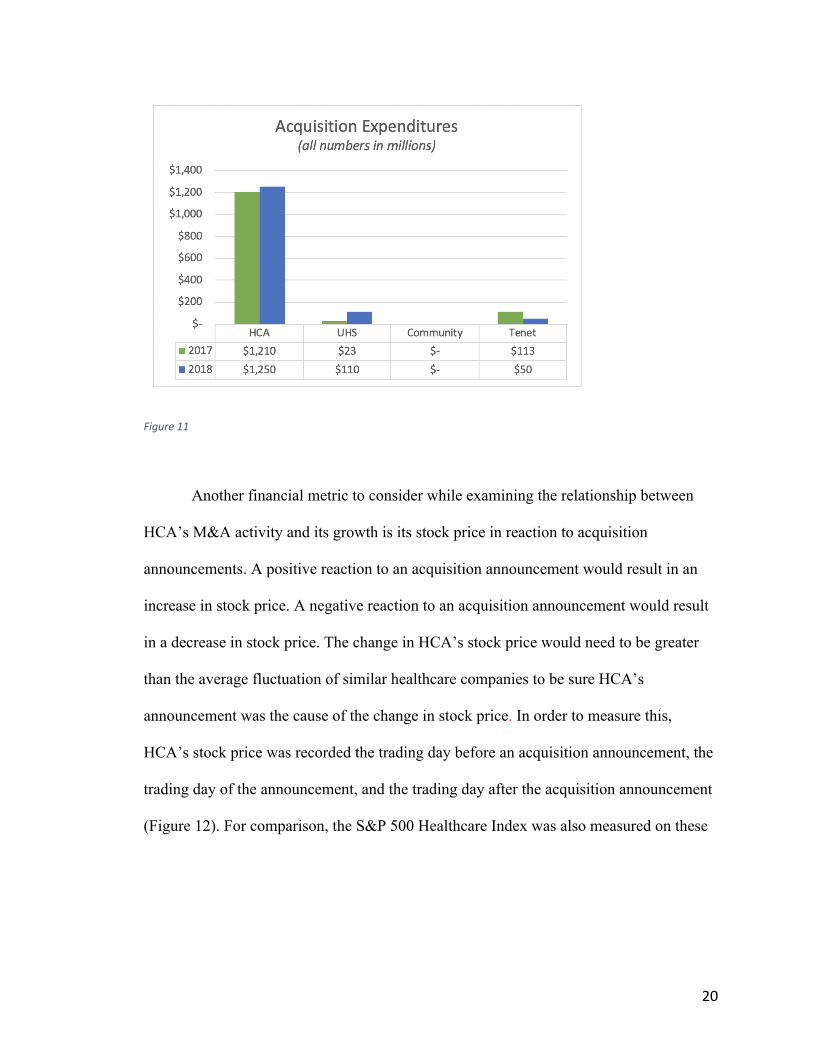
Another financial metric to consider while examining the relationship between
HCA’s M&A activity and its growth is its stock price in reaction to acquisition
announcements. A positive reaction to an acquisition announcement would result in an
increase in stock price. A negative reaction to an acquisition announcement would result
in a decrease in stock price. The change in HCA’s stock price would need to be greater
than the average fluctuation of similar healthcare companies to be sure HCA’s
announcement was the cause of the change in stock price. In order to measure this,
HCA’s stock price was recorded the trading day before an acquisition announcement, the
trading day of the announcement, and the trading day after the acquisition announcement
(Figure 12). For comparison, the S&P 500 Healthcare Index was also measured on these
21
Figure 12
same dates. Upon measuring this information for ten recent acquisition announcements,
the data analysis shows that these announcements have no significant effect on the
HCA’s stock price. The trend of HCA’s stock price over the day before, day of, and day
after an acquisition announcement was almost identical to that of the S&P healthcare
index (^HCX).
Question 2 SWOT Analysis
To get a full picture of HCA, one must consider its strengths, weaknesses,
opportunities and threats. Although HCA has become a giant in the healthcare industry, it
would be a mistake to consider the company invincible. However, it would also be a
22
mistake to discount the potential for continued success. In order to succeed in continuing
growth, HCA must focus on managing threats that could harm their future sustainability
as a profitable company.
Strengths:
HCA has many strengths that have allowed it to succeed in becoming the largest
for-profit hospital company in the United States. It has a large network of hospitals that
are able to benefit from being in such a network. Each facility is able to benefit from
shared data and information that can help to increase efficiencies. This benefit, along
with access to technology unique to HCA, allows each individual hospital unit to operate
more efficiently within HCA’s network of hospitals than alone. This large network of
hospitals has allowed HCA to create trusted brands both nationally and locally. This
brand allows HCA facilities to become trusted hospitals in whatever locality in which
they find themselves, providing a competitive edge. HCA also benefits from being such a
large company at a corporate level. This size allows the company to have more
bargaining power with suppliers, as they are easily able to display the large demand and
purchasing potential they bring to suppliers. HCA also enjoys the luxury of being a
company with vast financial resources. This wealth has allowed the company the chance
to enter into M&A transactions on a regular basis. Many other companies are not in a
position to consider purchasing other businesses as HCA can. The company has also been
able to make efficient operations standard across the nation by implementing software
solutions that they have acquired.
23
Weaknesses:
Although HCA has been able to cement itself as a giant in the healthcare industry,
its weaknesses have proven to be a limiting factor in its financial health and current
operations. Economic conditions over the last ten years have lightened the burden of
these limitations but have remained issues that could make future growth very difficult,
especially in times of uncertainty. One of the most pressing weaknesses is HCA’s
massive amounts of debt. Being as leveraged as HCA makes several aspects of running
such a large business very difficult. More specifically, it hampers HCA’s ability to
continue growing the company using their current strategy, making it difficult to
complete M&A transactions in the future. The extreme amount of debt, as always, comes
with a costly price of interest payments. This requires HCA to use more of its operating
cash flow to pay off debts, rather than other more efficient uses of cash flow. If the
economic conditions turn to become less favorable, HCA risks being strained to pay its
debts and maintain profits. The same would be true if there are regulatory changes in the
future.
As Medicare and Medicaid programs represents large amounts of HCA’s income,
any changes to these programs would have massive repercussion for the company as a
whole. If any laws are enacted that ease or tighten regulations or funding to public health
initiatives, HCA would have to work to recover these lost profits. Any one of these things
happening would be harmful to the company’s equity value as they could become less
attractive to investors.
HCA also relies too heavily on specific markets. The states that contribute the
most revenue in proportion to others are Texas and Florida. Relying on specific markets
24
means that if there are any changes in that specific market, the company as a whole
would suffer disproportionately to the same situation happening in other states. In order
to remain a primary and sustainable player in the healthcare industry, HCA must address
these weaknesses.
Opportunities:
There are many opportunities for continued growth at HCA. Although they have
risen to the top hospital company, they still only control a small portion of the entire
market. This fact presents vast amounts of profitable opportunities for growth. HCA has
many markets within the U.S. that it could enter in order to grow. Furthermore, HCA also
has opportunities to expand into different areas of the healthcare industry.
Healthcare technology and data are extremely valuable and profitable and can be
used to innovate and erupt emerging markets. With access to large amounts of data, HCA
could leverage this resource to create new business opportunities. HCA could also
develop technology that could be used both to make their own operations more efficient
and further diversify their streams of revenue. HCA has many opportunities to sell data to
companies that are not competitors, but value certain aspects of HCA’s data for research
and decision making (pharmaceutical companies and medical equipment suppliers).
The aging population of the United States ages, this provides opportunities for
HCA as well. An aging population inherently means more people who will need more
medical care, causing an increasing demand for HCA to meet in the near future. HCA can
take advantage of demographic trends to maintain strong revenue. Furthermore,
capitalizing on their opportunity to innovate through technology could ensure the
25
company is ready for such high demand. Having the proper technology in place will
allow HCA to have smoother operations and maintain their edge against competitors.
Threats:
HCA faces many threats that could be approaching on the horizon. To begin, one
of the biggest threats to HCA is changes in federal policies. These changes could cause
potential to make operations more difficult and more costly for HCA. An example would
be if the company needs to change policies in order to maintain compliance; such policies
are hard to implement across such a large organization, requiring many dollars spent in
updated training. It is essential HCA stay ahead of such factors to plan effectively for
their future operations. The same risks apply for state government as this threat could
harm HCA in the very near future. The repercussions of changing healthcare policy on a
governmental level means that profit margins would decrease. More specifically, there
are risks of Medicare or Medicaid programs receiving less funding in the future. With
HCA currently receiving large portions of their revenues through these programs, on
behalf of patients who otherwise are uninsured or unable to pay, losing funding in this
area would result in a depletion of a major revenue stream. If the payment of medical
bills shifts more on to the shoulders of private insurance companies, this would also pose
a threat to HCA, as these private insurers would receive even more bargaining power, as
they would hold a large portion of HCA’s revenues.
The last ten years have held a huge economic upswing, bringing prosperous times
for many. Nonetheless, markets are cyclical, and anticipation of the downturns are a
major part of a sustainable business. This cyclicality signals economic changes that could
restrict the flow of capital and make it more difficult for HCA to operate like it has in
26
recent years. This downturn, paired with HCA’s high level of debt, could cause the
company difficulties meeting financial obligations and using large amounts of capital to
purchase other companies to maintain on their current path of growth.
Despite having enjoyed growth throughout its history, HCA has just as many
weaknesses and threats as it does strengths and opportunities. The company, being highly
leveraged, has many weaknesses that could make them unprepared and exposed to threats
that could be arriving in the neat future. HCA is extremely susceptible to changes in
federal healthcare policy, and the slowing economy specifically. However, the company
does have many opportunities to expand geographically, as well as diversifying sources
of revenue by entering different areas of the healthcare industry, such as data and
technology. In order to be a company that can safely and reliably operate while also being
attractive to investors, HCA must address its weaknesses before future threats become
present issues.
Question 3 Analysis
Cash Flow Coverage Ratio:
In the analysis of HCA, it is important to gauge the liquidity position of the
company to help determine how sustainable their M&A activity actually is. One metric
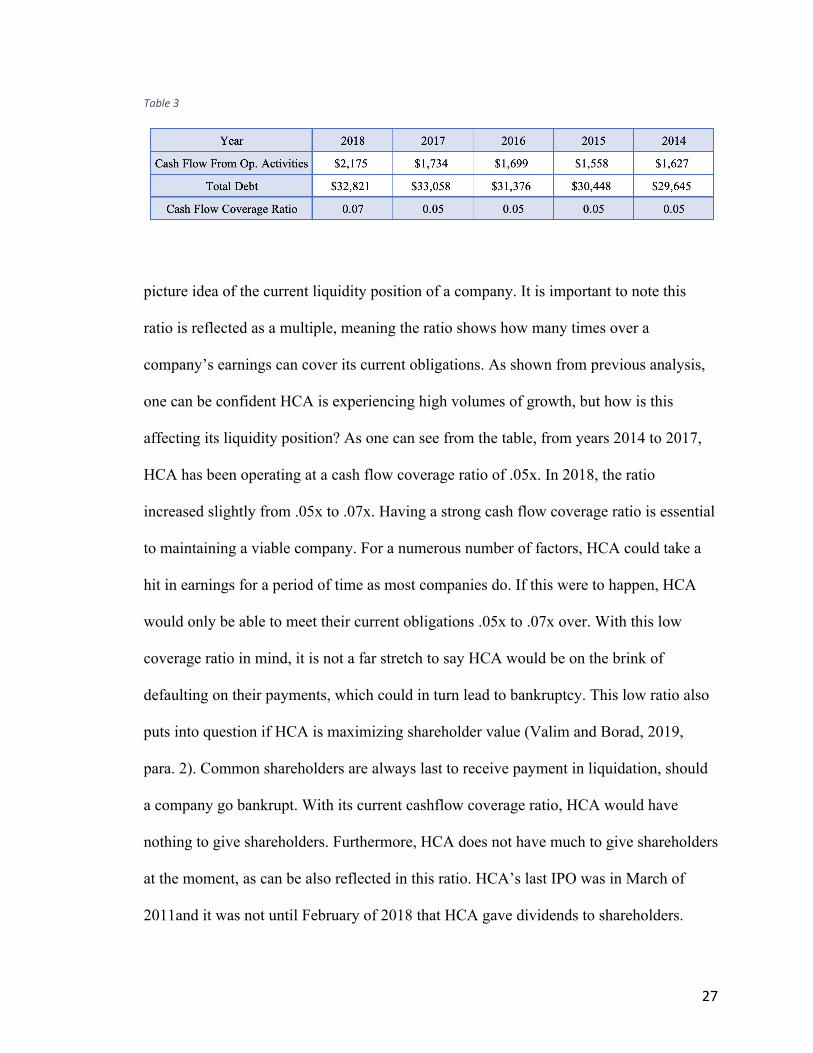
commonly used is the cash flow coverage ratio (Table 3). The formula is as follows:
Cash flow from Operating Activities / Total Debt. This ratio is used amongst investors
and stakeholders to give a big
27
Table 3
picture idea of the current liquidity position of a company. It is important to note this
ratio is reflected as a multiple, meaning the ratio shows how many times over a
company’s earnings can cover its current obligations. As shown from previous analysis,
one can be confident HCA is experiencing high volumes of growth, but how is this
affecting its liquidity position? As one can see from the table, from years 2014 to 2017,
HCA has been operating at a cash flow coverage ratio of .05x. In 2018, the ratio
increased slightly from .05x to .07x. Having a strong cash flow coverage ratio is essential
to maintaining a viable company. For a numerous number of factors, HCA could take a
hit in earnings for a period of time as most companies do. If this were to happen, HCA
would only be able to meet their current obligations .05x to .07x over. With this low
coverage ratio in mind, it is not a far stretch to say HCA would be on the brink of
defaulting on their payments, which could in turn lead to bankruptcy. This low ratio also
puts into question if HCA is maximizing shareholder value (Valim and Borad, 2019,
para. 2). Common shareholders are always last to receive payment in liquidation, should
a company go bankrupt. With its current cashflow coverage ratio, HCA would have
nothing to give shareholders. Furthermore, HCA does not have much to give shareholders
at the moment, as can be also reflected in this ratio. HCA’s last IPO was in March of
2011and it was not until February of 2018 that HCA gave dividends to shareholders.

28
Even now, the dividends are relatively low at $.40 per share quarterly (NASDAQ, n.d.).
It seems the amount of debt HCA has taken on is largely controlling their margin of
operating cash flows, and it does not seem to be for the better.
Debt to Equity Ratio:
The debt to equity (D/E) ratio is another metric used in this analysis to point to
how sustainable HCA’s growth though M&A activity is (Table 4). Despite the common
misconceptions, a balanced amount of debt is an essential part of a thriving business. As
the Harvard Business Review points out in their article titled A Refresher on Debt-To-
Equity Ratio (2017), relying heavily on equity to finance a business c
an be “costly and inefficient” (Gallo, 2015, para. 7). The debt to equity ratio shows for
each dollar of equity, how much debt has been taken on
Table 4
as well. The formula for this ratio is as follows: Total Liabilities / Shareholder’s Equity.
As one can see from the chart above, HCA has had a negative D/E ratio in which it has
increasingly gotten more negative as time goes on. The chart also supports HCA has
more liabilities than it does assets. Therefore, this ratio being negative concludes the
value of HCA is negative. This negative number should lead one to wonder just how
negative of a value HCA is. The Wall Street Journal valued HCA at a tangible book value
29
of $-37.63 per share. This calculation should be deeply concerning to shareholders and
investors for obvious reasons. HCA has been forced to take on immense amount of debt
to fund their M&A transactions. These ratios should serve as a warning sign to HCA that
further expansion through M&A activity, funded by debt, cannot be supported by their
current capital structure. If HCA was to continue taking on more debt, shareholders could
be at a major risk for loss.
Equity Multiplier:
Calculating a firm’s equity multiplier gives another picture of how leveraged a
company is, but through a different lens. The equity multiplier shows how much equity is
being used to pay for the assets of the company. More specifically, this ratio shows how
much shareholders actually own of the company. The formula for calculating a firm’s
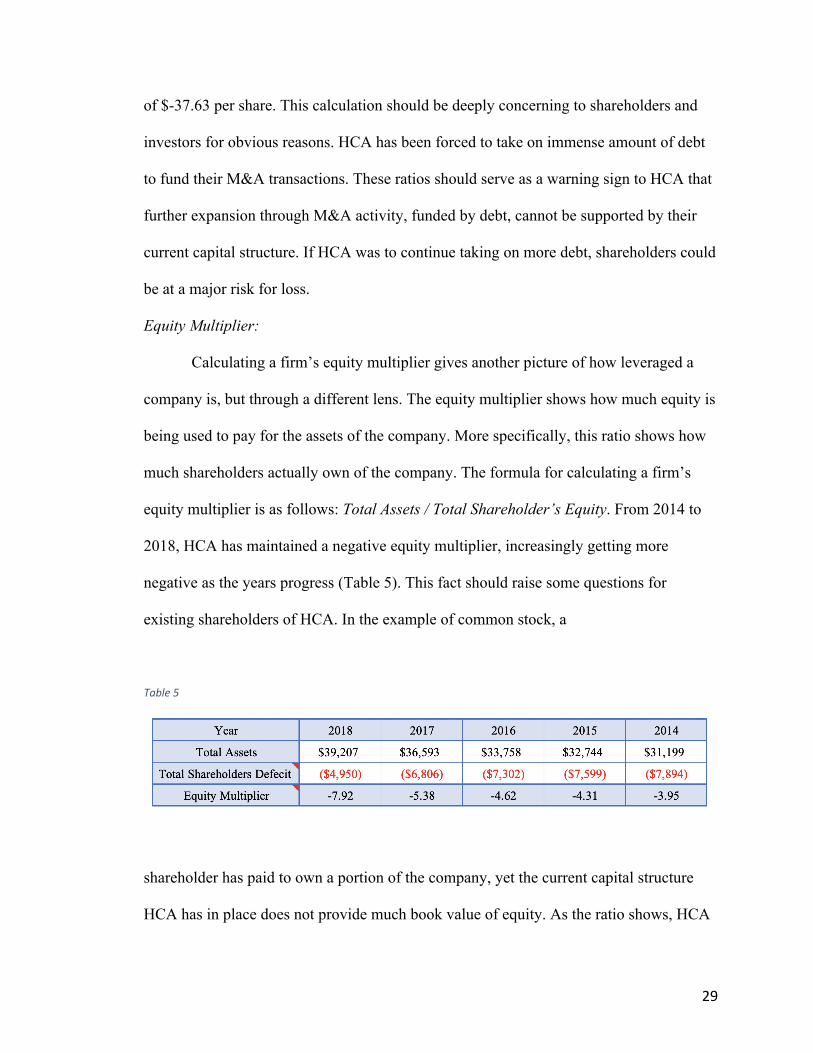
equity multiplier is as follows: Total Assets / Total Shareholder’s Equity. From 2014 to
2018, HCA has maintained a negative equity multiplier, increasingly getting more
negative as the years progress (Table 5). This fact should raise some questions for
existing shareholders of HCA. In the example of common stock, a
Table 5
shareholder has paid to own a portion of the company, yet the current capital structure
HCA has in place does not provide much book value of equity. As the ratio shows, HCA
30
does not have any book value of equity in its capital structure. Furthermore, HCA should
see this concerning fact as a potential threat as it continues to plan for future operations.
According to the Corporate Finance Institute, creditors and other investors commonly
consider the equity multiplier as a gauge for financial health. Most investors would be
reluctant to continue to lend money to HCA, and if they do, HCA should readily expect
high debt service charges and new ways to increase their operating cash flows (Equity
Multiplier, n.d., para. 2). In the worst case, HCA’s market reach expansion will have to
be put on hold until they lower their debts due to potential investors reluctance.
Capital Structure:
To further demonstrate just how leveraged HCA is, calculating the company’s
current capital structure shows how much weight both debt and equity have. The formula
used to calculate the equity weight is as follows: (Shareholder’s Equity / Shareholder’s
Equity + Total Debt. In support of previous analysis, HCA has a negative weight of
equity in its capital structure (Table 6). For the first time in this analysis, HCA started out
with negative debt in 2014, but has steadily decreased since then. In 2014, HCA had
negative equity of -36.29%. In 2018, HCA ended the year at -17.76%. Although this is
still a sign of being over-leveraged, it is a positive sign that HCA has slowly began to
take steps toward rebalancing its capital structure. To consider the amount of weight
HCA’s debt is in their capital structure, the formula as follows was used: 1- Equity
Weight. HCA’s 2018 equity weight is at 117.76%. This fact continues to be a major threat
for HCA when considering the future of its operations. As interest rates continue to rise,
HCA’s debt is going to become more and more expensive. There are actions to hedge
against this risk such
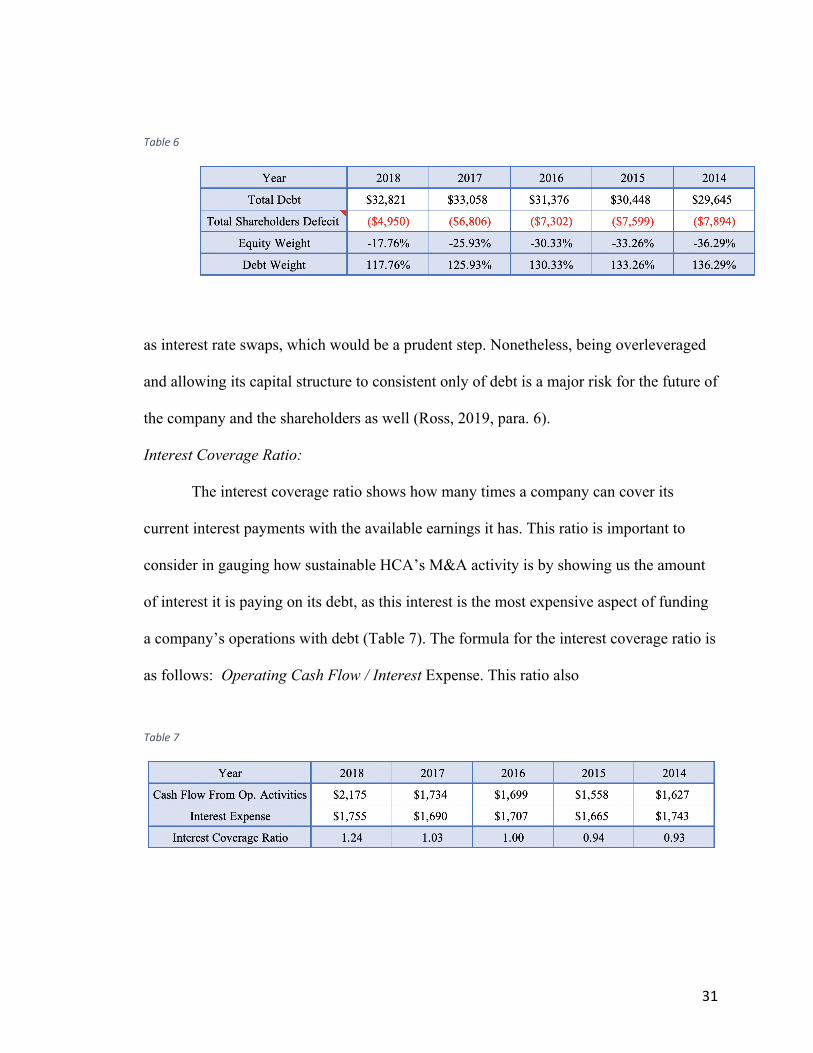
31
Table 6
as interest rate swaps, which would be a prudent step. Nonetheless, being overleveraged
and allowing its capital structure to consistent only of debt is a major risk for the future of
the company and the shareholders as well (Ross, 2019, para. 6).
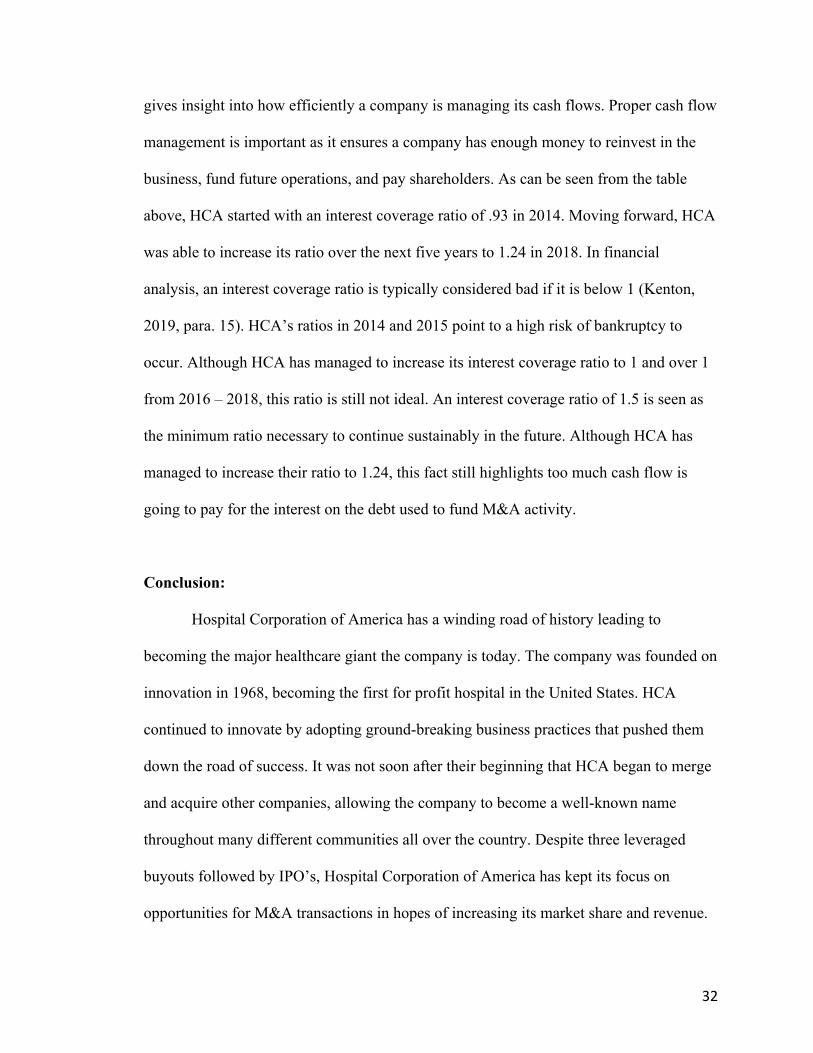
Interest Coverage Ratio:
The interest coverage ratio shows how many times a company can cover its
current interest payments with the available earnings it has. This ratio is important to
consider in gauging how sustainable HCA’s M&A activity is by showing us the amount
of interest it is paying on its debt, as this interest is the most expensive aspect of funding
a company’s operations with debt (Table 7). The formula for the interest coverage ratio is
as follows: Operating Cash Flow / Interest Expense. This ratio also
Table 7
32
gives insight into how efficiently a company is managing its cash flows. Proper cash flow
management is important as it ensures a company has enough money to reinvest in the
business, fund future operations, and pay shareholders. As can be seen from the table
above, HCA started with an interest coverage ratio of .93 in 2014. Moving forward, HCA
was able to increase its ratio over the next five years to 1.24 in 2018. In financial
analysis, an interest coverage ratio is typically considered bad if it is below 1 (Kenton,
2019, para. 15). HCA’s ratios in 2014 and 2015 point to a high risk of bankruptcy to
occur. Although HCA has managed to increase its interest coverage ratio to 1 and over 1
from 2016 – 2018, this ratio is still not ideal. An interest coverage ratio of 1.5 is seen as
the minimum ratio necessary to continue sustainably in the future. Although HCA has
managed to increase their ratio to 1.24, this fact still highlights too much cash flow is
going to pay for the interest on the debt used to fund M&A activity.
Conclusion:
Hospital Corporation of America has a winding road of history leading to
becoming the major healthcare giant the company is today. The company was founded on
innovation in 1968, becoming the first for profit hospital in the United States. HCA
continued to innovate by adopting ground-breaking business practices that pushed them
down the road of success. It was not soon after their beginning that HCA began to merge
and acquire other companies, allowing the company to become a well-known name
throughout many different communities all over the country. Despite three leveraged
buyouts followed by IPO’s, Hospital Corporation of America has kept its focus on
opportunities for M&A transactions in hopes of increasing its market share and revenue.
33
Today, HCA is seen as a leader in the healthcare industry. With revenues in the billions
and continually spending the same amount on M&A transactions a year, it is questionable
whether HCA’s growth strategy is promoting sustainable growth and maximizing
shareholder value. This thesis set out to analyze many different sides of HCA, gathering
quantitative and qualitative data to determine the sustainability over the long run for
Hospital Corporation of America.
It can be safely confirmed HCA has experienced growth over its history through a
steady pace of large acquisitions. The company also shows no sign of decreasing the
frequency or scale of its acquisitions. After analyzing data relating to the growth of HCA
and its M&A activity, a strong positive correlation was observed. Although correlation is
not synonymous with causation, observance of multiple correlations between multiple
quantitative data sets, accompanied by qualitative data gives reason to be confident in
M&A activity being the lead driver of HCA’s growth. This success has led HCA to use
acquisitions to purchase market share at a rate that was much lower than the value of
increased market share in terms of revenue. For each dollar invested in acquisitions, HCA
received three dollars in increased revenues. These decisions are also being driven by
business leaders who are experienced investors, working for and with firms that make
money by investing in, acquiring and selling companies. Although these findings support
the idea that HCA’s current growth strategy has been driven by M&A activity, the
findings have not proven that this strategy is sustainable long term. HCA has outpaced
other firms in the healthcare industry in acquisition spending, allocating close to 3% of its
revenues to purchasing new companies (and taking on more debt). This growth has
drastically increased the company’s risk despite its current strengths and expertise.

34
With the many years of experience behind Hospital Corporation of America, it is
no surprise the company has maintained a few areas of expertise. Many times, companies
that have been around as long as HCA face the challenge of being able to adapt to trends
over time, maintain their market share, and continually find new ways to advance in the
industry. HCA has done this well as the analysis of its strengths proved. Most notable of
HCA’s strengths is its financial resources that made their major M&A activity possible.
HCA over the years has used their financial resources to capitalize on opportunities that
have pushed the company to be what it is today. Despite these strengths and the
continuous opportunities HCA has taken advantage of, the company has many
weaknesses and threats that should be addressed. Its heavy reliance on concentrated
markets along with the immense cost being incurred on debt leaves HCA exposed to
threats on the horizon. As commonly noted, major upswings are followed by downturns
in our economy. Even with slight downturns, revenue and company’s loss in operations
can leave HCA susceptible to financial ruin. The most concerning factor is HCA might
not be in a position to address these opportunities and threats on the horizon, as it has
major issues to deal with now.
When noticing the immense amount of debt HCA has on the balance sheets, it is
naturally for the first question to be about the strength of their cash flows. In using the
cash flow coverage ratio, one is able to see the liquidity position HCA is maintaining and
how the company could meet their financial obligations should their earnings take a hit.
As stated in previous analysis, HCA has consistently been operating at a .05x to .07x
multiple for the last five years. This calculation shows an extremely weak position of
cash flows and suggest the company is not far from bankruptcy should an unexpected
35
downswing occur. Ultimately, continuing to take on more debt to fund M&A activity is
unsustainable with the company’s current cash flow position.
To further understand the financial health of Hospital Corporation of America,
analysis of the company’s debt to equity ratio provided insight to the current capital
structure of the company and if the company is taking on too much debt. The most
concerning aspect of this analysis is seeing the negative equity HCA currently has. The
result of this negative equity is also a negative debt to equity ratio as well. With HCA’s
debt to equity ratio being negative, it also means the total value of the company is
negative also. This fact in many ways shows the current strategy growth HCA has used
has come at a cost of shareholder value.
The interest coverage ratio in this analysis served as another disheartening
reminder that HCA is on an unsustainable track of growth in many ways. As previous
analysis demonstrates, HCA’s interest coverage ratio shows their debt is too expensive.
These ratios are largely under what is considered ideal or financially responsible. Not
only is this debt too expensive, it also makes up far too much of the company’s capital
structure, as it makes up all of the capital structure.
The purpose of this thesis was to analyze how HCA has chosen to use M&A
activity to drive their growth since the humble beginnings of the corporation. The belief
was held that HCA used these transactions in such a way that was sustainable in the long-
run allowing it to meet its financial obligations and to maximize shareholder value.
Through quantitative and qualitive analysis of the healthcare industry, the company’s
market share and revenue growth, effects on stock price, and financial analysis, my
analysis shows the data shows the contrary. HCA has proven to pursue M&A activity at
36
the cost of their financial health and shareholder value. Based on their past history and
common trends in the market today, I predict Hospital Corporation of America will go
through another leverage buyout to manage its debt, sell off many aspects of the business
to remain financially viable, or worst of all, default on their debt and enter bankruptcy.
Any of these events would affect the local Middle Tennessee area and the U.S. healthcare
industry as whole considering the enormous role Hospital Corporation of America plays.
37
Works Cited
“Affordable Care Act (ACA) - HealthCare.gov Glossary.” HealthCare.gov, U.S. Centers
for Medicare & Medicaid Services, www.healthcare.gov/glossary/affordable-care-act/.
Appleby, Julie. “HCA to Settle More Allegations for $631M.” USA Today, Gannett
Satellite Information Network, 18 Dec. 2002,
usatoday30.usatoday.com/money/industries/health/2002-12-18-hca-settlement-_x.htm.
Baldwin, Clare. “HCA Raises $3.79 Billion in Largest U.S. PE-Backed IPO.” Reuters,
Thomson Reuters, 10 Mar. 2011, www.reuters.com/article/us-hca/hca-raises-3-79-
billion-in-largest-u-s-pe-backed-ipo-idUSTRE7280NV20110310.
Baldwin, Clare. “HCA IPO Prices at $30, Sells More Shares: Sources.” Reuters,
Thomson Reuters, 9 Mar. 2011, www.reuters.com/article/us-hca/hca-ipo-prices-
at-30-sells-more-shares-sources-idUSTRE7280NV20110309.
“Dividend History.” NASDAQ.com, NASDAQ, www.nasdaq.com/symbol/hca/dividend-
history.
“Equity Multiplier - Guide, Examples, Financial Leverage Ratios.” Corporate Finance
Institute, corporatefinanceinstitute.com/resources/knowledge/finance/equity-
multiplier/.
Gallo, Amy. “A Refresher on Debt-to-Equity Ratio.” Harvard Business Review, 30 Nov.
2017, hbr.org/2015/07/a-refresher-on-debt-to-equity-ratio.
38
Gilpin, Kenneth N. “Dr. Thomas Frist Sr., HCA Founder, Dies at 87.” The New York
Times, The New York Times, 8 Jan. 1998, www.nytimes.com/1998/01/08/business/dr-
thomas-frist-sr-hca-founder-dies-at-87.html.
Haggard, Amanda. “How Nashville Changed Health Care for the Nation.” Nashville
Scene, 13 Sept. 2018, www.nashvillescene.com/news/cover-
story/article/21021762/how-nashville-changed-health-care-for-the-nation.
Kenton, Will. “Why the Interest Coverage Ratio Matters.” Investopedia, Investopedia, 12
Mar. 2019, www.investopedia.com/terms/i/interestcoverageratio.asp.
LaVito, Angelica. “CVS Creates New Health-Care Giant as $69 Billion Merger with
Aetna Officially Closes.” CNBC, CNBC, 28 Nov. 2018,
www.cnbc.com/2018/11/28/cvs-creates-new-health-care-giant-as-69-billion-
aetna-merger-closes.html.
“Nashville: The Health Care Industry Capital.” Nashville Health Care Council,
healthcarecouncil.com/nashville-health-care-industry/.
“Press Kit.” HCA Healthcare, HCA, hcahealthcare.com/about/press-kit.dot.
RevCycleIntelligence. “How Hospital Merger and Acquisition Activity Is Changing
Healthcare.” RevCycleIntelligence, RevCycleIntelligence, 17 Dec. 2018,
revcycleintelligence.com/features/how-hospital-merger-and-acquisition-activity-
is-changing-healthcare.
Ross, Sean. “How Do You Calculate Debt and Equity Ratios in the Cost of
Capital?” Investopedia, Investopedia, 12 Mar. 2019,
39
www.investopedia.com/ask/answers/021115/how-do-you-calculate-ratio-
between-debt-and-equity-cost-capital.asp.
Skokie. “Healthcare Provider M&A Hit a Record-Breaking Pace in 2017 and Signals Big
Changes Ahead, According to Kaufman Hall Report.” Budgeting Forecasting |
Healthcare Performance Management Software | Kaufman Hall, Jan. 2018,
www.kaufmanhall.com/news/healthcare-provider-ma-hit-record-breaking-pace-
2017-and-signals-big-changes-ahead-according.
“Social Security.” Social Security History, Social Security Administration,
www.ssa.gov/history/ssa/lbjmedicare1.html.
US Census Bureau. “Older People Projected to Outnumber Children.” The United States
Census Bureau, 3 Dec. 2018, www.census.gov/newsroom/press-
releases/2018/cb18-41-population-projections.html.
Valim, Jose Luiz, and Sanjay Bulaki Borad. “Cash Flow Coverage Ratio | Calculation of
Cash Flow Coverage Ratio.” EFinanceManagement.com, 1 Jan. 2019,
efinancemanagement.com/investment-decisions/cash-flow-coverage-ratio.
“Who We Are.” HCA Healthcare, hcahealthcare.com/about/.