Embed Size (px)
Citation preview

Materials Today: Proceedings 2S ( 2015 ) S26 – S31
Available online at www.sciencedirect.com
ScienceDirect
2214-7853 © 2015 Published by Elsevier Ltd. This is an open access article under the CC BY-NC-ND license (http://creativecommons.org/licenses/by-nc-nd/3.0/).Selection and peer-review under responsibility of the Conference Committee of Conference MEFORM 2015, Light Metals – Forming Technologies and Furtherdoi: 10.1016/j.matpr.2015.05.005
Conference MEFORM 2015, Light Metals – Forming Technologies and Further Processing
Long-term stability of superelastic behavior of nanosubgrained Ti-Nb-Zr and Ti-Nb-Ta shape memory alloys
V. Sheremetyeva,*, S. Prokoshkina, V. Brailovskib, S. Dubinskiya, M. Filonova, M. Petrzhika
aNational University of Science and Technology “MISIS”, 4, Leninskiy prosp., Moscow 119049, Russian Federation bÉcole de technologie supérieure, 1100, Notre-Dame Street West, Montreal (Quebec), H3C 1K3, Canada
Abstract
Ti-21.8Nb-6Zr and Ti-19.7Nb-5.8Ta (at.%) shape memory alloys for medical implants were subjected to a thermomechanical treatment comprising cold rolling and post-deformation annealing. The evolutions of their structure and their superelastic behavior were monitored during mechanical “loading-unloading” 10-cycle testing (3 times) and during long-term pauses between testing (40 and 365 days). During the first multicycle testing of the Ti-Nb-Ta alloy, its Young's modulus showed a significant decrease (from 30 GPa - 40 GPa to 20 GPa - 25 GPa). It regained its initial value after a first pause, and then decreased again during re-testing, but to a smaller extent, regaining its initial value after the second pause and finally stabilizing. The Ti-Nb-Zr alloy demonstrated more stable SE behavior than the Ti-Nb-Ta alloy: its Young's modulus showed only a 10 % decrease during the first mechanical cycling (from 31 GPa - 40 GPa to 27 GPa - 37 GPa), restored its initial value after a first pause and then remained stable. © 2014 The Authors. Published by Elsevier Ltd. Selection and peer-review under responsibility of the Conference Committee of Conference MEFORM 2015, Light Metals – Forming Technologies and Further. This is an open access article under the CC BY-NC-ND license (http://creativecommons.org/licenses/by-nc-nd/3.0/).
Keywords: titanium alloys; shape memory alloys; thermomechanical treatment; martensitic transformations; structure; superelasticity; stability
* Corresponding author. Tel.: +7-495-638-4405; fax: +7-499-236-2105. E-mail address: [email protected]
© 2015 Published by Elsevier Ltd. This is an open access article under the CC BY-NC-ND license (http://creativecommons.org/licenses/by-nc-nd/3.0/).Selection and peer-review under responsibility of the Conference Committee of Conference MEFORM 2015, Light Metals – Forming Technologies and Further

V. Sheremetyev et al. / Materials Today: Proceedings 2S ( 2015 ) S26 – S31 S27
1. Introduction
Titanium-nickel shape memory alloys (SMA) demonstrate superelastic (pseudoelastic) behavior close to that of human hard tissue [1-6]. However, they contain toxic nickel which hinders expansion of their medical use [6, 7]. Metastable Ti-Nb-based SMA are regarded as promising replacements for the traditional titanium alloys and Ti-Ni SMA in biomedical application [3-6]. The main advantages of these Ni-free superelastic alloys are high biological compatibility combined with improved biomechanical compatibility [4-6]. The shape recovery in Ni-free SMA occurs as a consequence of a reversible martensitic transformation of BCC β-phase into orthorhombic α”-phase [8, 9]. It is well established that the functional properties of Ti-Ni and Ti-Nb based SMA can be effectively improved by thermomechanical treatment (TMT) generally comprising cold-work and annealing [10-15].
It has been observed [16] that superelastic (SE) cycling of Ti-24Nb-4Zr-7.95Sn (at.%) alloy leads to a gradual decrease of the Young’s modulus, but a six-day room-temperature (RT) pause was enough for a partial restoration of its initial value. On the other hand, it was shown [17] that the Young's modulus of Ti-Nb-Zr and Ti-Nb-Ta alloys decreased drastically during initial SE cycling, but remained unchanged after a 40-day RT pause and a subsequent SE cycling run. On the contrary, transformation yield stress and residual strain values did not exhibit stable behavior after a 40-day pause and a subsequent SE-cycling run. The aim of the present work was to study the structural and functional stability of the Ti-Nb-Zr and Ti-Nb-Ta alloys for a longer than 40 days period of time.
2. Experimental methodology
A 50 mm-diameter, 660 mm-long Ti-21.8Nb-6Zr (TNZ) (at.%) ingot was produced by Induction Skull Melting and isostatically-pressed (900 °C, 100 MPa, 2h). An 80 mm-diameter, 350 mm-long Ti-19.7Nb-5.8Ta (TNT) (at.%) ingot was produced by vacuum arc melting, hot-forged at 900 °C and then machined to a 50 mm diameter. The ingots were then cut into 2×8×50-mm plates and subjected to cold rolling with a true strain of e=0.3. The plates were finally cut into 1.5×1.5×50-mm specimens and annealed. Post-deformation annealing (PDA) at 500 °C, 600 °C (1 h) and 600 °C (0.5 h) was intended to form nanosubgrained (NS) β-phase structure in both alloys and create conditions for room-temperature superelasticity [13, 18]. PDA at 750 °C (0.5 h) served as a reference recrystallization treatment [18]. For TNT alloy, an additional aging at 300 °C (1 h) was performed after PDA at 500 °C (1 h) to benefit from the potentially positive influence on the alloy’s fatigue life of the -phase age-hardening [13].
The 10-cycle loading-unloading tensile testing was performed on 30 mm gauge length specimens, up to a strain of ε=2% in each cycle. After a 40-day RT pause, the second series of 10-cycle tests was conducted followed by a 365-day RT pause and the third series of a 10-cycle testing (Figure 1). The microstructure evolution was monitored using X-ray diffraction (XRD) before testing (point 1), after the 1st mechanical test (point 2), after a 40-day RT pause (point 3), after the 2nd mechanical test (point 4), after a 365-day RT pause (point 5), and finally, after the 3rd mechanical test (point 6) (Figs. 1-3). The evolution of the loading-unloading stress-strain diagrams throughout the experiment was also analyzed (Fig. 4).
3. Results and discussion
3.1 Structure evolution
The main phase constituent in both alloys, irrespective of the testing stage, is β-phase (Fig. 1). In TNT alloy, after PDA at 500 and 600 °C, a significant quantity of cooling-induced α''-martensite is also observed (Fig. 1a). In the last case, during the 1st series of mechanical testing, a reorientation of α''-phase crystals under tensile stresses leads to anisotropic changes in their α''-phase lines intensities. A subsequent 40-day pause, second SE-cycling, a 365-day pause and the third SE-cycling are not accompanied by changes in the β- and α''-phase lines intensities, which indicates their orientation stability. In the same alloy, but after a two-step heat treatment, 500 °C (1 h) + 300 °C (1 h), neither the cooling-induced, or the stress-induced α''-martensite are perceptible (Fig. 1b). In this test, the Ms temperature shifts below RT as a result of ω-phase age-hardening [13]. For TNZ alloy, α''-martensite is not detectable (Fig. 1c).

S28 V. Sheremetyev et al. / Materials Today: Proceedings 2S ( 2015 ) S26 – S31
Thus, the structural mechanism underlying strain reversibility in the course of SE-cycling of the annealed TNZ alloy and of the annealed+aged TNT alloy is quite clear: it is a reversible β↔α" martensitic transformation. For the case of the annealed-only TNT alloy, the contributions of martensitic transformation and martensite reorientation mechanisms to strain reversibility cannot be separated; it can be done in the course of an in-situ X-ray experiment only.
Fig. 1. X-ray diffractograms (points 1-6). TNT: (a) after PDA 600°C (1h) and (b) 500°C (1h)+300°C (1h);TNZ: (c) after PDA 600°C (0.5h).
After the 1st series of multi-cycle testing, the β-phase X-ray lines significantly broaden for the recrystallized TNZ alloy (Fig. 2a), which reflects the accumulation of microstresses during transformation- and reorientation-induced hardening. The β-phase line broadening is much less pronounced in nanostructured and dispersion-hardened conditions, when the initial hardening is quite higher (Fig. 2b, c). The corresponding increase in the dislocation density of the recrystallized TNZ alloy after the 1st series of multi-cycle testing was shown in [19] using TEM. Subsequent pauses and SE-cycling do not lead to any significant changes in the X-ray lines’ width (Fig. 2).
Fig. 2. β-phase X-ray lines’ width (points 1-6). TNZ: (a) PDA 750°C (0.5h); (b) PDA 600°C (0.5h); TNT: (c) PDA 500°C (1h)+300°C(1h).
The accumulation of the longitudinally-oriented microstresses near the specimen surface is confirmed by a decrease in the β-phase interplanar distances, as follows from the changes in the β-phase lattice parameter a. Fig. 3a,b shows that after the 1st series of cycling of the initially less-hardened TNZ (600 °C and 750 °C, 0.5 h) and TNT (600 °C, 1 h) alloys, the value of a decreases. This means that tensile stresses generated during SE testing contribute to the reduction of the transformation yield stresses and to the formation of oriented martensite. In the case of NS (500 oC) and aged NS (500 oC + 300 oC) β-phase structures, this effect is manifested to a lesser degree. The β-phase lattice parameter a remains unchanged during the subsequent stages of the experiment in all of the cases (Fig. 3).
Fig. 3. Beta-phase lattice parameter vs experimental points 1-6 of the (a) TNZ and (b) TNT alloys.
Inte
nsity
(a.u
.)
30 40 50 60 70 30 40 50 60 70 30 40 50 60 702Θ, deg1
2
3
4
5
6
123456
123456
(c)(b)(a)110β
200β 211β020α” 021α” 022α”200α” 131α”220α”
130α”
110β
200β211β
110β
200β211β
Inte
nsity
(a.u
.)
Inte
nsity
(a.u
.)
2Θ, deg 2Θ, deg
Ti-Nb-Ta Ti-Nb-Ta Ti-Nb-Zr
00.10.20.30.40.50.60.7
0 1 2 3 4 5 61 2 3 4 5 6
(b)(a) Bhkl, 2θ deg
00.10.20.30.40.50.60.7
0
Bhkl, 2θ deg
Experimental points Experimental points1 2 3 4 5 6
200
220211
(c)
Experimental points0
0.10.20.30.40.50.60.7
0
Bhkl, 2θ deg Ti-Nb-Zr Ti-Nb-Zr Ti-Nb-Ta
0 1 2 3 4 5 6
500°С, 1h
600°С, 1h
500°С, 1h +300°С, 1h
600°С, 0,5h
750°С, 0,5h
0.3301
0.3302
0.3303
0.3304
0.3305
0.3306
0.3307
0.32770.32780.32790.32800.32810.32820.32830.3284
а, nm
Experimental points0 1 2 3 4 5 6
Experimental points
а, nm(a) (b)Ti-Nb-Zr Ti-Nb-Ta
V. Sheremetyev et al. / Materials Today: Proceedings 2S ( 2015 ) S26 – S31 S29
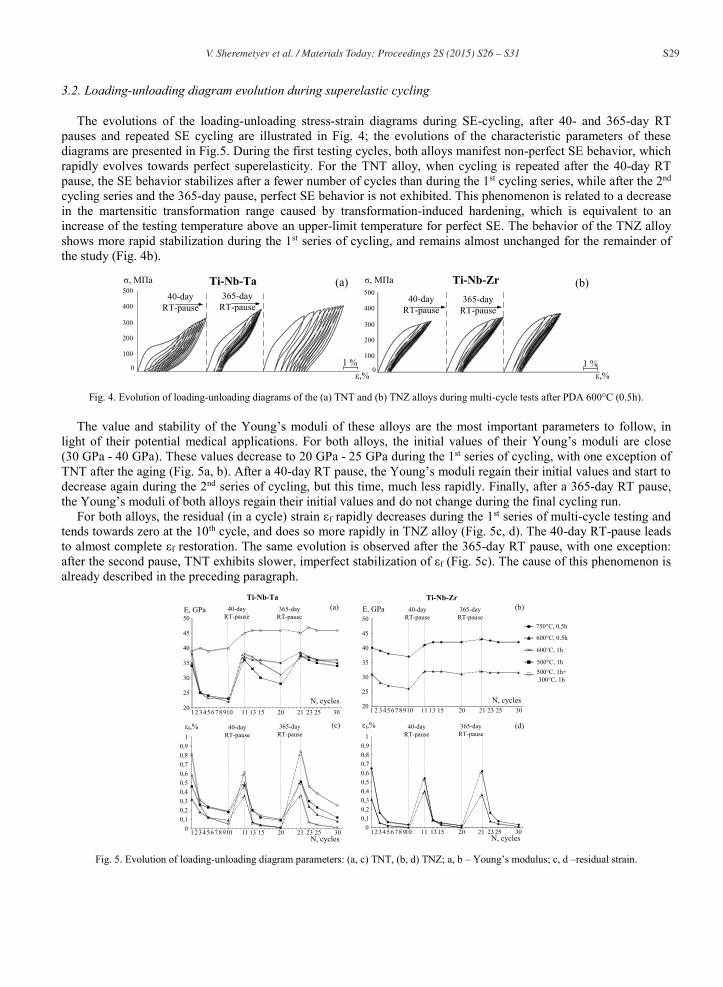
3.2. Loading-unloading diagram evolution during superelastic cycling
The evolutions of the loading-unloading stress-strain diagrams during SE-cycling, after 40- and 365-day RT pauses and repeated SE cycling are illustrated in Fig. 4; the evolutions of the characteristic parameters of these diagrams are presented in Fig.5. During the first testing cycles, both alloys manifest non-perfect SE behavior, which rapidly evolves towards perfect superelasticity. For the TNT alloy, when cycling is repeated after the 40-day RT pause, the SE behavior stabilizes after a fewer number of cycles than during the 1st cycling series, while after the 2nd cycling series and the 365-day pause, perfect SE behavior is not exhibited. This phenomenon is related to a decrease in the martensitic transformation range caused by transformation-induced hardening, which is equivalent to an increase of the testing temperature above an upper-limit temperature for perfect SE. The behavior of the TNZ alloy shows more rapid stabilization during the 1st series of cycling, and remains almost unchanged for the remainder of the study (Fig. 4b).
Fig. 4. Evolution of loading-unloading diagrams of the (a) TNT and (b) TNZ alloys during multi-cycle tests after PDA 600°C (0.5h).
The value and stability of the Young’s moduli of these alloys are the most important parameters to follow, in light of their potential medical applications. For both alloys, the initial values of their Young’s moduli are close (30 GPa - 40 GPa). These values decrease to 20 GPa - 25 GPa during the 1st series of cycling, with one exception of TNT after the aging (Fig. 5a, b). After a 40-day RT pause, the Young’s moduli regain their initial values and start to decrease again during the 2nd series of cycling, but this time, much less rapidly. Finally, after a 365-day RT pause, the Young’s moduli of both alloys regain their initial values and do not change during the final cycling run.
For both alloys, the residual (in a cycle) strain εf rapidly decreases during the 1st series of multi-cycle testing and tends towards zero at the 10th cycle, and does so more rapidly in TNZ alloy (Fig. 5c, d). The 40-day RT-pause leads to almost complete εf restoration. The same evolution is observed after the 365-day RT pause, with one exception: after the second pause, TNT exhibits slower, imperfect stabilization of εf (Fig. 5c). The cause of this phenomenon is already described in the preceding paragraph.
Fig. 5. Evolution of loading-unloading diagram parameters: (a, c) TNT, (b, d) TNZ; a, b – Young’s modulus; c, d –residual strain.
0
100
200
300
400
500
σ, МПа
0
100
200
300
400
500σ, МПа
1 %ε,%
1 %ε,%
40-dayRT-pause
365-dayRT-pause
40-dayRT-pause
365-dayRT-pause
(a) (b)Ti-Nb-Ta Ti-Nb-Zr
20
25
30
35
40
45
50
20
25
30
35
40
45
50
12345678910 11 13 15 20 21 23 25 30
N, cycles1 2 3 456 78910 11 13 15 20 21 23 25 30
N, cycles
Е, GPa Е, GPa40-dayRT-pause
365-dayRT-pause
40-dayRT-pause
365-dayRT-pause
500°C, 1h
600°C, 0.5h
500°C, 1h+300°C, 1h
600°C, 1h
750°C, 0,5h
Ti-Nb-Ta Ti-Nb-Zr(a) (b)
00,10,20,30,40,50,60,70,80,9
1
00,10,20,30,40,50,60,70,80,9
1
12345678910 11 13 15 20 21 23 25 30N, cycles
12345678910 11 13 15 20 21 23 25 30N, cycles
εf,% εf,%(c) (d)40-dayRT-pause
365-dayRT-pause
40-dayRT-pause
365-dayRT-pause

S30 V. Sheremetyev et al. / Materials Today: Proceedings 2S ( 2015 ) S26 – S31
The transformation yield stress σtr of both alloys decreases during cycling and then regain their initial values after the pauses (Fig. 6a, b). The TNT alloy specimens represent a specific feature: the 365-day RT pause leads to a significant increase in their transformation yield stresses compared to their pre-testing values (Fig. 6a).The maximum stresses reached in every loading-unloading cycle, σmax, increase during each multi-cycle testing sequence and decrease to their almost initial values after RT pauses (Figure 6c, d). An increasing difference between the transformation maximum stress and the yield stress values results in an improvement of the SE behavior, preventing earlier involvement of the unrecoverable plastic deformation in the deformation process [20].
Fig. 6. Evolution of loading-unloading diagram parameters: (a, c) TNT, (b, d) TNZ; a, b – transformation yield stress; c, d – maximum stress.
Comparing the evolution of the structure with that of the stress-strain behavior indicates their incomplete correlation. Indeed, the 1st SE cycling is logically accompanied by transformation-induced hardening, the development of dislocation substructure and oriented residual stress fields, which should result in the normally-predicable changes in their loading-unloading behavior: a decrease in the onset stress of the martensitic transformation and an increase in the maximum stress reached in a loading-unloading cycle. However, these anticipated effects are clearly observable only in the case of the initially non-hardened, i.e. recrystallized, β-phase (Fig. 2a, 3); while there are blurred for the low-temperature annealed and aged alloys (Figs. 2 b, 2 c, 3). This discrepancy can be explained by a much higher pre-testing level of substructural and precipitation hardening in the last cases, which makes them less sensible to additional transformation-induced hardening during repeated SE-testing [20]. Another discrepancy cannot be so easily explained: the complete (or almost complete) restoration of the SE diagram parameters during long-term pauses is not accompanied by clearly observable variations in the β-phase lattice and X-ray lines’ width values. In other words, the alternating processes of stress and structure relaxation (long-term pauses) and substructural hardening with oriented stress generation (SE cycling), which obviously occur during the experiment, are not observable during our study.
This situation requires special, more thorough, investigations. However, the following hypotheses can already be advanced here. One of the causes for such a discrepancy may be a high localization of the relaxation and generation processes, which simply cannot be detected by the conventional XRD technique used in this study. Furthermore, X-ray diffraction is limited to the near-surface regions of the specimen, and therefore, cannot describe the processes occurring in the specimen body. Finally, long-term impurity segregation phenomenon cannot be completely dismissed, and needs to be specifically addressed.
4. Conclusions
1. For both Ti-Nb-Zr and Ti-Nb-Ta shape memory alloys, the 1st series of 10-cycle SE testing leads to an increase in dislocation density, reorientation of retained (stabilized) ”-martensite and accumulation of the oriented
0
50
100
150
200
250
300
0
50
100
150
200
250
300
050
100150200250300350400450500
1 2345678910 111315 20 21 23 25 30N, cycles
123456 78910 11 1315 20 21 23 25 30N, cycles
1234567 8910 1113 15 20 21 23 25 30N, cycles
12345678910 11 13 15 20 2123 25 30N, cycles
σtr, MPa σtr, MPa
σmax, MPa σmax, MPa
40-dayRT-pause
365-dayRT-pause
40-dayRT-pause
365-dayRT-pause
40-dayRT-pause
365-dayRT-pause
40-dayRT-pause
365-dayRT-pause
(a)
(c)
(b)
(d)
050
100150200250300350400450500
500°C, 1h
600°C, 0.5h
500°C, 1h+300°C, 1h
600°C, 1h
750°C, 0,5h
Ti-Nb-Ta Ti-Nb-Zr

V. Sheremetyev et al. / Materials Today: Proceedings 2S ( 2015 ) S26 – S31 S31
residual microstresses. These processes are pronounced in the case of the initially non-hardened recrystallized structure of β-phase after PDA at 750 °C. In other cases, when the initial structure is nanosubgrained, and even more so, when it is dispersion-hardened by aging, the initial hardening of β-phase is so pronounced that it prevents further structure changes. In all of these cases, the attained structure and stress state are rather stable during subsequent pauses and cycling runs.
2. All of the SE functional parameters change extensively as a result of the 1st mechanical cycling. The Young’s modulus, residual strain in a cycle and transformation yield stress rapidly decrease, while the maximum stress in the cycle and accumulated strain increase at different rates. The Ti-Nb-Ta alloy in the most hardened state (PDA at 500 °C + aging at 300 oC) is an exception; in this case, the Young’s modulus does not change during the experiment.
3. For both alloys, the 40-day RT pause leads to an almost complete restoration of the initial SE loading-unloading behavior, and then, during the 2nd series of multi-cycle testing, this behavior evolves again, but to a smaller extent. The subsequent 365-day RT pause and the 3rd series of testing do not affect the SE behavior.
4. The significant SE characteristics variations during the 1st, 2nd and 3rd series of SE cycling are caused by intense accumulation of the oriented residual stresses and substructural hardening. The 40-day as well as the 365-day RT pauses lead to an almost complete restoration of the SE behavior, with no detectable changes in the X-ray line width and interplanar distances. The cause of this discrepancy should be specially examined, taking into consideration a possible localization of the repeated substructural and microstress generation-relaxation processes.
5. Over the entire long-term experiment, Ti-Nb-Zr alloy demonstrates more stable and clearly-identified superelastic behavior than Ti-Nb-Ta alloy; this is especially true for the nanostructured material (PDA at 600 °C for 0.5 h), where the alloy’s Young’s modulus reaches an ultra-low value of 30 GPa. These features make Ti-Nb-Zr alloy very suitable for biomedical application.
Acknowledgements
The authors are grateful to the Natural Sciences and Engineering Research Council of Canada, and the Ministry of Education and Science of the Russian Federation, in the framework of the Increase Competitiveness Program of NUST«MISIS» (Grant No. К4-2014-018) and the 14-08-31702 project of the Russian Foundation for Basic Research for their financial support.
References
[1] K. Otsuka and C. Wayman. Shape Memory Materials, Cambridge University Press, 1996. [2] L. Yahia. Shape memory implants, Springer–Verlag, 2000. [3] D.H. Ping, C.Y. Ciu, F.X. Yin et al., Scripta Mater. 54 (2006) 1305-1310. [4] H.Y. Kim, Y. Ikehara, J.I. Kim et al., Acta Mater. 54 (2006) 2419-2429. [5] J. Kim, H. Kim, T. Inamura et al., Mater. Sci. Eng. A 403 (2005) 334-339. [6] S. Miyazaki, H. Kim and H. Hosoda., Mater. Sci. Eng. A 438-440 (2006) 18-24. [7] K. Takamura, K. Hayashi, N. Ishinishi et al., Biomed. Mater. 28 (1980) 583-589. [8] Yu.A. Bagariatskii, G.I. Nosova, T.V. Tagunova. Sov. Phys. Dok. 3 (1959) 1014-1018. [9] E.W. Collings. The Physical Metallurgy of Titanium Alloys. ASM: Metals Park, Ohio, 1984. [10] S. Miyazaki, K. Otsuka, Y. Suzuki, Scripta Metallogr. 15 (1981) 287-292. [11] V. Brailovski, S. Prokoshkin, I. Khmelevskayaet al., Mater. Trans. 47 (2006) 795-904. [12] V. Brailovski, S. Prokoshkin, K. Inaekyan et al., J. Alloy Compd. 509 (2011) 2066-2075. [13] S. Dubinskiy, V. Brailovski, S. Prokoshkin et al., J. Mater. Eng. Perform. 22 (2013) 2656-2664. [14] V. Brailovski, S. Prokoshkin, M. Gauthier et al., Mater. Sci. Eng. C 31 (2011) 643-657. [15] S. Prokoshkin, V. Brailovski, A. Korotitskiy et al., J. Alloy. Compd. 577 (2013) 418-422. [16] Y. Hao, S. Li, S. Sun et al., Acta Biomater. 3 (2007) 277-286. [17] S. Prokoshkin, V. Brailovski, M. Petrzhik et al., Mater. Sci. Forum 738-739 (2013) 481-485. [18] S. Dubinskiy, S. Prokoshkin, V. Brailovski et al., Phys. Met. Metallogr. 112 (2011) 529-542. [19] V. Sheremetyev, S. Prokoshkin, V. Brailovski. et al., Phys. Met. Metallogr. 116 (2015) in press. [20] S. Prokoshkin, I. Khmelevskaya, E. Ryklina. In Shape Memory Alloys: fundamentals, modeling and applications. V. Brailovski, S.
Prokoshkin, P. Terriault and F. Trochu, Editors; Montreal: ETS Publ., (2003) 427-434.