Embed Size (px)
Citation preview
OCEANOLOGICA ACTA - VOL. 20 - No 1 ~ ----~
Long-term fluctuations of Jellyfish Liriope tetraphylla
Pelagia noctiluca Long-tenn fluctuations
Mediterranean Sea Liriope tetraphylla in Villefranche Bay between 1966 and 1993 compared to Pelagia noctiluca pullulations
Méduse Liriope tetraphylla
Pelagia noctiluca Fluctuations à long terme
Mer Méditerranée
ABSTRACT
RÉSUMÉ
Emmanuelle BUECHER a, Jacqueline GOY b, Benjamin PLANQUE Michèle ETIENNE a and Serge DALLOT a
a, c '
a Observatoire des Sciences de l'Univers, Station Zoologique, BP 28, 06234 Villefranche-sur-Mer Cedex, France.
b Laboratoire d'Ichtyologie Générale et Appliquée, Muséum National d'Histoire Naturelle, 43, rue Cuvier, 75231 Paris Cedex 05, France.
c Sir Alister Foundation for Ocean Science, The laboratory, Citadel Hill, Plymouth PLI 2PB, United Kingdom.
Received in revised form 29/02/96, accepted 05/03/96.
Fluctuations in the abundance of developmental stages and adults of the medusa Liriope tetraphylla were monitored from 1966 to 1993 in the bay of Villefranche-sur-Mer, Northwestem Mediterranean Sea. L. tetraphy/la exhibited large interannual variations in both mean abundance levet and seasonality. Cluster analysis was applied to classify as "poor", years with medium to scarce populations evenly distributed the year; as "normal", years with a population maximum during autumn as frequently observed in the Mediterranean; and as "special", years with strong population maxima localized in spring or summer. The changing jellyfish abundance levels appeared not to be reliably linked to long-term changes in sea water temperature and salinity, even if temperature strongly affects their seasonality and generation time, which was estimated here at four to seven weeks, respectively, during warm or cold months of the year. L. tetraphylla interannual trends were compared to those of the large scyphozoan medusa Pelagia noctiluca with undecennal blooming periods (data from literature and pers. obs.). Possible links with specifie composition changes in the pelagie ecosystem are discussed.
Fluctuations à long terme de Liriope tetraphylla dans la Baie de Villefranche de 1966 à 1993. Comparaison avec Pelagia noctiluca.
Les fluctuations d'abondance de Liriope tetraphylla (Cnidaria, Hydrozoa) ont été observées de 1966 à 1993, en baie de Villefranche-sur-Mer, au nord-ouest de la Méditerranée. L. tetraphylla montre de grandes variations interannuelles de son abondance moyenne et de ses variations saisonnières. On a utilisé une méthode de classification automatique pour grouper les années en « années pauvres » avec des populations clairsemées ou moyennes, distribuées régulièrement durant toute l'année, des « années normales » qui se caractérisent par des maxima automnaux et hivernaux, et des « années particulières » avec de forts maxima d'abondance durant le printemps et l'été. Les changements à long terme de la température et de la salinité de l'eau de mer ne correspondent pas clairement aux changements d'abondance de la méduse, même si la température affecte
145

E. BUECHER et al.
fortement ses variations saisonnières et la durée du développement, qui a été estimée ici entre quatre à sept semaines respectivement durant les mois chauds et froids de l'année. La tendance interannuelle de Liriope tetraphylla a été comparée à celle de la grande scyphoméduse Pelagia noctiluca (Cnidaria, Scyphozoa) qui a des périodes de pullulations undécennales (données de la littérature et observations personnelles). Les relations possibles avec des changements du peuplement de l'écosystème pélagique sont discutées.
Oceanologica Acta, 1997, 20, 1, 145-157.
INTRODUCTION
Liriope tetraphylla (Chamisso and Eysenhardt, 1821) is among the best known medusae in the Mediterranean Sea. A very common epiplanktonic species found in the western and eastern Mediterranean basins (Kramp, 1924; Goy, 1968), L. tetraphylla is of interest because it shows direct development, without a fixed hydroid stage. Despite Metschnikoff s observations (1886) on the earliest stages of development, the total ti me required to reach the adult stage is unknown. In this study, we analysed the generation time during two seasons in the bay of Villefranche. Elsewhere in the Mediterranean Sea, analysis of the local population was performed over one - or two-ycar periods, but the abundance of different stages of development was rarely taken into account (Berhaut, 1968). Wc have monitored Liriope adult and developmental stages in Villefranche Bay during a 27-year period in ordcr to describe the seasonal and interannual variability of abundance in relation to hydroclimatic conditions. Observations of the abundance of Pelagia noctiluca (Forsskal, 1775), another well-monitored Mediterranean medusa, show sorne blooming periods (e.g. UNEP, 1984; Goy et al., 1989a; Morand et al., 1992). Our study compared the attendance periods of these two holoplanktonic medusae.
MATERIAL AND METHODS
Area of study
ln the Ligurian Sea (Northwestern Mediterranean), the bay of Villefranche-sur-Mer is a well-sheltered bay situated near Nice (Fig. 1). Hydrodynamic conditions in the bay are controlled by the Ligurian current and local winds (Gostan, 1968; Béthoux et al., 1988). The current hugs the coast, enters at the surface at Cap Ferrat (in a northeasterly direction) and leaves at depth at the Cape of Nice, on the western side to the bay. At the entrance to the bay, two stations have been sampled over the 1ast 30 years:
- Sampling station B (43 41' 10" N; 7 19' 00" E) is axially located at the entrance to the bay and has a maximum depth of 87 m. This site is not directly influenced by the incoming Ligurian current. Weekly hydrological measurements have been taken at this permanent monitoring station from 1957 up to the present time (Etienne et al., 1991; pers. comm. for years 1992 and 1993).
- Sampling stationS (43 40' 95" N; 7 19' 47" E) is located in the southeastern part of the bay and has a maximum
146
depth of 40 m. The current here is usually strong, with a frequent inflow of macroplanktonic species observed in surface waters. This site is sheltered from the prevailing easterlies and has been selected for horizontal plankton tows.
Sampling
Zooplankton sampling and hydrological data measurements were performed from 1966 to 1993 at station B. Another zooplankton sample series was collected during 1963 and 1964 at both stations B and S.
The 27-year plankton series (weekly values)
Vertical plankton tows were collected from a depth of 75 rn to the surface, from November 1966 to December 1993, at station B. Hauls were performed during daylight by towing a Juday-Bogorov net (mouth aperture 0.50 rn, filtering length of 1.80 rn and mesh of 330 rn). The average volume of water filtered by the net was estimated to be 10 m3 per haul. Organisms were preserved with 3% formalin. Samples were taken at a maximum frequency of twice daily, except during weekends. Hauls (up to 11) from the same week were pooled, yielding a series of weekly samples. A total set of 1 ,244 pool cd samples was examined. The four developmental stages of Liriope tetraphylla were counted in subsamples ( 117 of each weekly sample volume). Juvenile stages were classed by changes of size, manubrium development and number and position of tentacles: stage 1 has 8 tentacles, a diameter <0.5 mm and no developed manubrium; stage 2 has 12 tentacles and a diameter < 1.5mm; stage 3 has 8 tentacles and a long functional manubrium, and a diameter <5.0 mm. Adults have 8 tentacles, 4 developing gonads, and a maximum diameter of 15 mm. Figure 2 shows interannual abundance values for the totality of the four stages.
One-year plankton series (daily data)
Horizontal plankton tows at the entrance to the bay (at both stations B and S), were performed from May 1963 to May 1964. Plankton samples were collected each working day at three depths (3 rn, 20 rn and 50 rn) using a Regent net (mouth aperture 1.0 rn, length of 4.0 rn, mesh size 680 rn, silk fabric). The mean volume of sea water filtered during a standard haul was estimated to be 400 m3, using flowmeter measurements. Organisms were preserved in sea water with 4% formai in. The four developmental stages

FLUCTUATIONS OF L. TETRAPHYLLA IN VILLEFRANCHE BAY
··~
-San Remo ~ r • :' .. .. _ -- ..... "
sur-Mer
43"42' N
N
·•· s 1000m
North-western Ligurian Sea and Bay of Villefranche-sur-Mer
Figure 1
Northwestem Ligurian Sea and the bay of Villefranche-sur-Mer, with stations B and S. 1: Ligurian current's entrance in the bay; 2: Outflow of the current.
of Liriope were counted without subsampling in each of the 276 samples taken; values obtained at different depths were added together (Fig. 3).
Hydrological data
Only temperature and salinity measured at 10 and 75 rn were considered here for the period of interest. Etienne et al. ( 1991) gave detailed information on hydrological methods and calculations. From 1988 to 1993, measurements were obtained by using a CTD Sea Cat profiler®.
147
Data analysis
Cluster analysis
We used the long time series to characterize variability in the annual abundance pattern. For each developmental stage, we logged data in abundance tables, years in rows and weeks in columns. These Buys-Ballot tables contained missing data (there was no sampling during sorne weeks). Missing data were interpolated by linear estimation using PCAM (principal components analysis for missing values, Bouvier, 1977). From the resulting tables, using weeks as

E. BUECHER et at.
Figure 2
log (abund + l) 3
2,5
2
1,5
--P.n.
75 80 85
P.n.
90 Years
"i>:;;. Y ears with P. noctiluca
The 27-year series: Weekly abundance variations of L. tetraphylla at station B, during November 1966 to Da·ember 1993; number of individuals per JO m3 (Juday-Bogorov net).
Figure 3
log (abund+l) 3,5
3
2,5
2
1,5
J Jt A s 0 N D J FM A MMonth
1963 t----~;.----
The one-year series: Dai/y abundance variations of L. tetraphylla (sum of the four developmental stages for hauts at the three depths) at stations B and S, from June 1963 to May 1964; number of individuals per 1,200 m3 (Regent net).
descriptors, we computed the euclidean distances between years. Years were clustered together by an agglomerative flexible sorting algorithm (Lance and Williams, 196 7).
Cumulative sum of hydrological data
Temperature and salinity measurements are used to identify long-term trends in environmental conditions and to compare fluctuations of biological and hydrological series. The cumulative sum (cusum) method (lbanez et al., 1993) was applied to detect local mean changes of temperature and salinity in the long time series. In this method, a reference value, the mean of the series, is subtracted from the data. These residuals are successively cumulated. Negative residuals (data Jess than the mean) are represented
148
by a decreasing slope. Positive residuals (data greater than the mean) are represented by an increasing slope. The value of the slope is proportional to the mean deviation from the overall average of the series. Sequences of data values close to the mean show null slope values. To eliminate seasonal variability of temperature, the monthly means were previously calculated and taken off to the data. The summary of the hydrological data series was compared with the general trends of medusa abundance.
Species preferences
We plotted the cumulative distribution of abundance of each Liriope stage (y axis) versus environmental factors (x axis) (Perry and Smith, 1993). Temperature and salinity

FLUCTUATIONS OF L. TETRAPHYLLA IN VILLEFRANCHE BAY
at 10 rn were chosen to represent the upper layer of the
sea, where medusae were most abundant. Environmental factors were sorted in increasing rank order in such a
manner that their cumulative distribution lies on the first diagonal of the graph, which then forms the reference
line for Liriope stage cumulative distributions. Species preference was determined in the part of the graph where the slope of their cumulative abundance was maximal.
Stage 1
so
10
so
70
Stage 3.
sa_,..,.,- h ~
70
10
Adults
sa _ = :::t__-===._
70
10
Figure 4
20
20
20
Generation time estimation
For species whose population structure is defined by cohorts, developmental time can be estimated by the duration of appearance of a particular cohort. We hypothesize that cohort development was synchronous over a large geographie range and, consequently, at a monitored station, subjected to advective process. This means that time intervals between successive peaks of abundance
30 40 50
40
30 40 50
30 40 50
Weekly abundance of the four developmental stages of L. tetraphylla, from November 1966 to December 1993. Number of individuals per JO m
3. In the Buys-Ballot tables, years are in rows and weeks in columns. The four stages abundances are represented on a geometrie scale.
Different kinds of grey represent the different classes: White: No data; Pale grey : Class 1: no medusae; Grey: Class II: from 0 to 3 ind.; Dark grey: Class Ill: from 4 to 17 ind.; Black: Class IV: more than 18 ind.
149

E. BUECHER et al.
Stage 1 Stage 2
77 78 RJ RO 69 79 8-l 68 75 82 85 81 76 67 70 92 '?1 1:2 73 S:9 90 86 91 SR 9l 7-t 87 fU R'i S.l 82 7') 77 MO 71, (,7 flf( 69 7; '92 7.l 71J Hl 86 MM 72 91 R') 1X) 78 71 9.1 7-1 R7 .'---.!=-'
Stage 3 Adulls
82 85 84 79 83 69 78 75 80 67 81 73 68 70 89 76 92 71 93 90 91 72 77 74 86 87 88 67 68 85 (,<> 82 84 78 SO 82 77 SI 83 71 70 72 92 79 93 90 91 75 89 73 76 87 74 86 88 ·, ~ L~
Figure 5
Dendrograms of the group of years for the four developmental stages of L. tetraphylla. a (a, to a4): "poor years"; b (b, to b4): "normal years"; c: "special years": for stage 1 (cJ) and stage 2 (c2): 1974 and 1987, for stage 3 (CJ) and adults (c4): 1974 and 1986 to 1988.
correspond to in situ generation time. We chose to study developmental stage 1 abundance periodicity, as it was the most abundant and a good indicator of Liriope population recruitment (for the one year 1963-1964, 70.4% of the Liriope population was represented by stage 1). The series was then divided into two parts, corresponding respectively to a "summer" part (June-July-August and September 1963) and a "winter" part (from December 1963 to May 1964). As the resulting series contain missing values and were too short to apply Fourier's transform accurately to identify the main periodicities of the data, we computed contingency periodograms on abundance data coded on three classes, each containing the same number of data (Legendre et al., 1981; Morand, 1989). The statistically significant periods were identified at the 0.05 probability levet.
RESULTS
Abondance fluctuations of Liriope tetraphylla
For graphical purposes (Fig. 4), abundances of the four developmental stages, during 1966 to 1993, were coded in four geometrie classes (Frontier, 1969). Stages 1 and 2 were the most abundant developmental stages, adults always being scarce. Maximum abundance class IV is essentially characteristic of the last quarter of the year. During sorne consecutive years (1967-1969 and 1975-1985), Liriope were quite rare in the samples. During other
150
years, Liriope were present throughout the four seasons. Maximum abundance was frequently observed during the last quarter of the year (on and after the 35th week, end of August), especially between 1986 and 1993. On sorne occasions, maxima were observed in late winter and early spring.
Classification of these annual patterns corresponds approximately to this visual impression. The dendrograms of each stage show two or three well-separated clusters of years, and sorne very dissimilar years, left unclustered (Fig. 5). We attempted to categorize clusters observed for the different stages according to their population abundance level and annual pattern of variations (Fig. 6).
The "poor years", group a (subgroups a1 to U4, indices refer to the different developmental stages) comprises years with scarce population. The seasonal pattern is flat with prevalent zeros or low abundance values randomly distributed within a year. ln a groups, linkage dissimilarity values increased according to annual averages.
The "normal years", group b (subgroups b1 to b4) comprises years with medium abundance and more strongly seasonal populations. This group is characterized by a main population rise during autumn, for juvenile stages 1 and 2. Stage 3 and adults also have sorne spring medium or high values. a or b subgroups did not necessarily correspond to the same years. Discrepancies between different developmental stage cluster compositions probably reflect sampling errors, interannual variations

FLUCTUATIONS OF L. TETRAPHYLLA IN VILLEFRANCHE BAY
Poor Years Normal Y ears Special Y ears
Abondance Abondance
Stage 1
10
5
Abondance
--e-1974
___.__ 1987
0 O~JA-~~~~~~~~~ f m a m ~ j f m a m
Stage 2 2 r--------------------,15,--------------------,80,_------------,-,----,
10 - 1974
5 ___.__ 1987
0 0 f m a m j jy a • 0 n d
Stage 3 2 4
2
0 0
20 _/j,_.J)r - 1974 - 1987
0 f m a m jy a • 0 n d fmamjjya s 0 n d mon th
Adults 2 4 40
2 20 - 1974
1987
0 ·" J'\f\.... 0 f m a m j jy a • 0 n d
Figure 6
Abundance of the four developmental stages of L. tetraphylla for the "poor years", the "normal years" and the "special years" ( 1974 and 1987) (number of individuals per JO m3, note the changing abundance scale).
of abundance proportions, and in sorne cases advective transport of sorne particular medusa age classes (mainly the adults).
The "special years", group c (subgroups CJ to c4), were unclustered years 197 4, 1986, 1987 and 1988, which were especially rich with unusua1 seasona1 patterns.
1974: This year was characterized by an unusua1 secondary maximum in April. Abundance peaked at the beginning of September (no data were availab1e in August) and included ali four developmental stages; the population collapsed in October.
1987: The medusa was not observed in the bay until June. During the Iast six months of the year, two maxima occurred, the first in early September and the second in October. High abundance was observed for ali four developmental stages.
1986 and 1988: These years are considered as special years for stage 3 and for adults. They were included within the normal years group for stages 1 and 2. Years 1986 and 1988 were characterized by large maxima restricted to October.
Cumulated abondance distribution relative to temperature and salinity in 1974 and 1987
We present the thermal and haline preference of Liriope during the two richest years of the long time series (197 4, 1987) characterized as two "special years" by
151
dendrogram analysis. Cumulative abundance graphs of Liriope as a function of rank of temperature and salinity (Fig. 7) distinguished juvenile stages from adults, for these two years and illustrated possible associations between environmental factors and Liriope.
In 1974, as previously shown, we observed a spring and a summer peak of abundance. Sea surface temperature ranged from 13.1 °C (21 February) to 24.2 °C (28 August). Maximum change of adult abundance occurred at temperatures higher than 15.6 °C, corresponding to the October maximum. At the same time, the upper layer of the sea was mixed after a cooling period. Increasing abundance of juvenile stages was observed over large temperature ranges including periods of the spring stratification, summer, and the autumnal mixing. Almost three-quarters of the populations of developmental stages 1 to 3 were associated with a temperature higher than 15.6°C. Salinity at 10 rn ranged from 37.4 (mid-June) to 38.1 (5 November). Juvenile stage distribution followed irregularly the diagonal line and this distribution indicates that population growth was not directly coupled with salinitics variations. A very different pattern was observed for the adults, which avoided low salinity values: only 10% of the adult population was observed at salinities lower than 38.0.
In 1987, temperatures ftuctuated between 12.6 oc in midMarch and 25.4 oc on 25 August. Juveniles and adulis

E. BUECHER et al.
TEMPERATURE (0 C) SALINITY (PSU)
1974 Cumulative frequency 1
Cumulative frequency ++ 1
1987
0.8
0.6
0.4
0,2 /
/ ,.,. Jv ........ ~/
0 ;,;. +++++++++++++++-+''-+ ,..----r-...----, 13.1 15.6 17.9 22.2 24.2
0,8
0,6
0.4
0,2
0,8
0,6
0,4
0.2
,+++ ++
~.~··) v +++++++++++++~ +++++1.------~-----. Rank of factor
38.23 38.82 38.01
/ /
/
/
/
//
/
/ /
/ /
/
// . ~
// /
/ /
/
/ /
/
/ //
,.*
/ +++++~
0 +·~~;+;;<~+~+;;++;+;:+~+l.-------,,~----.. Rank of factor 37.50 38.02 38.21 38.56
stage 1 ~ stage 2 --o- stage 3 --+--- adults
Figure 7
Cumulative frequency of the Jour developmental stages of L. tetraphylla for special years in relation to temperature and salinity. Dotted Une corresponds to the first diagonal.
showed the same cumulative graph. The population was absent during the coldest weeks; a very significant increase in the population was observed at temperatures higher than 20.rc. The salinity range extended from 37.5 to 38.6. Several abnormally high salinity values for the Ligurian Sea were observed between July and November. No developmental stages showed a significant increase with low salinity, but major changes occurred at salinities higher than 38.2 (about 50% of the Li ri ope population was associated with salinity higher than 38.2). Ali four developmental stage evolved with salinity in the same fashion.
Cumulative distribution of abundance of each developmental stage illustrates growth of the population as a function of temperature or salinity and reflectes for 1974 a specifie behaviour of the adult population in relation to the other stages.
Long-term fluctuations of hydrological factors
Hydrological time series show fluctuations of temperature and salinity during the 27 years and their maxima and minima (Fig. 8 and Table l ). At 10 rn, seasonality was obviously correlated with temperature in the cusum graph (Fig. 9a). At 75 rn, temperatures were below the mean from 1969 to 1975, from 1978 to 1982 and after 1991. Higher
152
temperatures were observed between 1989 and 1991 and between 1975 and 1978. Salinity showed a simple pattern similar at lü rn and 75 rn (Fig. 9b). Salinity was generally lower than the overali mean between 1967 and 1980 and after 1991. Periods of high salinity were present during 1974-76 and during 1981 to 1987.
Estimation of generation time
The biology and life cycle of Liriope may explain the longterm fluctuations observed in the bay. Metschnikoff (1886) was the first, and the last, to describe the development during the first seven days. He observed cellular divisions which transformed the egg into stage l. The observation of a new first developmental stage in the population characterizes a new generation. In the laboratory (during 1994 and 1995), several rearing tests of L. tetraphylla did not yield sufficient information on the generation time of this species.
From May 1963 to May 1964, Liriope tetraphylla was very highly abundant in the bay. Liriope was always present during this period, with a maximum from June to September, and similar densities during ali the other seasons. Clearly this one-year series 1963-1964 also be longs to the "special years" heterogeneous category. Even if quantitative comparisons between Juday-Bogorov

FLUCTUATIONS OF L. TETRAPHYLLA IN VILLEFRANCHE BAY
lOm JOr-----------------------------------------------------------------------------,
6& &7 68 69 71!1 71 7Z 73 74 75 7& 77 78 79 81!1 B 1 SZ 83 84 85 86 87 SB 89 91!1 91 9Z 93
f" Y)r}y~ryrhJh,H\' l'y '\~i\'~\v'v'Y1f IZl 37
75m 30 ~--------------------------------------------------------,
~ zs
8. zo 8 ~
l O 6& 67 68 69 71l 71 72 73 74 75 7& 77 78 79 88 S 1 82 83 84 85 8& 87 SB 89 99 91 92 93
39
>. 38 -:-s ~ 37
36 6& &7 &8 69 79 71 7Z 73 74 75 76 77 78 79 SB 81 8Z 83 84 85 86 87 88 89 99 91 9Z 93
Figure 8
Weekly sea temperature (C) and salinity (PSU) at JO rn and 75 rn, from 1966 to /9YJ.
and Regent nets may be difficult to achieve, the 1963-1964 seasonal pattern, with a strong summer maximum and similar abundance values for the three other seasons, was unique in our data. Due to the mesh size of the Regent net, the stage 1 population could have been underestimated, but a high abundance of this stage is significant. On the other band, during this year, L. tetraphylla accounted for a quarter of the medusa population in the bay (Goy, 1968).
With these considerations in mind, in situ data of these series were examined by the contingency peridogram. In
Table 1
Minima and maxima of hydrographie data, at JO rn and 75 rn, from 1966 to 1993.
Temperature (0 C) Salinity (PSU)
Minimum Maximum Minimum Maximum
!Om 12.45 25.77 37.02 38.58 (11.03.84) (10.08.71) (20.11.91) (30.09.87)
75 rn 12.41 20.04 37.59 38.51 (21.02.73) (0.3.11.87) (23.06.87) (07.11.73)
153
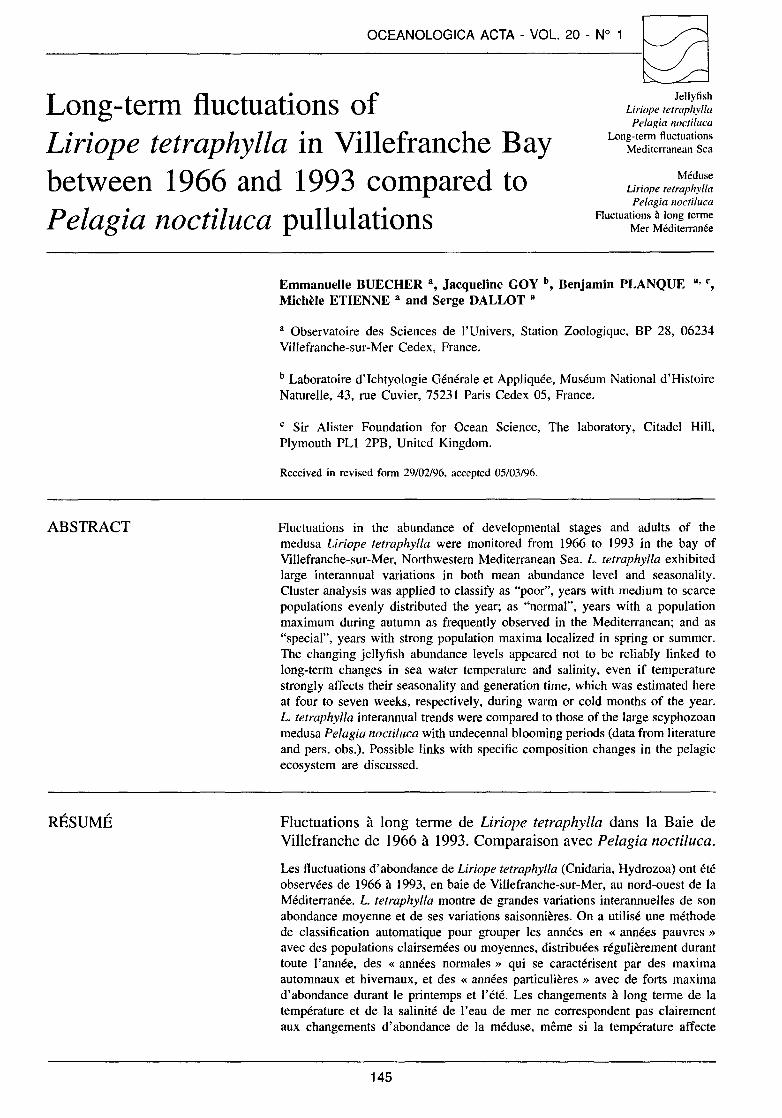
the warmest period of the year 1963 (June to September, 20-26 °C at 10 rn depth) the abundance peak of stage 1 occurred with a significant period of 28 days (Fig. IOa). In the colder period (December 1963 to May 1964, 13-20°C at 10 rn), the significant period has a value of 44 da ys (Fig. lOb). As in the case of ali marine species, in winter, growth is slower than in summer when it is accelerated. In these series, maximal abundance was observed during the warmest months.
DISCUSSION AND CONCLUSION
Liriope tetraphylla is a cosmopolitan and euryhaline species from temperate and subtropical waters. This jellyfish can dominate the carnivorous gelatinous zooplankton, especially in upwelling are as (Furnestin, 1959; Goy, 1973)
The "normal years" seasonal pattern in our series agrees with previous studies in different parts of the western Mediterranean. Vannucci ( 1966) observed maximal occurrence of Lirîope in the bay of Naples from October to March (survey from 1959 to 1961). In the Gulf of

E. BUECHER et al.
® 20
t 0
l20
= 'f-40 -= c ~-60 E ~ :-80
..!S = §lOO u -120
-140
-160
Years 1
® 5
s 0 00 1:::. .§ -5 -; ·;;: ~-10 c = ., E .,-15 .. ·= ..!S Ë-20 = u
-25
-30
Figure 9
1 1 70
lOm
75m
1 1 75
1 1 80
1 1 85
1 1 90
Cumulative sum series of weekly sea temperature (deseasonalized data; A) and salinity (B), from November 1966 to December 1993, at JO m and 75 m.
Marseilles (Berhaut, 1968), the medusa is most abundant from October to December (years 1964-1967). In the western Mediterranean Sea, ail these periods correspond to the annual cooling period. Autumn temperatures are usually between 20°C and 15°C and uniform from the surface to a depth of more than 50 m. As in the case of other planktonic organisms, medusae are known to be influenced by temperature and salinity (Reeve and Walter, 1972; Catalano, 1985; Larson, 1985; Morand et al., 1987; Malej, 1989; Rottini Sandrini and Avian, 1989; Arai, 1992; Matsakis, 1993 and many others). However, no experimental work has been done on the metabolic and behavioural effects of these parameters on Liriope.
In the long-term series, direct relationships between Liriope population variations and hydrological parameter changes are debatable. In our area, the most important climatic
154
events of the last 30 years were the cold winter of 1963 and the dry period during 1980-90 (Fromentin and Ibanez, 1994 ). During the winter of 1963, deep water formation occurred in the Northwestem Mediterranean Sea. Off Villefranche, the entire water column remains homogeneous unti1 the beginning of surface warming in early May (Braconnot et al., 1966). During this mixing event, large amounts of nutrients were found in the euphotic zone (Gostan, 1968). Planktonic production was delayed. When the temperature increased in mid-spring, new production was fueled by the large nutrient pool and may explain the high abundance of Liriope we observed in summer.
The dry decade 1980-1990 corresponds to high surface salinity and poor years of Liriope until 1986. A dramatic increase of another medusa, Pelagia noctiluca (Forsskal,
FLUCTUATIONS OF L. TETRAPHYLLA IN VILLEFRANCHE BAY
A . 1.0
>. 0.8 (.) c:: "' ~ .5 0.6
ë1 0 u 0.4
0.2
0.0 0 60
Period
B
>. :-.:r / (.)
c:: "' ~ c:: ·g 0.4 0 u
0.2
0.0 0 20 40 60 80
Figure 10
Contingency periodogram for stage 1 of L. tetraphylla. A: the "summer" series (from June to September 1963). B: the "winter" series (from December 1964 to May 1964). Line which delimited hatched surface corresponds to the critical values at 5% probability levet. When the curve is above this fine, calculated period is significant. Period is in days.
1775) took place during this period (UNEP, 1984). Goy et al. (l989a) demonstrated that this holoplanktonic jellyfish exhibits near undecennal blooming periods (12 years) in the Mediterranean. Years preceding the occurrences of Pelagia may be characterized by special weather conditions: high atmospheric pressure and low rainfall. Therefore, periods of high abundances of the two medusae species are not coïncident during our 27-year series. Pelagia was very abundant from 1982 to 1985, when Liriope was very rare. A medium-intensity bloom of Pelagia was observed in 1969-70, accompanied by a low Liriope population. A sparse and irregular population of Pelagia was recorded off the French Riviera in 1992-93 (pers. obs.), while at the same time Liriope was less abundant than the preceeding years (Fig. 2 illustrates periods of occurrence of Pelagia in comparison with Liriope). From 1963, the richest years of Liriope abundance always occur during Pelagia absences.
Both medusae are carnivorous and have a holopelagic !ife cycle (Metschnikoff, 1886; Delap, 1907; Morand et al., 1987; Malej, 1989; Rottini Sandrini and Avian, 1989; Matsakis, 1990). In situ observations and experimental data do not contradict the view that, at the same size, they have similar trophic niches. Nevertheless they have very different generation times, reproductive size and maximum size (the corresponding maximum dry weights are about l mg for Liriope and 10 g for Pelagia). The largest Pelagia are able to feed on large prey (pteropods molluscs, fish larvae and krill, as we observed in the Ligurian Sea) that adult Liriope cannot catch at ali. On the other band, Pelagia could also eat medusae, for example Liriope. As Legovic (1987) concluded, the fluctuations
155
of jellyfish populations could be explained by variations in food availability, standing stocks of either competitors and predators, and even direct climatic effects, such as temperature variations outside the vital range. Few data are available quantitatively to compare these various effects simultaneously for both species. Experimental work and population dynamic modelling have only been reported on Pelagia (Morand, 1989; Malej and Malej, 1992; Morand et al., 1992).
At our present leve! of knowledge, the interannual pattern of succession of the two medusae species suggests a simple hypothesis. As the food requirements to enable the two species to reach maturity differ greatly, considering their different sizes, we could suppose that developing populations of the large predator Pelagia occur only during periods of strong and sustained secondary production accumulating biomass in the food web in large-sized prey species. Morand et al. ( 1992) showed that prey standing stocks are a critically limiting factor for Pelagia ephyrae which grow during five months in spring and summer. The much smaller Liriope may develop during periods of normal productivity, which may not be sufficient to sustain a population of Pelagia. As we have shown, in the absence of Pelagia, Liriope seasonality and population levels seem positively influenced by environmental conditions favourable to increases in coastal planktonic production. Pelagia, with its longer generation time, may not be able to benefit from transient coastal production events. ln the Ligurian Sea, developmental stages appear to be localized in more permanently productive frontal zones (Boucher et al., 1987).

E. BUECHER et al.
During Pela~ia blooms, Liriope populations may be reduced by direct trophic competition and predation. Evidence of competitive exclusion during Pelagia pullulations was documented by Morand and Dallot ( 1985) and Goy et al. (1989h) for other macroplanktonic predators observed in the Villefranche Bay during the years 1898-1915. The ctenophore Leucothea multicornis develops during Pela~ia's inter-bloom period. The siphonophore Hippopodius hippopus and trachymedusa Geryonia proboscidalis are both depressed during pullulations of Pelagia. These effects
REFERENCES
Arai M.N. (1992). Active and passive factors affecting aggregations of Hydromedusae: a review. Sei. Mar. 56, 2-3, lJY-108.
Berhaut J, (1968). Variations mensuelles d'abondance de la Trachyméduse Liriope tetraphylla (Chamisso ct Eysenhard, 1821) dans le Golfe de Marseille. Bull. Mus. Nat. llist. Nat. Paris, 2" série, 40, 6, 1222-1231.
Béthoux j.-P., L. Prieur, j.-H. Bong (1988). Le courant Ligure au large de Nice. Oceanologica Acta, SP (Océanographie pélagique méditerranéenne, Minas and Nival eds.), 59-67.
Boucher J., F. Ibanez, L. Prieur ( 1987). Daily and sesonal variations in the spatial distribution of zooplankton population in relation to the physical structure in the Ligurian front. J. Mar. Res. 45, 1, 133-173.
Bouvier A. ( 1977). Programme ACPM. Analyse des composantes principales avec données manquantes. CNRA. Laboratoire de Biométrie, Jouy en Josas, Document 77, 17, 1-34.
Braconnot J.C., C. Carré, .J, Goy, Ph. Laval, E. Sentz-Braconnot (1966 ). Conditions hydrologiques pendant les années 1963 et 1964 en un point au large de Villefranche-sur-Mer (A.M.). Particularités dues à l'hiver froid de 1963. Cah. océanogr. 18, 423-437.
Catalano G., M. A vian, R. Zanelli ( 1985). Influence of salinity on the behaviour of Pelagia noctiluca (Forsskal) (Scyphozoa. Semaeostomeae). Obelia 11, N.S .• 169-179.
Delap M. ( 1907). Notes on the rearing in aquarium. of Aurelia aurita L. and Pelagia perla (Slabber). Rep. Sea inld Fish. Ire. ( 1905), pt II, Scient. Invest. 160-164.
Etienne M., M.C. Corre, S. Dallot, P. Nival (1991 ). Observations hydrologiques à une station cÎ>tière Méditerranéenne. Point B - Rade de Villefranche-sur-Mer (43 41' 10" N-7 19' 00" E). Jfremer, COF, 14, 89 p.
Fromentin j.M., F. lbanez (1994 ). Ycar-to-ycar changes in meteorological fcatures of the French coast during the last half ccntury; Examples of two biological responses. Oceanologica Acta 17, 3, 285-296.
Frontier S. (1969). Sur une méthode d'analyse faunistique rapide du zooplancton. J. Exp. Mar. Biol. Eco/. 3, 18-26.
Furnestin M. L. ( 1959). Méduses du plancton marocain. Revue Trav. inst. scient. tech. Pêches marit. 23, 1, 105-124.
Gostan j. (1968). Contribution à l'étude hydrologique du bassin Jiguro-provençal entre la Riviera et la Corse: distribution et variations saisonnières de la température, de l'oxygène et des phosphates minéraux dissous dans les masses d'eau superficielles, intermédiaires et profondes. Thèse de doctorat d'Etat, Université de Paris VI, 206 p.
Goy j. (1968). Les Hydroméduses de la rade de Villefranche-sur-Mer et de la Mer de Ligurie. Thèse de doctorat, spécialité océanographie biologique, Université de Paris VI, 183 p.
Goy J, ( 1973). Note sur les Hydroméduses dans les eaux tropicales et subtropicales. Bull. Mus. Nat. Hist. Nat. Paris, 3e série, 165, Ecologie générale 21. 333-343.
156
are more pronounced in summer and autumn, when Pelagia occurrence is maximum in coastal waters.
Acknowledgements
The authors wish to thank J.M. Fromentin and F. Ibanez for their material help and critical comments.
Goy J,, P. Morand, M. Etienne (1989a). Long-term fluctuations of Pelagia noctiluca (Cnidaria, Scyphomedusae) in the western Mediterranean Sea. Prediction by climatic variables. Deep-Sea Res. 36. 2, 269-279.
Goy J., S. Dallot, P. Morand (1989b). Les proliférations de la méduse Pelagia noctiluca et les modifications associées de la composition du macroplancton gélatineux. Oceanis 15, 1, 17-23.
Ibanez F., .J.M. Fromentin, j. Castel (1993). Application de la méthode des sommes cumulées à l'analyse des séries chronologiques en leurs composantes suivant diverses méthodes. Etudes statistiques et économétriques. Bull. Stat., INS 1965, 10, 1449-1524.
Kramp P. L. (1924). Medusae. Rep. danish oceanogr. Exped. Medit., vol. Il, Biol., H. 1, 1-67.
Lance G.N., W.T. Williams ( 1967). A general theory of classificatory sorting strategies. 1. Hierarchical systems. Computer J. 9, 373-380.
Larson R. (1985). Trophic ecology of gelatinous predators (Cnidaria and Ctcnophora) in Saanich ln let, Vancouver Is., B.C., Canada. Thesis, ( PhD) University of Victoria, 253 p.
Legendre L., M. Fréchette, P. Legendre ( 1981 ). The contin geney pcriodogram: a method of identifying rhythms in series of nonmetric ecological data. Journal of Eco/ogy 69, 965-979.
Legovic T. ( 1987). A recent increas in jcllyfish population: a predatorprey modcl and its implications. Ecological Modelling 38, 3-4, 243-256.
Malej A. ( 1989). Behaviour and trophic ecology of the jellyfish Pelagia noctiluca (Forsskal, 1775). J. exp. mar. Biol. Eco/. 126, 259-270.
Malej A., M. Malej (1992). Population dynamics of the jcllyfish Pelagia noctiluca (Forsskal, 1775). ln: G. Colombo et al. ed. Marine Eutrophication and Population Dynamics, 215-219.
Matsakis S. ( 1990). Comportement et métabolisme de quelques méduses en Mer Ligure et au bassin de Bedford. Thèse de doctorat, spécialité océanographie biologique, Université Paris VI, 165 p.
Mal~akis S. ( 1993). Growth of Clytia spp. hydromedusae (Cnidaria, Thecata): etl"ects of temperature and food availibility. J. Exp. Mar. Biol. Eco/. 171, 107-118.
Metschnikoff E. ( 1886) Medusologische Mittheilungen. A rb. Zoo/. Jnst. Univ. Wien und Zool. Stat. Triest. 6, 2, 237-266.
Morand P. ( 1989). La méduse Pelagia noctiluca en Méditerranée Occidentale: de la dynamique de population aux variations à longterme. Thèse de doctorat, spécialité biomathémathiques, Université Paris VI, 191 p.
Morand P., S. Dallot (1985). Variations annuelles et pluriannuelles de quelques espèces du macroplancton côtier de la Mer Ligure (1898-1914). R{lpp. Comm. lnt. Mer Méd. 29, 295-297.
Morand P, C. Carré, D.C. Biggs ( 1987). Feeding metabolism of the jellyfish Pelagia noctiluca (Scyphomedusae, semaeostomae). J. Plankton Res. 9, 4, 651-665.

FLUCTUATIONS OF L. TETRAPHYLLA IN VILLEFRANCHE BAY
Morand P, J. Goy, S. Dallot (1992). Recrutement et fluctuations à long-terme de Pelagia noctiluca (Cnidaria, Scyphozoa). Ann. lnst. océanogr., Paris, 68, 1-2, 151-158.
Perry R.I., S.J. Smith (1994). Identifying habitat of marine fishes using survey data: an application to the Northwest Atlantic. Can. J. Aquat. Sei. 51, 589-602.
Reeve M.R., M.A. Walter (1972). Conditions of culture, food-size selection and the effects of temperature and salinîty on growth rate and generation time in Sagitta hispida Conant. J. Exp. Mar. Biol. Eco/. 9, 168-189.
157
Rottini Sandrini L., M. Avian (1989). Feeding mechanîsm of Pelagia noctiluca (Scyphozoa: Semaeostomeae); laboratory and open sea observations. Mar. Biol. 102, 49-55.
UNEP (1984). Workshop on jellyfish blooms in the Medîterranean. United Nations Environnement Programme ed. Athens, 221 p.
Vannucci M. (1966) Total net plankton volume and Hydromedusae from fixed stations in Gulf of Naples. ln: H. Barnes ed. Sorne contemporary studies in Marine science, London, 675-397.