Embed Size (px)
Citation preview
1 INTRODUCTION Terrestrial digital photogrammetry (TDP) is now routinely applied in rock mass discontinuity characterization of both natural and engineered rock slopes. Discontinuity mapping on photo-grammetric stereomodels allows measurement of discontinuity geometric properties, which in-clude discontinuity position, orientation, persistence, roughness, frequency and block size. Sev-eral authors, including Krosley et al. (2006), Martin et al. (2007), Coggan et al. (2007), Haneberg (2006 and 2007) and Sturzenegger and Stead (2009a), have highlighted the accuracy and potential of photogrammetric techniques. Software allowing both stereomodel generation and discontinuity characterization are available (Gaich et al., 2006; Birch, 2006; Poropat, 2006) and are designed to be used by non-photogrammetrists, i.e. geologists and geotechnical engi-neers.
Until now, TDP has been applied predominantly on individual benches or roadcuts, at close-range. Characterizing larger rock slopes at medium- to long-range represents a logical develop-ment (Sturzenegger and Stead, 2009b). Large rock slopes may be represented by entire moun-tain cliffs or open-pit slopes at scales ranging from the multibench to entire pit wall. Using TDP on large rock slopes can solve obvious issues related to accessibility and hazard. In addition, it allows accurate assessment of the properties of large structures that may potentially affect slope stability.
The current paper summarizes the challenges faced and presents preliminary results in the application of long-range TDP for discontinuity characterization at the Palabora open-pit mine, South Africa. Photographs were taken across the diameter of the pit from a distance of 1600m. Complete sets of photographs, covering the entire pit, were obtained using f=20mm, 55mm, 100mm and 200mm lenses and partial coverage of the walls were achieved using a f=50mm and 400mm lens. Multi-scale discontinuity characterization is being achieved on these stereomodels and the results at selected locations are presented. This data highlights the need to consider the effect of observation scale in the planning phase of a long-range photogrammetric field survey.
Long-range terrestrial digital photogrammetry for discontinuity characterization at Palabora open-pit mine
M. Sturzenegger, D. Stead, A. Beveridge & S. Lee Department of Earth Sciences, Simon Fraser University, Burnaby, British Columbia, Canada
A. van As Rio Tinto Technical Services, Brisbane, Australia
ABSTRACT: This paper documents a field survey using long-range terrestrial digital photo-grammetry at the Palabora open-pit mine, South Africa, for multi-scale characterization of rock mass discontinuities. Stereomodels covering the entire mine were generated based on photo-graphs taken from a distance of 1600m across the pit, using a series of f=20-400mm lenses. De-tails on the methodology used and its accuracy are discussed. Preliminary results on discontinui-ty orientation, persistence and intensity are presented, highlighting the effect of observation scale. The potential uses of long-range terrestrial digital photogrammetry in open-pit mine and large natural rock slope environments is emphasized. The use of an f=400mm lens from dis-tances larger than 1.5km may represent an important step forward in the geotechnical characte-rization of inaccessible remote rock faces.
ROCKENG09: Proceedings of the 3rd CANUS Rock Mechanics Symposium, Toronto, May 2009 (Ed: M.Diederichs and G. Grasselli)
PAPER 3984 1
2 THE PALABORA MINE Located approximately 390km North East of Johannesburg, the Palabora copper mine began open pit operations in 1964. Surface excavations ceased in 2003, and since then the mine has been operating as an underground block cave operation. Following the inception of the under-ground activities beneath the north wall of the open pit, cracking was observed in the northern pit wall during 2003. As caving progressed, so the wall disturbance increased, ultimately lead-ing to the development of an approximately 800m high failure of the north wall.
The Palabora Igneous Complex consists of a succession of subvertical pipe-like bodies of al-kaline and ultramafic rocks that have intruded the surrounding Archean granite (Piteau Ass., 2005). The copper orebody occurs in the Loolekop pipe emplaced in pyroxenite host rock and contains successive intrusions of micaceous pyroxenite, foskorite and banded carbonatite. Sub-vertical, northeasterly trending dolerite dykes cut across the complex. Four large scale faults, striking WSW, WNW and S, cross the open pit. Three dominant discontinuity sets are ubiquit-ous within the mine.
3 TERRESTRIAL DIGITAL PHOTOGRAMMETRY
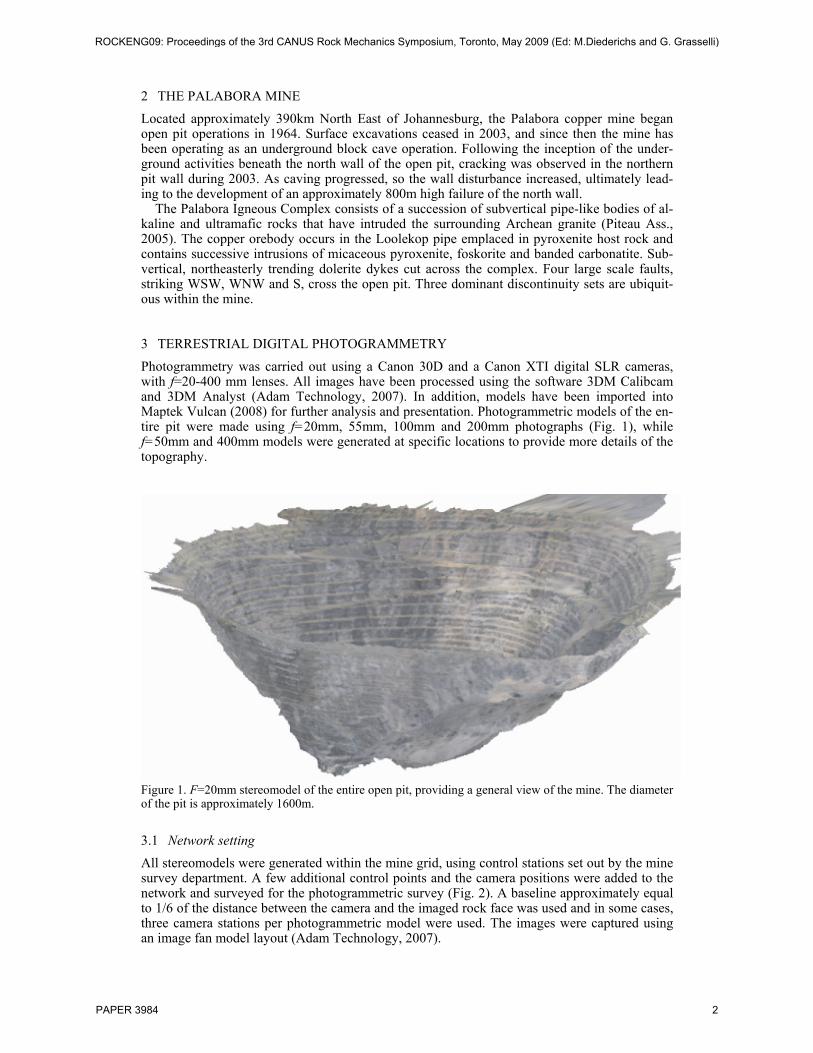
Photogrammetry was carried out using a Canon 30D and a Canon XTI digital SLR cameras, with f=20-400 mm lenses. All images have been processed using the software 3DM Calibcam and 3DM Analyst (Adam Technology, 2007). In addition, models have been imported into Maptek Vulcan (2008) for further analysis and presentation. Photogrammetric models of the en-tire pit were made using f=20mm, 55mm, 100mm and 200mm photographs (Fig. 1), while f=50mm and 400mm models were generated at specific locations to provide more details of the topography.
Figure 1. F=20mm stereomodel of the entire open pit, providing a general view of the mine. The diameter of the pit is approximately 1600m.
3.1 Network setting All stereomodels were generated within the mine grid, using control stations set out by the mine survey department. A few additional control points and the camera positions were added to the network and surveyed for the photogrammetric survey (Fig. 2). A baseline approximately equal to 1/6 of the distance between the camera and the imaged rock face was used and in some cases, three camera stations per photogrammetric model were used. The images were captured using an image fan model layout (Adam Technology, 2007).
ROCKENG09: Proceedings of the 3rd CANUS Rock Mechanics Symposium, Toronto, May 2009 (Ed: M.Diederichs and G. Grasselli)
PAPER 3984 2

The north, east, south and west walls of the pit were covered by four different sets of photo-graphs, in order to locate the camera stations sub-perpendicular to each wall. For the f=200mm and 400mm models, where a large number of photographs were required to cover entire walls, the sets of photographs were split in two or three sub-sets in order to create two or three stereo-models with a manageable amount of images (in terms of digital photomodel size).
Figure 2. Network of surveyed points, including control targets (red filled circles) and camera locations (white circles) (after Beveridge et al., 2008).
3.2 Accuracy Because of the limited number of available mine control points (15 over the entire pit), these could only be used in the registration of the low resolution models (f=20-55mm). Some inaccu-racy in the model registration can be expected because of the non-optimal sizes/shapes of the control points. Prisms located at the top of permanent survey rods are sub-optimal, because the poles are too thin to be represented on stereomodels. The prisms located on top of massive con-crete monuments were usually adequate; the best control points being provided by large targets painted directly on the rock walls.
As mentioned in section 3.1, at higher resolution, the sets of photographs had to be split into sub-sets, which individually did not contain enough control points for registration. Consequent-ly, f=100 to 400mm models were registered by transfer of control from selected recognizable features in the 55mm model. Since this model had been registered, any point could potentially be used as a control point. It must be noted that absolute errors in the 55mm model are conse-quently transmitted to the higher resolution models. Maximum inaccuracy of -3.7, 4.2 and 0.6m
ROCKENG09: Proceedings of the 3rd CANUS Rock Mechanics Symposium, Toronto, May 2009 (Ed: M.Diederichs and G. Grasselli)
PAPER 3984 3

in the x, y and z coordinates, respectively and maximum imprecision of 5.0, 6.5 and 1.5m in the x, y and z coordinates, respectively have been measured on the f=55mm model. As the predo-minant use of models is in the measurement of relative dimensions/orientations (not absolute coordinate), the obtained accuracy and precision are considered adequate for rock mass charac-terization.
Based on a comparison of discontinuities mapped on a specific bench of the north wall both from a 1600m distance using f=400mm lens (long-range) and at a 30m distance with the f=50 mm lens (close-range), Fig. 3 shows that there is a good consistency between stereonets. This suggests that the methodology provides accurate discontinuity orientation measurements for rock engineering purposes.
Figure 3. Equal angle, lower hemisphere stereonets with poles of discontinuities mapped using f=50 and 400mm lenses on a selected bench in the north wall. f=50mm mapping was carried out at a 30m distance and f=400mm at a 1600m distance (after Beveridge et al., 2008).
3.3 Ground resolution Table 1 summarizes ground point spacing for each focal length used. Ground point spacing is the distance between spatial points in the stereomodels and represents the product of the ground pixel size and the step size (number of pixels, both horizontally and vertically, used to generate one spatial point).
Table 1. Ground point spacing and observation scale for the various stereomodels (after Beveridge et al., 2008). __________________________________________________________________________ Focal length Distance Ground point spacing Observation scale __________________________________________________________________________ [mm] [m] [cm] __________________________________________________________________________ 20 1600 365 Wall 50 30 3 Bench 55 1600 133 Wall 100 1600 82 Wall 200 1600 41 Wall 400 1600 21 Wall/Bench __________________________________________________________________________
ROCKENG09: Proceedings of the 3rd CANUS Rock Mechanics Symposium, Toronto, May 2009 (Ed: M.Diederichs and G. Grasselli)
PAPER 3984 4
3.4 Specific issues to be addressed in photogrammetric pit wall survey To ensure the quality of stereomodels, pairs of photographs should be taken within a short pe-riod of time to avoid changes in lighting of the walls. This condition was sometimes difficult to adhere to, because of the distance between successive camera positions (several hundreds of meters and on different benches). Consequently, when the weather is characterized by an alter-nation of sun and clouds, the conditions can be sub-optimal. In addition, field work must be carefully planned so that the walls illuminated by the sun at a certain time of the day are sur-veyed at the appropriate time.
Another fieldwork component, where difficulties may be encountered, is in the calibration of long focal length f=200 and 400mm lenses. Calibration is an important step in the photogram-metric process, necessary to calculate the exact focal length of a lens and to quantify internal camera parameters. With large focal lengths, the network of successive camera locations used for calibration (see AdamTech, 2007), involves large distances. Consequently, for the same rea-sons as highlighted in the previous paragraph, optimal weather conditions may be difficult to at-tain. In addition, at such large ranges, it may be difficult to survey a rock slope with relatively sufficient relief, a requirement for good calibration. Calibration may however be conducted after the field survey at a location optimal for maximizing success.
4 DISCONTINUITY CHARACTERIZATION To date, a total of 2808 discontinuities have been manually mapped on the various focal length stereomodels. At this stage, characterization on the f=55 and 100mm models covers both the north and west walls, while on the f=50, 200 and 400mm models, it is concentrated predomi-nantly in specific areas of the north walls. Characterization using various resolution stereomo-dels must be applied with care because of the potential for observation scale effects. Sturzeneg-ger and Stead (2009b) summarized the effects of observation scale on discontinuity orientation and persistence. While high resolution stereomodels usually allow the most detailed characteri-zation, lower resolution can be useful in the recognition of highly persistent features, which can be critical for wall stability.
The numerous images required to cover the pit walls at f=100 mm, 200 mm and 400 mm resolutions has presented some issues for simultaneously displaying a large number of stereo-models on computer screens. This was particularly problematic for the characterization of large features, which cross several stereomodels, and where censoring issue must be considered. As this limitation is a function of computing processing/memory facilities and not a limitation of high focal length imagery, it is considered that future censoring problems will be more easily addressed.
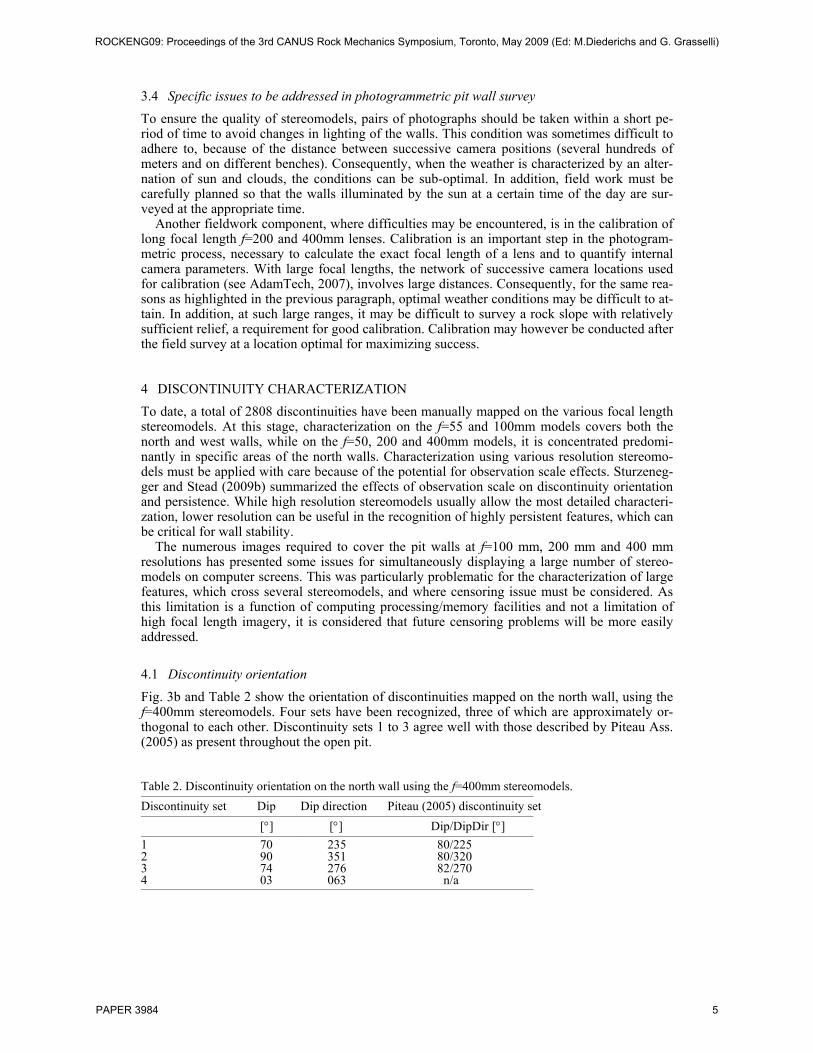
4.1 Discontinuity orientation Fig. 3b and Table 2 show the orientation of discontinuities mapped on the north wall, using the f=400mm stereomodels. Four sets have been recognized, three of which are approximately or-thogonal to each other. Discontinuity sets 1 to 3 agree well with those described by Piteau Ass. (2005) as present throughout the open pit.
Table 2. Discontinuity orientation on the north wall using the f=400mm stereomodels. ______________________________________________________________________________ Discontinuity set Dip Dip direction Piteau (2005) discontinuity set ______________________________________________________________________________ [°] [°] Dip/DipDir [°] ______________________________________________________________________________ 1 70 235 80/225 2 90 351 80/320 3 74 276 82/270 4 03 063 n/a ______________________________________________________________________________
ROCKENG09: Proceedings of the 3rd CANUS Rock Mechanics Symposium, Toronto, May 2009 (Ed: M.Diederichs and G. Grasselli)
PAPER 3984 5
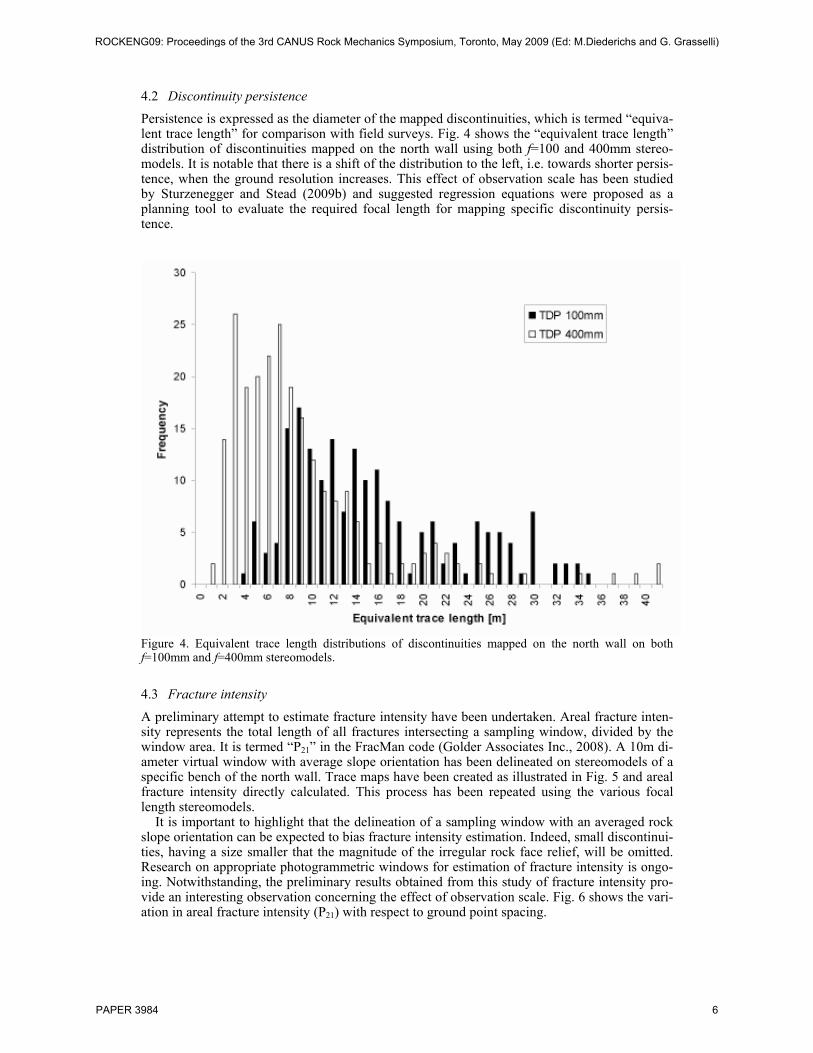
4.2 Discontinuity persistence Persistence is expressed as the diameter of the mapped discontinuities, which is termed “equiva-lent trace length” for comparison with field surveys. Fig. 4 shows the “equivalent trace length” distribution of discontinuities mapped on the north wall using both f=100 and 400mm stereo-models. It is notable that there is a shift of the distribution to the left, i.e. towards shorter persis-tence, when the ground resolution increases. This effect of observation scale has been studied by Sturzenegger and Stead (2009b) and suggested regression equations were proposed as a planning tool to evaluate the required focal length for mapping specific discontinuity persis-tence.
Figure 4. Equivalent trace length distributions of discontinuities mapped on the north wall on both f=100mm and f=400mm stereomodels.
4.3 Fracture intensity
A preliminary attempt to estimate fracture intensity have been undertaken. Areal fracture inten-sity represents the total length of all fractures intersecting a sampling window, divided by the window area. It is termed “P21” in the FracMan code (Golder Associates Inc., 2008). A 10m di-ameter virtual window with average slope orientation has been delineated on stereomodels of a specific bench of the north wall. Trace maps have been created as illustrated in Fig. 5 and areal fracture intensity directly calculated. This process has been repeated using the various focal length stereomodels.
It is important to highlight that the delineation of a sampling window with an averaged rock slope orientation can be expected to bias fracture intensity estimation. Indeed, small discontinui-ties, having a size smaller that the magnitude of the irregular rock face relief, will be omitted. Research on appropriate photogrammetric windows for estimation of fracture intensity is ongo-ing. Notwithstanding, the preliminary results obtained from this study of fracture intensity pro-vide an interesting observation concerning the effect of observation scale. Fig. 6 shows the vari-ation in areal fracture intensity (P21) with respect to ground point spacing.
ROCKENG09: Proceedings of the 3rd CANUS Rock Mechanics Symposium, Toronto, May 2009 (Ed: M.Diederichs and G. Grasselli)
PAPER 3984 6

Figure 5. Areal fracture intensity estimation. (a) 10m diameter circular sampling window, (b) mapped discontinuities, (c) discontinuities intersecting the window, (d) traces of these discontinuities (after Beve-ridge et al., 2008).
0.000.100.200.300.400.500.600.700.800.901.00
0 20 40 60 80 100 120 140
Ground point spacing [cm]
P21
Figure 6. Graph illustrating a decrease in P21 value as ground pixel spacing increases.
ROCKENG09: Proceedings of the 3rd CANUS Rock Mechanics Symposium, Toronto, May 2009 (Ed: M.Diederichs and G. Grasselli)
PAPER 3984 7
5 DISCUSSION The authors successfully applied long-range terrestrial digital photogrammetry in a large
open-pit mine, at Palabora. At this mine, it is no longer possible to obtain access to pit walls for conventional mapping due to safety concerns. Previous data were obtained during the life of the open pit. As the orebody contains magnetic rock types, this is also a factor in conventional mapping. Further data on the fracture networks is required to allow the application of state-of-the-art modeling codes with increased confidence (Vyazmensky et al., 2009; Sainsbury et al., 2008). This paper presents an extension of conventional rock engineering photogrammetry to long range high focal length applications. During the fieldwork and subsequent stereomodel generation, practical difficulties encountered included: i. Registration of stereomodels with a limited number of control points, due to the lack of op-
timal and accessible targets, ii. Lighting issues, non-optimal weather conditions necessitating careful planning of fieldwork
according to the position of the sun, iii. Management of large sets of photographs, providing difficulties to achieve resection and
successful bundle adjustment. The experience gained in solving these problems will allow improvements in future applica-
tions of the technique. Long-range TDP has significant potential in large open-pit mine envi-ronment and on large natural slopes, where limited accessibility and rockfall hazard exist.
Concerning discontinuity characterization, the following observations are noted based on the preliminary results of this research: i. Characterization at the pit wall scale using the f=55mm lens has proven useful, since it has
enabled mapping to be conducted relatively quickly at reasonable detail, providing an initial view of the structure. Clearly defined, persistent structures have been mapped at this resolu-tion and compare well to structures mapped on other focal length stereomodels. The inten-tion is to extend the use of f=400mm imagery to map key areas in an attempt to improve the detail of the structure captured (Fig. 7).
ii. A current limitation of the photogrammetry-specific software for f = 400m mapping is the number of models that can be stored on screen at any one time. On high resolution stereo-models, this increases the potential for censoring of persistent planes, making it harder to es-tablish a true trace length. Some initial work using the Maptek Vulcan code has been carried out to overcome this issue, the use of this code allowing more images to be loaded on-screen at any one time while the operator continues delineating persistent planar structures. (This limitation is considered transient and related to hardware/software issues, which will un-doubtedly be alleviated in the near future.)
iii. The results of this research show that long-range TDP is able to accurately quantify discon-tinuity orientation, persistence and intensity. These three parameters are the main input re-quired for the generation of discrete fracture network (DFN) models. In this preliminary ap-plication at the Palabora site, it is shown that discontinuity persistence and fracture intensity are highly dependent on the photogrammetric observation scale. Further work on the effect of observation scale on both fracture intensity and block size is ongoing. Work to date emphasizes that it is critical that geologists and geological engineers decide at the planning stage on appropriate resolutions for the specific purposes of their application. If only large structures need to be characterized, low ground resolution stereomodels may be sufficient, while if a more detailed characterization of rock mass fracturing is required, higher ground resolution must be achieved.
ROCKENG09: Proceedings of the 3rd CANUS Rock Mechanics Symposium, Toronto, May 2009 (Ed: M.Diederichs and G. Grasselli)
PAPER 3984 8
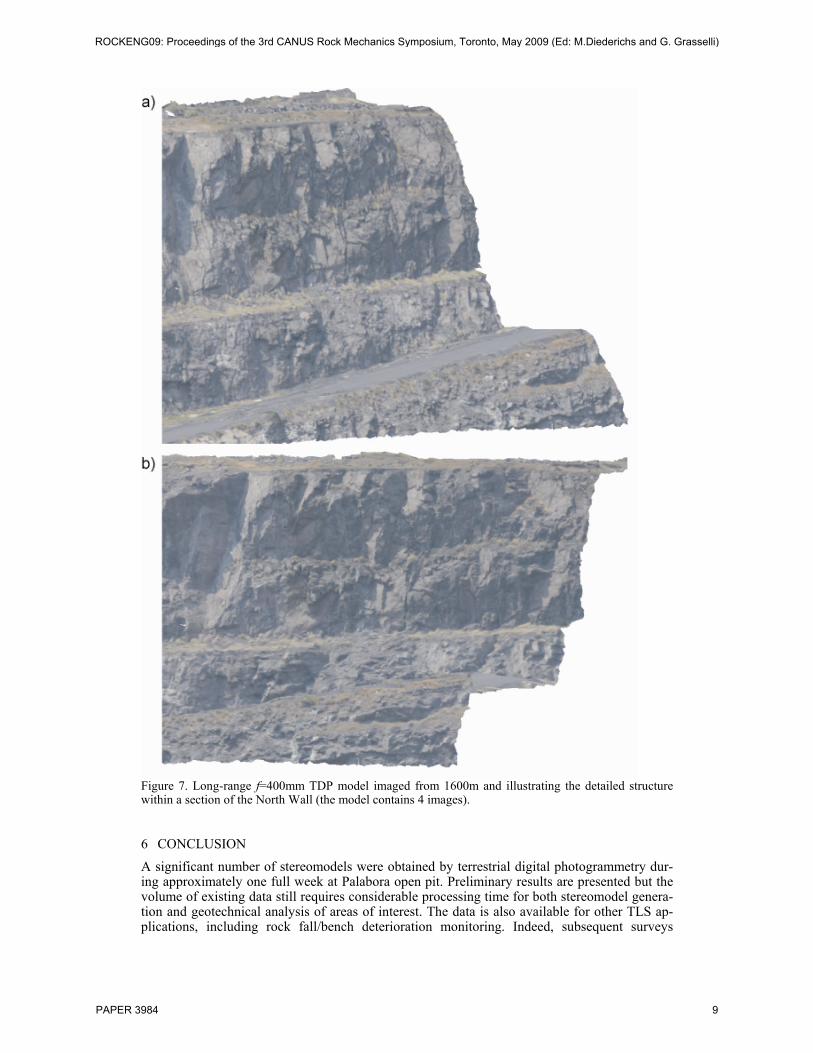
Figure 7. Long-range f=400mm TDP model imaged from 1600m and illustrating the detailed structure within a section of the North Wall (the model contains 4 images).
6 CONCLUSION
A significant number of stereomodels were obtained by terrestrial digital photogrammetry dur-ing approximately one full week at Palabora open pit. Preliminary results are presented but the volume of existing data still requires considerable processing time for both stereomodel genera-tion and geotechnical analysis of areas of interest. The data is also available for other TLS ap-plications, including rock fall/bench deterioration monitoring. Indeed, subsequent surveys
ROCKENG09: Proceedings of the 3rd CANUS Rock Mechanics Symposium, Toronto, May 2009 (Ed: M.Diederichs and G. Grasselli)
PAPER 3984 9
would provide the opportunity to quantify/record (multi)bench deformation mechanism that might be related to underground mining. Deformation monitoring using long-range TDP would be possible but would require appropriate improvements in survey control points. This would be particularly useful to track continuing underground activities related movements and to guaran-tee the security of the mine personal at specific locations of the pit.
7 ACKNOWLEDGMENTS All salaries, equipment and travel involved in this work were funded through an Endowment to Professor Stead, NSERC CRD and NSERC Operating Grants, an NSERC Undergraduate re-search scholarship (Sung Lee) and an SFU Ph.D. scholarship (Andy Beveridge). We are grateful to Palabora Mine and the geotechnical/geological staff for providing food and accommodation and the generous field support while undertaking the field work.
REFERENCES
Adam Technology 2007. 3DM CalibCam and 3DM Analyst, version 2.2b, http://www.adamtech.com.au. Beveridge, A., Stead, D., Sturzenegger, M. & Lee, S. 2008. Remote imaging of the Palabora open-pit
mine, a preliminary report on rock mass characterization using terrestrial digital photogrammetry and LiDAR. Internal report by the Engineering Geology and Resource Geotechnics Working Group, Si-mon Fraser University, Canada.
Birch, J.S. 2006. Using 3DM Analyst mine mapping suite for rock face characterization. In Tonon, F. & Kottenstette, J. (Eds.), Laser and Photogrammetric Methods for Rock Face Characterization, ARMA, 13-32.
Coggan, J.S., Wetherelt, A., Gwynn, X.P. & Flynn, Z.N. 2007. Comparison of hand-mapping with re-mote data capture systems for effective rock mass characterization. In Proc. 11th Congress of ISRM, Lisbon, Portugal, July 2007.
Gaich, A., Pötsch, M. & Schubert, W. 2006. Acquisition and assessment of geometric rock mass feature by true 3D images. In Proc. 41st U.S. Symp. on Rock Mech, Golden, Colorado, 17-21 June 2006.
Golder Associates Inc. 2008. FracMan manual, version 7.10. Haneberg, W.C., Norrish, N.I. & Findley, D.P. 2006. Digital outcrop characterization for 3-D structural
mapping and rock slope design along interstate 90 near Snoqualmie Pass, Washington. In Proc. 57th annual Highway Geology Symp., Breckenridge, Colorado, 27-29 Sept. 2006.
Haneberg, W.C. 2007. Directional roughness profiles from three-dimensional photogrammetric or laser scanner point clouds. In E. Eberhardt, D. Stead & T. Morrison (Eds.), Proc. 1st Canada-U.S. Rock Mechanics Symp., Vancouver, 27-31 May 2007, 101-106.
Krosley, L.K., Shaffner, P.T., Oerter, E. & Ortiz, T. 2006. Digital ground-based photogrammetry for measuring discontinuity orientations in steep rock exposures. In Proc. 41st U.S. Symp. on Rock Me-chanics (USRNS), Golden, Colorado, 17-21 June 2006.
Maptek 2008. Vulcan, version 7.5, http://www.maptek.com/products/vulcan.html. Martin, C.D., Tannant, D.D. & Lan, H. 2007. Comparison of terrestrial-based, high resolution, LiDAR
and digital photogrammetry surveys of a rock slope. In E. Eberhardt, D. Stead & T. Morrison (Eds.), Proc. 1st Canada-U.S. Rock Mechanics Symp., Vancouver, 27-31 May 2007, 37-44.
Piteau Associates Engineering Ltd. 2005. Assessment of pit wall instability and slope displacement as a result of interaction between the open pit and underground mine. Internal Report.
Poropat, G.V. 2006. Remote 3D mapping of rock mass structure. In Tonon, F. & Kottenstette, J. (Eds.), Laser and Photogrammetric Methods for Rock Face Characterization, ARMA, 63-75.
Sainsbury, B., Pierce, M.E. & Mas Ivars, D. 2008. Analysis of caving behaviour using a synthetic rock mass-ubiquitous joint rock mass modeling Technique. In Proc. 1st Southern Hemisphere International Rock Mechanics Symposium, Perth, Australia, 16-19 September 2008, 243-253.
Sturzenegger, M. & Stead, D., 2009a. Close-range terrestrial digital photogrammetry and terrestrial laser scanning for discontinuity characterization on rock cuts. Engineering Geology, doi:10.1016/j.enggeo.2009.03.004.
Sturzenegger, M. & Stead, D. 2009b. Quantifying discontinuity orientation and persistence on high mountain rock slopes and large landslides using terrestrial remote sensing techniques. Natural Hazard and Earth System Sciences 9 (2), 267-287.
Vyazmensky, A., Stead, D., Elmo, D. & Moss, A. 2009. Numerical analysis of block caving-induced in-stability in large open pit slopes: a finite element/discrete element approach. Rock Mechanics and Rock Engineering, doi:10.1007/s00603-009-0035-3.
ROCKENG09: Proceedings of the 3rd CANUS Rock Mechanics Symposium, Toronto, May 2009 (Ed: M.Diederichs and G. Grasselli)
PAPER 3984 10