Embed Size (px)
Citation preview
Logistic Regression
What Type of Regression? Dependent Variable – Y
Continuous – e.g. sales, height Dummy Variable or Multiple Regression
What Type of Regression? Dependent Variable – Y
Continuous – e.g. sales, height Dummy Variable or Multiple Regression
Dependent Variable – Y Binary (0 or 1) – Purchased product or didn’t
purchase Logistic Regression
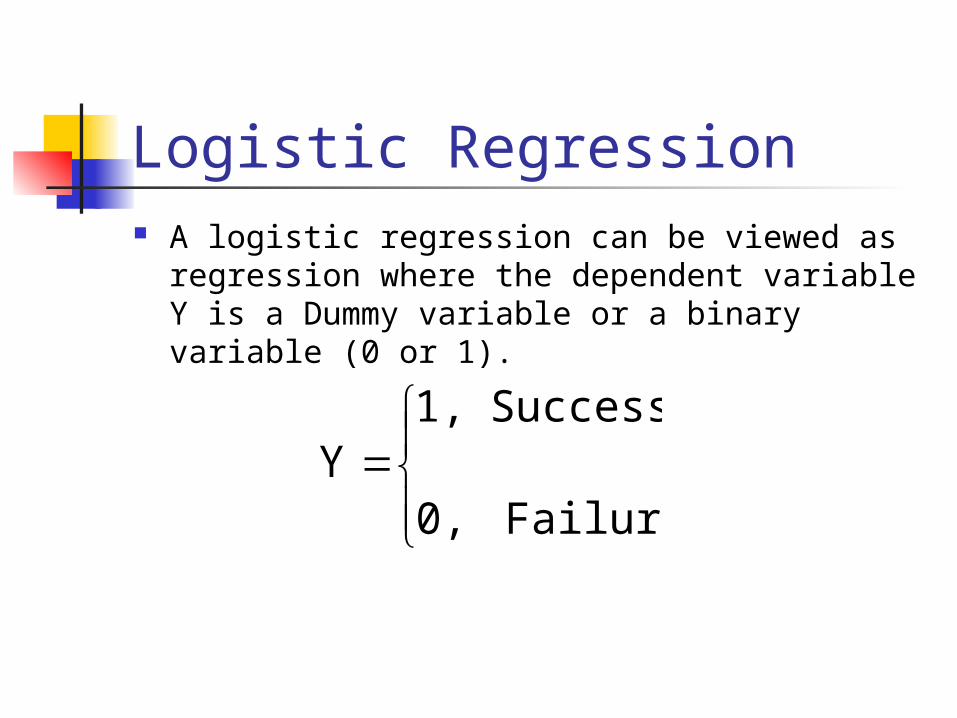
Logistic Regression A logistic regression can be viewed as regression
where the dependent variable Y is a Dummy variable or a binary variable (0 or 1).
Failure0,
Success1,Y
Examples A success may be defined in terms of having a credit
card client upgrade from a standard card to a premium card.
A success may be defined in terms of launching the Space Shuttle successfully and not having any damage to the secondary motors during the launch and flight.
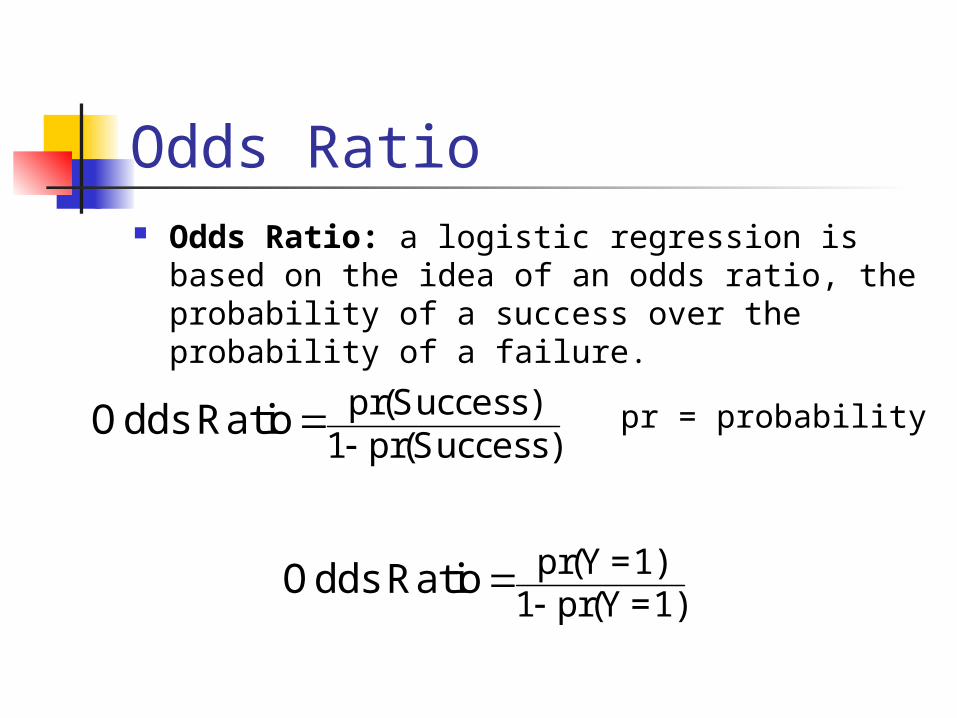
Odds Ratio Odds Ratio: a logistic regression is based on
the idea of an odds ratio, the probability of a success over the probability of a failure.
pr(Success)
1 pr(Success)Odds Ratio
pr(Y =1)
1 pr(Y =1)Odds Ratio
pr = probability
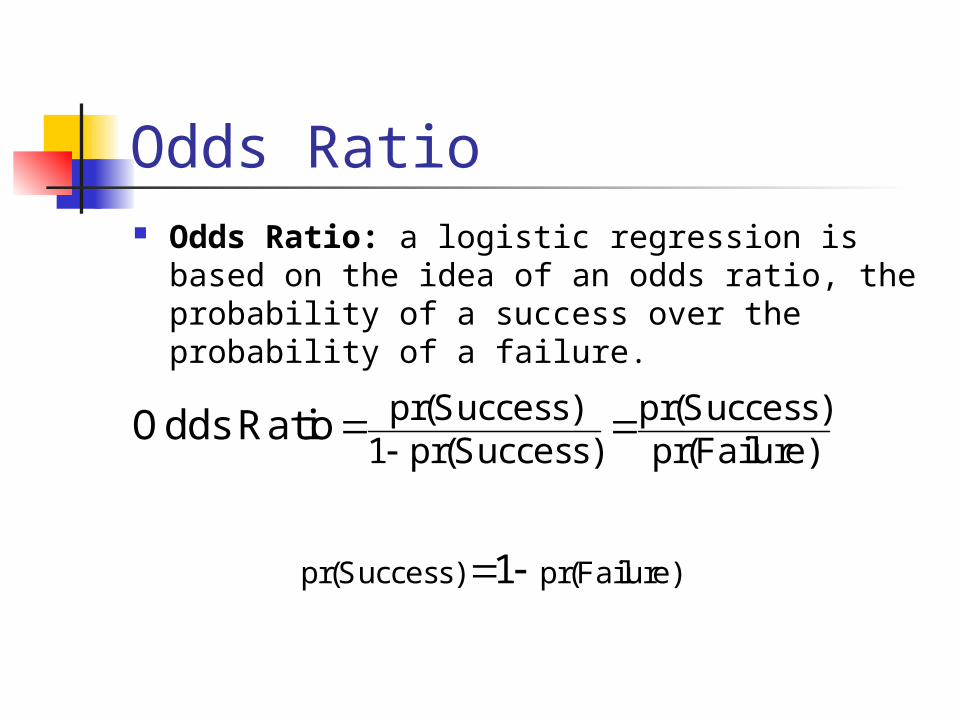
Odds Ratio Odds Ratio: a logistic regression is based on
the idea of an odds ratio, the probability of a success over the probability of a failure.
pr(Success) pr(Success)
1 pr(Success) pr(Failure)Odds Ratio
1 pr(Success) pr(Failure)
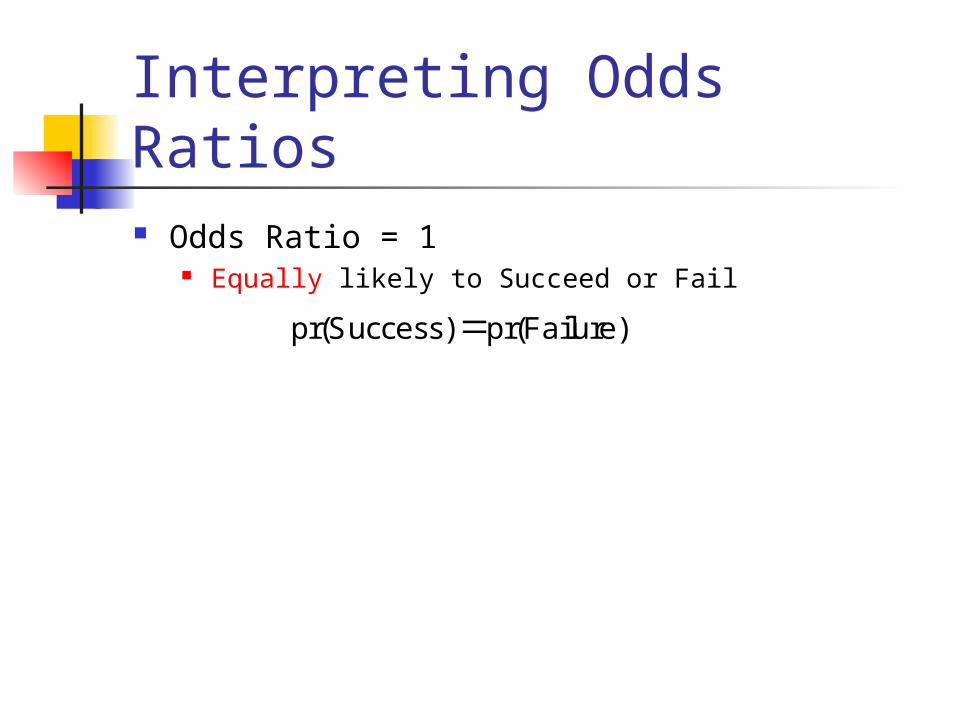
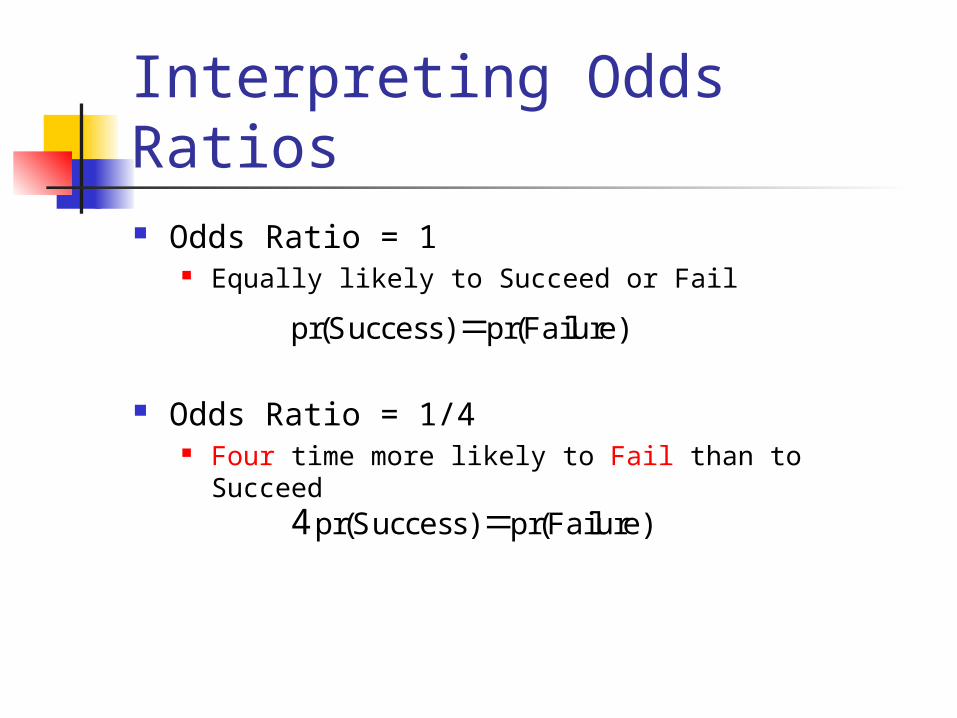
Interpreting Odds Ratios Odds Ratio = 1
Equally likely to Succeed or Fail
pr(Success) pr(Failure)
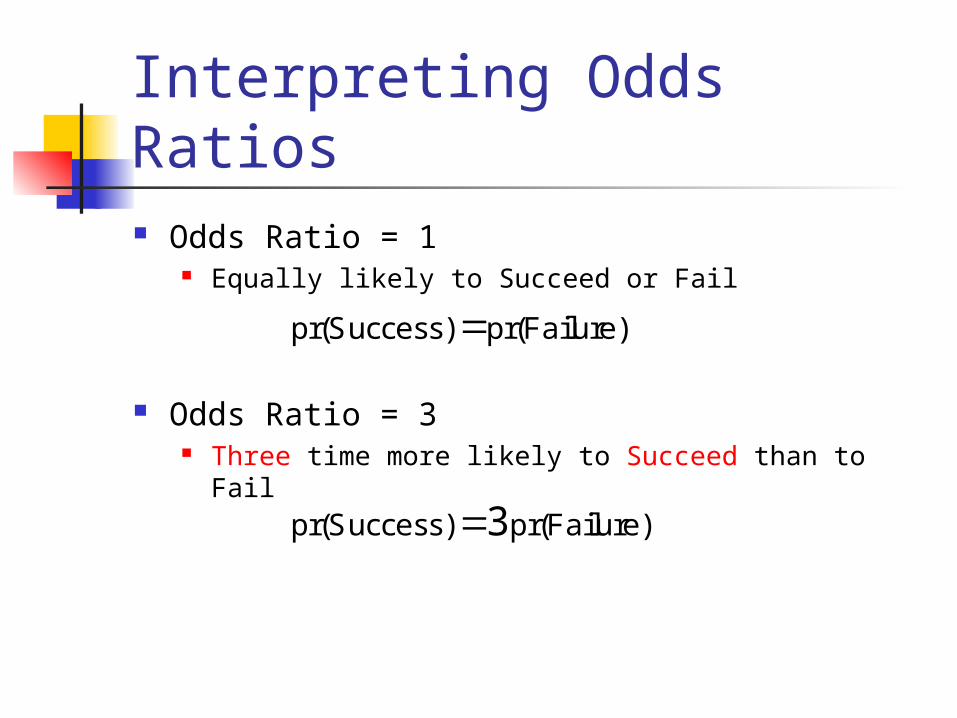
Interpreting Odds Ratios Odds Ratio = 1
Equally likely to Succeed or Fail
Odds Ratio = 3 Three time more likely to Succeed than to Fail
pr(Success) pr(Failure)
3pr(Success) pr(Failure)
Interpreting Odds Ratios Odds Ratio = 1
Equally likely to Succeed or Fail
Odds Ratio = 1/4 Four time more likely to Fail than to Succeed
pr(Success) pr(Failure)
4 pr(Success) pr(Failure)
Upgrading a Credit Card A manager would like to know what influences
the chance that a credit card customer would upgrade their credit card from a standard to a premium card
Possible Predictors of Chance Customer Upgrades Annual Credit Card Spending If they posses additional credit cards Introductory offers
Gift certificate to a local restaurant Reduced Interest rate for six months
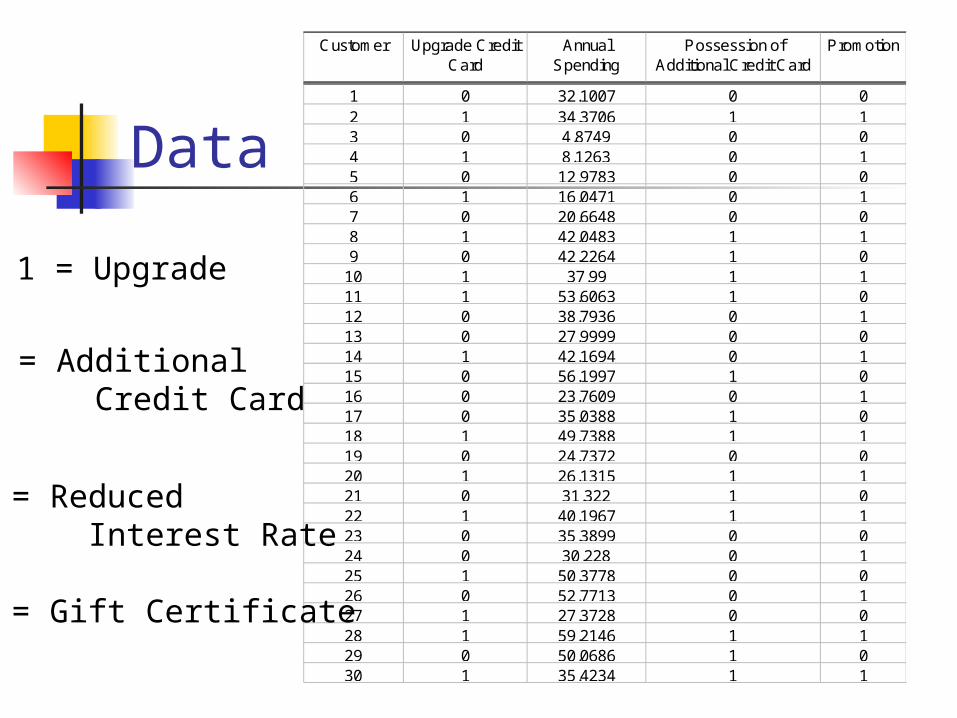
Data
Customer Upgrade Credit Card
Annual Spending
Possession of Additional Credit Card
Promotion
1 0 32.1007 0 02 1 34.3706 1 13 0 4.8749 0 04 1 8.1263 0 15 0 12.9783 0 06 1 16.0471 0 17 0 20.6648 0 08 1 42.0483 1 19 0 42.2264 1 0
10 1 37.99 1 111 1 53.6063 1 012 0 38.7936 0 113 0 27.9999 0 014 1 42.1694 0 115 0 56.1997 1 016 0 23.7609 0 117 0 35.0388 1 018 1 49.7388 1 119 0 24.7372 0 020 1 26.1315 1 121 0 31.322 1 022 1 40.1967 1 123 0 35.3899 0 024 0 30.228 0 125 1 50.3778 0 026 0 52.7713 0 127 1 27.3728 0 028 1 59.2146 1 129 0 50.0686 1 030 1 35.4234 1 1
1 = Upgrade
1 = Additional Credit Card
1 = Reduced Interest Rate
0 = Gift Certificate
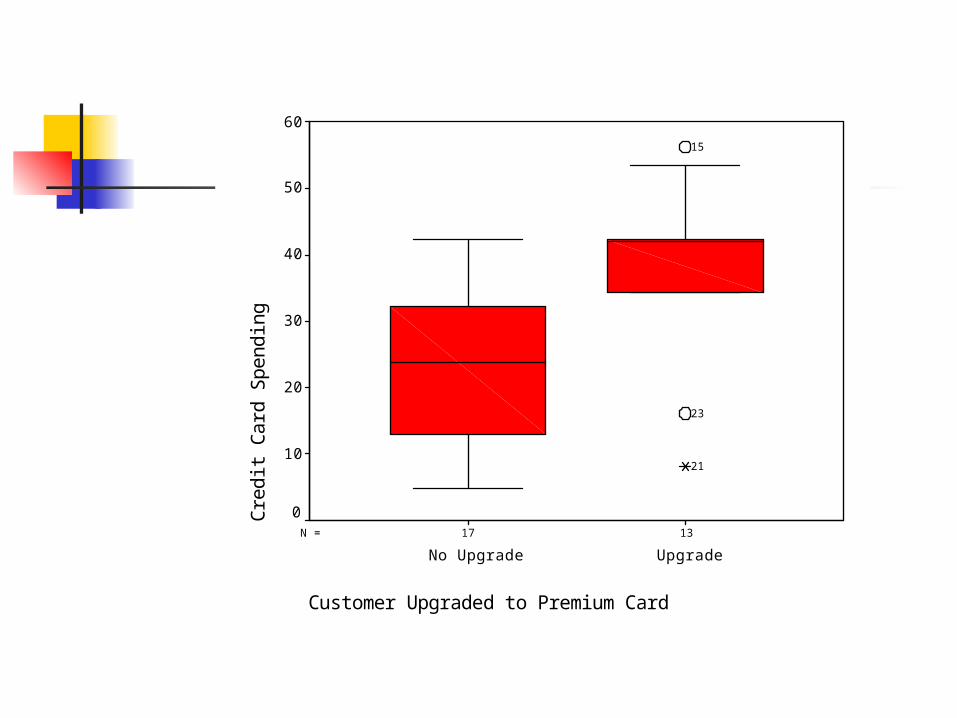
1317N =
Customer Upgraded to Premium Card
UpgradeNo Upgrade
Cre
dit
Ca
rd S
pe
nd
ing
60
50
40
30
20
10
0
23
21
15
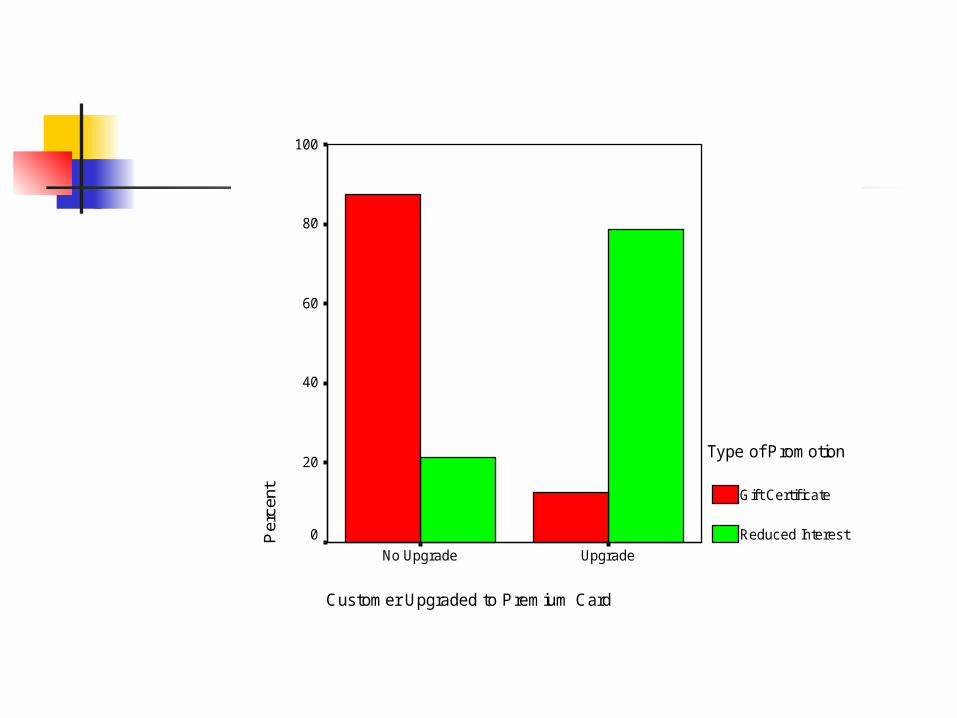
Customer Upgraded to Premium Card
UpgradeNo Upgrade
Per
cent
100
80
60
40
20
0
Type of Promotion
Gif t Certif icate
Reduced Interest
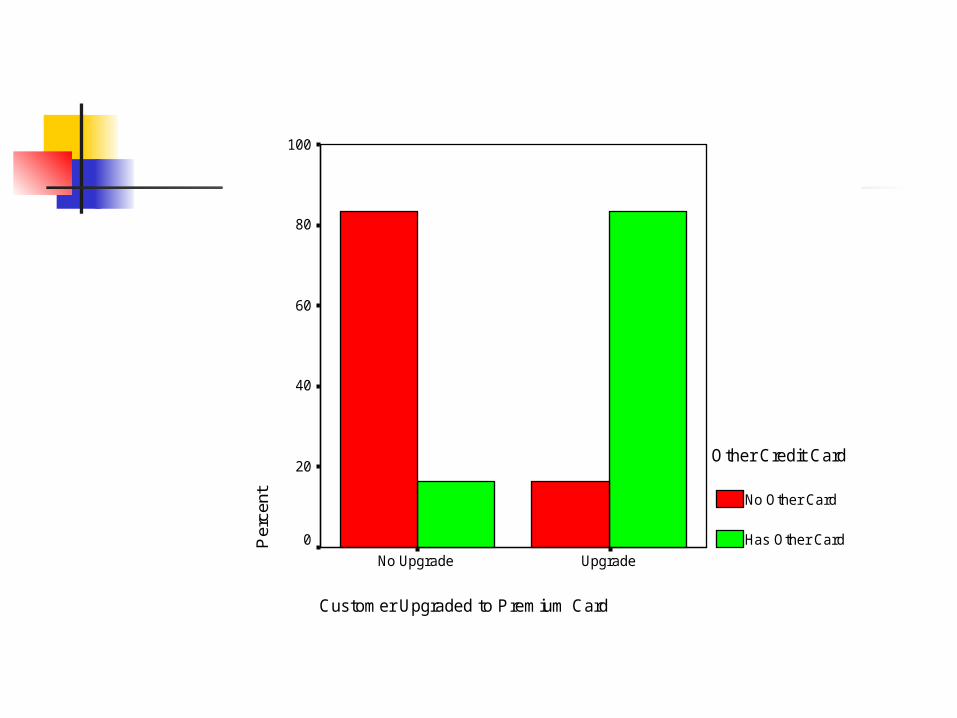
Customer Upgraded to Premium Card
UpgradeNo Upgrade
Per
cent
100
80
60
40
20
0
Other Credit Card
No Other Card
Has Other Card
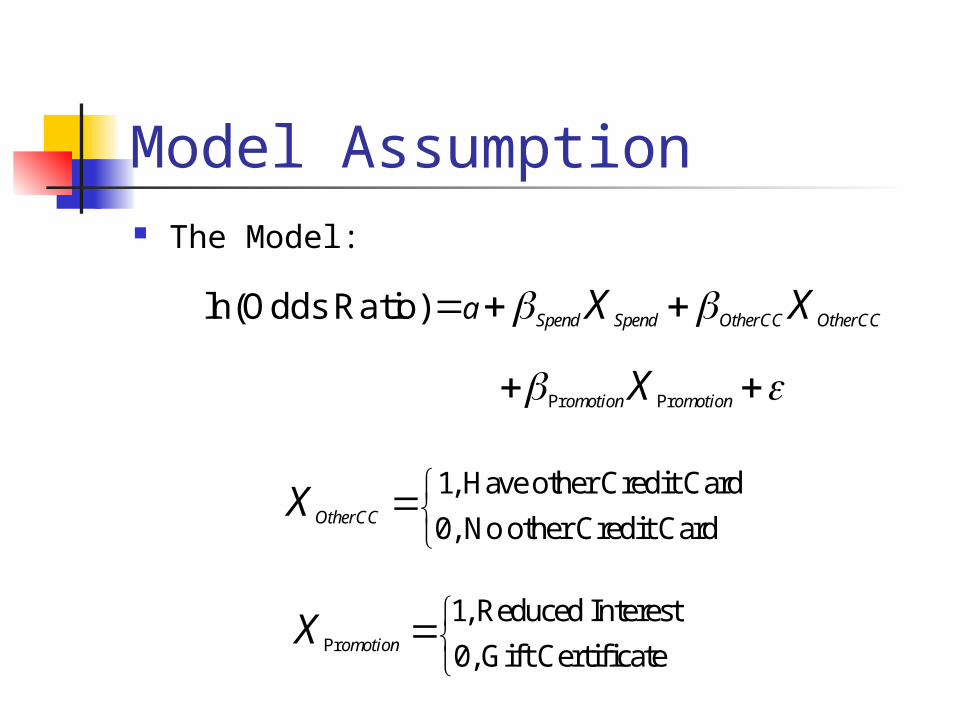
Model Assumption The Model:
Spend Spend OtherCC OtherCCa X X ln(Odds Ratio)
Pr Promotion omotionX
1, Have other Credit Card
0, No other Credit Card OtherCCX
Pr
1, Reduced Interest
0, Gift Certificate omotionX
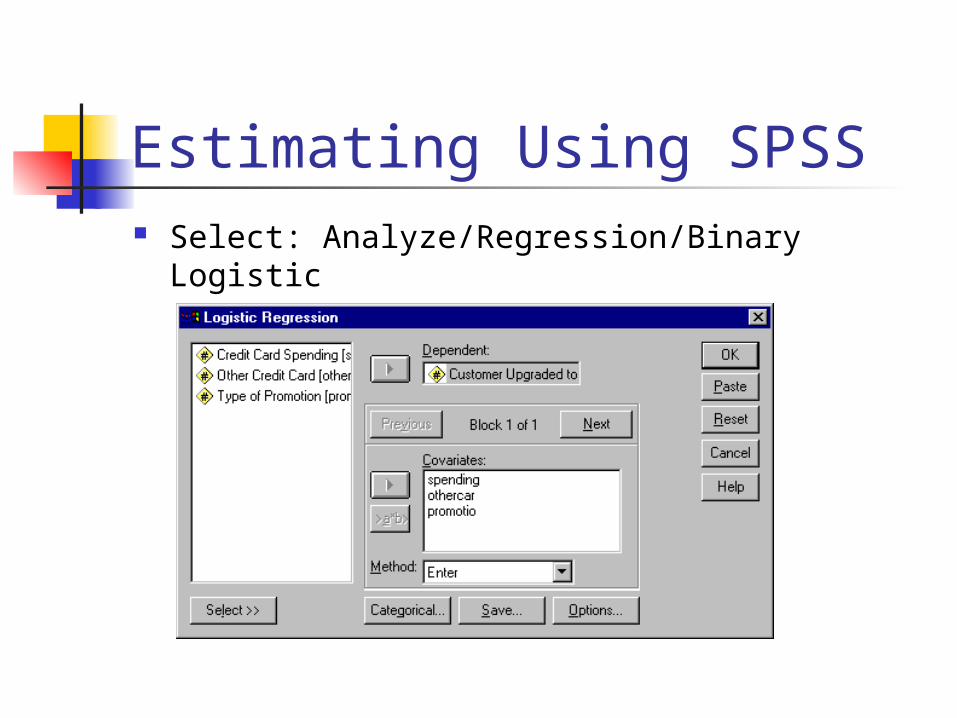
Estimating Using SPSS Select: Analyze/Regression/Binary Logistic
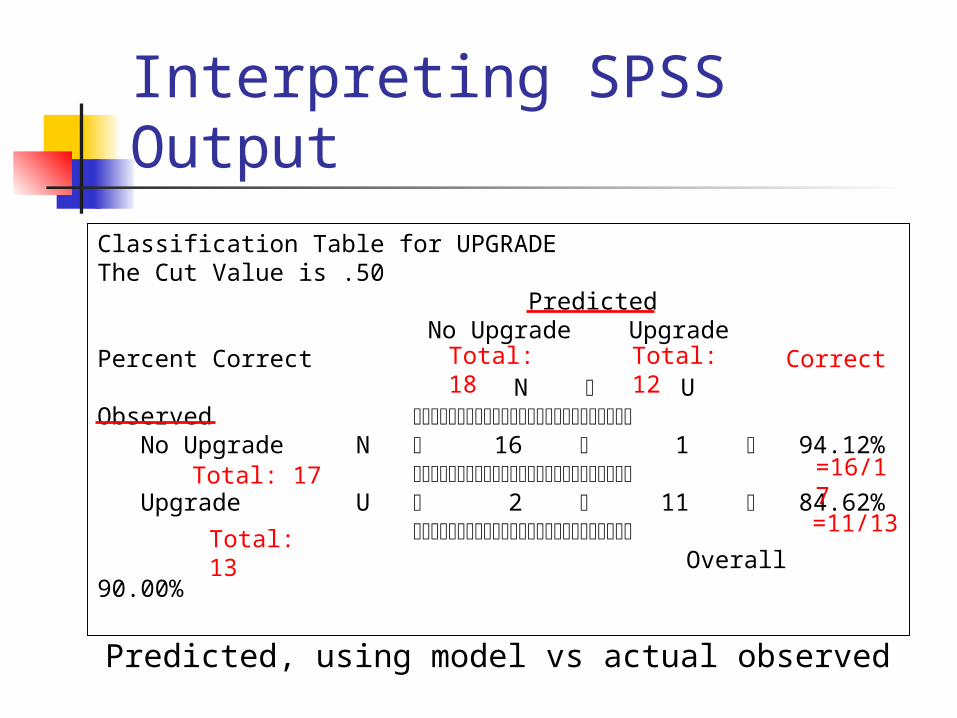
Interpreting SPSS OutputClassification Table for UPGRADEThe Cut Value is .50 Predicted No Upgrade Upgrade Percent Correct N UObserved No Upgrade N 16 1 94.12% Upgrade U 2 11 84.62% Overall 90.00%
Predicted, using model vs actual observed
Total: 13
Total: 17
Total: 18 Total: 12
=16/17=11/13
Correct
Interpreting SPSS Output
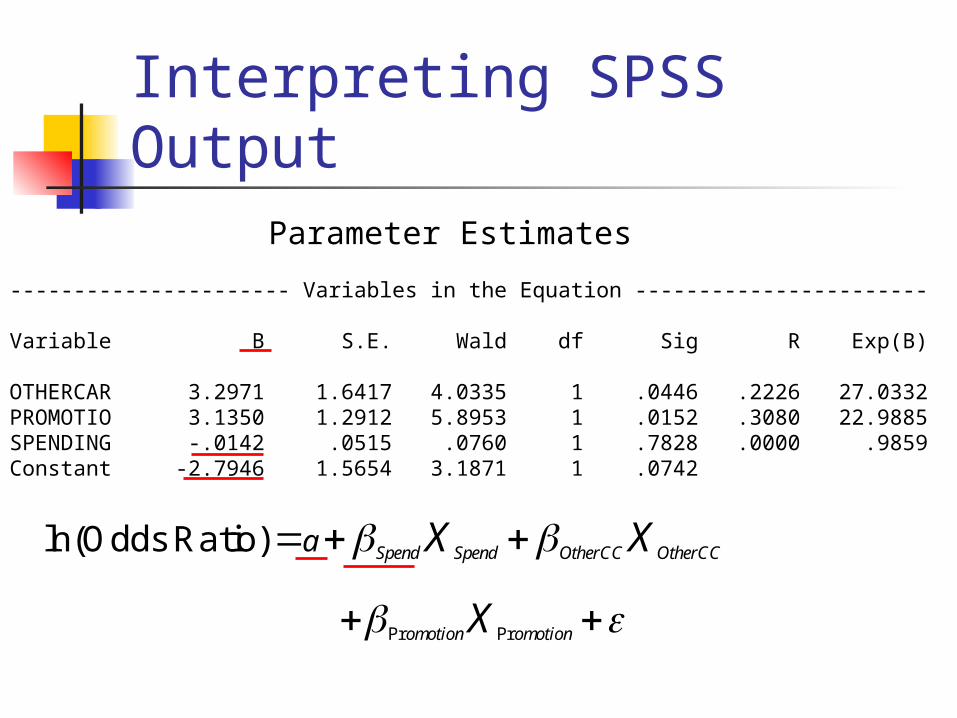
---------------------- Variables in the Equation ----------------------- Variable B S.E. Wald df Sig R Exp(B) OTHERCAR 3.2971 1.6417 4.0335 1 .0446 .2226 27.0332PROMOTIO 3.1350 1.2912 5.8953 1 .0152 .3080 22.9885SPENDING -.0142 .0515 .0760 1 .7828 .0000 .9859Constant -2.7946 1.5654 3.1871 1 .0742
Parameter Estimates
Spend Spend OtherCC OtherCCa X X ln(Odds Ratio)
Pr Promotion omotionX
Interpreting SPSS Output
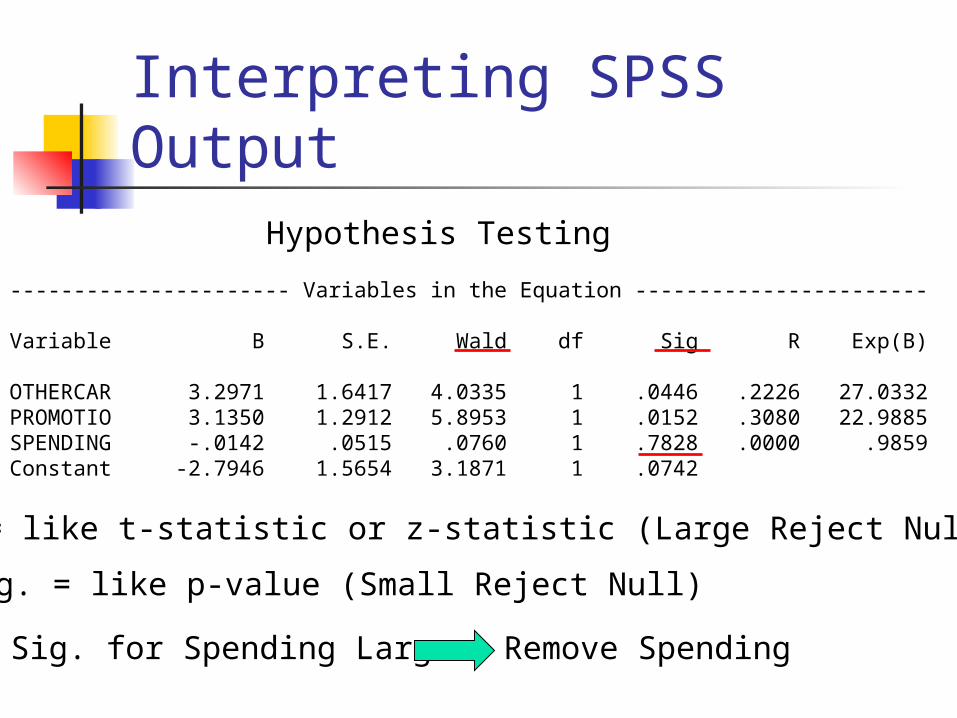
---------------------- Variables in the Equation ----------------------- Variable B S.E. Wald df Sig R Exp(B) OTHERCAR 3.2971 1.6417 4.0335 1 .0446 .2226 27.0332PROMOTIO 3.1350 1.2912 5.8953 1 .0152 .3080 22.9885SPENDING -.0142 .0515 .0760 1 .7828 .0000 .9859Constant -2.7946 1.5654 3.1871 1 .0742
Wald = like t-statistic or z-statistic (Large Reject Null)
Sig. = like p-value (Small Reject Null)
Hypothesis Testing
Sig. for Spending Large Remove Spending
Interpreting SPSS Output
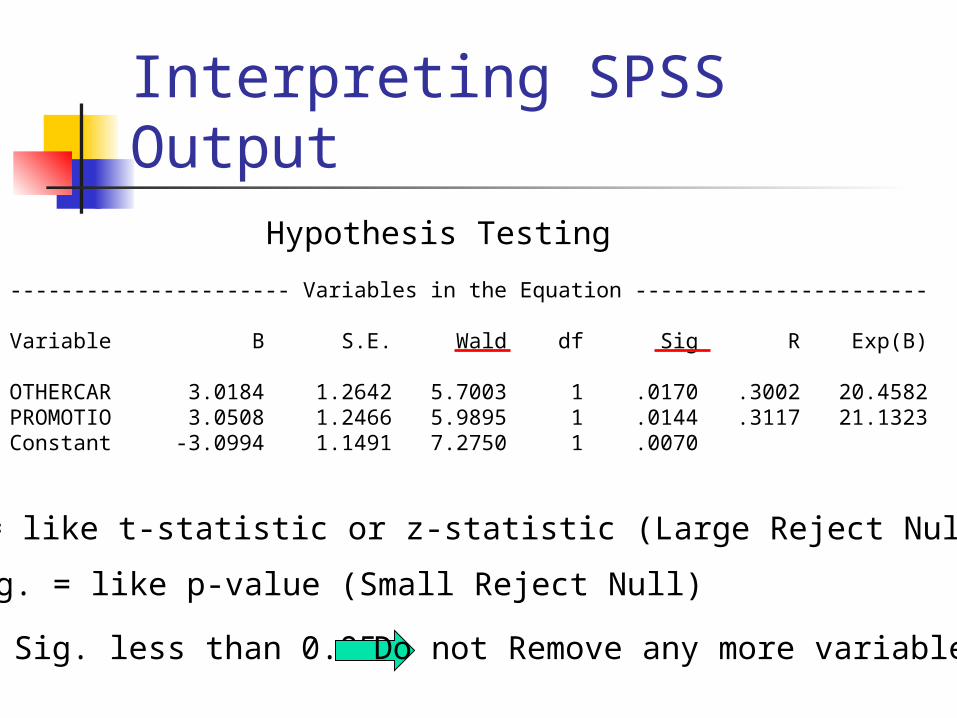
---------------------- Variables in the Equation ----------------------- Variable B S.E. Wald df Sig R Exp(B) OTHERCAR 3.0184 1.2642 5.7003 1 .0170 .3002 20.4582PROMOTIO 3.0508 1.2466 5.9895 1 .0144 .3117 21.1323Constant -3.0994 1.1491 7.2750 1 .0070
Wald = like t-statistic or z-statistic (Large Reject Null)
Sig. = like p-value (Small Reject Null)
Hypothesis Testing
Sig. less than 0.05 Do not Remove any more variables
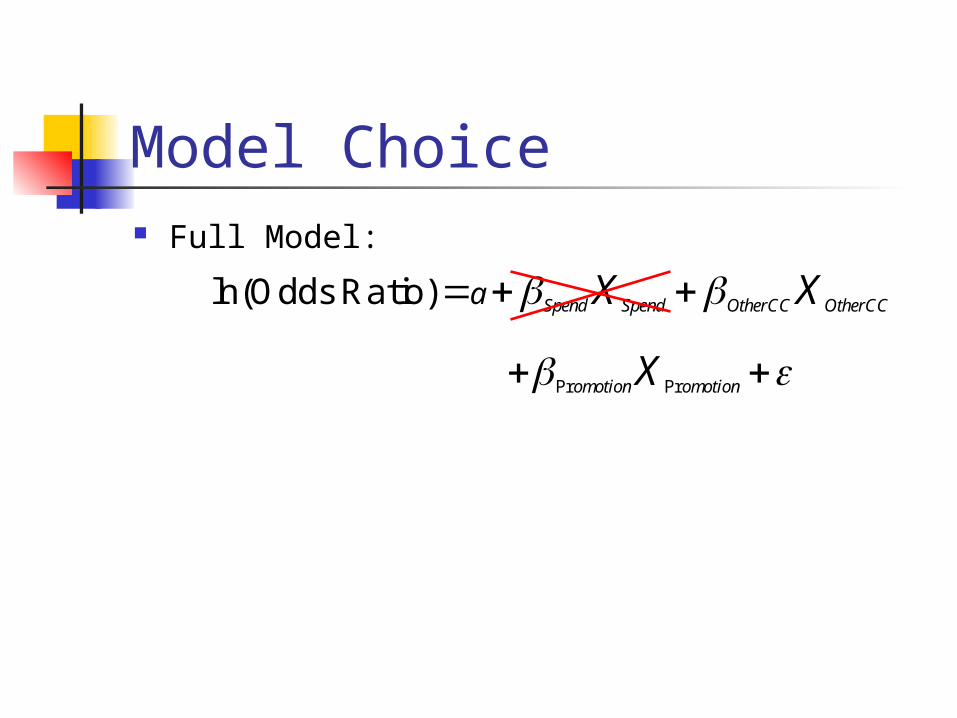
Model Choice Full Model:
Spend Spend OtherCC OtherCCa X X ln(Odds Ratio)
Pr Promotion omotionX
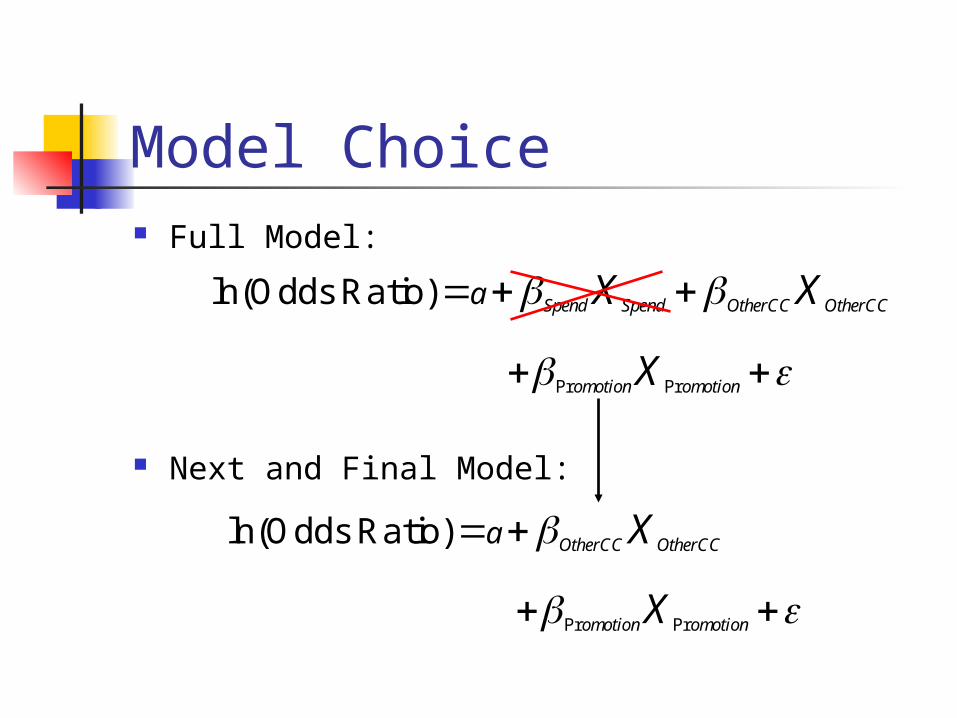
Model Choice Full Model:
Next and Final Model:
Spend Spend OtherCC OtherCCa X X ln(Odds Ratio)
Pr Promotion omotionX
OtherCC OtherCCa X ln(Odds Ratio)
Pr Promotion omotionX

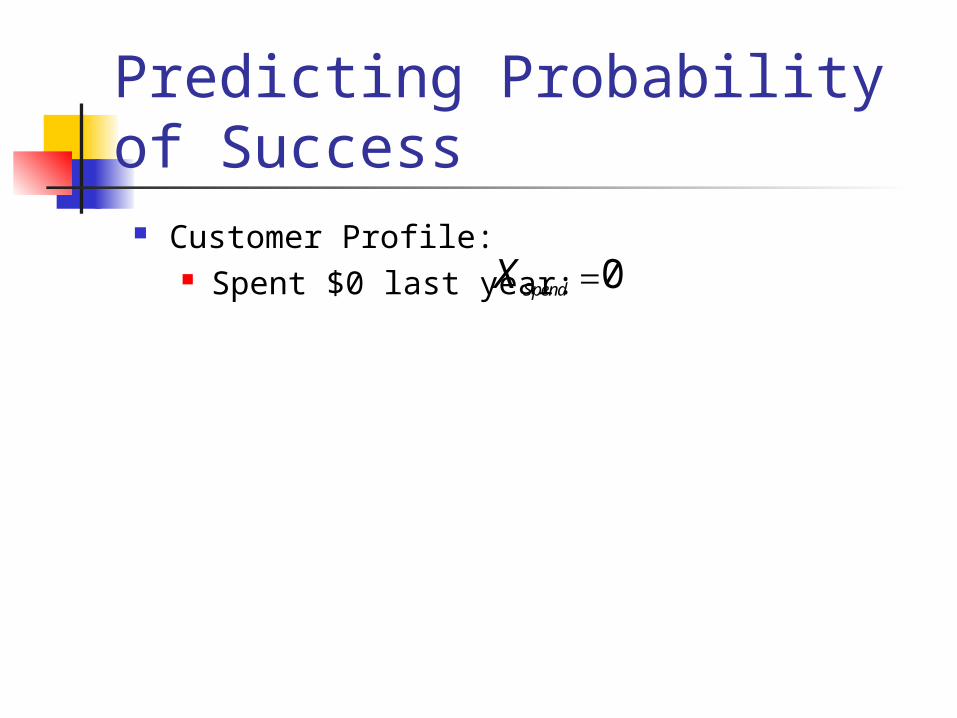
Predicting Probability of Success
Customer Profile: Spent $0 last year: 0SpendX
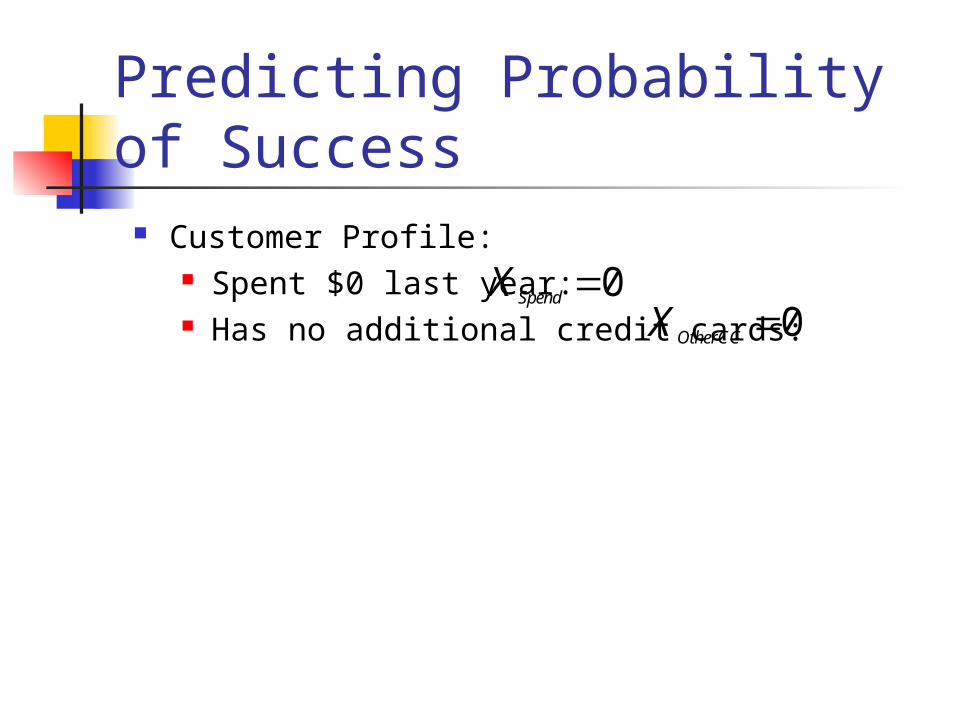
Predicting Probability of Success
Customer Profile: Spent $0 last year: Has no additional credit cards: 0OtherCCX
0SpendX
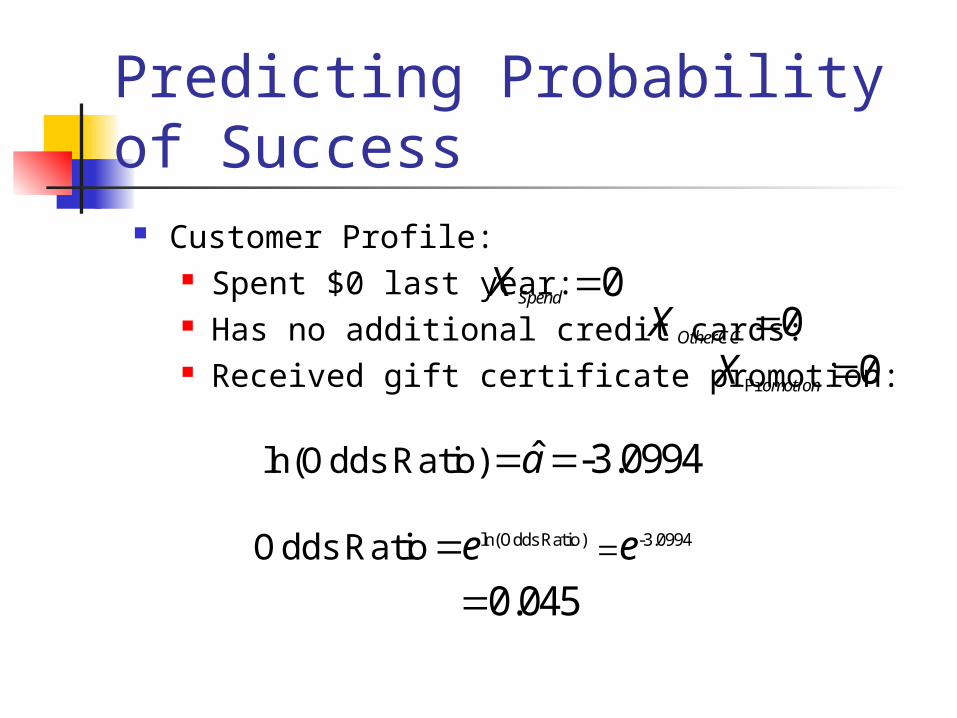
Predicting Probability of Success
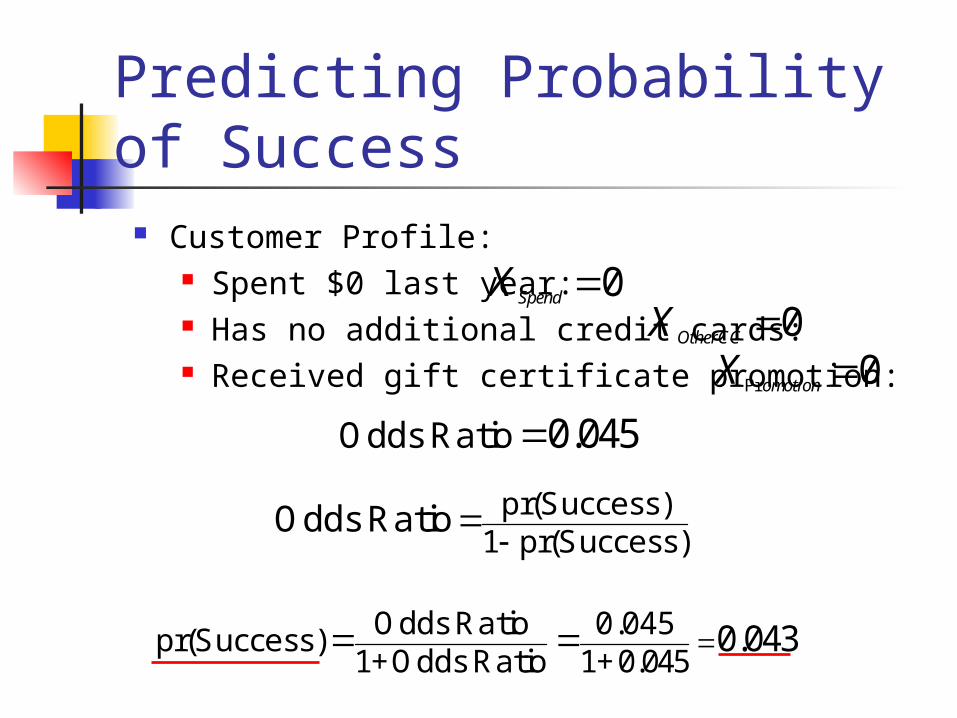
Customer Profile: Spent $0 last year: Has no additional credit cards: Received gift certificate promotion:
ˆ -3.0994a ln(Odds Ratio)
0OtherCCX 0SpendX
Pr 0omotionX
ln(Odds Ratio) -3.0994e eOdds Ratio
0.045
Predicting Probability of Success
Customer Profile: Spent $0 last year: Has no additional credit cards: Received gift certificate promotion:
0OtherCCX 0SpendX
Pr 0omotionX
0.045Odds Ratio
pr(Success)
1 pr(Success)Odds Ratio
Odds Ratiopr(Success)1+Odds Ratio 0.045
0.043 0.0451+
Predicting Probability of Success
Customer Profile: Spent $0 last year: 0SpendX
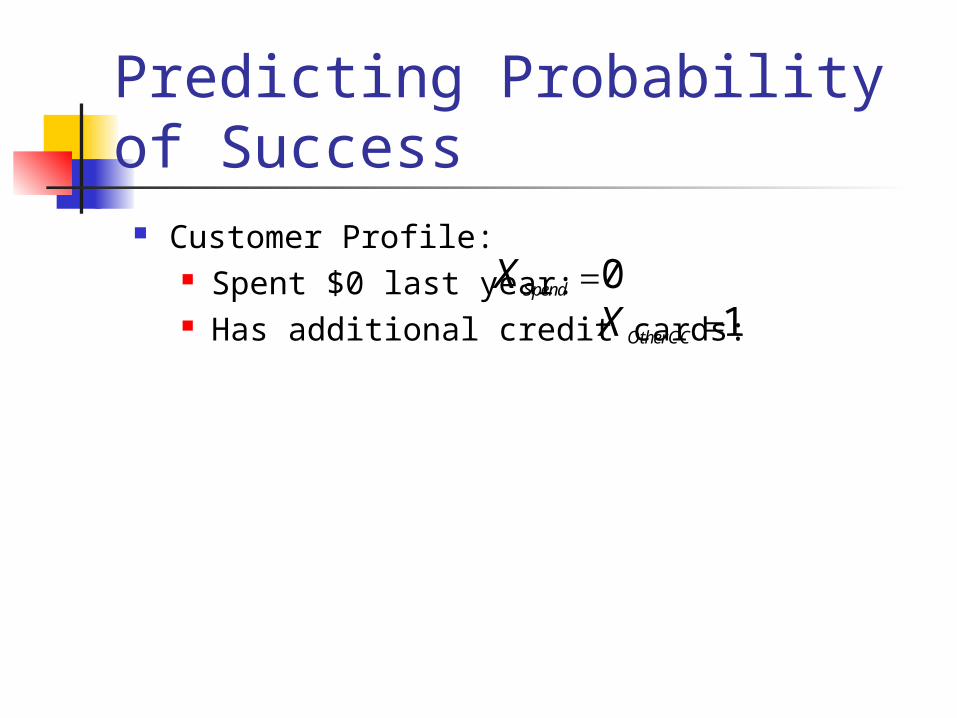
Predicting Probability of Success
Customer Profile: Spent $0 last year: Has additional credit cards: 1OtherCCX
0SpendX
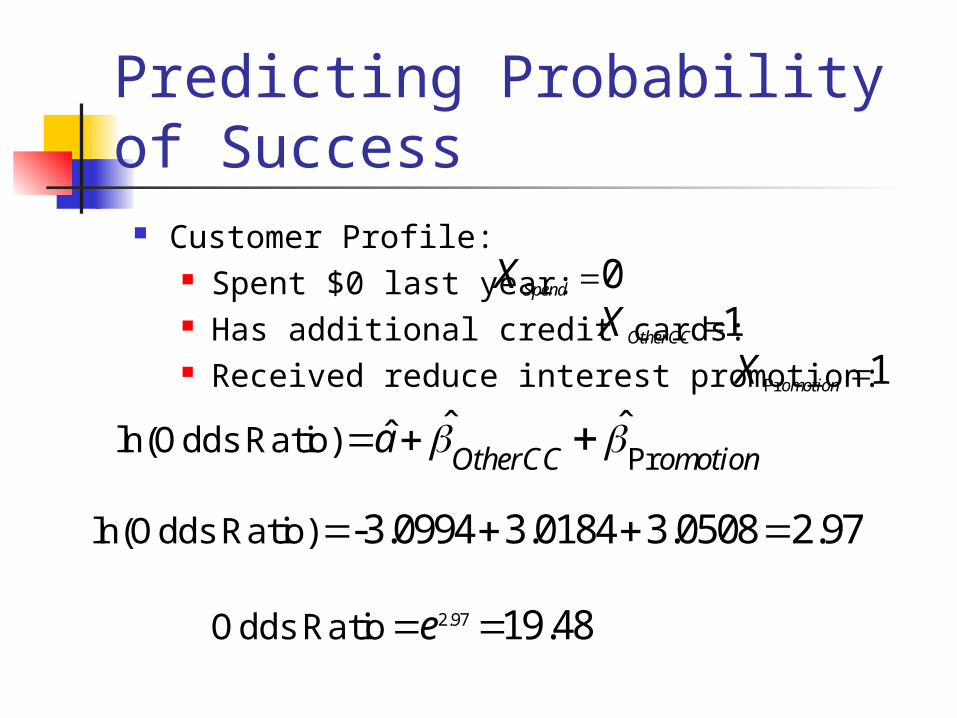
Predicting Probability of Success
Customer Profile: Spent $0 last year: Has additional credit cards: Received reduce interest promotion:
Prˆ ˆˆOtherCC omotion
a ln(Odds Ratio)
1OtherCCX
0SpendX
Pr 1omotionX
2.97eOdds Ratio 19.48
-3.0994 3.0184 3.0508 2.97 ln(Odds Ratio)
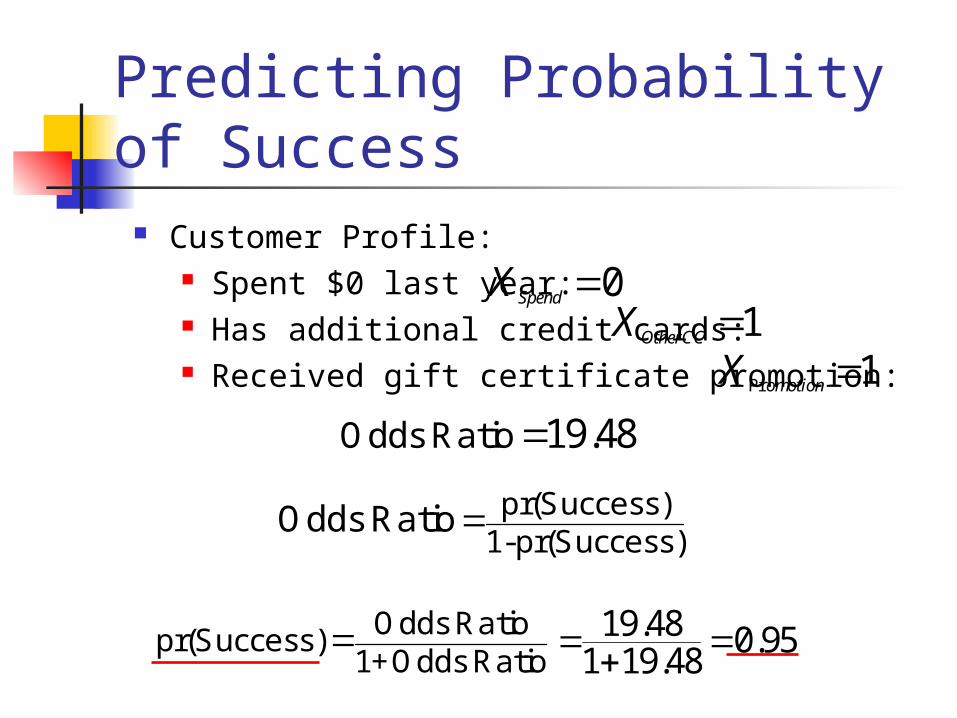
Predicting Probability of Success
Customer Profile: Spent $0 last year: Has additional credit cards: Received gift certificate promotion:
1OtherCCX 0SpendX
Pr 1omotionX
19.48Odds Ratio
pr(Success)1-pr(Success)
Odds Ratio
Odds Ratiopr(Success)1+Odds Ratio
19.48 0.951 19.48
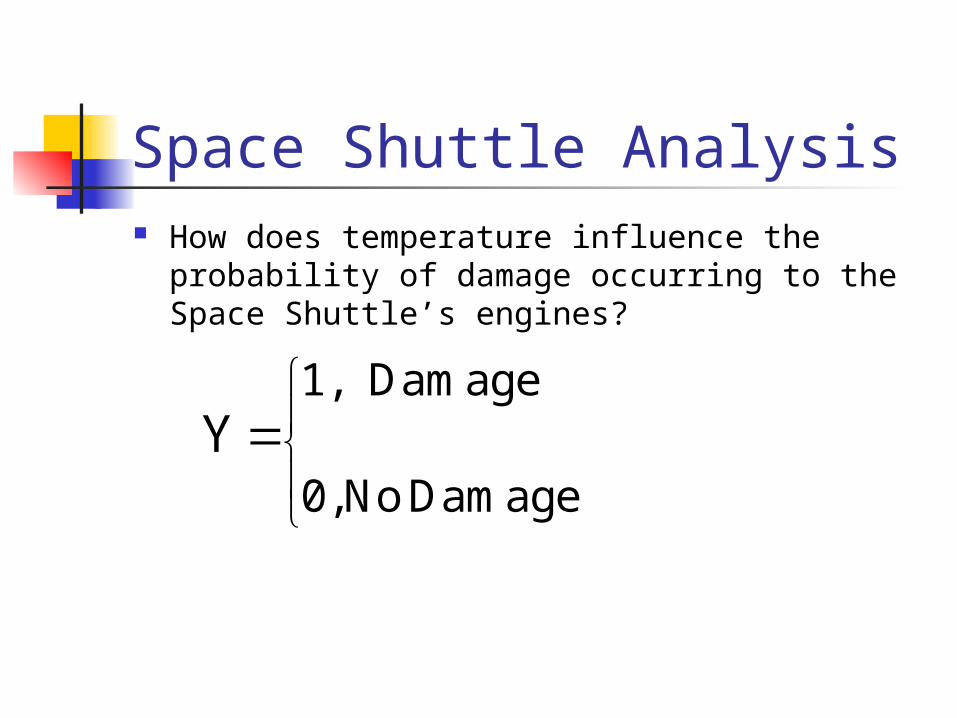
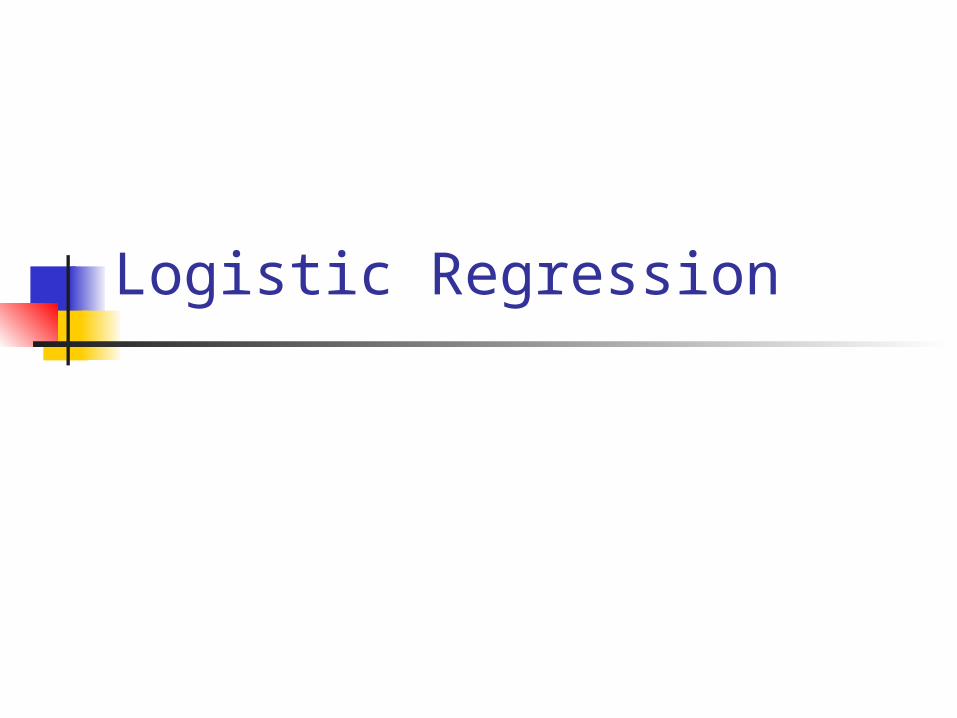
Space Shuttle Analysis How does temperature influence the
probability of damage occurring to the Space Shuttle’s engines?
1, Damage
0, No Damage Y
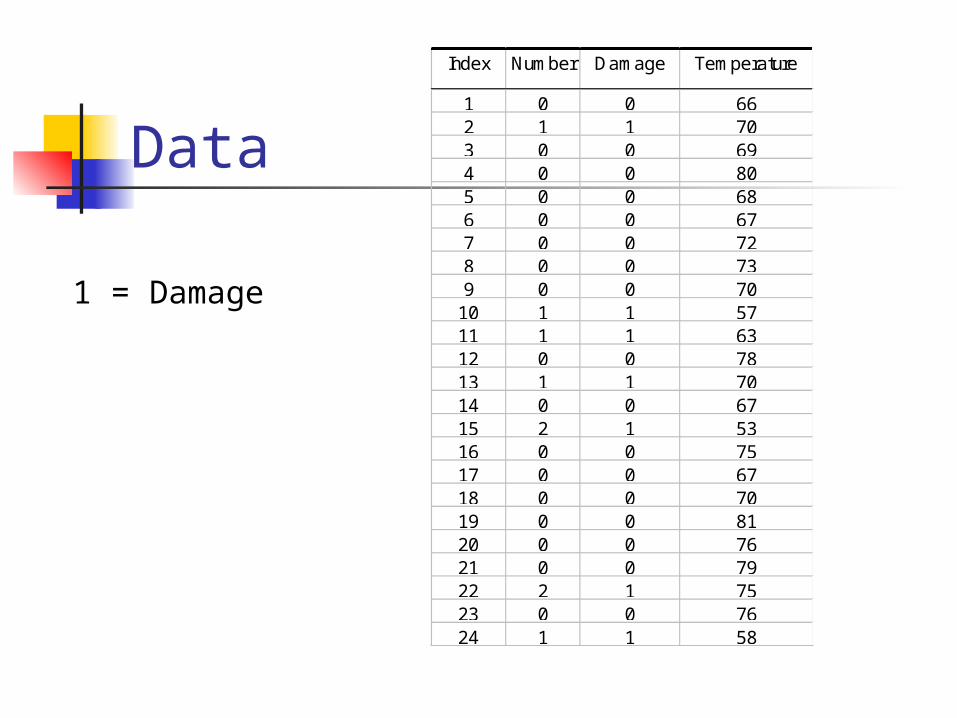
Data
Index Number Damage Temperature
1 0 0 662 1 1 703 0 0 694 0 0 805 0 0 686 0 0 677 0 0 728 0 0 739 0 0 70
10 1 1 5711 1 1 6312 0 0 7813 1 1 7014 0 0 6715 2 1 5316 0 0 7517 0 0 6718 0 0 7019 0 0 8120 0 0 7621 0 0 7922 2 1 7523 0 0 7624 1 1 58
1 = Damage
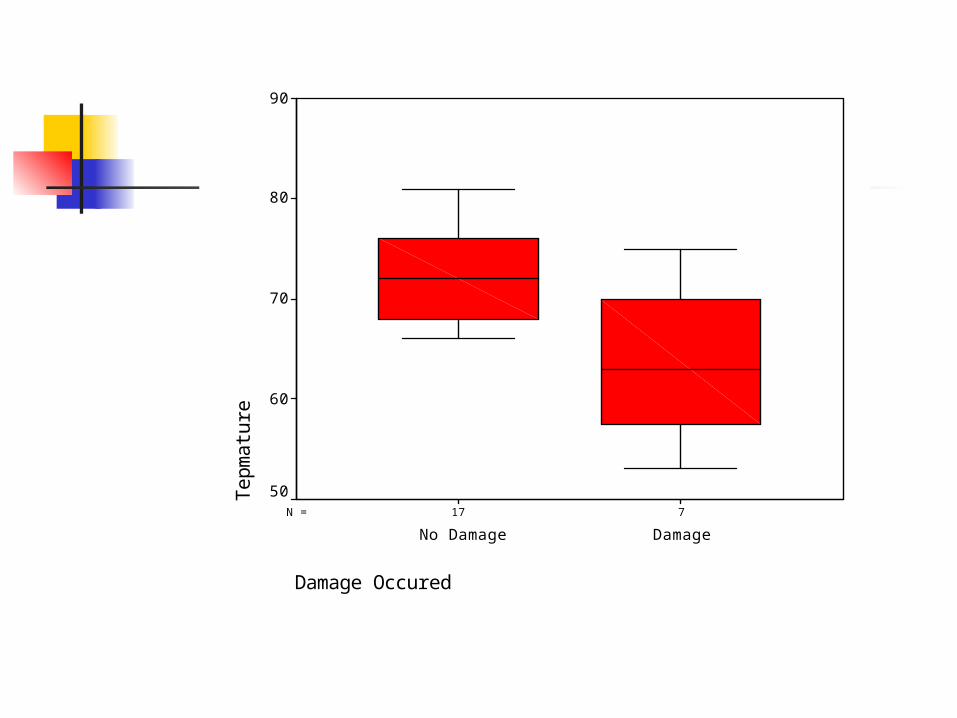
717N =
Damage Occured
DamageNo Damage
Tep
ma
ture
90
80
70
60
50
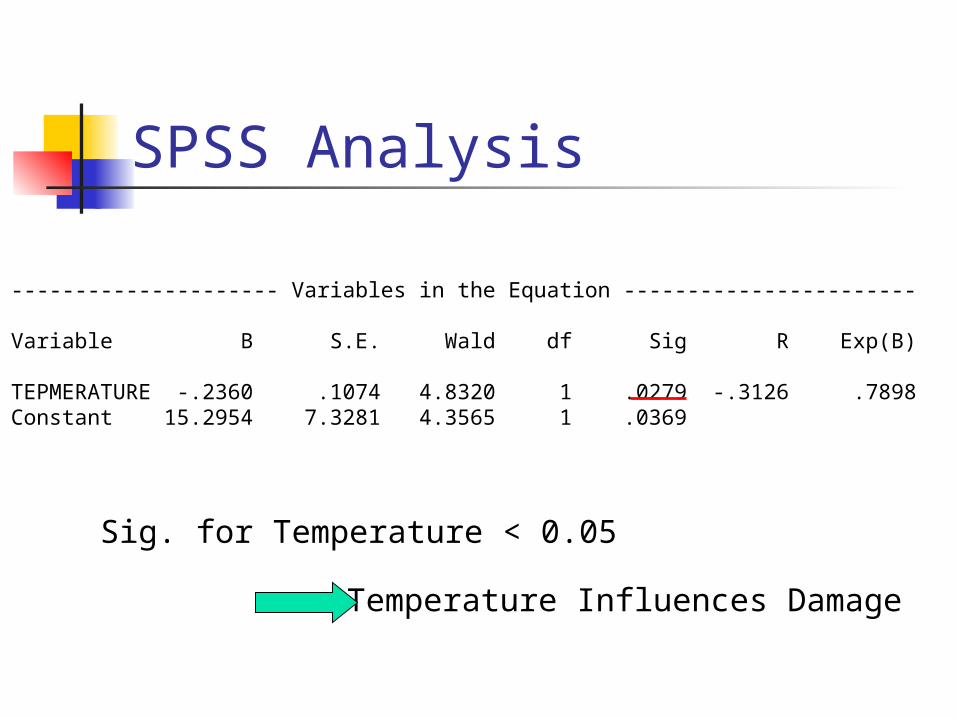
SPSS Analysis
--------------------- Variables in the Equation ----------------------- Variable B S.E. Wald df Sig R Exp(B) TEPMERATURE -.2360 .1074 4.8320 1 .0279 -.3126 .7898Constant 15.2954 7.3281 4.3565 1 .0369
Sig. for Temperature < 0.05
Temperature Influences Damage
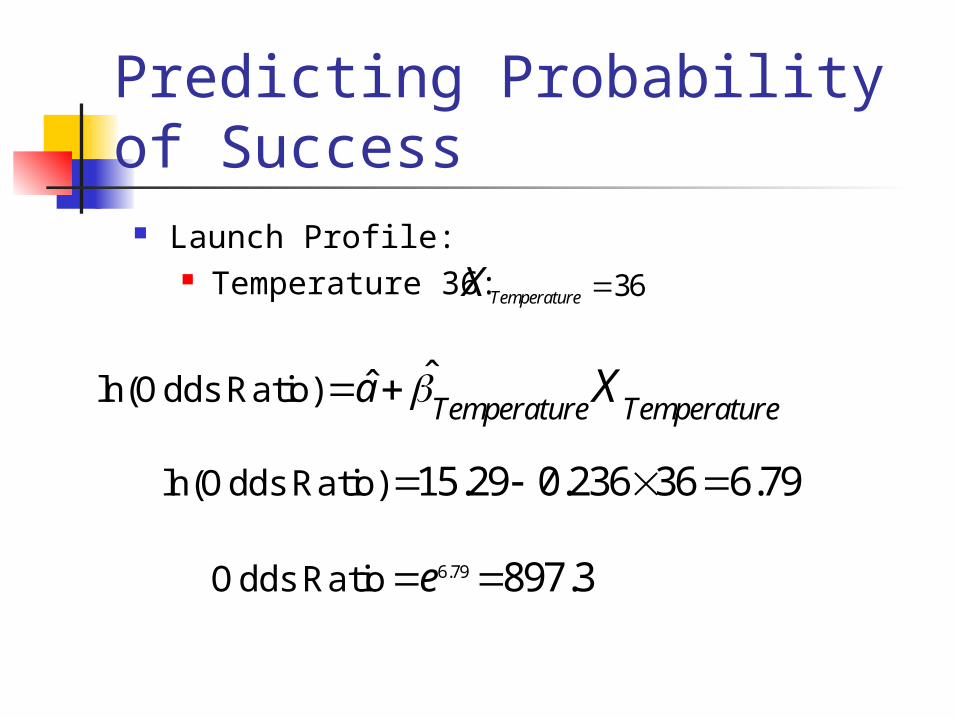
Predicting Probability of Success
Launch Profile: Temperature 36:
ˆˆTemperature Temperature
a X ln(Odds Ratio)
36TemperatureX
6.79eOdds Ratio 897.3
15.29 0.236 36 6.79 ln(Odds Ratio)
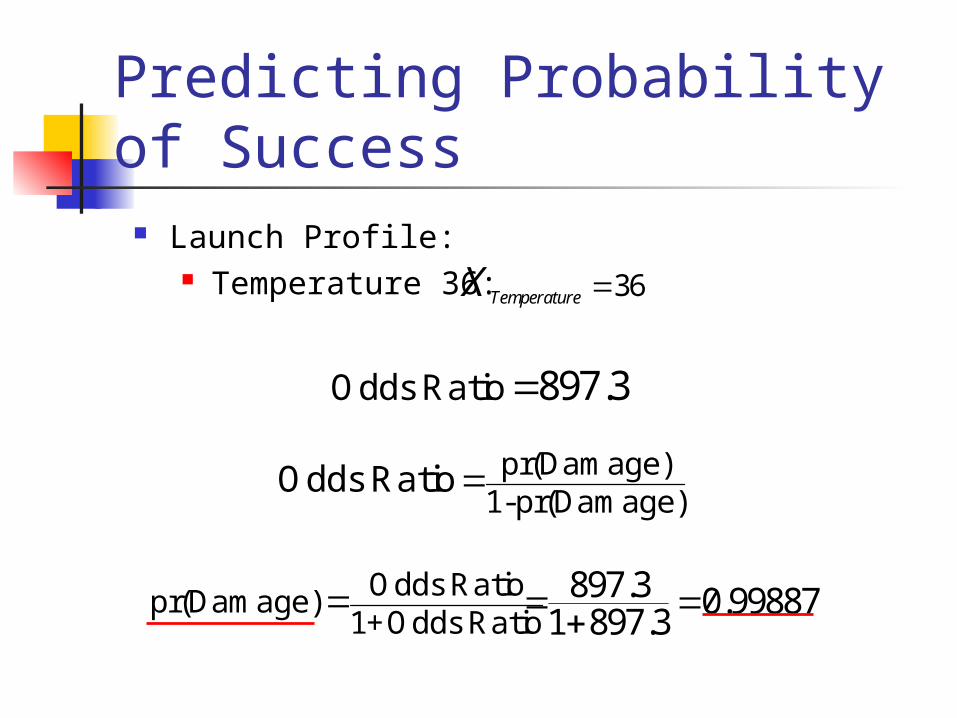
Predicting Probability of Success
Launch Profile: Temperature 36:
897.3Odds Ratio
pr(Damage)1-pr(Damage)
Odds Ratio
Odds Ratiopr(Damage)1+Odds Ratio
897.3 0.998871 897.3
36TemperatureX