Embed Size (px)
Citation preview

Dr. David Luke Oates, REsurety / Dr. Kathleen Spees, The Brattle Group
A Force Multiplier for the Carbon Impact of Clean
Energy Programs
LocationalMarginal
Emissions

1
Many large corporations are announcing commitments to combat climate change, often including ambitious net-zero or net-negative carbon goals for their operations. As they seek to reduce their carbon footprints, many of these organizations deploy wind and solar generation resources to offset their electricity consumption. In the U.S. alone, corporations announced over 10.6 GW of new clean power contracts in 2020 (31 GW total over the past five years), dominating the offtake market for renewable energy. 1 While the impressive growth in clean energy development is an encouraging signal that we can tackle the harms of greenhouse gases and climate change, we should remember that clean energy deployment itself is not the ultimate goal. Tracking environmental goals in traditional units of MWh of clean energy is an outdated and imprecise approach that does not measure the carbon emissions reductions actually achieved. For example, clean resources in locations where high-emitting fossil plants cannot be retired for reliability reasons have high carbon abatement value, as do clean resources whose output aligns with times of high emissions intensity on the grid. Batteries and hybrid resources that can shape clean energy injection to maximize carbon abatement can also provide decarbonization benefits that are ignored by traditional MWh-based accounting.
There is a better way to measure and incentivize clean energy resources. We propose that customers, markets, and policymakers embrace the concept of “Locational Marginal Emissions” (LMEs) as a force multiplier for directing their clean energy program dollars to maximize carbon impact. In our 2-year analysis of renewable energy projects across Texas, we found that directing clean energy deployment to the highest-value renewable projects has the potential to double the carbon impact as compared to a more traditional annual energy matching approach. Setting goals and measuring performance using carbon-based metrics can help organizations select generation technologies, make siting decisions, and operate resources to minimize their carbon footprint.
What are Locational Marginal Emissions?
The LME is a metric that measures the tons of carbon emissions displaced by 1 MWh of clean energy injected to the grid at a specific location and a specific point in time. LMEs are calculated at each power system node in a manner very similar to the Locational Marginal Prices (LMPs) used to set wholesale electricity market prices. LMEs measure emissions by identifying the marginal generators: the generators that would have been producing energy but for the renewable injection to the grid at that location at that moment.2 If the renewable resource can displace output from a coal plant, the LME would reflect a high carbon impact of the clean energy injection; if the renewable resource is injecting power in an oversaturated region where renewables are already being curtailed, the LME would show a low or zero carbon impact from the clean energy injection.
Timing, location, the physics of the power grid, and power market economics all affect the carbon abatement value of different clean energy projects. Accurate measurement of LMEs reflect all of these drivers, unlocking the potential for granular carbon-based decision making for consumers, project developers, and policymakers. While the full potential of LMEs has previously been limited by unreliable or unavailable data,3 REsurety’s new LME calculation technology eliminates this barrier, providing unprecedented insight into the carbon abatement value of renewable energy projects.
1 Renewable Energy Buyers Alliance Deal Tracker, https://rebuyers.org/deal-tracker/ 2 Marginal emissions are sometimes referred to as avoided emissions or displaced emissions.3 Google, 24/7 Carbon-Free Energy: Methodologies and Metrics, Section 5. d.
About REsurety
REsurety is the leading analytics company supporting the clean energy economy and is rapidly changing the way renewable energy is bought and sold across the globe. REsurety empowers industry decision makers with best-in-class value and risk intelligence. Operating at the intersection of physical science, big data, and financial modeling, REsurety has built unrivaled databases and analytical systems that enable a more precise understanding of the value and risk of intermittent power generation.
For more information, please visit
resurety.com.
About Brattle
The Brattle Group answers complex economic, finance, and regulatory questions for corporations, law firms, and governments around the world. We are distinguished by the clarity of our insights and the credibility of our experts, which include leading international academics and industry specialists. Brattle has over 400 talented professionals across three continents.
For more information, please visit brattle.com.

2
Why do different renewable projects offer different carbon abatement value?
To illustrate how LMEs account for drivers of carbon abatement, we compare a real-world example of two seemingly interchangeable solar projects in the Electric Reliability Council of Texas (ERCOT) Far West. The projects use the same technology, have (almost) the same generation profile, are located only 40 miles from each other, and (likely) have similar development costs. A company choosing between these two solar projects on the basis of cost alone
Figure 1 illustrates how the more advantageous positioning of Solar 1 on the grid achieves a much higher LME than Solar 2 on a typical day in June 2018. At the beginning and end of the day, sufficient transmission is available to deliver both solar projects equally to customers such that both projects have the same ability to displace fossil plants. However, in the middle of the day when the grid becomes congested, only Solar 1 is fully deliverable to customers and fully able to displace the high-emitting fossil resources that would otherwise generate the needed electricity.4
A similar effect reoccurs in a daily pattern that, over the course of the year, means that Solar 1 offers double the carbon displacement value of Solar 2. Wholesale power markets already recognize the impacts of transmission to drive different energy market prices between these two points on the grid, but without the benefit of the LME metric there has been no means to measure the differences in carbon impact of these two resources.
would view them as offering identical value contribution toward their sustainability goals. A company selecting projects in consideration of LMEs would see the opportunity to more than double the carbon impact its clean energy contracting by selecting Solar 1 (at an LME of more than 0.5 ton/MWh over the two-year period 2018-19) rather than Solar 2 (at an LME rate of about 0.25 ton/MWh).
Notes: Figure shows hourly LMEs for two solar facilities on June 13, 2018. Both facilities are located in ERCOT’s Far West, on either side of a binding transmission constraint.
Figure 1: Large Differences in LME Between Seemingly Interchangeable Solar Projects LME of Two Solar Projects in Texas Across an Example Day
4 More precisely, during the first few hours of the day, LMEs for the two facilities are equal, varying between about 0.4 ton/MWh to 0.7 ton/MWh with a mix of coal and gas resources marginal for the whole system. But between 8 AM and 7 PM, a transmission constraint drives the LMEs of the two facilities apart. During these hours, Solar 2 is in a transmission-constrained pocket with excess solar generation. Due to the constraint, incremental output from Solar 2 displaces (curtailed) solar resources rather than coal or gas. In contrast, Solar 1 is located on the other side of the constraint and its output is able to displace fossil generation. In fact, incremental generation from Solar 1 counter-flows the transmission constraint, allowing some of the curtailed solar to be ramped up and displacing even more fossil generation.

How much do Locational Marginal Emissions vary across different renewable projects?
To evaluate the scale of impacts that LME-based clean energy procurement could have on carbon, we assessed the differences in carbon value that could be achieved by contracting with different renewable resources across the entire ERCOT footprint. Figure 2 shows the range of 2018-19 generation-weighted average LMEs for solar and wind projects, with the spread driven by both location and generation timing. Projects located with ready access to transmission can often displace dirtier resources and have higher LMEs. Projects whose generation profiles peak when LMEs are highest have greater carbon impact over time. The figure shows that two-year carbon impact differs by a factor of two between projects with the highest and lowest LME abatements.
In some cases, LME differences are large enough to justify a premium for projects and locations that offer outsized carbon abatement opportunity. In other cases, buyers could consider carbon abatement rates that could be considered as a “tie breaker” for otherwise similar offtake opportunities. Perhaps surprisingly, this analysis does not suggest that wind is always better than solar (or solar always better than wind) at displacing carbon emissions. It does suggest however, that selecting the right wind or the right solar projects can have a tremendous impact on carbon.
3
Notes: Figure shows the 2018-19 generation-weighted average Locational Marginal Emissions abatement delivered by solar and wind resources operating in the ERCOT market during the entire period.
Figure 2: Contracting with Higher-LME Resources Could Double the Carbon Impact Average LME of Renewables Across the ERCOT Market

4
We further evaluated the locations of projects with the highest and lowest LMEs across ERCOT, as shown in Figure 3. The figure shows that wind resources bottled in the panhandle have less carbon impact than those located closer to load centers in the South East. Local congestion in the Far West tends to reduce the carbon impact of projects whose output aggravates the congestion while boosting the impact of projects that mitigate it. The figure also shows several examples of projects located close together, but where differences in generation profile and transmission conditions drive substantial differences in carbon impacts.
Figure 3: Renewable Project Siting Can Drive Substantial Differences in Carbon Abatement
Notes: Figure shows the 2018-19 generation-weighted average Locational Marginal Emissions for wind and solar resources in ERCOT.
5
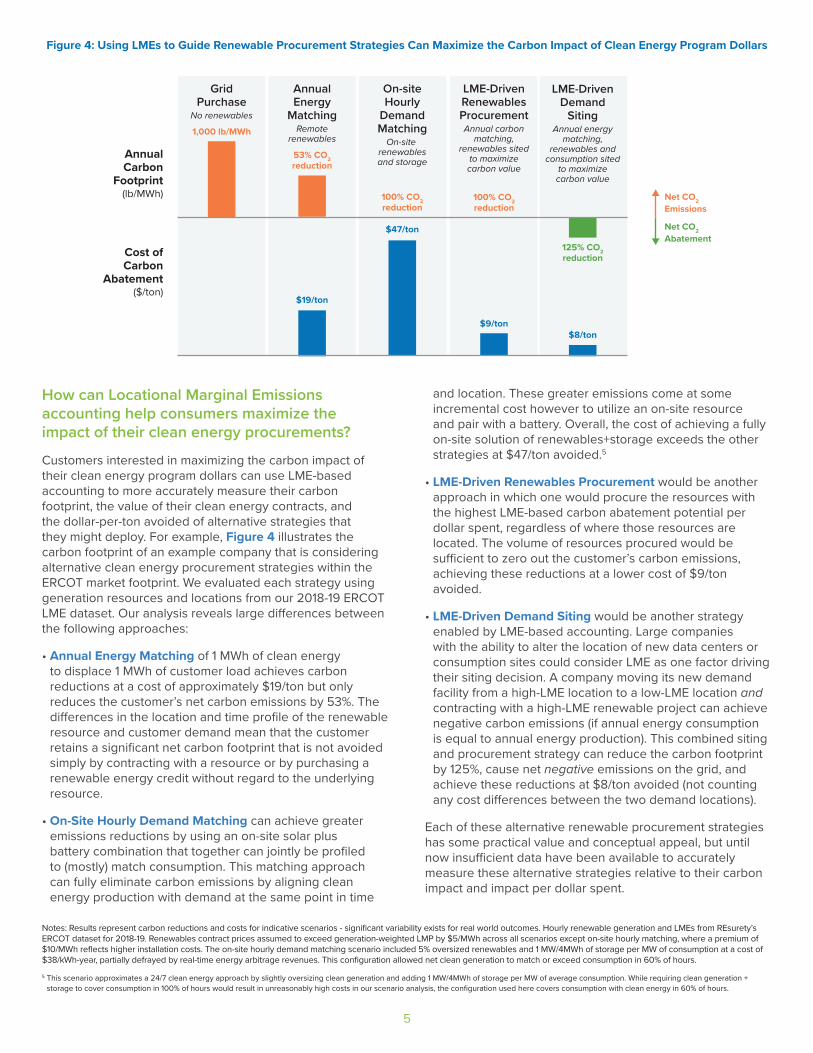
How can Locational Marginal Emissions accounting help consumers maximize the impact of their clean energy procurements?
Customers interested in maximizing the carbon impact of their clean energy program dollars can use LME-based accounting to more accurately measure their carbon footprint, the value of their clean energy contracts, and the dollar-per-ton avoided of alternative strategies that they might deploy. For example, Figure 4 illustrates the carbon footprint of an example company that is considering alternative clean energy procurement strategies within the ERCOT market footprint. We evaluated each strategy using generation resources and locations from our 2018-19 ERCOT LME dataset. Our analysis reveals large differences between the following approaches:
• Annual Energy Matching of 1 MWh of clean energy to displace 1 MWh of customer load achieves carbon reductions at a cost of approximately $19/ton but only reduces the customer’s net carbon emissions by 53%. The differences in the location and time profile of the renewable resource and customer demand mean that the customer retains a significant net carbon footprint that is not avoided simply by contracting with a resource or by purchasing a renewable energy credit without regard to the underlying resource.
• On-Site Hourly Demand Matching can achieve greater emissions reductions by using an on-site solar plus battery combination that together can jointly be profiled to (mostly) match consumption. This matching approach can fully eliminate carbon emissions by aligning clean energy production with demand at the same point in time
and location. These greater emissions come at some incremental cost however to utilize an on-site resource and pair with a battery. Overall, the cost of achieving a fully on-site solution of renewables+storage exceeds the other strategies at $47/ton avoided.5
• LME-Driven Renewables Procurement would be another approach in which one would procure the resources with the highest LME-based carbon abatement potential per dollar spent, regardless of where those resources are located. The volume of resources procured would be sufficient to zero out the customer’s carbon emissions, achieving these reductions at a lower cost of $9/ton avoided.
• LME-Driven Demand Siting would be another strategy enabled by LME-based accounting. Large companies with the ability to alter the location of new data centers or consumption sites could consider LME as one factor driving their siting decision. A company moving its new demand facility from a high-LME location to a low-LME location and contracting with a high-LME renewable project can achieve negative carbon emissions (if annual energy consumption is equal to annual energy production). This combined siting and procurement strategy can reduce the carbon footprint by 125%, cause net negative emissions on the grid, and achieve these reductions at $8/ton avoided (not counting any cost differences between the two demand locations).
Each of these alternative renewable procurement strategies has some practical value and conceptual appeal, but until now insufficient data have been available to accurately measure these alternative strategies relative to their carbon impact and impact per dollar spent.
Notes: Results represent carbon reductions and costs for indicative scenarios - significant variability exists for real world outcomes. Hourly renewable generation and LMEs from REsurety’s ERCOT dataset for 2018-19. Renewables contract prices assumed to exceed generation-weighted LMP by $5/MWh across all scenarios except on-site hourly matching, where a premium of $10/MWh reflects higher installation costs. The on-site hourly demand matching scenario included 5% oversized renewables and 1 MW/4MWh of storage per MW of consumption at a cost of $38/kWh-year, partially defrayed by real-time energy arbitrage revenues. This configuration allowed net clean generation to match or exceed consumption in 60% of hours.
Figure 4: Using LMEs to Guide Renewable Procurement Strategies Can Maximize the Carbon Impact of Clean Energy Program Dollars
5 This scenario approximates a 24/7 clean energy approach by slightly oversizing clean generation and adding 1 MW/4MWh of storage per MW of average consumption. While requiring clean generation + storage to cover consumption in 100% of hours would result in unreasonably high costs in our scenario analysis, the configuration used here covers consumption with clean energy in 60% of hours.

6
About the Authors
Dr. David Luke Oates is REsurety’s Vice President of Power Markets Research. He develops analytical tools to address customers’ needs by combining expertise in wholesale electricity markets with optimization and statistical methods.
Dr. Kathleen Spees is a Principal and Board member of The Brattle Group with expertise in wholesale electricity markets and environmental policy design. She supports policy makers and grid operators in developing the next stage of markets and policies to drive electricity sector decarbonization, enable emerging technologies, and deliver reliable power at affordable costs.
LMEs Can Amplify the Impact of Clean Energy Programs
The scale of the de-carbonization challenge ahead of us is daunting. Fortunately, governments, the public sector, and many corporations are increasingly rising to the challenge by setting ambitious targets and following through with action. As we enter the next phase of climate mitigation efforts, we recommend adopting a more robust means of measuring the impact of program choices through the use of LMEs. Relative to the status quo, LMEs enable:
• Better generation technology selection: LMEs highlight the relative carbon abatement value of wind, solar, and other clean energy resources.
• Better siting decisions: LMEs reflect the impact of transmission congestion on carbon emissions and can be used to support granular siting decisions for both clean generation and demand centers.
• Accurate assessment of the carbon value of energy storage: High time-granularity LMEs can accurately evaluate the carbon benefits of energy storage that charges when emissions intensities are low and discharges when emissions intensities are high.
• Better clean energy procurements: LMEs can be used to create “dynamic” Renewable Energy Credit markets, ensuring that each ratepayer dollar achieves maximum carbon benefit.6
• Alignment of interest between investors and power system operators: By highlighting the limited carbon value of clean generation projects in export-constrained regions, LMEs discourage investment that will exacerbate congestion.
• Higher overall carbon abatement per dollar: LMEs support calculation of carbon abatement cost effectiveness metrics for candidate clean energy projects, enabling investors, consumers, and policymakers to maximize the carbon impact of their clean energy program dollars.
• More accurate accounting of carbon footprint for companies that have committed to doing so.
In short, better information about the carbon impacts of clean generation and consumption can help ensure that de-carbonization investments are cost-effective and do not have unintended consequences for the grid. We hope that REsurety’s LME technology can provide this improved information and play a role in building the power system of the future.
6 Spees et al., How States, Cities, and Customers Can Harness Competitive Markets to Meet Ambitious Carbon Goals Through a Forward Market for Clean Energy Attributes, The Brattle Group, September 2019, Prepared for NRG, Appendix H.1
Are you a clean energy developer or buyer looking for high quality carbon data?
Contact REsurety at [email protected]
Interested in considering marginal carbon impacts of system or policy design?
Contact Brattle at [email protected]