Embed Size (px)
Citation preview

Location Models in Humanitarian Logistics Dissertação apresentada para a obtenção do grau de Mestre em Engenharia Civil na
Especialidade de Urbanismo, Transportes e Vias de Comunicação
Autor
Diogo Rafael dos Santos Forte Orientador
Miguel Gueifão Santos
Esta dissertação é da exclusiva responsabilidade do seu
autor, não tendo sofrido correções após a defesa em
provas públicas. O Departamento de Engenharia Civil da
FCTUC declina qualquer responsabilidade pelo uso da
informação apresentada
Coimbra, Junho, 2014

Location Models in Humanitarian Logistics ACKNOWLEDGEMENTS
Diogo Rafael dos Santos Forte i
ACKNOWLEDGEMENTS
I would like to thank my advisor Prof. Dr. Miguel Gueifão Santos for making this opportunity
possible. Furthermore, I would like to express my gratitude towards his guidance, corrections
and knowledge provided not only in this project but throughout this last academic year of
studies. I would like to state that without his contribution, the conclusion of this thesis would
not have been possible.
I also would like to express my gratitude to the Civil Engineering Department of the University
of Coimbra and to the Rzeszow University of Technology for the tools and knowledge provided
during the last five years and for allowing me to feel ready to embrace new challenges. To my
friends, a special thanks for the help during the long work hours and for the good moments.
I want to thank my parents for their unconditional support throughout my entire life, for
believing in me, for accepting every choice I made and above all else, for their love. Without
their encouragement and sacrifice, this project would not have been possible.
Last but not least, I want to thank my girlfriend, Natacha Rodrigues, for being my companion,
for always supporting and understanding me, for your unconditional love and most importantly,
for making me feel as happy and as fulfilled as anyone can be.

Location Models in Humanitarian Logistics RESUMO
Diogo Rafael dos Santos Forte ii
RESUMO
Logística humanitária designa o processo de planeamento, gestão e controlo dos recursos
necessários ao socorro de pessoas afetadas por desastres naturais ou causados pela ação
humana. A literatura em logística humanitária é extensa, em particular a baseada em técnicas
de otimização. Os primeiros modelos de otimização para a resolução de problemas de logística
humanitária foram desenvolvidos nos anos 1960s e 1970s, e a partir dos anos 1980s o número
de modelos desenvolvidos cresceu rapidamente. A literatura em logística humanitária
desenvolve-se em dois ramos, dependendo de se considerarem as operações antes ou depois do
impacto do desastre, designadas respetivamente por operações pré-desastre e pós-desastre. No
âmbito desta dissertação, são estudados alguns modelos de otimização desenvolvidos para o
planeamento de operações de logística humanitária em situações de pré-desastre. Os modelos
estudados abordam problemas de evacuação (localização de abrigos) e de distribuição de
recursos (localização de centros de distribuição) durante situações de desastre. A aplicabilidade
dos modelos é analisada através da sua implementação para a resolução de problemas
hipotéticos.

Location Models in Humanitarian Logistics ABSTRACT
Diogo Rafael dos Santos Forte iii
ABSTRACT
Humanitarian Logistics consists in the process of planning, managing and controlling resources
needed to help people affected by natural disasters or by disasters caused by human activity.
The literature on humanitarian logistics is extensive, particularly the one based on optimization
techniques. The first optimization models to solve humanitarian logistics problems of were
developed in the 1960s and 1970s, and since the 1980s the number of models developed grew
rapidly. The literature on humanitarian logistics is developed into two branches, depending on
whether they consider emergency operations before or after the impact of a disaster, designated
respectively by pre-disaster and post-disaster operations. Within the context of this dissertation,
we studied some optimization models developed for the planning of humanitarian logistics
operations in pre-disaster situations. Models which were studied within this dissertation address
the issues of evacuation (locating shelters) and resource distribution (location of distribution
centers) during disaster situations. The applicability of the models is analyzed through its
implementation for solving hypothetical instances.
Location Models in Humanitarian Logistics TABLE OF CONTENTS
Diogo Rafael dos Santos Forte iv
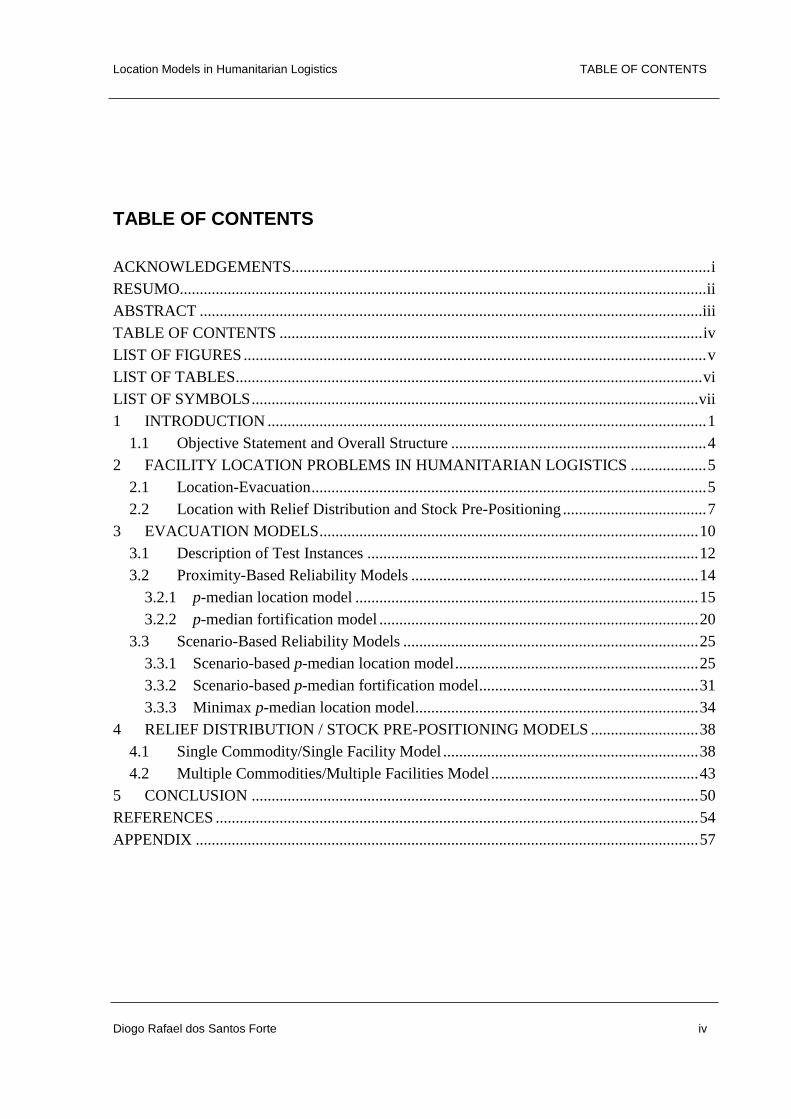
TABLE OF CONTENTS
ACKNOWLEDGEMENTS......................................................................................................... i
RESUMO.................................................................................................................................... ii
ABSTRACT ..............................................................................................................................iii
TABLE OF CONTENTS .......................................................................................................... iv
LIST OF FIGURES .................................................................................................................... v
LIST OF TABLES..................................................................................................................... vi
LIST OF SYMBOLS ................................................................................................................ vii
1 INTRODUCTION .............................................................................................................. 1
1.1 Objective Statement and Overall Structure ................................................................ 4
2 FACILITY LOCATION PROBLEMS IN HUMANITARIAN LOGISTICS ................... 5
2.1 Location-Evacuation ................................................................................................... 5
2.2 Location with Relief Distribution and Stock Pre-Positioning .................................... 7
3 EVACUATION MODELS ............................................................................................... 10
3.1 Description of Test Instances ................................................................................... 12
3.2 Proximity-Based Reliability Models ........................................................................ 14
3.2.1 p-median location model ...................................................................................... 15
3.2.2 p-median fortification model ................................................................................ 20
3.3 Scenario-Based Reliability Models .......................................................................... 25
3.3.1 Scenario-based p-median location model ............................................................. 25
3.3.2 Scenario-based p-median fortification model....................................................... 31
3.3.3 Minimax p-median location model ....................................................................... 34
4 RELIEF DISTRIBUTION / STOCK PRE-POSITIONING MODELS ........................... 38
4.1 Single Commodity/Single Facility Model ................................................................ 38
4.2 Multiple Commodities/Multiple Facilities Model .................................................... 43
5 CONCLUSION ................................................................................................................ 50
REFERENCES ......................................................................................................................... 54
APPENDIX .............................................................................................................................. 57

Location Models in Humanitarian Logistics LIST OF FIGURES
Diogo Rafael dos Santos Forte v
LIST OF FIGURES
Figure 1.1 – Number of disaster occurrences and affected population between 1990 and 2012
(source: Guha-Sapir et al., 2013) ................................................................................................ 2
Figure 3.1 – Network design with (A) Delaunay Triangulation plus (B) Voronoi Diagram ... 13
Figure 3.2 – Network of center/site locations divided into zones ............................................ 14
Figure 3.3 – Example of assignments for (A) proximity level 1 and (B) proximity level 2 .... 15
Figure 3.4 – p-median location model for level of service: (A) 0 (B) 1 (C) 2 (D) 3 (E) 4 ....... 19
Figure 3.5 – p-median fortification model considering 𝑓 = 2 ................................................. 23
Figure 3.6 – Scenario-based p-median location model for scenarios: (A) 2 (B) 13 (C) 19 and
(D) 25 ........................................................................................................................................ 29
Figure 3.7 – Scenario-based p-median fortification model for scenarios: (A) 5 (B) 14 (C) 20
and (D) 23 ................................................................................................................................. 32
Figure 3.8 – Minimax p-median location model (2nd approach) for scenario 13 (𝑠 = 13) ...... 37
Figure 4.1 – Network design with location of “logistical staging areas" ................................. 41
Figure 4.2 – Solution for the single commodity/single facility model ..................................... 42
Figure 4.3 – Multiple Commodities/Multiple facilities model – results for the distribution of
water in (A) 1st approach and (B) 2nd approach ........................................................................ 47
Figure 4.4 – Multiple Commodities/Multiple facilities model – results for the distribution of
food in (A) 1st approach and (B) 2nd approach .......................................................................... 48
Figure 4.5 – Multiple Commodities/Multiple facilities model – results for the distribution of
medication in (A) 1st approach and (B) 2nd approach ............................................................... 49

Location Models in Humanitarian Logistics LIST OF TABLES
Diogo Rafael dos Santos Forte vi
LIST OF TABLES
Table 3.1 – Assignment results for p-median location model .................................................. 18
Table 3.2 – p-median location model results in travelled distances ......................................... 19
Table 3.3 – Shelters per level of proximity to populated centers (𝑗𝑐) in the p-median
fortification model .................................................................................................................... 22
Table 3.4 – Distance matrix 𝑑𝑗𝑐 (in Km) for the p-median fortification model ........................ 23
Table 3.5 – Levels of service in fortification reassignments .................................................... 25
Table 3.6 – Combination of failing zones according to scenarios ............................................ 28
Table 3.7 – Results of scenario-based p-median location model ............................................. 30
Table 3.8 – Results of scenario-based p-median fortification model ....................................... 33
Table 3.9 - Results of minimax p-median location model ....................................................... 35
Table 3.10 – Results for the second approach of the minimax p-median location model........ 36

Location Models in Humanitarian Logistics LIST OF SYMBOLS
Diogo Rafael dos Santos Forte vii
LIST OF SYMBOLS
𝑱 – Set of centers, indexed by j
𝑲 – Set of sites, indexed by k
𝑹 – Set of serviceability levels, indexed from 0 to 𝑝 − 1
𝑨 – Set of network zones, indexed by a
𝑪 – Set of proximity levels, indexed by c;
𝑺 – Set of failure scenarios, indexed by s
𝑰 – Set of LSA locations, indexed by i
𝑵 – Set of types of distribution centers, indexed by n
𝑻 – Set of types of commodities, indexed by t
𝑳 – Set of facility types, indexed by l
𝑑𝑗𝑘 –Shortest path distance from center 𝑗 to site 𝑘;
ℎ𝑗 – Number of residents in center 𝑗;
𝑞 – Probability of failure occurring;
𝑝 – Maximum number of shelters to be located;
𝑠𝑘𝑎 – Zone 𝑎 in which site 𝑘 is located;
𝑗𝑐 – 𝑐th closest shelter to population in center j;
𝑑𝑗𝑐 – Distance between population in center 𝑗 and its 𝑐th closest operational shelter;
𝑓 – Maximum number of fortified shelters;
𝑞𝑠 – Probability of scenario 𝑠 occurring;
𝑎𝑗 – Demand of resources in location 𝑗;
𝑑𝑖𝑘 – Distance from distribution center 𝑘 to LSA 𝑖;
𝑝𝑛 – Maximum number of distribution centers of type 𝑛;
𝑒𝑛 – Maximum holding capacity in distribution centers of type 𝑛;

Location Models in Humanitarian Logistics 1 LIST OF SYMBOLS
Diogo Rafael dos Santos Forte viii
𝑣𝑗𝑡𝑠 – Demand of commodity 𝑡 in center 𝑗 during scenario 𝑠;
𝑚𝑙𝑡 – Maximum holding capacity of commodity 𝑡 in facility type 𝑙;
𝑔𝑘𝑡 – Amount of commodity 𝑡 pre-stocked on site 𝑘;
𝑝𝑙 – Maximum number of facility type 𝑙;
𝑞𝑟𝑠 – Probability of scenario 𝑠 occurring;
𝑀 – Penalty factor;
𝐿𝑗𝑟𝑎 – Zone 𝑎 to which residents of center 𝑗 are assigned to in level 𝑟;
𝑌𝑘 – Binary variable. Assumes the unitary value if a shelter is located in k, and 0 otherwise;
𝑋𝑗𝑘𝑟 – Binary variable. Assumes the unitary value if population from j is served in site k on
level r, and 0 otherwise;
𝑍𝑘 – Binary variable. Assumes the unitary value if a shelter is fortified in site k, and 0 otherwise;
𝑊𝑗𝑐 – Binary variable. Assumes the unitary value if the 𝑐 − 1 closest shelters to center j are not
protected but the 𝑐th closest shelter is, and 0 otherwise;
𝑎𝑘𝑠 – Binary value. Assumes the unitary value of site k fails in scenario s, and 0 otherwise;
𝑋𝑗𝑘𝑠 – Binary variable. Assumes the unitary value if population from j is served in site k on
scenario s, and 0 otherwise;
𝑈 - Variable which defines the distances travelled in the worst scenario;
𝑋𝑖𝑘𝑛 – Variable. Resources transported from LSA 𝑖 to distribution center 𝑘 of type 𝑛;
𝑍𝑘𝑛 – Binary variable. Assumes the unitary value if a distribution center of type n is located in
site k, and 0 otherwise;
𝑌𝑗𝑘𝑛 – Binary variable. Assumes the unitary value if population from j are assigned to
distribution center k of type n, and 0 otherwise;
𝑋𝑗𝑘𝑡𝑠 – Variable. Demand of commodity 𝑡 from center 𝑗 that is served in facility located in site
𝑘 during scenario 𝑠;
𝑌𝑘𝑙 – Binary variable. Assumes the unitary value if facility of type l is opened in site k, and 0
otherwise;

Location Models in Humanitarian Logistics 1 INTRODUCTION
Diogo Rafael dos Santos Forte 1
1 INTRODUCTION
A disaster is the result of a sudden disruption in the ecological balance between man and his
environment, posing a significant, widespread threat to human life, health, property or the
environment (United Nations, 1999). Regarding its origin, a disaster can either be categorized
as natural or as man-made (Caunhye et al., 2012). Natural disasters are events such as
earthquakes, floods or hurricanes, whereas man-made disasters events include leakage of
chemical products and terrorist attacks, among others. Wassenhove (2006) states that disasters
can be further categorized according to the quickness in which its effects take place: sudden-
onset disasters have much quicker and uncontainable effects on the environment, and slow-
onset disasters take time to develop into a full blown catastrophe. Events such as earthquakes,
hurricanes, coup d’états and terrorist attacks are considered to be sudden-onset disasters, while
famine, drought and political/refugee crisis are events which are considered to be slow-onset
disasters.
The number of occurring disasters has consistently grown over the years, and every year, an
average of more than 500 disasters are estimated to strike our planet, leaving a destruction path
that kills around 75,000 people and severely affects 200 million others (Balcik and Beamon,
2008). In an annual statistical review, Guha-Sapir et al. (2013) show that the number of reported
disasters has maintained significantly higher when compared to the previous decade (see Figure
1.1). Among the valuable statistical data presented, some figures come out as worrying.
According to this study, in the year 2012, out of the top ten countries affected by natural
disasters, three countries – India, Indonesia and Philippines – are middle-lower income
economies, and another three countries – Afghanistan, Bangladesh and Haiti – are low income
economies (according to the World Bank income classification).

Location Models in Humanitarian Logistics 1 INTRODUCTION
Diogo Rafael dos Santos Forte 2
Figure 1.1 – Number of disaster occurrences and affected population between 1990 and 2012
(source: Guha-Sapir et al., 2013)
To add up to the increasing number of disaster occurrences, Fritz Institute (2005) indicates that
during the 2004 Indian Ocean tsunami, one of the most devastating recent natural incidents, no
pre-established plan of action was set up in case a disaster took place, thus, leading to a massive
amount of aid that ended up not being delivered to people in need. Later reports (BBC News,
2010) provided by on field reporters during the 2010 Haiti earthquake indicate that the same
neglect might have taken place as well. Furthermore, Haiti’s case has become an example on
how the lack of planning can result in catastrophic consequences.
Taking into account the impact that disasters create, especially when affecting under-developed
areas, and the trends of occurrence in disasters, it is clear that there is a need for the development
of efficient planning for responses to disasters. These disaster response operations are addressed
in humanitarian logistics, which is defined as “the process of planning, implementing and
controlling the efficient, cost-effective flow and storage of goods and materials as well as
related information, from point of origin to point of consumption for the purpose of meeting
the end beneficiary’s requirements” (Wassenhove, 2006). Humanitarian logistics problems are
those which look for ways to alleviate the damages caused to the population by disaster
situations.
Humanitarian logistics diverge from traditional business-related logistics, which is the most
developed area of research in logistic problems. Problems found within this area commonly
have the main focus of locating a series of warehouses and defining transportation plans that
guarantee the most cost effective way of supplying each warehouse with goods. The main
differentiating factor between these areas is the non-emergency environment that traditional
logistics problems are developed in. According to Balcik and Beamon (2008) and Kaynak and
0
100
200
300
400
500
600
700
800
Affected population (in millions) Reported number of disasters

Location Models in Humanitarian Logistics 1 INTRODUCTION
Diogo Rafael dos Santos Forte 3
Tuğer (2014), approaches that solve a traditional logistics problem may not do as well for a
humanitarian logistics problem. Factors such as the uncertainty of safety conditions, on roads
and buildings, and demand levels, for resources and people in need of assistance, present a
serious problem to the creation of transportation plans and in determining the assistance needs.
To cover issues related with uncertainties, humanitarian logistics problems may take into
account stochastic data to define several possibilities of demand levels and conditions of the
overall network of roads and surrounding buildings, according to the magnitude of the disaster.
Furthermore, humanitarian logistics is a derivation of emergency logistics, a specific area of
business-related logistics which is aimed at coping with uncertainties in emergency/disaster
situations and which takes into account stochastic data. However similar, while humanitarian
logistics aim at providing relief to affected people, emergency logistics aim at reducing
company costs inherent to disaster occurrences (Snyder et al. 2005).
During recent years, humanitarian logistics have been the focus of a great number of research
efforts. In the available literature regarding this subject, 45% of studies were published after
the year 2000, giving a clear indication that the research on the topic is rapidly expanding (Altay
and Green 2006). Research efforts in humanitarian logistics problems are divided according to
the time phase when disaster operations take place, be it before or after a disaster strikes
(Caunhye et al. 2012). Pre-disaster operations are all the efforts that take place before the impact
of a disaster. During this phase, strategic planning and disaster mitigation take center stage,
focusing on facility location, stock pre-positioning and evacuation efforts. Post-disaster
operations, take place after a disaster occurs and have the sole purpose of attending to disaster
impacts, be it by way of distributing resources or by providing transportation to disaster
casualties (injured or deceased).
In this dissertation, we will focus on two of the most important problems addressed in pre-
disaster operations: evacuation and relief distribution with stock pre-positioning. Studies
performed to address both problems use facility location models, which are derived from
classical models for the location of public facilities.
Evacuation models determine the best location of shelters, and define routes of access from the
populated centers to the located shelters. These models present solutions which may consider
events such as the failure of certain road links, which may alter the choice of routes to get to a
shelter, and the failure of one/several located shelters, which may require to opt for a different
and farther away point of assistance. These models present solutions that encompass the number
of people served by each shelter and the routes used between their location of residency and
closest shelter under operation.

Location Models in Humanitarian Logistics 1 INTRODUCTION
Diogo Rafael dos Santos Forte 4
Relief distribution and stock pre-positioning models look for ways to provide the population
with access to resources (such as food, water and medication) which may be needed in disaster
situations. Furthermore, these models determine the amount of goods that should be placed in
each warehouse/distribution center and also the routes to be used. Some models in this context
require that a set of suppliers be considered, in order to account for a first phase of planning
that involves the transportation of resources from each supplier to the located distribution
centers. This consideration allows us to determine the amount of resources that is stocked in
each distribution center and the supplier from which it was originally transported. Solutions
commonly presented for these problems consider the minimization of aggregated travelled
distances between the suppliers and the distribution centers as well as the distances between the
distribution centers and each populated center in need.
1.1 Objective Statement and Overall Structure
Regardless of the moment of action, humanitarian logistics problems focus essentially on the
response time and user accessibility under chaotic situations. As facility location problems look
to improve timeliness of demand response and functional cost in the best way possible, they
present themselves to be one of the most important and efficient areas of study in order achieve
an adequate emergency plan, especially with the usage of optimization models. Given that fact,
in this dissertation, several facility location optimization models used for the planning of pre-
disaster operations will be presented.
For the development of this dissertation we defined two main goals: providing a description of
the main problems addressed in humanitarian logistics for pre-disaster operations; and
performing a detailed study of optimization models used to solve those main problems.
The remainder of this dissertation is organized in four Chapters. In Chapter 2, a brief overview
of the existing literature on evacuation and relief distribution models is presented. In Chapters
3 and 4, the matters of location-evacuation problems (planning the location of facilities with
the objective of minimizing evacuation time) and location with relief distribution and stock pre-
positioning (planning the location of facilities with the objective of positioning and delivering
the necessary resources), are addressed, respectively. For both types of situations, optimization
models are presented in order to achieve a solution that minimizes the distances that residents
have to travel in order to receive the needed assistance. In Chapter 5 we present conclusions
regarding the objectives that were established.

Location Models 2 FACILITY LOCATION PROBLEMS IN HUMANITARIAN LOGISTICS
in Humanitarian Logistics
Diogo Rafael dos Santos Forte 5
2 FACILITY LOCATION PROBLEMS IN HUMANITARIAN LOGISTICS
In humanitarian logistics, facilities considered for location are either shelters or distribution
centers (also referred to as warehouses). Facility location models are designed to aid decision
regarding the best possible location of shelters/distribution centers taking into account problems
such as the timeliness of evacuation efforts, preparedness of relief distribution and effectiveness
of stock pre-positioning. Regardless of the problem being analyzed, most facility location
models focus on a single-period. Moreover, facility location models are mainly based on mixed
integer programs (usually referred to as MIP) with binary location variables. In addition, these
models can be differentiated according to the available data type, which can use deterministic
parameters or a mixture of deterministic and stochastic parameters (be it probabilistically
distributed or scenario-based).
The available literature on facility location models in humanitarian logistics can be classified
into two different categories according to the main problems that are considered: Location-
evacuation and location with relief distribution and stock pre-positioning. The following sub-
chapters elaborate on optimization models used in each of the mentioned categories.
2.1 Location-Evacuation
Location-evacuation models determine the best set of locations for a set of shelters, in order to
serve the affected population at the minimum travel distance. Furthermore, common outputs
from these models are the number and location of the optimal set of shelters as well the
assignment routes from affected areas to the located shelters.
In our overview of available models on the topic of evacuation related problems we found that
emergency logistics models are a frequently cited topic on operational research. As explained
in Chapter 1 of this dissertation, emergency logistics tend to deal with problems related to the
economic performance and efficiency of networks, considering the effects of disasters. Studies
like the one conducted by Snyder et al. (2005), lead us to believe that if the necessary
adaptations are taken under consideration, emergency logistics models can be used as a basis
for the analysis of humanitarian logistics problems, which in turn, leads to a wider spectrum of
possibilities in terms of the research material that is available. Chapter 3 of this dissertation,
explores the similarities between the problems and expands on the notions that the models

Location Models 2 FACILITY LOCATION PROBLEMS IN HUMANITARIAN LOGISTICS
in Humanitarian Logistics
Diogo Rafael dos Santos Forte 6
developed in emergency logistics are applicable to humanitarian logistics, if only factors such
as costs of locating facilities are changed or dismissed.
Among the research conducted by Snyder et al. (2005), we considered the analysis of five
emergency logistics models which are easily relatable to the topic of evacuation models in
humanitarian logistics: Reliability Fixed-Charge Location Model (RFLM), Capacitated
Reliability Fixed-Charge Location Model (CRFLM), Minimax-Cost Reliability Fixed-Charge
Location Model (MMRFLM), p-Median Fortification Model (PMFM) and Capacitated p-
Median Fortification Model (CPMFM). The RFLM considers the risks connected to disaster
events by using probabilistic data regarding the failure of facilities. As a consequence of using
probabilistic data, the output from this model presents a serviceability plan for each level of
proximity from center of population to the location of the facilities. For each level of proximity,
assignments are made to guarantee that if a facility closer to the customer fails, he can be served
by a different, and non-disrupted, facility that is located further. The CRFLM considers
scenario-based failure events and decides the location of facilities and determines the
assignments of residents, after the occurrence of a random disruption (failure). The MMRFLM
is developed to analyze the worst-case scenario. It aims at minimizing costs only throughout
failure scenarios with noticeable probability of occurrence (e.g. scenarios with probability
higher than 0.01). Furthermore, it determines the location solution which best suits the worst-
case scenario. The PMFM and CPMFM are derived from RFLM and CRFLM, respectively,
and determine what facilities (which location is known a priori) should be fortified. The
CRFLM and CPMFM may consider capacity limits to the facilities. Furthermore, these capacity
limits are not addressed for the study described in this dissertation.
Location-evacuation models developed specifically within humanitarian logistics are
associated with a variety of uncertainties: traffic flows, evacuee panic and demand quantities
being the most commonly considered. We present the following studies as examples of some
of the applications found within the available literature regarding each of the cited uncertainty
topics.
Sherali et al. (1991) studied hurricane/flood situations, with consideration of the impact of
shelter locations on evacuation time. Furthermore, a model was proposed to select a set of
shelters from among a group of potential locations and prescribe an evacuation plan, which
minimizes the total evacuation time of the affected population. This model covers the study of
traffic flow’s influence on decision making, by considering the effects that congestion in
available road links has on travelling time. Based on the premise that Wardrop (1952) proposed,
this model, considered that the time of travel when using a certain link, varies according to the
level of saturation (percentage of link’s capacity being used) presented by that link at the point
of being chosen as a part of the evacuation route.

Location Models 2 FACILITY LOCATION PROBLEMS IN HUMANITARIAN LOGISTICS
in Humanitarian Logistics
Diogo Rafael dos Santos Forte 7
Kongsomsaksakul et al. (2005) presented a location-allocation model for flood evacuation
planning that determines the number and locations of a set of capacitated shelters as well as the
flow of movements within the road network. Contrary to most models, this proposed approach
dismisses the idea that administrative authority has total control over evacuees’ choices.
Instead, this model factors in evacuee panic as a major decision factor on the destination of
each affected person by defending that route decisions should be made by evacuees, taking into
account the damage presented in the roads, traffic congestion of those same roads and the
location and capacity of the destination shelters.
Song et al. (2009) take a different approach to most cases, by studying evacuation operations
that are performed by a pre-assigned public bus pick-up service. This model aims at minimizing
the total evacuation time and does it by identifying the optimal serving areas and vehicle routes
to move evacuees from affected zones to their designated shelter location. Furthermore, shelter
and population pick-up points’ location must be determined by this model, as well as the
transportation plan from each pick-up point to the located shelters. Furthermore, this model
studies, with great focus, issues related to demand quantities, as they are critical to guarantee
that all population is served (relation between bus capacity/evacuee number has to be carefully
managed).
Although the majority of models that plan for location-evacuation consider a single-objective,
Alçada-Almeida et al. (2009), consider a multi-objective analysis and aim at minimizing total
travel distance, risk of primary path being impassable, risk of destruction of the shelters and on
a complementary level, it aims at minimizing casualty transportation time from the shelters to
local hospitals. This model diverges from previously referred ones as it takes into account the
possibility of not only route failure, but also failure of located shelters. The authors develop a
model for determining the number and location of shelters and identify the primary and
secondary evacuation routes for affected residents to take to the operable shelters. For each
residential zone, a back-up route and shelter are identified in order to avoid complications
during the evacuation process.
2.2 Location with Relief Distribution and Stock Pre-Positioning
Facility location models with relief distribution and stock pre-positioning are used with the final
objective of deciding upon the location of a set of warehouses/distribution centers and at the
same time determining the amount and type of resources that those facilities should be
stockpiled with. These models also create a plan for the distribution of stockpiled goods to each
of the affected surrounding areas. The costs that are considered depend on the nature of the
disaster, although, in general, costs related with building facilities, acquiring resources and
distribution (transportation) of relief goods are commonly considered.
Location Models 2 FACILITY LOCATION PROBLEMS IN HUMANITARIAN LOGISTICS
in Humanitarian Logistics
Diogo Rafael dos Santos Forte 8
Early models such as the one presented in Psaraftis et al. (1986) were developed to help reduce
damage caused by oil spill disasters and aimed at providing decision makers with a model that
located the best set of resource storage facilities in order to achieve faster and less costly clean-
up operations, by way of stocking the needed type of resources (each type of resource is
associated with an acquisition cost and effectiveness of response) in the located facilities and
creating a plan to allocate the resources to affected areas. Furthermore, the presented model
takes into account stochastic data regarding the most likely points of disaster occurrence and
the demand of resources that those disasters would generate. In addition, besides the more
commonly used costs, this model considers unmet demand costs, that represent a penalization
for escaping oil due to delay of distribution or by resource ineffectiveness. Wilhelm and
Srinivasa (1996) reformulate oil spill models (due to the OPA – Oil Pollution Act) and consider
a model that takes into account time phased requirements. Furthermore, the latter propose a
different perspective of locating facilities by acknowledging that existent warehouses’
expansion should be considered.
Chang et al. (2007), proposed a multi-level approach to flood situations that first formulates an
organizational structure, by creating a grouping of regional distribution centers according to the
likelihood of flood occurrences and secondly locates facilities with sufficient resources in each
established region and determines the distribution flow of resources to be made from each
distribution center to each disaster affected area. Moreover, this model provides decision
makers with a logistics structure, organized by level of rescue importance, that considers the
possibility of resource shortage in each region, but at the same time, allows for different lower
level regional distribution centers to provide back-up in those cases. Mete and Zabinski (2010)
additionally consider situations where route planning for the distribution of medical resources
to local hospitals is affected by the magnitude of the occurring disaster (earthquakes were
studied for this model), thus advocating the creation of scenarios where certain road links
should be considered unusable/undesirable and creating alternative transportation routes that
guarantee the timeliness of delivery of additionally stockpiled resources in a subset of existing
hospital warehouses. Rawls and Turnquist (2010) expands on the uncertainty of conditions to
be considered, by developing a model that aims at locating pre stockpiled warehouses and
guarantees the distribution of resources to the affected population, even while considering
scenarios where partial/total pre-positioned warehouse stock is destroyed due to the disaster’s
spectrum of action as well as damage caused to the network of roads. Furthermore, this model
considers costs regarding the holding of excess resources (in case they are not used in certain
scenarios) and a penalization for unmet demand (due to destruction of stock).
Horner and Downs (2010) propose a slightly different approach to relief distribution compared
to the previous models, by developing an optimization model that considers the last phase of
the distribution process to be handled by the affected population. It is done by assuming that
Location Models 2 FACILITY LOCATION PROBLEMS IN HUMANITARIAN LOGISTICS
in Humanitarian Logistics
Diogo Rafael dos Santos Forte 9
population is in charge of travelling to the assistance point (much like the location-evacuation
models), be it by vehicle or by foot, in case they are nearby or if the access road is destroyed;
this assistance point is previously serviced by a central “logistics staging area”. The proposed
model considers the location of additional relief facilities (called break of bulb points), which
are smaller in cost as well as size and assistance capability, in order to guarantee that remote
population can have better access to help. The objective is to locate normal and smaller size
distribution centers in order to minimize costs and guarantee better accessibility to goods in all
the affected region.

Location Models in Humanitarian Logistics 3 EVACUATION MODELS
Diogo Rafael dos Santos Forte 10
3 EVACUATION MODELS
Evacuation models are developed in order to determine the location of a network of shelters
and define routes of evacuation from every populated center. These routes will lead people from
every affected center to arrive as safely and as quickly as possible to one of the located shelters.
Furthermore, these models look to achieve a solution that minimizes the overall distances
travelled by all the affected population.
In this chapter we will consider the studies performed by Snyder et al. (2005) and apply them
to a humanitarian logistics context. Models presented in that study were developed to cover
emergency logistics problems and consider costs regarding the installation of facilities (fixed-
charge). From a humanitarian logistics standpoint, it makes no sense to define an installation
cost associated with each facility that is located and so, a limitation of the number of facilities
is considered instead. By dropping the fixed location costs and replacing them with a limitation
to the number of facilities, the models should be designated as p-median optimization models.
This variable, 𝑝, is attributed a value, bearing in mind that every inhabitant of the affected
region should be served in a way which allows for a good level of service across the entire
region and at the same time guarantees that no unnecessary budget excess is made in terms of
the solutions that are made available. Furthermore, we present plans that consider reliable
facility locations. This type of planning efforts take in to account the occurrence of unexpected
failures in facilities, each with a probability of occurrence associated with the site where the
facility is to be located. Within the contents of our study, there are two types of models that are
considered: design models and fortification models.
Design models represent situations where a solution has to be built from scratch and its aim is
to determine the number and location of facilities. Furthermore, these models determine the
assignments of population to be made to each located facility. Fortification models, consider a
pre-defined set of facilities, and have the objective of determining which of the existing
facilities should be fortified in order to cope with failure events and enhance the proximity of
affected population to protected facilities. Additionally, most design models have a
corresponding fortification model in terms of approach. It is possible to improve planning
efforts by relating both phases and integrating the two models, in order to locate facilities and
to identify a subset of those facilities to fortify against failure.

Location Models in Humanitarian Logistics 3 EVACUATION MODELS
Diogo Rafael dos Santos Forte 11
As an attempt to more easily understand the adaptation of emergency logistics models to
humanitarian logistics requirements, in this dissertation, we devised the grouping of directly
relatable design and fortification models, and created two different categories according the
models’ characteristics: proximity-based reliability models study the effects of disasters on a
network of shelters by proposing hypothetical assignment solutions according to the level of
proximity of the shelters to each of the populated centers; scenario-based reliability models
study the occurrence of pre-defined specific failure combinations in certain areas of the territory
and develop the best solution of assignments according to each disaster scenario.
For proximity-based reliability models, we considered two different models: a p-median
location model (based on RFLM) and a p-median fortification model (based on PMFM). Both
of these models consider that there are no limitations in terms of the capacity of each located
shelter and always look to assign the population to their closest operable shelter. They present
solutions that give indications on what might happen in case all populated centers are served
by a shelter in a specific level of proximity. Furthermore, for each populated center, these
models analyze the distances to all the located shelters and indicate which shelter is the closest,
which is the furthest away and all other levels in between. At this point it should be noted that
solutions presented in these models are merely hypothetical, as no specific disaster occurrences
are considered (these are presented in scenario-based models).
The p-median location model presents the best possible set of shelter locations to minimize the
distances travelled by the population. The solutions are presented according to the level of
proximity that decision makers indicate. It basically generates solutions that illustrate the
assignments that we should expect in case all the centers would be served by shelters in the
same level of proximity.
The p-median fortification model determines a subset of shelters (which may be determined by
the design model) that should be fortified against failures and that guarantee the least amount
of distances travelled by the population. It indicates what would be the level of proximity for
which a populated center might find the closest fortified shelter. Furthermore, for this model, it
is assumed that all the population must be served by a facility that has been protected.
Additionally, this hypothetical solution determines the worst case in which a center might be
served during disaster occurrences, as it does not consider the possibility that a non-failing non-
fortified shelter might serve population, which in reality will happen.
For scenario-based reliability models, we considered three different models: a scenario-based
p-median location model (based on CRFLM), a scenario-based p-median fortification model
(based on CPMFM) and a minimax p-median location model (based on MMRFLM). In this
category, all models take into account specific disaster occurrences, represented by pre-defined

Location Models in Humanitarian Logistics 3 EVACUATION MODELS
Diogo Rafael dos Santos Forte 12
scenarios associated with a probability of occurrence. Their objective is to grant a result of
locations and assignments that presents a good level of functionality for the scenarios that are
considered. No limitations in terms of capability are considered and for all models, a plan for
the assignments in each scenario is provided. Furthermore, each scenario represents a different
combination of located failures.
The scenario-based p-median location model presents a solution for the location of shelters that
aims to minimize the amount of distances travelled across all the scenarios that are accounted
for. It presents a solution that grants importance to all scenarios, according to their probability
of occurrence: a scenario that is more likely, should have a higher level of importance, and
scenarios that are unlikely to occur, are considered less important. In this model, for each
scenario, we are presented with a plan of assignments that allocates the population in all centers
to their closest operational shelter.
The scenario-based p-median fortification model takes the shelter location solutions provided
by its corresponding design model and determines which shelters should be fortified. The
decision on which subset of shelters to fortify is taken according to the same scenarios analyzed
in the scenario-based p-median location model. The model develops a location solution that
guarantees that throughout all the scenarios, the population travels the least amount of distances
possible. Furthermore, a solution of assignments is also presented according to each scenario.
The minimax p-median location model presents a different approach from the other models in
this category. Instead of considering a minimization of the overall distances travelled across all
scenarios, this model looks for ways to optimize the results for the worst scenario of all. It takes
into account the exact same premises as the scenario-based p-median location model, however
in this case, only one scenario is viewed as being important. It develops a solution for the
location of shelters that guarantees that the network has the best performance possible for the
most devastating scenario. In this case, scenarios that are taken into consideration might be
subjected to a reduction in order to look for a solution that does not compromise the functionally
for scenarios that are not the worst case.
In this chapter, we will describe the approaches taken to reproduce the previously stated models,
present the adaptations from the original models and compare results between each approach
that is taken.
3.1 Description of Test Instances
A random test instance was used to demonstrate the applicability of the models. Taking into
account the studies performed in Teixeira and Antunes (2008), the instance was built by
Location Models in Humanitarian Logistics 3 EVACUATION MODELS
Diogo Rafael dos Santos Forte 13
considering a set of 20 centers and sites, with their coordinates (x,y) randomly generated in the
range of 0-5 Km. Centers consist of the set of locations that serve as residence to the inhabitants
of the region, while sites represent the set of locations where facilities might be placed.
Furthermore, it was assumed that sites would be coincident with centers. After analyzing the
coordinates for each center, a planar network was created by defining a Delaunay Triangulation
and the corresponding Voronoi Diagram (Lee, 1980). The graphical representation of the
resulting network is as follows:
This would generate a triangular mesh connecting all the centers and sites, simulating the
existence of a series of roads that joins all the points in the network and creating a situation that
is more closely related to a real network. Additionally, the Voronoi Diagram gives us a
representation of the proximity between points in the network: a point located within a restricted
area is more closely located to the center/site located in that restricted area than any other
center/site in the whole region. Finally, with the network defined, the Euclidean distances, 𝑑𝑗𝑘,
were determined by finding the all shortest paths on the resulting network. Furthermore,
demand levels were generated also considering the studies performed in Teixeira and Antunes
(2008). For each center, we considered demand values randomly generated in the range of 5-
100 units of demand. Data regarding the instances (coordinates, distances and demand) is
presented in the Appendix: Table A.1 shows the network coordinates; Table A.6 illustrates the
shortest path distance matrix; Table A.2 presents data regarding the generated demand levels.
A zoning of the network was developed and is presented in Figure 3.2. This zoning tries to
reflect the division that is commonly present in cities nowadays. It generally aggregates areas
that have similar topographical (terrain elevation) and structural characteristics (size of
(A) (B)
Figure 3.1 – Network design with (A) Delaunay Triangulation plus (B) Voronoi Diagram

Location Models in Humanitarian Logistics 3 EVACUATION MODELS
Diogo Rafael dos Santos Forte 14
buildings), among others. As it pertains to the occurrence of disasters, this aggregation of areas
in several zones is very useful when it comes to protecting the population. By separating each
zone, we can prepare for the event of isolated or combined failures in the zones considered.
Additionally, we can assume that when a disaster strikes a specific zone of the city, all shelters
located within that zone are likely to fail and therefore the population that resides in that zone
must be relocated to shelters on a different and safer zone of the city.
3.2 Proximity-Based Reliability Models
Proximity-based reliability models are developed in this dissertation with the intent or creating
or restructuring a network of shelters in order to guarantee that inhabitants of a certain area,
which may be affected by a disaster occurrence, are able to find better conditions of safety in
one of the located shelters. Furthermore, the models within this group generate plans for the
routing of each inhabitant, from the center where they live until the site where their assigned
shelter is to be located. Regarding the shelters, these types of models assume that there are no
limitation in terms of their capacity, and therefore, the results that are presented, allocate people
to the shelter that is more closely located to them.
Models developed within this category propose solutions for the hypothetical occurrence of
disasters where all the population collectively would have to be assigned to receive assistance
at a shelter that is at a certain level of proximity from their center of residence. We use the term
“hypothetical” because, in fact, the assignments proposed by models within this category will
never take place, at least not in the totality of assignments proposed. An analysis of Figure 3.3
allows for a better understanding of solutions proposed by the models within this category.
Figure 3.2 – Network of center/site locations divided into zones

Location Models in Humanitarian Logistics 3 EVACUATION MODELS
Diogo Rafael dos Santos Forte 15
Figure 3.3 (A) makes clear that the assignments for the first proximity level will have all the
population being served by its most closely located shelter. Furthermore, at a secondary level
of proximity (B), the population from all centers will be reassigned to its respective second
closest shelter. The population will only be served by its second closest shelter if the first one
has failed, and so, it is impossible to assume that we will be able to reassign all the population
to every level of proximity, as seen in Figure 3.3. This is due to the fact that for a certain center,
its shelter in some proximity level might be at the same time a shelter in the previous proximity
level for another center. Solutions proposed in the models within this category do not present
definitive assignment results for a specific occurrence, but rather, shed a light on what would
ensue if each center would have be served with a certain level of proximity. Furthermore, results
provided by this type of models serve as a reference for the assignments that are expected to be
made during more specific disaster occurrences.
Within this group, two different models can be found: a p-median location model (design) and
a p-median fortification model (fortification). We will present the formulation for both models,
using the location results from the design model as a basis for the application of the fortification
model. Furthermore, a comparison between results will be provided.
3.2.1 p-median location model
For the purposes that are intended and taking into account the necessary changes of perspective
from a decision standpoint, the developed p-median location model considers the following
notation:
Sets:
𝑱 – Set of centers, indexed by j
𝑲 – Set of sites, indexed by k
𝑹 – Set of serviceability levels, indexed from 0 to 𝑝 − 1
(A)
(B)
Figure 3.3 – Example of assignments for (A) proximity level 1 and (B) proximity level 2

Location Models in Humanitarian Logistics 3 EVACUATION MODELS
Diogo Rafael dos Santos Forte 16
𝑨 – Set of network zones, indexed by a
Parameters:
ℎ𝑗 – Number of inhabitants in center 𝑗 𝜖 𝑱
𝑑𝑗𝑘– Shortest path distance from center 𝑗 𝜖 𝑱 to site 𝑘 𝜖 𝑲
𝑞 – Probability of failure occurring in an open shelter
𝑝 – Maximum number of shelters to be located
𝑠𝑘𝑎 – Zone 𝑎 𝜖 𝑨 in which site 𝑘 𝜖 𝑲 is located
Decision variables:
𝐿𝑗𝑟𝑎 – Zone 𝑎 𝜖 𝑨 to which inhabitants of center 𝑗 𝜖 𝑱 are assigned to in level 𝑟 𝜖 𝑹
𝑌𝑘 = {1, if shelter 𝑘 is opened
0, otherwise
𝑋𝑗𝑘𝑟 = {1, if inhabitant 𝑗 is assigned to shelter 𝑘 at level 𝑟
0, otherwise
Regarding the underlying methodology, in this model it was assumed that any open shelters
may serve any resident and that there were no capacity restrictions to each open shelter. The
model proposes the assignments that are to be made in case inhabitants from center 𝑗 are to be
serviced at a certain level 𝑟. Furthermore, this models develops assignment solutions for each
serviceability level that is considered. A “level-r” assignment is one for which there are 𝑟 closer
open shelters. Taking that in to account, for each inhabitant’s center of residence there should
be made an analysis of the closest open shelters as well as the ordering of those shelters by
level. A level-0 assignment represents a situation where the local resident is being assigned to
the closest open shelter available, and so it is called a “primary” shelter. Subsequently an
assignment in which the level 𝑟 is higher than 0, the shelter to which the resident is assigned is
called a “backup” shelter for that particular resident, given the fact that the assignment will only
take place if the 𝑟 closer shelters to the inhabitant have failed. Additionally, since we know in
advance the maximum number of shelters that will open, the extent of the index 𝑟 should be
considered from 0 through 𝑝 − 1, as that is the maximum amount of serviceability levels there
might be.
Once all the factors mentioned above have been taken into account, the model is formulated as
an integer programming problem, with the objective and constraint functions as follows:

Location Models in Humanitarian Logistics 3 EVACUATION MODELS
Diogo Rafael dos Santos Forte 17
𝑚𝑖𝑛𝑖𝑚𝑖𝑧𝑒 ∑ ∑ ∑ ℎ𝑗𝑑𝑗𝑘𝑞𝑟(1 − 𝑞)𝑋𝑗𝑘𝑟
𝑘∈𝑲𝑟∈𝑹𝑗∈𝑱
(1)
(s.t):
∑ 𝑌𝑘
𝑘∈𝑲
≤ 𝑝 (2)
∑ 𝑋𝑗𝑘𝑟
𝑘∈𝑲
= 1, ∀𝑗 ∈ 𝑱, 𝑟 ∈ 𝑹 (3)
𝑋𝑗𝑘𝑟 ≤ 𝑌𝑘, ∀𝑗 ∈ 𝑱, 𝑘 ∈ 𝑲, 𝑟 ∈ 𝑹 (4)
∑ 𝑋𝑗𝑘𝑟
𝑟∈𝑹
≤ 1, ∀𝑗 ∈ 𝑱, 𝑘 ∈ 𝑲 (5)
𝑌𝑘 ∈ {0,1}, ∀𝑘 ∈ 𝑲 (6)
𝑋𝑗𝑘𝑟 ∈ {0,1}, ∀𝑗 ∈ 𝑱, 𝑘 ∈ 𝑲, 𝑟 ∈ 𝑹 (7)
Each of the equations that are listed above represent the mathematical expressions of all the
considerations that were taken into account to develop the p-median location model.
The objective function (1), minimizes the sum of travelled distances by all the inhabitants in all
levels of service. It reflects the fact that if a resident 𝑗 is assigned to shelter 𝑘 at level 𝑟, it will
only, in fact, be served by 𝑘 if all the 𝑟 closer facilities have failed (reflected in the equation by
the probability 𝑞𝑟) and if 𝑘 itself has not failed (with probability 1 − 𝑞).1
Constraints (2) limit the number of open shelters to a maximum of 𝑝. Constraints (3) ensure
that each inhabitant 𝑗 is to be assigned to some shelter at level 𝑟. Constraints (4) guarantee that
assignments can only be made to a shelter that is open, while constraints (5) impede a resident
from being assigned to the same shelter at more than one level, since if a shelter is the 𝑟 closest
1 For a numerical example let’s say that all shelters have a 30% percent change of failure once they are open, and
that for a center j=7, the order of proximity to an open shelter, is: 3, 12 and finally 9 (with level-0 = shelter 3;
level-1: shelter 12; level-2: shelter 9). The occurrence of a hypothetical assignment from j=7 to, for example,
shelter k=9, which represents a level-2 assignment, will only happen, if the r closer shelters (in this case 2) have
failed and at the same time if k=9 has not failed. This situation happens with probability: 𝑞𝑟 × (1 − 𝑞) = 0.32 ×
(1 − 0.3) = 0.063 ≡ 6.3%.

Location Models in Humanitarian Logistics 3 EVACUATION MODELS
Diogo Rafael dos Santos Forte 18
to a certain center, it cannot, at the same time, be the 𝑟 + 1 closest to that same center. Finally,
constraints (6) and (7), require the decision variables to be binary.
Application
Due to the zoning approach that was taken to apply this model, the following additional
constraints had to be considered:
𝐿𝑗𝑟𝑎 = ∑ 𝑋𝑗𝑘𝑟𝑠𝑘𝑎
𝑘∈𝑲
, ∀𝑗 ∈ 𝑱, 𝑎 ∈ 𝑨, 𝑟 ∈ 𝑹 (8)
∑ 𝐿𝑗𝑟𝑎1
𝑟∈𝑹
− ∑ 𝐿𝑗𝑟𝑎2
𝑟∈𝑹
≤ 1, ∀𝑗 ∈ 𝑱, 𝑟 ∈ 𝑹, 𝑎1 ≠ 𝑎2 ∈ 𝑨 (9)
Given the fact that we associate failure occurrences with specific zones of the network, this will
mean that once a zone fails, then, shelters which are located within the confinements of that
zone will all fail, since they are all subjected to the same conditions. To prevent situations of
this nature, which may prove to be costly, we decided that each zone must only have a single
located shelter within its limits. Furthermore, since assignments are performed according to
serviceability levels, we must guarantee that if the population from a center has been assigned
to shelter in a certain zone at a specific level of service then, population from that same center
may not be served by a shelter from that same zone on a different level of service. Constraints
(8) and (9) reflect our proposed approach of diving the networks into different zones.
Constraints (8) will determine the zone to which every assignment is made on all levels and
constraints (9) ensure that residents which were served in a specific zone at a certain level can
no longer be assigned to that same zone on a different level.
This model is applied taking into account: a maximum of five shelters (𝑝 = 5) and a 30%
probability (𝑞 = 0.3), of each shelter failing. For these considerations, the model presents the
results shown in Table 3.1.
Table 3.1 – Assignment results for p-median location model
Centers
1 2 3 4 5 6 7 8 9 10 11 12 13 14 15 16 17 18 19 20
Le
vel
of
Serv
ice
0 4 4 3 4 3 13 3 13 9 9 3 9 13 3 19 3 4 19 19 4
1 19 19 19 19 9 9 19 9 13 19 19 19 9 19 3 4 19 13 4 19
2 3 3 9 13 19 19 4 4 19 13 9 13 19 9 9 19 13 9 13 13
3 13 13 4 9 13 4 9 19 3 3 4 3 4 4 4 9 9 4 9 9
4 9 9 13 3 4 3 13 3 4 4 13 4 3 13 13 13 3 3 3 3

Location Models in Humanitarian Logistics 3 EVACUATION MODELS
Diogo Rafael dos Santos Forte 19
By analyzing Table 3.1 and the illustrations in Figure 3.4, we can observe that, for the
conditions that were taken into account, the network will have shelters located in centers 3, 4,
9, 13 and 19. This solution allows us to minimize the overall amount of distances travelled by
the region’s inhabitants in all the levels of service (14251.5 𝐾𝑚).
For a better understanding of the resulting assignments, in Table 3.2 we summarize the amount
of distances travelled according to each level of service:
Table 3.2 – p-median location model results in travelled distances
Level of service 0 1 2 3 4
Overall travelled distance (Km)
928.9 2314.8 3227.5 4039.5 4740.5
Average travelled distance per resident
(Km/resident) 0.8 2.0 2.9 3.6 4.2
Bearing in mind the objective, this model prioritizes locating a number of shelters (for this
instance 5) in the best set of places possible, in order to minimize the ℎ𝑗𝑑𝑗𝑘𝑋𝑗𝑘𝑟 component of
the problem in the totality of all levels of service, and not necessarily the best for each particular
Figure 3.4 – p-median location model for level of service: (A) 0 (B) 1 (C) 2 (D) 3 and (E) 4
Location Models in Humanitarian Logistics 3 EVACUATION MODELS
Diogo Rafael dos Santos Forte 20
group of residents. The solution presented in Figure 3.4 (A) shows the level-0 assignments (𝑟 =
0) for the instance that was described, representing what would ensue in the case of no failures
in any of the shelters. As explained earlier, solutions developed by this model are simply
hypothetical representations of what can follow a disaster. By analyzing the remaining
illustrations in Figure 3.4 (B; C; D and E), we can clearly understand that all represented
assignment solutions are impossible to take place. This is explained by the fact that a situation
where all population is assigned to their second, third, fourth of fifth closest shelter at the same
time is impossible. However, what is possible is situations where some populated centers are
assigned to their closest shelter, others are assigned to their second closest shelter and so on for
the remaining levels. So, in order to understand the solutions proposed, we have to consider
that assignments presented for each level are merely hypothetical situations of what would
occur if all population was assigned to shelters at a specific level of proximity. Furthermore,
solutions presented by this model are useful to understand assignments proposed by models
where specific failure occurrences are studied, since we already know in advance the
assignments that will be proposed by those models in case a certain populated center has to be
served by its first, second, third, fourth of fifth closest located shelter.
3.2.2 p-median fortification model
The developed p-median fortification model considers, for the most part, the same notations as
the p-median location model. However, seeing as it is developed with the intent of fortifying
an existent network of shelters, this model considers the following additional notation:
𝑲 denotes the set of existent rather than potential shelter locations – indexed with the
resulting shelter locations provided by the p-median location model;
𝑓 reflects the number of shelters to fortify;
𝑗𝑐 denotes the 𝑐th closest shelter to population in center 𝑗;
𝑑𝑗𝑐 represents the distance between population in center 𝑗 and its closest operational
shelter, given the fact that 𝑐 − 1 closest shelters to center 𝑗 are not protected and the 𝑐th
closest shelter to 𝑗 is.
The distance, 𝑑𝑗𝑐, is calculated as follows:
𝑑𝑗𝑐 = ∑ 𝑞𝑘−1(1 − 𝑞)𝑑𝑗𝑗𝑘
𝑐−1
𝑘=1
+ 𝑞𝑐−1𝑑𝑗𝑗𝑐 (10)
The latter differs from 𝑑𝑗𝑘 in the sense that it does not represent the distance from the population
in center 𝑗 to a shelter in site 𝑘, but rather that same distance influenced by the probability of
failure in each shelter, giving us information regarding the expected travelled distances.

Location Models in Humanitarian Logistics 3 EVACUATION MODELS
Diogo Rafael dos Santos Forte 21
The models determines the subset of existing shelters which are most suitable to be fortified. In
disaster situations, residents may be assigned to all the existing shelters but on this model, it
analyzes what would occur if the population was to be served exclusively by fortified shelters.
Regarding the notations, as no decision regarding the location of shelters has to me made in this
p-median fortification model, it does not take into account the same decision variables as the
model shown in previous chapter. The following sets of decision variables are taken into
consideration:
𝑍𝑘 = {1, 𝑖𝑓 𝑠ℎ𝑒𝑙𝑡𝑒𝑟 𝑘 𝑖𝑠 𝑓𝑜𝑟𝑡𝑖𝑓𝑖𝑒𝑑
0, 𝑜𝑡ℎ𝑒𝑟𝑤𝑖𝑠𝑒
𝑊𝑗𝑐 = {
1, 𝑖𝑓 𝑡ℎ𝑒 𝑐 − 1 𝑐𝑙𝑜𝑠𝑒𝑠𝑡 𝑠ℎ𝑒𝑙𝑡𝑒𝑟𝑠 𝑡𝑜 𝑝𝑜𝑝𝑢𝑙𝑎𝑡𝑖𝑜𝑛 𝑖𝑛 𝑗 𝑎𝑟𝑒
𝑛𝑜𝑡 𝑝𝑟𝑜𝑡𝑒𝑐𝑡𝑒𝑑 𝑏𝑢𝑡 𝑡ℎ𝑒 𝑐th 𝑐𝑙𝑜𝑠𝑒𝑠𝑡 𝑠ℎ𝑒𝑙𝑡𝑒𝑟 𝑖𝑠,0, 𝑜𝑡ℎ𝑒𝑟𝑤𝑖𝑠𝑒
Once all the factors mentioned above have been taken into account, the model is then
formulated as an integer programming problem, with the objective and constraint functions as
follows:
𝑚𝑖𝑛𝑖𝑚𝑖𝑧𝑒 ∑ ∑ ℎ𝑗𝑑𝑗𝑐𝑊𝑗𝑐
𝑝−𝑓+1
𝑐=1𝑗∈𝑱
(11)
(s.t):
∑ 𝑊𝑗𝑐
𝑝−𝑓+1
𝑐=1
= 1, ∀𝑗 ∈ 𝑱 (12)
𝑊𝑗𝑐 ≤ 𝑍𝑗𝑐, ∀𝑗 ∈ 𝑱, 𝑐 = 1, … , 𝑝 − 𝑓 + 1 (13)
𝑊𝑗𝑐 ≤ 1 − 𝑍𝑗𝑐−1, ∀𝑗 ∈ 𝑱, 𝑐 = 2, … , 𝑝 − 𝑓 + 1 (14)
∑ 𝑍𝑘
𝑘∈𝑲
= 𝑓 (15)
𝑊𝑗𝑐 ∈ {0,1}, ∀𝑗 ∈ 𝑱, 𝑐 = 1, … , 𝑝 − 𝑓 + 1 (16)
𝑍𝑘 ∈ {0,1}, ∀𝑘 ∈ 𝑲 (17)
The objective function (11) minimizes the overall expected travelled distances. It should be
noted at this point that the variable, 𝑊𝑗𝑐, and the travelled distances, 𝑑𝑗𝑐, only need to be defined
for values of 𝑐 between 1 and 𝑝 − 𝑓 + 1, as in the worst case possible, the closest protected
shelter to a resident living in center 𝑗 is 𝑝 − 𝑓 + 1. This situation occurs if the 𝑓 fortified shelters
Location Models in Humanitarian Logistics 3 EVACUATION MODELS
Diogo Rafael dos Santos Forte 22
are the furthest shelters from center 𝑗. So, if the 𝑝 − 𝑓 closest shelters to center 𝑗 fail, a resident
living in 𝑗 will be assigned to its 𝑝 − 𝑓 + 1 closest shelter.2
Constraints (12) guarantee that one of the 𝑝 − 𝑓 + 1 nearest shelters to center 𝑗 will be its
closest fortified shelter. The joint effect of constraints (13) and (14) ensure that an assignment
can only be made to a shelter that is protected, plus the assignment variable 𝑊𝑗𝑐 that equals 1
is the one linked with the smallest value of 𝑐, such that the 𝑐th closest shelter to 𝑗 is protected.
Summarizing, constraints (13) and (14) guarantee that once a shelter in whichever level of
proximity from a specific populated center is protected, then no further assignments are made
to a shelter on a higher level of proximity from that same center, even if it is protected. We take
this into account because once a protected shelter is found, on a certain level of proximity, then,
there will be no need for the population to considered further reallocation, since the shelter to
which they are assigned will already never fail. Constraints (15) limit the fortification resources
to a maximum of 𝑓 shelters that can be protected. Finally, constraints (16) and (17), require the
decision variables to be binary.
Application
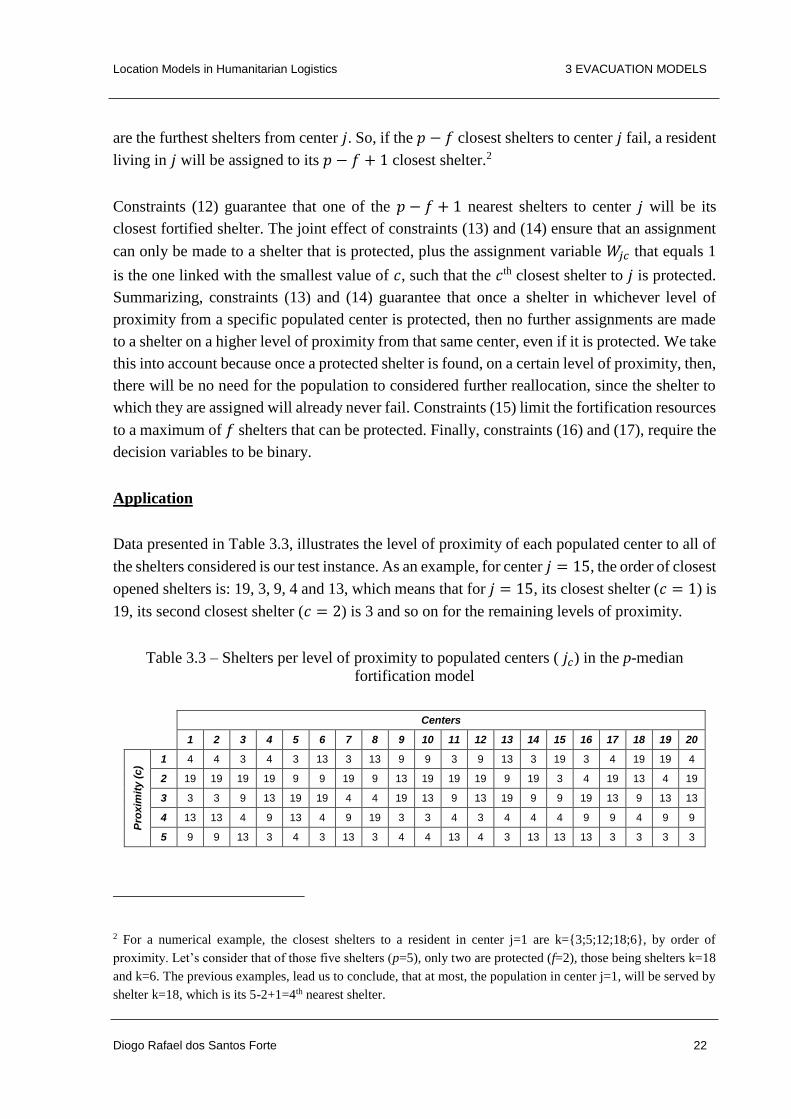
Data presented in Table 3.3, illustrates the level of proximity of each populated center to all of
the shelters considered is our test instance. As an example, for center 𝑗 = 15, the order of closest
opened shelters is: 19, 3, 9, 4 and 13, which means that for 𝑗 = 15, its closest shelter (𝑐 = 1) is
19, its second closest shelter (𝑐 = 2) is 3 and so on for the remaining levels of proximity.
Table 3.3 – Shelters per level of proximity to populated centers ( 𝑗𝑐) in the p-median
fortification model
2 For a numerical example, the closest shelters to a resident in center j=1 are k={3;5;12;18;6}, by order of
proximity. Let’s consider that of those five shelters (p=5), only two are protected (f=2), those being shelters k=18
and k=6. The previous examples, lead us to conclude, that at most, the population in center j=1, will be served by
shelter k=18, which is its 5-2+1=4th nearest shelter.
Centers
1 2 3 4 5 6 7 8 9 10 11 12 13 14 15 16 17 18 19 20
Pro
xim
ity (
c)
1 4 4 3 4 3 13 3 13 9 9 3 9 13 3 19 3 4 19 19 4
2 19 19 19 19 9 9 19 9 13 19 19 19 9 19 3 4 19 13 4 19
3 3 3 9 13 19 19 4 4 19 13 9 13 19 9 9 19 13 9 13 13
4 13 13 4 9 13 4 9 19 3 3 4 3 4 4 4 9 9 4 9 9
5 9 9 13 3 4 3 13 3 4 4 13 4 3 13 13 13 3 3 3 3

Location Models in Humanitarian Logistics 3 EVACUATION MODELS
Diogo Rafael dos Santos Forte 23
As the new distance matrix, 𝑑𝑗𝑐, is formulated according to the level of proximity of populated
centers to available shelters, the shelter corresponding to a certain value of proximity level, 𝑐,
changes from center to center, as each center has its own order of proximity to the located
shelters. The new distance matrix is presented Table 3.4 (See Appendix - Table A.7 for a clearer
and higher scale representation of the new distance matrix).
Table 3.4 – Distance matrix 𝑑𝑗𝑐 (in Km) for the p-median fortification model
The p-median fortification model, previously formulated in this chapter, is applied taking into
account: a maximum of amount two shelters which might be fortified (𝑓 = 2) and a 30%
probability (𝑞 = 0.3), of each shelter failing. Furthermore, it was assumed that the existing
network of shelters is a result of the locations determined by the p-median location model. For
these considerations, the model develops the results presented in Figure 3.5.
As expected, this model presents a significantly different solution than the one provided by the
p-median location model. The p-median location model produces assignments according to the
Centers
1 2 3 4 5 6 7 8 9 10 11 12 13 14 15 16 17 18 19 20
Pro
xim
ity (
c)
1 1 1.4 0 0 2.4 1 1 1 0 1 1 1 0 1.4 1 2.2 1 1 0 1.4
2 1.4 1.6 0.7 0.4 2.4 1 1.1 1.6 0.6 1.6 1.3 1.1 0.6 2.1 1.3 2.4 1.4 1.1 0.4 1.6
3 1.5 1.6 0.8 0.6 2.5 1.1 1.3 1.6 0.6 1.6 1.3 1.2 0.6 2.2 1.3 2.5 1.5 1.2 0.5 1.6
4 1.6 1.7 0.8 0.6 2.5 1.1 1.3 1.6 0.7 1.6 1.4 1.2 0.7 2.3 1.3 2.5 1.5 1.2 0.5 1.7
5 1.6 1.7 0.8 0.6 2.5 1.1 1.3 1.7 0.7 1.6 1.4 1.2 0.7 2.3 1.3 2.5 1.5 1.2 0.5 1.7
Figure 3.5 – p-median fortification model considering 𝑓 = 2
Location Models in Humanitarian Logistics 3 EVACUATION MODELS
Diogo Rafael dos Santos Forte 24
level of service that is considered, while the p-median fortification model takes into account the
locations of shelters determined by the design model and delivers a single solution, which
reassigns the population to a smaller subset of shelters (fortified) than the ones originally
determined by the design model.
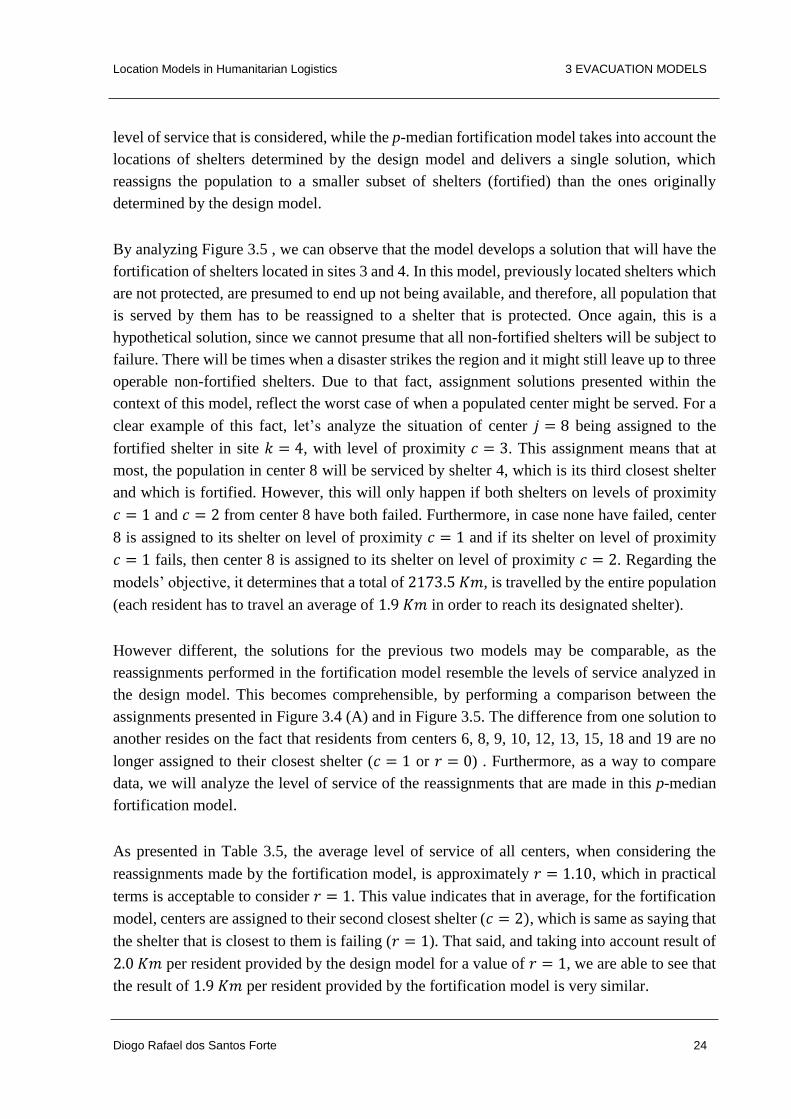
By analyzing Figure 3.5 , we can observe that the model develops a solution that will have the
fortification of shelters located in sites 3 and 4. In this model, previously located shelters which
are not protected, are presumed to end up not being available, and therefore, all population that
is served by them has to be reassigned to a shelter that is protected. Once again, this is a
hypothetical solution, since we cannot presume that all non-fortified shelters will be subject to
failure. There will be times when a disaster strikes the region and it might still leave up to three
operable non-fortified shelters. Due to that fact, assignment solutions presented within the
context of this model, reflect the worst case of when a populated center might be served. For a
clear example of this fact, let’s analyze the situation of center 𝑗 = 8 being assigned to the
fortified shelter in site 𝑘 = 4, with level of proximity 𝑐 = 3. This assignment means that at
most, the population in center 8 will be serviced by shelter 4, which is its third closest shelter
and which is fortified. However, this will only happen if both shelters on levels of proximity
𝑐 = 1 and 𝑐 = 2 from center 8 have both failed. Furthermore, in case none have failed, center
8 is assigned to its shelter on level of proximity 𝑐 = 1 and if its shelter on level of proximity
𝑐 = 1 fails, then center 8 is assigned to its shelter on level of proximity 𝑐 = 2. Regarding the
models’ objective, it determines that a total of 2173.5 𝐾𝑚, is travelled by the entire population
(each resident has to travel an average of 1.9 𝐾𝑚 in order to reach its designated shelter).
However different, the solutions for the previous two models may be comparable, as the
reassignments performed in the fortification model resemble the levels of service analyzed in
the design model. This becomes comprehensible, by performing a comparison between the
assignments presented in Figure 3.4 (A) and in Figure 3.5. The difference from one solution to
another resides on the fact that residents from centers 6, 8, 9, 10, 12, 13, 15, 18 and 19 are no
longer assigned to their closest shelter (𝑐 = 1 or 𝑟 = 0) . Furthermore, as a way to compare
data, we will analyze the level of service of the reassignments that are made in this p-median
fortification model.
As presented in Table 3.5, the average level of service of all centers, when considering the
reassignments made by the fortification model, is approximately 𝑟 = 1.10, which in practical
terms is acceptable to consider 𝑟 = 1. This value indicates that in average, for the fortification
model, centers are assigned to their second closest shelter (𝑐 = 2), which is same as saying that
the shelter that is closest to them is failing (𝑟 = 1). That said, and taking into account result of
2.0 𝐾𝑚 per resident provided by the design model for a value of 𝑟 = 1, we are able to see that
the result of 1.9 𝐾𝑚 per resident provided by the fortification model is very similar.

Location Models in Humanitarian Logistics 3 EVACUATION MODELS
Diogo Rafael dos Santos Forte 25
Table 3.5 – Levels of service in fortification reassignments
Center 6 8 9 10 12 13 15 18 19
New level of service (r) 3 2 3 3 3 3 1 3 1
Average reassignment level of service
2.44
Average level of service (all centers)
1.1
3.3 Scenario-Based Reliability Models
Scenario-based reliability models are designed with the intent of defining plans of evacuation
for specific disaster situations. For all scenarios, the model considers combinations of failure
events in the available site locations with the intent of preparing the network for as much
different situations as possible. Each scenario is associated with a probability of occurrence.
Furthermore, depending on the models’ objective, the number of scenarios which are
considered is subject to changes.
These models produce results that indicate the best course of action according to the disaster
occurrence that is being considered and in general, look to achieve a solution of shelter locations
and assignments that guarantees the minimum amount of travelled distances across all the
scenarios that are considered. Moreover, these models develop assignment solutions that always
allocate people to a shelter which is in a safe area and is operable. Like the models in the
previous chapter, the models within this group generate plans for the routing of each inhabitant,
from the center where they live until the site where their assigned shelter is to be located.
Furthermore, these models ensure that if any of the located shelters fails due to the occurrence
of a disaster, people are reassigned to the shelter that is immediately closer to them.
Within this group, three different models can be found: a scenario-based p-median location
model (design), a scenario-based p-median fortification model (fortification) and a minimax p-
median location model (design). We will present the formulation for all models, using the
location results from the design model as a basis for the application of the fortification model.
Furthermore, a comparison between results will be provided.
3.3.1 Scenario-based p-median location model
The scenario-based p-median location model takes into consideration most of the notations of
its proximity-based version, presented in Chapter 3.2.1. However, seeing as it is developed with
the intent of providing a solution that considers specific scenarios rather than general failure
occurrences, this model is subject to the following changes in notation, when compared to the
p-median location model:

Location Models in Humanitarian Logistics 3 EVACUATION MODELS
Diogo Rafael dos Santos Forte 26
Sets:
𝑺 – set of failure scenarios, indexed by s
Parameters:
𝑞𝑠 – Probability of scenario 𝑠 occurring
𝑎𝑘𝑠 = {1, 𝑖𝑓 𝑠ℎ𝑒𝑙𝑡𝑒𝑟 𝑘 𝑓𝑎𝑖𝑙𝑠 𝑖𝑛 𝑠𝑐𝑒𝑛𝑎𝑟𝑖𝑜 𝑠
0, 𝑜𝑡ℎ𝑒𝑟𝑤𝑖𝑠𝑒
Decision variables:
𝑋𝑗𝑘𝑠 = {1, 𝑖𝑓 𝑖𝑛ℎ𝑎𝑏𝑖𝑡𝑎𝑛𝑡 𝑗 𝑖𝑠 𝑎𝑠𝑠𝑖𝑔𝑛𝑒𝑑 𝑡𝑜 𝑠ℎ𝑒𝑙𝑡𝑒𝑟 𝑘 𝑖𝑛 𝑠𝑐𝑒𝑛𝑎𝑟𝑖𝑜 𝑠
0, 𝑜𝑡ℎ𝑒𝑟𝑤𝑖𝑠𝑒
Once all the factors mentioned above have been taken into account, the model is then
formulated as an integer programming problem, with the objective and constraint functions as
follows:
𝑚𝑖𝑛𝑖𝑚𝑖𝑧𝑒 ∑ 𝑞𝑠
𝑠∈𝑺
∑ ∑ ℎ𝑗𝑑𝑗𝑘𝑋𝑗𝑘𝑠
𝑘∈𝑲𝑗∈𝑱
(18)
(s.t): (2); (6)
∑ 𝑋𝑗𝑘𝑠
𝑘∈𝑲
= 1, ∀𝑗 ∈ 𝑱, 𝑠 ∈ 𝑺 (19)
𝑋𝑗𝑘𝑠 ≤ (1 − 𝑎𝑘𝑠)𝑌𝑘, ∀𝑗 ∈ 𝑱, 𝑘 ∈ 𝑲, 𝑠 ∈ 𝑺 (20)
𝑋𝑗𝑘𝑠 ∈ {0,1}, ∀𝑗 ∈ 𝑱, 𝑘 ∈ 𝑲, 𝑠 ∈ 𝑺 (21)
The objective function (18), minimizes the sum of travelled distances by all the inhabitants for
all the scenarios weighted by the probability of each scenario occurrence. It determines which
shelter locations are best in order for the travelled distances, corresponding the resulting
assignments, to be minimized across all scenarios. Constraints (19) state that each inhabitant 𝑗
is to be assigned to some shelter in each scenario. Constraints (20) guarantee that assignments
for each scenario can only be made to a shelter that is open and which as not failed. Finally,
constraints (6) and (21), require the decision variables to be binary.
Location Models in Humanitarian Logistics 3 EVACUATION MODELS
Diogo Rafael dos Santos Forte 27
Application
To ensure that a level of continuity is kept throughout all the models that are developed in this
dissertation, we continued to assume that the maximum number of located shelters would be
five (𝑝 = 5) and that a probability of failure of 30% would still be considered. However, this
time, that failure probability reflects the possibility of a certain zone being affected by a disaster.
We considered that failure occurrences were intimately connected to the zones that define the
network. Furthermore, as mentioned in Chapter 3.1, the association of failure occurrences to
specific zones enables us to present solutions that more easily reflect disaster situations.
Looking at the fact that we divided our network into five different zones, we propose only
taking into account situations where up to four out of those five zones are affected by disasters.
Table 3.6 shows the failure events that take place according to each scenarios that is considered
and presents their probability of occurrence. These occurrences of disasters in different zones
are independent events, and by dismissing the scenarios where five zones are affected
simultaneously, we will only be dismissing situations that occur with a probability of 0.24%
(𝑞𝑠 = 0.3 × 0.3 × 0.3 × 0.3 × 0.3 = 0.0024), which lets us plan for events of failure with a
good level of reliability. Furthermore, taking into account the notations that were used, the
single scenario that considers that no failures occur in any of the zones (𝑠 = 1), has a 16.8%
chance of taking place (𝑞𝑠 = (1 − 0.3)5 = 0.168). Furthermore, each scenario that reflects the
situation of a single zone being struck (scenarios 2 ≤ 𝑠 ≤ 6) has a 7.2% probability of occurring
(𝑞𝑠 = 0.3 × (1 − 0.3)4 = 0.072), scenarios which consider two simultaneous disasters
(scenarios 7 ≤ 𝑠 ≤ 16) have a 3.1% probability of occurring (𝑞𝑠 = 0.3 × 0.3 × (1 − 0.3)3 =
0.031), scenarios which consider three disasters occurrences (scenarios 17 ≤ 𝑠 ≤ 22) have a
1.3% probability of occurring (𝑞𝑠 = 0.3 × 0.3 × 0.3 × (1 − 0.3)2 = 0.013) and finally,
scenarios which consider four simultaneous disasters (scenarios 23 ≤ 𝑠 ≤ 25) have a 0.6%
probability of taking place (𝑞𝑠 = 0.3 × 0.3 × 0.3 × 0.3 × (1 − 0.3) = 0.006).The previously
described failure scenarios are illustrated as a binary matrix presented in the Appendix – Table
B.1.

Location Models in Humanitarian Logistics 3 EVACUATION MODELS
Diogo Rafael dos Santos Forte 28
Table 3.6 – Combination of failing zones according to scenarios
Total number of failing zones
Scenarios Combination of zones
that fail Probability of each
scenario
0 1 – 0.168
1
2 1
0.072
3 2
4 3
5 4
6 5
2
7 1+2
0.031
8 1+3
9 1+4
10 1+5
11 2+3
12 2+4
13 2+5
14 3+4
15 3+5
16 4+5
3
17 1+2+3
0.013
18 1+2+4
19 1+2+5
20 2+3+4
21 2+3+5
22 3+4+5
4
23 1+2+3+4
0.006 24 1+2+3+5
25 2+3+4+5
Furthermore, we assumed that each zone should only have located a shelter within its
confinements. This approach ensures that if a zone is affected by a disaster, no more than one
shelter will be left inoperable. To ensure this, we consider the following additional constraints
to the formulation:
∑ 𝑌𝑘
𝑘={3,14,16}
= 1 (22)
∑ 𝑌𝑘
𝑘={7,11,12,15,19}
= 1 (23)
∑ 𝑌𝑘
𝑘={5,9,10}
= 1 (24)
∑ 𝑌𝑘
𝑘={6,8,13,18}
= 1 (25)

Location Models in Humanitarian Logistics 3 EVACUATION MODELS
Diogo Rafael dos Santos Forte 29
∑ 𝑌𝑘
𝑘={1,2,4,17,20}
= 1 (26)
As the model develops different assignments for each scenario that is considered, we will
present an illustration of the resulting network assignments for the worst scenario in each of the
five situations that were considered. Furthermore as the assignments for the situation of no
failures are the exact same as in the p-median location model, presented in Figure 3.4 (A), there
will be no need to illustrate that situation.
In Figure 3.6, we can observe the resulting assignment solutions for each of the worst scenarios
in the remaining situations that were considered. As the considerations regarding the choice of
sites in which to locate shelters remain the same from previous models and given the fact that
no capacity limitations where considered, as expected, this model determines that shelters are
to be located in sites 3, 4, 9, 13 and 19. Furthermore, these are the five locations (one in each
zone) which offer the best conditions to guarantee that travelled distances amongst all the
population remains at a minimum.
Figure 3.6 – Scenario-based p-median location model for scenarios: (A) 2 (B) 13 (C) 19 and
(D) 25

Location Models in Humanitarian Logistics 3 EVACUATION MODELS
Diogo Rafael dos Santos Forte 30
As it pertains to the resulting assignments, it is now clear that this model presents solutions at
each scenario that always ensure that people from every center are being assigned to their
closest operable shelter. The data presented from Table 3.7 shows us all the results in terms of
average distances travelled by each resident. It now clear that the illustrated scenarios in Figure
3.6 are, in fact, the worst case for each of the disaster situations. From these illustrations we can
conclude an interesting fact: shelter 3 is the shelter that is located the furthest away from most
of the population, thus, when analyzing the situation where only one shelter remains functional,
the worst solution is the one where shelter 3 is operable (scenario 25). Another fact that is easily
verified is that the results get worse as the number of failing zones increases. Furthermore, for
the remaining scenarios that were not illustrated, situations would occur where less
reassignments due to shelter failures would take place. Additionally, the developed solution
allows for a total of 44955.4 𝐾𝑚 travelled across all the scenarios (absolute value, unaffected
by probabilities), which is the minimum possible, taking into account that each zone should
only have one shelter located within its confinements.
Table 3.7 – Results of scenario-based p-median location model
Scenarios Combination of zones
that fail Average travelled distance per resident (Km/resident)
1 – 0.82
2 1 1.16
3 2 0.99
4 3 1.04
5 4 1.05
6 5 1.10
7 1+2 1.46
8 1+3 1.41
9 1+4 1.38
10 1+5 1.45
11 2+3 1.29
12 2+4 1.25
13 2+5 1.62
14 3+4 1.40
15 3+5 1.32
16 4+5 1.32
17 1+2+3 1.41
18 1+2+4 1.72
19 1+2+5 2.31
20 2+3+4 1.92
21 2+3+5 1.93
22 3+4+5 1.67
23 1+2+3+4 2.69
24 1+2+3+5 2.87
25 2+3+4+5 3.01

Location Models in Humanitarian Logistics 3 EVACUATION MODELS
Diogo Rafael dos Santos Forte 31
3.3.2 Scenario-based p-median fortification model
Taking into account the necessary changes of perspective from a decision standpoint, in order
to develop this scenario-based p-median fortification model, we had to apply some changes to
notions used in the scenario-based p-median location: 𝑲 denotes the set of existent rather than
potential shelter locations – indexed with the resulting shelter locations provided by the the
scenario-based p-median location model; 𝑓 reflects the limitations in terms of the number of
shelters that can be fortified; as in the p-median fortification model, 𝑍𝑘 is now the main decision
variable, deciding upon which shelters will be fortified. Furthermore, once all the factors
mentioned above have been taken into account, the model is then formulated as an integer
programming problem, with the objective and constraint functions as follows:
Objective function: (18)
(s.t): (15); (17); (19); (21)
𝑋𝑗𝑘𝑠 ≤ (1 − 𝑎𝑘𝑠) + 𝑎𝑘𝑠𝑍𝑘 , ∀𝑗 ∈ 𝑱, 𝑘 ∈ 𝑲, 𝑠 ∈ 𝑺 (27)
Sharing every other restriction with the p-median fortification model and the scenario-based p-
median location, only constraints (27) illustrate a different reality, by imposing that a shelter
that has failed (𝑎𝑘𝑠 = 1) cannot accommodate any resident, unless it has been fortified.
Furthermore, the previous constraints allow a non-failing shelter (𝑎𝑘𝑠 = 0), be it fortified or
not, to accommodate residents. Because of this, it is now clear how considering pre-defined
disaster scenarios affects the assignment results. More specifically, when compared to the p-
median fortification model, this model produces assignments which resemble disaster
situations: if a shelter is failing, then the population assigned to that shelter is immediately
reassigned to their second closest operational shelter, which isn’t necessarily a fortified shelter,
as it might simply be another non-fortified shelter that has not failed in the scenario that is being
considered. As it pertains to the results, this model presents solutions that guarantee that each
resident is always being assigned to their closest operational shelter and also ensure that the
location of fortified shelters are determined in order have the least amount of travelled distances
across all scenarios.
Application
Once again, to ensure that a level of continuity is kept throughout the all the models that are
developed in this dissertation, we continued to assume that the maximum number of fortified
shelters would be two (𝑓 = 2) and that a probability of a disaster occurrence in each zone of
the network would still be 30%. Furthermore, we consider the same exact situations and
scenario probabilities as in the scenario-based p-median location model. Furthermore, as this
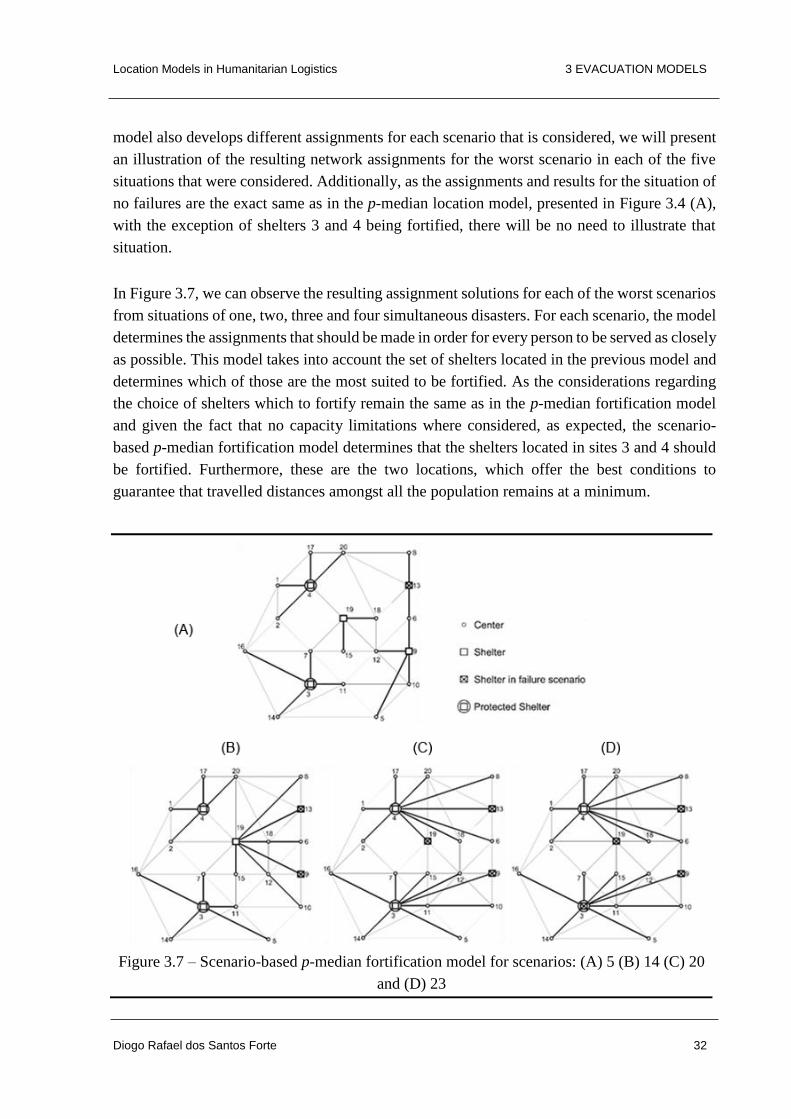
Location Models in Humanitarian Logistics 3 EVACUATION MODELS
Diogo Rafael dos Santos Forte 32
model also develops different assignments for each scenario that is considered, we will present
an illustration of the resulting network assignments for the worst scenario in each of the five
situations that were considered. Additionally, as the assignments and results for the situation of
no failures are the exact same as in the p-median location model, presented in Figure 3.4 (A),
with the exception of shelters 3 and 4 being fortified, there will be no need to illustrate that
situation.
In Figure 3.7, we can observe the resulting assignment solutions for each of the worst scenarios
from situations of one, two, three and four simultaneous disasters. For each scenario, the model
determines the assignments that should be made in order for every person to be served as closely
as possible. This model takes into account the set of shelters located in the previous model and
determines which of those are the most suited to be fortified. As the considerations regarding
the choice of shelters which to fortify remain the same as in the p-median fortification model
and given the fact that no capacity limitations where considered, as expected, the scenario-
based p-median fortification model determines that the shelters located in sites 3 and 4 should
be fortified. Furthermore, these are the two locations, which offer the best conditions to
guarantee that travelled distances amongst all the population remains at a minimum.
Figure 3.7 – Scenario-based p-median fortification model for scenarios: (A) 5 (B) 14 (C) 20
and (D) 23

Location Models in Humanitarian Logistics 3 EVACUATION MODELS
Diogo Rafael dos Santos Forte 33
Regarding the resulting assignments, it is now clear that this model presents solutions at each
scenario that always ensure that people from every center are being assigned to their closest
operable shelter. Furthermore, as in the previous chapter, we will summarize the resulting
assignments according to the disaster situation that is being considered. The data presented on
Table 3.8 shows us all the results in terms of average distances travelled by each resident. It is
now clear that the illustrated scenarios in Figure 3.7 are, in fact, the worst case for each of the
disaster situations. Additionally, regarding the models’ objective, the developed solution allows
for a total of 33358.4 𝐾𝑚 travelled across all the scenarios (absolute value, unaffected by
probabilities), which is the minimum possible.
Table 3.8 – Results of scenario-based p-median fortification model
Scenarios Combination of zones
that fail Average travelled distance per resident (Km/resident)
1 – 0.82
2 1 0.82
3 2 0.99
4 3 1.04
5 4 1.05
6 5 0.82
7 1+2 0.98
8 1+3 1.04
9 1+4 1.05
10 1+5 0.82
11 2+3 1.29
12 2+4 1.25
13 2+5 0.99
14 3+4 1.40
15 3+5 1.04
16 4+5 1.05
17 1+2+3 1.04
18 1+2+4 1.25
19 1+2+5 0.99
20 2+3+4 0.92
21 2+3+5 1.29
22 3+4+5 1.40
23 1+2+3+4 1.92
24 1+2+3+5 1.29
25 2+3+4+5 1.92
At this point, a comparison between the results proposed by the scenario-based p-median
location and fortification models, respectively, would contribute towards a better understanding
of the assignments that are proposed. Analyzing the data presented in Table 3.7 and Table 3.8,
it is clear that the fortification model develops solutions that are much more advantageous than
the ones presented in the design model. Furthermore, this is always to be expected (no matter

Location Models in Humanitarian Logistics 3 EVACUATION MODELS
Diogo Rafael dos Santos Forte 34
the failure conditions), since the fortification model selects the best subset of two shelters
located in the design model and considers that they are immune to disaster effects. By taking
this approach, we always guarantee, like it was expressed in the p-median fortification model,
that a populated center is never assigned to the shelter that is its fifth closest (in terms of
proximity: 𝑐 = 5), which consequently means that the hypothetical assignments for the last
level of service (𝑟 = 4), produced in the p-median location model, will never take place. In the
same line of thought, this model tell us, that at most, in the worst case possible, a center will
always be served by a shelter that is its fourth closest and which is fortified. All of this facts are
reflected in the difference of results in terms of assignments between both of the previous two
scenario-based models: we register an average reduction of travelled distances per scenario of
about 22%, if we take into account the solutions presented by the fortification model; the
objective function value of the fortification model (33358.4 𝐾𝑚) represents a 35% reduction
of the value determined by its corresponding location model (44955.4 𝐾𝑚).
3.3.3 Minimax p-median location model
The minimax p-median location model developed in this dissertation, aims at optimizing the
assignments for the worst possible scenario of shelter locations. More specifically, this model
develops a solution that guarantees that the scenario with the most travelled distances, will be
the one to which the optimal solution is found. In disaster situations, this model reflects the
need to consider the effects of catastrophic and unlikely disaster events, and ensure that the
planning for those situations are conducted with the utmost level of importance. Furthermore,
in regards to its notations and considerations, this model differs only on a single constraint when
compared to the scenario-based p-median location model. Additionally, a new decision variable
𝑈, which equals the distances travelled in the worst scenario of all that are considered.
Once all the factors mentioned above have been taken into account, the model is then
formulated as an integer programming problem, with the objective and constraint functions as
follows:
𝑚𝑖𝑛𝑖𝑚𝑖𝑧𝑒 𝑈 (28)
(s.t): (2); (6); (19); (20); (21)
∑ ∑ ℎ𝑗𝑑𝑗𝑘𝑋𝑗𝑘𝑠
𝑘∈𝑲𝑗∈𝑱
≤ 𝑈, ∀𝑠 ∈ 𝑺 (29)
The objective function (28), determines the location of shelters, which minimizes the distances
travelled in the worst case scenario, exclusively. Furthermore, constraints (29) determine the
distances that are travelled in the worst scenario, U, and identifies in which scenario that worst-
case result in taking place.

Location Models in Humanitarian Logistics 3 EVACUATION MODELS
Diogo Rafael dos Santos Forte 35
Application
To ensure a good level of cohesion between all the presented solutions, for this model, we
continued to consider that the maximum number of located shelters would be five (𝑝 = 5) and
that a probability of a disaster occurrence in each zone would be 30%. In order to perform a
thorough study of the solutions developed within the context of prioritizing the planning for the
worst case scenario, we should analyze the compromises that we would be making in order to
guarantee the upmost level of safety for the worst case scenario. For that, we start by analyzing
what would occur if we remained considering the possibility of up to four simultaneous
disasters. For these conditions, it is expected that the model prioritizes the optimization of
assignments for one of the scenarios which considers four simultaneous failures, since the
solution with the worst assignments is clearly represented within this group of scenarios
(scenarios 23 ≤ 𝑠 ≤ 25). Table 3.9 illustrates the solutions achieved with this approach.
Table 3.9 - Results of minimax p-median location model
Scenarios Combination of zones that fail
p-median location model result (Km/resident)
Minimax p-median model result (Km/resident
Increase in percentage (%)
1 – 0.80 2.79 240
2 1 1.16 2.61 125
3 2 0.99 2.69 173
4 3 1.04 2.74 164
5 4 1.05 2.33 123
6 5 1.10 3.01 175
7 1+2 1.46 2.78 91
8 1+3 1.41 2.75 95
9 1+4 1.38 2.34 70
10 1+5 1.45 2.75 90
11 2+3 1.29 2.83 119
12 2+4 1.25 2.88 129
13 2+5 1.62 3.01 85
14 3+4 1.40 2.82 102
15 3+5 1.32 3.01 129
16 4+5 1.32 3.01 128
17 1+2+3 1.41 2.71 92
18 1+2+4 1.72 2.96 72
19 1+2+5 2.31 2.91 26
20 2+3+4 1.92 2.75 43
21 2+3+5 1.93 3.01 56
22 3+4+5 1.67 3.01 80
23 1+2+3+4 2.69 2.69 0
24 1+2+3+5 2.87 2.98 0
25 2+3+4+5 3.01 3.01 0

Location Models in Humanitarian Logistics 3 EVACUATION MODELS
Diogo Rafael dos Santos Forte 36
The results presented in Table 3.9 enable us to understand just how much effect the optimization
of a statistically insignificant has on an entire array of more likely scenarios. The results
presented by this model, while still considering occurrences of up to four failures (which occur
with 0.6% probability), represent an average increase of 109% for the scenarios that were
subject to changes. Furthermore, these results allow us to say, without a shadow of a doubt, that
determining the location of shelters in order to plan specifically for the occurrence of scenario
25 (which is the one prioritized) is the wrong course of action to take in this situation. As we
can see, although the model aims at optimizing the worst case scenario, it fails to do so, because
for the situations of four failure occurrences, the location of shelters and assignments are
already optimized, thus the 0% difference in the results from scenarios 23 until 25.
In an effort to find a compromise that seems admissible, we propose analyzing the results of
shelter locations and assignments only for situations which are more likely to occur. In that
sense, situations of three and four simultaneous disasters should be dismissed, since they
present low and almost insignificant probabilities of occurring: 0.6 % for situations of four
simultaneous failures and 1.3% for situations of three disasters. With this approach, the array
of scenarios that are considered is reduced to a set of 16 different scenarios, covering situations
of no failures, one failure and two simultaneous failures (Table 3.6). For this approach, we will
once again compare the results provided by this model with the ones provided by the scenario-
based p-median location model, in an attempt to determine whether or not a compromise should
be made to achieve better results for significantly more dangerous disaster occurrences. This
comparison is represented in Table 3.10.
Table 3.10 – Results for the second approach of the minimax p-median location model
Scenarios Combination of zones that fail
p-median location model result (Km/resident)
Minimax p-median model result (Km/resident
Increase in percentage (%)
1 – 0.80 1.35 64
2 1 1.16 1.37 18
3 2 0.99 1.50 52
4 3 1.04 1.40 35
5 4 1.05 1.29 23
6 5 1.10 1.44 32
7 1+2 1.46 1.37 -6
8 1+3 1.41 1.50 6
9 1+4 1.38 1.51 9
10 1+5 1.45 1.52 5
11 2+3 1.29 1.49 15
12 2+4 1.25 1.44 15
13 2+5 1.62 1.46 -10
14 3+4 1.40 1.40 0
15 3+5 1.32 1.41 7
16 4+5 1.32 1.45 10
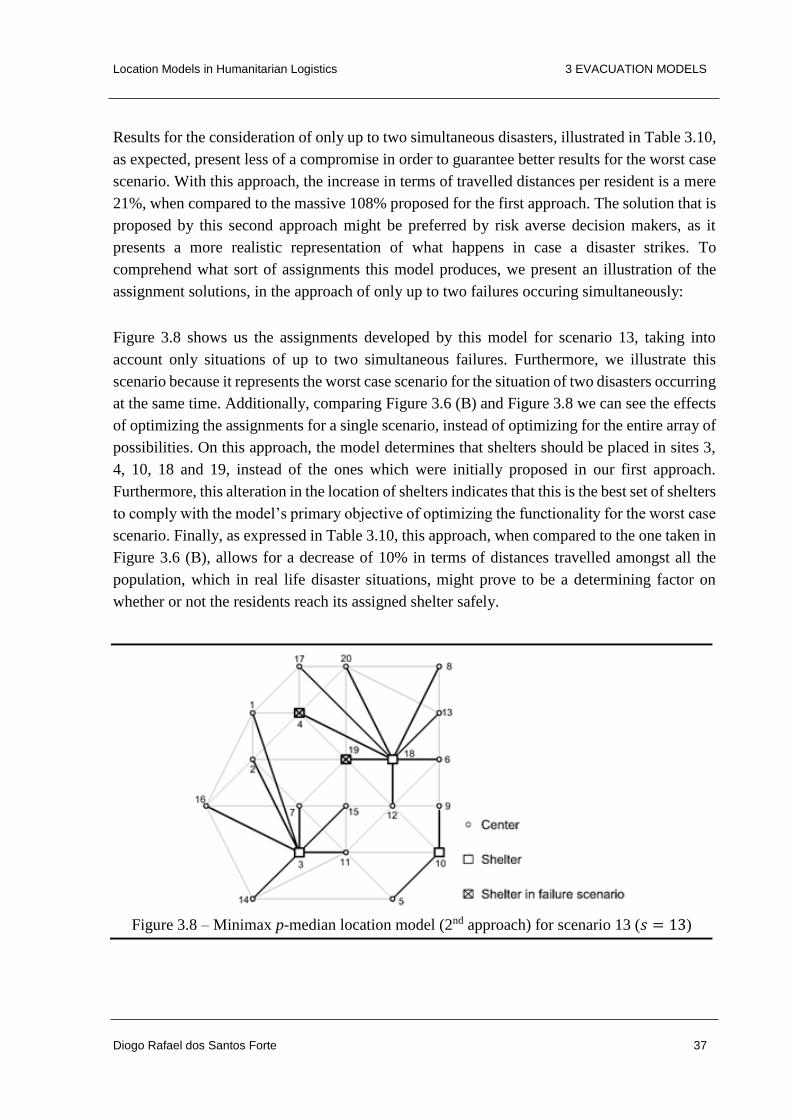
Location Models in Humanitarian Logistics 3 EVACUATION MODELS
Diogo Rafael dos Santos Forte 37
Results for the consideration of only up to two simultaneous disasters, illustrated in Table 3.10,
as expected, present less of a compromise in order to guarantee better results for the worst case
scenario. With this approach, the increase in terms of travelled distances per resident is a mere
21%, when compared to the massive 108% proposed for the first approach. The solution that is
proposed by this second approach might be preferred by risk averse decision makers, as it
presents a more realistic representation of what happens in case a disaster strikes. To
comprehend what sort of assignments this model produces, we present an illustration of the
assignment solutions, in the approach of only up to two failures occuring simultaneously:
Figure 3.8 shows us the assignments developed by this model for scenario 13, taking into
account only situations of up to two simultaneous failures. Furthermore, we illustrate this
scenario because it represents the worst case scenario for the situation of two disasters occurring
at the same time. Additionally, comparing Figure 3.6 (B) and Figure 3.8 we can see the effects
of optimizing the assignments for a single scenario, instead of optimizing for the entire array of
possibilities. On this approach, the model determines that shelters should be placed in sites 3,
4, 10, 18 and 19, instead of the ones which were initially proposed in our first approach.
Furthermore, this alteration in the location of shelters indicates that this is the best set of shelters
to comply with the model’s primary objective of optimizing the functionality for the worst case
scenario. Finally, as expressed in Table 3.10, this approach, when compared to the one taken in
Figure 3.6 (B), allows for a decrease of 10% in terms of distances travelled amongst all the
population, which in real life disaster situations, might prove to be a determining factor on
whether or not the residents reach its assigned shelter safely.
Figure 3.8 – Minimax p-median location model (2nd approach) for scenario 13 (𝑠 = 13)

Location Models 4 RELIEF DISTRIBUTION / STOCK PRE-POSITIONING MODELS
in Humanitarian Logistics
Diogo Rafael dos Santos Forte 38
4 RELIEF DISTRIBUTION / STOCK PRE-POSITIONING MODELS
Within the available literature, as it was expressed in Chapter 2.2, there are a variety of models
that consider planning for relief distribution. From all the analyzed models, we selected two for
their simplicity and applicability: Horner and Downs (2010) and Rawls and Turnquist (2010).
Both models look to provide solutions that allow for a better understanding of how to overcome
uncertainties related to disaster situations. Furthermore, they both have the same basic
underlying problem: locating a set of distribution centers and determining the amount of
commodities that they should hold in order to serve as relief sources for all the needs that the
affected population has.
However similar, these models present a fundamental difference: Horner and Downs (2010)
consider a single type of general commodity that is demanded while Rawls and Turnquist
(2010) take into account different types of commodities, each one needing a different level of
demand to be serviced. Although they consider different types of conditions, they both take an
approach to locate a single type of general relief distribution facility, divided into
categories/level according to the stock holding capacity that each one has. This disparity, lead
us to analyze a different approach for the model proposed by Rawls and Turnquist (2010) and
develop a model that would allow for the location of different types of facilities, which would
be assigned to serve only demand from a specific type of commodity. In sum, we will present
one model single commodity/single that locates a single type of facility (with different capacity
levels) which serves a single type of commodity demand and develop another model that
considers a variety of demand types and locates different types of facilities, according to their
capability of holding stock from the various types of commodity demand. In this chapter, we
will describe the approaches taken to reproduce the previously stated models, present the
adaptations from the original models and compare results between each approach that is taken.
4.1 Single Commodity/Single Facility Model
Horner and Downs (2010) formulated a model to optimize the distribution of disaster relief
goods during the occurrence of events like hurricanes. The model presented in this chapter is
an adaptation of the model developed by those authors and studies the problem of locating two
different classes of emergency facilities: primary and “break of bulb” distribution centers
(BOB). Furthermore, the model assures that each facility is stocked with the necessary amount
of relief goods in order to serve the assigned population with the demanded level of quantity.
Additionally, the two classes of distribution centers considered vary according to the level of

Location Models 4 RELIEF DISTRIBUTION / STOCK PRE-POSITIONING MODELS
in Humanitarian Logistics
Diogo Rafael dos Santos Forte 39
stock that they are able to store and distribute: primary distribution centers have bigger capacity
while BOB’s have a reduced level of capacity. As a result, this will likely lead BOB’s to be
more closely located to isolated populations, therefore allowing for a better overall solution in
terms of accessibility amongst residents. Finally, a set of “logistical staging areas” (LSA) are
considered in order to represent the primary source of relief goods, which is responsible for the
transportation and stocking of relief goods to each located distribution center. In this chapter,
we will present the changes that were applied to the original network of centers (presented in
Chapter 3.1) as well as the factors and notations that were taken into account to develop a
similar method to that of Horner and Downs (2010).
For the purposes that are intended and taking into account the necessary changes to fit the
available data, the single commodity/single facility model, developed in this dissertation,
considers the following notations:
Sets:
𝑱 – set of centers, indexed by j
𝑲 – set of sites, indexed by k
𝑰 – set of LSA locations, indexed by i
𝑵 – set of types of distribution centers, indexed by n
Parameters:
𝑎𝑗 – Demand of resources in location 𝑗 𝜖 𝑱
𝑑𝑖𝑘 – Distance from distribution center 𝑘 𝜖 𝑲 to LSA location 𝑖 𝜖 𝑰
𝑑𝑗𝑘 – Shortest path distance from center 𝑗 𝜖 𝑱 to site 𝑘 𝜖 𝑲
𝑝𝑛 – Maximum number of distribution centers of type 𝑛 𝜖 𝑵
𝑒𝑛 – Maximum holding capacity of distribution centers of type 𝑛 𝜖 𝑵
Decision variables:
𝑋𝑖𝑘𝑛 – Resources transported from LSA 𝑖 𝜖 𝑰 and stocked on facility 𝑘 𝜖 𝑲 of type 𝑛 𝜖 𝑵
𝑍𝑘𝑛 = {1, 𝑖𝑓 𝑑𝑖𝑠𝑡𝑟𝑖𝑏𝑢𝑡𝑖𝑜𝑛 𝑐𝑒𝑛𝑡𝑒𝑟 𝑘 𝑜𝑓 𝑡𝑦𝑝𝑒 𝑛 𝑖𝑠 𝑜𝑝𝑒𝑛𝑒𝑑
0, 𝑜𝑡ℎ𝑒𝑟𝑤𝑖𝑠𝑒
𝑌𝑗𝑘𝑛 = {1, 𝑖𝑓 𝑖𝑛ℎ𝑎𝑏𝑖𝑡𝑎𝑛𝑡𝑠 𝑓𝑟𝑜𝑚 𝑐𝑒𝑛𝑡𝑒𝑟 𝑗 𝑎𝑟𝑒 𝑎𝑠𝑠𝑖𝑔𝑛𝑒𝑑 𝑡𝑜 𝑓𝑎𝑐𝑖𝑙𝑖𝑡𝑦 𝑘 𝑜𝑓 𝑡𝑦𝑝𝑒 𝑛
0, 𝑜𝑡ℎ𝑒𝑟𝑤𝑖𝑠𝑒

Location Models 4 RELIEF DISTRIBUTION / STOCK PRE-POSITIONING MODELS
in Humanitarian Logistics
Diogo Rafael dos Santos Forte 40
Once all the factors mentioned above have been taken into account, the model is then
formulated as an integer programming problem, with the objective and constraint functions as
follows:
𝑚𝑖𝑛𝑖𝑚𝑖𝑧𝑒 ∑ ∑ ∑ 𝑑𝑖𝑘𝑋𝑖𝑘𝑛
𝑛∈𝑵𝑘∈𝑲𝑖∈𝑰
+ ∑ ∑ ∑ 𝑎𝑗𝑑𝑗𝑘𝑌𝑗𝑘𝑛
𝑛∈𝑵𝑘∈𝑲𝑗∈𝑱
(30)
(s.t):
∑ 𝑍𝑘𝑛
𝑘∈𝑲
≤ 𝑝𝑛, ∀𝑛 ∈ 𝑵 (31)
∑ 𝑋𝑖𝑘𝑛
𝑖∈𝑰
= ∑ 𝑎𝑗𝑌𝑗𝑘𝑛
𝑗∈𝑱
, ∀𝑘 ∈ 𝑲, 𝑛 ∈ 𝑵 (32)
∑ ∑ 𝑌𝑗𝑘𝑛
𝑛∈𝑵𝑘∈𝑲
= 1, ∀𝑗 ∈ 𝑱 (33)
𝑍𝑘𝑛 ≥ 𝑌𝑗𝑘𝑛, ∀𝑘 ∈ 𝑲, 𝑗 ∈ 𝑱, 𝑛 ∈ 𝑵 (34)
∑ 𝑎𝑗𝑌𝑗𝑘𝑛
𝑗∈𝑱
≤ 𝑒𝑛, ∀𝑘 ∈ 𝑲, 𝑛 ∈ 𝑵 (35)
𝑍𝑘𝑛 = 0, ∀𝑛 ∈ 𝑵, 𝑘 = 21, … ,24 (36)
𝑌𝑗𝑘𝑛 ∈ {0,1}, ∀ 𝑗 ∈ 𝑱, 𝑘 ∈ 𝑲, 𝑛 ∈ 𝑵 (37)
𝑍𝑘𝑛 ∈ {0,1}, ∀𝑘 ∈ 𝑲, 𝑛 ∈ 𝑵 (38)
The objective function (30), minimizes the overall travelled distances while distributing relief
goods from LSA’s to population centers through 𝑛 types of intermediate distribution centers.
The first term represents the distances that are travelled in order to pre-position stock of relief
goods in both types of distribution center. The second term represents the distances travelled
by the population in order to have access to relief goods in both types of distribution centers.
The inclusion of (30) aims at creating a balance between the two phases of transportation
involved, in order to guarantee the quickest stocking of facilities possible while minimizing the
travelled distances by the population.
Constraints (31) reflect the budgetary and operational limitations by way of imposing that the
maximum number of each 𝑛-type distribution center is 𝑝𝑛. Constraints (32) mandate that
demand served by distribution centers is to be provided by LSA’s. Constraints (33) regulate
that demand from populated areas may only be served by a single distribution center, be it a
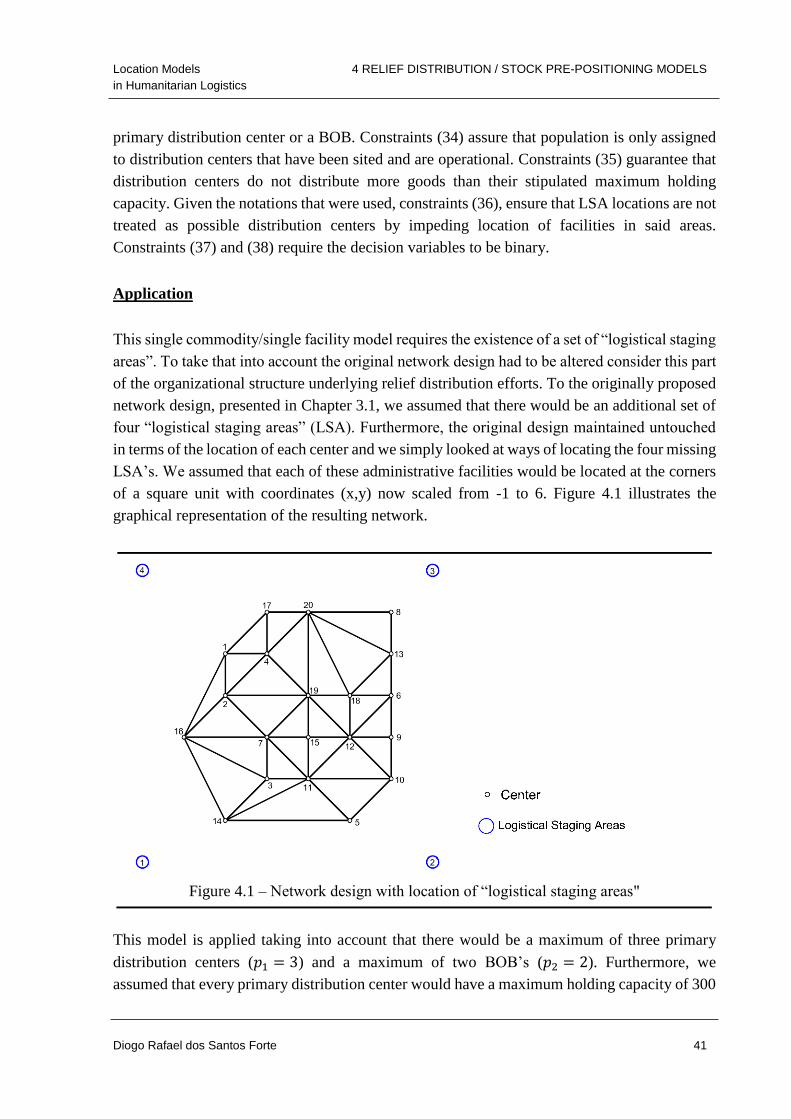
Location Models 4 RELIEF DISTRIBUTION / STOCK PRE-POSITIONING MODELS
in Humanitarian Logistics
Diogo Rafael dos Santos Forte 41
primary distribution center or a BOB. Constraints (34) assure that population is only assigned
to distribution centers that have been sited and are operational. Constraints (35) guarantee that
distribution centers do not distribute more goods than their stipulated maximum holding
capacity. Given the notations that were used, constraints (36), ensure that LSA locations are not
treated as possible distribution centers by impeding location of facilities in said areas.
Constraints (37) and (38) require the decision variables to be binary.
Application
This single commodity/single facility model requires the existence of a set of “logistical staging
areas”. To take that into account the original network design had to be altered consider this part
of the organizational structure underlying relief distribution efforts. To the originally proposed
network design, presented in Chapter 3.1, we assumed that there would be an additional set of
four “logistical staging areas” (LSA). Furthermore, the original design maintained untouched
in terms of the location of each center and we simply looked at ways of locating the four missing
LSA’s. We assumed that each of these administrative facilities would be located at the corners
of a square unit with coordinates (x,y) now scaled from -1 to 6. Figure 4.1 illustrates the
graphical representation of the resulting network.
Figure 4.1 – Network design with location of “logistical staging areas"
This model is applied taking into account that there would be a maximum of three primary
distribution centers (𝑝1 = 3) and a maximum of two BOB’s (𝑝2 = 2). Furthermore, we
assumed that every primary distribution center would have a maximum holding capacity of 300

Location Models 4 RELIEF DISTRIBUTION / STOCK PRE-POSITIONING MODELS
in Humanitarian Logistics
Diogo Rafael dos Santos Forte 42
units (𝑒1 = 300) and that BOB’s would a maximum of 150 units (𝑒2 = 150). Regarding the
demand data, we assumed that the number of people in need of emergency commodities would
be the same as the number of people in need of evacuation (see Appendix – Table A.2).
Figure 4.2 shows the results of this model, for the conditions that were mentioned above. It
shows that, for the conditions that were taken into account, a set of five distribution centers
should be located in order to achieve the desired objectives. More specifically, three primary
distribution centers, located in sites 1, 8 and 10, and a complementary set of two BOB’s, located
in sites 5 and 14. Furthermore, this solution represents an overall amount of 3926.6 𝐾𝑚 in
travelled distances, more specifically, 2469 𝐾𝑚 in the transportation of stock and 1457.6 𝐾𝑚
in the distribution of resources to the population. Additionally, these values represent an
average of 2.2 𝐾𝑚 and 1.3 𝐾𝑚 of travelled distances per demand unit in the transportation of
stock and in the distribution of resources, respectively.
Figure 4.2 – Solution for the single commodity/single facility model
Regarding the locations and assignments that were determined, it is clear that by assuming the
same level of importance on both terms of the objective function (30), the model always looks
to minimize the component of positioning stock in distribution centers first and only then looks
for the best combination of assignments to minimize the distances travelled by the population.
Although the population does not travel the ideally smallest amount of distances possible, the
approach that is taken in this model allows for the fastest pre-positioning of stock in located
distribution centers, which is an indirect benefit to the population that offsets the disadvantages
of them having to travel a slightly increased distance to receive the necessary aid.
Location Models 4 RELIEF DISTRIBUTION / STOCK PRE-POSITIONING MODELS
in Humanitarian Logistics
Diogo Rafael dos Santos Forte 43
This model is mainly influenced by the number of each type of distribution centers.
Furthermore, if we were to consider a limited number of primary distributions centers (𝑝1 = 2),
an amount of two additional BOB’s (𝑝2 = 4) would have to be created to provide the necessary
number of relief goods. This would result in an overall solution of 2613 𝐾𝑚 (2.3 𝐾𝑚 per
demand unit) travelled distances in transportation of stock and 1313.6 𝐾𝑚 (1.2 𝐾𝑚 per
demand unit) in travelled distances in the distribution of resources to the population. The sum
of both parts (3926.6 𝐾𝑚) matches the total result presented in Figure 4.2. Although the results
are identical on both situations in terms of combined distances (stocking + distribution), in this
last case, the distances travelled by the population would be smaller since the total number of
distribution centers would be six instead of the original five shown in Figure 4.2. All told, an
increase in the overall number of facilities is always accompanied by a decrease in the distances
travelled by the population and not necessarily in the distances travelled to transport supplies
from LSA’s to distribution centers.
4.2 Multiple Commodities/Multiple Facilities Model
Rawls and Turnquist (2010) formulate a model for the location of facilities that perform the
distribution of various types of pre-stocked commodities according to demands provided by
scenario-based disaster situations. This multiple commodities/multiple facilities model
developed within this dissertation consists of a variation of the latter. It considers that each type
of facility as a specific kind of demand that it might serve and that the levels of demand for
each type of resource vary according to the gravity of scenarios that are considered. Each
scenario is associated with a probability of occurrence. The problem is formulated as an
optimization model, in which the objective is to minimize the distances travelled by the
population in order to receive assistance for all the commodities that might be needed. The
model looks to minimize the distance results over all scenarios and presents assignment
solutions according to each commodity and each scenario of demand levels.
In order to adapt the original model presented by Rawls and Turnquist (2010) to the changes of
perspective that were taken in this dissertation for this particular problem, the following
notations were considered:
Sets:
𝑱 – set of centers, indexed by j
𝑲 – set of sites, indexed by k
𝑻 – set of types of commodities, indexed by t
𝑳 – set of facility types, indexed by l

Location Models 4 RELIEF DISTRIBUTION / STOCK PRE-POSITIONING MODELS
in Humanitarian Logistics
Diogo Rafael dos Santos Forte 44
𝑺 – set of scenarios, indexed by s
Factors:
𝑣𝑗𝑡𝑠 – Demand of commodity 𝑡 𝜖 𝑻 in center 𝑗 𝜖 𝑱 during scenario 𝑠 𝜖 𝑺
𝑚𝑙𝑡 – Maximum holding capacity of commodity 𝑡 𝜖 𝑻 in facility type 𝑙 𝜖 𝑳
𝑔𝑘𝑡 – Amount of commodity 𝑡 𝜖 𝑻 pre-stocked on site 𝑘 𝜖 𝑲
𝑑𝑗𝑘– Shortest path distance from center 𝑗 𝜖 𝑱 to site 𝑘 𝜖 𝑲
𝑝𝑙 – Maximum number of facility type 𝑙 𝜖 𝑳
𝑞𝑟𝑠 – Probability of scenario 𝑠 𝜖 𝑺 occurring
𝑀 – Penalty factor
Decision variables:
𝑋𝑗𝑘𝑡𝑠 – Demand of commodity 𝑡 𝜖 𝑻 from center 𝑗 𝜖 𝑱 that is served in facility located in site
𝑘 𝜖 𝑲 during scenario 𝑠 𝜖 𝑺
𝑌𝑘𝑙 = {1, 𝑖𝑓 𝑓𝑎𝑐𝑖𝑙𝑖𝑡𝑦 𝑜𝑓 𝑡𝑦𝑝𝑒 𝑙 𝜖 𝑳 𝑖𝑠 𝑜𝑝𝑒𝑛𝑒𝑑 𝑖𝑛 𝑠𝑖𝑡𝑒 𝑘 𝜖 𝑲
0, 𝑜𝑡ℎ𝑒𝑟𝑤𝑖𝑠𝑒
Once all the factors mentioned above have been taken into account, the model is then
formulated as an integer programming problem, with the objective and constraint functions as
follows:
𝑚𝑖𝑛𝑖𝑚𝑖𝑧𝑒 ∑ 𝑞𝑟𝑠
𝑠∈𝑺
∑ ∑ ∑ 𝑑𝑗𝑘𝑋𝑗𝑘𝑡𝑠
𝑡∈𝑻𝑘∈𝑲𝑗∈𝑱
+ 𝑀 × ∑ ∑ 𝑔𝑘𝑡
𝑡∈𝑻𝑘∈𝑲
(39)
(s.t):
∑ 𝑋𝑗𝑘𝑡𝑠
𝑘∈𝑲
= 𝑣𝑗𝑡𝑠 , ∀𝑗 ∈ 𝑱, 𝑡 ∈ 𝑻, 𝑠 ∈ 𝑺 (40)
𝑔𝑘𝑡 ≤ ∑ 𝑚𝑙𝑡𝑌𝑘𝑙
𝑙∈𝑳
, ∀𝑘 ∈ 𝑲, 𝑡 ∈ 𝑻 (41)
𝑔𝑘𝑡 ≥ ∑ 𝑋𝑗𝑘𝑡𝑠
𝑗∈𝑱
, ∀𝑘 ∈ 𝑲, 𝑡 ∈ 𝑻, 𝑠 ∈ 𝑺 (42)
Location Models 4 RELIEF DISTRIBUTION / STOCK PRE-POSITIONING MODELS
in Humanitarian Logistics
Diogo Rafael dos Santos Forte 45
∑ 𝑌𝑘𝑙
𝑙∈𝑳
≤ 1, ∀𝑘 ∈ 𝑲 (43)
∑ 𝑌𝑘𝑙
𝑘∈𝑲
≤ 𝑝𝑙, ∀𝑙 ∈ 𝑳 (44)
𝑌𝑘𝑙 ∈ {0,1}, ∀𝑘 ∈ 𝑲, 𝑙 ∈ 𝑳 (45)
The first term of the objective function (39) minimizes the distances travelled by the population
over all scenarios. The second term represents a penalty associated with the acquisition of
commodities to pre-position in the located facilities and leads to a solution that stocks only the
minimum amount of commodities possible to be able to serve the population. Furthermore, this
second term assembles, in a way, an objective to minimize costs associated with the holding of
excess commodities. In regards to effective results, the model provides a solution that is able to
cope with the most challenging set of commodity demands and presents a solution to the
location of facilities that is maintained throughout all disaster scenarios, with assignments
varying according to the commodities and scenarios that are considered. This means that even
if a smaller scale disaster occurs, the amount of stock that is pre-positioned in all the facilities
must be able to cope with a larger scale disaster, which consequently results in a certain amount
of commodities that end up not being used if a scenario with fewer demand occurs. Although,
the model presented does not take it into account, a cost of unmet demand may be considered
in order to generate a solution that performs well under catastrophic events (with lower
probability of occurring). Finally, this model provides a result which consists of three different
schemes of network assignments: one for the distribution of water, another for the distribution
of food and lastly one for the distribution of medication.
Constraints (40) guarantee that all demand for each commodity must be served. Constraints
(41) ensure that pre-positioning of stock may only occur if the facility has been located and that
the amount of stock must not exceed the facility’s capacity for each commodity. Constraints
(42) determine that the amount of pre-positioning of stock of each commodity in a certain
facility must be equal or exceed the overall number of demand from all the population that is
assigned to that same facility. Constraints (43) certify that only one type of facility may be
located at each site. Constraints (44) reflect the budgetary and operational limitations by way
of commanding that the maximum number of each l-type facility is 𝑝𝑙. Finally, constraints (45)
require the location decision variable to be binary.
In an attempt to achieve the best set of results possible, the previous formulation (1st approach),
which determines a solution in which the demand for a certain type of commodity may be
serviced by a multitude of facilities, will be compared to a second approach that mandates that
demand for a certain type of commodity may only be served by a single facility. This second

Location Models 4 RELIEF DISTRIBUTION / STOCK PRE-POSITIONING MODELS
in Humanitarian Logistics
Diogo Rafael dos Santos Forte 46
approach (2nd approach) may provide solutions that are easier to implement in real-life
situations, due to the clear indications that are provided to citizens on where to go to receive
assistance, which will likely not happen in the first approach.
Application
We consider a set of three different types of commodities (1 – Water; 2 – Food; 3 – Medication),
for which there is likely to be demand during a disaster event, and consider their pre-positioning
in three different types of storage/distribution facilities, according to the suitability of said
facilities to hold a certain type of commodity (1 – Water Silo; 2 – Food Distribution Center; 3
– Medical Center).
Both approaches of the multiple commodities/multiple facilities model will be tested and
compared in this chapter, according to a certain group of factors. We took into account that
there would be a maximum of two water silos (𝑝1 = 2), two food distribution centers (𝑝2 = 2)
and also two medical centers (𝑝3 = 2). Additionally, we generated random values for
commodity demand, varying from 0 – 150 units, depending on the gravity of the disaster that
the scenario portraits: 0-50 small scale; 50-100 mid-scale; 100-150 high scale (See Appendix –
Tables A.3; A.4 and A.5 for the detailed demand data). Furthermore, demand scenarios were
associated with the following random probabilities: 𝑞𝑟1 = 0.15 (small scale); 𝑞𝑟2 = 0.10 (mid-
scale); 𝑞𝑟3 = 0.05 (high scale). Finally, we assumed that water silos would only be able to serve
demand for water (𝑚11 = 1500 ; 𝑚12 = 0 ; 𝑚13 = 0), that food distribution centers would
have capacity to primarily serve demand for food and have a reserve for medication (𝑚21 =
0 ; 𝑚22 = 2000 ; 𝑚23 = 250), and that medical centers have the primary objective of serving
medication demand but also contain a reserve for food supplies (𝑚31 = 0 ; 𝑚32 =
250 ; 𝑚33 = 2000).
We obtain the solutions presented in Figure 4.3, Figure 4.4 and Figure 4.5, which represent the
resulting assignments and facility locations associated with the distribution of water, food and
medication, respectively.
The results presented in Figure 4.3 show that the location of water silos is not affected by the
approach that is taken into account. For both cases, the resulting number and location of
facilities for the distribution of water is the same, with a total of two water silos located in
centers 7 and 18. Moreover, due to the fact that the assignments remain untouched from one
approach to another, on both situations the amount of pre-positioned water resources is 1094
units in center 7 and 1338 units in center 18.

Location Models 4 RELIEF DISTRIBUTION / STOCK PRE-POSITIONING MODELS
in Humanitarian Logistics
Diogo Rafael dos Santos Forte 47
(A) (B)
Figure 4.3 – Multiple Commodities/Multiple facilities model – results for the distribution of
water in (A) 1st approach and (B) 2nd approach
Regarding the distribution of food, it is clear by the results illustrated in Figure 4.4 that the
decision regarding the location of facilities is subjected to changes, depending on the approach
that is taken, which consequently leads to a change in terms of the resulting assignments. For
the 1st approach, there will be two food distribution centers, located in centers 3 and 13, each
one with 1109 and 863 of pre-positioned commodity units, respectively. Furthermore, with each
medical center being capable of distributing up to 250 units of food, the results that are achieved
provide a solution with a better overall distribution of travelled distances. For the 1st approach,
in specific, the medical centers in 4 and 12, provide the population with a total of 500 food
units, as they are both stocked to their maximum capacity. The latter enables population from
centers such as 1, 4, 10 and 12 to receive quicker assistance. For the 2nd approach, food
distribution centers are to be located in centers 4 and 11, with each distributing 874 and 1106
food units, respectively. Regarding the backup provided by medical centers in the distribution
of food resources, both centers in 2 and 6 provide the distribution of 246 units of food.

Location Models 4 RELIEF DISTRIBUTION / STOCK PRE-POSITIONING MODELS
in Humanitarian Logistics
Diogo Rafael dos Santos Forte 48
(A) (B)
Figure 4.4 – Multiple Commodities/Multiple facilities model – results for the distribution of
food in (A) 1st approach and (B) 2nd approach
As for the distribution of medical supplies, the results presented in Figure 4.5, again show that
there is a difference of results according to the approach that is taken into consideration. For
the 1st approach, the model indicates that there should be located medical centers in centers 4
and 12. Furthermore, each of these centers distributes a total of 895 and 1139 medical supplies.
As for the backup provided by food distribution centers, centers 3 and 13 both distribute the
maximum amount of 250 medical supplies each. Regarding the 2nd approach, the results
indicate that there should be located medical centers in centers 2 and 6 with each distributing a
total of 1023 and 1018 medical supplies, respectively. As for the backup provided by food
distribution centers, a total of 243 medical supplies is stocked in center 4, while center 11 is
used in its’ maximum capacity, providing relief with the distribution of 250 units of medical
supplies.

Location Models 4 RELIEF DISTRIBUTION / STOCK PRE-POSITIONING MODELS
in Humanitarian Logistics
Diogo Rafael dos Santos Forte 49
(A) (B)
Figure 4.5 – Multiple Commodities/Multiple facilities model – results for the distribution of
medication in (A) 1st approach and (B) 2nd approach
In regards to the overall solution that each approach develops, it is expected that the 1st approach
develops results with lower travelled distances amongst all the population, as it considers that
population from the same center may be served in different distribution centers. In fact, this
expectation is met, as the assignments and locations proposed by the 1st approach result in an
overall amount of 18382.6 𝐾𝑚 travelled by all the population (2.5 𝐾𝑚 per demand unit), as
contrasting to the solution proposed by the 2nd approach, which reproduces a total of
18947.4 𝐾𝑚 in travelled distances (2.55 𝐾𝑚 per demand unit).
As it pertains to the disparity between the approaches in terms of travelled distances, the
registered difference of 564.8 𝐾𝑚, represents an increase of approximately 500 𝑚 per unit of
commodity demand for the 2nd approach. Taking into account the added level of safety (less
confusion in assignments) that the 2nd approach offers when compared to the 1st approach, the
small increase in distances travelled looks to be a logical compromise for the population to
accept the 2nd approach as the best solution.

Location Models in Humanitarian Logistics 5 CONCLUSION
Diogo Rafael dos Santos Forte 50
5 CONCLUSION
In this dissertation, we aimed at studying planning efforts for the prevention of damages
associated with the occurrence of catastrophic events. Within this context, humanitarian
logistics studies take center stage and present themselves as the most important tool in
constructing a coordinated and effective response plan for the eventuality of a disaster. These
studies address the topics of what are the necessities during a disaster crisis and plan for the
best way of implementing an efficient plan of action which guarantees that all those necessities
are met promptly. Humanitarian logistics, study relief efforts motivated by disaster events and
appoint specific solutions depending on the need that is presented (e.g. evacuation plans,
distributions of materials in need). Additionally, humanitarian logistics is a derivation of
emergency logistics, an area of business-related problems which studies the effects of disasters
on the functionality of a specific business.
Necessities and obstacles for the fulfilment of those necessities during disaster situations may
fluctuate according to the phase of actions that is considered, and so, humanitarian logistics is
divided into two specific planning stages: pre-disaster and post-disaster operations. Pre-disaster
operations are all the efforts that take place before the impact of a disaster and which look for
ways to alleviate or prevent the damages that are caused. Post-disaster operations, take place
after a disaster occurs and have the purpose of attending to disaster impacts. In this project, we
analyzed pre-disaster operations and found that they are mainly performed by way of
developing optimization models. Furthermore, in this area of studies, these models focus
primarily on facility location problems. They study the creation of a network of facilities and
have the objective of locating those facilities as closely as possible to areas which are likely to
be affected during a disaster.
Facility location problems, in humanitarian logistics, study the implementation of two different
types of network of facilities: a network of shelters or a network of distribution centers.
Problems which locate shelters aim at providing the population from all inhabited centers with
quick and safe access to protected zones. Problems that focus on locating distribution centers
aim at providing the population with access to emergency resources (e.g. food, water and
medicine), which are stocked in each distribution center. Furthermore, each of these different
types of networks is associated with a specific issue: a network of shelters provides solutions
that enable to solve problems related to the evacuation of people from affected areas – these are
called evacuation models; a network of distribution centers allows to solve problems related

Location Models in Humanitarian Logistics 5 CONCLUSION
Diogo Rafael dos Santos Forte 51
with the stocking and transportation of resources to people in need – these are referred to as
relief distributions and stock pre-positioning models.
The first type of models which we present, are evacuation models. They determine the location
of a network of shelters and define the routes of evacuation that should be taken from each
populated center in order to reach its assigned safe shelter. As an objective, these models look
for the best set of locations of shelters in order to minimize travelled distances. They take into
account probabilities of failure in shelters and specific zones of the city in order to present a
solution that guarantees the best level of preparedness.
We identified and studied two different types of approaches for evacuation models: proximity-
based models and scenario-based models. Proximity-based models provide different
assignment solutions according the levels of proximity of centers and sites. Furthermore,
models with this type of approach, study the hypothetical occurrence of every resident being
assigned to shelters at a specific level of proximity. Scenario-based models provide routing
assignments by taking into account scenarios that define a specific occurrence in terms of the
number of failures that occur due to a disaster. On this approach, models present a solution for
each pre-defined scenario of occurrences and give solid insight on the course of action for every
eventuality. We observed that for whichever approach, proximity-based or scenario-based,
there were two types of situations that were considered: design of networks and fortification of
networks. Network design models aim at building a network of shelters from scratch. Network
fortification models select a subset of shelters from the solutions presented by the design model
and then apply measures to fortify their structure, which turns them immune to the occurrence
of a disaster.
For proximity-based evacuation models, we presented the formulation and application of two
optimization models: a p-median location model (design) and a p-median fortification model
(fortification). The p-median location model presented solutions which allowed us to have a
better understanding of what would incur in terms of assignments, when a certain populated
center is assigned to a shelter at a certain level of proximity. From this model, we were able to
conclude upon what assignments to expect in a case a populated had its one, two, three or four
closest shelters failing. The p-median fortification model determined the subset of previously
existing shelters that should be fortified against failures. It indicated what would be the level of
proximity for which a populated center might find the closest fortified shelter.
For scenario-based evacuation models, we presented the formulation and application of three
optimization models: a scenario-based p-median location model (design), a scenario-based p-
median fortification model (fortification) and a minimax p-median location model (design).
The scenario-based p-median location model enabled us to determine a solution for the location

Location Models in Humanitarian Logistics 5 CONCLUSION
Diogo Rafael dos Santos Forte 52
of shelters and evacuation of people that performed well for the majority of the scenarios that
were considered, regardless of the probability of occurrence associated with a specific scenario.
We concluded that these types of solutions were useful for decision makers which concerned
themselves with presenting a solution that worked well overall and which devoted less time to
the specific planning of more catastrophic situations. The scenario-based p-median location
model allowed us to present the ideal solution for assignments and shelter locations, however,
we concluded that this solution would always require a bigger budget, and therefore, not be at
the reach of every decision maker. At last, the minimax p-median location model determined
solutions that looked for a compromise of the overall functionality of the network in order to
work in the best way possible for the most catastrophic event. We came to the conclusion that
this would be indicated for risk averse decision makers, which do not mind losing a significant
amount of responsiveness in most scenarios in order to avoid complications in the worst
scenario.
The second and also last type of models which we present are relief distribution and stock pre-
positioning models. These models have the objective of locating a set of distribution centers
and determining the amount of resources (like food, water and medication) that they should
hold in order to serve as relief sources for all the needs that the population has. Within relief
distribution and stock pre-positioning models, we analyzed and applied two different variations:
a single commodity/single facility model and a multiple commodities/multiple facilities model.
The single commodity/single facility model studies situations where there is a demand for a
single type of resource. This model assumes that to serve all the demand, there will only be a
single type of facility that is located. However, that single type of facility is divided into two
categories, according to the capacity that it has to hold and distribute stock: a primary
distribution center which holds the most amount of stock and a “break of bulb” facility which
has the capacity to serve a much smaller amount of people. The model aims at determining the
combined locations of each category of distribution centers that guarantees that people have the
quickest access to the stocked resources. Furthermore, the model considers the existence of
“logistical staging areas” which are in charge of delivering and stocking resources in each of
the located distribution centers. As a secondary objective, this model looks to minimize the
distances travelled to perform this transportation of stock from the “logistical staging areas” to
distribution centers, and so, in the end, the model presents a solution of distribution center
locations that guarantees the quickest combined process of stocking the located distribution
centers and reaching the population with the stocked resources. We were able to conclude that
this model presents solutions that are very balanced in terms of each stage that is considered
and also, that the inclusion of a smaller category of the same type of facility allows population
from remote zones of the city to have better access to the resources.
Location Models in Humanitarian Logistics 5 CONCLUSION
Diogo Rafael dos Santos Forte 53
The multiple commodities/multiple facilities model studies situations where is demand for
different types of resources and that the demand for each must be serviced by a specialized
distribution center. We solved a problem that had differentiated demands for food, water and
medication. Furthermore, we assumed that there would be located three types of facilities: water
silos, food distribution centers and medical centers. Water silos were exclusively serving water
demand, food distribution centers served food demand and had a small reserve of medicine also
stocked and medical centers served primarily demand for medication and had a backup for food
demand. For this model we took two different approaches regarding the possibility of
assignments. The first approach considered that a center might be served by more than one
facility for each type of resources. The second approach assumed that, to avoid confusion,
residents of each center had to be served exclusively by one facility for each type of demand.
This allowed us to conclude that the solutions presented for the second approach represented a
very good compromise and should always be taken in order to avoid misunderstandings in the
assignments that are proposed to the residents.

Location Models in Humanitarian Logistics REFERENCES
Diogo Rafael dos Santos Forte 54
REFERENCES
Alçada-Almeida, L., Tralhão, L., Santos, L. and Coutinho-Rodrigues, J. (2009). “A
multiobjective approach to locate emergency shelters and identify evacuation routes in
urban areas”. Geographical Analysis, 41: 9 – 29.
Altay, N. and Green III, WG. (2006). “OR/MS research in disaster operations management”.
European Journal of Operational Research, 175(1):475 – 493.
Balcik, B. and Beamon, B.M. (2008). “Facility location in humanitarian relief”. International
Journal of Logistics: Research and Applications, 11(2):101 – 21.
BBC News (2010). “Logistical nightmare hampers Haiti aid effort”. Report. January 22, 2010.
Available from: http://news.bbc.co.uk/2/hi/americas/8460787.stm - accessed in
21/03/2014.
Berman, O., Krass, D. and Menezes M (2005). “MiniSum with imperfect information: Trading
off quantity for reliability of locations”. Working paper, Rotman School of Management,
University of Toronto.
Berman, O., Krass, D. and Menezes M (2007). “Facility reliability issues in network p-median
problems: Strategic centralization and co-location effects”. Operations Research, 55(2): 332
– 350.
Caunhye, A.M., Nie, X. and Pokharel, S. (2012). “Optimization models in emergency logistics:
A literature review”. Socio-Economic Planning Sciences, 46: 4 – 13.
Chang, M.S., Tseng, Y.L. and Chen, J.W. (2007). “A scenario planning approach for the flood
emergency logistics preparation problem under uncertainty”. Transportation Research Part
E: Logistics and Transportation Review, 43(6):737 – 754.
Church, R.L. and Scaparra M.P. (2005). “Protecting critical assets: The r-interdiction median
problem with fortification”. Working paper 79, Kent Business School, Canterbury,
England, February.
Church, R.L., Scaparra, M.P. and Middleton R.S. (2004). “Identifying critical infrastructure:
The median and covering facility interdiction problems”. Annuals of the Association of
American Geographers, 94(3):491–502.
Fritz Institute (2005). “Logistics and the effective delivery of humanitarian relief”. Report.
Available from: http://www.fritzinstitute.org/PDFs/Programs/TsunamiLogistics0605.pdf –
accessed in 23/03/2014.
Guha-Sapir, D., Hoyois, Ph. and Below, R. (2013). Annual Disaster Statistical Review 2012:
The Numbers and Trends. Brussels: CRED.

Location Models in Humanitarian Logistics REFERENCES
Diogo Rafael dos Santos Forte 55
Haghani, A., Oh, S.C. (1996). “Formulation and solution of a multi-commodity, multimodal
network flow model for disaster relief operations”. Transportation Research Part A: Policy
and Practice, 30(3):231 – 250.
Horner, M.W. and Downs, J.A. (2010). “Optimizing hurricane disaster relief goods distribution:
model development and application with respect to planning strategies”. Disasters,
34(3):821 – 844.
Kaynak, R. and Tuğer, A.T. (2014). “Coordination and collaboration functions of disaster
coordination centers for humanitarian logistics”. Procedia – Social and Behavioral Sciences
109, 432 – 437.
Kongsomsaksakul, S., Yang, C. and Chen, A. (2005). “Shelter location-allocation model for
flood evacuation planning”. Journal of the Eastern Asia Society for Transportation Studies,
6: 4237 – 425
Mete, H.O. and Zabinsky, Z.B. (2010). “Stochastic optimization of medical supply location and
distribution in disaster management”. International Journal of Production Economics,
126(1):76 – 84.
Psaraftis, H.N., Tharakan, G.G. and Ceder, A. (1986). “Optimal response to oil spills: the
strategic decision case”. Operations Research, 34(2):203 – 217.
Rawls, C.G. and Turnquist, M.A. (2010). “Pre-positioning of emergency supplies for disaster
response”. Transportation Research Part B: Methodological, 44(4): 521 – 534.
Scaparra, M.P. and Church, R.L. (2005). “An optimal approach for the interdiction median
problem with fortification”. Working paper 78, Kent Business School, Canterbury,
England, February.
Sherali, H.D. and Carter, T.B and Hobeika, A.G. (1991). “A location-allocation model and
algorithm for evacuation planning under hurricane/flood conditions”. Transportation
Research Part B: Methodological, 25(6):439 – 452.
Snyder, L.V. and Daskin, M.S. (2006). “Models for reliable supply chain network design”. In
Alan T. Murray and Tony H. Grubesic, editors, Reliability and Vulnerability in Critical
Infrastructure: A Quantitative Geographic Perspective. Springer, forthcoming.
Snyder, L.V., Scaparra, M.P., Daskin, M.S. and Church, R.L. (2005). “Planning for disruptions
in supply chain networks”. Tutorials in Operations Research INFORMS, 234–257.
Song, R., He, S. and Zhang, L. (2009). “Optimum transit operations during the emergency
evacuations”. Journal of Transportation Systems Engineering and Information Technology,
9(6):154 – 160.
United Nations International Strategy for Disaster Reduction (1999). Available from:
http://www.unisdr.org/who-we-are/what-is-drr - accessed in 20/03/2014.
Van Wassenhove, L.N. (2006). “Blackett Memorial Lecture Humanitarian aid logistics: supply
chain management in high gear”. Journal of the Operational Research Society, 57,475-489.
Wardrop, J.G. (1952). “Road paper: some theoretical aspects of road traffic research”. ICE
Proceedings: Engineering Divisions, 1(3): 325 – 362.

Location Models in Humanitarian Logistics REFERENCES
Diogo Rafael dos Santos Forte 56
Wilhelm, W.E.and Srinivasa, A.V. (1996). “A strategic, area-wide contingency planning model
for oil spill cleanup operations with application demonstrated to the Galveston Bay area”.
Decision Sciences, 27(4):767 – 799.
Yi, W. and Özdamar, L. (2007). “A dynamic logistics coordination model for evacuation and
support in disaster response activities”. European Journal of Operational Research,
179(3):1177 – 1193.

Location Models in Humanitarian Logistics APPENDIX
Diogo Rafael dos Santos Forte 57
APPENDIX
A. NETWORK GEOMETRY AND CHARACTHERISTICS
B. SCENARIOS
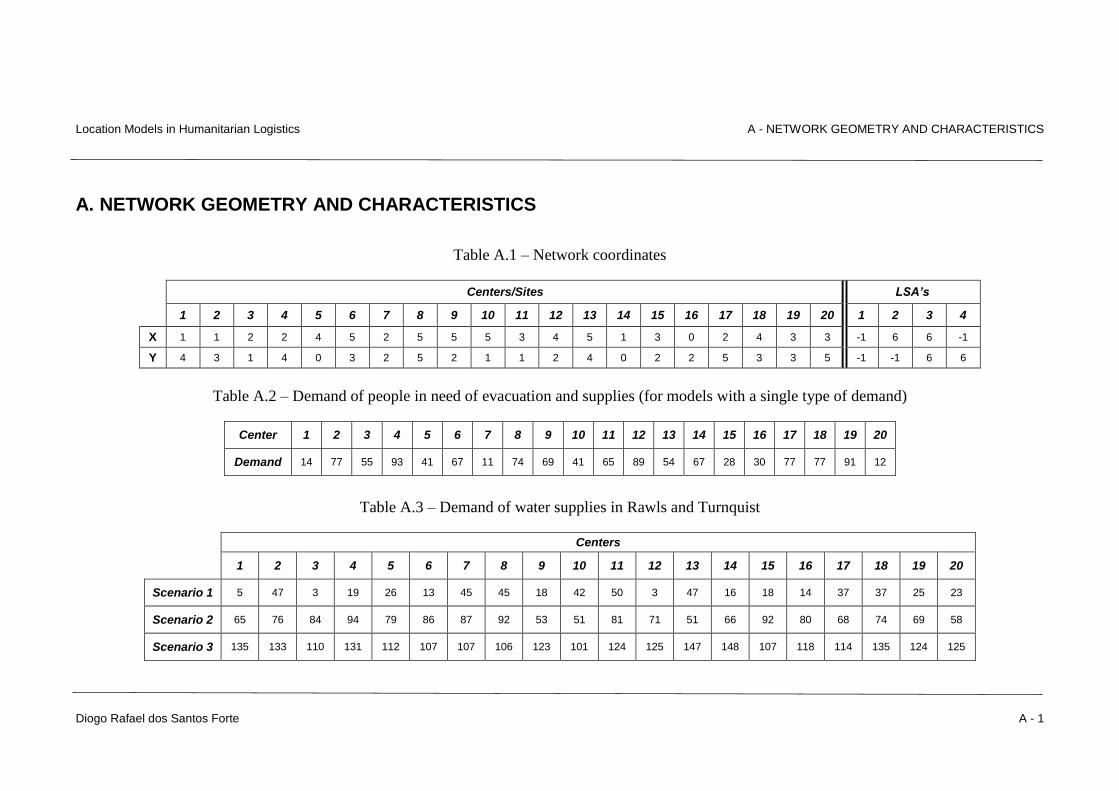
Location Models in Humanitarian Logistics A - NETWORK GEOMETRY AND CHARACTERISTICS
Diogo Rafael dos Santos Forte A - 1
A. NETWORK GEOMETRY AND CHARACTERISTICS
Table A.1 – Network coordinates
Centers/Sites LSA’s
1 2 3 4 5 6 7 8 9 10 11 12 13 14 15 16 17 18 19 20 1 2 3 4
X 1 1 2 2 4 5 2 5 5 5 3 4 5 1 3 0 2 4 3 3 -1 6 6 -1
Y 4 3 1 4 0 3 2 5 2 1 1 2 4 0 2 2 5 3 3 5 -1 -1 6 6
Table A.2 – Demand of people in need of evacuation and supplies (for models with a single type of demand)
Center 1 2 3 4 5 6 7 8 9 10 11 12 13 14 15 16 17 18 19 20
Demand 14 77 55 93 41 67 11 74 69 41 65 89 54 67 28 30 77 77 91 12
Table A.3 – Demand of water supplies in Rawls and Turnquist
Centers
1 2 3 4 5 6 7 8 9 10 11 12 13 14 15 16 17 18 19 20
Scenario 1 5 47 3 19 26 13 45 45 18 42 50 3 47 16 18 14 37 37 25 23
Scenario 2 65 76 84 94 79 86 87 92 53 51 81 71 51 66 92 80 68 74 69 58
Scenario 3 135 133 110 131 112 107 107 106 123 101 124 125 147 148 107 118 114 135 124 125

Location Models in Humanitarian Logistics A - NETWORK GEOMETRY AND CHARACTERISTICS
Diogo Rafael dos Santos Forte A - 2
Table A.4 – Demand of food supplies in Rawls and Turnquist
Centers
1 2 3 4 5 6 7 8 9 10 11 12 13 14 15 16 17 18 19 20
Scenario 1 38 19 36 32 33 38 4 14 12 42 34 19 47 35 13 31 22 12 25 26
Scenario 2 96 77 96 91 52 76 61 78 50 62 71 84 66 92 78 83 93 92 97 57
Scenario 3 109 113 114 145 144 108 123 117 111 129 110 130 138 113 132 133 121 119 123 140
Table A.5 – Demand of medication in Rawls and Turnquist
Centers
1 2 3 4 5 6 7 8 9 10 11 12 13 14 15 16 17 18 19 20
Scenario 1 26 33 34 44 12 38 14 26 24 2 38 24 45 0 49 8 49 5 3 21
Scenario 2 89 79 59 75 63 95 52 90 84 80 73 77 56 54 57 100 99 71 88 90
Scenario 3 148 108 121 107 105 107 119 123 147 128 145 108 131 121 144 114 148 140 134 136
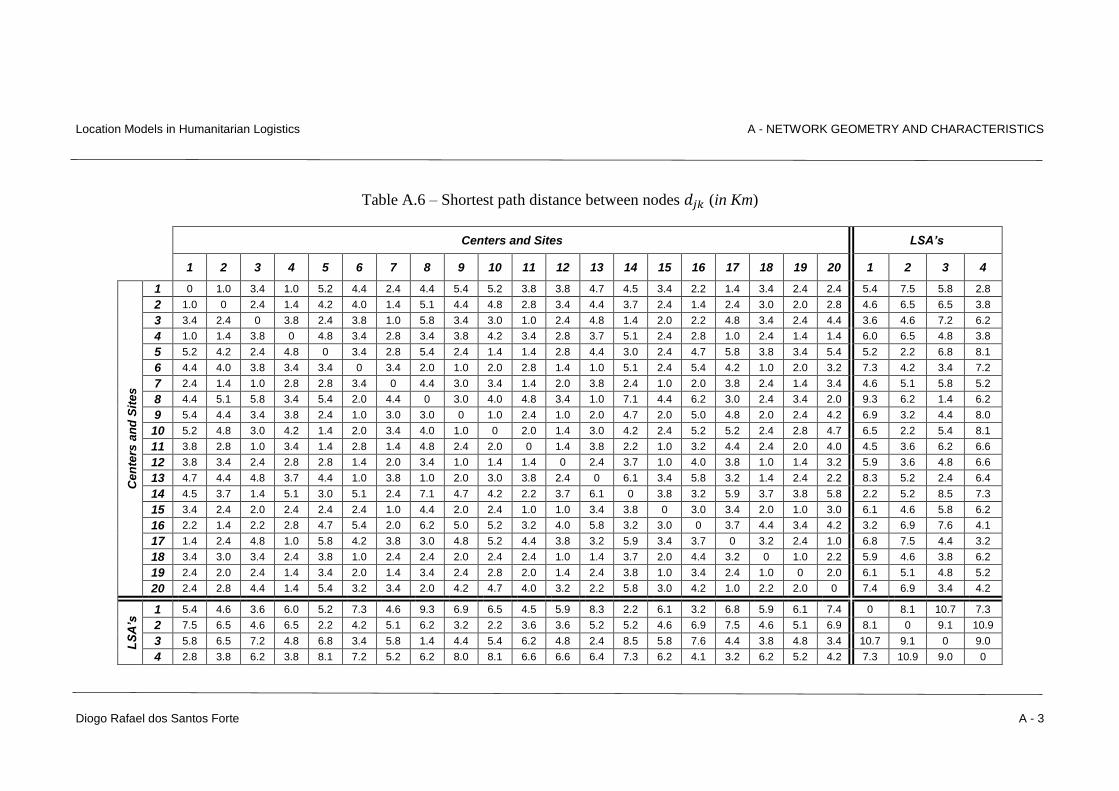
Location Models in Humanitarian Logistics A - NETWORK GEOMETRY AND CHARACTERISTICS
Diogo Rafael dos Santos Forte A - 3
Table A.6 – Shortest path distance between nodes 𝑑𝑗𝑘 (in Km)
Centers and Sites LSA’s
1 2 3 4 5 6 7 8 9 10 11 12 13 14 15 16 17 18 19 20 1 2 3 4
Cen
ters
an
d S
ite
s
1 0 1.0 3.4 1.0 5.2 4.4 2.4 4.4 5.4 5.2 3.8 3.8 4.7 4.5 3.4 2.2 1.4 3.4 2.4 2.4 5.4 7.5 5.8 2.8
2 1.0 0 2.4 1.4 4.2 4.0 1.4 5.1 4.4 4.8 2.8 3.4 4.4 3.7 2.4 1.4 2.4 3.0 2.0 2.8 4.6 6.5 6.5 3.8
3 3.4 2.4 0 3.8 2.4 3.8 1.0 5.8 3.4 3.0 1.0 2.4 4.8 1.4 2.0 2.2 4.8 3.4 2.4 4.4 3.6 4.6 7.2 6.2
4 1.0 1.4 3.8 0 4.8 3.4 2.8 3.4 3.8 4.2 3.4 2.8 3.7 5.1 2.4 2.8 1.0 2.4 1.4 1.4 6.0 6.5 4.8 3.8
5 5.2 4.2 2.4 4.8 0 3.4 2.8 5.4 2.4 1.4 1.4 2.8 4.4 3.0 2.4 4.7 5.8 3.8 3.4 5.4 5.2 2.2 6.8 8.1
6 4.4 4.0 3.8 3.4 3.4 0 3.4 2.0 1.0 2.0 2.8 1.4 1.0 5.1 2.4 5.4 4.2 1.0 2.0 3.2 7.3 4.2 3.4 7.2
7 2.4 1.4 1.0 2.8 2.8 3.4 0 4.4 3.0 3.4 1.4 2.0 3.8 2.4 1.0 2.0 3.8 2.4 1.4 3.4 4.6 5.1 5.8 5.2
8 4.4 5.1 5.8 3.4 5.4 2.0 4.4 0 3.0 4.0 4.8 3.4 1.0 7.1 4.4 6.2 3.0 2.4 3.4 2.0 9.3 6.2 1.4 6.2
9 5.4 4.4 3.4 3.8 2.4 1.0 3.0 3.0 0 1.0 2.4 1.0 2.0 4.7 2.0 5.0 4.8 2.0 2.4 4.2 6.9 3.2 4.4 8.0
10 5.2 4.8 3.0 4.2 1.4 2.0 3.4 4.0 1.0 0 2.0 1.4 3.0 4.2 2.4 5.2 5.2 2.4 2.8 4.7 6.5 2.2 5.4 8.1
11 3.8 2.8 1.0 3.4 1.4 2.8 1.4 4.8 2.4 2.0 0 1.4 3.8 2.2 1.0 3.2 4.4 2.4 2.0 4.0 4.5 3.6 6.2 6.6
12 3.8 3.4 2.4 2.8 2.8 1.4 2.0 3.4 1.0 1.4 1.4 0 2.4 3.7 1.0 4.0 3.8 1.0 1.4 3.2 5.9 3.6 4.8 6.6
13 4.7 4.4 4.8 3.7 4.4 1.0 3.8 1.0 2.0 3.0 3.8 2.4 0 6.1 3.4 5.8 3.2 1.4 2.4 2.2 8.3 5.2 2.4 6.4
14 4.5 3.7 1.4 5.1 3.0 5.1 2.4 7.1 4.7 4.2 2.2 3.7 6.1 0 3.8 3.2 5.9 3.7 3.8 5.8 2.2 5.2 8.5 7.3
15 3.4 2.4 2.0 2.4 2.4 2.4 1.0 4.4 2.0 2.4 1.0 1.0 3.4 3.8 0 3.0 3.4 2.0 1.0 3.0 6.1 4.6 5.8 6.2
16 2.2 1.4 2.2 2.8 4.7 5.4 2.0 6.2 5.0 5.2 3.2 4.0 5.8 3.2 3.0 0 3.7 4.4 3.4 4.2 3.2 6.9 7.6 4.1
17 1.4 2.4 4.8 1.0 5.8 4.2 3.8 3.0 4.8 5.2 4.4 3.8 3.2 5.9 3.4 3.7 0 3.2 2.4 1.0 6.8 7.5 4.4 3.2
18 3.4 3.0 3.4 2.4 3.8 1.0 2.4 2.4 2.0 2.4 2.4 1.0 1.4 3.7 2.0 4.4 3.2 0 1.0 2.2 5.9 4.6 3.8 6.2
19 2.4 2.0 2.4 1.4 3.4 2.0 1.4 3.4 2.4 2.8 2.0 1.4 2.4 3.8 1.0 3.4 2.4 1.0 0 2.0 6.1 5.1 4.8 5.2
20 2.4 2.8 4.4 1.4 5.4 3.2 3.4 2.0 4.2 4.7 4.0 3.2 2.2 5.8 3.0 4.2 1.0 2.2 2.0 0 7.4 6.9 3.4 4.2
LSA’s
1 5.4 4.6 3.6 6.0 5.2 7.3 4.6 9.3 6.9 6.5 4.5 5.9 8.3 2.2 6.1 3.2 6.8 5.9 6.1 7.4 0 8.1 10.7 7.3
2 7.5 6.5 4.6 6.5 2.2 4.2 5.1 6.2 3.2 2.2 3.6 3.6 5.2 5.2 4.6 6.9 7.5 4.6 5.1 6.9 8.1 0 9.1 10.9
3 5.8 6.5 7.2 4.8 6.8 3.4 5.8 1.4 4.4 5.4 6.2 4.8 2.4 8.5 5.8 7.6 4.4 3.8 4.8 3.4 10.7 9.1 0 9.0
4 2.8 3.8 6.2 3.8 8.1 7.2 5.2 6.2 8.0 8.1 6.6 6.6 6.4 7.3 6.2 4.1 3.2 6.2 5.2 4.2 7.3 10.9 9.0 0

Location Models in Humanitarian Logistics A - NETWORK GEOMETRY AND CHARACTERISTICS
Diogo Rafael dos Santos Forte A - 4
Table A.7 – Distance matrix 𝑑𝑗𝑐 for p-median fortification model (in Km)
Centers
1 2 3 4 5 6 7 8 9 10 11 12 13 14 15 16 17 18 19 20
Pro
xim
ity
(c
)
1 1 1.41 0 0 2.41 1 1 1 0 1 1 1 0 1.41 1 2.24 1 1 0 1.41
2 1.42 1.59 0.72 0.42 2.41 1 1.12 1.60 0.60 1.55 1.30 1.12 0.60 2.13 1.30 2.41 1.42 1.12 0.42 1.59
3 1.51 1.62 0.81 0.62 2.50 1.09 1.25 1.64 0.64 1.56 1.34 1.21 0.64 2.21 1.30 2.47 1.50 1.18 0.51 1.61
4 1.55 1.68 0.82 0.63 2.53 1.13 1.25 1.64 0.66 1.56 1.36 1.21 0.67 2.25 1.31 2.51 1.54 1.19 0.51 1.66
5 1.55 1.68 0.83 0.63 2.53 1.13 1.26 1.66 0.67 1.57 1.37 1.22 0.68 2.26 1.32 2.52 1.54 1.20 0.51 1.66

Location Models in Humanitarian Logistics B - SCENARIOS
Diogo Rafael dos Santos Forte B - 1
B. SCENARIOS
Table B.1 – Binary matrix of failure scenarios (𝑎𝑘𝑠)
Numbers of simultaneous failures
Zero One Two Three Four
Scenario number
1 2 3 4 5 6 7 8 9 10 11 12 13 14 15 16 17 18 19 20 21 22 23 24 25
Sit
es
1 0 0 0 0 0 1 0 0 0 1 0 0 1 0 1 1 0 0 1 0 1 1 0 1 1
2 0 0 0 0 0 1 0 0 0 1 0 0 1 0 1 1 0 0 1 0 1 1 0 1 1
3 0 1 0 0 0 0 1 1 1 1 0 0 0 0 0 0 1 1 1 0 0 0 1 1 0
4 0 0 0 0 0 1 0 0 0 1 0 0 1 0 1 1 0 0 1 0 1 1 0 1 1
5 0 0 0 1 0 0 0 1 0 0 1 0 0 1 1 0 1 0 0 1 1 1 1 1 1
6 0 0 0 0 1 0 0 0 1 0 0 1 0 1 0 1 0 1 0 1 0 1 1 0 1
7 0 0 1 0 0 0 1 0 0 0 1 1 1 0 0 0 1 1 1 1 1 0 1 1 1
8 0 0 0 0 1 0 0 0 1 0 0 1 0 1 0 1 0 1 0 1 0 1 1 0 1
9 0 0 0 1 0 0 0 1 0 0 1 0 0 1 1 0 1 0 0 1 1 1 1 1 1
10 0 0 0 1 0 0 0 1 0 0 1 0 0 1 1 0 1 0 0 1 1 1 1 1 1
11 0 0 1 0 0 0 1 0 0 0 1 1 1 0 0 0 1 1 1 1 1 0 1 1 1
12 0 0 1 0 0 0 1 0 0 0 1 1 1 0 0 0 1 1 1 1 1 0 1 1 1
13 0 0 0 0 1 0 0 0 1 0 0 1 0 1 0 1 0 1 0 1 0 1 1 0 1
14 0 1 0 0 0 0 1 1 1 1 0 0 0 0 0 0 1 1 1 0 0 0 1 1 0
15 0 0 1 0 0 0 1 0 0 0 1 1 1 0 0 0 1 1 1 1 1 0 1 1 1
16 0 1 0 0 0 0 1 1 1 1 0 0 0 0 0 0 1 1 1 0 0 0 1 1 0
17 0 0 0 0 0 1 0 0 0 1 0 0 1 0 1 1 0 0 1 0 1 1 0 1 1
18 0 0 0 0 1 0 0 0 1 0 0 1 0 1 0 1 0 1 0 1 0 1 1 0 1
19 0 0 1 0 0 0 1 0 0 0 1 1 1 0 0 0 0 1 1 1 1 0 1 1 1
20 0 0 0 0 0 1 0 0 0 1 0 0 1 0 1 1 0 0 1 0 1 1 0 1 1