Embed Size (px)
Citation preview

Location Based
Services - SIMPLE
NZNOG 2006, VUW March 22-24, 2006
Jonathan WierengaPeter Komisarczuk

MUM 2005, © VUW, 2005
Overview
• Context• TIP – Tourist Information (service) Provider• HIP – Health Information (service) Provider• Aggregating of Location (service) Providers• Location Determination Technology• One LDT component
– SIMPLE Components and Algorithms– SIMPLE Prototype Implementation– SIMPLE Results and Analysis
• Where to next?

MUM 2005, © VUW, 2005
Context
• Location Based Services (LBS)– New integrated wireless devices....– Enhancing wireless services (new
revenue streams)• Value added multimedia delivery
– Location Determination Technology (LDT)
• GPS• Cellular Network Techniques (Cell ID, Angle
Of Arrival etc)• WLAN• Bluetooth, RFID, IrDA

MUM 2005, © VUW, 2005
The TIP• Tourist Information (service) Provider
– Supporting the revenue stream from tourism– Where are you? (Privacy? Information not
available outside the system!)– Now I am here what can I do?– What did my peers do?
• Recommendation service (friend of a friend)• Reputation service (trust)• Air Graffiti etc.
– Value added multimedia content to enhance the museum, the arts festival etc.

MUM 2005, © VUW, 2005
TIP …
• Museum/heritage context– Virtual maps, guided tours, augmented
artifact information– Imposes a number of constraints on LDTs
• High Accuracy, Low Computational Requirements, Pervasive Indoor Positioning (direction and 1m accuracy) etc.
– Terminal equipment I/O?• PDA/phone up to 640x480• IP Multimedia Subsystem delivery• Through to voice only devices

MUM 2005, © VUW, 2005
The HIP
• Health Information (service) Provider– Consumers:
• Health sensor data monitoring/logging• Emergency data/medical alerts• Notification services• Data filtering
– Providers:• Map information• Location information• Security• (monitoring?)
– Enhanced security required over TIP

MUM 2005, © VUW, 2005
Aggregating Location Provider
• Aggregation of location based services– Multiple TIP providers
• Overlapping or non overlapping
– Analysis of positioning data from multiple sources
• Tracking for enhanced positioning• GPS + WLAN + ?????
– Federation: management, billing, integrated positioning, handover?
– Filtering content push (preferences)– Privacy policy enforcement

MUM 2005, © VUW, 2005
What we’ve been doing…
• Some location determination WLAN experiments
• Basic TIP (museum like context)
• Beginning aggregation R&D
• The rest:– WLAN location determination
(SIMPLE) experiments

MUM 2005, © VUW, 2005
WLAN Positioning• Beacon Based Association
• Herecast
• Time Difference On Arrival• Intel Precision Location
• RSSI Propagation Model Techniques• TIX, Radar
• Empirical RSSI Techniques– Deterministic Methods
• Radar (k nearest neighbours)
– Probabilistic Methods• Horus

MUM 2005, © VUW, 2005
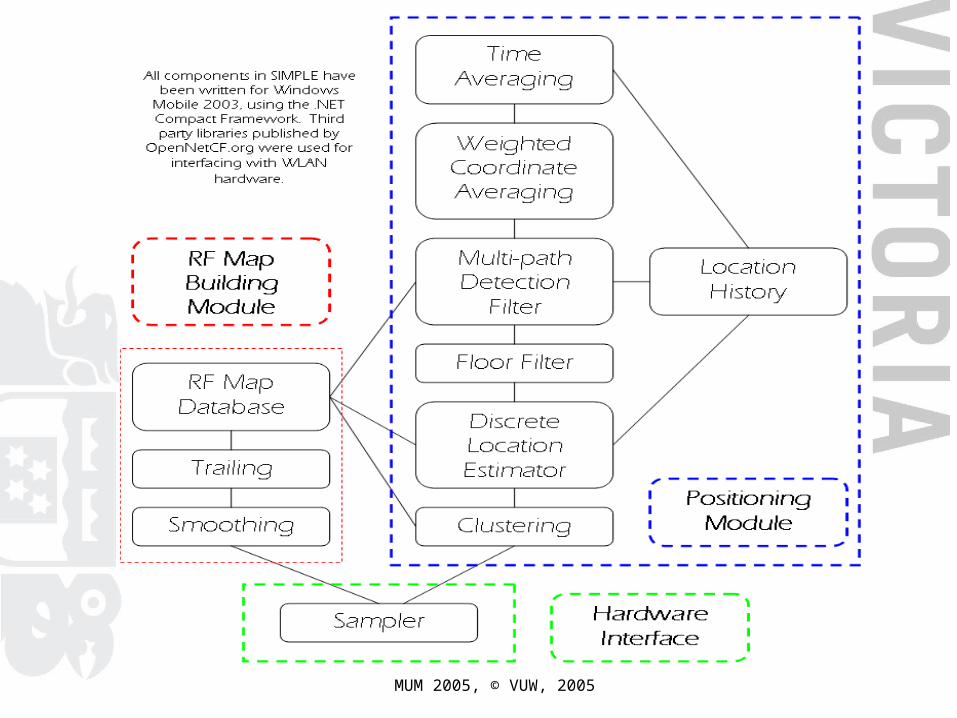
SIMPLE Overview
• “Simple Indoor Multi-floor Personal Location Engine”
• Based on probabilistic WLAN positioning• Two phases
– Offline – Builds a RF map of an environment– Online – Uses an observation and compares
with the map to estimate a position
• Amalgamation of existing techniques from Horus and research at IBM
• Measurement of relative effectiveness of those techniques
• Extension to determine on which floor you are located

MUM 2005, © VUW, 2005
Probabilistic Positioning
• Horus– Ashok Agrawala, University of Maryland
– Aims to overcome noisy characteristics of 802.11 channels
– Privacy, decentralisation of positioning– Reducing computational requirements– .9m accuracy over 2000m2 testbed
• IBM WLAN Positioning Engine– By Z. Xiang et al. IBM China Research Laboratory
– Aims to reduce RF map building costs– Device tracking– 2m accuracy (stationary) and 5m (moving
device)
MUM 2005, © VUW, 2005

MUM 2005, © VUW, 2005
Building an RF Map
An area is divided into a grid of marking positions, shown on the map. These should be in close proximity to APs.
0
0.02
0.04
0.06
0.08
0.1
0.12
0.14
0.16
0.18
-95
-84
-80
-76
-71
-67
-63
-59
-55
-50
-46
-42
-38
-34
-29
-25
-21
RSSI
At each marking position li, a set On = {o1
n, o2n.. , oj
n} is formed where oj
n is the RSSI value from AP aj in the nth scanning cycle.

MUM 2005, © VUW, 2005
0
200
400
600
800
1000
1200
1400
-90 -87 -84 -81 -78 -75 -72 -69 -66 -63 -60 -57 -54 -51 -48 -45 -42 -39 -36 -33 -30 -27 -24 -21 -18
Signal Strength (dBm)
Co
un
t
RSSI DistributionsHorusIBM
Distributions are close to Gaussian
(they can be approximated using their mean and standard deviation)

MUM 2005, © VUW, 2005
Estimating a position• RF map is used to estimate a position at an unknown
location x. • An observation O={o1, o2,..,oj, ok } is made where oj is
an estimation from AP aj , with a max of k APs.• Bayes’ Theorem used to express probability of the
location being li , given O. This is expressed as:
• P(O|li) is calculated by:
which results in a set of possible locations ordered by probability.

MUM 2005, © VUW, 2005
Potential PitfallsShort term sampling does not model long term variances
A model based training scheme is used (smoothing and trailing functions)
Calculating P(O|li) is
computationally expensive
Cluster locations into groups covered by APs. This greatly reduces no. of operations
O may be affected by multipath fading or shadow fading
Perturb observation if resulting location is unlikely. Choose a closer estimate
A user may not be located at a marking position
Weighted coordinate averaging treats location li as a position in
signal space whose weight is equal to its probability.
A user may be standing still, but positions fluctuate (or moving too quickly to consider past history)
Time averaging can help converge on a single location when recent estimates are similar.

MUM 2005, © VUW, 2005
Test Setup• 2 test beds, 1 for testing map
building parameters, another for location calculation optimisations
• Around 40 locations in each

MUM 2005, © VUW, 2005
The effect of calculation optimisations

MUM 2005, © VUW, 2005
Conclusions / Observations
• SIMPLE it is not…– Rich multipath environment– Cheap stock hardware?
• Noisy antenna• Slow scanning operation
– Scalability issues• Modeling of the environment• Device performance
– Future solutions from Intel (TDOA) more likely to be best WLAN solution

MUM 2005, © VUW, 2005
The effect of number of Intervals and Samples in creating RSSI
distributions

MUM 2005, © VUW, 2005
Effect of smoothing functionRate of smoothing

MUM 2005, © VUW, 2005
Effect of adding trailing probabilities“Amount of trailing”

MUM 2005, © VUW, 2005
Inclusion of prior probability, and time averaging
Effect of considering prior probability
Effect of time averaging


