Embed Size (px)
Citation preview

C A R B O N 5 0 ( 2 0 1 2 ) 3 8 1 6 – 3 8 2 5
.sc iencedi rect .com
Avai lab le at wwwjournal homepage: www.elsev ier .com/ locate /carbon
Localized functionally modified glass fibers with carbonnanotube networks for crack sensing in composites usingtime domain reflectometry
Gaurav Pandey a,b, Mitchell Wolters d, Erik T. Thostenson a,b,*, Dirk Heider a,c
a Center for Composite Materials, University of Delaware, Newark, DE 19716, United Statesb Department of Mechanical Engineering, University of Delaware, Newark, DE 19716, United Statesc Department of Electrical and Computer Engineering, University of Delaware, Newark, DE 19716, United Statesd Department of Composite Materials Engineering, Winona State University, Winona, MN 55987, United States
A R T I C L E I N F O
Article history:
Received 12 August 2011
Accepted 3 April 2012
Available online 13 April 2012
0008-6223/$ - see front matter � 2012 Elsevihttp://dx.doi.org/10.1016/j.carbon.2012.04.008
* Corresponding author at: Department of MeE-mail address: [email protected] (E.T. Th
A B S T R A C T
An electric time domain reflectometry (TDR) based sensing approach with an external par-
allel plate transmission line has been developed to evaluate high-frequency electromag-
netic changes in composites due to applied load and internal damage. A model system
of cross-ply glass fiber/vinyl ester composites with and without the selective integration
of localized carbon nanotube (CNT) networks was studied where microcracking and delam-
ination are introduced during tensile loading. A sizing technique has been used for local-
ized functional modification using CNTs. The TDR sensing approach has been correlated
with strain and acoustic emission (AE) measurements as well as micrographs of edge rep-
licas capturing the damage state. Both the nanotube modified and baseline composites
have similar mechanical properties and damage progression which is reflected in similar
stress–strain plots, AE measurements and edge replica studies. However, the CNT intro-
duced composites have enhanced strain and damage dependent TDR response. Hence,
through localized functional modification of the composite electromagnetic properties
using CNTs and the electromagnetic–mechanical property coupling of CNTs, it is possible
to (1) increase TDR sensitivity to strain and (2) sense development of micro-scale cracks.
This approach offers potential for use in existing composite structures or permanently
integrated during the manufacturing process and is in situ and non-invasive.
� 2012 Elsevier Ltd. All rights reserved.
1. Introduction
Composite materials exhibit multiple damage mechanisms at
different scales such as micro and transverse cracking, fiber–
matrix debonding, delamination and fiber breakage. These
various damage mechanisms interact and affect the ultimate
performance of the material at the structural level [1]. Failure,
durability, and damage tolerance are a critical part of any
high-performance structural design process but current fail-
ure theories suffer from large variations between theoretical
er Ltd. All rights reserved
chanical Engineering, Unostenson).
predictions and experimental data [2]. As a consequence
there is a critical need to develop robust and versatile struc-
tural health monitoring (SHM) techniques to evaluate the per-
formance of composites in long-term structural applications.
An ideal SHM system would be capable of measuring the var-
ious micro and macro damage modes that occur over the life-
span of the composite structure.
Recent advances in detecting damage have been made
using X-ray radiography [3], fiber Bragg grating [4,5], acoustic
emission (AE) [6,7], ultrasonic [3,8], eddy current [9,10] and
.
iversity of Delaware, Newark, DE 19716, United States.

C A R B O N 5 0 ( 2 0 1 2 ) 3 8 1 6 – 3 8 2 5 3817
piezoelectric sensing methods [11]. X-ray radiography is suit-
able only for laboratory-scale damage detection due to large
equipment required to perform radiography. Embedded fiber
optic Bragg grating sensing approaches suffer from of being
invasive and difficult to integrate during the composite manu-
facturing process. Acoustic emission sensors are firmly estab-
lished in laboratory environments but are prone to high
interference in practical implementations due to vibration
and noise.
Advances in the understanding of nanocomposite struc-
ture/property relations have enabled scientists and engineers
to produce functionally tailored matrix and fibers which have
coupled electromagnetic and mechanical properties. In partic-
ular, CNTs can form electrically conductive networks at small
concentrations in a polymer matrix and displays piezoresistive
behavior [12–14]. Due to their vast difference in scale CNTs can
form networks around the structural fiber reinforcement and
be utilized to sense damage based on breaking-up of the nano-
tube network. CNTs impart inherent damage sensing capabil-
ities to probe the bulk of the material [15–17]. Typically, this
measurement method relies on relating the bulk changes of
the direct current conductivity and low frequency dielectric
properties of the composite dopedwith CNTs to provide insight
into the overall material behavior and damage accumulation.
Electric time domain reflectometry (TDR) is a high-fre-
quency electrical measurement technique that can detect
spatial changes in dielectric properties. A key advantage of
the TDR technique is in the potential for distributed measure-
ment as the TDR signal provides time-domain feedback as a
function of the local dielectric material property and trans-
mission line geometry. The TDR approach has been utilized
for fault detection in printed circuit boards and cables [18]
and also for geological measurements to monitor soil mois-
ture content and faults in rock [19]. In addition, TDR ap-
proaches have been used for flow monitoring in liquid
composite molding [20], distributed strain sensing [21] and
as a test method to measure the crack length in the double
cantilevered beam fracture toughness tests [22]. Recently,
TDR has been used to study defects in concrete structures
[23,24] but the scale of faults in these structures is macro-
scopic as opposed to microscopic scale damage which initi-
ates in composites. While both TDR and DC based
monitoring (piezoresistivity) are electrical characterization
techniques, piezoresistivity based measurements require me-
tal electrodes to be bonded directly to the composite speci-
men using a conductive polymer. The degradation/
environmental effects (for example humidity) can damage
the composite-electrode joint and can hence lead to a false
signal. In TDR measurements, the metal TDR connectors
need to be connected to metal transmission line conductors
and not the actual specimen. Hence, TDR is less invasive as
compared to piezoresistivity measurements. Further, damage
localization using DC based techniques requires the integra-
tion of multiple arrays of electrodes (which will result in more
composite-metal electrode contacts) and multiplexing of sig-
nals whereas TDR can probe at the nanosecond time scale
along a single sensing line, without any potentially damaging
contact with the composite specimen.
For fiber composites the scale of damage ranges from the
scale of microns (microcracks, fiber/matrix debonding) to
centimeters or larger (ply delamination). The length scale res-
olution of the TDR measurement is directly proportional to
wavelength of the electromagnetic signal, which in turn is in-
versely proportional to the frequency. With recent advances
in microwave engineering and the advent of picoseconds rise
time and Gigahertz frequency pulses, TDR has been used to
probe length scales providing high enough resolution to mea-
sure many of the damage modes observed in composites.
Through nanoscale hybridization and localized tailoring of
the dielectric properties it is likely that the scale can be ex-
tended to detect microcracks. The TDR approach also over-
comes some challenges for SHM since the sensors are non-
invasive; they can be surface mounted yet detect sub-surface
damage in situ. Furthermore, the technique is not affected by
vibration and other acoustic events.
The main objectives of present study are: (1) to establish a
TDR based non-invasive technique for damage sensing in
CNT introduced fiber composite materials; (2) to investigate
the role of CNT networks in high frequency electromagnetic
response of composite materials; and (3) to demonstrate the
utility of selective functional modification using CNTs as de-
scribed in [26,29] for non-invasive damage sensing. The basic
scientific question addressed by this study is to observe the
effect of CNT networks in fiber composites on TDR response.
The present study fulfills these objectives and addresses the
scientific question by TDR measurements in conjunction with
strain measurement, acoustic emission and optical
microscopy.
The current study evaluates the sensitivity of the high fre-
quency dielectric property changes for sensing of micro-scale
damage CNT–polymer composites using the TDR technique.
Model experiments have been conducted to measure the
TDR signal changes for various damage modes with focus
on early detection of microcracking. The TDR data has been
correlated with AE and strain measurements. An enhanced
electromagnetic response due to localized functional modifi-
cation of the electrical properties in regions prone to damage
has been observed with an external TDR sensor at low input
voltage (250 mV). A uniform electromagnetic field has been
achieved using a novel parallel plate sensor design. Previous
TDR related researches have focused mostly on parallel wire
sensing. Parallel plate sensing enables enhanced sensitivity
due to due uniform penetration of electromagnetic fields.
The present work provides the foundation for an embedded
or surface-mounted sensor capable to measure distributed
micro and macro scale damage mechanisms in advanced
composite materials doped with CNTs. Together, the TDR sys-
tem combined with localized functional modification of com-
posite dielectric properties with CNT networks provides the
potential for future scale-up to a viable structural health
monitoring system in large composite structures.
2. Experimental
2.1. Electric time domain reflectometry: configuration anddata reduction
TDR refers to a technique of sending a high-frequency electri-
cal pulse through a transmission line and subsequently

3818 C A R B O N 5 0 ( 2 0 1 2 ) 3 8 1 6 – 3 8 2 5
detecting the reflected signal. Fig. 1(a) shows the equivalent
electric circuit diagram of a typical TDR setup and Fig. 1(b)
shows the test configuration for the current investigation. In
Fig. 1(b), the pulse propagates along the transmission line
and the electromagnetic field interacts with the dielectric
material surrounding the transmission line. Because the time
domain signal response is a function of the sensor configura-
tion and surrounding dielectric properties, the test, in theory,
allows reconstruction of the material electrical properties
along the entire length of the transmission line [20,23]. Since
cracks in the material result in discontinuity in dielectric
Fig. 1 – (a) Equivalent electrical circuit diagram of TDR setup;
and (b) schematic of experimental setup.
properties this reconstruction could be subsequently ana-
lyzed to find the location and extent of damage. The electrical
properties of the specimen and transmission line are defined
by the characteristic impedance, Z. The characteristic Imped-
ance and propagation speed, v, of a lossless transmission line
is given by:
Z ¼ffiffiffiffiLC
rð1Þ
v ¼ 1ffiffiffiffiffiffiLCp ð2Þ
where, L is the distributed inductance and C is the distributed
capacitance of the specimen under investigation. The imped-
ance of the parallel plate transmission line system can then
be expressed in terms of the material dielectric constant (e,
magnetic permeability (l), specimen geometry (d and trans-
mission line width (w) as [25]:
Z ¼ffiffiffiffiffilep
C¼
ffiffiffile
rdw
ð3Þ
It should be noted that the impedance given by Eq. (3) is
not a material property of the specimen but a property of
the specimen and sensor (transmission line). For example,
for the specimen with same dielectric constant and magnetic
permeability, the impedance will depend not only on the
dielectric constant and the magnetic permeability of the spec-
imen but also on the distance between the transmission line
conductors (d) and the width of transmission line conductors
(w). Also, due to multiple reflections, the measured imped-
ance will also depend on the contact impedance between
the connector and the specimen and the coaxial cables [11].
The effect of CNT on actual impedance has been measured
using a ‘TDR test cell’. This data is included as Supplementary
data. Fig. S1 shows the test setup and Fig. S2 of the Supple-
mentary information shows the TDR response of the neat
and CNT-reinforced specimens. CNTs have been found to
lower the impedance of the vinyl ester resin. Similar results
have been found for other resins as well and ongoing research
is aimed at quantifying the influence of CNTs on electrical
properties. For monitoring purposes, effective impedance
change given by Eq. (5) can be used assuming that it is only
the specimen which is changing during the experiment. Also,
from Eq. (3), it can be observed that the impedance of the
specimen depends on magnetic and dielectric material prop-
erties. Since the specimen used in this study were not mag-
netic, the electromagnetic response presented here can be
assumed to be primarily dielectric.
In this study, a parallel plate transmission line made from
copper foil strips is used. The copper strips are the conductors
for the transmission line and the specimen forms the dielec-
tric medium. There is no direct electrical connection between
the copper strips and the specimen but the copper strips are
in contact with the specimen surface. Electrical contact is not
important to the impedance measurement since the speci-
men acts like a dielectric material between the copper strips
(Fig. 2). Adhesive tape was used to fix the transmission line
conductors in place on the specimen. The copper strips are
connected via a coaxial cable to the TDR signal generator
and detector (HL-8200, Hyperlabs Inc., OR, USA). The TDR
module has a high frequency step generator and an oscillo-

Fig. 2 – Parallel plate transmission line using CNT sized sample (similar copper sheet on other side of the specimen).
Adhesive tapes were used to fix the transmission line conductors in place, fully covering the copper sheet.
Fig. 3 – Relationship between voltage response and load
impedance.
C A R B O N 5 0 ( 2 0 1 2 ) 3 8 1 6 – 3 8 2 5 3819
scope together with a very accurate timing device. The step
generator of the TDR module has a rise time of 200 ps and
an amplitude of 250 mV. A step pulse generated by the step
generator is made up of several different frequency compo-
nents. Based on the rise time specified by the manufacturer,
the frequencies are in the 5 GHz range. The high frequency
electrical signal travels along the specimen transmission line
and an electromagnetic field develops and penetrates
throughout the specimen thickness.
As the specimen elongates under tension (without any
damage accumulation), the thickness and hence the effective
dielectric constant changes due to Poisson contraction so the
characteristic impedance changes with applied strain. In addi-
tion, the dielectric constant also depends on strain as well [31].
At the end of an elastic loading cycle, the impedance should
return to its original value for an undamaged specimen. Sim-
ilarly, with crack accumulation and delamination, the imped-
ance is expected to increase due to a decrease of the effective
dielectric constant due to cracks and air inclusions.
The relationship between voltage of the TDR line (El,m) at
each measurement point (m), incident voltage (Ei), specimen
impedance (Zl) and the effective characteristic impedance of
the cable (Zcable) connecting the TDR module to the load
impedance is given by:
El;m ¼ Ei2ZL;m
Zcable þ ZL;m
� �ð4Þ
and the effective impedance change can be calculated by sub-
tracting the initial average impedance of the untested sample
from the current test.
DZEff ¼P
ZL;m
m� Zuntested ð5Þ
In the experiments, the incident voltage was set at 250 mV
and standard Bayonet Neill–Concelman (BNC) and SubMinia-
ture version A (SMA) cables with 50 X impedances were used
for attaching the TDR module to the specimen. TDR traces for
several known resistances were obtained to verify that Eq. (4)
is valid for the test setup (Fig. 3). The results indicate that
impedance can be extracted accurately using Eq. (4).
2.2. Composites manufacturing
The composite laminates were manufactured by laying-up
five unidirectional E-glass fiber plies (COM-VEW130-50,
Jamestown Distributers) with a cross-ply stacking sequence
of [02/90/02]. The ply lay-up was sealed in a vacuum bag with
a resin distribution layer to enhance matrix infiltration and
subsequently infused with an epoxy vinyl-ester resin (Dera-

3820 C A R B O N 5 0 ( 2 0 1 2 ) 3 8 1 6 – 3 8 2 5
kane� 501A-40, Ashland Inc.). Two percent MEKP (Chemtura
Inc.) and 0.03% Cobalt naphthenate (6% Cobalt, Mahagony
Co.) were used as initiator and promoter, respectively. The
laminates were cured at room temperature for 24 h followed
by post cure at 120 �C for 2 h. Identical processing conditions
were used for manufacturing both the CNT-sized and baseline
composites. The center cross-ply configuration is used to ini-
tiate microcracking in the 90� glass layer under tensile loading
[15–17]. It is widely established that micro-scale cracks initi-
ate in the 90� layers at relatively low strain as compared to
the ultimate strain. As cracking is initiated stress is redistrib-
uted through the interface with the 0� plies. The cracks con-
tinue to develop within the 90� layers as the material is
strained until the ply is completely saturated with cracks.
After the cross ply laminate is saturated with transverse
cracks in the 90�, the transverse cracks coalesce to form inter-
ply delaminations [32]. Ultimate failure of the laminate fol-
lows immediately after these interply delaminations.
Previous research has established improved sensitivity to
microcracking with DC conductivity measurements when
percolating networks of CNTs were added to the composite
[15–17,26]. Changes in the dielectric properties of the speci-
men due to strain or damage will result in a change in the re-
flected TDR signal. In order to evaluate the influence of
nanoscale modification on the sensitivity of the impedance
change two different sets of laminates were produced with
and without CNT modification. Since damage accumulation
occurs primarily in the 90� layer of the composite, this layer
was selectively modified with CNTs in order to assess the sen-
sitivity of the dielectric properties on the sensing response.
The 90� ply was conductively modified by creating CNT net-
works at the surfaces of the fibers through the application
of a fiber sizing prior to composite manufacturing. The sizing
process, described in Ref. [26], involves the infiltration of a
commercially available liquid sizing agent containing highly
dispersed nanotubes (SizicylTM CNT sizing agent from Nanocyl
s.a.) followed by drying. The solid content in the sizing agent
is reported in the manufacturer’s data1 as 6.2% but this solid
content is mostly the polymeric film-former. The mass
change of the glass fibers after the sizing application is less
than 0.5% which is partially due to the deposition of CNTs
[26]. The as-sized layer was electrically conductive after dry-
ing and indicates that electrical percolation (formation of
CNT networks [33]) had been achieved in the layer. Earlier re-
search work [26] provides DC electrical characterization and
microscopy data for CNT sized glass fiber composites. Based
on the microscopic images in [26] the sizing layer has a thick-
ness of less than 500 nm. In addition to being electrically con-
ductive, CNT sized glass fiber layer has the capability to detect
early onset of damage as reported in [29].
2.3. Mechanical/electrical characterization
Tensile specimens were produced based on ASTM Standard
D3039 [27] by bonding fiber glass end tabs onto the ends of
the laminates and machining the laminate using a diamond
slot grinding wheel to a final width of 2.54 cm (1 in.). After
1 SIZICYLTM XC R2G product data: http://www.nanocyl.com/Products
machining the test specimens the copper foils were applied
to the surface of the specimen as described in Section 2.1
(Fig. 2). The copper foil (0.05 mm thickness) was de-greased
using isopropyl alcohol and stretched over the length of the
specimen on both sides to form a parallel plate transmission
line. The parallel transmission line conductors (copper foils)
were soldered to a SMA connector. The specimen strain was
measured by bonding a surface-mounted resistive strain gage
in a region outside the copper strips (Micro-Measurements,
Inc.).
A custom data acquisition system was developed to track
the TDR signals and compute the difference between the ori-
ginal baseline TDR trace and all subsequent traces. Load,
strain and the TDR signals were further integrated to assess
the real-time response. The TDR module acquired an inci-
dent/reflected signal approximately every 1 s. Standard strain
gauges were mounted on the specimen surface and continu-
ously monitored using a National Instruments DAQ system.
In addition, conventional damage detection and assess-
ment techniques were utilized for validation of the observed
TDR sensing response. AE measurements were used to non-
invasively monitor the progression of damage due to micro-
cracking. An AE sensor (35–100 kHz, Physical Acoustics,
Princeton Junction, NJ) was placed on the surface of the spec-
imen and measures the number of elastic wave pulses gener-
ated during each crack. Microscopic edge replication was
utilized to track the state of damage in the specimen at differ-
ent stages of loading. Tensile testing under a progressively
increasing cyclic loading profile with step size of 1000 N was
applied using a displacement controlled load frame (Instron
5567) at 1.26 mm/min. At each loading step the machine
was stopped for approximately 2 min and the load was subse-
quently released with the same rate. During the hold under
tension, microscopic edge replicas were acquired by applying
an acetate replica tape to the specimen (Ted Pella, Inc.). Opti-
cal micrographs of edge replicas of the laminate were taken at
various loading steps and reveal the progressive micro crack
damage accumulation.
3. Results and discussion
Stepwise cyclic loading in steps of 2000 N was applied to both
specimens (Fig. 4(a)). Fig. 4(b) summarizes the stress–strain
behavior. Fig. 4(c) shows the normalized stiffness (E/E0) with
respect to number of loading cycles undergone, where E0 is
the stiffness of the specimen during the first loading cycle.
The modulus does not decrease significantly due to the for-
mation of transverse cracks in the polymer matrix since the
elastic stiffness is dominated by the stiff 0� plies. An almost
identical stress–strain response is observed for all loading cy-
cles, indicating that the CNTs did not change the overall elas-
tic properties as compared to the baseline. In order to verify
that the transverse CNT layer does not significantly change
the tensile strength of the composite laminate, uniaxial ten-
sile tests were performed on three specimens each of baseline
and CNT modified laminates, shown in Fig. 4(d). The baseline
laminates have an average tensile strength of 383 MPa (stan-
-Solutions/Products/SIZICYL.
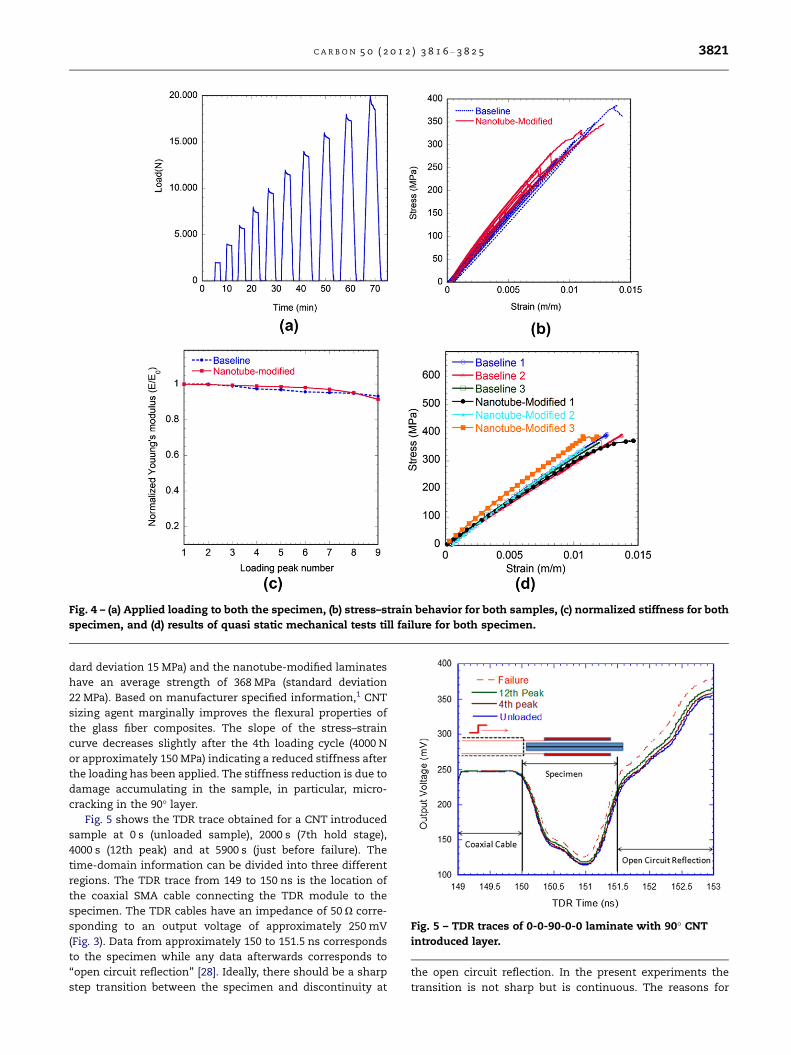
Fig. 4 – (a) Applied loading to both the specimen, (b) stress–strain behavior for both samples, (c) normalized stiffness for both
specimen, and (d) results of quasi static mechanical tests till failure for both specimen.
Fig. 5 – TDR traces of 0-0-90-0-0 laminate with 90� CNT
introduced layer.
C A R B O N 5 0 ( 2 0 1 2 ) 3 8 1 6 – 3 8 2 5 3821
dard deviation 15 MPa) and the nanotube-modified laminates
have an average strength of 368 MPa (standard deviation
22 MPa). Based on manufacturer specified information,1 CNT
sizing agent marginally improves the flexural properties of
the glass fiber composites. The slope of the stress–strain
curve decreases slightly after the 4th loading cycle (4000 N
or approximately 150 MPa) indicating a reduced stiffness after
the loading has been applied. The stiffness reduction is due to
damage accumulating in the sample, in particular, micro-
cracking in the 90� layer.
Fig. 5 shows the TDR trace obtained for a CNT introduced
sample at 0 s (unloaded sample), 2000 s (7th hold stage),
4000 s (12th peak) and at 5900 s (just before failure). The
time-domain information can be divided into three different
regions. The TDR trace from 149 to 150 ns is the location of
the coaxial SMA cable connecting the TDR module to the
specimen. The TDR cables have an impedance of 50 X corre-
sponding to an output voltage of approximately 250 mV
(Fig. 3). Data from approximately 150 to 151.5 ns corresponds
to the specimen while any data afterwards corresponds to
‘‘open circuit reflection’’ [28]. Ideally, there should be a sharp
step transition between the specimen and discontinuity at
the open circuit reflection. In the present experiments the
transition is not sharp but is continuous. The reasons for

3822 C A R B O N 5 0 ( 2 0 1 2 ) 3 8 1 6 – 3 8 2 5
the gradual transition at the open circuit arise from are multi-
ple reflections and equivalent time sampling by the TDR mod-
ule. The frequency of the pulse is also not a single frequency
but rather a bandwidth of frequencies in the GHz range.
Hence, as it is not possible to explicitly delimit the specimen
region, a fixed time interval, from 150 to 153 ns has been used
as the gradual open circuit reflection contains electromag-
netic property information about the specimen state as the
TDR reflection at any point depends on all previous reflec-
tions as well [11]. This helps in maintaining consistency from
specimen to specimen.
The TDR timescale can be accurately converted to spatial
scale using the velocity of electromagnetic waves propagating
inside the sample as:
Dx ¼ 1
2ffiffiffiffiffiffiLCp Dt ð6Þ
In order to apply Eq. (6), we must have an accurate induc-
tance and capacitance profile of the sample at each time step.
Since this study is more concerned with gross damage state of
the specimen and not with tracking damage location, the
effective material change based on Eq. (5) was calculated.
Nevertheless, the approach could be used to calculate distrib-
uted damage parameters (spatial damage along the sensor)
with the appropriate signal processing. This approach will
be evaluated in future work.
The effective impedance change between 150 and 153 ns
was calculated (Fig. 6). At the peak of 9th loading cycle prior
to total failure of the specimen, an impedance change of
approximately 5.5 X in the CNT specimen is seen versus 2 X
in the specimen without CNTs indicating significantly higher
sensitivity in the CNT introduced specimen. Although the
same qualitative trend was observed from testing multiple
specimens, there was a quantitative specimen to specimen
variation due to different contact impedances (mainly due
to variation in soldering between the transmission line con-
Fig. 6 – Effective impedance change for CNT sized and
baseline specimen under progressively increasing cyclic
loading.
ductors and the SMA connectors). The standard deviation of
noise for the measurement of the TDR system is approxi-
mately 0.028 and 0.04 X for CNT introduced and baseline
specimens, respectively, based on data from four specimens
each tested under the same loading conditions. The scatter
data can be found in Figs. S5 and S6 in the Supplementary
information section. Two observations can be made from
the Fig. 6. First, the TDR data seems to follow the loading cy-
cle. Increasing the specimen stresses or strain increases the
effective impedance of the specimens, while reducing the
tensile load reduces the impedance. Secondly, a hysteresis
behavior is seen where the TDR response does not reach ori-
ginal impedance values when the specimens are unloaded.
This is particularly true for the CNT modified specimen and
for higher peak loads.
Fig. 7 illustrates this behavior in more detail. The maxi-
mum impedance change is plotted for each loading cycle dur-
ing the peak (Fig. 7(a)) load hold stage and unloaded/
unstrained stage (Fig. 7(b)). At a higher peak load, higher
impedance is observed for both the baseline and the CNT
introduced specimen. However, the CNT introduced specimen
shows higher impedance sensitivity due to the fact that CNTs
have coupled electrical and mechanical properties [12–15].
The peak data suggest a linear relationship between stres-
ses/strain and the TDR signal until the 3rd to 4th load cycle,
with an increasing TDR response afterwards.
The unstrained baseline and CNT modified specimen
show a different TDR response (Fig. 7(b)). In Fig. 7(b), the per-
manent impedance change is plotted against the peak strain
undergone by the specimen in the previous cycle. The imped-
ance of the specimen without CNTs falls back to its original
value as the specimen is unloaded until the 6th to 7th cycle
while a significant impedance change is observed in the
CNT introduced specimen starting with the 4th cycle The hys-
teresis behavior can be attributed to permanent breakage of
CNT interconnects within the sizing layer [29]. After the sev-
enth loading cycle, the micro cracks coalesce to form delam-
inations between the plies. At this stage of higher damage
(delamination), even the baseline composite shows a perma-
nent impedance change. Increasing the load further does lead
to permanent damage in both specimens and significant
impedance residuals.
The test specimens were designed to introduce micro-
cracking in the center ply even at intermediate loading condi-
tions. In the previous section, several observations of the TDR
and strain sensor data suggested damage accumulation after
the 3rd loading cycle for the CNT sized specimen or 4th load-
ing for baseline specimen. AE tests and micrographic tests
were conducted to validate the damage mode. AE measure-
ment is an established method to monitor local damage in
materials and has been successfully employed to validate
CNT network based damage sensing techniques for cross
ply laminates [30]. Basic principle of acoustic emission is
monitoring elastic waves which are generated by crack open-
ing. A sensor placed on the surface of specimen generates a
given number of AE counts corresponding to each elastic
wave pulse it encounters. Recursively summing up these AE
counts results in the accumulated AE counts. A sudden in-
crease in accumulate AE counts corresponds to damage initi-
ation. Fig. 8(a) and (b) shows the accumulated AE counts

Fig. 7 – Impedance change for each consecutive loading step (a) at peak load plotted with peak strain and (b) during unloaded
stage plotted with previous peak strain.
Fig. 8 – Acoustic emission studies of: (a) CNT sized specimen and (b) baseline specimen.
C A R B O N 5 0 ( 2 0 1 2 ) 3 8 1 6 – 3 8 2 5 3823
versus time for baseline and CNT modified specimens,
respectively. It can be seen that after the 3rd loading cycle
for the CNT sized specimen or 4th loading for baseline spec-
imen, the acoustic hits significantly increase. This suggests
development of damage due to transverse cracking. As a con-
sequence the permanent change observed in the impedance
of unloaded impedance of CNT introduced specimen during
3rd–4th loading step onwards is microcracking. The micro-
cracking results in transverse cracking which shows a large
number of acoustic hits for higher loading cycles.
An important observation is that even though the acoustic
emission plots are similar for both the baseline and the CNT
introduced specimen, the unloaded impedance changes ob-
served are markedly different. While the CNT introduced
specimen enable a much earlier indication of damage, the
baseline specimen show a significant impedance changes
only at the delamination stage. The final composite fracture
then occurs due to the fiber-dominated fracture of the 0� plies
at the last cycle. Here it is observed that there is no change in
the initiation strain for the formation of transverse cracks
and the ultimate fracture of the composite specimen. Thus,
the addition of nanotubes to the composite is non-invasive
and does not alter the composite properties.
Visual inspection of the specimens using micro graphs of
edge replicas further validate the occurrence of micro cracks
in the specimens. Fig. 9 shows micrographs of edge replica of
both the specimens at 2nd, 4th and 7th loading cycle. The
micrographs indicate similar progressive damage accumula-
tion in both the CNT introduced and baseline specimen. It
can be seen that during the 2nd loading step, microscopic
damage is initiated. At the 4th loading step, the specimen
has a significant accumulation of transverse cracks. The for-
mation of these transverse cracks results in higher acoustic
hits observed around 3rd–4th loading cycle. The formation
of microscopic cracks as well as transverse cracks results in
permanent impedance change of CNT introduced specimen.
Finally, at near failure loading cycles (7th loading step and be-
yond), these transverse cracks start coalescing to form delam-
ination’s which results in a permanent impedance change of
both CNT introduced and baseline specimen. Hence, while in
a baseline composite, delaminations can be detected only
when they have already occurred, the CNT networks can be

Fig. 9 – Micrographs of edge replicas of baseline (a) and CNT loaded (b) laminate at various loading stages: (left) 2nd loading
step (4000 N), (center) 4th loading step (8000 N), (right) 7th loading step (14,000 N).
3824 C A R B O N 5 0 ( 2 0 1 2 ) 3 8 1 6 – 3 8 2 5
used for an early warning about delaminations as they are fol-
lowed by transverse cracking and transverse cracking shows
up in permanent impedance change of CNT introduced spec-
imen. An earlier work has also used TDR for detecting delam-
inations in baseline composites during double cantilevered
beam (DCB) testing using TDR [22].
All sensor and image data suggest that the accumulation
of microcracking starts around the 3rd or 4th cycle, leading
to delaminations and stiffness reduction and ultimately total
failure of the specimens. Nevertheless, the TDR system pro-
vides this feedback non-destructively with the integrated sen-
sor at a significantly higher sensitivity compared to the
stiffness reduction measured by the attached strain gauge
system. In addition, at zero load level the TDR system pro-
vides a change in signal which can be related to the perma-
nent damage of the specimen. For the specimen with the
CNT layer, small-scale damage is detected significantly earlier
with the TDR system compared to the baseline. The TDR sen-
sor is also sensitive to strain and thus provides multi-func-
tional feedback of the state of the specimen.
4. Conclusions
The multifunctional properties of CNTs can be utilized to tai-
lor the dielectric properties of fiber-reinforced composites. In
this work we have established that localized functional mod-
ification of the composite structure with networks of CNTs re-
sults in enhanced sensitivity to crack detection. As damage
accumulates in the CNT-graded region the network of CNTs
breaks-up and changes the dielectric response. Through
tracking changes in impedance a TDR system can be used
to evaluate the effective dielectric changes in composites
specimen during applied loading and damage accumulation.
This research relates the TDR signal to strain when an exter-
nal load is applied, accumulation of microcracks in the spec-
imen, delamination and ultimate failure. The TDR sensor
correlates well with the strain of the sample and was able
to measure the accumulated damage when microcracking
and delamination occurred at various loading stages. An
important feature of the TDR sensor is that the effect of the
damage can be measured without external loading and thus
provides a successful sensor system at any loading condition
of the sample. In addition, the distributed sensing (along the
transmission line) capability of the TDR method eliminates
the need for multiple sensors to monitor gross structural
changes in large structures.
Acknowledgment
The authors would like to acknowledge the Department of the
Navy, Office of Naval Research Grant No. N00014-06-1-1000 for
funding this work.
Appendix A. Supplementary data
Supplementary data associated with this article can be found,
in the online version, at http://dx.doi.org/10.1016/j.carbon.
2012.04.008.

C A R B O N 5 0 ( 2 0 1 2 ) 3 8 1 6 – 3 8 2 5 3825
R E F E R E N C E S
[1] Degrieck J, Paepegem WV. Fatigue damage modeling of fibre-reinforced composite materials: review. Appl Mech Rev2001;54:279–300.
[2] Daniel IM. Failure of composite materials. Strain2007;43:4–12.
[3] Cantwell WJ, Morton J. Detection of impact damage in CFRPlaminates. Compos Struct 1985;3:241–7.
[4] Rao YJ. Recent progress in applications of in-fibre Bragggrating sensors. Opt Lasers Eng 1999;31:297–324.
[5] Ling H, Lau K, Cheng L, Jin W. Viability of using an embeddedFBG sensor in a composite structure for dynamic strainmeasurement. Measurement 2006;39:328–34.
[6] Barre S, Benzeggagh ML. On the use of acoustic emission toinvestigate damage mechanisms in glass-fibre-reinforcedpolypropylene. Compos Sci Technol 1994;52:369–76.
[7] Grosse CU, Ohtsu M. Acoustic emissiontesting. Berlin: Springer Verlag; 2008.
[8] Aymerich F, Meili S. Ultrasonic evaluation of matrix damagein impacted composite laminates. Compos Part B: Eng2000;31:1–6.
[9] Valleau A. Eddy-current nondestructive testing of graphitecomposite-materials. Mater Eval 1990;48:230–9.
[10] Mook G, Lange R, Koeser O. Non-destructive characterisationof carbon-fibre-reinforced plastics by means of eddy-currents. Compos Sci Technol 2001;61:865–73.
[11] Kessler SS. Piezoelectric-based in situ damage detection ofcomposite materials for structural health monitoringsystems. PhD thesis. Cambridge, MA, USA: MassachusettsInstitute of Technology; 2002.
[12] Koerner H, Price G, Pearce N, Alexander M, Vaia R. Remotelyactuated polymer nanocomposites – stress-recovery ofcarbon-nanotube-filled thermoplastic elastomers. Nat Mater2004;3:115–20.
[13] Ahir S, Terentjev E. Photomechanical actuation in polymer–nanotube composites. Nat Mater 2005;4:491–5.
[14] Rochefort A, Avouris P, Lesage F, Salahub D. Electrical andmechanical properties of distorted carbon nanotubes RID A-5124-2010. Phys Rev B 1999;60:13824–30.
[15] Thostenson ET, Chou T. Carbon nanotube networks: sensingof distributed strain and damage for life prediction and selfhealing correction 2008. Adv Mater 2006;18:2837–41.
[16] Thostenson ET, Chou T. Real-time in situ sensing of damageevolution in advanced fiber composites using carbonnanotube networks correction 2008. Nanotechnology2008;19:215713–9.
[17] Gao L, Thostenson ET, Zhang Z, Chou T. Sensing of damagemechanisms in fiber-reinforced composites under cyclic
loading using carbon nanotubes. Adv Funct Mater2009;19:123–30.
[18] Smolyansky D, Corey S. PCB interconnect characterizationfrom TDR measurements. Electron Eng 1999;71:63–67.
[19] O’Connor KM, Dowding CM. Geomeasurements by pulsingTDR cables and probes. Boca Raton: CRC Press; 1999.
[20] Dominauskas A, Heider D, Gillespie Jr JW. Electric time-domain reflectometry distributed flow sensor. Compos PartA-Appl Sci Manuf 2007;38:138–46.
[21] Yoon M, Dolan DF, Gabriel S. Time domain reflectometry as adistributed strain sensor. Proc SPIE 2008;6932:69321R–11.
[22] Obaid AA, Yarlagadda S, Yoon MK, Hager NE, Domszy RC. Atime-domain reflectometry method for automatedmeasurement of crack propagation in composites duringmode I DCB testing. J Compos Mater 2006;40:2047–66.
[23] Lin M, Thaduri J. Structural damage detection using anembedded ETDR distributed strain sensor. Sens Imaging: Int J2005;6:315–36.
[24] Chen G, Mu H, Pommerenke D, Drewniak JL. Damagedetection of reinforced concrete beams with noveldistributed crack/strain sensors. Struct Health Monit2004;3:225–43.
[25] Faria JAB. Electromagnetic foundations of electricalengineering. Chichester, UK: Wiley; 2008.
[26] Gao L, Chou T, Thostenson ET, Godara A, Zhang Z, Mezzo L.Highly conductive polymer composites based on controlledagglomeration of carbon nanotubes. Carbon 2010;48:2649–51.
[27] ASTM standard D3039. Standard test method for tensileproperties of polymer matrix composite materials; 2008.
[28] Time domain reflectometry theory. Application Note 1304-2.Agilent Technologies; 2006.
[29] Gao L, Chou T, Thostenson ET, Zhang Z. A comparative studyof damage sensing in fiber composites using uniformly andnon-uniformly dispersed carbon nanotubes. Carbon2010;48:3788–94.
[30] Gao L, Thostenson ET, Zhang Z, Chou T. Coupled carbonnanotube network and acoustic emission monitoring forsensing of damage development in composites. Carbon2009;47:1381–8.
[31] Lee HY, Shkel YM. Dielectric response of solids forcontactless detection of stresses and strains. Sens ActuatorsA: Phys 2007;137:287–95.
[32] Chou TW. Microstructural design of fibercomposites. Cambridge, UK: Cambridge University Press;1992.
[33] Thostenson ET, Ziaee S, Chou T. Processing and electricalproperties of carbon nanotube/vinyl ester nanocomposites.Compos Sci Technol 2009;69:801–4.

![openresearch.lsbu.ac.uk · Web viewMoreover, Wu et al. [13] investigated free vibration and elastic buckling of sandwich beams with a stiff core and functionally graded carbon nanotube](https://img.dokumen.tips/doc/110x75/5ea378d753a10e0852431960/web-view-moreover-wu-et-al-13-investigated-free-vibration-and-elastic-buckling.jpg)