Embed Size (px)
Citation preview
Localization and Proximity Detection in theInternet of Things Based on an Augmented
UHF RFID System
by
Majed Rostamian
Thesis submitted to the
Faculty of Graduate and Postdoctoral Studies
In partial ful�llment of the requirements
For the M.A.Sc. degree in
Electrical and Computer Engineering
School of Electrical Engineering and Computer Science
Faculty of Engineering
University of Ottawa
c© Majed Rostamian, Ottawa, Canada, 2014
Abstract
In the "Internet of Things" (IoT), the things will be able to sense, communicate, and interact.
They will also exchange data, information and knowledge, and locate themselves and other
things that surround them. In order to be able to interact, the things need to recognize
that they are in proximity of other things. It is anticipated that the most widespread
components of the IoT will be passive radio frequency identi�cation (RFID) tags because
they are inexpensive and provide automatic identi�cation. However, passive RFID tags are
not capable of performing complex operations, such as proximity detection and localization,
which will be required in future networks. In this thesis, we describe existing problems
with current RFID systems and survey potential solutions for localization and proximity
detection. Then we present a new RFID device called "Sense-a-Tag" (ST) that can passively
detect and decode backscattered signals from tags in its proximity. There have already been
an attempt to use this device for tracking. However, detailed analysis of the performance
of the ST especially for proximity detection has not been performed yet. We show that
when STs are added to a standard RFID system, the problems of proximity detection and
localization with RFID tags can readily be solved. Then we applied ST-based system for
identifying people and object interactions. The potential uses of ST as an augmented device
for IoT applications are discussed in this thesis. Advantages and limitations of an ST based
RFID system have been investigated in details for each application.
Results obtained from real experiments illustrate that an ST-based RFID system is feasi-
ble for proximity detection applications. In addition, a special software is developed in C# to
process the data and run a localization algorithm based on proximity detection information.
The same software has been used for tracking people's activity. Di�erent scenarios have been
considered in the experiments. We tried to consider majority of factors that might a�ect
the accuracy in the experiments including: angle and distance between the reader/ST and
tags, timing in sending queries, presence of human body, etc. The simulations based on real
experiments and results illustrates that an ST-based RFID system can be a realistic solution
for proximity detection and localization for Location Positioning systems (LPS) and activity
monitoring in future IoT.
ii

Acknowledgements
This thesis has been completed just because of the help and support of many. I would
like to extend my gratitude to Ellie Barrington, Bob Goodfellow, Masi Shaneshin and Nima
Zaker for their support, comments and suggestions on improving the thesis. I am thankful
for the contribution of Alexey Borisenko, whose technical advice helped me a lot to speed
up my research. I would also like to thank Akshay Athalye from Astraion LLC for providing
the Sensatag boards and NSERC for funding the research.
I would like to o�er special thanks to my thesis supervisor, Dr. Miodrag Bolic, for his
excellent professional guidance and personal support during my research work on this thesis.
Last, but not least, my family for always believing in me and always encouraging me on
every step of the way.
Majed Rostamian
iii

Contents
1 Introduction 1
1.1 Overview of the �eld . . . . . . . . . . . . . . . . . . . . . . . . . . . . . . . 1
1.1.1 RFID System . . . . . . . . . . . . . . . . . . . . . . . . . . . . . . . 1
1.1.2 Passive UHF RFID . . . . . . . . . . . . . . . . . . . . . . . . . . . . 2
1.1.3 Real Time Localization System (RTLS) . . . . . . . . . . . . . . . . . 2
1.1.4 Proximity Detection . . . . . . . . . . . . . . . . . . . . . . . . . . . 3
1.2 Problem statement . . . . . . . . . . . . . . . . . . . . . . . . . . . . . . . . 3
1.3 Motivation . . . . . . . . . . . . . . . . . . . . . . . . . . . . . . . . . . . . . 4
1.4 Objectives . . . . . . . . . . . . . . . . . . . . . . . . . . . . . . . . . . . . . 4
1.5 Contribution . . . . . . . . . . . . . . . . . . . . . . . . . . . . . . . . . . . . 5
1.6 Thesis Organization . . . . . . . . . . . . . . . . . . . . . . . . . . . . . . . . 5
2 Background and Prior Art 7
2.1 The Internet of Things . . . . . . . . . . . . . . . . . . . . . . . . . . . . . . 7
2.1.1 Overview . . . . . . . . . . . . . . . . . . . . . . . . . . . . . . . . . 7
2.1.2 IoT Architectures . . . . . . . . . . . . . . . . . . . . . . . . . . . . . 7
2.1.3 IoT Requirements . . . . . . . . . . . . . . . . . . . . . . . . . . . . . 9
2.1.4 IoT and RFID . . . . . . . . . . . . . . . . . . . . . . . . . . . . . . . 10
2.2 Radio Frequency IDenti�cation (RFID) . . . . . . . . . . . . . . . . . . . . . 11
2.2.1 Overview . . . . . . . . . . . . . . . . . . . . . . . . . . . . . . . . . 11
2.2.2 RFID Classi�cation . . . . . . . . . . . . . . . . . . . . . . . . . . . . 12
2.2.3 Reader and Tag . . . . . . . . . . . . . . . . . . . . . . . . . . . . . . 14
2.3 EPC Global Standard . . . . . . . . . . . . . . . . . . . . . . . . . . . . . . 14
2.3.1 EPC Global . . . . . . . . . . . . . . . . . . . . . . . . . . . . . . . . 14
2.3.2 EPCglobal Class 1 Generation 2 Standard . . . . . . . . . . . . . . . 15
2.4 Localization . . . . . . . . . . . . . . . . . . . . . . . . . . . . . . . . . . . . 16
vi

2.4.1 Overview . . . . . . . . . . . . . . . . . . . . . . . . . . . . . . . . . 16
2.4.2 Range-based techniques . . . . . . . . . . . . . . . . . . . . . . . . . 16
2.4.2.1 Signal Strength . . . . . . . . . . . . . . . . . . . . . . . . . 17
2.4.2.2 Time of Flight(TOF) . . . . . . . . . . . . . . . . . . . . . . 17
2.4.2.3 Angle of Arrival(AOA) . . . . . . . . . . . . . . . . . . . . . 17
2.4.2.4 Comparison between Range-based Localization . . . . . . . 18
2.4.3 Range-free techniques . . . . . . . . . . . . . . . . . . . . . . . . . . . 18
2.4.4 Indoor Radio-based Real Time Localization Systems . . . . . . . . . 21
2.5 Localization based on proximity detection . . . . . . . . . . . . . . . . . . . 24
2.5.1 Overview . . . . . . . . . . . . . . . . . . . . . . . . . . . . . . . . . 24
2.5.2 Proximity detection with proximity sensors . . . . . . . . . . . . . . . 27
2.5.3 Proximity detection with active tags . . . . . . . . . . . . . . . . . . 30
2.5.4 Localization, proximity detection and tracking with passive RFID . . 32
3 Description of Sense-a-Tag 36
3.1 Overview . . . . . . . . . . . . . . . . . . . . . . . . . . . . . . . . . . . . . . 36
3.2 ST and similar UHF RFID solutions for proximity detection . . . . . . . . . 36
3.3 Functionality of the ST . . . . . . . . . . . . . . . . . . . . . . . . . . . . . . 38
3.4 System level design . . . . . . . . . . . . . . . . . . . . . . . . . . . . . . . . 40
3.5 Use scenarios . . . . . . . . . . . . . . . . . . . . . . . . . . . . . . . . . . . 44
3.5.1 Localization . . . . . . . . . . . . . . . . . . . . . . . . . . . . . . . . 44
3.5.2 Data �ltering . . . . . . . . . . . . . . . . . . . . . . . . . . . . . . . 45
3.5.3 Unwanted reads . . . . . . . . . . . . . . . . . . . . . . . . . . . . . . 45
3.5.4 Proximity detection . . . . . . . . . . . . . . . . . . . . . . . . . . . . 46
4 ST-Based RFID system 48
4.1 Overview . . . . . . . . . . . . . . . . . . . . . . . . . . . . . . . . . . . . . . 48
4.2 Mitigating RFID problems . . . . . . . . . . . . . . . . . . . . . . . . . . . . 48
4.2.1 Inexpensive tags, costly readers . . . . . . . . . . . . . . . . . . . . . 48
4.2.2 Fading, multipath and blind spots . . . . . . . . . . . . . . . . . . . . 49
4.2.3 Interference . . . . . . . . . . . . . . . . . . . . . . . . . . . . . . . . 49
4.2.4 Data processing . . . . . . . . . . . . . . . . . . . . . . . . . . . . . . 50
4.3 Proximity detection, localization and IoT applications with ST . . . . . . . . 50
4.3.1 Overview . . . . . . . . . . . . . . . . . . . . . . . . . . . . . . . . . 50
4.3.2 ST as landmark tag . . . . . . . . . . . . . . . . . . . . . . . . . . . . 51
vii

4.3.3 ST as mobile tag . . . . . . . . . . . . . . . . . . . . . . . . . . . . . 51
4.3.4 Unwanted reads . . . . . . . . . . . . . . . . . . . . . . . . . . . . . . 53
4.4 ST-based system vs other solutions . . . . . . . . . . . . . . . . . . . . . . . 54
4.4.1 Limitations and disadvantages of the STs . . . . . . . . . . . . . . . . 61
5 System and Experimental Designs 62
5.1 Overview . . . . . . . . . . . . . . . . . . . . . . . . . . . . . . . . . . . . . . 62
5.2 Basic Tests . . . . . . . . . . . . . . . . . . . . . . . . . . . . . . . . . . . . 63
5.2.1 Reader and tag test . . . . . . . . . . . . . . . . . . . . . . . . . . . . 63
5.2.2 Reader and ST test . . . . . . . . . . . . . . . . . . . . . . . . . . . . 66
5.2.3 ST and tag test . . . . . . . . . . . . . . . . . . . . . . . . . . . . . . 68
5.3 Software design . . . . . . . . . . . . . . . . . . . . . . . . . . . . . . . . . . 69
5.3.1 Overview . . . . . . . . . . . . . . . . . . . . . . . . . . . . . . . . . 69
5.3.2 LLRP . . . . . . . . . . . . . . . . . . . . . . . . . . . . . . . . . . . 69
5.3.3 RFID Locator software . . . . . . . . . . . . . . . . . . . . . . . . . . 70
5.3.3.1 Software back-end . . . . . . . . . . . . . . . . . . . . . . . 70
5.3.3.2 Localization method . . . . . . . . . . . . . . . . . . . . . . 70
5.3.3.3 User interface . . . . . . . . . . . . . . . . . . . . . . . . . . 73
6 Experiments and Applications 77
6.1 Overview . . . . . . . . . . . . . . . . . . . . . . . . . . . . . . . . . . . . . . 77
6.2 Proximity Detection . . . . . . . . . . . . . . . . . . . . . . . . . . . . . . . 77
6.2.1 Object-to-object interactions when the objects are stationary . . . . . 77
6.2.2 Object-to-person interaction when both are stationary . . . . . . . . 78
6.2.3 Object-to-object interactions when one object is mobile . . . . . . . . 79
6.3 Localization . . . . . . . . . . . . . . . . . . . . . . . . . . . . . . . . . . . . 82
6.3.1 Locating stationary objects . . . . . . . . . . . . . . . . . . . . . . . 82
6.3.2 Locating mobile objects . . . . . . . . . . . . . . . . . . . . . . . . . 83
6.3.3 Locating mobile objects and indirect locating stationary tags . . . . . 88
6.4 Activity Tracking . . . . . . . . . . . . . . . . . . . . . . . . . . . . . . . . . 90
6.4.1 ST as a wearable device . . . . . . . . . . . . . . . . . . . . . . . . . 90
6.4.2 Passive tag as a wearable device . . . . . . . . . . . . . . . . . . . . . 93
6.4.3 Detecting and locating movement of objects and people in landmarked
area . . . . . . . . . . . . . . . . . . . . . . . . . . . . . . . . . . . . 94
6.5 Non-line-of-sight e�ects . . . . . . . . . . . . . . . . . . . . . . . . . . . . . . 96
viii
6.6 Portal and Cross Reading . . . . . . . . . . . . . . . . . . . . . . . . . . . . 97
6.7 Summary of the Experimental Results . . . . . . . . . . . . . . . . . . . . . 99
7 Conclusion 101
7.1 Concluding remarks . . . . . . . . . . . . . . . . . . . . . . . . . . . . . . . . 101
7.2 Future Work . . . . . . . . . . . . . . . . . . . . . . . . . . . . . . . . . . . . 102
ix
List of Tables
2.1 Comparison between Range-based Localization . . . . . . . . . . . . . . . . . 19
2.2 Real time Localization Systems on the market . . . . . . . . . . . . . . . . . 25
2.3 Comparison between di�erent localization solutions in academia . . . . . . . 26
2.4 Comparison between di�erent technologies in passive RFID localization and
proximity detection . . . . . . . . . . . . . . . . . . . . . . . . . . . . . . . 35
3.1 Comparison of UHF RFID solutions for proximity detection . . . . . . . . . 39
3.2 Potential application of STs based on di�erent placement of tags and STs . . 44
3.3 Proximity detection applications based on whether the STs and tags are placed
on objects or people . . . . . . . . . . . . . . . . . . . . . . . . . . . . . . . 46
4.1 Comparison table between the di�erent solutions for proximity detection and
localization with ST. . . . . . . . . . . . . . . . . . . . . . . . . . . . . . . . 57
5.1 Sample ST log �le. . . . . . . . . . . . . . . . . . . . . . . . . . . . . . . . . 71
6.1 Detection rate for di�erent distances between the ST and the reader and the
ST and the tag when both the tag and the ST are stationary and the tag is
placed either on an object or on a person. . . . . . . . . . . . . . . . . . . . 78
6.2 Twenty records out of 200 for Figure 6.5 (a) and errors(cm) in each coordinate 85
6.3 Error values for experiment 1 and 2 at di�erent distances from the origin . . 88
x
List of Figures
1.1 High-level block diagram of RFID system . . . . . . . . . . . . . . . . . . . . 1
1.2 Commercial UHF RFID tags . . . . . . . . . . . . . . . . . . . . . . . . . . . 2
2.1 Internet of Things concept . . . . . . . . . . . . . . . . . . . . . . . . . . . . 8
2.2 RFID System . . . . . . . . . . . . . . . . . . . . . . . . . . . . . . . . . . . 12
2.3 Di�erent radio frequencies for RFID . . . . . . . . . . . . . . . . . . . . . . . 13
2.4 EPCglobal framework [1] . . . . . . . . . . . . . . . . . . . . . . . . . . . . . 15
2.5 Electronic product code . . . . . . . . . . . . . . . . . . . . . . . . . . . . . 16
2.6 APIT: Triangular Coverage Based on Proximity [2] . . . . . . . . . . . . . . 21
2.7 Triangulation technique . . . . . . . . . . . . . . . . . . . . . . . . . . . . . 22
2.8 Objects 'X', 'Y', and 'Z' are located by monitoring their connectivity to one
or more access point in a wireless cellular network. The cell geometry is
dependent to the wireless technology technology used in the implementation.
For example, X in the picture is a radio cellular network with the shape of the
region containing object 'X' while di�use infrared in a room is constrained
by the walls resulting in a square shape which illustrated by the area that
contains 'Z'[3]. . . . . . . . . . . . . . . . . . . . . . . . . . . . . . . . . . . . 27
2.9 Proximity sensor model [4] . . . . . . . . . . . . . . . . . . . . . . . . . . . . 29
2.10 Target tracking model in [4] . . . . . . . . . . . . . . . . . . . . . . . . . . . 30
2.11 Olivetti Active Badge (right) and a base station (left) used in the system's
infrastructure [3] . . . . . . . . . . . . . . . . . . . . . . . . . . . . . . . . . 31
2.12 Target tracking model in [5] . . . . . . . . . . . . . . . . . . . . . . . . . . . 32
3.1 Overall concept for RFID augmented devices . . . . . . . . . . . . . . . . . . 37
3.2 Block diagram of the ST . . . . . . . . . . . . . . . . . . . . . . . . . . . . . 41
3.3 The main operational steps of an ST . . . . . . . . . . . . . . . . . . . . . . 42
xi
3.4 Steps implemented by the host for obtaining information from STs through
readers . . . . . . . . . . . . . . . . . . . . . . . . . . . . . . . . . . . . . . . 43
4.1 ST-based RFID system . . . . . . . . . . . . . . . . . . . . . . . . . . . . . . 49
4.2 Localization of the tags T and ST-R with ST-E tags placed at known �xed
locations. There are two readers, labeled R1 and R2. The dotted circles
around each ST-E tag represent their detection range. . . . . . . . . . . . . . 52
4.3 Localization of the tags T and ST with passive/semi-passive beacon tags (BTs)
placed at known �xed locations. . . . . . . . . . . . . . . . . . . . . . . . . . 53
5.1 Experimental set for evaluating the distance from reader to ground e�ect on
RSSI value . . . . . . . . . . . . . . . . . . . . . . . . . . . . . . . . . . . . . 64
5.2 RSSI values for di�erent positions of reader antenna and tags . . . . . . . . . 64
5.3 RSSI values for di�erent positions of reader antenna and tags when the angle
between the tag and reader antnna is 45 degree . . . . . . . . . . . . . . . . 65
5.4 RSSI values for di�erent angles between the reader antenna and UHF tag . . 66
5.5 RSSI values for di�erent distances between the reader antenna and ST . . . 67
5.6 RSSI values for di�erent angles between the reader antenna and ST . . . . . 67
5.7 ST EPC structure . . . . . . . . . . . . . . . . . . . . . . . . . . . . . . . . . 68
5.8 (a) Centroid Localization; (b) Weighted Centroid Localization . . . . . . . . 72
5.9 User interface of RFID locator software . . . . . . . . . . . . . . . . . . . . . 74
5.10 User interface of RFID locator software after doing setup and running the
localization . . . . . . . . . . . . . . . . . . . . . . . . . . . . . . . . . . . . 76
6.1 A mobile ST and stationary tag experiment. . . . . . . . . . . . . . . . . . . 80
6.2 The experimental setup. . . . . . . . . . . . . . . . . . . . . . . . . . . . . . 81
6.3 The number of times a tag is detected by a mobile ST when the ST is in the
segment corresponding to angles of 0, 15, 30, 45 and 60 degrees, respectively,
and for three di�erent speeds of the robot. . . . . . . . . . . . . . . . . . . . 82
6.4 Number of times a mobile tag is detected by a stationary ST when the tag
is in the segment corresponding to angles of 0, 15, 30, 45 and 60 degrees,
respectively, and for three di�erent speeds of the robot. . . . . . . . . . . . . 83
6.5 Location estimation for two di�erent locations in landmarked area. (a) Loca-
tion(50cm,200cm). (b) Location(50cm,350cm). . . . . . . . . . . . . . . . . . 84
6.6 The experimental setup for direct localization of ST. . . . . . . . . . . . . . 86
xii

6.7 Graphical user interface in real-time direct localization. Each location esti-
mation of the ST has been presented by a red dot. . . . . . . . . . . . . . . . 87
6.8 Estimated location and their corresponding real location in direct localization. 89
6.9 Graphical User Interface of the software for localization of STs in real-time. . 90
6.10 An experimental setup for tracking interactions between a person and an object. 91
6.11 Number of reads of a tag by the reader and by the ST in tracking experiment 1. 92
6.12 Number of reads of a tag by the reader and by the ST in tracking experiment 2. 93
6.13 Experimental setup for tracking the interactions among a person and an object. 94
6.14 Tracking activity in UHF landmarked area. . . . . . . . . . . . . . . . . . . . 95
6.15 LOS experiment for traditional RFID system: RSSI for two di�erent distances
between the reader antenna and the tag where measurement is repeated 6 times. 96
6.16 NLOS experiment for traditional RFID system: RSSI for two di�erent dis-
tances between the reader antenna and the tag where measurement is repeated
6 times. . . . . . . . . . . . . . . . . . . . . . . . . . . . . . . . . . . . . . . 97
6.17 LOS experiment for ST-based RFID system: the number of reads by the ST
in 15 seconds repeated 6 times. . . . . . . . . . . . . . . . . . . . . . . . . . 98
6.18 NLOS experiment for ST-based RFID system: the number of reads by the ST
in 15 seconds repeated 6 times. . . . . . . . . . . . . . . . . . . . . . . . . . 98
xiii

List of Abbreviations
3D 3 Dimensional, page 3
AOA Angle Of Arrival, page 3
ARR Augmented RFID Reader, page 5
CL Centroid Localization, page 71
DOA Direction of Arrival, page 22
EPC Electronic Product Code, page 2
FFC Far Field Communication, page 14
Gen2 Generation 2, page 2
GPS Global Positioning System, page 2
HAN Home Area Networks, page 9
IoT Internet of Things, page 3
IP Internet Protocol, page 11
IPS Indoor Positioning Systems, page 21
IR Infra Red, page 3
Kb Kilo Byte, page 15
LLRP Low-Level Reader Protocol, page 69
LOS Line Of Sight, page 2
xiv

NFC Near Field Communication, page 13
OCR Optical Character Recognition, page 11
PDoA Phase Di�erence of Arrival, page 22
RFID Radio Frequency Identi�cation, page 1
RSS Received Signal Strength, page 22
RTLS Real Time Localization Systems, page 2
SoC System on Chip, page 11
ST Sense-a-Tag, page 3
TDoA Time Di�erence of Arrival, page 22
ToA Time of Arrival, page 22
TOF Time of Flight, page 18
UHF Ultra High Frequency, page 14
UWB Ultra Wide Band, page 23
WCL Weighted Centroid Localization, page 72
WLAN Wireless Local Area Network, page 23
xv

Chapter 1
Introduction
1.1 Overview of the �eld
1.1.1 RFID System
RFID is a wireless data transmission process between an interrogator called a reader and a
transponder called a tag. The tag consists of an internal memory or one/multiple sensor(s)
that send information to the reader. The reader is usually connected to a host computer
with a database, in order to do further processing of information received from the tags.
Currently, RFID technology has been applied to many applications such as transportation,
asset management, logistics, animal tracking, supply chain, etc.[6]
ReaderTag
data
clock
energydata Host PC
Figure 1.1: High-level block diagram of RFID system
RFID systems have di�erent categories based on frequency and working mechanism.Tags
are clasi�ed as active, passive and semi-passive. Majority of active tags include a power
source and send their information toward a reader at preset intervals. Commonly, passive
and semi-passive tags send their information when they are activated by the signal from the
reader. Both passive and semi-passive tags transmit the data by backscattering the reader`s
1

Introduction 2
signal. The main di�erence between passive and semi-passive tags is that semi-passive tags
use internal battery for their internal process such as decoding signal or reading sensors, and
increase the sensitivity and read range by this way. RFID systems operating in KHz, MHz
and GHz have di�erent applications and standards.
1.1.2 Passive UHF RFID
Passive RFID has been introduced as a replacement for barcode systems. Originally, they
were designed for the identi�cation of small goods. Passive tags are inexpensive and come
with memory and the ability to modify memory. Some passive tags also integrate authenti-
cation and encryption. These features open doors to other applications too [7].
Figure 1.2: Commercial UHF RFID tags
EPCglobal Class-1 Gen2 (ISO 18006c, [8]) UHF RFID is a "reader talk �rst" protocol
for passive UHF RFID systems. The tag waits to be addressed �rst. Then it transmits the
data using backscattering modulation, which can be its identi�cation code or parts of its
memory.
1.1.3 Real Time Localization System (RTLS)
Since satellite based navigation techniques such as Global Positioning System (GPS) are
limited to outdoor areas, and wireless network devices are large and expensive, indoor Real
Time Localization Systems (RTLS) are an emerging application of RFID systems. Non RF-
Based localization techniques like laser-based, infrared and ultrasonic localization are a�ected
by environmental impacts such as �uorescent lights. They are limited to applications that
can satisfy Line-of-Sight (LOS) readability. One of the main issues with RF-based systems is

Introduction 3
multipath propagation. Some approaches have been introduced to estimate distance between
unknown targets and known ones such as readers. Received Signal Strength Indication
(RSSI), Time of Arrival (TOA), and Angle of Arrival (AOA) are the most well-known. The
problem with all of these techniques is that in reality using backscattering modulation does
not follow the theoretical propagation model. The better solution to localize is proximity
detection, by using intersection of several coverage areas. We should note that proximity
techniques are dependent on the density of reference tags and reader distribution which
increases their cost. Most of the reported RFID-RTLS systems are still designed for two
dimensional space and there is not much research yet on 3D systems.
1.1.4 Proximity Detection
Proximity detection systems can detect the presence of an object or person. In proximity
detection, the actual locations of the two objects are not important. The only important
factor is the presence of two objects near each other. Proximity detection systems became
more popular when the Internet of Things appeared. With the IoT, there has been a need
to recognize objects or persons in each other's vicinity in situations like mines, work areas,
medical care and social interaction. Depending on the application many di�erent technologies
such as such as IR sensors, Sonar sensors, GPS, RFID, etc. have been used to detect
proximity[9].
1.2 Problem statement
In recent years the concept of the Internet of Things (IoT) has been gaining popularity. The
basic premise of the concept is that "things" are interconnected and have unique identi�ers.
With such technology implemented, waste products and inventory mismanagement will be
a thing of the past. One of the potential technologies for the IoT is RFID. The coarse-
grained knowledge of the location of a tag o�ered by RFID systems is not suitable for the
context-awareness of identi�able objects in IoT. The objective of this thesis is to analyze and
improve the functionality of a novel semi-passive tag called "Sense-a-Tag (ST)" introduced
in [10]. The ST can overcome the existing limitations of RFID systems including cost and
performance. The existing systems for proximity detection and localization, are based on
active systems and run on specialized platforms. Since ST can be added as a new hardware
to any current RFID system without any modi�cation in hardware or �rmware, it can be
considered a realistic solution for proximity detection and localization applications. In this

Introduction 4
thesis we show how ST can be used for tracking, localization, proximity detection and people
interaction monitoring. The method described in this thesis, overcomes the limitation of
existing RFID localization systems including cost, accuracy and scalability. This new method
has many applications using UHF RFID for the IoT.
1.3 Motivation
The motivation behind this thesis to open new doors for using RFID systems in multi-
purpose applications. Nowadays, RFID readers and tags exist everywhere. RFID systems
have only been used to recognize and identify items. However, these wireless systems are
capable of much more.
Since the epiphany of the IoT, RFID has became more popular and is being explored
for use in developing IoT technology. Three key answers to who?/where?/when? can cover
all the needs of many smart applications. Today, current RFID system can answer some of
these questions. However, estimating the location of objects using RFID is still challenging.
Interaction between the objects and people can provide valuable information that can be used
for di�erent applications such as marketing and health monitoring. ST, as an augmented
device, has been added to RFID system to increase its capabilities. Although tracking has
been introduced as one of the applications of ST, detailed analysis of performance of the ST-
based RFID system especially for proximity detection application has not been performed
yet.
We investigated the "weighted-centroid" method of localization and activity tracking
system based on proximity detection using ST and RFID passive tags.
1.4 Objectives
Passive RFID tags are expected to be the heart of the IoT because they are inexpensive
and they do not need internal or external power source. However, passive RFID systems
are not capable of performing complex operations such as proximity detection and accurate
localization, which are important to the IoT. There are three di�erent scenarios for the object
location information using RFID systems:
• Localization of stationary objects.
• Localization of moving objects tagged with RFID tags.

Introduction 5
• Detecting proximity between objects.
In the past decade much research has been done on using UHF RFID for proximity
detection and localization. Gen2 listener [11], Augmented RFID Reader (ARR) [12] and
Tag-to-Tag communication system [13] can be counted as similar works to ST. But none of
these researches have been able to o�er low cost, mobility and precision.
The main objective of this thesis to investigate the performance of an ST-based RFID
system for localization and proximity detection application while keeping the overall cost of
RFID system low and by reducing mobility of tagged objects in the RFID system.
1.5 Contribution
Required localization accuracy of the system is di�erent depending on the applications. For
indoor localization, less than 25cm accuracy can meet most of the application's requirement.
For proximity detection, required detection rate is 90%. The method introduced in this
thesis o�ers a less expensive proximity detection system than similar e�orts such as Gen2
listener [11], Augmented RFID Reader (ARR) [12] and Tag-to-Tag communication system
[13]. It also o�ers good accuracy to be used in many applications. The contribution of this
thesis can be summarized:
• Development of a real-time and multi-threaded software to localize tagged objects.
• Development of a real-time simulator based on real results for proximity detection.
• Measurement of the performance of ST with passive and semi-passive tags in real
environment.
• Demonstration of the proximity detection of ST as a people interaction detector system.
• Investigation of ST potentials in IoT applications based on proximity detection.
1.6 Thesis Organization
Chapter 2 presents a background and literature review on the RFID system, Internet of
things (IoT), realtime localization systems(RTLS) and proximity detection, with em-
phasis on the UHF RFID-EPCGen 2 standard.

Introduction 6
Chapter 3 presents the description of ST including its functionality and potentials for
proximity detection and localization. A survey about similar devices that augment the
RFID systems is presented in this chapter.
Chapter 4 describe how ST can be a helpful device for future IoT. We summarize the
problems with regular RFID system and show how some of those problem will be
solved in ST-based RFID system. Advantages and limitation of ST compared to other
solutions in proximity detection have been discussed in this chapter.
Chapter 5 summarize a experimental analysis for basic tests in ST-based RFID system.
We describe the proposed localization and proximity detection system designs, in the
real environment and investigate the parameters which might a�ect the read-range and
accuracy.
Chapter 6 covers the experimental results and analysis for the experiments that have been
done based on some IoT applications. Di�erent factors that a�ect the localization and
proximity detection discussed in this chapter. Also the accuracy and reliability of the
system have been investigated for each application.
Chapter 7 summarizes the conclusions and recommends future research.

Chapter 2
Background and Prior Art
2.1 The Internet of Things
2.1.1 Overview
With the daily development of technology and ever increasing connections between hardware
and software, society is moving towards the concept of "always being in touch". Nowadays,
networks exist everywhere, either wired or wireless. This has led to proposals for new
networks where objects and people are connected over the internet known as "Internet of
Things". Many researchers believe that the IoT will change the world for people and objects
in the same way that the internet did for the information [14]. The usual path for developing
a product is to start from science and end in engineering. But the IoT is an exception[15].
Because engineers came up with the idea of IoT after wide-spread use of RFID in di�erent
applications.
2.1.2 IoT Architectures
The architecture of the IoT consists of three main layers: perception, network and application
[16]. Later, researchers proposed a more layered architecture that consists of perception,
transport, processing, application and business [17]. The perception layer gathers the data
and information by various data collection technologies such as barcode, RFID, camera,
sensors and etc. The transport layer is responsible for transmitting data received from the
perception layer. Protocols for communication such as IPV6 are applied in this layer. The
processing layer stores, analyzes and processes the information about objects received from
the transport layer. The application layer addresses industry and society demands and the
7

Background and Prior Art 8
search for solutions to them. Finally, the business layer, acts as a manager of the IoT, �nding
a business model for new applications.
Figure 2.1: Internet of Things concept
Background and Prior Art 9
2.1.3 IoT Requirements
Bill of material(BOM) cost
Internet connection price is one of the issues in the globalization of the IoT. Connecting to the
internet requires widespread memory and CPU resources. These are needed to support heavy
weight TCP/IP protocol and operating systems to communicate over SSL. This increases
the cost of the system. Some home area networks (HAN) have been developed to be able
to communicate with small packet sizes such as ZigBee, Z-Wave, RFID, etc.[18], But these
technologies are not designed for global usage. It is impossible to carry HAN protocols
over the internet. So we need a convert the protocol on the �rst gateway so that it can be
carried over the internet. To solve this problem, XML based communication technologies
(e.g. REST, JSON) have been developed. The problem with them is that huge code libraries
are needed[19]. The cloud computing design pattern made it possible to use 8-bit MCUs
with a small amount of memory in communication infrastructure. However, RFID, as an
interface between nodes and internet connectable devices, can collect the data at lower cost
which enables higher production volumes.
Ease of installation
The installation process for any IoT system should be easy enough that non-technical people
can use them in their environments. One of the problems in IoT applications for a regular
customer, is setting up the router and assigning a special IP address to the endpoint. Another
challenge is that it is not possible to de�ne a static IP for each item in an area, so we usually
use dynamic IP addresses. Cloud computing based communication schemes outside the
consumer`s �rewall, somehow solved this problem. However, the easier way would be to
gather the information by an interface and assign a single IP address to only one reader.
RFID can help us here by collecting the data from tags and making it ready to send through
the internet.
Security
Depending on the application, security is one of the most important parts of any network.
For security purposes, Let us consider separately the HAN and the internet connection.There
are many types of technologies to provide security for the internet. Some are expensive(e.g.
SSL, VPN) and some are cheap(e.g. WPA, WPA2, etc.). For the HAN, depending on the
Background and Prior Art 10
technology that we are using, security methods can be changed. Unfortunately, UHF RFID
security is not completely reliable. Although many 8-bit MCUs used in low cost end point
have 128-bit AES encryption in their hardware without any extra cost, providing a secure
connection in low cost design of UHF RFID tags is still a big issue.
Reliability
A basic expectation of consumers is reliability. Among the most common problems with
internet connectable devices, is that they freeze up and need to be rebooted manually.
These problems are frequently experienced with OS based PCs and smart-phones. We need
a reliable and less vulnerable internet connection. For example, a consumer, who wants
to be able to check remotely whether they have left their stove on, will not be satis�ed if
they cannot check because their home computer has shut down. RFID because of its simple
architecture o�ers an alternative not vulnerable to these problems. Even if electricity is lost,
RFID can boot automatically and continue the operation. Only a simple interface hardware
is required here to make the information from RFID readable for WiFi routers.
Scalability
When we are talking about the IoT, we are considering millions of devices as endpoints in
our network. So it is essential to pay attention to scalability. Storing the information of
each endpoint in one database will be impossible. A SQL database on a server can handle
maximum 1000 SQL operations per second. Currently, most MCUs pro�t from reasonable
EEPROM and FLASH memory. These memories have been integrated in UHF RFID tag
chips (e.g. NXP, Impinj, and EM Microelectronics) [20][21]. By storing information inside
the tag or middle-ware, and calling them only when we need the information, we actually
create millions of small databases which are always accessible.
2.1.4 IoT and RFID
RFID is the starting point of the idea of the IoT and researchers started to develop the IoT
without any deep understanding of the science behind it. Nowadays, IoT is based mainly
on RFID. Since each RFID tag has a unique ID, each tagged item has a unique identity
in the world. Therefore, it is possible to send to and to gather information from of all the
objects around us. RFID tags send their information to a reader that can include only tags'
IDs or additional data such as data obtained from attached sensors. After receiving this
Background and Prior Art 11
information, the reader will send it to a host computer where further processes can be done.
In both de�ned architectures in section 1.2, the perception layer plays the main role in the
IoT. Data collection technologies such as ZigBee, RFID, NFC, Bluetooth, Z-wave and others
have grown a lot in the last decade. To actualize the IoT, each object (thing) should have
a unique identity in the network. This can be a unique IP or ID which can be addressed
locally in the network. IPV6 protocol allows that each node in the network can have its own
IP address. The same thing is true for RFID systems. RFID is one of the best solutions for
data collection and meet the IoT requirements [22] mentioned above.
On the other hand, microprocessors and SoCs are getting smaller and require less power
[23]. This opens up the opportunity to integrate light weight network protocols in RFID
tags. Ideally, we will be able to keep the passive property of RFID systems, while allowing
the tags to connect Internet through a simple interface and lightweight protocols[24].
2.2 Radio Frequency IDenti�cation (RFID)
2.2.1 Overview
RFID technology is a wireless data collection technology that permits unique identi�cation
of objects. It is one of many types of automatic identi�cation, including bio-metric(exp.
�ngerprint), Optical Character Recognition (OCR), and smart cards. In comparison with
barcodes, RFID has the advantages of: longer read range, supporting larger memory and
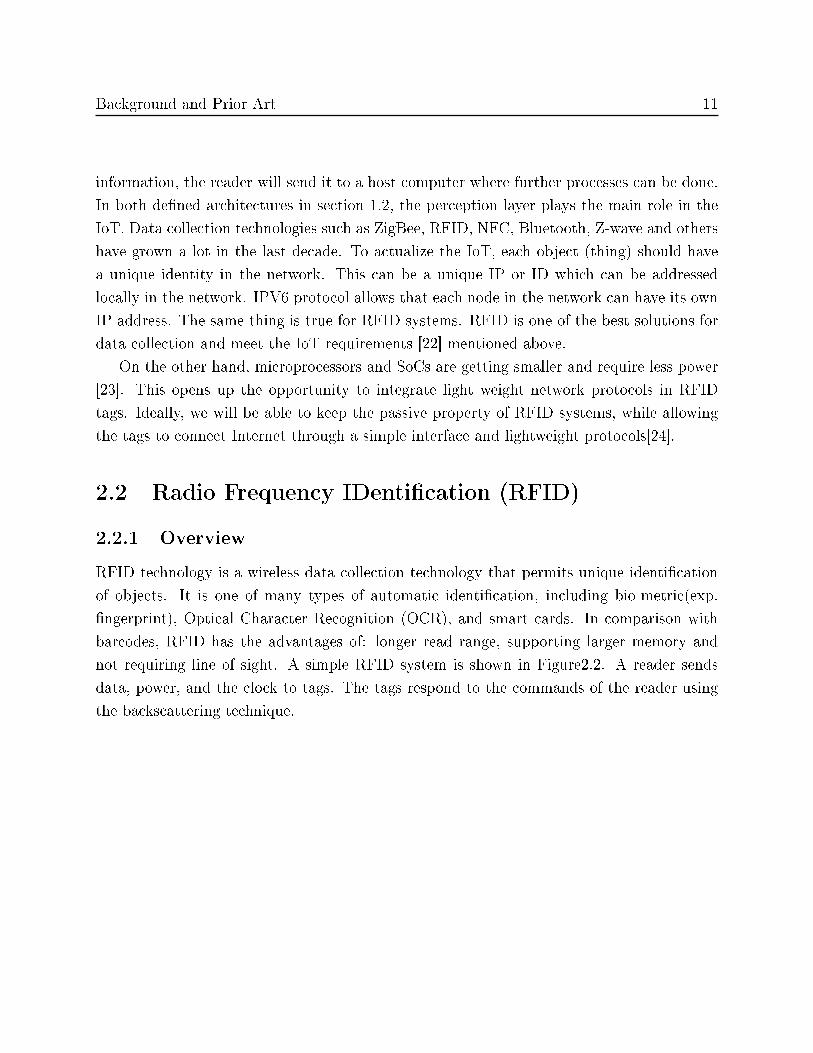
not requiring line of sight. A simple RFID system is shown in Figure2.2. A reader sends
data, power, and the clock to tags. The tags respond to the commands of the reader using
the backscattering technique.

Background and Prior Art 12
Figure 2.2: RFID System
2.2.2 RFID Classi�cation
RFID systems are classi�ed based on either their frequency of operation or power system.
In some references [25], researchers classi�ed the RFID systems based on coupling method.
- Frequency
The �rst type of classi�cation for RFID systems is their frequency of operation. Depending
on the frequency range, the applications are also di�erent. LF systems pro�t from a high
penetration rate that allows them to be used near metal or water. HF systems have a longer
read range and also are much cheaper than LF tags. Finally UHF tags have highest the
data rate, the longest range and the lowest cost compared to the others. Figure 2.3 shows
di�erent frequencies that RFID systems can operate in.

Background and Prior Art 13
Figure 2.3: Di�erent radio frequencies for RFID
- Power
RFID systems can also be classi�ed according to how they get their power for operation: this
can be passive, semi-passive and active. Both passive and semi-passive tag are activated by
the RF signal from the reader. The passive tag is only powered by the energy transformed
from the radio wave from the reader. This signi�cantly reduces the read range for tag, but
also makes it smaller and cheaper. Semi-passive tags use battery for their internal processing
and to power up the sensors integrated with tag. As with passive tags, they don`t use internal
power for transmitting the signal. Both passive and semi-passive tags send their signal using
the backscattering modulation. A backscatter RFID system is basically a radar system in
which the reader (radar transceiver) provides the radio frequency signal for communications
in both directions. The tag has no transmitter power generating source, but uses the incident
power from the reader on which to modulate its response. Active tags use their power for all
required operations. Their read range is much longer than passive and semi-passive group.
Active tags are usually tag-talk-�rst. Since cost and life time are two major factors that
make this technology so widespread, power is very important in RFID. Semi-passive tags
and active tags usually have a maximum life time of 3-5 years.[26] passive tags can work in
de�nitely unless they are physical damaged.
- Coupling
Coupling in RFID refers to the way that power is transferred from the transponder to the tag.
Two types of coupling are already in use in di�erent RFID systems: inductive (or near-�eld)
and radiative (far-�eld) [25]. Near Field Communication (NFC) is a set of standards for
Background and Prior Art 14
electronic devices, communicating with each other, from not more than 10cm apart. When
in proximity, the initiator actively generates an RF �eld and powers up a passive target. In
Far Field Communication (FFC), a receiver can pick up a signal without having any e�ect
on the original signal from the source. Tags will communicate by modulating their message
on the carrier signal in passive mode, which is called backscattering modulation.
2.2.3 Reader and Tag
A RFID reader is a device that communicates with compatible RFID tags with one or
multiple antennas. Modulation and demodulation are done inside the reader. Some readers
can have data transmission with both active and passive tags in the same frequency, but
most are only capable of working in just one mode. Database management and special
reader settings such as threshold justi�cation for power of the RF signal, are usually done
by the host computer connected to the reader. A RFID tag is a device that contains internal
memory and unique ID. Some tags have sensors integrated within them and can transmit the
sensor information using RF signals. As mentioned before, tags can be categorized by their
power type: passive, semi-passive and active. Active tags usually send their information
when they receive the activator signal from the reader. Then they send their information at
a speci�c time interval. Passive and semi passive tags are usually reader talk �rst systems,
so they will respond to the reader using backscattering modulation.
2.3 EPC Global Standard
2.3.1 EPC Global
EPCglobal is an organization with the goal of promoting and standardizing EPC (Electronic
Product Code). EPC is an RFID coding scheme, for replacing the old barcode system. EPC
standard o�ers a large variety of �elds in UHF RFID to improve its capabilities including:
the capture of information, the exchange of information, and the identity of information.
Figure 2.4 shows the EPCglobal standards hierarchy.

Background and Prior Art 15
Figure 2.4: EPCglobal framework [1]
2.3.2 EPCglobal Class 1 Generation 2 Standard
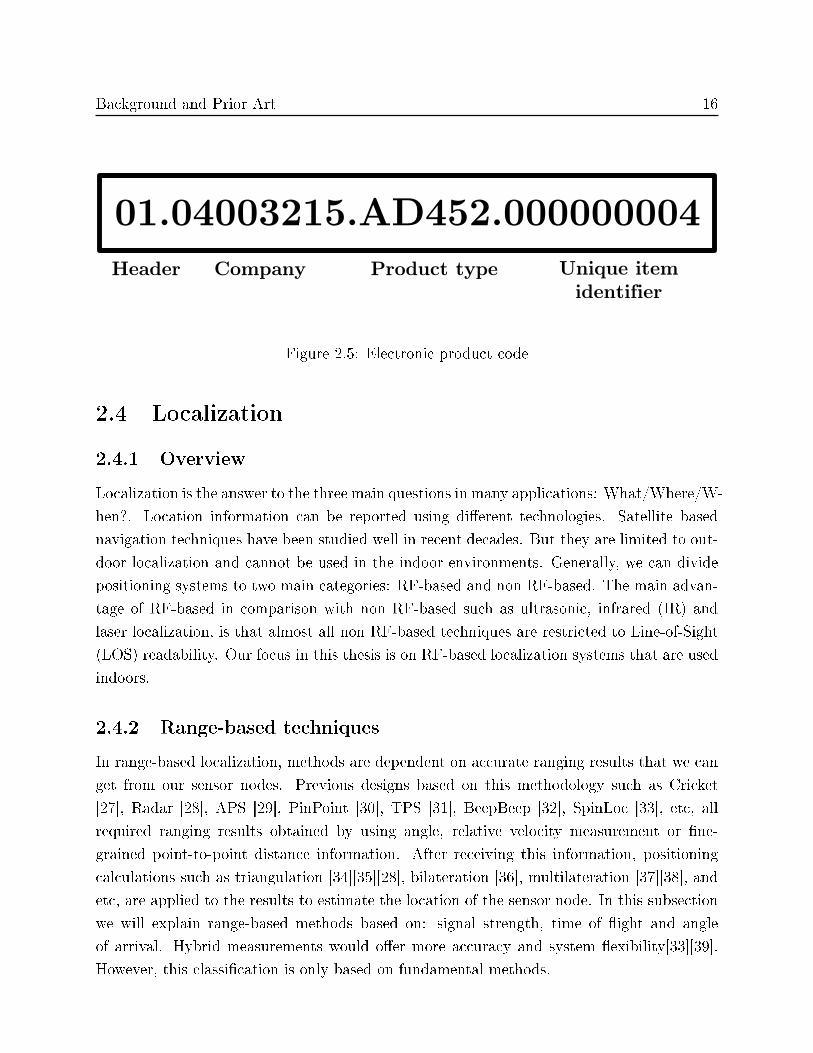
The main speci�cation of the standard is the electronic product code, Figure 2.5, which is the
global identi�er tags use in the EPC Gen 2 standard. The EPC has 96 bits, which identify
respectively the encoding standard, company information, product type, and unique item
identi�er. The idea is that each tag has a unique ID. Using EPC Gen2, we can identify 268
million di�erent companies, each with 16 million distinct object classes. That means we can
have 4288 billion unique serial numbers in the world. In addition to an EPC number, tags
can store information such as expiration date, manufacturing date, manufacturing location,
etc. New tags can have more than 8Kb memory in the chip and can send information using
the RFID interface to the reader.[20]
Background and Prior Art 16
01.04003215.AD452.000000004
Header Company Product type Unique item
identifier
Figure 2.5: Electronic product code
2.4 Localization
2.4.1 Overview
Localization is the answer to the three main questions in many applications: What/Where/W-
hen?. Location information can be reported using di�erent technologies. Satellite based
navigation techniques have been studied well in recent decades. But they are limited to out-
door localization and cannot be used in the indoor environments. Generally, we can divide
positioning systems to two main categories: RF-based and non RF-based. The main advan-
tage of RF-based in comparison with non RF-based such as ultrasonic, infrared (IR) and
laser localization, is that almost all non RF-based techniques are restricted to Line-of-Sight
(LOS) readability. Our focus in this thesis is on RF-based localization systems that are used
indoors.
2.4.2 Range-based techniques
In range-based localization, methods are dependent on accurate ranging results that we can
get from our sensor nodes. Previous designs based on this methodology such as Cricket
[27], Radar [28], APS [29], PinPoint [30], TPS [31], BeepBeep [32], SpinLoc [33], etc, all
required ranging results obtained by using angle, relative velocity measurement or �ne-
grained point-to-point distance information. After receiving this information, positioning
calculations such as triangulation [34][35][28], bilateration [36], multilateration [37][38], and
etc, are applied to the results to estimate the location of the sensor node. In this subsection
we will explain range-based methods based on: signal strength, time of �ight and angle
of arrival. Hybrid measurements would o�er more accuracy and system �exibility[33][39].
However, this classi�cation is only based on fundamental methods.
Background and Prior Art 17
2.4.2.1 Signal Strength
Received Signal Strength (RSS) can be measured at almost no additional cost to the system,
so it became the most popular method for range estimation in many wireless networks.
Signal strength can be reported as a part of message in the reader side. Most of RFID
readers also report RSS using their interfaces such as LLRP. The problem with RSS is that
it is dependent on the environment and is susceptible to re�ecting changes caused by other
objects in the area [40][41]. Without having a detailed model of the physical environment
inferring distance from RSS will not be precise.
SpotON [42] uses signal strength and triangulation techniques using active tags for lo-
calization. Such techniques are less feasible with passive tags since they do not have any
power source. That results in a weak, unreliable signal that is causes signi�cant errors in
triangulation techniques.
To improve the accuracy of positioning based on RSS, two solutions have been investi-
gated.
• directly infer distance from RSS measurements based on statistic results and multiple
measurements[43][44].
• radio pro�ling and radio-frequency (RF) �ngerprint matching [45][46][47].
2.4.2.2 Time of Flight(TOF)
Many localization systems use time of �ight measurement of radio signals to estimate the
range. In this methodology the distance is calculated based on the speed of signal propagation
and the time elapsed between the signal transmitter and receiver. Sometimes, in synchronized
nodes, the start time is sent through the packet and the received time is replied in the return
message. On the host side, based on the speed of signal propagation we can �gure out
how far away the target is. By decreasing the e�ective range of each node, using TOA
techniques we can achieve centimeter-level accuracy in localization. However, this requires
dense deployment of sensor nodes or transmitters and it is usually applicable in systems
based on acoustic signals [48][27]. RF-based systems, can have bigger coverage area, but
provide less accuracy in the range from one to tens of meters [49][30][50].
2.4.2.3 Angle of Arrival(AOA)
Localization can be based on angular estimates as well. Angle of arrival (AOA) is a method
which allows a receiver to determine the direction of a transmitter [43][51]. Today, phased
Background and Prior Art 18
array radars [52] and smart antennas [53] can be counted as two popular applications in
many places including the military. Using AOA in indoor localization in WSNs is not as
popular as the distance based measurement systems. This is because measuring angles is
much harder and more expensive and decreasing the size of sensor nodes is impossible if
we want to develop a localization system based on AOA [54]. Some factors that e�ect the
accuracy of the AOA system are: directivity of signals in both transmitter and receiver,
multi-path re�ection, background noise and etc.
2.4.2.4 Comparison between Range-based Localization
Table 2.1 illustrates the advantages and disadvantages of mentioned range-based localization
methods. According to this table, we can observe that TOF method has the greatest accu-
racy. However, RSS-based localization has the advantage of low cost and simplicity. Our
analysis conclude, that range-based methods can provide us with an accurate localization
system. However, it would be expensive due to hard costs such as additional hardware cost
or soft costs such as time and number of repetitions needed for reliability.
2.4.3 Range-free techniques
Although RSS-based methods in the range-based category are cheap in comparison with
other methods, they still need hardware and software resources that makes it costly. Exam-
ples of smart ideas that have been applied in pursuit of a lower cost system are Centroid
[55]and Spotlight[56]. The main idea of range free localization was based on proximity infor-
mation in respect to unknown objects with known positions [55][57]. But later another idea
called "connectivity-based localization" has been investigated by researchers that use local
neighborhood sensing to build virtual distances in large indoor areas.
Localization based on proximity is simpler than using traditional ranging methods. If
node A senses node B with any kind of technology such as radio or infrared, will report this
presence to the base station. Since one of the nodes has known location information (node
A for instance), the other one can be considered in the same location with the distance of
≤ RA where RA is the maximum read range of node A.
Centroid is a practical implementation of the same idea for localization. In this system
the target sensor node "j" will receive the information of "k" nodes in its neighborhood .
Then the location of the target node can be calculated using equation 2.1 where X and Y
are the coordinates of each neighborhood nodes.

Background and Prior Art 19
Table 2.1: Comparison between Range-based Localization
Method Advantages Disadvantages
RSS-
Direct
inferring
low-cost sensor nodes, scalable,
omni-directional, low
computation overhead for
ranging
low positioning accuracy,
environment sensitive, in-�eld
calibration for accuracy
RSS - Map
pro�ling
low-cost sensor nodes, enhanced
accuracy, omni-directional, low
computation at nodes
extensive environment pro�ling
and calibration, unscalable, high
background computation cost
TOF-
Acoustic
signal
high accuracy, low timing
requirements, low computation
and communication overhead
limited e�ective range,
directional, extra sensing
hardware, high anchor
(landmark) density
TOF-
Radio
sigmal
better accuracy than RSS direct
inferring, large e�ective range
than acoustic systems
ultra-high timing requirements,
expensive hardware, heavy
computation for signal
processing
AOAadditional channel of ranging,
orientation information
hardware constraints,
computation for e�ective
estimation
Background and Prior Art 20
(xj, yj) = (k∑
i=1
Xi/k,
k∑i=1
Yi/k) (2.1)
LANDMARC [58] and WCL [59] improved Centroid design by considering weight for the
nodes. The idea of giving weight to nodes in localization using proximity is that the anchor
which is closer to the target node, should have more weight in location estimation. Both
of the mentioned methods use RSS to calculate the weight for each node. Note that in a
realistic environment, a larger RSS does not mean that it is closer, except in an anechoic
chamber. So mathematical and statistical equations are required at least to decrease the
error. For example, LANDMARC uses the following equation to calculate the location of a
target node:
(x, y) = (k∑
i=1
wi(xi, yi)) (2.2)
Where
wi =1/E2
i∑ki=1 1/E2
i
(2.3)
And
Ei =
√√√√ n∑i=1
(Θi − Si)2 (2.4)
Θi is the RSS value in the reference tags and Si is the RSS value on the reader's side.
Also WCL applies the following equation for location estimation:
(xj, yj) =
∑ki=1wij · (Xi.Yi)∑k
i=1wij
(2.5)
wij = (Pref · 10RSSij/20)g (2.6)
RSSij is the RSS value from anchor i at/from node j, Pref is the reference power of radio
system and g is a parameter for reducing error and making weak RSS values more e�ective
in the calculation.
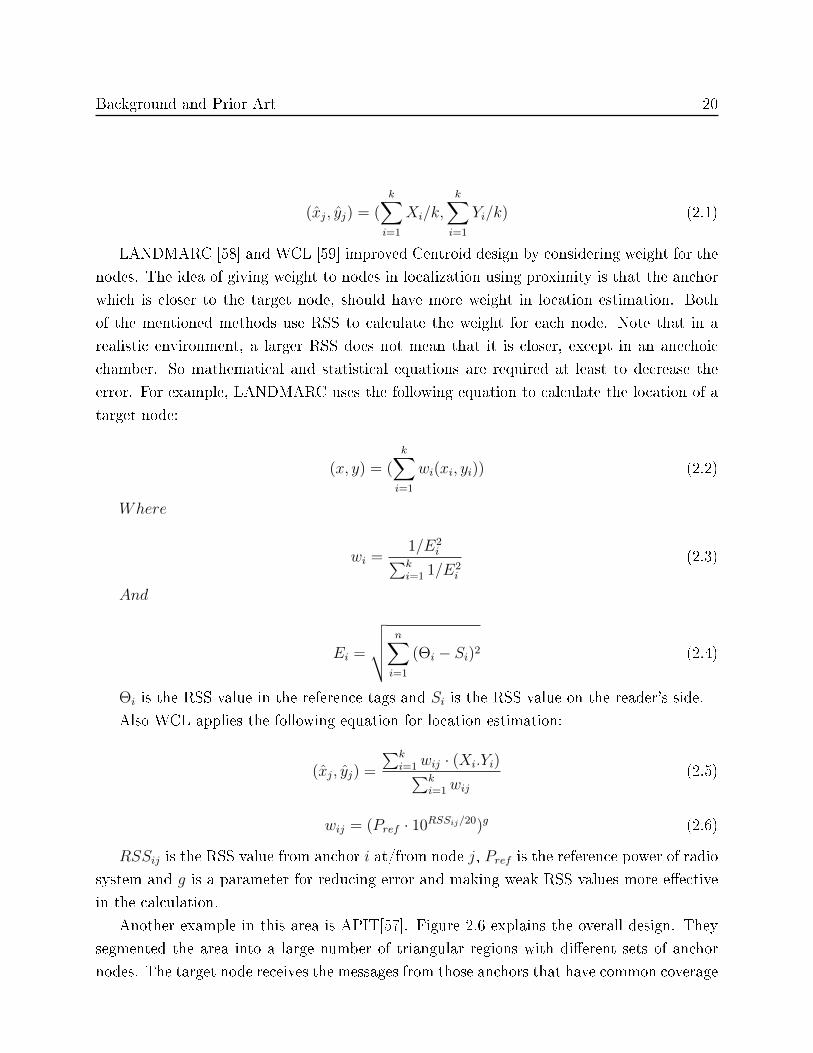
Another example in this area is APIT[57]. Figure 2.6 explains the overall design. They
segmented the area into a large number of triangular regions with di�erent sets of anchor
nodes. The target node receives the messages from those anchors that have common coverage
Background and Prior Art 21
with its location. The overlapping area from all received data can estimate the location of a
target node. As you can see in the picture the gray triangle in the �gure is the �nal estimated
location of the unknown node.
Figure 2.6: APIT: Triangular Coverage Based on Proximity [2]
2.4.4 Indoor Radio-based Real Time Localization Systems
Although outdoor localization techniques have been well studied, and are dominated by GPS
technology, IoT and many applications still lack an accurate indoor localization system. Since
GPS signals are too weak to be used indoors, indoor positioning (IPS) approaches have to
be considered in developing localization.
Mainstream techniques used for indoor positioning are [60]:
• Assisted GPS (A-GPS)
• Inertial navigation
• Infrared positioning
• Radio-based positioning
• Ultrasonic positioning

Background and Prior Art 22
• Vision-based positioning
Our focus in this thesis is on radio-based positioning. Usually in radio based systems, we
have transponder and receiver on each cycle of data transmission. RFID is not an exception
and tag and reader are sender and receiver. Localization can be important for reader and/or
receiver(tags in our case). For example, it can be important to �nd the position of RFID
tags covered by RFID readers [58][61], or to �nd the reader's location with the assistance of
reference tags.[62][63]
Ranging techniques such as those we described in the previous section, Received Signal
Strength (RSS) [64], Time of Arrival (ToA)[65], Time Di�erence of Arrival (TDoA)[66],
Phase Di�erence of Arrival (PDoA)[67] can report and estimate the distance from the reader.
Bellow are the principle techniques used in Radio-based localization[68]:
Triangulation
This technique is based on the direction of arrival of the tag signal to multiple readers
or receivers. It can also be obtained by measuring the radial distance from the readers.
Figure 2.7 illustrates the overall idea of triangulation technique. Direction of Arrival
(DOA) can be obtained using di�erent methods such as directional antenna[69][70],
phased array[71], or smart antennas.
Figure 2.7: Triangulation technique
Radio map

Background and Prior Art 23
Radio map technique also called "scene analysis", is based on previously measured
values in the environment and tries to �nd the best match with them for localizing
unknown location. The values can be signal strength [58] and other parameters, de-
pending the application. Note that accuracy of localization in this method has a direct
relation with the number of reference tags. Although there are some techniques to
avoid adding more physical reference tags and thus decrease the cost [72], for accurate
localization we need more real reference tags.
Trilateration/multilateration
Trilateration determines the location of transponder or receiver using the range in-
formation estimated at some reference points. The range can be estimated using any
ranging technique mentioned above. Trilateration is easy and useful where a high de-
gree of accuracy is not required [73][74]. RF signals are so vulnerable to be changed in
real environments, so measuring based on previous measurements cannot be reliable
all the times.
Proximity
Since the range of radio based devices is limited, if the range is not too big, the location
of an unknown object can be considered the same as the location of the reader that
detected it.[75] In UHF RFID systems, LLRP can report the number of antenna which
the tag is read from. So the reference points for detecting the proximity can be just
antennas rather than expensive readers.[76]
Radio-based IPS approaches can use Bluetooth, RFID, WiFi and any other wireless
technologies. Note that most of them were not speci�cally designed for localization, so
several modi�cations or add-ons to the system are needed in order to make them capable of
localizing.
Wireless Local Area Network (WLAN) devices are one example. But they are expensive
and also too large to attach them to small things. Also, Ultra Wide Band (UWB) systems
have a potential interference with some radar systems in the environment where they share
a wide range of bandwidth.
For indoor localization most current systems provide room-level or sub-room level resolu-
tion. Since the coverage area and resolution is limited, the cost issue becomes very important
in indoor RTLS. A brief list of up-to-date RTLS products and their major applications is
listed in Table 2.2. All of the information in the table is collected from their datasheets or
their manufacturer's website. As we can see in the table, most of indoor localization systems

Background and Prior Art 24
in the market are based on active tags. Although active systems o�er more accurate and
reliable system, but they are expensive and require battery replacement routinely.
Also a short comparison table in academic literature is presented in Table 2.3. Since UHF
Passive tags have very weak RSSI and varying considerably depending on the environment,
the localization based on signal characteristics from the tag is not going to be precise. So
there is not any considerable passive localization system based on the techniques that use
signal information.
2.5 Localization based on proximity detection
2.5.1 Overview
Proximity detection technology has been a research topic of great interest for decades, but
it has drawn new interest in recent years from research and industry because of its ability
to address new needs. One example is turning o� the smart phone touchscreen when it is
held next to the ear. In proximity detection, the location of items is not of interest. On the
other hand, the distance between objects is important. Reporting this information opens
up a large number of applications from energy harvesting to automatic control systems and
medical care systems.[84]
Proximity detection can have di�erent levels of intelligence depending on the application.
Automatic doors were an early form of proximity detection based on IR sensors. Later,
automatic toilet �ashers and faucet controls became popular. Although these sensors can
detect proximity, all of them are big, power hungry, and not intelligent enough for detecting
the identi�cation of the object. Traditional proximity detection systems could only identify
an object in the vicinity. When RFID showed up, it opened a new window to the application
of detecting proximity. Since each tag has a unique ID in RFID, we can determine the identity
of two objects and run more intelligent applications: detecting people's interaction [85][86],
nurse monitoring in health care [87], tracking people's activity in work area [85] and etc. In
this thesis our focus is on proximity detection with identi�ed objects or persons.
There are three general approaches to sensing proximity:
1. Detecting physical contact
Physical contact detection with an object is the most basic kind of proximity sensing. Pres-
sure sensors, touch sensors, and capacitive �eld detectors are some technologies that have

Background and Prior Art 25
Table 2.2: Real time Localization Systems on the marketSystem Vendor Technology Ranging Accuracy Applications
AeroScout RTLS AeroScoutWiFi and ActiveRFID
TDOA, RSSI 5 meterHealthcare,Manufacturing,Logistics
ZOMOFI Albis Active RFID Not known 0.5 - 2m Not known
Axcess RTLS Axcess Active RFID Not known Not knownLogistics,Security
CenTrak RTLS CenTrakInfrared andActive RFID
Not known Rack-level Healthcare
WirelessLocation
CiscoWiFi, Active andPassive RFID
Not known Not knownAssetManagement
Ekakau RTLS Ekakau WiFi RSSI Sub-roomHealthcare,Retail, Logictics,Manufacturing
LOST Essensium ZigBee TOA Sub-meter Logistics
Argus Guard RFID Active RFID Not known 3-5 meterIndustrial,Healthcare
SensorSMART IdentecActive RFID andWSN
Not known Not knownMarine, Oil,Mining, Defense
BizTalk RFID Microsoft UWB and RFID Not known Not known Manufacturing
RTLS ENGINE MotorolaWiFi, Active andPassive RFID
Not known Not knownAssetManagement
Omnitrol RTLS OmnitrolWiFi, UWB, andRFID
Not known Not knownManufacturing,Retail, Logistics
PanGo Locator PanGo/CiscoWiFi and ActiveRFID
RSSI Not knownAssetManagement,Healthcare
PervTrack RTLS PervComActive RFID andWSN
Not known Not knownManufacturing,Mining Industry
PINC RTLS PINC Passive RFID Not known +/- 1 spotYardManagement
Radianse RTLS Radianse Active RFID Not known Not known Healthcare
Asset Manager RF Code Active RFID Not known Sub-roomAssetManagement
RFind RTLS RFind Active RFID Not known Not known
Automotive,Logistics,Manufacturing,Public Transit
SmartChain Savi Active RFID Not known Not known
Aerospace,Defense,Logistics,NaturalResources
High De�nition Sonitor/IBM Ultrasound Not known Sub-roomHealthcare,Homecare
Plus, PlusON Time Domain UWB Not known Not known
Retail,Manufacturing,Healthcare,Defense
Ubisense RTLS Ubisense UWB AOA, TDOA 15cmManufacturing,Defense,Transpotation
WhereNet Zebra WiFi and UWB TDOA Not knownAsset Tracking,Supply ChainManagement

Background and Prior Art 26
Table 2.3: Comparison between di�erent localization solutions in academia
System Technology Method Accuracy
whereNet [77] Active RFID TDOA 2-3m
LANDMARC [58] Active RFID RSSI 1-18m
Multifrequency [78] passive RFID phase 80cm-4m
Phase [79] Passive RFID phase 1m
Cricket [27] Ultrasound +RF TDOA 10cm
WISP [80] Ulrasound+RFID ToA 1.5cm
A. Chattopadhyay at al [81] Passive RFID RSSI 60 cm
R. Miesen at al [82] Passive RFID phase N/A
A.P. Sample at al [83] Passive RFID Optical localization N/A
Sense-a-Tag (this thesis) passive RFID Proximity detection 30cm
been used for sensing physical contact. Contact, a system for intra-body data communica-
tion among objects in direct contact with a person's skin is using capacitive �eld detection
technique[88]. The same technique has been used to implement a Touch Mouse in [89].
2. Monitoring wireless cellular access points
Monitoring when a mobile device is in range of one or more access points in a wireless cellular
network is another implementation of the proximity location technique and is illustrated by
Figure 2.8. Active Badge Location System [90] and the Xerox ParcTAB System [91] are
exampels of such a system. Both using di�use infrared cells in an environment. The Carnegie
Mellon Wireless Andrew [92] using a campus-wide 802.11 wireless radio network is another
example.

Background and Prior Art 27
Figure 2.8: Objects 'X', 'Y', and 'Z' are located by monitoring their connectivity to one
or more access point in a wireless cellular network. The cell geometry is dependent to the
wireless technology technology used in the implementation. For example, X in the picture
is a radio cellular network with the shape of the region containing object 'X' while di�use
infrared in a room is constrained by the walls resulting in a square shape which illustrated
by the area that contains 'Z'[3].
3. Observing automatic ID systems
In this method if the reader interrogates the tag, or monitors the transaction which has
a known location, the location of the mobile object can be inferred. This technique uses
automatic identi�cation systems such as credit card point-of-sale terminals, electronic card
lock logs, landline telephone records, and identi�cation tags such as electronic highway E-Toll
systems[93].
2.5.2 Proximity detection with proximity sensors
Any sensor that can detect the presence of an object without any physical contact, can be
called a proximity sensor. Depending on the application, proximity sensors work on di�erent
bases. For example, a capacitive photoelectric sensor can be used for plastic targets, for

Background and Prior Art 28
metal objects inductive proximity sensors are more useful. Below are some types of proximity
sensors that are already in the market:
• Capacitive
• Passive optical (such as charge-coupled devices)
• Passive thermal infrared
• Photocell (re�ective)
• Ultrasonic sensor (sonar which runs in air)
• Inductive
• Laser range�nder
• Doppler e�ect (sensor based on e�ect)
• Eddy-current
• Magnetic, including Magnetic proximity fuse
• Capacitive displacement sensor
• Radar
• Re�ection of ionising radiation
• Sonar (typically active or passive)
Generally, we can de�ne two variables for all proximity sensors: proximity range and
separation range. Proximity range is the nominal range that a sensor will report the presence
of object. Separation range is the nominal distance that a sensor can report the absence of
an object which was in vicinity. In some cases these two ranges are almost the same. But it
might be di�erent too. Figure 2.9 illustrates a sensor model. Re is the area that chance of
detection decreases with the distance from the reader.

Background and Prior Art 29
Figure 2.9: Proximity sensor model [4]
As previously stated, proximity sensors do not require any physical contact, so they
usually have a high reliability and long life, since mechanical issues such as fraction do not
exist. International Electrotechnical Commission (IEC) 60947-5-2 [94] de�nes the technical
details of proximity sensors.
As referenced [4], researchers used binary proximity sensors for tracking the targets.
Sensors provide one bit of information regarding a target`s presence or absence in their
vicinity. In this system, a WSN with "n" known-location sensor nodes was considered.
Each node is actually one proximity sensor. Nodes records the detection duration and time.
A distance-based weighting scheme implemented in the algorithm is used for tracking the
object. We borrowed Figure 2.10 to explain the system's functionality better. As you can see
in the picture, each node has a circular read range, so the object can enter a sensor sensing
range from any point or angle. Each node records the time of presence in the vicinity. The
researchers assume that the target is at the boundary of the detecting range at the time of
detection. By considering the average speed based on previous detection by other sensors
they can estimate the angle of entry by calculating the distance d from the time of detection
and separation. Finally, using particle �ltering and some probabilistic equations, they try
to reduce the error in tracking.

Background and Prior Art 30
Figure 2.10: Target tracking model in [4]
Similar work was presented in [95]. The main di�erence in this work is that it includes
the binary information of whether the object is moving toward the sensor or away from it.
These researchers also developed a particle �ltering style algorithm for tracking the target
using proximity sensors. IR sensors in each node report the proximity in WSN. Range of
detection is justi�ed by choosing a threshold that satis�es the desired proximity range.
The "Active Badge" [90], is another example of proximity sensors used in indoor local-
ization. This project developed at Olivetti Research Laboratory, used infrared technology to
realize indoor localization. However, it did not solved the big problem with indoor proximity
sensors- the line-of-sight requirement and the short range of signal transmission.
2.5.3 Proximity detection with active tags
The speci�cation of active tags was discussed in section 3. Since there is an on-board radio
and battery in active tags, they have multiple times more read rage than passive tags. Also,
the tag can run di�erent algorithms. Because of all of these capabilities, active tags have
been considered a good solution for localization and proximity detection.
The "Active badge" system can be named as the �rst archetypal indoor active localization
system[90]. It consists of a cellular proximity system that uses di�use infrared technology.
Figure 2.11 is a sample badge that people should wear and carry to be able to be localized.

Background and Prior Art 31
The badge emits a globally unique identi�er every 10 seconds or on demand. A central
server collects this data from �xed infrared sensors around the building, aggregates it, and
provides an application programming interface for using the data. The biggest problem with
the Active Badges system was its sensitivity to �uorescent lighting or direct sunlight causing
problems with infrared connectivity.
Figure 2.11: Olivetti Active Badge (right) and a base station (left) used in the system's
infrastructure [3]
LANDMARC system [58] is an indoor localization system based on proximity detection.
We described the functionality of this system in section 2.4.3. This system considers active
tags as reference points for localization. LANDMARC uses the notion of reference tags
(whose locations are known before) and track the tag's nearness to reference tags by the
similarity of their signal received at multiple readers in the environment.
EnHANTS project is based on UWB communication and focuses mainly on energy har-
vesting [96]. Proximity detection can be explored since the communication range between
the devices is relatively small. The communication between wireless units is not based on
backscattering and therefore it is more power-consuming than passive RFID.
Another popular proximity detection application is for monitoring daily activities of
people. The solution in [97] describes miniature HF RFID reader that can be attached to
the wrist or as a glove and be used to detect tagged objects that have been touched.
OpenBeacon [86] is the most well-known active tag based system for proximity detection.
This project founded in 2006 by the Bitmanufaktur company is an open platform for active

Background and Prior Art 32
RFID applications.
Researchers at [5] used OpenBeacon active tags to design a person-to-person interaction
detector system. They attached an active tag to each participant at a conference. By
gathering information about individual's interactions, they were able to identify the patterns
of interaction. Some sample models are shown in Figure 2.12. Each tag has a unique ID and
identi�es one person. In addition, times for each interaction were saved in the host computer.
Using the model and stored information, they were able to estimate people's interaction with
each other with reasonable accuracy.
Figure 2.12: Target tracking model in [5]
2.5.4 Localization, proximity detection and tracking with passive
RFID
RFID can meet IoT requirements in many ways. Passive UHF RFIDs do not have batteries
and therefore the BOM of passive UHF RFID systems is low. The functionality of passive
UHF RFID tags has grown a lot. It opens an opportunity to make RFID suitable for a
remote two-way communication by modifying RFID readers. In [98] researchers are showing
how communication can be done via mobile IPv6 and how passive RFID can be part of that.
They modi�ed the RFID readers and low cost tags to be able to communicate two-way end-
to-end remotely. Nokia introduced a concept of new radio frequency identi�cation system
based on Master-Slave RFID reader architecture. The proposed system will reduce the power
consumption and decrease the processing time because of its ability to �lter information in
the system. They introduced this system suitable for smart homes to do special jobs such as
washing, cooking, shopping, etc [99]. The system consists of some master readers, a number

Background and Prior Art 33
of slave readers and some mobile RFID readers which can all communicate with each other
and transfer UHF tag information through the internet. They also counted localization and
proximity detection as one of the capabilities of the system.
Researchers in university of Washington deployed a big RFID-based network with hun-
dreds of antennas and thousands of tags in [100]. They presented the challenges with RFID
networks including: object's material, orientation of antennas, how the tag is mounted to
the object, input data error, unpredictable input streams and privacy challenges. They used
proximity detection to monitor people interaction in their network. Their system is based on
detecting a tag in the coverage area of special antennas. Then based on received EPCs from
tags, they process all the information and estimate the possible location and track people in
the indoor area.
There are some other solutions for passive systems. But they are integrated with another
technology like camera or ultrasound [83][80] or are not accurate enough [79]. Another
problem with current passive localization systems is their need of using multiple reader and
antennas which increase the cost of the system. For example in [81] neural networks have
been used to train the system based on previously collected RSSI values. Even though the
area of operation is small (2mx3m), the localization error is about 60 cm on average. In our
method, the average error is less than 30 cm depending on the number of deployed landmark
tags.
In [101][102], an RFID-enabled IoT solution was presented. It is based on UHF RFID
readers placed in a building and passive UHF RFID tags attached to people and objects
of interest. The system was extended with a number of software applications that allowed
searching for things, integration with social applications, tracking personal trends and so on.
The work presented in [103] describes tags that are able to power themselves and com-
municate based on the ambient RF. These tags communicate using backscattering and are
able to detect proximity of one another up to 2.5 ft distance outdoors. The solution is not
based on UHF RFID and does not support UHF RFID passive tags covered in this paper.
The range estimation performance from the RSS is known not to be reliable especially
when the system operates in a complex propagation environment. In addition, as pointed
out in [79], the tag backscatter loss varies with the power incident on the tag because input
impedance of RFID tag IC is power dependent. RSS is also angle dependent. Therefore,
di�erent techniques such as fusing tag detection rate with the RSS values or using neural
networks to train the system based on previously collected RSS values [81] are used to
improve the localization accuracy of RSSI based systems.
Landmark-based techniques are mainly based on comparing the RSS values of the tags

Background and Prior Art 34
placed at known locations with the RSS of the tag that needs to be located. Due to the
problems with RSS mentioned in previous paragraph, calibration of the system based on
landmark tags is di�cult.
Phase-based techniques can be used to improve the accuracy of RSS based techniques
for RFID readers that provide phase information (that are not common yet). The solution
in [79] describes an experiment using time di�erence phase-di�erence of arrival that shows
that it is feasible to detect ingress/egress direction of the tag movement and the point when
the tag crosses the center. Single frequency narrow-band holographic method to localize
passive UHF RFID tags is presented in [82] where the localization is based on phase values
sampled from a synthetic aperture by a RFID reader antenna that is moved along a known
trajectory. Simulation results show the error of 50 cm can be achieved. It has been shown
that the performance of PDOA and RSS techniques in NLOS environment drops up to three
times.
Techniques where passive RFID systems are enhanced with other technologies such as
ultrasound or cameras outperform RFID-only techniques regarding localization accuracy.
Wireless Identi�cation and Sensing Platform (WISP) tags are extended with LEDs that
allows optical locating tagged items with millimeter accuracy [83]. The system consists of
a WISP tag with acoustic tone-detector that receives and times ultrasound signals, UHF
RFID reader, and an array of ultrasonic beacons.
Sherlock [104] uses both a camera and steerable antenna to localize the items. In the
RFID endpoint, an RFID antenna is attached to a stepper motor and rotates and changes
the power transmission continuously. It scans and processes the number of reads per each
angle and power and �nally processes the data using a special algorithm. In their scenario,
the most recent time the object was detected, the id(s) of the antenna that detected it will
be reported, and the location of the tag will be estimated. In the camera endpoint, Sherlock
scans the area. If a new object enters the zone and gets detected by the RFID antenna, the
camera will synchronize itself with the corresponding antenna angle that detected the item
for the �rst time. Then that picture is stored in the database. By this way when somebody
is searching for an object, it will search in the database and move the camera to the stored
position in the database.
There are several solutions that have been introduced to augment existing UHF RFID
systems in which proximity detection is larger than 50 cm. They are: the ST-based system
[105] presented in this thesis, the Gen2 listener [101] and Augmented RFID receiver (ARR)
[106], and the Tag-to-Tag communication system [13]. Table 2.4 compare these solutions for
proximity detection and localization with some others that described before. These systems
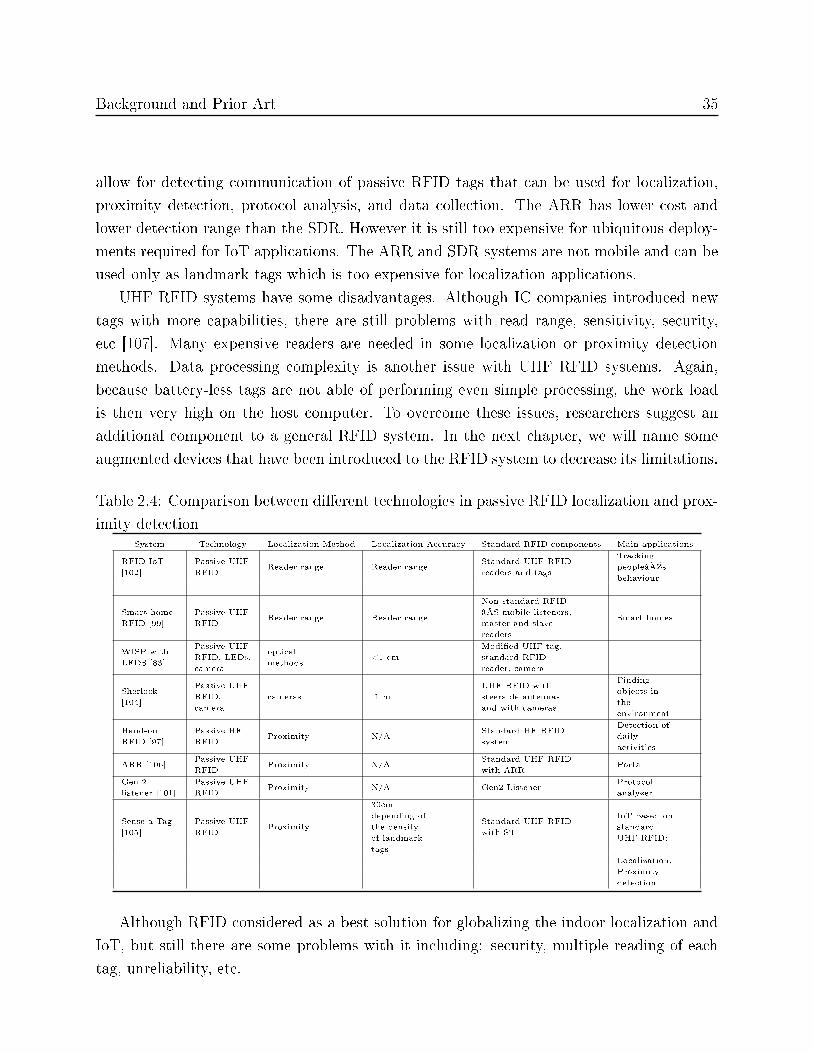
Background and Prior Art 35
allow for detecting communication of passive RFID tags that can be used for localization,
proximity detection, protocol analysis, and data collection. The ARR has lower cost and
lower detection range than the SDR. However it is still too expensive for ubiquitous deploy-
ments required for IoT applications. The ARR and SDR systems are not mobile and can be
used only as landmark tags which is too expensive for localization applications.
UHF RFID systems have some disadvantages. Although IC companies introduced new
tags with more capabilities, there are still problems with read range, sensitivity, security,
etc [107]. Many expensive readers are needed in some localization or proximity detection
methods. Data processing complexity is another issue with UHF RFID systems. Again,
because battery-less tags are not able of performing even simple processing, the work load
is then very high on the host computer. To overcome these issues, researchers suggest an
additional component to a general RFID system. In the next chapter, we will name some
augmented devices that have been introduced to the RFID system to decrease its limitations.
Table 2.4: Comparison between di�erent technologies in passive RFID localization and prox-
imity detectionSystem Technology Localization Method Localization Accuracy Standard RFID components Main applications
RFID IoT[102]
Passive UHFRFID
Reader range Reader rangeStandard UHF RFIDreaders and tags
Trackingpeople�sbehaviour
Smart-homeRFID [99]
Passive UHFRFID
Reader range Reader range
Non standard RFID� mobile listeners,master and slavereaders
Smart homes
WISP withLEDS [83]
Passive UHFRFID, LEDs,camera
opticalmethods
<1 cmModi�ed UHF tag,standard RFIDreader, camera
Sherlock[104]
Passive UHFRFID,camera
cameras 1 mUHF RFID withsteerable antennasand with cameras
Findingobjects intheenvironment
Hand-onRFID [97]
Passive HFRFID
Proximity N/AStandard HF RFIDsystem
Detection ofdailyactivities
ARR [106]Passive UHFRFID
Proximity N/AStandard UHF RFIDwith ARR
Portal
Gen 2listener [101]
Passive UHFRFID
Proximity N/A Gen2 ListenerProtocolanalyzer
Sense-a-Tag[105]
Passive UHFRFID
Proximity
30cmdepending ofthe densityof landmarktags
Standard UHF RFIDwith ST
IoT based onstandardUHF RFID:
Localization,Proximitydetection
Although RFID considered as a best solution for globalizing the indoor localization and
IoT, but still there are some problems with it including: security, multiple reading of each
tag, unreliability, etc.
Chapter 3
Description of Sense-a-Tag
3.1 Overview
This chapter presents the description of Sense-a-tag (ST) and shows how this new de-
vice(hardware) augments regular RFID systems. We describe the capabilities of ST and
show how it can help develop the Internet-of-Things. Finally we compare it with similar
devices that have been introduced by other researchers.
3.2 ST and similar UHF RFID solutions for proximity
detection
The research in [105], [108] and [109] introduced a novel RFID system which contains, in
addition to tags and readers, a component called "Sense-a-Tag" (ST). A ST has several
distinctive features. It can passively detect and decode backscatter signals from RFID tags
in its proximity, perform basic processing and communicate the acquired information to an
RFID reader by backscattering, using standard RFID protocols.
STs are deployed throughout the space of interest or placed on objects or people. They
may be equipped with sensors whose measurements can be conveyed to an RFID reader
by backscattering. A ST can listen to the communication between other tags and readers
if it is physically near the tags. If the locations of the STs are known, an RFID system
with a network of STs has an exceptional advantage over traditional systems for �ne grain
localization, real time tracking and monitoring.
There are several solutions that have been introduced to augment the existing RFID
36

Description of Sense-a-Tag 37
systems. They are: the ST-based system presented in this chapter, the Gen2 listener [101],
Augmented RFID receiver (ARR) [12], and the Tag-to-Tag communication system [13].
These three systems all allow for detecting communication of passive RFID tags that can be
used for localization, proximity detection, protocol analysis, and data collection. Figure 3.1
shows the overall concept of all mentioned systems. The light in this picture can be a good
representation of the reader. Without the light, nobody can see each other. But when the
reader start to communicate with one of the men in the coverage area, they can also see each
other. The girl cannot be seen by none of them until entering to the coverage area of the
reader. Bellow, we brie�y describe each of solutions. Later, we compare these three systems
and the ST based RFID system.
Figure 3.1: Overall concept for RFID augmented devices
Augmented RFID Receiver (ARR)
Augmented RFID Receiver (ARR): A receiver that can sense UHF RFID tags around it
is developed in [12]. The ARR uses a method called synchronous detection to overcome
the frequency o�set challenges associated with intercepting tag signals using a non-
envelope detection scheme. This system captures the data by an o�-the-shelf UHF

Description of Sense-a-Tag 38
RFID reader IC and then sends and processes the data using an FPGA hardware and
a soft-core processor. The ARR has high power consumption and it communicates with
the host through Ethernet, and as such it cannot be used for portable applications. The
ARR is a high performance high cost component that can provide fast communication
to the host and can be used as a landmark tag or a protocol sni�er.
Software De�ned Radio (SDR)
Software De�ned Radio (SDR): In [101], researchers introduced an RFID device that
acts as a UHF reader without downlink (reader-to-tag) transmission. The device is
called "Listener" because of its ability to receive and decode the radio signal from
both tag and reader. The Listener was implemented fully in C++ and Python and
can be run on a Linux PC. The code is based on GNURadio and is released with GPL
license. As the ARR, the SDR requires high power consumption and has no mobility.
Furthermore, the very high cost of the SDR makes it an unsuitable device for the IoT.
Tag-to-Tag Communication System (T2T CS)
Tag-to-Tag Communication System (T2T CS): Researchers at Intermec Technologies
Corporation introduced a passive RFID system called a reader tag, which is based on
a low power microcontroller [13]. In this system, the tags establish communication in
the presence of an RFID reader. The reader tag communicates with standard UHF
passive RFID tags by backscattering the RF wave from the reader. The limitation of
this system is that the antenna of the listener and reader tags must be coupled and
the maximum read range is only several centimeters.
In the table 3.1 we compare the ST with the three other UHF RFID systems that can
detect the proximity of passive tags. The Gen2 Listener o�ers the best performance in
detecting passive tags, but it has the limitation of high cost of the devices. ARR has a
lower cost and lower detection range, however it is still too expensive for the ubiquitous
deployments required for the IoT applications. ARR and SDR systems are not mobile and
can be used only as landmark tags. The T2T CS system has a too low detection range to
be of practical use in the proximity detection or localization.
3.3 Functionality of the ST
None of these three similar systems provide cost-e�ective support for localization of passive
tags or a way of detecting proximity of other tags. ST introduces an RFID system that can

Description of Sense-a-Tag 39
Table 3.1: Comparison of UHF RFID solutions for proximity detection
Criteria Devices
Sense-a-tag ARR SDR T2T CS
Detection range
of passive tags1 m 3 m 10 m 2.5 cm
Near/far �eld Far-�eld Far-�eld Far-�eld Near-�eld
Cost 25$ 115$ 750$ 15$
Power
consumptionMedium High High Low
Applications IoT Analyzer Analyzer
Very close
proximity
detection
Tracking LocalizationData
collector
Localization Data collector
Social-
interaction
Data collector
Proximity-
detection

Description of Sense-a-Tag 40
perform these tasks and others cost e�ectively. The ST-based UHF system is composed of
standard tags, readers, and the novel ST component. The ST has properties that are useful
for the IoT. They are as follows:
• It is able to decode backscattered communication from nearby tags and to communicate
with the reader as a regular tag. In other words, the ST is an IoT tag that can hear the
communication link between EPC-Global Class 1 Generation 2 [1] UHF RFID readers
and tags.
• It is able to store the ID numbers of the detected tags, which can be used to establish
association between the STs and the tags. Based on this information, the system is
able to infer the locations of the tags or detect the proximities among the tags and the
STs.
• It is able to communicate with a reader by backscattered communication. This means
that its communication can also be detected by other STs, thereby allowing communi-
cation among multiple STs.
• It can be programmed to be situation sensitive and to detect and sense only particular
tags. The ST communication is based on RFID interface and does not require any
other network infrastructure besides RFID readers. This property, together with its
low cost and relatively low power usage, makes the ST a more suitable device for the
IoT than solutions based on ARR and SDR.
3.4 System level design
In this section, we provide technical details about the ST. We also describe how the host and
the STs work together to detect proximities. The ST is a semipassive EPC Gen 2 compliant
device that operates in the range of 902-928 MHz. It uses a battery to power the digital and
analog electronics. Speci�c components used in building the ST include:
• Antenna: LAIRD Tech- Omni directional antenna, 3dBi gain, model CAF95956.
• FPGA: Xilinx Spartan 3AN.
• Battery: Alkaline 9 volts 2100mAh battery.

Description of Sense-a-Tag 41
The detection range of passive tags of the ST is 1-2 m. It has been extensively tested
with the IMPINJ Speedway R1000 reader and with di�erent commercial tags using Gen2
chips from Philips, EM microelectronics, Impinj, and Toshiba. A block diagram of the ST
hardware is shown in Figure 3.2.
Figure 3.2: Block diagram of the ST
Details of the hardware components of the ST prototype are presented in [105]. The RF
front-end of the device is a combination of a passive envelope detector that uses a Schottky
diode and corresponding matching circuit. Unlike conventional RFID tags, the STs must be
able to sense and decode the backscatter from tags in their vicinity in addition to sensing
and decoding reader commands. When a tag in the vicinity of a ST backscatters, the ST
receives a superposition of two signals: The weak backscatter from the tag and the much
stronger continuous wave from the reader. In terms of the baseband signal, this superposition
e�ectively adds a DC o�set to the backscatter signal. The Schottky diode detector detects
this signal and feeds it to the analog section for �ltering and digitization. The amplitude,
frequency and pulse width of the signal from the reader are signi�cantly di�erent than those
of the tag backscatter. As a result, the analog section of the ST must have variable �ltering
and threshold generation circuits in order to reliably digitize the reader signals and the
tag backscatter. The output of the decoder is the input to a data processing element which
implements the ST protocol. A Xilinx Spartan 3AN FPGA is employed as a processing engine

Description of Sense-a-Tag 42
in the digital section of the ST. This platform has been chosen for its rapid prototyping and
its ability in parallel processing of the reader and tag signals. The storage unit keeps the IDs
of the acquired tags and possibly data from sensors connected to the ST (e.g., temperature
or humidity). The blocks that are presented by dotted lines have not been implemented in
the current ST version. They include sensors as well as additional interface blocks such as,
for example, ZigBee. These blocks would allow the ST to become an interface between the
RFID system and standard wireless sensor networks [110].
Figure 3.3: The main operational steps of an ST
Next, we describe how the host and the ST work together so that proximity detection
can be accomplished. Figure 3.3 shows the main operational steps of the ST. A ST acts as
a tag, which means that it can respond to all the commands from a reader in the same way
as regular tags. However, it has an important additional functionality: it can listen to the
backscattered response from the tags and can discriminate if the reader reads a tag or not.
As shown in Figure 3.3, the ST listens to particular commands of the reader for addressing
tags (the Select and Query commands as de�ned in [1]). If the ST detects the command from
the reader, the tag's response, and the reader's acknowledgment, then the ST has detected
the tag. The information about the detected tag is stored in the ST's storing unit. When
the reader singulates the ST, the ST transfers the information about the detected tag(s) to
the reader.
Figure 3.4 presents the main operations of the host. In order to incorporate STs into
existing RFID systems, the readers have to treat the STs as tags. Since the readers are
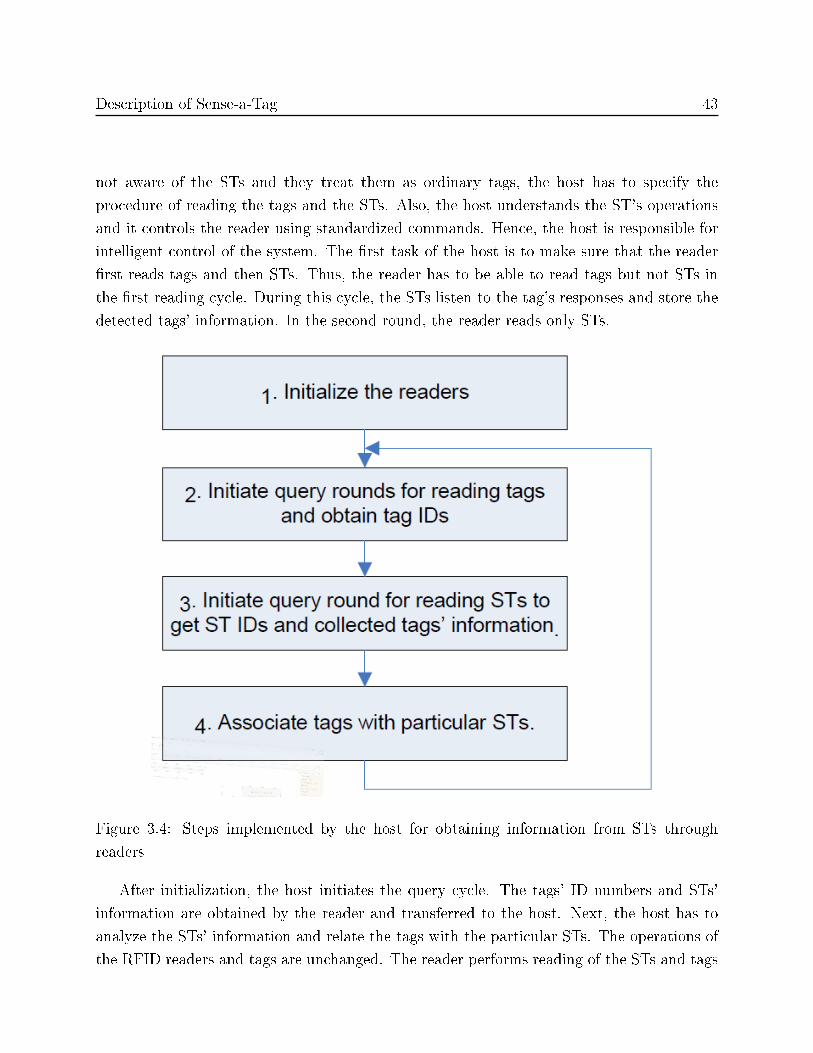
Description of Sense-a-Tag 43
not aware of the STs and they treat them as ordinary tags, the host has to specify the
procedure of reading the tags and the STs. Also, the host understands the ST's operations
and it controls the reader using standardized commands. Hence, the host is responsible for
intelligent control of the system. The �rst task of the host is to make sure that the reader
�rst reads tags and then STs. Thus, the reader has to be able to read tags but not STs in
the �rst reading cycle. During this cycle, the STs listen to the tag's responses and store the
detected tags' information. In the second round, the reader reads only STs.
Figure 3.4: Steps implemented by the host for obtaining information from STs through
readers
After initialization, the host initiates the query cycle. The tags' ID numbers and STs'
information are obtained by the reader and transferred to the host. Next, the host has to
analyze the STs' information and relate the tags with the particular STs. The operations of
the RFID readers and tags are unchanged. The reader performs reading of the STs and tags

Description of Sense-a-Tag 44
based on the command obtained from the host, and it reports to the host all the information
that is read.
3.5 Use scenarios
Potential use settings are classi�ed based on the roles of the ST and the tags. We consider
two possible placements of both tags and STs: 1) Fixed placement where the tags and/or
STs are used as infrastructure components (IC), and they are placed at known locations,
and 2) Movable placement attached to objects and/or people (OP).
In Table 3.2 below, we de�ne potential applications of systems with STs based on the
placement of tags and STs.
Table 3.2: Potential application of STs based on di�erent placement of tags and STs
ST Tag Potential application
IC IC Data �lter
IC OP
-Localization of tags using �xed STs,
-Portal application for preventing
cross reading of tags,
-Data �lter
OP IC-Localization of STs using �xed tags
-Proximity detection among STs
OP OP-Proximity detection among STs and
tags
Next, we brie�y explain how the STs can be used for these applications.
3.5.1 Localization
To support localization, the STs can be used as infrastructure components (landmark tags)
placed at known �xed locations. The tags are attached to object or people that need to be
located. The location and tracking of the object or people is obtained from the information
collected by the STs. Depending on the application, we can exchange the roles of the tags and
STs, i.e., use the STs on mobile objects and the tags as landmark tags [105]. The software
will decode the information from the STs and determine if the object is in proximity to
Description of Sense-a-Tag 45
speci�c landmark tags. It is clear that increasing the number of landmark tags will result in
more accurate localization. When the processing for localization of the collected information
from a moving object is carried out sequentially in time, the system can perform tracking
and estimate direction of movement of objects or people [109]. At a given time, the location
of the desired object or person can be determined. At a subsequent time, a new set of data
locates the object or person again, and so on. From the sequence of estimated locations, the
system detects if there is movement and determines the direction and speed of movement.
3.5.2 Data �ltering
RFID systems produce a large amount of data to be processed. Therefore, this data needs
to be �ltered. It can be �ltered at several levels:
1. Air protocol level, where the reader sends a command (Select command in EPC Gen
2 standard) that causes only tags of interest to respond and send their IDs.
2. Reader level where the reader processes the tags' IDs and removes redundant and
static information.
3. Middleware level, removing static information from the list of read tags sent by the
reader.
The STs can act as an additional �lter. Besides selecting only tags of interest, the sys-
tem with ST will allow for selecting particular tags at particular places or selecting speci�c
events of interest (interactions, for example). In addition, in current RFID systems, static
information means that the tag is being repeatedly read by the same reader antenna. How-
ever, the tag can move inside the reading zone of the RFID reader and this move will still
be considered static information. With STs, the granularity of tag detection is signi�cantly
re�ned, which improves the process of data �ltering.
3.5.3 Unwanted reads
There are two main problems in using RFID for portal applications: (1) the read-accuracy
and (2) cross-reading of tags. The read accuracy is the percentage of tags moving through the
portal that are correctly read and identi�ed by the portal reader. Cross-reading represents
unwanted reads of tags that do not go through the portal. With the RFID passive tag,
the read-accuracy depends on the amount of power the reader is able to deliver to passive
tags. In order to improve the read accuracy, the power at the output of the reader antenna
is increased, which then results in an increased number of cross-readings. So, high read
accuracy and zero cross-reads are con�icting requirements.

Description of Sense-a-Tag 46
By using STs, it would be possible to transmit signals from the reader antenna at full
power. By properly positioning and shielding the STs, only those tags in the portal areas
would be identi�ed. Even if the tags are read by the readers outside of the portal area, they
will not be sensed by the STs and therefore will not be registered by the system.
3.5.4 Proximity detection
The main di�erence between proximity detection and localization is that localization is based
on having infrastructure components (either tags or STs) at known locations. For proximity
detection, the location of the STs (or tags) is not known in advance and is irrelevant. There
are many applications where it is important to detect interactions of objects or to detect
proximity between objects without knowing exactly where the objects are.
Table 3.3: Proximity detection applications based on whether the STs and tags are placed
on objects or people
ST Tag Potential applications
Object Object
-Interaction among objects:
-IoT applications
-Detection if the object is moved from a
particular place
Object People
Interaction between people and objects in
situations where the objects are expensive
or their number is small so that they are
tagged with STs.
People Object
-Interaction between people and objects:
-IoT applications
-Tracking daily activity of people.
-Tracking interaction with sensitive objects
such as blood samples, dangerous chemicals,
or explosive devices
People People
-Interaction among people:
-IoT applications
-Tracking interactions at social events
Potential applications are presented in Table 3.3. One promising application of advanced

Description of Sense-a-Tag 47
UHF RFID technology augmented by ST, attaches it to a person with cognitive di�culties
to track their daily activities in order to keep them safe. In [111], tags are attached to objects
of interest and short-range readers are attached to people's hands. This system does not
satisfy a basic requirement of the application because it interferes with the person's daily
activities. They would have to wear heavy bulky readers on both of their hands. Our new
ST-based solution would only require wearing one small ST wristband. The long range RFID
reader could be �xed and placed to cover the area of interest without interfering with the
individuals activities.

Chapter 4
ST-Based RFID system
4.1 Overview
This chapter proposes a solution to the existing problems that described in previous chapters
in the form of ST-based RFID system. In this system, the regular RFID system doesn't need
to be changed or modi�ed in both hardware and software point of view. The only change
is that a new device called the ST is adding to this system and complements the regular
reader-tag RFID system. The ST receives both reader's and tag's signal and report the
existence of tags in the vicinity to the reader using RFID interface, Figure 4.1. First, we
start with how this system can mitigate the problems. Next, we introduce some applications
that ST can be a solution for that in real world and its limitation.
4.2 Mitigating RFID problems
4.2.1 Inexpensive tags, costly readers
RFID tags are very cheap, but are not capable of doing heavy processing. In reverse, readers
can run heavy processing algorithms, but are very expensive in cost. So it is challenging
how we can implement an RFID system with the best trade-o� between cost and capability.
By adding ST to the regular RFID system, the performance of the system will be improved.
However, the cost of the system will not increase so much. STs can perform some of reader's
tasks. In fact, instead of adding one reader, depending on the application, we can add 20
STs to the system.
48
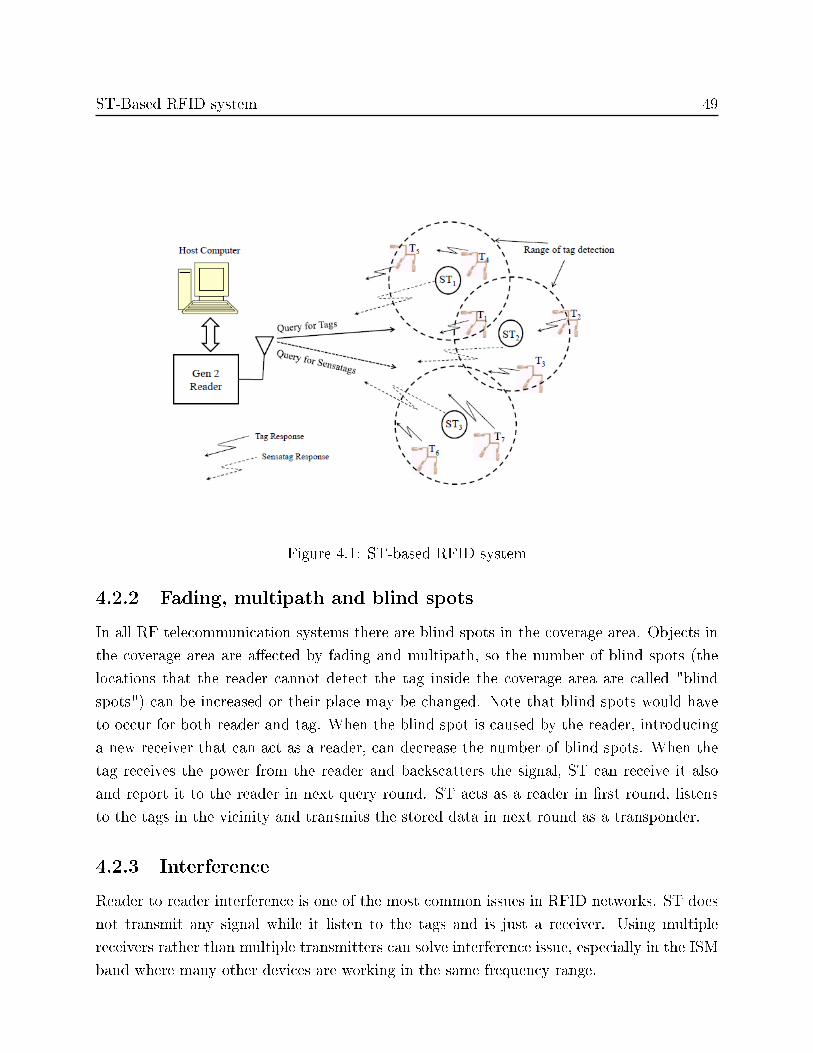
ST-Based RFID system 49
Figure 4.1: ST-based RFID system
4.2.2 Fading, multipath and blind spots
In all RF telecommunication systems there are blind spots in the coverage area. Objects in
the coverage area are a�ected by fading and multipath, so the number of blind spots (the
locations that the reader cannot detect the tag inside the coverage area are called "blind
spots") can be increased or their place may be changed. Note that blind spots would have
to occur for both reader and tag. When the blind spot is caused by the reader, introducing
a new receiver that can act as a reader, can decrease the number of blind spots. When the
tag receives the power from the reader and backscatters the signal, ST can receive it also
and report it to the reader in next query round. ST acts as a reader in �rst round, listens
to the tags in the vicinity and transmits the stored data in next round as a transponder.
4.2.3 Interference
Reader to reader interference is one of the most common issues in RFID networks. ST does
not transmit any signal while it listen to the tags and is just a receiver. Using multiple
receivers rather than multiple transmitters can solve interference issue, especially in the ISM
band where many other devices are working in the same frequency range.

ST-Based RFID system 50
4.2.4 Data processing
As mentioned in the last chapter, RFID tags respond to the reader anytime that reader
interrogates the zone. Using LLRP, it is possible to put a mask when it is going to send the
query. But it is not applicable solution all the time. For example, if we want to use RFID as
a system for localization, we need to interrogate the whole zone and read all the tags. Lets
estimate that each tag will be read 15 times/second on average and thousands of tags are in
the area. Huge CPU and memory resources are required to process this much data and run
the algorithms. ST as an interface between the tag and reader, can just report the valuable
information that we need. In this case, the host computer does not need to do the �ltering.
Just processing the ST's EPC will be enough to localize the item.
4.3 Proximity detection, localization and IoT applica-
tions with ST
4.3.1 Overview
In this section we show how ST can help RFID applications with emphasis in proximity
detection and localization. Based on di�erent scenarios, we demonstrate the ST`s role in its
corresponding application. Roles of the ST and passive tags can be di�erent for di�erent
applications. The tags (or STs) can be used as infrastructure components (landmark tags)
placed at known locations and for detecting mobile STs (or tags). In another scenario, both
tags and STs can be mobile and the STs can be used to detect proximity among themselves
to the other tags. Next, we brie�y explain how the STs can be used for proximity detection
and reducing cross-reading. Localization is completely based on detecting proximity between
the ST and the stationary landmark tags as described in [105].
Potential use settings of ST tags are classi�ed based on the roles of the ST tags and the
tags. We consider two possible placements of both tags and ST tags:
1. Fixed placement where the tags and/or ST tags are used as beacon tags (BT), and
they are placed at known locations, and
2. Attached to objects and/or people (OP).
Table 3.2 provides potential applications. In this section we focus on how the STs can be
used for proximity and localization.

ST-Based RFID system 51
4.3.2 ST as landmark tag
In support to localization, the ST tags can be used as beacon or landmark tags placed at
known �xed locations. The tags are attached to objects or people that need to be located.
The location and tracking of the object or people is obtained from the information collected
by the ST tags. This organization is shown in Figure 4.2. ST-Es in the picture are STs that
have been considered as landmarks and ST-R is a representation of a mobile object attached
with ST. All the ST-E tags will send the gathered information through RFID interface. The
ST-E tags can detect tags and other ST tags in their proximity and report detected result
to the host. This use scenario is suitable for the applications where the number of objects
to be tracked is large and therefore it is feasible to tag them using passive tags. Finding lost
items and searching for objects are two potential IoT applications in this scenario.
4.3.3 ST as mobile tag
Depending on the application, we can exchange the roles of the tags and ST tags, i.e., we can
use the ST tags on mobile objects and the tags as beacon tags. The software will decode the
information from the ST tags and determine if the object is in proximity of speci�c landmark
tags. This is presented in Figure 4.3. It is clear that increasing the number of beacon tags
results in more accurate localization.
The ST tags can be, for example, attached to the wrists of workers. The ST tag is mobile
and communicates with the reader using backscattered communication and therefore the ST
tags are of ST-R type in this con�guration. The beacon tags are labeled as BT and they are
placed at �xed locations in each aisle. In practice, more beacon tags are needed for reliable
localization than ST-E tags in Figure 4.2. Passive tags (T) can be used for example to label
boxes that are on the shelves. In Figure 4.3, the ST-R tag on the left side can sense one tag
and one BT. Based on the position of the BT and the response received from the ST-R tag,
it is possible to determine the position of the ST-R tag. When the position of the ST-R tag
is known and the ST-R tag detected a tag nearby, it is possible to estimate the position of
that tag as well. We call this indirect localization. Besides localizing nearby tags, it is also
possible to infer which objects are nearby. This use scenario is suitable for the following IoT
applications:
• Localizing people and/or objects that carry ST tags.
• Detecting proximity between detected objects and possibly inferring their interactions
or relationships.

ST-Based RFID system 52
Figure 4.2: Localization of the tags T and ST-R with ST-E tags placed at known �xed
locations. There are two readers, labeled R1 and R2. The dotted circles around each ST-E
tag represent their detection range.
The advantages of the use scenario presented in Figure 4.3 in comparison with the scenario
presented in Figure 4.2 are:
• The infrastructure hardware is much less expensive because beacon tags are inexpensive
passive tags.
• The maintenance required would be much less because of the smaller number of ST
tags than that in the �xed infrastructure scenario of Figure 4.2.
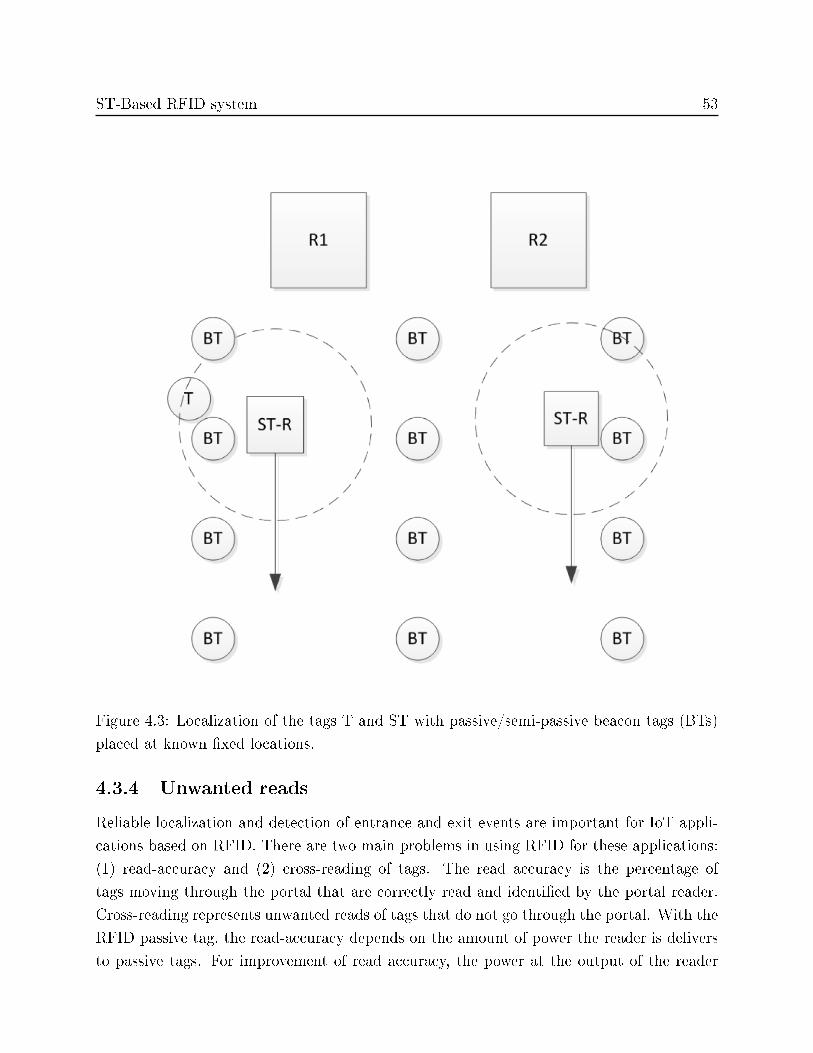
ST-Based RFID system 53
Figure 4.3: Localization of the tags T and ST with passive/semi-passive beacon tags (BTs)
placed at known �xed locations.
4.3.4 Unwanted reads
Reliable localization and detection of entrance and exit events are important for IoT appli-
cations based on RFID. There are two main problems in using RFID for these applications:
(1) read-accuracy and (2) cross-reading of tags. The read accuracy is the percentage of
tags moving through the portal that are correctly read and identi�ed by the portal reader.
Cross-reading represents unwanted reads of tags that do not go through the portal. With the
RFID passive tag, the read-accuracy depends on the amount of power the reader is delivers
to passive tags. For improvement of read accuracy, the power at the output of the reader
ST-Based RFID system 54
antenna is increased, but then the number of cross-readings is increased. Clearly, high read
accuracy and zero cross-reads are two con�icting requirements. By using STs, it is possible
to transmit signals from the reader antenna at full power. The STs are deployed to sense tags
only in the portal area by properly positioning and shielding the STs. When tags outside
the portal area are read by the readers, they will not be sensed by the STs and therefore will
not be registered by the system.
4.4 ST-based system vs other solutions
There are di�erent solutions that can localize passive UHF RFID tags. Some of them use
only the reader antenna and some use additional technology like infrared for more accurate
localization. In this section we discuss about how ST-based system can improve localization
accuracy, resolution, speed, cost and etc.
Our experience with RSSI based techniques for localization is that it is very unreliable
when the RFID system operates in a complex propagation environment [112]. Shadowing,
re�ection and scattering are problems not only for signal strength-based techniques but also
for phase and time of arrivals based techniques. We will present the Cramer-Rao lower bound
[113] for the range estimate using RSS based technique that provides minimum achievable
mean square error of a set of parameters. For the range estimation dest, the CRLB due to
shadowing e�ect is presented in equation 4.1 [112]:
RMSE(dest) ≥Const ∗ σ ∗ d
n(4.1)
We see that the error increases with the distance d and with the standard deviation of
shadowing σ and decreases with the path loss exponent n. In our application, the threshold
for detection of the ST is �xed and based on the received signal strength from the reader.
However, the error is small because in most cases the ST and the tag are very close to
one another and there is no shadowing. Non-line-of-sight which is a problem for all other
methods is not a problem as long as the ST receives the signal from the tag that is above the
�xed threshold. So, non-line-of-sight will reduce the read range and detection range of the
ST but it will not a�ect the accuracy of the method if the ST detects the tag. The major
di�erence between the other methods and our method is that the other methods need to
estimate the phase or the signal strength based on di�erent mathematical models while our
method relies on simple associations when the ST detects a tag in its proximity.
In this thesis we only consider IoT based on o�-the-shelf passive UHF RFID systems.

ST-Based RFID system 55
Systems that use other technologies besides RFID are attractive but cannot be used in
localization of regular passive tags or detection of their proximity. There are di�erent systems
that use di�erent methods such as phased based techniques presented by Intermec [79] or
previously patented by Symbol Technologies [114]. But still there is some issues such as
phase-based methods are sensitive to phase distortion caused by multipath propagation.
There is two important points that should be considered in comparison for accuracy.
First, we need to take into account if the object is stationary or mobile. Second, the accurate
methods rely on the accuracy of another technology that has been used such as camera or
ultrasound.
The goal of this thesis was to use the existing passive UHF RFID components such as o�-
the-shelf readers and tags and then to enhance the existing passive UHF systems by adding
the new component: the ST. Addition of another technology such as ultrasound requires
modi�cations of commoditized components such as tags and therefore will have di�culties
being adopted by the industry. Current UHF RFID systems with stationary readers cannot
be used for proximity detection between tagged devices. These tags communicate only with
the readers and as such the system would need to rely on determining location of the tags by
the reader and therefore determining proximity. As pointed out, traditional RTLS techniques
are inaccurate and this scenario would fail. Another approach could rely on having mobile
readers that are carried by the users in a similar way as it is done in HF systems. These mobile
readers could then detect proximity of other tags. Inexpensive mobile readers that allow for
reading up to 1m are bulky, power consuming and still very expensive ($500 minimum).
Therefore, the solution that relies on the STs is simpler, more �exible and more reliable.
We will summarize the advantages in comparison with the other systems:
• UHF RFID systems: allow for proximity detection, allow for more precise localiza-
tion that depends less on fading conditions in the indoor environment.
• HF solutions: ST-based RFID system is a �exible and scalable solution that can be
used not only for tracking interaction between people and objects, but also between
people and to localize people and objects.
• Active RFID solutions: Even though our ST is still expensive and power consuming,
it will be implemented in next iteration to be less power consuming and expensive
than regular active tags used for RTLS. The only active solution that we are aware
of that supports proximity detection among tags is openbeacon. We are currently
experimenting with the openbeacon system and we are getting good results in detecting
ST-Based RFID system 56
proximity of people (this is what it has been intended for) but not in detecting objects
or localizing people and objects. However, after some modi�cations, this could also be
done.
• RFID systems enhanced with other technologies: These systems are not the
mainstream and require modi�cations of o�-the-shelf components. However, when line-
of-sight is available it is known that ultrasound techniques for RTLS are very accurate.
A comparison table with 14 references used in the paper is presented in Table 4.1. It
is important to note that ST-based RFID system does not only improve localization per-
formance of RFID systems but also enables other applications such as proximity detection
and portal application. N/A means that the systems are not used for localization. Indirect
localization means that the knowledge of the location of one object can help locating other
objects. ST advantages are listed in the last column. Advantages and limitations of ST have
been described before.

ST-Based RFID system 57Table
4.1:Comparisontable
betweenthedi�erentsolutionsforproximitydetectionand
localizationwithST.
System
Technology
Localization
Method
Accuracy
Std
RFID
components
Indirect
localization
Proximity
detection
Applications
ST
advantages
RFID
IoT
Passive
UHFRFID
Reader
range
Reader
range
Standard
UHFRFID
readersand
tags
No
No
Tracking
people's
behaviour
Allowingfor
proximity
detection.
Fine
grained
localization.
RSSIRFID
Passive
UHFRFID
RSSI
∼1m
Standard
UHFRFID
readersand
tags
No
No
Localization
Allowingfor
proximity
detection.
Fine
grained
localization.
Smart-home
RFID
Passive
UHFRFID
Reader
range
Reader
range
Nonstan-
dard
RFID
�mobile
listeners,
master
andslave
readers
No
Noamong
tags,slave
andmobile
readers
havelow
rangeand
canbe
usedfor
proximity
detection
Smart
homes
[6]isjust
aconceptual
solution
thatismore
complex
thanST-
basedRFID
system
Ambient
backscatter
Passive
technology
Ambient
power
har-
vestingand
backscatter-
ing
N/A�
however
itispos-
sibleto
implement
localization
basedon
proximity
Nonstan-
dard
N/A
2.5
ftproximity
communica-
tion
Power
harvesting
IoT
Relyingon
standard
RFID
components
Enhants
]UWB
Non-RFID
�power
harvesting
N/A
Nonstan-
dard
N/A
Yes
�in
therangeof
1m
to10m
Power
har-
vesting
IoT�
the
goalisto
continu-
ouslylocate
anddetect
proximity
Relyingon
standard
RFID
com-
ponents,
Localization
Holographic
Passive
UHFRFID
phase
<50cm
Standard
UHFreader
andtags
�reader
antenna
moves
at
known
trajectory
No
No
Localization
Allowingfor
proximity
detection.
Continued
onnextpage

ST-Based RFID system 58Table
4.1
�continuedfrom
previouspage
System
Technology
Localization
Method
Accuracy
Std
RFID
components
Indirect
localization
Proximity
detection
Applications
ST
advantages
Noneed
tomove
readers.
PDOA
Passive
UHFRFID
phase
<1m
Reader
that
provides
phase
No
No
Localization
Allowingfor
proximity
detection
andlimiting
therange.
WISPwith
LEDS
Passive
UHFRFID,
LEDs,
camera
optical
methods
<1cm
Modi�ed
UHFtag,
standard
RFID
reader,
camera
No
Nobetween
thetags.
Itcandetect
thattwo
tagsare
located
nextto
one
another
by
thecamera.
Much
simpler
system
basedon
standard
RFID
tags.
Sherlock
Passive
UHFRFID,
camera
cameras
∼1m
UHFRFID
withsteer-
ablean-
tennas
andwith
cameras
No
No
Finding
objects
inthe
environment
Much
sim-
plersystem
basedon
only
on
RFID
com-
ponents,
proximity
detection
Hand-on
RFID
PassiveHF
RFID
Proximity
N/A
Standard
HFRFID
system
N/A
Detecting
touchingof
objects
Detection
ofdaily
activities
STcan
beused
formuch
more
ap-
plications:
localiza-
tion,social
interactions
Openbeacon
Active
RFID
Proximity
andlo-
calization
basedon
landmark
∼2m
isreported.
Itcanbe
much
less
ifdenser
landmark
tagsare
used
Non-
standardized
activeRFID
Yes
Yes
<1m
detection
range
Social
interaction,
Activetags
are
more
expensive.
Forlocaliz.,
openbeacon
tagsneed
toreplace
batteries
ifusedas
landmark.
Locationof
people Continued
onnextpage

ST-Based RFID system 59Table
4.1
�continuedfrom
previouspage
System
Technology
Localization
Method
Accuracy
Std
RFID
components
Indirect
localization
Proximity
detection
Applications
ST
advantages
ARR
Passive
UHFRFID
Proximity
N/A
Standard
UHFRFID
withARR
N/A
Yes
∼3m
detection
range
Portal
STcan
beused
asboth
stationary
andmobile
tagwhile
ARRisonly
stationary
andit
ismore
complex.
Gen
2listener
Passive
UHFRFID
Proximity
N/A
Standard
UHFRFID
withGen2
Listener
N/A
Yes
∼12m
detection
range
Protocol
analyzer
Expensive
hardware
withGNU
radio.Sta-
tionary
compoe-
nent.
Sense-a-Tag
Passive
UHFRFID
Proximity
30cm
�depending
ofthe
density
of
landmark
tags
Standard
UHFRFID
withST
Yes
Yes
<0.6
mdetection
range
dependant
ofthe
distance
from
the
reader
IoTbased
onstandard
UHFRFID:
Localization,
Proximity
detection

ST-Based RFID system 60
The requirements for the IoT are mentioned before in Chapter 2. Bellow we review some
of the critical points in IoT applications, specially in tracking humans, identifying tagged
object carried by a humans and having tags passing through a portal. Then we explain how
ST can provide a better solution in comparison to its competitors.
• 1) Cost: Most of the localization systems are using multiple antennas and multiple
readers to localize the items. In UHF systems, the main cost of the system is on the
reader side. Current ST costs about $80 in non-industrial production. However, it will
be much less than that in mass production. Besides, lots of optimization need to be
done on the hardware part which can decrease the cost to 1/3 of current price such
as replacing the FPGA with a low power MCU. In large environments that adding
readers is required, ST based systems can decrease the cost e�ectively.
• 2) Speed: The speed is currently not high and depends on the implementation of
RFID system. In the current implementation, the ST listens and records selected tags
in 5 consecutive EPC Gen 2 query rounds. In the sixth round, only STs are selected by
the RFID reader and they report their results. The number of query rounds that can be
generated in a second is limited with our current reader that we use and theoretically
can be much better. Therefore the experiments that were performed in Section D are
done with the robot that is moving slowly. Again, this is the limitation of the current
implementation and the current technology that we use and will be improved in future.
• 3) Read range of ST is more than 5 meters by itself. The read range is small for
the semipassive tag and it will be signi�cantly improved in our next design. Detection
range (resolution) of the ST is in the range of 1-2m. This limited range allows the
system to decrease the error in localization and proximity detection applications.
• 4) Read rate is distance dependent. In that experiment it is clear that the ST is able
to detect the tag large number of times when the distance between the tag and the ST
is 5 m only when the distance between the tag and the ST is about 0.5 m. However,
it is still able to detect the tag less times at larger distances and in many applications
this should provide satisfactory results. At this moment the threshold for detection of
tags by ST is �xed to a particular power level detected by the tag. One of the future
research directions can be to make the threshold adaptive.
• 5) Localization performance: The performance will depend on the number of de-
ployed landmark tags. The limited range of the ST allows the system to decrease the

ST-Based RFID system 61
error in localization and proximity detection applications. Clearly, since RSS of pas-
sive tags are not reliable, we tried to use sensing the proximity of tags for localization
purposes. Some realistic experiments for localization and tracking will be discussed in
Chapter 6. Based on our experiments, the precision of localizing the moving object
was very high <40cm. In addition, the ST also detects and therefore localizes nearby
stationary tags.
• 6) Proximity detection: UHF RFID systems do not support proximity detection.
The works presented in the thesis that we call UHF RFID solutions for proximity
detection all require a new component that can detect the proximity. Other RFID
systems could be used such as HF or some active RFID systems (openbeacon). As
pointed out before, RTLS systems make large localization errors and as such are not
suitable for detecting proximity.
4.4.1 Limitations and disadvantages of the STs
The main disadvantage in comparison with some solutions in Table 4.1 is a need for landmark
tags for localization applications and the need to change batteries on mobile STs. However,
these landmark tags are passive UHF RFID tags which are inexpensive and maintenance-
free. Features that need to be improved in the current version of the ST are presented next.
The detection range between the ST and the tags depends on the orientation between the
ST and the tags. We can improve the detection range if we use dual-dipole passive tags, two
tags per object or a semipassive tag.
In order to preserve the same number of detections of the nearby tag by the ST, the
detection range of the ST decreases with the distance between the tag and the reader. In
case of localization with �xed reader antennas and �xed passive landmark tags this feature
can be corrected in software.
In addition, the ST listens to �ve readers query rounds and reports in sixth. Therefore, the
reporting speed of the ST is limited with the current implementation and the protocol used.
Since this was the �rst prototype of the ST its reading range (up to 5 m) and sensitivity are
quite low for the semipassive tag. These features can be improved in the next implementation
of the ST.

Chapter 5
System and Experimental Designs
5.1 Overview
This chapter explains the design details of the localization system and experimental area
including the reader, tag and ST characteristics. The goal of these experiment is to eval-
uate accuracy of the ST in realistic conditions. We will show how di�erent factors in the
environment can a�ect the accuracy of the results on the system based on ST.
The system was setup in Lab 5130 of the SITE building, located at the University of
Ottawa. This laboratory is approximately 10m*6m*3.55m meters.
A software developed in C# has been prepared to simulate and process the information
received from the reader.
The reader that is used for this experiments is Impinj R1000 reader [115] from Impinj
company. The power output has been set at maximum power, which is 32dBm. The antenna
cable has 2dBm loss, according to its datasheet. Thus, the output power at the antenna is
30dBm.
The UHF passive tags for the experiments have been chosen randomly between 200
similar commercial tags from GAORFID. The passive UHF tags have the Philips "MF1S70"
chip and a simple dipole antenna.
62
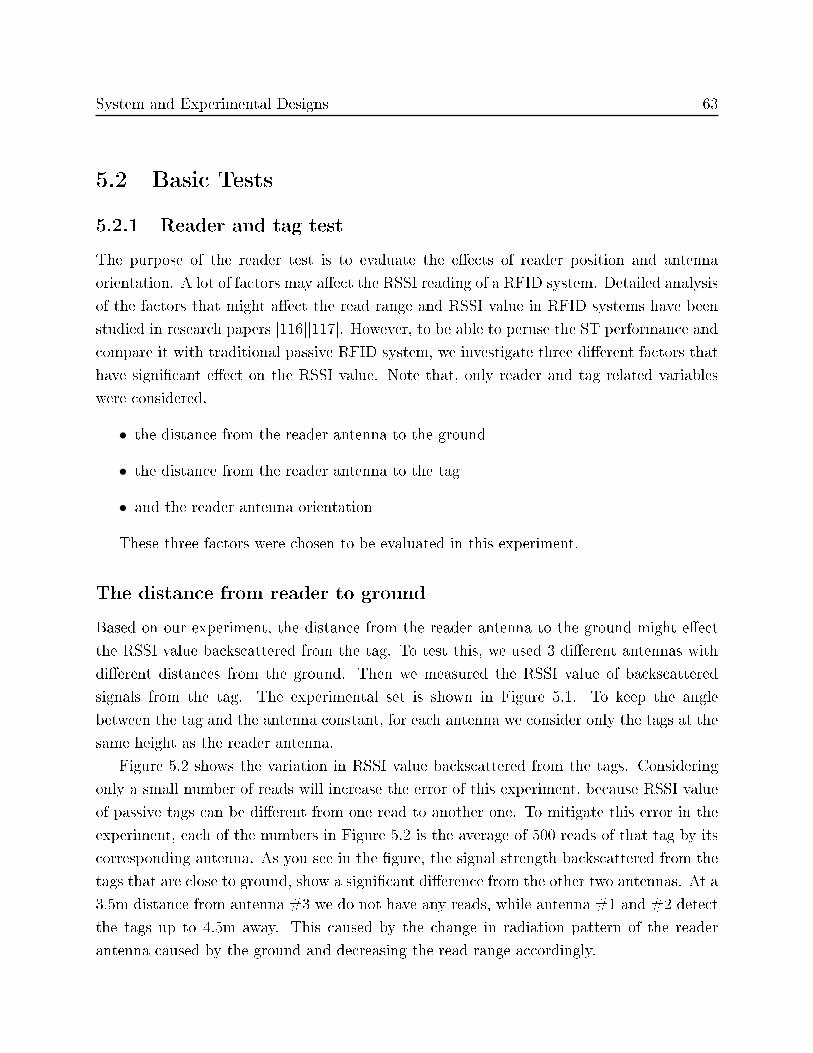
System and Experimental Designs 63
5.2 Basic Tests
5.2.1 Reader and tag test
The purpose of the reader test is to evaluate the e�ects of reader position and antenna
orientation. A lot of factors may a�ect the RSSI reading of a RFID system. Detailed analysis
of the factors that might a�ect the read range and RSSI value in RFID systems have been
studied in research papers [116][117]. However, to be able to peruse the ST performance and
compare it with traditional passive RFID system, we investigate three di�erent factors that
have signi�cant e�ect on the RSSI value. Note that, only reader and tag related variables
were considered.
• the distance from the reader antenna to the ground
• the distance from the reader antenna to the tag
• and the reader antenna orientation
These three factors were chosen to be evaluated in this experiment.
The distance from reader to ground
Based on our experiment, the distance from the reader antenna to the ground might e�ect
the RSSI value backscattered from the tag. To test this, we used 3 di�erent antennas with
di�erent distances from the ground. Then we measured the RSSI value of backscattered
signals from the tag. The experimental set is shown in Figure 5.1. To keep the angle
between the tag and the antenna constant, for each antenna we consider only the tags at the
same height as the reader antenna.
Figure 5.2 shows the variation in RSSI value backscattered from the tags. Considering
only a small number of reads will increase the error of this experiment, because RSSI value
of passive tags can be di�erent from one read to another one. To mitigate this error in the
experiment, each of the numbers in Figure 5.2 is the average of 500 reads of that tag by its
corresponding antenna. As you see in the �gure, the signal strength backscattered from the
tags that are close to ground, show a signi�cant di�erence from the other two antennas. At a
3.5m distance from antenna #3 we do not have any reads, while antenna #1 and #2 detect
the tags up to 4.5m away. This caused by the change in radiation pattern of the reader
antenna caused by the ground and decreasing the read range accordingly.

System and Experimental Designs 64
Figure 5.1: Experimental set for evaluating the distance from reader to ground e�ect on
RSSI value
Figure 5.2: RSSI values for di�erent positions of reader antenna and tags

System and Experimental Designs 65
Figure 5.3: RSSI values for di�erent positions of reader antenna and tags when the angle
between the tag and reader antnna is 45 degree
The distance from reader to tag
The same experimental set shown in Figure 5.1 has been used for this experiment. In Figure
5.2 we can easily observe variation of RSSI value as the distance from the reader increases.
In some cases our RSSI value increases with distance from the antenna. A sample of this
situation can be seen at the distance of 2m from antenna #2. The reason for this is that at
the previous point (1.5m), we have a fading e�ect. In the worst case, although we are in the
read range of the reader, we do not have any reads. We call this points "blind spots".
Note that the RSSI values in the Figure 5.2 average 500 reads. The angle between the
reader's and tag's antenna is in the best orientation in this experiment. Figure 5.3 shows
the RSSI value of 5 sets of experiments without averaging. The tag used in this set of
experiment (UHF chip from EM Semiconductor) is di�erent from the tag used when the
reads were averaged. In this experiment, the angle between the reader antenna and the tag
is 45 degrees. The 5 experiment sets were chosen randomly from 500 repetitions. As we can
see in the Figure 5.3, the values for each set of experiment are extremely variable due to
environmental e�ects.

System and Experimental Designs 66
Figure 5.4: RSSI values for di�erent angles between the reader antenna and UHF tag
Antenna orientation
For this experiment we put a passive UHF tag 2m away from the reader antenna. As with
previous experiments, the RSSI value reported in the Figure 5.4 is the average of 500 reads
for each angle. We changed the angle of UHF tag between "0" to "90" degree with interval
of "15" degrees. The results can be seen in Figure 5.4.
According to our experiments with di�erent type of tags, depending on the model of
chipset and antenna design of the UHF tag, the RSSI values at each angle can be di�erent.
This is one of the signi�cant problems with localization based on RSSI value of UHF passive
tags. Because the tags are attached to mobile objects, the angle of the UHF tags to the
antenna will vary, making it more di�cult to estimate the distance between the tag and the
reader and increasing the mean square error.
5.2.2 Reader and ST test
The same 3 factors as discussed above are important for the ST and reader. The only
di�erence is the RSSI value of ST is much stronger than that of the UHF passive tag,
because it is designed as semi-passive tag. The experiments with ST have been done with a
9 V 1800mAh Alkaline battery and the antenna attached to the ST is an omni-directional
antenna with 3dbi gain. Figure 5.5 and Figure 5.6 show the measured values for the same
experiment that has been done for the passive tag in the previous subsection.

System and Experimental Designs 67
Figure 5.5: RSSI values for di�erent distances between the reader antenna and ST
Figure 5.6: RSSI values for di�erent angles between the reader antenna and ST

System and Experimental Designs 68
Figure 5.7: ST EPC structure
5.2.3 ST and tag test
This experiment shows the factors that a�ect the reading of tags by ST. We can consider
the ST as a reader in this situation, so the same factors between reader and tags are valid
here too. An additional factor is being added - the human body, because we are going to
use ST for human tracking in the IoT.
In ST side, we do not have access to the RSSI value. Instead, number of reads are the
factor that we consider for detection. ST can report 6 EPCs on vicinity per each report.
Figure 5.7 shows the structure of reported message(EPC) by ST to the reader. Each 3
byte from right belongs to the information of one passive tag in the vicinity. The �rst two
characters are the last 2 character of a passive tag's EPC and the third character is the
number of reads from previous the report to the current one, starting from "0". This means
that a "0" in the third character indicates 1 read. The maximum number of reads that can
be reported on each round is "F" or "15". The ST reports its stored information by receiving
a special command from the reader. A parameter called a "Locator round" has been set in
the software. This variable determines how often the command for receiving the information
from ST, has to be sent by the reader. The locator round parameter cannot be greater than
15, since an ST can only report up to 15 reads per round.
Based on our experiments with humans, doing activities at their natural pace we found
System and Experimental Designs 69
the best value for the locator round parameter to be "5".
Three factors in terms of distance are important to the ST read range. The �rst is the
distance from reader to ST. The second is the distance from the reader and the tag. The
third is the distance from ST to the tag. We note that the human body changes the antenna
parameters of the ST, a�ecting its input impedance, radiation pattern and antenna gain
[118]. We have done further experiments on these factors to understand the capability of
the ST in proximity detection. These results will be explained in detail in the next chapter
in section 6.2.
5.3 Software design
5.3.1 Overview
In this section we explain the software developed by us in C# for running the experiment
for tracking and localization. We will explain how we read/send the information from/to
the reader. How to query the ST and its corresponding command will be discussed in this
chapter.
5.3.2 LLRP
The LLRP (Low-Level Reader Protocol) standard [119] is a speci�cation for the interface
between RFID readers and clients, such as smart-phones or PCs. Many RFID reader manu-
facturers use this standard for their reader-client interface [120]. LLRP does not only support
the EPC Gen 2 standard, but also provides an interface for the addition of other standards.
Using this protocol it is possible to set the reader con�guration and the air-protocol con�gu-
rations. Modulation, encoding, frequency range, Q-value, output power level, and sensitivity
are some of the �exibilities that it provides. These settings can be modi�ed to boost perfor-
mance or to mitigate interference of RFID systems.
In the LLRP, standard messages have been de�ned and all of the communication be-
tween reader and clients are based on these messages. Client-to-Reader messages include
capability discovery, managing inventory, getting and setting the con�guration of the reader,
and accessing the operations. In reverse, messages from Reader-to-Client include RF survey
reports, inventory results, status reports, and access results. A parameter can contain one
or more �elds or messages.

System and Experimental Designs 70
5.3.3 RFID Locator software
5.3.3.1 Software back-end
The goal of this software is to send commands to the reader, receive the information from it
using LAN/WLAN and �nally process the received data and present it on an interface for
the user. We used LLRP for the reader to PC communication and vice versa. The software
has to be multi-threaded to be able to show the results in real-time. Therefore, sending the
commands, receiving the information from the reader and processing the received data must
all be done in parallel.
Impinjreader class in the project runs all the functions related to reader-PC communi-
cation including: connecting to reader, setting reader characteristics such as power level,
switching between antennas, receiving the packet from the reader and splitting it down to
store them in understandable variables, checking reader status and reporting for debugging
the system.
A timer is set in the software to tell the reader to interrogate the zone at speci�c time
intervals. This time will be set by user in the setting. The reader sends a command to the
ST by putting a mask on its query once it reaches the value of the "locator round". This
value will be checked every time in the timer interrupt. According to this value the reader
will be asked to read all the tags or just read the ST information.
The software will store all the received passive tags' EPCs with their corresponding
information such as RSSI, time, count and antenna ID. If the EPC belongs to the ST, it
splits the EPC to 13 di�erent parts consisting of ST-ID, 6 detected tag IDs in the vicinity and
their number of reads in that report. All the variables will be stored for further processes.
Table. 5.1 shows the part of the log �le that the software generates based on received ST
EPCs.
First column represents Electronic Product Code (EPC) register created by ST and
backscattered to the reader. Second column is the time when the measurement is taken.
Third and fourth column represent X and Y coordinates of the current position of the ST.
In �fth column, we can �nd the ID of the active antenna, and in sixth column, the reported
received signal strength (ST-to-reader RSS).
5.3.3.2 Localization method
The method used for localization using received data is "Weighted Centroid". In pure cen-
troid method the target calculates its position at the center of the positions of the tags that

System and Experimental Designs 71
Table 5.1: Sample ST log �le.
���������������������������������������
���
EPC Time in sec X Position Y Position Ant. ID RSSI
���������������������������������������
���
E111105000000000000005123 0 0,01111111 0,01111111 2 -44
E111105000000000056023044 0,51765 1,91916901 0,01111111 1 -59
E111105000000000005156023 1,56273 5,77133389 0,01111111 1 -59
E111105000000000000156123 3,09678 11,42584219 0,01111111 1 -59
E111105000000000000000123 4,21535 15,54889121 0,01111111 1 -63
E111105000000000023156055 5,05575 18,64660561 0,01111111 1 -60
E111105000000123144156155 6,30523 23,25218889 0,01111111 1 -61
E111105000000000000005055 6,45834 23,81655235 0,01111111 2 -44
E111105000000000000000005 7,48528 27,60185319 0,01111111 1 -60
E111105000000000044023055 8,47986 31,26787507 0,01111111 1 -62
are in the vicinity or are read, as shown in Figure 5.8(a). To increase the accuracy of the
localization, "Weights" are introduced into this system. Weights are used to calculate the
distance of the target from each respective tag, as shown in Figure 5.8(b). Depending on the
system, weights can be a function of RSSI value or other factors that can be a representation
of distance from each tag. In our case, number of reads by the ST has been used for weight
factors.
The only kind of distance information used in centroid localization(CL) is the binary
information, whether the unknown object is in the communication range of a tag or not. CL
relies on the assumption that each tag has a circular area within which it can be sensed by
the ST. In the other words, ST can read those tags when the distance between the ST and
the tag is smaller than a speci�c range. The threshold that has been considered for signal
strength in RF front-end of the ST can change this read range.
The algorithm which can be performed on each unknown location of ST is shown in
equation 5.1. In this formula, Pi(x, y) indicates the position of unknown object i. The
known position of tag j is given by Bj(x, y). The number of tags which are within the
communication range of the unknown ST is indicated by m.

System and Experimental Designs 72
Figure 5.8: (a) Centroid Localization; (b) Weighted Centroid Localization
Pi(x, y) =1
m
n∑j=1
Bj(x, y) (5.1)
Based on CL equation, for example, if an ST is able to communicate to all of the four tags
in the vicinity, the software will calculate its position to be in the center of the arrangement
(Figure 5.8(a)). Blumenthal et al. showed in [121] that the averaged localization error
can not be less than 12% of the Landmark tag distance for CL. This corresponds with the
�ndings published by Bulusu in [55]. Blumenthal et al. also showed that the localization
error depends on the ratio between the landmark distance and the communication range.
The low accuracy in location estimation of CL became a motivation for researchers to
develop Weighted Centroid Localization (WCL). This method introduced the quanti�cation
of the landmarks depending on their distance from the unknown node (ST in our case). The
aim is to give more in�uence to those landmarks which are nearer to the ST. The quanti�er
(weight) in WCL method is described as shown in equation 5.2, where wij describes the
weight value for landmark j used by receiver i. The distance between landmark j and receiver
i is given by dij and g symbols a degree[122].
wij =1
(dij)g(5.2)
In our system, wij is the number of tag reads by the ST on each report. That means
we put more weight for the landmark tags which are detected more times by the ST. The
ST can detect the tags more times if they are closer, because of the stronger backscattered

System and Experimental Designs 73
signal. More accuracy can be achieved if we consider the distance between the tags and
reader antenna in our weights. We showed in Section 5.2.3 that the number of reads are
dependent on the distance between the tag and reader. But for the application of interest
in this thesis, the accuracy that we achieve by the number of reads alone, can meet our
expectations. Using the weight for the initial equation 5.1, it can be expanded for WCL as
shown in equation 5.3.
Pi(x, y) =1
m
∑mj=1wij ·Bj(x, y)∑m
j=1wij
(5.3)
wij = Number of the tag reads by the ST on each report (5.4)
5.3.3.3 User interface
The user interface designed for the software uses Windows Form of C#. We tried to make
it easy for non-technical users to be able to work with the software. Figure 5.9 shows the
look of the software.
In our "select data �le" panel, the information of landmark tags and antenna locations
will be imported to the software. The landmark information �le consists of tags' IDs, their
location in XYZ coordinates and RSSI values that were measured for each tag. However,
the RSSI value will be updated if it has been changed after starting the query. The antenna
information �le consists of antenna IDs, their locations in XYZ coordinates and the power
transmission level for each antenna.
To start the simulation we connect to the reader �rst. By clicking on "Setting/Reader"
we can choose the reader and set its IP and other settings in the pop-up window. By
clicking connect, the status bar reports if the connection has been successful. After successful
connection, then we set the settings for querying the zone. This is done on the horizontal
menu bar. By clicking on the "locator" in the menu, we will set the locator round, as
previously discussed. Note that the software only sends the command to ST if we set the
locator round and its label color is "red" during the experiment. "Total query" determines
how many queries should be send from the beginning to the end of the experiment. "Query
interval" determines the time intervals between each query. Based on our experiment with
a Impinj R1000 reader, the minimum secure time interval is 200ms.
"Algorithm" in the menu is the variable that is used for data processing and localization.
If algorithm value is "1", then CL will be considered for localization. Changing this value
to "2" will apply WCL for localization. By activating "Zone divide", we can switch between

System and Experimental Designs 74
Figure 5.9: User interface of RFID locator software

System and Experimental Designs 75
antennas at speci�c time interval. Zone divide can sometimes improve the accuracy if we
are using multiple antennas in big area.
Figure 5.10 illustrates the software after the setup once the "Run" button has been
clicked. First the software arranges the landmark tags, based on their information. Then it
checks the RSSI value backscattered from each landmark and updates the values for RSSI.
Red dots in the zone represent ST locations on each report. We can see the details of each
ST location and their corresponding time, by hovering the mouse on top of each red dot.
Information about all the EPCs that have been read are then saved in Excel �le by
clicking on the save buttons for landmark and ST information. At a later time, we can load
the saved �les and experiment o�ine with other algorithms for localization.

System and Experimental Designs 76
Figure 5.10: User interface of RFID locator software after doing setup and running the
localization

Chapter 6
Experiments and Applications
6.1 Overview
This chapter presents the tests that were done based on some IoT applications. We tested
the reader, tag and the ST characteristics such as range, read rate, and performance with the
tag under di�erent distance and orientations, in realistic environment in previous chapter.
We used those information to setup the reader and the landmarks in the lab. Di�erent
applications in IoT have been considered to see if ST based RFID system can help in realizing
them or not. These applications are proximity detection, localization, portal and cross
reading, and activity tracking.
We would like to point out that these experiments are using only the initial prototype of
the ST and that we will have better performance results with the next version of the ST.
In all of the experiments the same RFID tags and reader in previous chapter have been
used. In addition, we used our ST with an antenna with the gain of 3 dBi.
Bellow, we will explain each one including the experiment results and factors that are
important for each experiment.
6.2 Proximity Detection
6.2.1 Object-to-object interactions when the objects are stationary
The goal of this experiment was to determine the proximity range between an ST and a
tag for di�erent distances between the ST and the reader antenna. The purpose of the
experiment was to show that the ST is suitable for detecting interactions among objects as
77

Experiments and Applications 78
well as to point out limitations. The experimental setup was the following. The ST was
attached to a wooden object, and four UHF tags were placed on a paper box. The distance
between the ST and the reader antenna was changed from 1.5 m to 5 m. The tags were
placed behind the ST so that the ST was between the tags and the reader antenna. We
recorded the number of times the ST detected the tag during a 1 minute period. For every
distance between the reader and the ST, we changed the distance between the tags and the
ST until the ST was able to detect the tags about 200 times during 1 min. The distance
between the tags and the ST and the ST detection rate are shown in the �rst and third
column of Table 6.1.
From the results, we conclude the proximity detection range for �xed detection rate
depends on the distance between the ST and the reader. This is an expected result because
the ST detects backscattered signal from the tag and when the tag is farther from the reader,
the ST needs to be closer to the tag to receive the same power level. This feature needs to
be taken into account when using STs for IoT applications.
Table 6.1: Detection rate for di�erent distances between the ST and the reader and the ST
and the tag when both the tag and the ST are stationary and the tag is placed either on an
object or on a person.
Number of times
the ST attached on
the object detects
a tag
Distance
between tag
and ST
Distance
between ST
and reader
Tag on another
object
Tag on the
human body
246 84 130 cm 150 cm
152 34 130 cm 300 cm
228 75 45 cm 300 cm
192 14 45 cm 500 cm
216 43 30 cm 500 cm
6.2.2 Object-to-person interaction when both are stationary
The goal of this experiment was to determine the proximity range between the ST that is
on an object and the tag that is placed near a human body (on the chest). The purpose of
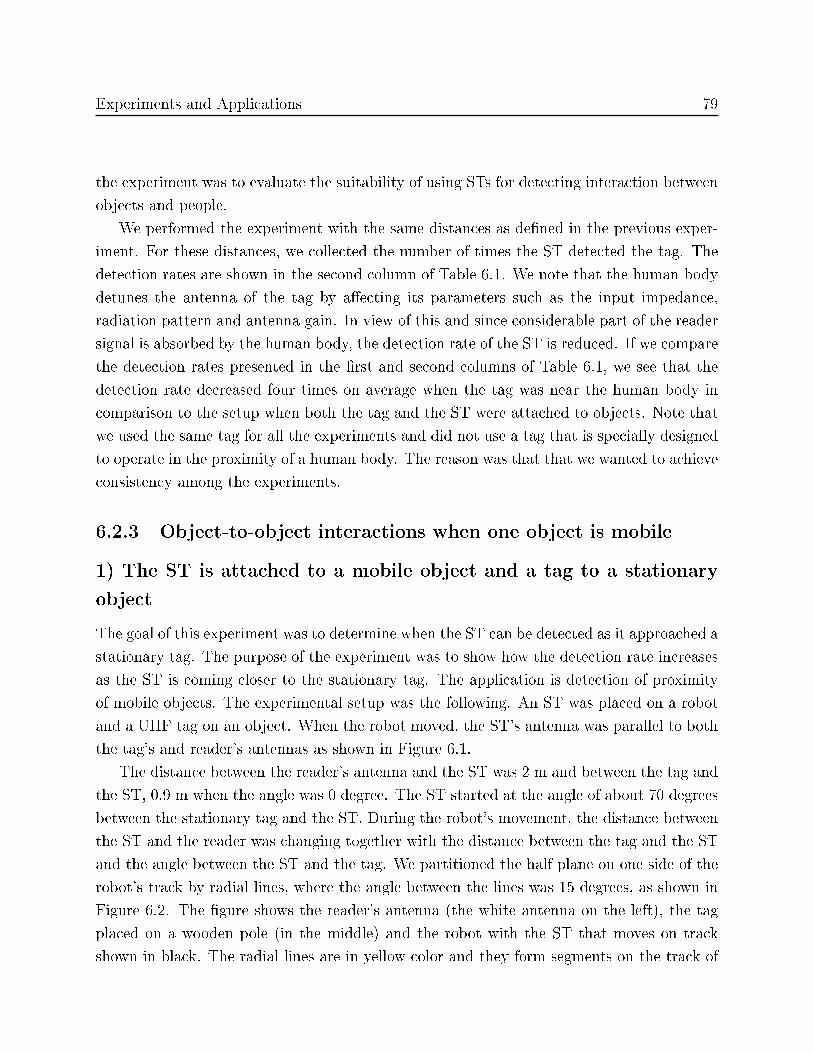
Experiments and Applications 79
the experiment was to evaluate the suitability of using STs for detecting interaction between
objects and people.
We performed the experiment with the same distances as de�ned in the previous exper-
iment. For these distances, we collected the number of times the ST detected the tag. The
detection rates are shown in the second column of Table 6.1. We note that the human body
detunes the antenna of the tag by a�ecting its parameters such as the input impedance,
radiation pattern and antenna gain. In view of this and since considerable part of the reader
signal is absorbed by the human body, the detection rate of the ST is reduced. If we compare
the detection rates presented in the �rst and second columns of Table 6.1, we see that the
detection rate decreased four times on average when the tag was near the human body in
comparison to the setup when both the tag and the ST were attached to objects. Note that
we used the same tag for all the experiments and did not use a tag that is specially designed
to operate in the proximity of a human body. The reason was that that we wanted to achieve
consistency among the experiments.
6.2.3 Object-to-object interactions when one object is mobile
1) The ST is attached to a mobile object and a tag to a stationary
object
The goal of this experiment was to determine when the ST can be detected as it approached a
stationary tag. The purpose of the experiment was to show how the detection rate increases
as the ST is coming closer to the stationary tag. The application is detection of proximity
of mobile objects. The experimental setup was the following. An ST was placed on a robot
and a UHF tag on an object. When the robot moved, the ST's antenna was parallel to both
the tag's and reader's antennas as shown in Figure 6.1.
The distance between the reader's antenna and the ST was 2 m and between the tag and
the ST, 0.9 m when the angle was 0 degree. The ST started at the angle of about 70 degrees
between the stationary tag and the ST. During the robot's movement, the distance between
the ST and the reader was changing together with the distance between the tag and the ST
and the angle between the ST and the tag. We partitioned the half plane on one side of the
robot's track by radial lines, where the angle between the lines was 15 degrees, as shown in
Figure 6.2. The �gure shows the reader's antenna (the white antenna on the left), the tag
placed on a wooden pole (in the middle) and the robot with the ST that moves on track
shown in black. The radial lines are in yellow color and they form segments on the track of
Experiments and Applications 80
Figure 6.1: A mobile ST and stationary tag experiment.

Experiments and Applications 81
Figure 6.2: The experimental setup.
the robot. We recorded the detection rate of the ST for each segment.
The results of the experiments are shown in Figure 6.3. The �gure displays the number
of times the ST detected the tag for each segment for three di�erent speeds of the robot: 3.6
cm/sec, 5.4 cm/sec and 8.2 cm/sec. The results show that an incoming ST is detected when
it is at an angle 60 degrees relative to the tag and that the detection rate improves as the
ST approaches the tag. Also, the detection rate decreases as the speed increases because the
ST spends less time in the �eld of the reader.

Experiments and Applications 82
Figure 6.3: The number of times a tag is detected by a mobile ST when the ST is in the
segment corresponding to angles of 0, 15, 30, 45 and 60 degrees, respectively, and for three
di�erent speeds of the robot.
2) A tag is attached to a mobile objects and an ST to a stationary
object
This experiment is similar to the previous one except that the tag is now attached to a
mobile robot and the ST is stationary. The results are shown in Figure 6.4. The detection
rate is lower than the detection rate in the previous experiment (Figure 6.3). This result
shows that the distance between a tag and a reader, which changes the strength of the tag's
backscattered signal, is more important than the position of the ST in the proximity circle
of the tag with the same angle.
6.3 Localization
6.3.1 Locating stationary objects
The goal of this experiment was to determine whether it is possible to locate a tagged object
in an indoor area. The software described in section 5.3 has been used to localize the ST in
landmarked area. Locator round variable has been set to "5". That means the ST listen to
the tags in �ve query rounds, then transmits its information to the reader after modifying
its EPC.
The position of the ST was estimated by the weighted centroid method. Figure 6.5 shows
the localization for two di�erent locations in the area. Two hundred samples recorded from
the ST in 20 seconds. Each red dot in the picture represents one location based on its
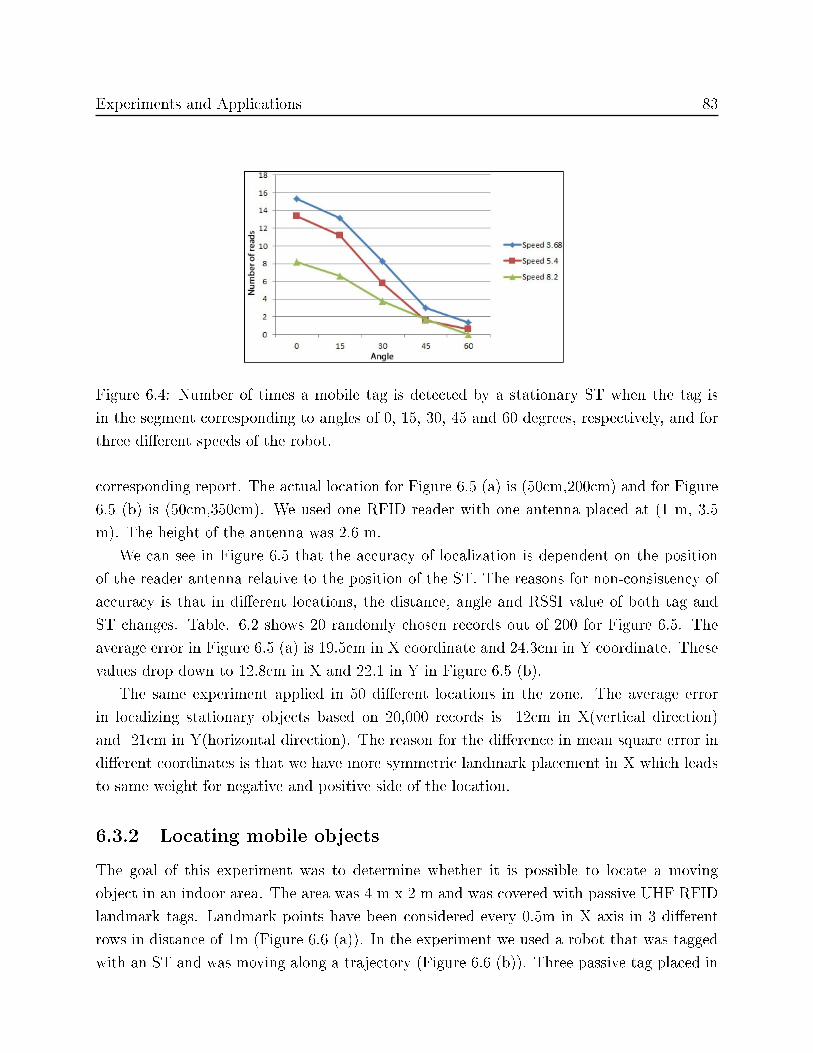
Experiments and Applications 83
Figure 6.4: Number of times a mobile tag is detected by a stationary ST when the tag is
in the segment corresponding to angles of 0, 15, 30, 45 and 60 degrees, respectively, and for
three di�erent speeds of the robot.
corresponding report. The actual location for Figure 6.5 (a) is (50cm,200cm) and for Figure
6.5 (b) is (50cm,350cm). We used one RFID reader with one antenna placed at (1 m, 3.5
m). The height of the antenna was 2.6 m.
We can see in Figure 6.5 that the accuracy of localization is dependent on the position
of the reader antenna relative to the position of the ST. The reasons for non-consistency of
accuracy is that in di�erent locations, the distance, angle and RSSI value of both tag and
ST changes. Table. 6.2 shows 20 randomly chosen records out of 200 for Figure 6.5. The
average error in Figure 6.5 (a) is 19.5cm in X coordinate and 24.3cm in Y coordinate. These
values drop down to 12.8cm in X and 22.1 in Y in Figure 6.5 (b).
The same experiment applied in 50 di�erent locations in the zone. The average error
in localizing stationary objects based on 20,000 records is 12cm in X(vertical direction)
and 21cm in Y(horizontal direction). The reason for the di�erence in mean square error in
di�erent coordinates is that we have more symmetric landmark placement in X which leads
to same weight for negative and positive side of the location.
6.3.2 Locating mobile objects
The goal of this experiment was to determine whether it is possible to locate a moving
object in an indoor area. The area was 4 m x 2 m and was covered with passive UHF RFID
landmark tags. Landmark points have been considered every 0.5m in X axis in 3 di�erent
rows in distance of 1m (Figure 6.6 (a)). In the experiment we used a robot that was tagged
with an ST and was moving along a trajectory (Figure 6.6 (b)). Three passive tag placed in

Experiments and Applications 84
Figure 6.5: Location estimation for two di�erent locations in landmarked area. (a) Loca-
tion(50cm,200cm). (b) Location(50cm,350cm).

Experiments and Applications 85
Table 6.2: Twenty records out of 200 for Figure 6.5 (a) and errors(cm) in each coordinate
EPC RSSI STY STX Error in Y Error in X
11110511532811930633C227 -50 85 169 35 31
11110523611912931232623C -55 89 186 39 14
11110501913C21203A13B326 -51 69 188 19 12
11110503603711822633C03B -53 79 200 29 0
11110513721723C03B118226 -51 76 185 26 15
11110531811723C029326136 -55 96 187 46 13
11110521711821232623633C -49 72 178 22 22
11110511213731812621933C -51 72 176 22 24
11110521A21233C13B126118 -56 67 181 17 19
11110503A23B33C31232601A -53 88 188 38 12
11110521933C11833A217312 -51 80 177 30 23
11110511212623C113236017 -50 101 169 51 31
11110523C136213129326117 -54 60 171 10 29
11110511922911233C01A137 -54 85 185 35 15
11110521203B33C13A028226 -56 81 182 31 18
11110513711822913622623C -55 85 200 35 0
11110522641813601301733C -54 96 178 46 22
11110531243A23C226118119 -56 101 186 51 14
11110531232611902933C318 -55 70 168 20 32

Experiments and Applications 86
Figure 6.6: The experimental setup for direct localization of ST.
each landmark point in order to increase the chance of being read by the ST. The location
of the ST was estimated by the WCL method.
In the experiment, tags are located on the �oor, ST is 75 cm above the ground and reader
antenna location is (1 m, 2 m). The height of the reader antenna was 2.6 m. Figure 6.7
shows the graphical user interface of the software developed for real-time localization. Each
red dot is representation of location of the robot. In real-time mode, one red dot adds to the
screen if the reader receive the information from the ST. The black line is the actual path
of the robot. Most of the calculated locations are closer to the middle column of landmarks.
The reason is that the density of landmark tags on the side which is closer to middle line
is more than the other side. So the probability of detecting the landmark tags on the more
dense side, is higher than the other.
The accuracy of the localization is dependent to the density of landmark tags. We
repeated the same experiment with the only di�erence of reducing number of landmarks to

Experiments and Applications 87
Figure 6.7: Graphical user interface in real-time direct localization. Each location estimation
of the ST has been presented by a red dot.

Experiments and Applications 88
half. In new set of experiment we have landmark tags in every 1m on X direction. Table.
6.3 compare the error in localization between two experiments. For X equals to 100 and 150,
the error di�erence between the two experiment is almost zero. Because the antenna has
the maximum power in that area and backscattered signal from the tags are strong, so even
with less dense landmark, we have enough reads from each tag.
Table 6.3: Error values for experiment 1 and 2 at di�erent distances from the origin
Distance from the origin 50 100 150 200 250 300 350
Error in experiment 1 (cm) 18 15.6 9.2 14 18 16 29
Error in experiment 2 (cm) 28 21.2 11 13 19 29 48
Figure 6.8 shows the relation between the real location and calculated location in 5 sets
of experiments. Each dot is a representation of one location report from the ST. According
to the Figure 6.8 we can conclude that the average error can be approximated using a linear
function and the relation between the real value and calculated value can be presented by
a linear equation (diagonal line in Figure 6.8). Equation 6.1 describes the relation between
real and calculated value in our experiment. Note that the equation for the error can be
di�erent in other environments, but follows the same behavior.
Yreal = 1.275 · Yest − 56.031 (6.1)
6.3.3 Locating mobile objects and indirect locating stationary tags
The goal of this experiment was to determine whether it is possible to locate a moving
object that carries an ST as well as to indirectly locate static objects tagged with passive
tags. In the experiment we used a robot that was tagged with an ST and was moving along
a trajectory. The area was 4 m x 2 m and was covered with passive UHF RFID landmark
tags. Software was developed in C# has been used to process the received data from the
ST, to control the reader and to log the activity (Figure 6.9). The position of the ST was
estimated by the WCL method.
In the experiment, we had 24 landmark tags. Two boxes with UHF passive tags were in
the area with coordinates BOX1 (100,125) and BOX2 (100,300). We used one RFID reader
with one antenna placed at (1 m, 2 m). The height of the antenna was 2.6 m. We performed
additional experiments where, �rst, 10 more tags were added to the environment and then

Experiments and Applications 89
Figure 6.8: Estimated location and their corresponding real location in direct localization.
when two persons were standing between the boxes and the moving robot. The estimate of
the location of the ST is presented on the screen using red dots. The green circles represent
the position estimates of BOX1, and the blue circles the position estimates of BOX2. The
accuracy of the system in estimating the ST's location was better than 32 cm in the X
direction. Note that the reader antenna is placed in the middle and the number of landmark
tags at the beginning and at the end of the path is smaller and therefore the localization
error is di�erent throughout the path.
The second part of the experiment for determining if it is possible to locate the positions
of unknown tags based on the estimated position of the ST showed that when an ST was
close to a tagged box, the boxes were detected and located. The ST detected boxes all
repetition of experiments and in all the cases. It reported approximately every second but
did not detect the boxes in each report. The number of reports when the STs were in the
range of the boxes was between 40% and 66%, which was enough to detect boxes every time.
The proximity of people or other tags did not a�ect neither the localization performance
nor the detection and localization of the boxes. In a similar way, we can design a system to
track people carrying STs and determine if they carry tagged objects. This can be used to
identify in real time if someone moves and carries important, dangerous, expensive or other
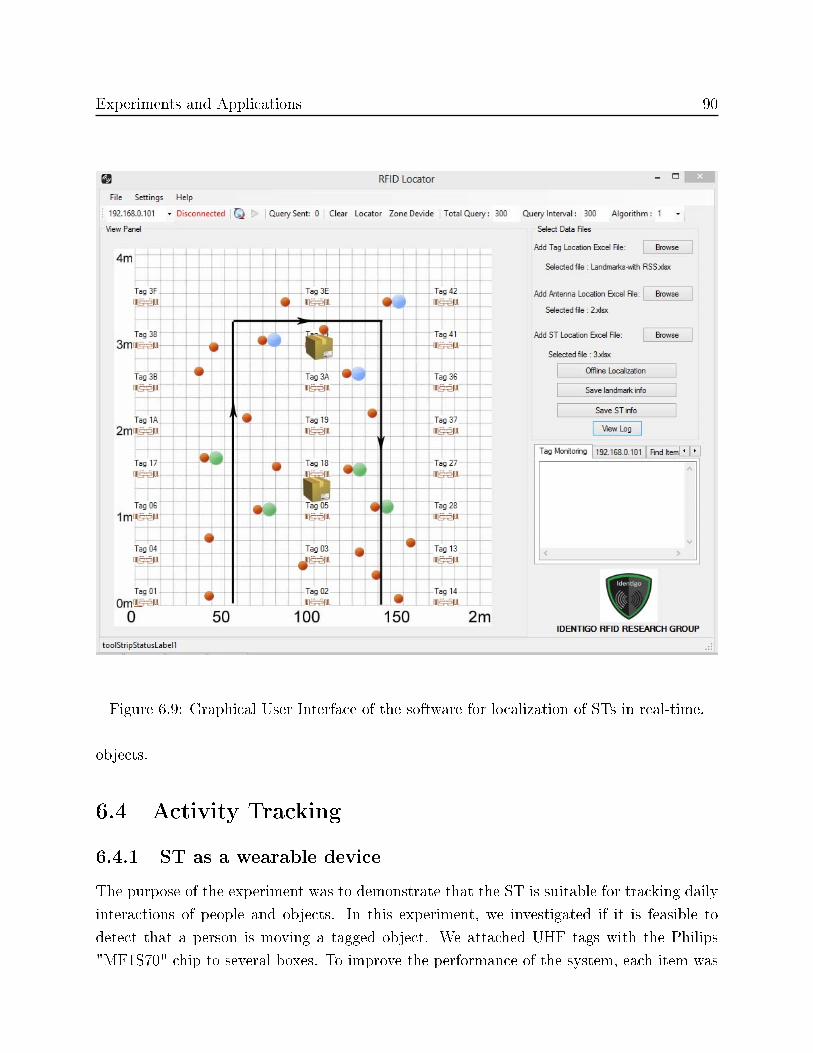
Experiments and Applications 90
Figure 6.9: Graphical User Interface of the software for localization of STs in real-time.
objects.
6.4 Activity Tracking
6.4.1 ST as a wearable device
The purpose of the experiment was to demonstrate that the ST is suitable for tracking daily
interactions of people and objects. In this experiment, we investigated if it is feasible to
detect that a person is moving a tagged object. We attached UHF tags with the Philips
"MF1S70" chip to several boxes. To improve the performance of the system, each item was

Experiments and Applications 91
Figure 6.10: An experimental setup for tracking interactions between a person and an object.
tagged by two tags placed on the top and on the side of the object. An ST was used as a
wristband worn by the person.
The experimental setup is shown in Figure 6.10. The person who wore the ST was getting
close to the object placed on the right desk, grabbed the object, and put it on the left desk.
The distance between the desks was 2 m. The reader antennas were separated by 1.5 m and
placed in front of each desk. The reader switched between the antennas every second. The
UHF tags on the boxes could be read by both reader antennas so that it was not easy to
detect the movement without STs. The number of reads of the tags on the object of interest
by reader antennas 1 and 2 is presented in Figure 6.11 by yellow line for the reader antenna
1 and blue for antenna 2. Number of reads by the ST is presented by black line when reader
antenna 1 is on and orange when reader antenna 2 is on and �nally the grey line represents
the total number of ST reads.
We are mainly interested in the number of time the ST detected the tag (gray line on
Figure 6.11) and we consider that the person is interacting with the object when the number
of ST detections is more than one per second. Therefore, for the current scenario we are
always able to detect that there is an interaction between the person and the object.
When the person picked up the item from the right desk, the ST detected the tag only
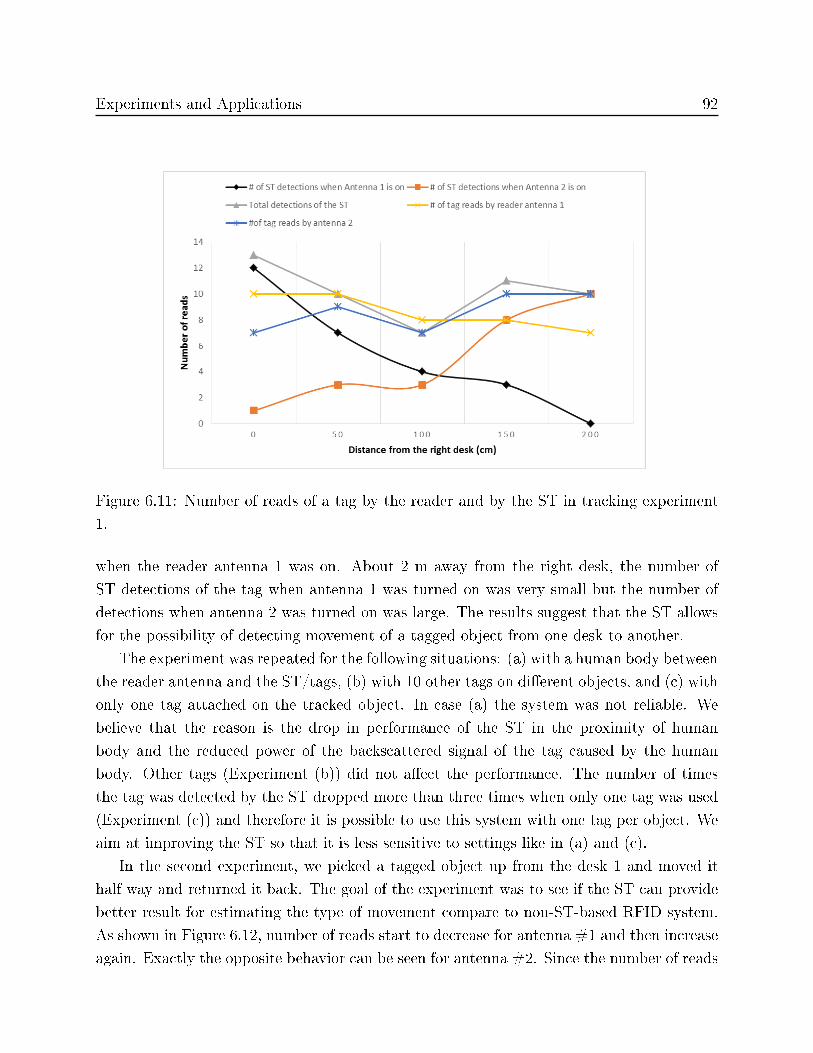
Experiments and Applications 92
Figure 6.11: Number of reads of a tag by the reader and by the ST in tracking experiment
1.
when the reader antenna 1 was on. About 2 m away from the right desk, the number of
ST detections of the tag when antenna 1 was turned on was very small but the number of
detections when antenna 2 was turned on was large. The results suggest that the ST allows
for the possibility of detecting movement of a tagged object from one desk to another.
The experiment was repeated for the following situations: (a) with a human body between
the reader antenna and the ST/tags, (b) with 10 other tags on di�erent objects, and (c) with
only one tag attached on the tracked object. In case (a) the system was not reliable. We
believe that the reason is the drop in performance of the ST in the proximity of human
body and the reduced power of the backscattered signal of the tag caused by the human
body. Other tags (Experiment (b)) did not a�ect the performance. The number of times
the tag was detected by the ST dropped more than three times when only one tag was used
(Experiment (c)) and therefore it is possible to use this system with one tag per object. We
aim at improving the ST so that it is less sensitive to settings like in (a) and (c).
In the second experiment, we picked a tagged object up from the desk 1 and moved it
half way and returned it back. The goal of the experiment was to see if the ST can provide
better result for estimating the type of movement compare to non-ST-based RFID system.
As shown in Figure 6.12, number of reads start to decrease for antenna #1 and then increase
again. Exactly the opposite behavior can be seen for antenna #2. Since the number of reads

Experiments and Applications 93
Figure 6.12: Number of reads of a tag by the reader and by the ST in tracking experiment
2.
in the reader side for passive tags is almost the same in its interrogation zone read range,
it is hard to estimate the type of tracking by considering just number of passive tags (see
yellow and blue line in Figure 6.11 and Figure 6.12. But by considering the number of reads
by ST, we can estimate that the object got close/away to/from antenna 2/1 and again got
away/close from/to it.
6.4.2 Passive tag as a wearable device
In this experiment, we tracked interaction between a person and an object. We attached
a ST to a paper box and used a UHF tag as a wristband. This experiment presents the
opposite situation from the one presented in the previous subsection where the ST was
attached to a person and the tag to an object. Again, we used the same type of tag as in the
previous experiments for consistency reasons and not a commercial wristband tag. The tag
was separated from the arm by an isolator that is about 0.8 cm thick. The person who wore
the tag is getting close to the box, grabs it and put on another place as shown in Figure
6.13. The distance between the box and reader antenna is 1.5 m and it increases to 2 m
after moving the box.
Since the path of the hand's movement is not always the same, we ran the experiment
many times. Because of the e�ect of the human body, the backscattered signal from the tag
is weaker than in the experiments that do not involve humans. So the ST starts detecting the
tag at 20 cm distance between the tag and the ST. When the distance between the tag and

Experiments and Applications 94
Figure 6.13: Experimental setup for tracking the interactions among a person and an object.
the ST is less than 15 cm, the tag will always be recognized by the ST. In our experiment,
the total time required for the movement of the object is about 3 sec while the ST detects a
tag approximately 0.5 sec before and after the interaction. In this period of time, the ST can
detect the tag on the wrist about 12 times on average. Very di�erent results are obtained
depending on whether the tag is directly seen by the reader antenna or if there is an arm
in between the reader antenna and the tag. Without the line of sight, the detection rate is
only 2 on average. The reason for this is that without the line of sight the tag receives less
power and the backscattered power is too low for the ST to detect the tag.
6.4.3 Detecting and locating movement of objects and people in
landmarked area
The goal of this experiment was to determine whether the ST is suitable for detecting
association between an object with the ST and a tagged person and if it is feasible to track
both of them as the person is carrying the object. The purpose of the experiment was to
show that the ST is suitable for tracking objects and people in real environment such as a
depot or a warehouse.
In this experiment, an object of interest is tagged with the ST. The area is covered using
passive UHF RFID landmark tags. Software has been developed in C# used to process the
received data from ST, control the reader and log the activity. The user interface is shown
in Figure 6.14. The area is 8 m x 4 m and it is covered by 30 landmark tags (it is not
completely covered). The one reader with two antennas placed at the following (1.8 m, 5.7
m) and (1.65 m, 2.1 m) is used. The height of the antennas is 2.4 m. The estimate of the

Experiments and Applications 95
Figure 6.14: Tracking activity in UHF landmarked area.
location of the ST is presented on the screen using a red dot. As can be seen in the Figure
6.14 (a), the system keeps estimating the position of the sensatag using the WCL method
and presenting its position.
Next, two persons with UHF semi-passive wristbands enter the area (EM4325 UHF RFID
tag chip). First, one person takes the object with the ST and caries it by following trajectory
shown using a light blue line in Figure 6.14 (a). The estimated position of the �rst person is
shown using green dots in Figure 6.14 (a). After this, the �rst person leaves the box and the
second person takes it and carries it to its original place. The real trajectory of the second
person is presented using a dark blue line in Figure 6.14 (b) and the estimated positions of
the second person using light-blue dots. In both Figure 6.14 (a) and (b) we can see that
the system is able to associate the person with the box a number of times. This is shown in
the �gure when a red circle (the ST) is very close to the green or light-blue circle (people).
In this way, we can design a system that can detect in real time who is moving or carrying
important, dangerous or expensive objects and where.
This experiment shows that when ST is reporting persons tag ID, localization is less

Experiments and Applications 96
Figure 6.15: LOS experiment for traditional RFID system: RSSI for two di�erent distances
between the reader antenna and the tag where measurement is repeated 6 times.
accurate since person`s ID is replacing with one of landmark IDs, because ST can report just
six tags in its vicinity in each report. Also we can see in Figure 6.14 that sometimes the
proximity of person is not reported by the ST. However, this is due to current implementation
of the ST and can be overcome by decreasing the time interval in sending the ST report and
introducing additional logic for detecting association between the ST and the personal tags.
6.5 Non-line-of-sight e�ects
In this experiment, we show the e�ect of NLOS on measured RSS values as well as on the
performance of the ST. In the �rst experiment, we recorded the RSS value of a passive tag
placed 2 m and 4 m away from the reader. Then we repeated the same experiment with the
only di�erence of presence of a human between the reader and the tag. Figure 6.15 shows
the LOS experiment where 6 RSS value were collected at the reader side from a passive tag
placed at the distance of 2 m and 4 m. In Figure 6.16, a person enters the zone and stays
in the middle between the reader and the tag (d=1 m when tag and the reader are 2 m
apart, and d=2 m when the tag and the reader are 4 m apart). In presence of a human, the
recorded RSSI values are weaker as expected. The bigger problem is that the RSS values of
a tag at the distance of 4 m is LOS situation is very similar to the RSS value of the tag 2
m away from the reader in NLOS situation. Clearly, making decision based on only RSSI
values for localization can be quite inaccurate.
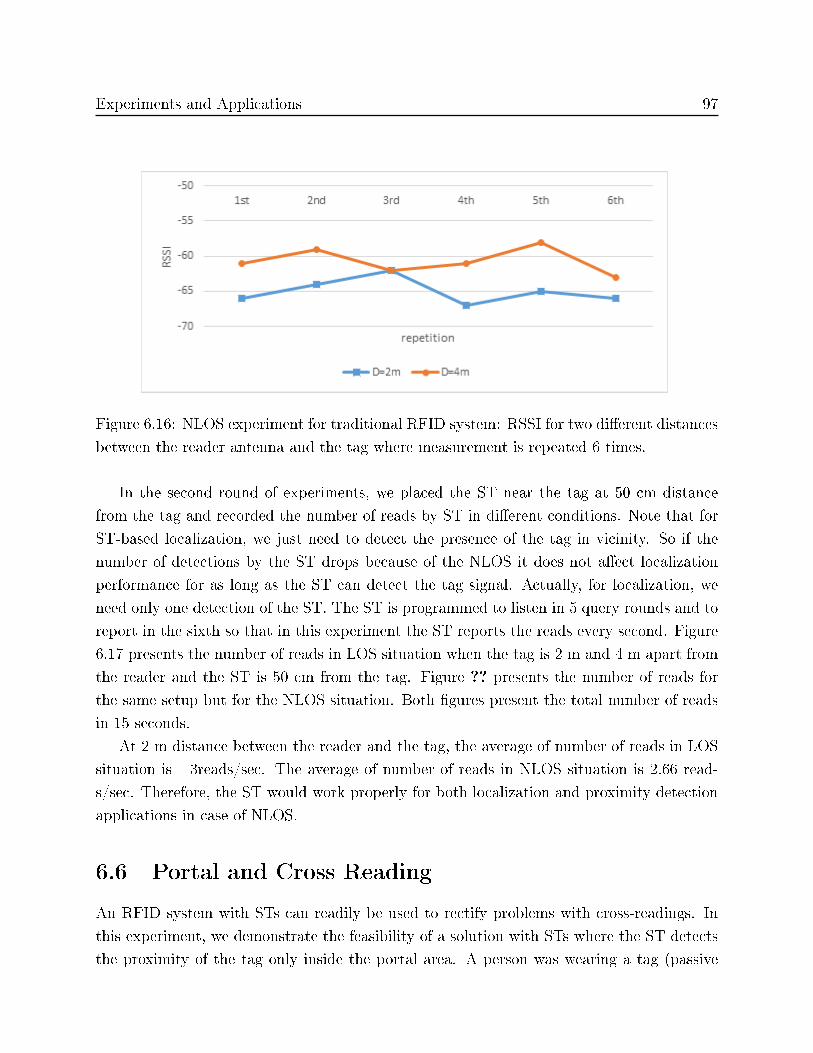
Experiments and Applications 97
Figure 6.16: NLOS experiment for traditional RFID system: RSSI for two di�erent distances
between the reader antenna and the tag where measurement is repeated 6 times.
In the second round of experiments, we placed the ST near the tag at 50 cm distance
from the tag and recorded the number of reads by ST in di�erent conditions. Note that for
ST-based localization, we just need to detect the presence of the tag in vicinity. So if the
number of detections by the ST drops because of the NLOS it does not a�ect localization
performance for as long as the ST can detect the tag signal. Actually, for localization, we
need only one detection of the ST. The ST is programmed to listen in 5 query rounds and to
report in the sixth so that in this experiment the ST reports the reads every second. Figure
6.17 presents the number of reads in LOS situation when the tag is 2 m and 4 m apart from
the reader and the ST is 50 cm from the tag. Figure ?? presents the number of reads for
the same setup but for the NLOS situation. Both �gures present the total number of reads
in 15 seconds.
At 2 m distance between the reader and the tag, the average of number of reads in LOS
situation is 3reads/sec. The average of number of reads in NLOS situation is 2.66 read-
s/sec. Therefore, the ST would work properly for both localization and proximity detection
applications in case of NLOS.
6.6 Portal and Cross Reading
An RFID system with STs can readily be used to rectify problems with cross-readings. In
this experiment, we demonstrate the feasibility of a solution with STs where the ST detects
the proximity of the tag only inside the portal area. A person was wearing a tag (passive
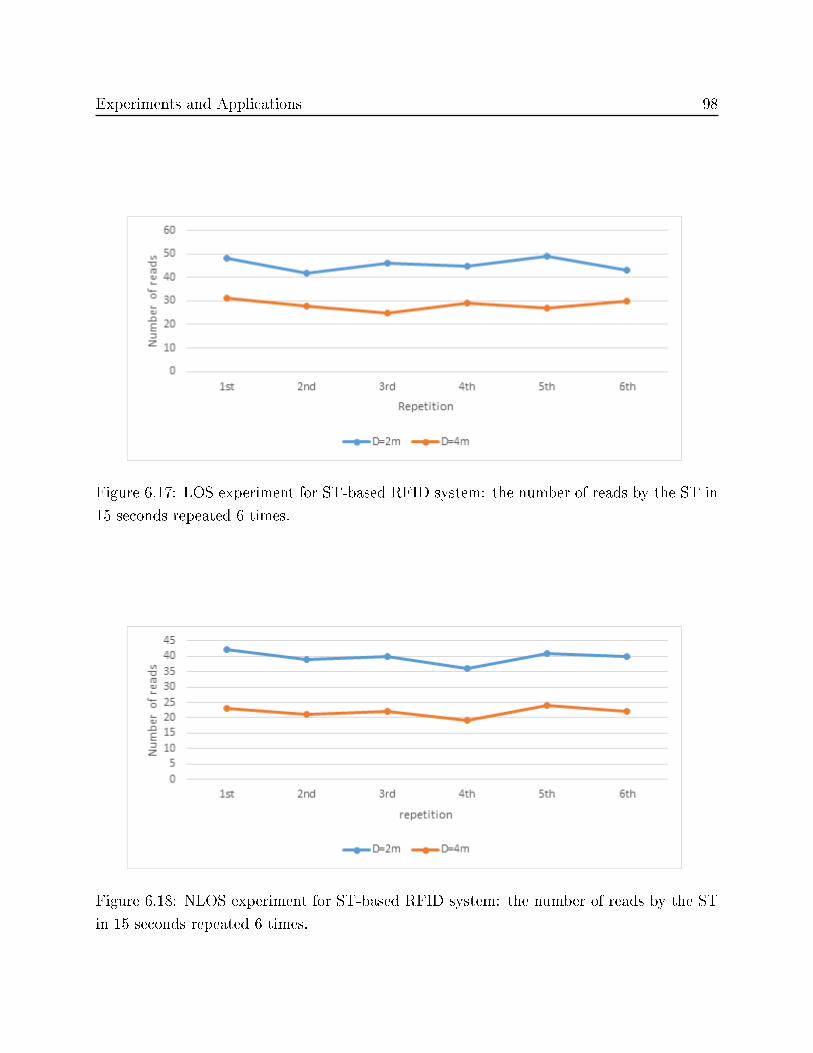
Experiments and Applications 98
Figure 6.17: LOS experiment for ST-based RFID system: the number of reads by the ST in
15 seconds repeated 6 times.
Figure 6.18: NLOS experiment for ST-based RFID system: the number of reads by the ST
in 15 seconds repeated 6 times.
Experiments and Applications 99
UHF tags with chip "MF1S70" from Philips) on the wrist and was passing through an
improvised portal made on one reader antenna on the left and the ST on the right. The
distance between the ST and the reader was 2 m, the height of the reader antenna was 1.2
m and the height of the ST from the ground was 1.25 m. The tag was detected 100% of
the time by the ST and the reader when the experiment was repeated 10 times. When the
person with the tag went around the portal (behind the ST) it was not detected at all (0/10
times). A real portal would have, for example, two reader antennas (one on each side) and
minimum four STs (at least two on each side). The detection of the tags by the STs will
not only be used for determining if the tags pass through the portal but also for estimating
the direction of their movement. Since only one prototype of ST was available, doing this
experiment and providing measurements and numbers was not possible. However, based on
the observations on the portal with one ST, we can expect reasonable results.
6.7 Summary of the Experimental Results
A number of experiments have been performed to evaluate the performance of the STs for
proximity detection and IoT applications accordingly. An important metric used in the
performance evaluation was the detection rate or read rate of the ST. It represents the
number of times the ST detected a tag in a prede�ned time interval and use it for weighting
in WCL method. We tested the detection rate of STs in (a) stationary and (b) mobile
settings.
We had several groups of experiments. In the �rst one we studied proximity detection
performance in object-to-object and object-to-human in both stationary and mobile settings.
Based on this experiment and the results shown in Table 6.1, we can conclude that the
proximity detection rate depends on both the distance between the tag-ST and distance
between the tag-reader. Presence of human body has a signi�cant e�ect on the proximity
detection rate and decrease the rate four times on average. The angle between the tag's and
ST's antenna can also a�ect the detection rate. According to the experiment that explained
in Section 6.2.3, the ST can detect the tag when the angle between their antenna is between
0 and 60 degree. However, for the angles greater than 45 degree the number of reads are
small and not reliable.
In the second experiment we used the capability of the ST in proximity detection, and
used this potential for indoor localization. Weighted centroid localization method is con-
sidered for estimating the location. Number of tag reads by ST have been used for weights
in the method. The error in localizing stationary objects depends on the density of the
Experiments and Applications 100
landmark tags. In the experimental area covered by UHF passive tags (a tag on each 50cm
in X coordinate and each 1m in Y coordinate), the mean error for stationary object is 19
cm in X coordinate. The mean error will increase to 24 cm in mobile ST with the speed of
3.68 cm/s, because of changing the detection rate while the ST moves between each report.
According to Figure 6.3 we can also conclude that the mean square error depends on the
speed of the mobile ST. In indirect localization, ST could report non-landmark tags in the
vicinity between 40 and 66%. This is enough for detecting the non-landmark tags every time
and for estimating its location. The error of the indirect localization based on the ST is less
that its detection range for passive tags.
In the next set of experiment, we used the ST for activity tracking. As long as the human
body is not between the ST and reader antenna when it is attached to the body, we can
track the activities 100%. The reliability of the ST-based tracking system increases if we
attach more than one UHF tag to the object. However, even with one tag on the object we
were able to track the movement even though the number of times the tag was detected by
the ST dropped three times on average as shown in the Figure 6.10. In the next part of the
experiment, ST used to detect and locate movement of objects and people in landmarked
area. The results show that the localization accuracy will be less when ST is reporting person
tag ID compare to just locating the mobile ST, because ST can report six tags only in its
vicinity in each report. However, tracking objects and people in landmarked area can be
done in ST-based RFID system as shown in Figure 6.14.
At last, the capability of the ST in cross reading detection has been investigated. The
tag was detected 100% of the time by the ST and the reader when it passes through the
portal. The number of detection by ST dropped to 0 if the tag went around the portal.
Based on this, it can be concluded that ST-based RFID system is a very reliable system for
portal applications.

Chapter 7
Conclusion
7.1 Concluding remarks
The IoT will be a network of things where the nodes (things) are intelligent and are able to
interact among themselves. In this thesis, we described a UHF RFID system augmented with
STs, which are able to address several issues of the IoT. They include unique identi�cation,
proximity detection, and localization of the things. We investigated how the STs perform
in applications of proximity detection and localization and showed that they have a strong
potential for an important role in the IoT. They can be used for detecting proximity of
objects and people, tracking moving objects, and detecting if objects are moved from one
place to another. The ability of ST in preventing cross-reading can be helpful in enumeration
applications in future IoT.
The thesis compared this approach to two other similar implementations using passive
systems. The ST-based RFID system o�ers good performance and low-cost due to the ability
to be added to any regular RFID system and using inexpensive elements on the board.
The ST su�ers from limitations in sensitivity and problems in working near human body.
However, the ST-based system does overcome the limitations of the similar implementations,
namely it deals with NLOS reading, and allows for localizing the object in a real environment.
Quantitatively, the ST-based RFID system achieved an accuracy of 20cm in an area covered
by landmark tags(2Ltag/m on each coordination). However, this number can be variable
depending on the density of landmark tags. In 100% of times, we can localize items indirectly
in the read range of the ST. Di�erent scenarios were implemented to showcase the usability
of ST in localization, proximity detection and activity tracking.
101

Conclusion 102
7.2 Future Work
The results presented in this thesis are based on the �rst prototype of the ST. The speed of
the system and the ST's orientation sensitivity, size, cost and power consumption need to be
improved. The optimization of the power consumption is one of our future e�orts. Namely,
working on migrating from an FPGA design to a low-power/low-cost MCU that can increase
the lifetime of the ST up to one year. The presented system, however, shows that it has
potential for various IoT applications.
The current ST supports Miller 4 modulation from the reader and ASK modulation from
the tag. One possible extension is to implement all available modes supported by the EPC
Gen 2 standard.
One of the big advantages of ST in IoT applications, is data �ltering. The protocol and
�rmware of the ST can be changed to receive special commands from the reader and act as
a middleware in RFID system to �lter the data.
The current implementation of the ST is not optimized to work near human body. One
extension is to optimize the ST front-end circuit to work better near human body.
Another suggestion for future works is expanding the capabilities of the ST by adding
energy harvesting techniques to increase the battery life time. Also changing the protocol
to let STs communicate to each other can open many windows for new applications of IoT
using ST.
References
[1] EPCGlobal, �Speci�cation for RFID Air Interface EPC Radio-Frequency Identity
Protocols Class-1 Generation-2 UHF RFID Protocol for Communications at 860 MHz�
960 MHz,� Available: http://www.gs1.org/gsmp/kc/epcglobal/uhfc1g2/uhfc1g2_
1_2_0-standard-20080511.pdf [Mar. 1, 2012].
[2] Z. Zhong, Range-free Localization and Tracking in Wireless Sensor Networks, Ph.D.
thesis, Minneapolis, MN, USA, 2010.
[3] J. Hightower and G. Borriello, �A survey and taxonomy of location systems for ubiq-
uitous computing,� Tech. Rep., IEEE Computer, 2001.
[4] W. Kim, K. Mechitov, JY. Choi, and S. Ham, �On target tracking with binary proxim-
ity sensors,� in Information Processing in Sensor Networks, 2005. IPSN 2005. Fourth
International Symposium on. IEEE, 2005, pp. 301�308.
[5] C. Cattuto, W. Van den Broeck, A. Barrat, V. Colizza, J.F. Pinton, and A. Vespignani,
�Dynamics of person-to-person interactions from distributed r�d sensor networks,� PloS
one, vol. 5, no. 7, pp. e11596, 2010.
[6] B. Violino, �RFID Business Applications,� Available: Http://www.Rfidjournal.com/
article/view/1334 [Mar. 30, 2013].
[7] D. Dobkin, The RF in RFID: Passive UHF RFID in Practice, Newnes, 2007.
[8] EPCGlobal, �EPCglobal Standards Overview,� Available: http://www.gs1.org/
gsmp/kc/epcglobal [Mar. 1, 2012].
[9] K. Finkenzeller, RFID handbook, Wiley, 2010.
103

REFERENCES 104
[10] A. Athalye, V. Savi¢, M. Boli¢, and P.M. Djuri¢, �A Radio Frequency Identi�cation
System for accurate indoor localization,� 2011 IEEE International Conference on
Acoustics, Speech and Signal Processing (ICASSP), pp. 1777�1780, 2011.
[11] D. De Donno, F. Ricciato, L. Catarinucci, and L. Tarricone, �Design and applica-
tions of a Software-De�ned listener for UHF RFID systems,� in 2011 IEEE MTT-S
International Microwave Symposium Digest (MTT), June 2011, pp. 1�4.
[12] A. Borisenko, �Design and Implementation of an Augmented RFID System,� M.Sc.
Thesis, University of Ottawa, 2012.
[13] P.V. Nikitin, S. Ramamurthy, R. Martinez, and K. Rao, �Passive tag-to-tag communi-
cation,� in RFID (RFID), 2012 IEEE International Conference on. IEEE, 2012, pp.
177�184.
[14] K. Ashton, �That 'internet of things' thing,� RFID Journal, vol. 22, pp. 97�114, 2009.
[15] Y. Huang and G. Li, �A semantic analysis for internet of things,� in Intelligent
Computation Technology and Automation (ICICTA), 2010 International Conference
on. IEEE, 2010, vol. 1, pp. 336�339.
[16] Xiaolin J., Quanyuan F., Taihua F., and Quanshui L., �R�d technology and its ap-
plications in internet of things (iot),� in Consumer Electronics, Communications and
Networks (CECNet), 2012 2nd International Conference on, 2012, pp. 1282�1285.
[17] Q. Sun, J. Liu, S. Li, C. FAN, and J. SUN, �Internet of things: Summarize on concepts,
architecture and key technology problem,� Journal of Beijing University of Posts and
Telecommunications, vol. 3, pp. 300�303, 2010.
[18] L.C. Miller, Home Networking Do-It-Yourself For Dummies, For Dummies, 1st edition,
2011.
[19] W3.org, �XML 1.0 Speci�cation,� Available: http://www.W3.org [Jun. 22, 2010].
[20] Impinj Inc, �Monza X8K Dura Datasheet,� Available: http://www.impinj.com/
Documents/Tag_Chips/Monza_X-8K_Dura_Datasheet/ [Mar. 1, 2013].
[21] NXP Semiconductors, �EM4325 UHF BAP RFID tag chip Datasheet,� Avail-
able: http://www.emmicroelectronic.com/products.asp?IdProduct=295 [Mar.
10, 2013].

REFERENCES 105
[22] Arrayenet Co., �System Requirements for Connecting Consumer Products to Smart-
phone and Web Applications,� Available: http://www.arrayent.com [Mar. 6, 2013].
[23] T. Instruments, �MSP430 f1611 Datasheet,� Available: http://www.ti.com/product/
msp430f1611 [Mar. 1, 2013].
[24] D. Guinard, V. Trifa, F. Mattern, and E. Wilde, �From the internet of things to the
web of things: Resource-oriented architecture and best practices,� in Architecting the
Internet of Things, pp. 97�129. Springer, 2011.
[25] R. Want and D.M. Russell, �Ubiquitous electronic tagging,� Distributed Systems
Online, IEEE. http://www. computer. org/dsonline/articles/ds2wan. htm, 2000.
[26] PowerID, �PowerP RFID Tags for People Tracking PowerP Speci�cations,� Available:
http://www.power-id.com/Data/pdf/PowerP_0311.pdf [May 1, 2012].
[27] N.B. Priyantha, A. Chakraborty, and H. Balakrishnan, �The cricket location-support
system,� in Proceedings of the 6th annual international conference on Mobile computing
and networking. ACM, 2000, pp. 32�43.
[28] P. Bahl and V.N. Padmanabhan, �Radar: An in-building rf-based user location and
tracking system,� in INFOCOM 2000. Nineteenth Annual Joint Conference of the
IEEE Computer and Communications Societies. Proceedings. IEEE. Ieee, 2000, vol. 2,
pp. 775�784.
[29] D. Niculescu and B. Nath, �Ad hoc positioning system (aps) using aoa,� in INFOCOM
2003. Twenty-Second Annual Joint Conference of the IEEE Computer and Communi-
cations. IEEE Societies. IEEE, 2003, vol. 3, pp. 1734�1743.
[30] M. Youssef, A. Youssef, C. Rieger, U. Shankar, and A. Agrawala, �Pinpoint: An
asynchronous time-based location determination system,� in Proceedings of the 4th
international conference on Mobile systems, applications and services. ACM, 2006, pp.
165�176.
[31] X. Cheng, A. Thaeler, G. Xue, and D. Chen, �Tps: A time-based positioning scheme
for outdoor wireless sensor networks,� in INFOCOM 2004. Twenty-third AnnualJoint
Conference of the IEEE Computer and Communications Societies. IEEE, 2004, vol. 4,
pp. 2685�2696.

REFERENCES 106
[32] C. Peng, G. Shen, Y. Zhang, Y. Li, and K. Tan, �Beepbeep: a high accuracy acoustic
ranging system using cots mobile devices,� in Proceedings of the 5th international
conference on Embedded networked sensor systems. ACM, 2007, pp. 1�14.
[33] H. Chang, J. Tian, T. Lai, H. Chu, and P. Huang, �Spinning beacons for precise indoor
localization,� in Proceedings of the 6th ACM conference on Embedded network sensor
systems. ACM, 2008, pp. 127�140.
[34] D. Estrin, R. Govindan, J. Heidemann, and S. Kumar, �Next century challenges:
Scalable coordination in sensor networks,� in Proceedings of the 5th annual ACM/IEEE
international conference on Mobile computing and networking. ACM, 1999, pp. 263�
270.
[35] X. Xu, N. Rao, and S. Sahni, �A computational geometry method for localization using
di�erences of distances,� ACM Transactions on Sensor Networks (TOSN), vol. 6, no.
2, pp. 1�10, 2010.
[36] D.K. Goldenberg, P. Bihler, M. Cao, J. Fang, B. Anderson, A.S. Morse, and Y.R.
Yang, �Localization in sparse networks using sweeps,� in Proceedings of the 12th
annual international conference on Mobile computing and networking. ACM, 2006, pp.
110�121.
[37] C.S. Raghavendra, K.M. Sivalingam, and T. Znati, Wireless sensor networks, Springer,
2004.
[38] D. Moore, J. Leonard, D. Rus, and S. Teller, �Robust distributed network localization
with noisy range measurements,� in Proceedings of the 2nd international conference
on Embedded networked sensor systems. ACM, 2004, pp. 50�61.
[39] A. Basu, J. Gao, J. Mitchell, and G. Sabhnani, �Distributed localization using noisy
distance and angle information,� in Proceedings of the 7th ACM international sympo-
sium on Mobile ad hoc networking and computing. ACM, 2006, pp. 262�273.
[40] D. Ganesan, B. Krishnamachari, A. Woo, D. Culler, D. Estrin, and S. Wicker, �Com-
plex behavior at scale: An experimental study of low-power wireless sensor networks,�
Tech. Rep., Technical Report UCLA/CSD-TR 02, 2002.
[41] K. Srinivasan, P. Dutta, A. Tavakoli, and P. Levis, �Understanding the causes of packet
delivery success and failure in dense wireless sensor networks,� in Proceedings of the

REFERENCES 107
4th international conference on Embedded networked sensor systems. ACM, 2006, pp.
419�420.
[42] J. Hightower, R. Want, and G. Borriello, �Spoton: An indoor 3d location sensing
technology based on rf signal strength,� UW CSE 00-02-02, University of Washington,
Department of Computer Science and Engineering, Seattle, WA, vol. 1, 2000.
[43] A. Savvides, C. Han, and M.B. Strivastava, �Dynamic �ne-grained localization in ad-
hoc networks of sensors,� in Proceedings of the 7th annual international conference on
Mobile computing and networking. ACM, 2001, pp. 166�179.
[44] N. Patwari, A.O. Hero III, and J.A. Costa, �Learning sensor location from signal
strength and connectivity,� in Secure Localization and Time Synchronization for Wire-
less Sensor and Ad Hoc Networks, pp. 57�81. Springer, 2007.
[45] T. Roos, P. Myllymaki, and H. Tirri, �A statistical modeling approach to location
estimation,� Mobile Computing, IEEE Transactions on, vol. 1, no. 1, pp. 59�69, 2002.
[46] P. Krishnan, A. Krishnakumar, W. Ju, C. Mallows, and S. Gamt, �A system for lease:
Location estimation assisted by stationary emitters for indoor rf wireless networks,�
in INFOCOM 2004. Twenty-third AnnualJoint Conference of the IEEE Computer and
Communications Societies. IEEE, 2004, vol. 2, pp. 1001�1011.
[47] Y. Ji, S. Biaz, S. Pandey, and P. Agrawal, �Ariadne: a dynamic indoor signal map con-
struction and localization system,� in Proceedings of the 4th international conference
on Mobile systems, applications and services. ACM, 2006, pp. 151�164.
[48] A. Harter, A. Hopper, P. Steggles, A. Ward, and P. Webster, �The anatomy of a
context-aware application,� Wireless Networks, vol. 8, no. 2/3, pp. 187�197, 2002.
[49] S. Lanzisera, D.T. Lin, and K.S. Pister, �Rf time of �ight ranging for wireless sensor
network localization,� in Intelligent Solutions in Embedded Systems, 2006 International
Workshop on. IEEE, 2006, pp. 1�12.
[50] R.J. Fontana and S.J. Gunderson, �Ultra-wideband precision asset location system,�
in Ultra Wideband Systems and Technologies, 2002. Digest of Papers. 2002 IEEE Con-
ference on. IEEE, 2002, pp. 147�150.
[51] J.H. Winters, �Smart antenna techniques and their application to wireless ad hoc
networks,� Wireless Communications, IEEE, vol. 13, no. 4, pp. 77�83, 2006.

REFERENCES 108
[52] A.J. Fenn, D.H. Temme, W.P. Delaney, and W.E. Courtney, �The development of
phased-array radar technology,� Lincoln Laboratory Journal, vol. 12, no. 2, pp. 321�
340, 2000.
[53] J.C. Liberti and T.S. Rappaport, Smart antennas for wireless communications: IS-95
and third generation CDMA applications, Prentice Hall PTR, 1999.
[54] ZZHAW Dan, �Physical layer design of wireless sensor network nodes,� Journal of
Southeast University (English Edition), vol. 1, pp. 004, 2006.
[55] N. Bulusu, J. Heidemann, and D. Estrin, �Gps-less low-cost outdoor localization for
very small devices,� Personal Communications, IEEE, vol. 7, no. 5, pp. 28�34, 2000.
[56] R. Stoleru, T. He, J.A. Stankovic, and D. Luebke, �A high-accuracy, low-cost local-
ization system for wireless sensor networks,� in Proceedings of the 3rd international
conference on Embedded networked sensor systems. ACM, 2005, pp. 13�26.
[57] T. He, C. Huang, B.M. Blum, J.A. Stankovic, and T. Abdelzaher, �Range-free lo-
calization schemes for large scale sensor networks,� in Proceedings of the 9th annual
international conference on Mobile computing and networking. ACM, 2003, pp. 81�95.
[58] L.M. Ni, Y. Liu, Y.C. Lau, and A.P. Patil, �Landmarc: indoor location sensing using
active r�d,� Wireless networks, vol. 10, no. 6, pp. 701�710, 2004.
[59] S. Schuhmann, K. Herrmann, K. Rothermel, J. Blumenthal, and D. Timmermann,
�Improved weighted centroid localization in smart ubiquitous environments,� in Ubiq-
uitous Intelligence and Computing, pp. 20�34. Springer, 2008.
[60] M. Zhu, Positioning Algorithms for RFID-Based Multi-Sensor Indoor / Outdoor Po-
sitioning Techniques, Ph.D. thesis, RMIT University, 2011.
[61] R. Oktem, E.U. Aydin, and N.E. Cagiltay, �An r�d based location �nding and tracking
with guidance,� in Wireless Communications, Networking and Mobile Computing,
2008. WiCOM'08. 4th International Conference on. IEEE, 2008, pp. 1�4.
[62] H.D. Chon, S. Jun, H. Jung, and S.W. An, �Using r�d for accurate positioning,�
Journal of Global Positioning Systems, vol. 3, no. 1-2, pp. 32�39, 2004.
[63] M.W. Duron and R. Bridgelall, �Reverse infrastructure location system and method,�
July 22 2008, US Patent 7,403,120.
REFERENCES 109
[64] A. Hatami and K. Pahlavan, �A comparative performance evaluation of rss-based
positioning algorithms used in wlan networks,� in Wireless Communications and Net-
working Conference, 2005 IEEE. IEEE, 2005, vol. 4, pp. 2331�2337.
[65] I. Guvenc, Z. Sahinoglu, and P.V. Orlik, �Toa estimation for ir-uwb systems with
di�erent transceiver types,� Microwave Theory and Techniques, IEEE Transactions
on, vol. 54, no. 4, pp. 1876�1886, 2006.
[66] P. Poormoghaddam, H. Amindavar, and R.L. Kirlin, �A new time-delay estimation in
multipath,� Signal Processing, IEEE Transactions on, vol. 51, no. 5, pp. 1129�1142,
2003.
[67] M. Knox and R. Bridgelall, �Object location based security using r�d,� July 14 2010,
EP Patent 1,794,951.
[68] M. Boli¢, D. Simplot-Ryl, and I. Stoymenovi¢, RFID Systems: Research Trends and
Challenges, Wiley, 2010.
[69] I. Amir, �Dual antenna base station for improved r�d localization,� Nov. 17 2009, US
Patent 7,619,532.
[70] S. Jia, J. Sheng, and K. Takase, �Improvement of performance of localization id tag
using multi-antenna r�d system,� in SICE Annual Conference, 2008. IEEE, 2008, pp.
1715�1718.
[71] Y. Zhang, M.G. Amin, and S. Kaushik, �Localization and tracking of passive r�d tags
based on direction estimation,� International Journal of Antennas and Propagation,
vol. 2007, 2007.
[72] Y. Zhao, Y. Liu, and L.M. Ni, �Vire: Active r�d-based localization using virtual refer-
ence elimination,� in Parallel Processing, 2007. ICPP 2007. International Conference
on. IEEE, 2007, pp. 56�56.
[73] A. Stelzer, K. Pourvoyeur, and A. Fischer, �Concept and application of lpm-a novel
3-d local position measurement system,� Microwave Theory and Techniques, IEEE
Transactions on, vol. 52, no. 12, pp. 2664�2669, 2004.
[74] J. Hightower, C. Vakili, G. Borriello, and R. Want, �Design and calibration of the
spoton ad-hoc location sensing system,� unpublished, August, 2001.

REFERENCES 110
[75] J. Song, C.T. Haas, and C.H. Caldas, �A proximity-based method for locating r�d
tagged objects,� Advanced Engineering Informatics, vol. 21, no. 4, pp. 367�376, 2007.
[76] M. Bouet and G. Pujolle, �3-d localization schemes of r�d tags with static and mobile
readers,� in NETWORKING 2008 Ad Hoc and Sensor Networks, Wireless Networks,
Next Generation Internet, pp. 112�123. Springer, 2008.
[77] D. Zhang, F. Xia, Z. Yang, L. Yao, and W. Zhao, �Localization technologies for
indoor human tracking,� in Future Information Technology (FutureTech), 2010 5th
International Conference on. IEEE, 2010, pp. 1�6.
[78] D. Arnitz, K. Witrisal, and U. Muehlmann, �Multifrequency continuous-wave radar
approach to ranging in passive uhf r�d,� Microwave Theory and Techniques, IEEE
Transactions on, vol. 57, no. 5, pp. 1398�1405, 2009.
[79] P.V. Nikitin, R. Martinez, S. Ramamurthy, H. Leland, G. Spiess, and K. Rao, �Phase
based spatial identi�cation of uhf r�d tags,� in RFID, 2010 IEEE International Con-
ference on. IEEE, 2010, pp. 102�109.
[80] Y. Zhao and J.R. Smith, �A battery-free r�d-based indoor acoustic localization plat-
form,� in RFID (RFID), 2013 IEEE International Conference on, 2013, pp. 110�117.
[81] A. Chattopadhyay and A.R. Harish, �Analysis of low range indoor location tracking
techniques using passive uhf r�d tags,� in Radio and Wireless Symposium, 2008 IEEE.
IEEE, 2008, pp. 351�354.
[82] R. Miesen, F. Kirsch, and M. Vossiek, �Holographic localization of passive uhf r�d
transponders,� in RFID (RFID), 2011 IEEE International Conference on. IEEE, 2011,
pp. 32�37.
[83] A.P. Sample, C. Macomber, L.T. Jiang, and J.R. Smith, �Optical localization of
passive uhf r�d tags with integrated leds,� in RFID (RFID), 2012 IEEE International
Conference on. IEEE, 2012, pp. 116�123.
[84] TOAS Inc., �Proximity Detection. Solutions for Emerging and Innovative Applica-
tions,� Available: http://www.taosinc.com [Jul. 6, 2013].
[85] J.R. Smith, K.P. Fishkin, B. Jiang, A. Mamishev, M. Philipose, A.D. Rea, S. Roy, and
K. Sundara-Rajan, �R�d-based techniques for human-activity detection,� Communi-
cations of the ACM, vol. 48, no. 9, pp. 39�44, 2005.

REFERENCES 111
[86] Bitmanufaktur GmbH Co., �OpenBeacon Active RFID Project,� Internet: http:
//www.openbeacon.org/ [April 1, 2012].
[87] Y. Lin, M. Su, S. Chen, S. Wang, C. Lin, and H. Chen, �A study of ubiquitous monitor
with r�d in an elderly nursing home,� inMultimedia and Ubiquitous Engineering, 2007.
MUE'07. International Conference on. IEEE, 2007, pp. 336�340.
[88] K. Partridge, L. Arnstein, G. Borriello, and T. Whitted, �Fast intrabody signaling,�
Demonstration at Wireless and Mobile Computer Systems and Applications (WM-
CSA), 2000.
[89] K. Hinckley and M. Sinclair, �Touch-sensing input devices,� in Proceedings of the
SIGCHI conference on human factors in computing systems. ACM, 1999, pp. 223�230.
[90] R. Want, A. Hopper, V. Falcão, and J. Gibbons, �The active badge location system,�
ACM Transactions on Information Systems (TOIS), vol. 10, no. 1, pp. 91�102, 1992.
[91] R. Want, B.N. Schilit, N.I. Adams, R. Gold, K. Petersen, D. Goldberg, J.R. Ellis, and
M. Weiser, �The parctab ubiquitous computing experiment,� in Mobile Computing,
pp. 45�101. Springer, 1996.
[92] A. Hills, �Wireless andrew [mobile computing for university campus],� Spectrum,
IEEE, vol. 36, no. 6, pp. 49�53, 1999.
[93] R. Want and D. Russell, �Ubiquitous Electronic Tagging,� IEEE Concurrency, pp.
1�6, July 2000.
[94] International Electrotechnical Commission, �(IEC) 60947-5-2,� Available: http://
www.iec.ch [Jul. 6, 2013].
[95] J. Aslam, Z. Butler, F. Constantin, V. Crespi, G. Cybenko, and D. Rus, �Tracking a
moving object with a binary sensor network,� in Proceedings of the 1st international
conference on Embedded networked sensor systems. ACM, 2003, pp. 150�161.
[96] M. Gorlatova, P. Kinget, I. Kymissis, D. Rubenstein, X. Wang, and G. Zussman,
�Energy harvesting active networked tags (enhants) for ubiquitous object networking,�
Wireless Communications, IEEE, vol. 17, no. 6, pp. 18�25, 2010.
[97] K.P. Fishkin, M. Philipose, and A. Rea, �Hands-on r�d: Wireless wearables for de-
tecting use of objects,� in Wearable Computers, 2005. Proceedings. Ninth IEEE Inter-
national Symposium on. IEEE, 2005, pp. 38�41.

REFERENCES 112
[98] S. Dominikus, M. Aigner, and S. Kraxberger, �Passive r�d technology for the in-
ternet of things,� in Internet Technology and Secured Transactions (ICITST), 2010
International Conference for. IEEE, 2010, pp. 1�8.
[99] M. Darianian and M.P. Michael, �Smart home mobile r�d-based internet-of-things sys-
tems and services,� in Advanced Computer Theory and Engineering, 2008. ICACTE'08.
International Conference on. IEEE, 2008, pp. 116�120.
[100] E. Welbourne, M. Balazinska, G. Borriello, and W. Brunette, �Challenges for pervasive
r�d-based infrastructures,� in Pervasive Computing and Communications Workshops,
2007. PerCom Workshops' 07. Fifth Annual IEEE International Conference on. IEEE,
2007, pp. 388�394.
[101] D. De Donno, F. Ricciato, L. Catarinucci, and L. Tarricone, �Design and applications
of a software-de�ned listener for uhf r�d systems,� in Microwave Symposium Digest
(MTT), 2011 IEEE MTT-S International. IEEE, 2011, pp. 1�4.
[102] E. Welbourne, L. Battle, G. Cole, K. Gould, K. Rector, S. Raymer, M. Balazinska,
and G. Borriello, �Building the internet of things using RFID: the RFID ecosystem
experience,� IEEE Internet Computing, vol. 13, no. 3, pp. 48�55, 2009.
[103] V. Liu, A. Parks, V. Talla, S. Gollakota, D. Wetherall, and J.R. Smith, �Ambient
backscatter: wireless communication out of thin air,� in Proceedings of the ACM
SIGCOMM 2013 conference on SIGCOMM. ACM, 2013, pp. 39�50.
[104] A. Nemmaluri, M.D. Corner, and P. Shenoy, �Sherlock: automatically locating objects
for humans,� in Proceedings of the 6th international conference on Mobile systems,
applications, and services. ACM, 2008, pp. 187�198.
[105] A. Athalye, V. Savic, M. Bolic, and P.M. Djuric, �Novel semi-passive r�d system for
indoor localization,� Sensors Journal, IEEE, vol. 13, no. 2, pp. 528�537, 2013.
[106] A. Borisenko, M. Bolic, and M. Rostamian, �Intercepting uhf r�d signals through syn-
chronous detection,� EURASIP Journal on Wireless Communications and Networking,
vol. 2013, no. 1, pp. 1�10, 2013.
[107] G. Avoine, �Privacy issues in r�d banknotes protection schemes.,� in CARDIS.
Springer, 2004, pp. 33�48.

REFERENCES 113
[108] P.M. Djuric and A. Athalye, �R�d system and method for localizing and tracking a
moving object with an r�d tag,� Oct. 12 2010, US Patent 7,812,719.
[109] V. Savic, A. Athalye, M. Bolic, and P.M. Djuric, �Particle �ltering for indoor r�d tag
tracking,� in Statistical Signal Processing Workshop (SSP), 2011 IEEE. IEEE, 2011,
pp. 193�196.
[110] H. Liu, M. Bolic, A. Nayak, and I. Stojmenovic, �Taxonomy and challenges of the
integration of r�d and wireless sensor networks,� Network, IEEE, vol. 22, no. 6, pp.
26�35, 2008.
[111] M. Philipose, K.P. Fishkin, M. Perkowitz, D.J. Patterson, D. Fox, H. Kautz, and
D. Hahnel, �Inferring activities from interactions with objects,� Pervasive Computing,
IEEE, vol. 3, no. 4, pp. 50�57, 2004.
[112] Y. Zhang, X. Li, and M.G. Amin, Principles and techniques of RFID positioning,
Wiley, 2010.
[113] H. Cremér, Mathematical Methods of Statistics (PMS-9), vol. 9, Princeton university
press, 1999.
[114] M. Knox, R. Bridgelall, M.W. Duron, R.T. Knadle Jr, and J.J. Bender, �Angle of
position object location system and method,� Jan. 30 2007, US Patent 7,170,412.
[115] Impinj, �Impinj R1000 Datasheet,� Available: http://www.impinj.com/Documents/
Reader/Speedway_User_Guide_3_2/ [Mar. 21, 2013].
[116] J. Wu, Three-Dimensional Indoor RFID Localization System, Ph.D. thesis, University
of Nebraska-Lincoln, 2012.
[117] D.M. Dobkin and S.M. Weigand, �Environmental e�ects on r�d tag antennas,� in
Microwave Symposium Digest, 2005 IEEE MTT-S International, June 2005, pp. 4
pp.�.
[118] G. Marrocco, �R�d antennas for the uhf remote monitoring of human subjects,� An-
tennas and Propagation, IEEE Transactions on, vol. 55, no. 6, pp. 1862�1870, 2007.
[119] EPCGlobal, �Low Level Reader Protocol,� Available: http://www.gs1.org/gsmp/
kc/epcglobal/llrp/llrp_1_1-standard-20101013.pdf [Mar. 8, 2010].
REFERENCES 114
[120] A. Vries and P. Dietrich, �Standards facilitate RFID adoption,� Available: http:
//rfdesign.com/mag/709RFDEf1.pdf [April 4, 2012].
[121] J. Blumenthal, R. Grossmann, F. Golatowski, and D. Timmermann, �Weighted cen-
troid localization in zigbee-based sensor networks,� in Intelligent Signal Processing,
2007. WISP 2007. IEEE International Symposium on. IEEE, 2007, pp. 1�6.
[122] R. Behnke and D. Timmermann, �Awcl: Adaptive weighted centroid localization as an
e�cient improvement of coarse grained localization,� in Positioning, Navigation and
Communication, 2008. WPNC 2008. 5th Workshop on. IEEE, 2008, pp. 243�250.