Embed Size (px)
Citation preview

Degree project inCommunication Systems
Second level, 30.0 HECStockholm, Sweden
J I E S U N
An analysis based upon traffic in an IP access network
Locality of Internet Traffic
K T H I n f o r m a t i o n a n d
C o m m u n i c a t i o n T e c h n o l o g y

Locality of Internet Traffic
An analysis based upon traffic
in an IP access network
Jie Sun
2012.12.12
Examinar: Gerald Q. Maguire Jr. Academic supervisor: Gerald Q. Maguire Jr.
Industrial Supervisor: Jonas Lindqvist, Acreo AB
School of Information and Communication Technology KTH Royal Institute of Technology
Stockholm, Sweden


i
Abstract
The rapid growth of Internet Traffic has emerged as a major issue due to the rapid development of various network applications and Internet services. One of the challenges facing Internet Service Providers (ISPs) is to optimize the performance of their networks in the face of continuously increasing amounts of IP traffic while guaranteeing some specific Quality of Services (QoS). Therefore it is necessary for ISPs to study the traffic patterns and user behaviors in different localities, to estimate the application usage trends, and thereby to come up with solutions that can effectively, efficiently, and economically support their users’ traffic.
The main objective of this thesis is to analyze and characterize traffic in a local multi-service residential IP network in Sweden (referred to in this report as “Network North”). The data about the amount of traffic was measured using a real-time traffic-monitoring tool from PacketLogic. Traffic from the monitored network to various destinations was captured and classified into 5 ring-wise locality levels in accordance with the traffic’s geographic destinations: traffic within Network North and traffic to the remainder of the North of Sweden, Sweden, Europe, and World.
Parameters such as traffic patterns (e.g., traffic volume distribution, application usage, and application popularity) and user behavior (e.g., usage habits, user interests, etc.) at different geographic localities were studied in this project. As a result of a systematic and in-depth measurement and the fact that the number of content servers at the World, Europe, and Sweden levels are quite large, we recommend that an intelligent content distribution system be positioned at Level 1 localities in order to reduce the amount of duplicate traffic in the network and thereby removing this traffic load from the core network.
The results of these measurements provide a temporal reference for ISPs of their present traffic and should allow them to better manage their network. However, due to certain circumstances the analysis was limited due to the set of available daily traffic traces. To provide a more trustworthy solution, a relatively longer-term, periodic, and seasonal traffic analysis could be done in the future based on the established measurement framework.
Key Words: Traffic Measurement, Geographical Locality, Traffic Pattern, User Behavior, Application Utilization.


iii
Sammanfattning
Den ökande tillväxten av Internet Trafik har blivit en viktig fråga med anledning av den snabba utvecklingen av olika internetbaserade applikationer och tjänster. En av utmaningarna för Internet leverantörerna är att optimera prestandan i sina nät inför de ständigt ökande datamängderna och samtidigt garantera kvalitet på tjänsterna (QoS). Därför är det nödvändigt för Internetleverantörer att studera trafikmönster och lokala differentierade användarbeteenden, för att uppskatta trender av nyttjande av internettjänster, och därmed komma med lösningar som effektivt och ekonomiskt stödja deras kunders trafik.
Det främsta syftet med denna avhandling är att analysera och karaktärisera internettrafiken i ett lokalt IP baserat multiservicenätverk i Sverige (i denna rapport avseende "Network North"). Uppgifterna om trafikmängden mättes i realtid med ett övervakningsverktyg från PacketLogic. Trafik till och från det övervakade nätverkets olika destinationer fångades upp och delades in i 5 cirkelliknande lokaliseringsnivåer i enlighet med geografiska trafikdestinationer: trafik inom nätverket North och till resten av norra Sverige, Sverige, Europa och världen.
Parametrar som trafikmönster (t.ex. distribuerad internettrafik mängd, användning av olika tjänster och applikationer med dess popularitet) och användarbeteenden (t.ex. användar-vanor och intressen, etc.) på olika geografiska lokaliseringsnivåer har studerades i inom projekt. Som ett resultat av de systematiska och djupgående internetmätningar med det faktum av det stora antalet existerande tjänsteinnehållsservrar som ofta finns placerad långt ifrån slutanvändaren, ute i världen eller i Europa som är ganska så många till antalet. Rekommenderar vi att ett intelligent tjänstedistributionssystem appliceras närmre slutanvändaren på en regional nivå, för att minska på dagens onödiga omfattande duplicerande internettrafik i nom stamnäteten.
Resultaten av dessa trafikmätningar av internettrafik ger en tidsmässig referens för Internetleverantörerna av deras nuvarande trafik och bör göra det möjligt för dem att bättre hantera sin nätverksinfrastruktur. Men på grund av vissa omständigheter begränsades mätanalysen på grund av möjliga och tillgängliga tidrammar att utföra dagliga trafikmätningsuppsättningen. För att ge en mer tillförlitlig lösning kan en på en längre sikt, periodisk och säsongsbunden trafikanalys göras i framtiden, baserat på den etablerade mätinfrastrukturen.
Nyckelord: Internet Trafik, Geografiska Trafikdestinationer, Trafikmönster, Användarbeteenden, Applikationer Popularitet

iv

v
Acknowledgements
First and foremost, I would like to express my sincere gratitude to my examiner and supervisor Prof. Gerald Q. Maguire Jr. for the valuable guidance which inspired me throughout the whole thesis work. Without his consistent, precise and illuminating feedbacks and suggestions, this thesis could not reach its present form. I cherished every comment from him which was vital for me to improve my work, and even the future study would ever been.
Furthermore, I would like to thank my industrial advisor Jonas Lindqvist for his
advices and sharing knowledge during this project work. I appreciate Central Baltic INTERREG IV A project CeBa testbed and IPNQSIS celtic initiative project for giving me the opportunity to do this project. I very much appreciate Andreas Aurelius and Jie Li for their kind help and arrangement in the data measurements. I also would like to express my special gratitude and thanks to Ziyi Xiong for her valuable comments that helped me improve the thesis.
In addition, I want to show my special appreciation to my parents. Thank you for always supporting behind me. I could not success without your understanding and encouragement.
Finally, I would like to thank all the people from Acreo and KTH who helped me
during the entire thesis project.
Jie Sun Stockholm
12th Dec 2012


vii
Table of Contents
Abstract ...................................................................................................... i
Sammanfattning ...................................................................................... iii
Acknowledgements ................................................................................... v
Table of Contents ................................................................................... vii
List of Figures .......................................................................................... ix
List of Tables ........................................................................................... xi
List of Acronyms and Abbreviations .................................................. xiii
1 Introduction ....................................................................................... 1
1.1 Overview .................................................................................................................... 1 1.2 Thesis Outline ............................................................................................................ 3 1.3 Reader ........................................................................................................................ 4
2 Background ........................................................................................ 5
2.1 Project Overview ........................................................................................................ 5 2.2 Internet Interconnections ............................................................................................ 8 2.3 Network Locality ....................................................................................................... 9 2.4 Power Laws .............................................................................................................. 10
3 Methodology .................................................................................... 13
3.1 Overview of Network ............................................................................................... 13 3.2 Measurement Tools .................................................................................................. 14
3.2.1 PacketLogic ..................................................................................................... 14 3.2.2 PacketLogic client ........................................................................................... 14 3.2.3 PacketLogic Python API ................................................................................. 14
3.3 Measurement Procedure ........................................................................................... 15 3.3.1 Rules Setting .................................................................................................... 15 3.3.2 Creating NetObjects ........................................................................................ 16 3.3.3 PacketLogic Statistics ...................................................................................... 16
3.4 Definition of the Localities’ Boundary .................................................................... 17 3.5 Categorys of Network Services ................................................................................ 18
4 Results and Analysis ....................................................................... 21
4.1 Traffic Statistics ....................................................................................................... 21
viii
4.2 Utilization by different applications ......................................................................... 23 4.2.1 P2P File Sharing .............................................................................................. 23 4.2.2 Media Streaming ............................................................................................. 25 4.2.3 Other Network Services .................................................................................. 26
4.3 Application Popularity ............................................................................................. 28 4.4 Daily Traffic Pattern ................................................................................................ 30 4.5 Network Traffic Locality ......................................................................................... 39
5 Conclusions and Future work ........................................................ 47
5.1 Conclusions .............................................................................................................. 47 5.2 Future work .............................................................................................................. 49 5.3 Required reflections ................................................................................................. 49
References ................................................................................................ 51

ix
List of Figures
Figure 1-1: Topology of Network Interconnections ....................................................................... 2 Figure 1-2: An Example of Peering ................................................................................................ 3 Figure 2-1: Peering of ISPs ............................................................................................................ 9 Figure 3-1: Architecture of Network North ................................................................................. 13 Figure 3-2: Setting up a PacketLogic Rule .................................................................................... 15 Figure 3-3: Examples of NetObjects in PacketLogic ..................................................................... 16 Figure 3-4: Example of a Connection Search for Connections Initiated within a Given Time
Interval .................................................................................................................. 17 Figure 4-1: Traffic Volume of Different Network Services per Day ............................................... 22 Figure 4-2: Uplink Traffic Volume of Media Streaming Servers in Network North per Day .......... 23 Figure 4-3: Top 5 P2P Applications in Downlink Traffic per Day ................................................... 24 Figure 4-4: Top 5 P2P Applications in Uplink Traffic per Day ....................................................... 24 Figure 4-5: Top 5 Media Streaming Applications in Terms of Downlink Traffic per Day ............... 25 Figure 4-6: Top 5 Media Streaming Applications in Terms of Uplink Traffic per Day .................... 26 Figure 4-7: Downlink Traffic Volume of Other Applications per Day ............................................ 27 Figure 4-8: Uplink Traffic Volume of Other Applications per Day ................................................ 27 Figure 4-9: Total Number of Connections of Different Types of Network Services per Day ......... 28 Figure 4-10: Total Number of Connections Observed of Different Applications per Day ............. 29 Figure 4-11: Network Application Popularity .............................................................................. 30 Figure 4-12: Network Traffic Volume per Half Hour on a Selected Weekday ............................... 31 Figure 4-13: Network Traffic Volume per Half Hour on a Selected Weekend Day ........................ 31 Figure 4-14: CDF of Time Duration per User in Use of BitTorrent Transfer on a Weekday ........... 32 Figure 4-15: CDF of Traffic Volume per User from 18:00 to 24:00 in a Workday .......................... 33 Figure 4-16: CDF of Network Connection Size on the Downlink .................................................. 34 Figure 4-17: CDF of Network Connection Size on The Uplink ...................................................... 35 Figure 4-18: CDF of Downlink Traffic Volume per Connection by Services .................................. 36 Figure 4-19: CDF of Uplink Traffic Volume per Connection by Services ....................................... 37 Figure 4-20: Traffic Ratio per Application during One Day........................................................... 38 Figure 4-21: Session Duration of Different Applications .............................................................. 39 Figure 4-22: Network Traffic to and from Different Localities ..................................................... 40 Figure 4-23: Network traffic to and from Different Localities as a Function of Time ................... 41 Figure 4-24: Downlink Traffic by Service and Locality Level ......................................................... 42 Figure 4-25: Uplink Traffic by Service and Locality Level ............................................................. 42 Figure 4-26: Network North Connections in Different Localities ................................................. 43 Figure 4-27: Average Connection Size Generated at Different Locality Levels ............................. 43 Figure 4-28: Traffic Volume Generated with Number of Host Servers at Different Locality
Levels ..................................................................................................................... 45


xi
List of Tables
Table 2-1. Previous theses conclusion ........................................................................................... 6 Table 3-1: Locality Levels ............................................................................................................ 17 Table 3-2: Category of network applications and protocols ........................................................ 18 Table 4-1: Overview of the packet traces .................................................................................... 21 Table 4-2: Services traffic statistics ............................................................................................. 21 Table 4-3: Total traffic statistics ................................................................................................... 40


xiii
List of Acronyms and Abbreviations
API Application Programming Interface AS Autonomous Systems DHT Distributed Hash Table DRDL Datastream Recognition Definition Language ISP Internet Service Provider IX Internet Exchange KB Kilobytes LAN Local Area Network OPEX OperatingExpense PRE PacketLogic Real-Time Enforcement platform PSM PacketLogic’s Subscriber Manager P2P Peer-to-Peer QoE Quality of Experience QoS Quality of Service


1
1 Introduction
This chapter first gives an overview of the growth in global IP traffic. Then the Internet traffic management system is introduced and the problems to be solved are described. Solutions to these problems will be covered in the remainder of this thesis.
1.1 Overview
Internet traffic has been constantly increasing with the revolutionary developments in communication networks and applications. Global IP traffic is predicted to increase threefold over the next 5 years in Cisco’s report on global IP traffic forecast for 2011–2016 [1]. The diversified development of communication methods has not only increased demand for Internet access, but also brought heavier network traffic loads. As revealed in [1], most IP traffic originating with PC devices has a tendency to continue to generate increasing traffic loads, meanwhile the traffic generating by non-PC devices would will double in the next few years.
The greatly increased user demands have caused the Internet to successfully evolve into a mainstream market from an esoteric niche. The Internet service providers (ISPs), on one hand, have realized the business opportunities and rapidly developed a wide variety of network applications and Internet services, which in turn brought in considerable revenue while generating increasing traffic loads. On the other hand, ISPs are obsessed with the traffic stress associated with offering various services. Therefore, there is a need to consider potential network management solutions.
The question of how to avoid traffic bottlenecks is obsessing ISPs all of the time. An efficient method to address network traffic issue is to monitor the network performance based upon real time continuous data collection, and by understanding the network traffic patterns to propose effective and economical solutions to support the expected traffic.
ISPs connect end users to the Internet. Additionally, these ISPs exchange traffic with other ISPs so that the users connected to different ISPs can communicate with each other. This is called interconnection [2]. The growing amount of network traffic transiting the Internet has required tremendous expenditures by ISPs. However, the ISPs want to minimize the cost of operating their business.
A common way to reduce the network traffic and cost for ISPs is to use peering between two or among several ISPs[3]. Figure 1-1 shows the basic topology of these network interconnections, in which transiting and peering are the two main functions.
Transiting is a simple service that forward packets from one user to the upstream ISP, and the upstream ISP decides where these packets should be forwarded based upon entries in its routing table. ISPs need to defray certain expenses to obtain access to the upstream ISP’s routing[4]. When two service providers have nearly same

2
network scale, cost, and traffic volumes, it is unnecessary for each of them to pay a transit fee in both directions, as they would be paying each other equal amounts of money. In this case the service providers will implement a peering solution.
Local ISP
National ISP
Local ISPLocal ISP
Local ISP
Regional ISP
Regional ISPRegional ISP
National ISPPeering
Transit
Figure 1-1: Topology of Network Interconnections
Peering technology reduces unnecessary access fees and the stress caused by high traffic volume in the core of the network. Peering enables direct mutual connectivity for end users of the peered ISPs without sending routing information about this peering to their upstream ISPs[4]. Peering also reduces traffic latency from a user connected to one ISP when communicating with a user connected to another peer ISP[5][6]. As one can see in Figure 1-2, ISP-A peers with ISP-B, hence the traffic is exchanged directly between them rather than forwarding traffic to transit through ISP-C. Consequently, a suitable peering link not only lowers the operating expense (OPEX) for ISPs, but also benefits the end users by providing better services (e.g. lower delays, faster response times, etc.). A better understanding of the Internet traffic pattern within different geographic locations can assist the ISPs when making decisions about whether it is necessary to peer with other specific ISPs, as the ISP can consider which networks to peer with in order to achieve the best performance at the lowest OPEX[7].

3
Figure 1-2: An Example of Peering
This master’s thesis project aims to analyze the Internet traffic in IP access networks. The traffic patterns and user behavior were the main focus in this research. The scope of this project is limited to traffic observed within a residential network in Sweden. The study examined the general traffic patterns in a residential network in Sweden and how this traffic is related to destinations in other networks of increasing geographic coverage area. The motivation was to set up a measurement framework for effectively and systematically monitoring live Internet traffic at different levels of network locality. The traffic patterns and user behaviors in different levels of localities were abstracted in order to provide a reference for ISPs of how they might deploy their own content servers, peering links, etc.
1.2 Thesis Outline
The thesis consists of five chapters. The first chapter is the introduction which briefly introduces the basic concepts of traffic monitoring and analysis, the concept of traffic exchanges, and the questions to be addressed. Specifically, the need for interconnection of networks is introduced in this chapter. Chapter two presents related work and background information relevant to this thesis project, including previous works in the area, related technologies, traffic measurements, and an empirical power law. The methodology used in the measurements is described in chapter three. This chapter also introduces the tools and methods used for data capture and monitoring, processing, and analysis. In the fourth chapter, the analysis that was performed is presented and the obtained results are interpreted in detail. The thesis project’s results are given as conclusions in the fifth chapter, along with a discussion of possible future work.

4
1.3 Reader
This master thesis project focuses on analyzing traffic within an open-access residential network in Sweden. The research has involved developing tools for monitoring the QoS of network services and modeling users’ behavior. We assume that the reader is familiar with the Internet and network traffic engineering; or that the reader has a general interest in network management and traffic measurements. Some background knowledge about network traffic measurement and the tools used are given in the next chapter, in order to facilitate the readers’ better understanding of this research.

5
2 Background
This chapter provides the reader with background information in order to better understanding thesis project. It begins by introducing relevant studies in the field of Internet traffic measurement. Section 2.2 introduces the details of Internet interconnections. As the aim of this project is to better understand traffic locality, the concept of a locality-aware network will be introduced in section 2.3. Following this, some related studies in the field of ISPs peering are discussed and an algorithm is presented which quantifies the benefits of traffic locality and peering.
2.1 Project Overview
Internet usage is developing every day, from simply web browsing usage to multi-application services. Identifying and monitoring Internet usage in detail can assist network operators in designing methods to improve their delivery of services. Traffic patterns and applications have been widely investigated by service providers. The Traffic Measurements and Models in Multiservice Networks (TRAMMS) project aims to model and analyze the characteristics of the traffic in multi-service IP networks in different parts of Europe[8]. TRAMMS provides both a hardware and software framework for investigating and measuring network traffic in order to obtain significant insight into this network traffic, perform bottleneck analysis, and to deliver the desired network QoS[8]. Furthermore, TRAMMS has also studied network user behavior in order to optimize broadband deployment in access networks and to improve the network QoS which operators provide[8]. IP Network Monitoring for Quality of Service Intelligent Support (IPNQSIS) is a successful subproject within the TRAMMS project. The main objective of IPNQSIS is monitoring and studying network users’ experience through analysis of network traffic and service performance[9]. This master’s thesis project focuses on monitoring local network traffic and to model users’ behavior in order to create a monitoring component for a Customer Experience Management System (CEMS) [9].
The concept of Quality of Experience (QoE) is a new term which extends the concept of QoS to reflect the quality of network service as experience by the customer [10]. On one hand, QoE depends on the subjective experience of customers which involves the evaluation of the QoS provided by service providers and the quality of resources which they utilize. On the other hand, QoE quantifies the difference between the delivered quality of network service and customers’ expectations. User experience, as it is the most essential criterion of QoE, is becoming more important for service providers to estimate in their network. Since every network service will ultimately be delivered to customers, assessing user experience is a more accurate estimate of QoE than is a simple assessment of QoS. In order to correctly manage QoE, a common management framework was established for the QoE measurements of end users, some criteria (based upon Service Level Agreements (SLA), Customer Experience Management Index (CEMI), etc.) were established to define and estimate

6
the expectations regarding service quality, priorities, and responsibilities among several parties [11][12]. Different Application Programming Interfaces (APIs) and collection metrics were created to provide measurements of QoE [13].
This master’s thesis project analyzed live traffic in an IP access network. By studying the data collected we have gained knowledge about the general characteristics of network traffic patterns and analyzed user behavior by performing statistical computations on the network traffic in order to assess the actual quality of the users’ experience. From this data analysis we identify the traffic within the different levels of network locality. The goal is to expand these results to characterize the traffic’s locality. This thesis project builds upon the earlier theses[14]–[19]. The results of these earlier theses are summarized in Table 2-1.
Table 2-1. Previous theses conclusion
Earlier Theses
Project Conclusions
[14][15] Measuring & Modeling HTTP Media Stream In IP-Networks This research was based on two Swedish networks, Network 1 with 173 households and Network 2 with ~2800 private customers (of these ~2600 customers video streaming could be analyzed).
• The relative activity was 23% for Network 1 and 31-35% for Network 2 according to the customers’ IP addresses.
• In terms of traffic intensity, the primetime for user activity was between 17:00 and 22:00.
• The ratio of usage of HTTP media stream by different customers was skewed with 10% hosts responsible for about 50% of the number of connections and traffic volume.
• More than 40% of the active hosts visited the YouTube website. Less than 5% of active hosts accessed the examined internet radio sites.
7
[16][17] Traffic Measurements and Analysis in Fixed and Mobile Broadband Access Networks The research was based on 3 Swedish access networks: Network 1 used digital subscriber line (DSL) technology, Network 2 used fiber-to-the-home (FTTH) technology, and Network 3 was a radio network which used high speed packet access (HSPA) for 20 customers.
• More than 85% households connected through FTTH had used BitTorrent at some point during a month
• FTTH households had a higher outbound data rate than inbound
• The top 10% bandwidth households in the FTTH network had more than 4.3 GB every day in outbound traffic.
• In the case of DSL, the amount of transferred data each day was more than 2 GB for the top 10% bandwidth households.
[18] Internet Traffic Analysis • P2P file sharing was the majority of the traffic generated. The outbound traffic volume from P2P file sharing was about 97% of the total traffic during the week of 2007 that was analyzed.
• Peak traffic occurred between 19:00 and 21:00.
• The daily traffic pattern during 2007 was more symmetric than in 2009, which could be seen as a result of P2P becoming more popular.
• The amount of streaming media increased very fast from 2007 to 2009. Inbound traffic from streaming media was only 4.1% of the total traffic in 2007, but increased to 22% in 2009. Spotify was one of the factors in the growth in the amount of streaming media based on P2P technology.
• Four games were analyzed: Second Life, World of Warcraft, Counter Strike, and Warcraft III, but they generated very little outbound traffic.

8
2.2 Internet Interconnections
The Internet is made up of ISPs and the customers. Different ISPs have different scale, e.g. local ISPs have local area coverage, regional ISPs provide connectivity for regional customers, etc. Naturally, ISPs interconnect with each other according to their business model [20]. In the first chapter we showed that the adoption of peering by ISPs was done to reduce the ISP’s OPEX and to allow their customers to reach the entire Internet. The concept of peering was initially motivated based on the irrelevance of fees for traffic exchanged between two ISPs with roughly equivalent
[19] Residential Network Traffic and User Behavior Analysis
• Outgoing traffic (the uplink from households) exceeded the amount of incoming traffic (downlink to the households).
• The Weibull distribution model better described the incoming traffic, while the Pareto distribution better described the outgoing traffic.
• For inbound traffic, P2P accounted for roughly half of the traffic. Media streaming accounted for 18% of this traffic. Web browsing accounted for 11.1% of all traffic., while Instant Messaging and online gaming comprised 0.7% and 0.8% of the traffic respectively.
• For outbound traffic, P2P accounted for 73.6% of the outbound traffic, which dominated the overall application traffic.
• BitTorrent was the dominant application and accounted for 90% of the P2P file sharing traffic. Flash over HTTP was responsible for ~50% of the incoming media streaming traffic. P2P accounted for the majority of outgoing streaming traffic.
• Outbound traffic volumes followed the subscriber's maximum data rates.

9
business scales. By exchanging routes to customers directly with each other ISPs these ISPs kept the traffic local to their networks (providing traffic optimization) and their avoided the need to pay access fees to their upstream ISPs. However, there is still a cost for peering. In [21], Norton describes three monthly recurring costs for Internet peering which most of these payment were charged by an Internet Exchange (IX).
The growth of IXs can provide ISPs better peering. As Figure 2-1 shows, with one peering connection established between ISPs, the ISPs need to pay for this local circuit. This cost can be greatly reduced when there are several ISPs involved in the peering. One solution is to instantiate an IX at the peering point, thus the IX connect multiple ISPs and charges for them for this service. The IX offers a peering service to these ISPs and collect a ‘maintenance fee’ from these ISPs. However, the ISPs reduce their expense of connecting to the Internet and the transit traffic to the other ISPs is reduced, even the traffic to their upstream ISPs, given their IX facilities payment. Consequently, the deployment of Internet peering is closely related to the profit of ISPs. As a result there has been quite a lot of research on peering arrangements and Internet traffic pricing. The factors which influence the Internet peering market include. the level of commitment, transit price, peering costs, and so on[22]. Additionally, peering of ISPs also reduces the latency for local traffic. Some researches on peering and latency has examined online gaming, TCP streaming, etc.[23]–[25].
Figure 2-1: Peering of ISPs
2.3 Network Locality
The Internet has made the world smaller and virtually brought people closer together. However, the Internet has regional characteristics. Sandvine’s Global Internet Phenomena Report: 2H 2012 revealed that, Asia is the world leader in mobile traffic consumption, with an average monthly usage of 659 MB. In Europe, YouTube represents more than 20% of the downstream traffic in mobile networks. BitTorrent traffic continues to decline and is currently only 10% of North American and 15% of European traffic[26]. All of these statistics indicate that, the Internet has the different

10
characteristics in different geographic regions. In [27], long distance data transmission was traced, paths that traverse a wide area in multiple ISP networks were studied and analyzed to examine network properties from a geographic perspective. There were also a number of experiments with results show that the topology of autonomous systems (AS) can affect Internet traffic properties[28].
Unlike this previous research on how geographic factor impacts the Internet traffic or traffic transit costs, this master’s thesis project calculates the traffic volumes in different geography areas in a test network. In the next chapter, these geography areas are defined in terms of different levels of locality.
2.4 Power Laws
Power laws are used to describe a wide range of phenomena in nature. They are mainly used in the fields such as computer science, physics, economics, etc. A power law is characterized by a slow decay in probability of occurrence, which means that large events occur with a negligible probability and small events occur frequently. Power laws can be used to describe a variety of trends, such as the distribution of income, citations of scientific papers, word frequencies, etc. In the Internet, extensive research indicates that Internet and its attributes following power laws[29]–[31].
Zipf's law is one of the power laws that is frequently cited and studied. George Kingsley Zipf, an American linguist, observed the frequency of the words used in a language and text fit a distribution know known as Zipf’s law. Zipf’s law can also be used in explain this phenomena in other fields. Zipf’s law states that there is a set of events where the frequency f of occurrence of an event relative to its rank r has the following relationship: a/
Where a and b are constants and b is close to 1. The frequency f of an event is inversely proportional to its rank, which indicates the most popular event. If b=1, then the distribution exactly following Zipf law. Zipf’s law is normally plotted by using a log-log graph as the plot will be a line. If we take the logarithm of both sides of the equation, we obtain: log log a b ∗ log
The log function can be to any base, such as e or 10. Thus a distribution that follows Zipf's law will be a straight line with slope close to -1 in a log-log plot.
Pareto’s law is another power law frequently used in network traffic analysis, which aims to answer what many percentage of events occur more or less frequently than x. Pareto's law is normally written in terms of a cumulative distribution function (CDF), i.e. the probability that X is greater than x is an inverse power of x: ~

11
A power law distribution tells us the probability that an event occurs for an exact value x. It is simply the probability distribution function (PDF) associated with the CDF given by Pareto's Law. This means that: ~
All these three power laws will be used for the network traffic analysis in this thesis project and the results will be presented in Chapter 4.


13
3 Methodology
This chapter first describes the network where the measurement data was collected. The tools used for data capture, processing, and analysis will be presented in section 3.2. The measurement procedures will be introduced in section 3.3. After that, the definition of the boundary between two localities will be defined. Finally the different protocols will be categorized in section 3.5.
3.1 Overview of Network
The network used for our measurement was a municipal IP access network in Sweden connecting roughly 5000 households. For privacy reasons, this network is simply referred to as “Network North”. This network offers different services to those whom are connected to it, such as broadband Internet access and IPTV service. This specific open access residential network is fiber based, and the residents can freely choose from the different services that are offered by the different ISPs.
Figure 3-1 shows the architecture of Network North. The residential access networks are aggregated at the point where the ISPs connect to the Internet. The measurement equipment is deployed at this point. The aggregation network was realized through several Layer 2 switches based on ring and star topologies. With Layer 2 switches, all traffic from one local residential network will be only forwarded to the upstream router. As a result of the deployment and configuration, the measurements of the network traffic can be collected completely. Additionally, the traffic data was stored in a database and processed independently, so that the network traffic is not affected by collecting measurements.
Figure 3-1: Architecture of Network North

14
3.2 Measurement Tools
The data processing has two parts: data collection and analysis. This section introduces the equipment and software that used for processing the traffic data.
3.2.1 PacketLogic PacketLogic is an intelligent network solution from Procera Networks [32]. The
specific version of this equipment used in the test network is the PacketLogic Real-Time Enforcement platform (PRE). PRE can be configured to work as a router and a firewall. The product has been designed for use in an enterprise network or in an ISP’s access network. PacketLogic’s Subscriber Manager (PSM) integrates a PacketLogic device with other systems that provide authentication, authorization, and account (AAA); provisioning; and policy management. The main functions of PSM are to collect information from network devices, collection location information, to collect data about application and service protocols, and to collect network traffic statistics for a specified period of time, for example, a day, a week, a special extended period, and so on[33]. PSM provides both live traffic monitoring and recording of detailed information for subsequent analysis.
3.2.2 PacketLogic client The PacketLogic client is a graphical interface used by PacketLogic’s customers
to monitor and operate PacketLogic devices[34]. Customers can log into a particular PacketLogic system and manage the associated network. The PacketLogic client is connected to the PRE and can provide both graphical and textual information in detail. One of the main features of the PacketLogic client is that it allows users to set their own rules for filtering data. Shaping rules and the statistics rules are two of the main types of filtering rules used in the PacketLogic client. The PacketLogic client database is able to distinguish traffic based on different applications and protocols, for example, Skype, a YouTube stream, HTTP stream, and BitTorrent. However, when using the PacketLogic client alone it is not possible to perform more advanced processing. However, the PacketLogic Python API can used to extract this additional information for further analysis [34].
3.2.3 PacketLogic Python API The PacketLogic Python API is a software tool provided by Procera Networks that
can be used to collect data from the PacketLogic system by writing Python programs. Python is a modern object-oriented programming language. It is an open source tool and it is easy to learn to use this programming language and its large number of libraries. The PacketLogic Python API provides some small scripts to configure and collect data from the PacketLogic system. A main advantage of using the PacketLogic Python API is that python scripts can be used in different programming environments without any changes.
In this thesis project, the data traffic data is monitored by PRE and collected by a PacketLogic server. This data will subsequently be filtered and processed by the PacketLogic client side using a python script.

15
3.3 Measurement Procedure
In this section, a brief introduction of the measurement procedures will be presented, e.g. creating the monitoring objects, setting up data collection rules, enabling statistics objects, etc.
3.3.1 Rules Setting After the objects are created, something needs to operate upon these objects. One
method for doing this is to define a rule. Different rules can have different conditions. A condition can evaluate a function on different objects. In a rule setting, the condition that objects are ‘equal’ means that the condition will accept all connections/packets/… which match the specified objects. When the objects are ‘not equal’ the condition will filter out all connections that do not match these specific objects.
Figure 3-2 is an example of setting up a rule. In the figure, a new rule is to be created. In the right hand side window, there are several configurations, for example, object types, operator conditions, and sub-objects. These can be selected according to the desired measurements.
Figure 3-2: Setting up a PacketLogic Rule

16
3.3.2 Creating NetObjects
Figure 3-2 shows an example of NetObject in PacketLogic. These objects can be subnetworks, a device with a specific IP address, collections of nodes, etc.
Figure 3-3: Examples of NetObjects in PacketLogic
3.3.3 PacketLogic Statistics
PacketLogic Statistics is a PacketLogic module which can store data and help the network administrator to view and manage traffic data. The statistics module is operated through Statistics rules and StatisticsObjects. A StatisticsObjects is an object used for controlling statistical functions. This control enables the traffic data to be presented in the real-time reports, e.g. a line chart presenting traffic trends, a bar chart shows the traffic volume in the network, a pie chart for monitoring the proportion of traffic generated by different applications, etc. All of these types of results may be valuable for the network operators as they try to manage their network.
In the Statistics module, a connection log is a function used to keep track of the traffic that matches some specific criteria. The search for specific traffic is realized by a Connection Search function. For example, with this search function we can determine who connects to a certain host at a specific time. The connection search function returns the details of the requested connection(s). For example, we can search based upon hosts’ IP addresses, connection start time and end time, occurrences of specific protocols and services, etc.
Figure 3-4 is an example of the connections matching a specific start time criterion in the connection search. Using the Connection Log introduced above, there are some advantages of using connection search. For example, connections are easily presented in detail and it is easy to manage and control these connections. On the other hand, connection search has some limitation. For example, the maximum number of connection results that can be displayed following a connection search is 100,000 connections. Unfortunately, this is major limitation of the connection search function when used for a large network or when data has been collect for a long time.

17
Figure 3-4: Example of a Connection Search for Connections Initiated
within a Given Time Interval
3.4 Definition of the Localities’ Boundary
In this thesis project, the boundaries between different locality levels were defined in terms of geography in order to gain better understanding of the network traffic characters in these different localities. The locality levels that were defined are shown in Table 3-1. A comparison of the network traffic volume of different levels will be analyzed in the following chapter.
Table 3-1: Locality Levels
Locality Level Definition Level 1: Area Network traffic within the Network North Level 2: Region (rest) Network traffic from/to Level 1 to/from rest parts in
North of Sweden Level 3: Country (rest) Network Traffic from/to Level 1 to/from rest parts of
Sweden Level 4: Continent (rest) Network Traffic from/to Level 1 to/from rest countries in
Europe Level 5: World (rest) Network Traffic from/to Level 1 to/from rest countries
of the World
In order to obtain the geographic scope for each connection in the network traffic, the IP addresses of the hosts were mapped to their corresponding countries and geographic coordinates by using MaxMind: GeoLiteCity[35]. This is a public database providing the geographic coordinates of devices based upon IP addresses with an accuracy of 99.8% on a country level and 90% on a state level[36]. The GeoLiteCity API is language friendly and works well with our python scripts.

18
In addition to the country and city information we obtained from GeoLiteCity, the geographic coordinates of the hosts’ IP addresses are used to distinguish the northern part of Sweden. In this project, the latitude of Gävle (60°40'N), a city approximately 175 km north of Stockholm, was selected as the latitude of the boundary between the north and south of Sweden [37].
3.5 Categorys of Network Services
As introduced previously, the PacketLogic hardware and software can be used for traffic load collecting, filtering, and statistical analysis. This system classifies the network traffic based upon flow characteristics, for example, the traffic signatures of applications and protocols, such as BitTorrent transfers, HTTP media streaming, HTTP downloads, etc. Table 3-2 classifies the different applications and protocols into different network services. The traffic measurements of the various network services were based on this table.
Table 3-2: Category of network applications and protocols
P2P File sharing BitTorrent KRPC uTP BitTorrent transfer BitTorrent encrypted transfer BitTorrent tracker Gnutella discovery eDonkey eDonkey encrypted Thunder Thunder UDP
Media Streaming Flash video over HTTP HTTP media stream RTMP SHOUTcast RTMPE Spotify Funshion RTSP media stream PPStream SIP RTCP RTCP iTunes Store RTMPT PPFilm
19
Flash Kugoo SinaTV FastTV
Web Browsing HTTP HTTP download Google Earth Google Safe Browsing Xbox Live server browser Battle net Web Client Blizzard web client WebDAV WebSocket Java Web Start
Other Services (Main)
SSL v2 SSL v3 Unknown Teredo Open VPN DNS IP protocol 50 (ESP) Raw file transfer IP protocol 41 (IPv6) Direct Connect transfer SSH


21
4 Results and Analysis
In this chapter, the data collect concerning Network North is presented and statistically analyzed. First, the statistics of network traffic are briefly summarized in section 4.1 in order to give reader an overview of the major characteristics that were observed. Section 4.2 described that traffic observed from different applications. By analyzing the traffic of different applications and services we are able to describe the popularity of these applications and services in section 4.3. The daily traffic pattern is described in section 4.4. By analyzing the network traffic localities, the traffic volume in different locality levels will be presented in section 4.5.
4.1 Traffic Statistics
In this project, the Internet traffic that originated to/from different devices in Network North was analyzed. As the collected datasets were too large to be fully analyzed, two of the datasets were randomly selected and analyzed on a half-hour basis. Table 4-1 describes these two data sets, with their start and end time of collection, duration, and dataset size. Both datasets were stored as text files. As can be seen, the two datasets were collected on two separate full days (i.e. 24 hours for each dataset). Looking at the collected data, 7827 unique client IP addresses are counted and used in the measurements. The average traffic volume for each day was 11.3 TB in downlink and roughly 17.1 TB in uplink directions (see Table 4-2). These two datasets were combined for the purposes of analysis in this thesis project. A total of 552 Internet services and network protocols were found in the traffic transmitted during the two data collection periods.
Table 4-1: Overview of the packet traces
Name Start time End time Duration Size SEP06 2012-09-06
10:30am 2012-09-07
10:30am 24 h >70 GB
SEP09 2012-09-09 00:00am
2012-09-09 24:00pm
24 h >70 GB
Table 4-2: Services traffic statistics
P2P Media Streaming Web Browsing Other Total Downlink 40% 25% 14% 21% 11.3 TB
Uplink 76% 2% 2% 20% 17.1 TB
22
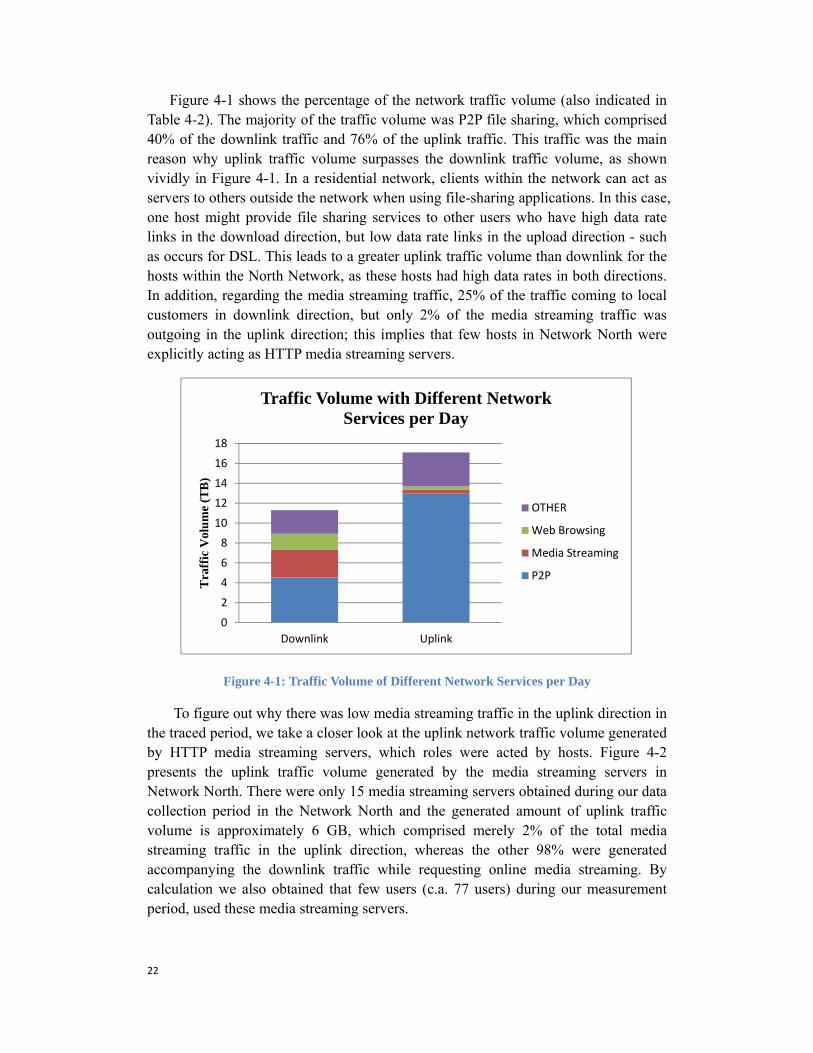
Figure 4-1 shows the percentage of the network traffic volume (also indicated in Table 4-2). The majority of the traffic volume was P2P file sharing, which comprised 40% of the downlink traffic and 76% of the uplink traffic. This traffic was the main reason why uplink traffic volume surpasses the downlink traffic volume, as shown vividly in Figure 4-1. In a residential network, clients within the network can act as servers to others outside the network when using file-sharing applications. In this case, one host might provide file sharing services to other users who have high data rate links in the download direction, but low data rate links in the upload direction - such as occurs for DSL. This leads to a greater uplink traffic volume than downlink for the hosts within the North Network, as these hosts had high data rates in both directions. In addition, regarding the media streaming traffic, 25% of the traffic coming to local customers in downlink direction, but only 2% of the media streaming traffic was outgoing in the uplink direction; this implies that few hosts in Network North were explicitly acting as HTTP media streaming servers.
Figure 4-1: Traffic Volume of Different Network Services per Day
To figure out why there was low media streaming traffic in the uplink direction in the traced period, we take a closer look at the uplink network traffic volume generated by HTTP media streaming servers, which roles were acted by hosts. Figure 4-2 presents the uplink traffic volume generated by the media streaming servers in Network North. There were only 15 media streaming servers obtained during our data collection period in the Network North and the generated amount of uplink traffic volume is approximately 6 GB, which comprised merely 2% of the total media streaming traffic in the uplink direction, whereas the other 98% were generated accompanying the downlink traffic while requesting online media streaming. By calculation we also obtained that few users (c.a. 77 users) during our measurement period, used these media streaming servers.
0
246
810
121416
18
Downlink Uplink
Tra
ffic
Vol
ume
(TB
)
Traffic Volume with Different Network Services per Day
OTHER
Web Browsing
Media Streaming
P2P

23
Figure 4-2: Uplink Traffic Volume of Media Streaming Servers in Network North per Day
4.2 Utilization by different applications
In the previous section, the total traffic volume generated from different network services was presented. In this section we take a closer look at the traffic volume of various Internet applications via different network services. In our case, Procera’s Datastream Recognition Definition Language (DRDL) is used to identify application protocols, with more than 2000 application protocols recognized[38]. For example, BitTorrent is a P2P file sharing protocol used for distributing large amounts of data, its traffic will be identified as BitTorrent KRPC (the BitTorrent distributed hash table protocol), BitTorrent transfer, BitTorrent encrypted transfer protocols, and so on.
4.2.1 P2P File Sharing
First of all, we examined P2P file sharing services. Figure 4-3 and Figure 4-4 present the top 5 application protocols that generated the most downlink traffic and the most uplink traffic, respectively. BitTorrent KRPC is roughly 50% of both the downlink and uplink traffic, and is the main source for the volume of P2P traffic. BitTorrent KRPC is a protocol implementing Mainline DHT in a custom RPC protocol[39]. It is used in BitTorrent for peer seeking and distribution. It is compact because it uses B-encoded dictionaries, thus is widely used in BitTorrent. However, it can generate a large proportion of the traffic. This suggests that having a relatively stable DHT could reduce the amount of traffic required to maintain the DHT, hence reduce so of the BitTorrent KRPC traffic.
0
0.5
1
1.5
2
2.5
3
1 2 3 4 5 6 7 8 9 10 11 12 13 14 15
Traf
fic V
olum
e (G
B)
Media Streaming Server
Uplink Traffic Volume of Media Streaming Servers in Network North per Day
Uplink Traffic

24
Figure 4-3: Top 5 P2P Applications in Downlink Traffic per Day
Figure 4-4: Top 5 P2P Applications in Uplink Traffic per Day
0 500 1000 1500 2000 2500
eDonkey encrypted
BitTorrent encrypted transfer
BitTorrent transfer
uTP
BitTorrent KRPC
Traffic Volume (GB)
TOP 5 P2P Applications in Downlink Trafffic per Day
Downlink
0 1000 2000 3000 4000 5000 6000 7000
eDonkey encrypted
BitTorrent encrypted transfer
uTP
BitTorrent transfer
BitTorrent KRPC
Traffic Volume (GB)
TOP 5 P2P Applications in Uplink Trafffic per Day
Uplink

25
4.2.2 Media Streaming
Figure 4-5 shows that HTTP media streaming was the top most media streaming protocol and generated approximately 45% of the downlink traffic of different media streaming protocols. Flash video over HTTP was the second highest volume media streaming protocol and it accounted for 40% of the downlink media streaming traffic.
Figure 4-5: Top 5 Media Streaming Applications in Terms of Downlink Traffic per Day
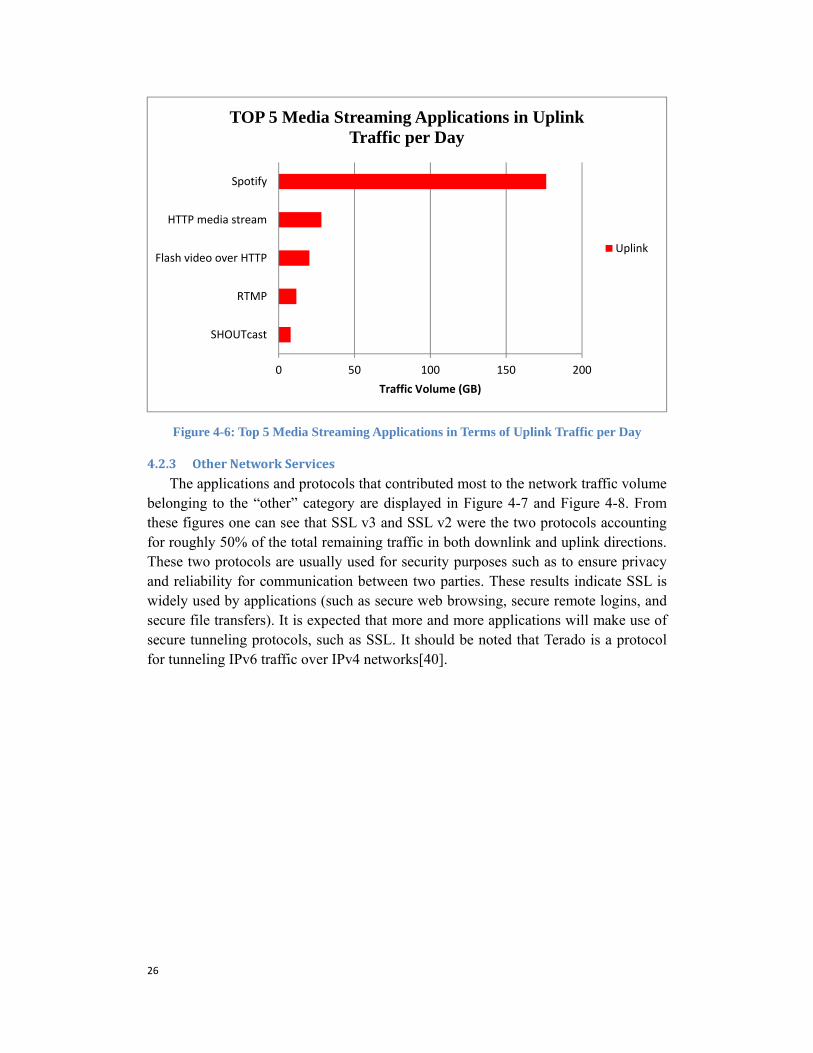
Figure 4-6 shows that in comparison to the downlink traffic, that media streaming applications generated a much smaller volume of uplink traffic than downlink traffic. Among these protocols Spotify generated most of the uplink traffic, generating approximately 75% of this uplink traffic. Spotify is a P2P based streaming application. Each Spotify client can act as a server to streaming to its peers; this is why Sportify generated such a high amount of uplink traffic. Note that Spotify generates approximately as much uplink as downlink traffic because the client application will try to get data from a peer rather than the central Spotify servers if there is a peer which has this data. A small amount of download traffic represents the data needed to seed content into the Spotify peers. Some HTTP streaming applications can be found in the list of uplink traffic generators, such as Flash video over HTTP and HTTP media stream, as both contribute to the uplink traffic at a certain level.
0 200 400 600 800 1000 1200
SHOUTcast
Spotify
RTMP
Flash video over HTTP
HTTP media stream
Traffic Volume (GB)
TOP 5 Media Streaming Applications in Downlink Traffic per Day
Downlink
26
Figure 4-6: Top 5 Media Streaming Applications in Terms of Uplink Traffic per Day
4.2.3 Other Network Services The applications and protocols that contributed most to the network traffic volume
belonging to the “other” category are displayed in Figure 4-7 and Figure 4-8. From these figures one can see that SSL v3 and SSL v2 were the two protocols accounting for roughly 50% of the total remaining traffic in both downlink and uplink directions. These two protocols are usually used for security purposes such as to ensure privacy and reliability for communication between two parties. These results indicate SSL is widely used by applications (such as secure web browsing, secure remote logins, and secure file transfers). It is expected that more and more applications will make use of secure tunneling protocols, such as SSL. It should be noted that Terado is a protocol for tunneling IPv6 traffic over IPv4 networks[40].
0 50 100 150 200
SHOUTcast
RTMP
Flash video over HTTP
HTTP media stream
Spotify
Traffic Volume (GB)
TOP 5 Media Streaming Applications in Uplink Traffic per Day
Uplink

27
Figure 4-7: Downlink Traffic Volume of Other Applications per Day
Figure 4-8: Uplink Traffic Volume of Other Applications per Day
0 100 200 300 400 500 600
SSL v2
Teredo
Unknown
SSL v3
Traffic Volume (GB)
Downlink Traffic Volume of Other Applications per Day
Downlink
0 200 400 600 800 1000 1200
SSL v2
Teredo
Unknown
SSL v3
Traffic Volume (GB)
Uplink Traffic Volume of Other Applications per Day
Uplink

28
4.3 Application Popularity
All previous sections described the traffic generated by specific applications. This data can be used to answer the following interesting question: Which application is most popular? Application popularity is calculated based on the frequency that each application has been used, and this frequency depends on the number of connections established, if we assume that each connection represents a specific application that has been invoked once*, thus the more connections established, the more popular an application is.
The number of connections for each type of services was calculated and the results were shown in Figure 4-9. One can see that P2P services generated the most connections with around 55% of the total number of connections, which suggests that P2P is the most popular service. Therefore we might assume that the most popular application belongs to the P2P service group. This is reasonable because there is no centralized architecture in P2P protocols, hence packets must be sent to locate and keep track of peers, and to download and upload content from multiple peers requiring multiple connections. In comparison media streaming and Web browsing initiated only a small number of connections. The remaining connections were classified as ‘OTHER’. These are mainly due to untraced traffic, e.g. connections with the tags: ‘Being Analyzed’, ‘Unknown’, ‘Untraced’, etc. While these kinds of traffic represented nearly half of all connections there were not considered further in the research in this thesis project.
Figure 4-9: Total Number of Connections of Different Types of Network Services per Day
* Note that this assumption might be strengthened if we counted new connections that occur within a small period of time as most likely being generated by a single instance of an application, rather that each being a separate instance of the application being run.
0.00E+00
5.00E+07
1.00E+08
1.50E+08
2.00E+08
2.50E+08
3.00E+08
3.50E+08
4.00E+08
4.50E+08
5.00E+08
connection
Num
ber o
f Con
nect
ions
Total Connections of Different Services per Day
OTHER
WEB
STREAM
P2P
29
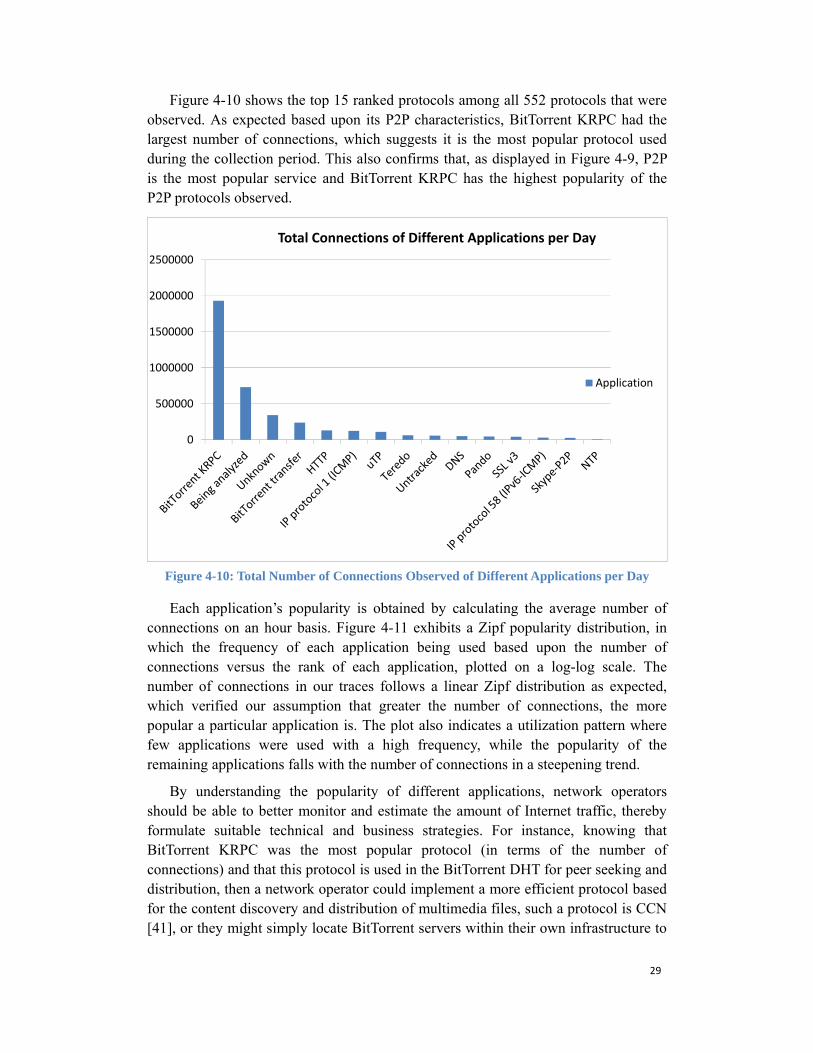
Figure 4-10 shows the top 15 ranked protocols among all 552 protocols that were observed. As expected based upon its P2P characteristics, BitTorrent KRPC had the largest number of connections, which suggests it is the most popular protocol used during the collection period. This also confirms that, as displayed in Figure 4-9, P2P is the most popular service and BitTorrent KRPC has the highest popularity of the P2P protocols observed.
Figure 4-10: Total Number of Connections Observed of Different Applications per Day
Each application’s popularity is obtained by calculating the average number of connections on an hour basis. Figure 4-11 exhibits a Zipf popularity distribution, in which the frequency of each application being used based upon the number of connections versus the rank of each application, plotted on a log-log scale. The number of connections in our traces follows a linear Zipf distribution as expected, which verified our assumption that greater the number of connections, the more popular a particular application is. The plot also indicates a utilization pattern where few applications were used with a high frequency, while the popularity of the remaining applications falls with the number of connections in a steepening trend.
By understanding the popularity of different applications, network operators should be able to better monitor and estimate the amount of Internet traffic, thereby formulate suitable technical and business strategies. For instance, knowing that BitTorrent KRPC was the most popular protocol (in terms of the number of connections) and that this protocol is used in the BitTorrent DHT for peer seeking and distribution, then a network operator could implement a more efficient protocol based for the content discovery and distribution of multimedia files, such a protocol is CCN [41], or they might simply locate BitTorrent servers within their own infrastructure to
0
500000
1000000
1500000
2000000
2500000
Total Connections of Different Applications per Day
Application

30
servof tuserthe back
4.4
(Sepon wbasivoluworeach
ve their userthe peers wrs would shamount of kbone and p
4 Daily T
The data optember 9, weekdays vis, since eacume in the rking day, wh half hour
rs. If these will use themhare storage
multimediapeering link
Figu
Traffic P
of a rando2012) were
versus weekch collecteddownlink a
while Figurof the selec
servers offem to locate and bandw
a streaming ks.
ure 4-11: Net
Pattern
om workinge processedkends. Thisd dataset waand uplink re 4-13 illucted weeken
er sufficientand downl
width within traffic that
twork Applic
g day (Sepd in order to
daily trafficas quite largdirections d
ustrates the nd day.
t performanload or uplthe operatomust be tra
cation Popul
ptember 6, o see the dic pattern wge. Figure 4during eachdownlink
nce, then a lload files. Ior’s networkansferred o
larity
2012) andifference in as analyzed4-12 shows h half hour and uplink
large proporIn this way k, thus reduver the Inte
d weekend traffic patt
d on a half hthe total trof the seletraffic vol
rtion end
ucing ernet
day terns hour affic
ected lume

31
Figure 4-12: Network Traffic Volume per Half Hour on a Selected Weekday
Figure 4-13: Network Traffic Volume per Half Hour on a Selected Weekend Day
0
100
200
300
400
500
600
700Tr
affic
Vol
ume
(GB)
2012-9-7
Network Traffic Volume per Half Hour on a Weekday
DownlinkTraffic
UplinkTraffic
0
100
200
300
400
500
600
700
800
Traf
fic V
olum
e (G
B)
2012-9-9
Network Traffic Volume per Half Hour on a Weekend Day
DownlinkTraffic
UplinkTraggic

32
The two graphs above represent typical daily traffic patterns, with fluctuation of traffic volume at every time slot. Comparing both graphs, one may notice that the traffic pattern was consistency over both two days, although the specific peak hours of traffic volume on the weekday were slightly different with that of a weekend day. In general, the traffic volume valley occurred during the period 3:00 to 6:00 on both days, and increased steadily until reached a peak value during the period 18:00 to 23:00, then declining rapidly after midnight.
As we examined traffic in a residential network, it is reasonable to believe that users’ behavior depended on their living routines and habitual patterns. For instance, Figure 4-12 leads us to infer that the residents utilizing this network go to sleep at midnight (or sometime after 23:00), get up and start to work in the early morning (from 7:00), and tend to surf after work (after 16:30). Figure 4-13 exhibits a similar user behavior. Therefore we conclude that the traffic pattern depends on the type of network as well as its users’ living routines and habitual patterns.
Figure 4-14: CDF of Time Duration per User in Use of BitTorrent Transfer on a Weekday
As introduced, downlink traffic can reflect a user's behavior at certain level since it is generated directly by users’ utilization of network. However, this may not applicable to the uplink traffic in the fact that some users, especially P2P users, left their computers turned on and connected to the network, which generated the uplink traffic. To identify whether this happened in our case, let us take a look at the time duration that each user spends using BitTorrent transfer, because we assume that the longer a user uses BitTorrent transfer, the greater probability the user keeps the computer on. Figure 4-14 illustrates the time duration per user in use of BitTorrent transfers on a working day. One can see that approximately 72% of users used BitTorrent less than 10 hours, which implies that they have relatively low probability

33
of leaving their computers being turned on after work. Yet there were still 15% of users worked more than 20 hours and roughly 10% of users kept working the whole day. Therefore, we suspect that these users have a relatively high probability of keeping their computers on all the time.
We have seen that network traffic is influenced by users’ living patterns. One may wonder whether different user contribute equally to the traffic? The answer is clearly: no. Figure 4-15 presents the network traffic contributed by each customer in a workday during prime time from 18:00 to 24:00. From this plot we can see that approximately 88% of users generated a traffic volume of less than 1000 MB during this measurement period, whereas the other 12% of users contributed most of the network traffic. This shows that there could be a very large difference in the per user behavior. For example, one of the users belonging to the 12% group might be a P2P user, whose P2P service establishes a large number of peers and consequently produced considerable traffic among these peers. While this might seem to be a bad situation for the network service provider, it turns out to be a very good thing if these other peers are connected to the same network – as this reduces the amount of peering traffic or backbone Internet traffic.
Figure 4-15: CDF of Traffic Volume per User from 18:00 to 24:00 in a Workday
34
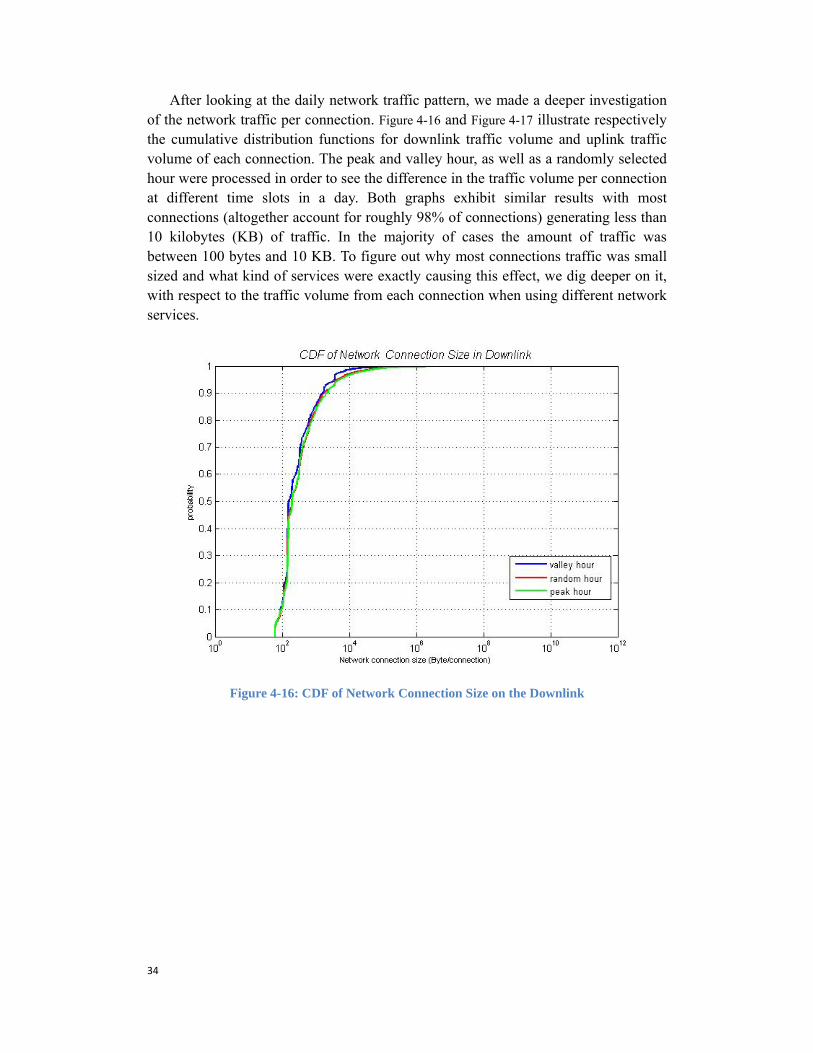
After looking at the daily network traffic pattern, we made a deeper investigation of the network traffic per connection. Figure 4-16 and Figure 4-17 illustrate respectively the cumulative distribution functions for downlink traffic volume and uplink traffic volume of each connection. The peak and valley hour, as well as a randomly selected hour were processed in order to see the difference in the traffic volume per connection at different time slots in a day. Both graphs exhibit similar results with most connections (altogether account for roughly 98% of connections) generating less than 10 kilobytes (KB) of traffic. In the majority of cases the amount of traffic was between 100 bytes and 10 KB. To figure out why most connections traffic was small sized and what kind of services were exactly causing this effect, we dig deeper on it, with respect to the traffic volume from each connection when using different network services.
Figure 4-16: CDF of Network Connection Size on the Downlink

35
Figure 4-17: CDF of Network Connection Size on The Uplink
Figure 4-18 and Figure 4-19 display the cumulative distribution functions of downlink and uplink traffic volume generated from each connection for three different types of network services. These figure indicate that P2P connections had a smaller number of bytes of traffic for both downlink and uplink directions, with 95% of connections having a size between 100 bytes and 10 KB. For the web browsing, we found that size of the connections were larger than for the P2P connections, with roughly 70% of the connections between 100 bytes and 10 KB and 30% were between 10 KB and 1 MB in the downlink direction. In the uplink direction, the traffic volume in each connection during web browsing and media streaming were smaller than in the downlink direction, with 90% of these connections smaller than 10 KB on the uplink. The media streaming connection sizes had 75% larger than 10KB and 17% more than 1MB in the downlink direction. This later result is to be expected as media streaming includes video streaming.
By comparing Figure 4-18 versus Figure 4-16, and Figure 4-19 versus Figure 4-17, one can notice that the P2P connection size plot matches the plot of general connection size per connection at different traffic hours. Specifically both of them are small sized connections with at least 95% of connection between 100 bytes and 10 KB. It is understandable because the non-centralized architecture of P2P causes many connections from multiple peers with a typical small unit connection size. BitTorrent KRPC, as a P2P application generates the most connections. Although this protocol uses UDP as its transport protocol (which has smaller message header than TCP packets) [42], thus the individual packets have a smaller header size and the protocol avoids the longer delays of setting up a TCP connection. However, the actual

36
amount of data that needs to be carried in the payload is rather small – since the size of a request looking for a given file is small and the response indicating where the chunks of the file can be found is also relatively small. Thus we conclude that the usage of P2P services is both the major source of connections and that the characteristics of this traffic dominate the connection sizes of the other types of traffic. While these observations verified to a great extent the nature of P2P protocols, the combination of small sized unit connection with a very large number of peer connections, results in the P2P services generating the largest fraction of the traffic volume as presented in section 4.1.
Figure 4-18: CDF of Downlink Traffic Volume per Connection by Services

37
Figure 4-19: CDF of Uplink Traffic Volume per Connection by Services
From Figure 4-16 and Figure 4-17 one may notice another interesting phenomenon as the three curves chosen from different sample hours have similar trends and almost overlap. This means that the probability distribution of the traffic size per connections in each hour slot was roughly constant during the data collection period. We attribute this to the relatively stable user behavior during the short period and assumed it could show up in the application usage ratio. Figure 4-20 presents the percentage of each application used by user on one day (specifically 2012-09-07). One can see that each application contributed a similar amount of traffic since the amplitude does not vary much from half hour to half hour, which confirmed our assumption.

38
Figure 4-20: Traffic Ratio per Application during One Day
After looking at the traffic ratio per application, another question is how long a
session usually is, in other words, how long do users use different applications. In Figure 4-21 we show the session duration of three applications (i.e., BitTorrent, Video Stream and Web Browser) that respectively belong to three services (i.e., P2P, Media Streaming and Web Browsing). The figure shows that, with roughly 62% of BitTorrent sessions lasting less than 10 seconds, the session duration changes abruptly at different time durations than other two applications, the major reason is that the duration of BitTorrent sessions are dependent on the peers which vary. For web browsing, 40% of sessions are smaller than 10 seconds, and we attribute this to useless web pages and users doubt[43]. Considering that many web pages are poorly designed and include lots of spam or advertisements, users avoid wasting time on these kinds of pages. Thus, the first 10 seconds are critical for web users to decide whether to stay or leave the website. The figure also indicates that, roughly 94% of video streaming sessions are shorter than 120 seconds. Thus 2 minutes is sufficient time to download a short video clip and it also means that people prefer to watch short online videos.
0%10%20%30%40%50%60%70%80%90%
100%
00:0
0-00
:30
01:0
0-01
:30
02:0
0-02
:30
03:0
0-03
:30
04:0
0-04
:30
05:0
0-05
:30
06:0
0-06
:30
07:0
0-07
:30
08:0
0-08
:30
09:0
0-09
:30
10:0
0-10
:30
11:0
0-11
:30
12:0
0-12
:30
13:0
0-13
:30
14:0
0-14
:30
15:0
0-15
:30
16:0
0-16
:30
17:0
0-17
:30
18:0
0-18
:30
19:0
0-19
:30
20:0
0-20
:30
21:0
0-21
:30
22:0
0-22
:30
23:0
0-23
:30
Traffic Ratio per Application in One Day
Other
Web
Streaming
P2P

39
Figure 4-21: Session Duration of Different Applications
The study of traffic patterns and user behavior provides evidence that may suggest effective and economically solutions for network management. For instance, there may be a concern that the large amount traffic generated by P2P users during prime time may lead to congestions of the links to the Internet. While in contrast, the traffic load is very low during the night (as can be seen in Figure 4-12 and Figure 4-13). Therefore pre-fetching or pre-caching of files during the night could relieve servers and links from considerable traffic during peak hours, while reducing the total network (and server) energy consumption to some extent. Additionally, because there would be a local copy of data, requests for this data from within the operator’s network will be even faster! This leads us to the next section of the thesis where we will examine network traffic locality.
4.5 Network Traffic Locality
In the previous section we looked at all traffic originating in or destined to a specific residential network (North Network). To better understand this traffic, we decided to look for traffic patterns at different locality levels, as we believed that understanding these patterns would be beneficial for network management, e.g. improving bandwidth utilization, reducing latency, etc. As introduced in the methodology chapter, the data was processed by sorting the geographic locations of both clients and servers according to the boundaries of different localities. These localities were stratified into 5 levels: L1: Network North, L2: the rest of the North of Sweden, L3: the rest of Sweden, L4: the rest of Europe, and L5: the rest of the World.
The total traffic to and from these different localities was calculated and shown in Table 4-3. The amount of total downlink traffic coming into Network North was roughly 11 TB and the uplink traffic going out of Network North was about 17 TB.

40
Most of the network traffic was exchanged with hosts within the level 4, with roughly 28% of the downlink traffic and 37% of the uplink traffic exchanged with hosts within this level. We can see from this table that the traffic going to other parts of Sweden was greater than the amount of traffic going to other parts of the world. In fact, traffic within Level 1 is only 2% of downlink traffic and 1.6% of uplink traffic. This is due to the fact that there were a small number of residents with similar user behavior in North Network. The statistics also indicates that the majority of the traffic in terms of numbers of bytes was sent and received within Sweden, a total of ~45% of downlink and 40% of uplink traffic. An explanation for this could be that the traffic was obtained from a Swedish residential network; hence it is natural that they would connect mainly to Swedish language websites, communicate with friends in Sweden, watch Swedish online TV programs, etc. Additionally, one would expect that due to the selection algorithms used by P2P networks, content delivery networks, and various different distributed services that traffic would be scoped geographically (with respect to delays). Figure 4-22 shows graphically the network traffic volumes at different locality levels.
Table 4-3: Total traffic statistics
Downlink Cumulative Downlink Uplink Cumulative
Uplink L5 World 27.61% 100.00% 23.43% 100.00% L4 Europe 28.51% 72.39% 37.07% 76.57% L3 Sweden 20.27% 43.88% 28.09% 39.50%
L2 North of Sweden 21.85% 23.61% 10.25% 11.41% L1 Network North 1.76% 1.76% 1.16% 1.16%
Total 11.3 TB 11.3 TB 17.1 TB 17.1 TB
Figure 4-22: Network Traffic to and from Different Localities
0
1
2
3
4
5
6
7
L1 NetworkNorth
L2 North ofSweden (rest)
L3 Sweden(rest)
L4 Europe(rest)
L5 World(rest)
Traf
fic V
olum
e (T
B)
Network Traffic in Diferent Localities
Downlink
Uplink
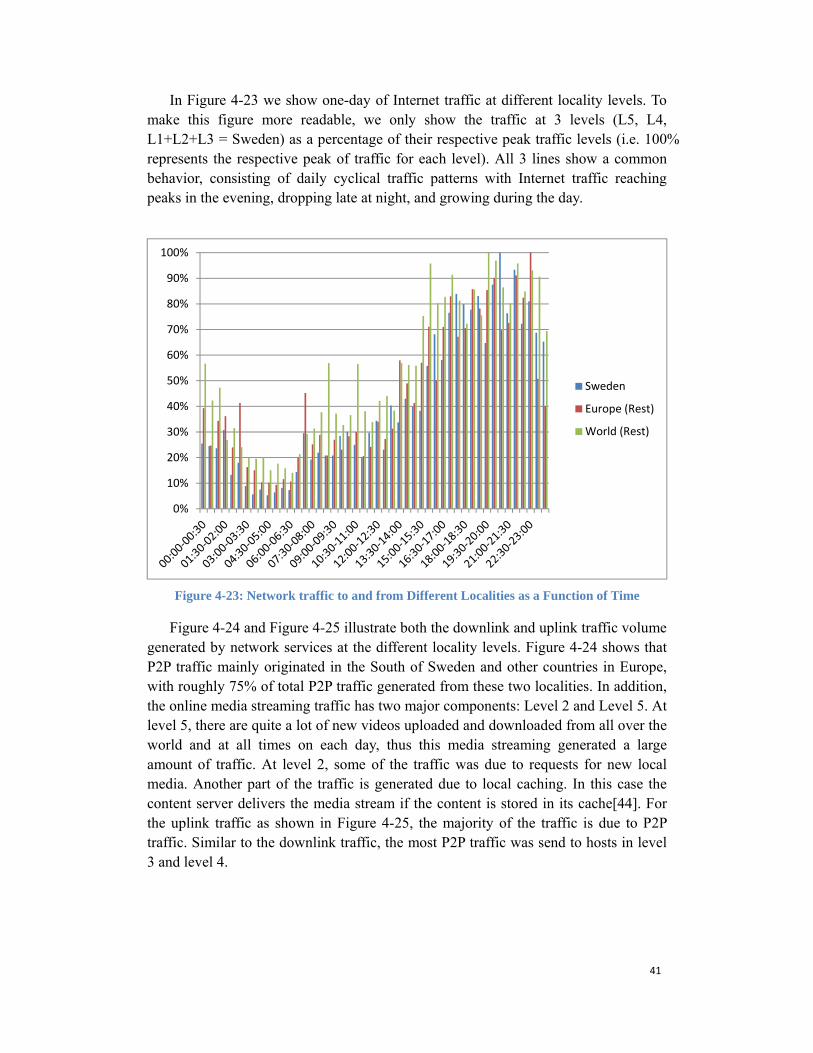
41
In Figure 4-23 we show one-day of Internet traffic at different locality levels. To make this figure more readable, we only show the traffic at 3 levels (L5, L4, L1+L2+L3 = Sweden) as a percentage of their respective peak traffic levels (i.e. 100% represents the respective peak of traffic for each level). All 3 lines show a common behavior, consisting of daily cyclical traffic patterns with Internet traffic reaching peaks in the evening, dropping late at night, and growing during the day.
Figure 4-23: Network traffic to and from Different Localities as a Function of Time
Figure 4-24 and Figure 4-25 illustrate both the downlink and uplink traffic volume generated by network services at the different locality levels. Figure 4-24 shows that P2P traffic mainly originated in the South of Sweden and other countries in Europe, with roughly 75% of total P2P traffic generated from these two localities. In addition, the online media streaming traffic has two major components: Level 2 and Level 5. At level 5, there are quite a lot of new videos uploaded and downloaded from all over the world and at all times on each day, thus this media streaming generated a large amount of traffic. At level 2, some of the traffic was due to requests for new local media. Another part of the traffic is generated due to local caching. In this case the content server delivers the media stream if the content is stored in its cache[44]. For the uplink traffic as shown in Figure 4-25, the majority of the traffic is due to P2P traffic. Similar to the downlink traffic, the most P2P traffic was send to hosts in level 3 and level 4.
0%
10%
20%
30%
40%
50%
60%
70%
80%
90%
100%
Sweden
Europe (Rest)
World (Rest)
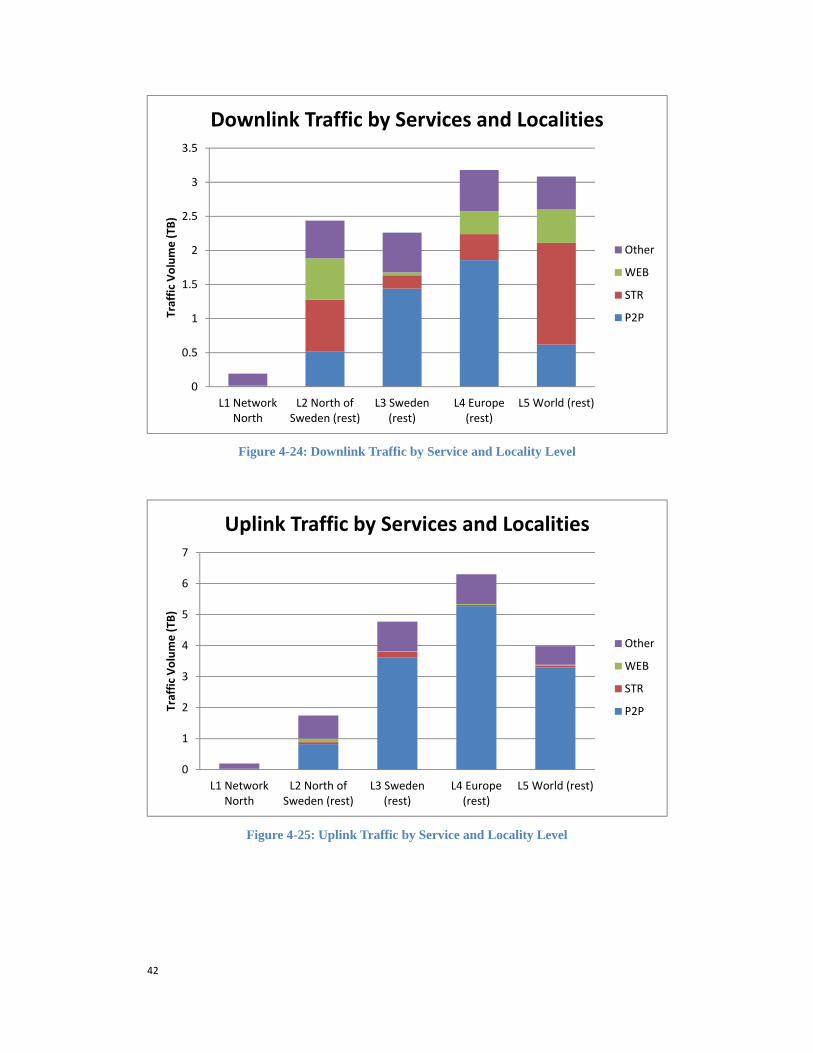
42
Figure 4-24: Downlink Traffic by Service and Locality Level
Figure 4-25: Uplink Traffic by Service and Locality Level
0
0.5
1
1.5
2
2.5
3
3.5
L1 NetworkNorth
L2 North ofSweden (rest)
L3 Sweden(rest)
L4 Europe(rest)
L5 World (rest)
Traf
fic V
olum
e (T
B)
Downlink Traffic by Services and Localities
Other
WEB
STR
P2P
0
1
2
3
4
5
6
7
L1 NetworkNorth
L2 North ofSweden (rest)
L3 Sweden(rest)
L4 Europe(rest)
L5 World (rest)
Traf
fic V
olum
e (T
B)
Uplink Traffic by Services and Localities
Other
WEB
STR
P2P

43
The number of connections with each locality level was also studied. Figure 4-26 presents the average number of connections on a workday. As one can see, the majority of network connections were established at Level 5, with about 46% of the total connections established between Network North and other continents excluding Europe. Level 4 follows with 33% of the total connections. The total connections within Sweden (L1+L2+L3) are roughly 21% of the total number of connections, which is far smaller than for the other two levels.
Figure 4-26: Network North Connections in Different Localities
Using the traffic volume in different locality levels divided by the number of connections at this level; a rough average connection size at each locality level can be obtained. As it is shown in Figure 4-27, the largest average connection size of uplink and downlink exists at locality Level 1, this suggests that the connection size within this small geographic area was larger than the average connection size in a higher locality layer. Therefore, it seems reasonable to suggest that under the same conditions, e.g. the same numbers of connection at these different locality levels, transit fees, etc., that a peering deployment closer to the end users yields greater benefits.
Figure 4-27: Average Connection Size Generated at Different Locality Levels
0.0E+00
5.0E+07
1.0E+08
1.5E+08
2.0E+08
2.5E+08
3.0E+08
3.5E+08
4.0E+08
4.5E+08
Connection
L1 Network North
L2 North of Sweden (rest)
L3 Sweden (rest)
L4 Europe (rest)
L5 World (rest)
0.0E+00
5.0E+04
1.0E+05
1.5E+05
2.0E+05
L1Network
North
L2 Northof Sweden
(rest)
L3Sweden
(rest)
L4 Europe(rest)
L5 World(rest)
Byte
/con
nect
ion
Downlink
Uplink

44
In order to observe the difference in user interest at different locality levels, HTTP server traffic was selected. This traffic was selected since HTTP traffic is mostly initiated by requests from users’ web browsers; hence it is reasonable to expect that this traffic reflects user interests. Figure 4-28 presents the number of unique server hosts at different locality levels which generated traffic to/from Network North. The Y-axis is the amount of traffic (in bytes) to and from each host server during one day. The X-axis shows the number of server hosts who were responsible for greater than 1 MB of traffic in one day. As one can see, Level 5 had the most unique servers, with about 12,000 servers. Level 4 and Level 2 followed with approximately 8,000 and 5,200 servers respectively. The traffic volume of these three levels transiting to the users connected to Network North was 2000 GB due to Level 5, 750GB due to Level 4, and 1120 GB due to Level 2. However, looking at Level 1 and Level 3, there were fewer server hosts than at other levels, with approximately only 22 (Level 1) and 1,600 (Level 3) servers, and their traffic loads were about 1.2 GB and 85.4 GB respectively. This was unexpected, as we expect that more traffic would be produced by the server hosts when there were more users using their services. One suggestion is that content distribution servers could be positioned within Level 1 or Level 3, yet if the traffic is redundant they are best placed within Level 1 in order to reduce the traffic at the next level, thus reducing the traffic load in the Internet core. Another possibility would be to shift the traffic from a heavy loaded server to a more lightly loaded server. For instance, considering the traffic volume of servers at Level 5 (shown in Figure 4-28), a lot of server hosts process less than 1 GB, hence these servers could be used to service requests for other heavily loaded servers. This suggests that when viewed from a L1 point of view that clouds of server hotels might be a suitable architecture. However, this ignores the fact that the number of customers connected to Network North is insignificant in comparison to the total number of customers connected elsewhere in the world, hence while HTTP servers at level L5 server few customers in L1 they may be serving a very large number of customers in the rest of L2, L3, L4, and L5!

45
Host Server at Different Locality Levels
Figure 4-28: Traffic Volume Generated with Number of Host Servers
at Different Locality Levels

47
5 Conclusions and Future work
The conclusions of this project are summarized in this chapter and some possible future works is suggested. The chapter ends with some required reflection on the social, economic, and ethical issues associated with this thesis project.
5.1 Conclusions
In general, this thesis project aimed to study and understand network traffic patterns, user behavior, and application usage in daily network communications in a residential access network in Sweden. By setting up a monitoring framework for data collection, processing, and visualizing, a systematic method was successfully built up to store traffic data, then to perform measurements and analysis. The tools used in this project are open sourced in order to realize an easy and common way for future work in traffic analysis. The results obtained in this thesis project were based upon statistical analysis of a large amount of network traffic data. Unlike previous projects, the concept of geographic locality was employed, thus traffic to and from the monitored network and to and from various destinations was collected and classified based upon the location of the source/destination into 5 locality levels in increasing scope. In this way the traffic characteristics of communication between the local network and other locality networks could be better studied.
The observed result shows that P2P paradigm may cause asymmetric traffic transmission within a residential network, since the nature of P2P protocols causes user hosts to act as servers for other peers, especially those with a high download rate but low upload data rate. According to our analysis, the P2P paradigm is still the most popular service in the access network that was studied. However, the downlink traffic ratio of P2P applications decreased from 50% of total traffic in 2009 (according to the results presented in [19]) to 40% of the total traffic as we observed in Network North in 2012.
On the other hand, Media Streaming services have increased from 19% of total traffic in 2009 (according to the results presented in [19]) to 25% of the traffic we observed in Network North in 2012. We believe that this difference is due to more and more people utilizing the Internet to catch movies, TV shows, and access other content. This huge growth in demand for on online video generates lots of traffic. The media streaming business segment has also realized the potential large market that has evolved from an esoteric niche to a mainstream market, thus a content provider can potentially generate a great deal of revenue by providing more online media streaming services, which in turn generates more traffic.
Our measurement results also indicated that utilization of the network protocols for security, e.g. SSL v3, SSL v2, etc. have become wide spread.

48
An interesting result concerning the popularity of specific applications showed that the popularity of an application was inversely proportional to its rank, hence following Zipf’s law. By understanding the relative popularity of various applications, network operators should be able to estimate the usage of these application and use the characteristics of specific applications to estimate the expected amounts of traffic, hence the operator could develop appropriate strategies to enhance their business. This means that knowing the rank ordering of applications (in terms of traffic) is important business intelligence.
The daily traffic pattern has also been studied during this project. The data of a random working day and weekend day were processed in order to see the difference in the traffic pattern between weekdays and weekends. The traffic patterns exhibits similar results on both days, with only a slight difference between two. Both results show that the peak traffic hours in this residential access network are from 18:00 to 23:00 and the amount of traffic declines rapidly after midnight. We attribute this to the residents’ living routines and habitual patterns within this residential network, since their expected usage behavior was confirmed by the observed traffic both in downlink and uplink direction. Furthermore, by studying the traffic volume generated by each user during the peak time, we observed that 88% of users collectively generated a minority of the total traffic volume, while the other 12% contributed the majority of the traffic.
Taking a closer look at the traffic volume per connection, we observed that most connections generated less than 10 KB traffic, typically between 100 B and 10 KB. This was verified by a further analysis of the connection size for different services, with the majority of connections generating only 100 bytes to ~10 KB. These results were heavily influenced by the statistics of the P2P connections. Despite their small connection size, the P2P protocols utilize multiple connections among peers, thus generating more total traffic than any other services. We also found the traffic size per connection was similar even during different periods of time. We attributed this to the relatively stable user behavior during the period of the data collection. Based upon observing the traffic ratio by application every 30 minutes during one day, we found that the traffic ratios of these services were stable over this period of time. This may suggest that the rank order of applications is stable and that the behaviors of the users are highly independent, as otherwise we would expect to see changes in the ratios of applications with peaks when many users were running the same application and not running other applications.
Traffic in different locality levels was identified for both downlink to and uplink from the Network North. The results indicate that, the majority of the traffic was sent and received within Sweden, approximately 45% for the downlink and 40% for the uplink traffic. Concerning the different service usage causing traffic at different locality level, we observed that P2P traffic was mainly generated in the South of Sweden (Level 3) and other countries in Europe (Level 4), with roughly 75% of the total P2P traffic associated with these two levels. Unlike P2P traffic, the online media streaming traffic had major producers at Level 2 and Level 5. This is mainly caused

49
by a large number of media requests all over the world including Level 2 and another contributing factor was local caching, where a local content server will deliver media if this the media is stored in its cache. Based upon a deeper analysis of HTTP server requests we concluded that content distribution servers could be situated at Level 1 and Level 3, in which the best option is to position it at Level 1 locality. This would reduce the amount of transit traffic at the next level and reduce the amount of traffic load transiting the Internet core.
5.2 Future work
This project sought to identify traffic patterns and user behavior in the context of local traffic in a residential access network. Unfortunately, due to limitations in time and server storage capacity data could only be collected on a daily basis. Therefore it is highly recommended that a longer term traffic measurement be carried out, as Internet-based technologies, applications, and protocols are constantly being developed and applications are updated quite frequently. Because of this, the analysis results from this project should be considered as a temporal reference for traffic management at the present time. Using the traffic measurement system designed in this project, it would be easy in future research to set up a periodic and seasonal traffic measurement system for monitoring possible variations.
Extending the measurement periods to a long-term would be a clear direction for future studies. It is necessary to observe traffic patterns over a longer time period because there is likely to be little variation in traffic patterns and user behaviors during a short monitoring period. Observing traffic characteristics monthly or yearly could be beneficial, especially to give network operators an empirically cumulative picture of traffic patterns so that they could do strategic planning.
In regard to the locality aspects of the observed traffic at different aggregation levels, this should be further researched in detail. For example utilizing information of end users from ISPs who peer could help to cluster customers. Additionally, content locality is another aspect of the traffic load that needs to be studied. Our results suggest that peering deployment closer to the end users may bring benefits to both users and service providers. Therefore, it is worth further study of the detailed benefits of locating content servers at suitable aggregation points and implementing a suitable peering system.
5.3 Required reflections
The study of traffic patterns and user behaviors in this thesis project provides evidence for local ISPs for better understanding, estimating, and supporting the expected Internet traffic. The proposed solutions address large potential benefits to both operators and end users in terms of social and economic aspects, such as how to achieve the best operating performance at the lowest OPEX with respect to ISPs, while meeting the market’s demands with better services (e.g. lower delays, faster response times, etc.). With regards to ethical aspects, in terms of privacy, hashing was

50
utilized during this project to shielding the users’ IP addresses. Considering the limitations in the work, the established systematic measurement framework laid a good foundation for the proposed future work towards a more trustworthy solution.

51
References
[1] “Cisco Visual Networking Index: Forecast and Methodology, 2011-2016
[Visual Networking Index (VNI)],” Cisco. [Online]. Available: http://www.cisco.com/en/US/solutions/collateral/ns341/ns525/ns537/ns705/ns827/white_paper_c11-481360_ns827_Networking_Solutions_White_Paper.html. [Accessed: 18-Nov-2012].
[2] M. B. Weiss and S. J. Shin, “Internet Interconnection Economic Model and its Analysis: Peering and Settlement,” NETNOMICS: Economic Research and Electronic Networking, vol. 6, no. 1, pp. 43–57, Apr. 2004.
[3] S. Shakkottai and R. Srikant, “Economics of network pricing with multiple ISPs,” in Proceedings IEEE INFOCOM 2005. 24th Annual Joint Conference of the IEEE Computer and Communications Societies, 2005, vol. 1, pp. 184 – 194 vol. 1.
[4] W. B. Norton, “Internet service providers and peering,” in Proceedings of NANOG, 2001, vol. 19, pp. 1–17.
[5] W. B. Norton, “A business case for ISP peering,” White Paper (v1. 3), February, 2002.
[6] W. B. Norton, “The evolution of the US Internet peering ecosystem,” Equinix white papers, 2004.
[7] A. D’Ignazio and E. Giovannetti, “Spatial Dispersion of Peering Clusters in the European Internet,” SSRN eLibrary, Jan. 2006.
[8] “TRAMMS - Traffic Measurements and Models in Multi-Service Networks, winner of the Celtic Excellence Award in Gold 2010.” [Online]. Available: http://projects.celtic-initiative.org/tramms/. [Accessed: 21-Nov-2012].
[9] “IPNQSIS - IP Network Monitoring for Quality of Service Internet Support.” [Online]. Available: http://projects.celtic-initiative.org/ipnqsis/. [Accessed: 21-Nov-2012].
[10] D. Soldani, M. Li, and R. Cuny, Eds., “Front Matter,” in QoS and QoE Management in UMTS Cellular Systems, John Wiley & Sons, Ltd, 2006, pp. i–xxvii.
[11] “TM Forum - Service Level Agreement.” [Online]. Available: http://www.tmforum.org/SLAManagement/1690/home.html. [Accessed: 22-Nov-2012].
[12] “TR193, Customer Experience Management Index (CEMI), Release 1.0.” [Online]. Available: http://www.tmforum.org/TechnicalReports/50589/article.html?linkid=50589. [Accessed: 22-Nov-2012].
[13] “TR148, Managing the Quality of Customer Experience, Release 1.0.” [Online]. Available: http://www.tmforum.org/TechnicalReports/TR148Managingthe/38504/article.ht

52
ml. [Accessed: 22-Nov-2012]. [14] Tomas Sisohore, “Measuring & Modeling HTTP Media Stream In
IP-Networks,” Master Thesis, KTH Royal Institute Of Technology, Stockholm, Sweden, 2007.
[15] G. Yu, T. Westholm, M. Kihl, I. Sedano, A. Aurelius, C. Lagerstedt, and P. Odling, “Analysis and characterization of IPTV user behavior,” in IEEE International Symposium on Broadband Multimedia Systems and Broadcasting, 2009. BMSB ’09, 2009, pp. 1 –6.
[16] Tomas Bonnedahl, “Traffic Measurement and Analysis in Fixed and Mobile Broadband Access Networks,” Master Thesis, Dept. of Electrical and Information Technology, Lund Universtity, Lund, Sweden, 2009.
[17] J. A. Andersson, T. Bonnedahl, S. Höst, M. Kihl, and A. Aurelius, “Traffic Patterns on Different Internet Access Technologies.”
[18] Phat Hoang, “Internet Traffic Analysis,” Master Thesis, Department of Electrical and Information Technology Faculty of Engineering, LTH, Lund University, Lund, Sweden, 2010.
[19] Y. Zhang, “Residential Network Traffic and User Behavior Analysis,” Master Thesis, KTH Royal Institute of Technology, Stockholm, Sweden, 2010.
[20] R. Mahajan, D. Wetherall, and T. Anderson, “Mutually controlled routing with independent ISPs,” in Proc. NSDI, 2007.
[21] W. B. Norton, “A Business Case for Peering in 2004,” in Gigabit Peering Forum IX (New York City, 2004), 2010.
[22] “DrPeering White Paper - Internet Transit Prices - Historical and Projections.” [Online]. Available: http://drpeering.net/white-papers/Internet-Transit-Pricing-Historical-And-Projected.php. [Accessed: 23-Nov-2012].
[23] J. Nichols and M. Claypool, “The effects of latency on online madden NFL football,” in Proceedings of the 14th international workshop on Network and operating systems support for digital audio and video, 2004, pp. 146–151.
[24] T. Henderson, “Latency and user behaviour on a multiplayer game server,” Networked Group Communication, pp. 1–13, 2001.
[25] H. S. Martin, A. J. McGregor, and J. G. Cleary, “Analysis of internet delay times,” Measurement, vol. 651588039, 2000.
[26] “Sandvine : Global Broadband Trends.” [Online]. Available: http://www.sandvine.com/news/global_broadband_trends.asp. [Accessed: 23-Nov-2012].
[27] L. Subramanian, V. N. Padmanabhan, and R. H. Katz, “Geographic properties of Internet routing,” in USENIX Annual Technical Conference, 2002, pp. 243–259.
[28] S. Bar, M. Gonen, and A. Wool, “A geographic directed preferential Internet topology model,” in 13th IEEE International Symposium on Modeling, Analysis, and Simulation of Computer and Telecommunication Systems, 2005, 2005, pp. 325 – 328.
[29] A. Wierzbicki, N. Leibowitz, M. Ripeanu, and R. Woźniak, “Cache

53
replacement policies for P2P file sharing protocols,” European Transactions on Telecommunications, vol. 15, no. 6, pp. 559–569, 2004.
[30] L. A. Adamic and B. A. Huberman, “Power-Law Distribution of the World Wide Web,” Science, vol. 287, no. 5461, pp. 2115–2115, Mar. 2000.
[31] G. Dán and N. Carlsson, “Power-law revisited: A large scale measurement study of P2P content popularity,” in Proceedings of the 9th international conference on Peer-to-peer systems, 2010, pp. 12–12.
[32] “Procera Networks: Intelligent Policy Enforcement.” [Online]. Available: http://www.proceranetworks.com/index.php. [Accessed: 24-Nov-2012].
[33] “Procera_Overview_Brochure_Letter_Single Page.pdf.” . [34] “Release_Notes-v11.387.pdf.” . [35] “MaxMind - GeoIP | IP Address Location Database.” [Online]. Available:
http://www.maxmind.com/en/geolocation_landing. [Accessed: 25-Nov-2012]. [36] “MaxMind APIs: GeoLite Free Downloadable Databases.” [Online]. Available:
http://dev.maxmind.com/geoip/geolite. [Accessed: 25-Nov-2012]. [37] “Sweden Latitude and Longitude Map.” [Online]. Available:
http://www.mapsofworld.com/lat_long/sweden-lat-long.html. [Accessed: 25-Nov-2012].
[38] “DRDL Technology.” [Online]. Available: http://www.proceranetworks.com/drdl-technology.html. [Accessed: 14-Nov-2012].
[39] Andrew Loewenstern, “DHT Protocol.” [Online]. Available: http://bittorrent.org/beps/bep_0005.html#contact-encoding. [Accessed: 28-Nov-2012].
[40] C. Huitema, “Teredo: Tunneling IPv6 over UDP through network address translations (NATs),” Internet Request for Comments, Feb-2006. [Online]. Available: http://www.rfc-editor.org/rfc/rfc4380.txt. [Accessed: 10-Dec-2012].
[41] ROBERT MÖRT, “121207-Robert_Mort-with-cover.pdf.” [Online]. Available: http://web.it.kth.se/~maguire/DEGREE-PROJECT-REPORTS/121207-Robert_Mort-with-cover.pdf. [Accessed: 11-Dec-2012].
[42] “Transport Layer ISO OSI TCP ports UDP datagram.” [Online]. Available: http://www.highteck.net/EN/Transport/OSI_Transport_Layer.html. [Accessed: 26-Nov-2012].
[43] “How Long Do Users Stay on Web Pages? (Jakob Nielsen’s Alertbox).” [Online]. Available: http://www.useit.com/alertbox/page-abandonment-time.html. [Accessed: 05-Dec-2012].
[44] J. Liu and J. Xu, “Proxy caching for media streaming over the Internet,” IEEE Communications Magazine, vol. 42, no. 8, pp. 88 – 94, Aug. 2004.

www.kth.se
TRITA-ICT-EX-2012:302