Embed Size (px)
Citation preview

1 | P a g e
Pic
ture
Co
urt
esy
: S
an
tosh
an
d S
ury
ab
ha
n M
ou
rya
Baseline Survey of the
Feni Industry
A Report
Report prepared by
Pranab Mukhopadhyay, PhD,
Santosh Maurya & Suryabhan Mourya
SHODH, Nagpur
Submitted to Principal Investigator of the
project: Dr. Dwijen Rangnekar, CSGR
University of Warwick, UK
Sponsoring Agency
Economic & Social Research Council, UK Grant reference: RES-.061-23-0119
Localising Economic Control through clubs: Examining the Intellectual Property
Protection of Feni in Goa, India”

2 | P a g e
Localising Economic Control through clubs:
Examining the Intellectual Property
Protection of Feni
in Goa, India
Report of Baseline Survey
Prepared by
Pranab Mukhopadhyay, PhD,
Santosh Maurya and Suryabhan Mourya
for
SHODH, Nagpur, India
Submitted to
Principal Investigator: Dr. Dwijen Rangnekar,
Centre for the Study of Globalisation &
Regionalisation
University of Warwick, Coventry
United Kingdom
Sponsoring Agency: Economic & Social Research Council, UK
Grant reference: RES-061-23-0119

3 | P a g e
Table of Contents Acknowledgements ................................................................................................................................. 7
1 Preface ................................................................................................................................................. 8
1.1 History ........................................................................................................................................... 8
1.2 Structure of the Goan Economy: .................................................................................................... 8
1.2.1 Tourism & Feni .......................................................................................................................... 10
1.3 Cashew & Goa .............................................................................................................................. 11
1.4 Indian Cashew .............................................................................................................................. 12
1.5 The Cashew Apple ........................................................................................................................ 14
2 Feni..................................................................................................................................................... 14
2.1 The Product and the Process ........................................................................................................ 15
2.2 The state and Feni production ...................................................................................................... 16
2.3 Feni Industry ................................................................................................................................ 19
2.4 Area under Cashew ...................................................................................................................... 20
3. The Survey ..................................................................................................................................... 21
3.1 Objective ...................................................................................................................................... 21
3.2 Sampling strategy ......................................................................................................................... 21
3.3 Survey Period & Area ................................................................................................................... 22
3.5 Questionnaire .............................................................................................................................. 23
3.6 Survey outcome ........................................................................................................................... 23
4 Discussion of findings .......................................................................................................................... 23
4.1 Socio-Economic profile ................................................................................................................. 24
4.1.1 Educational level ................................................................................................................... 24
4.1.2 Other occupations ................................................................................................................. 25
4.1.3 Years of operation ................................................................................................................. 25
4.2 Production history ........................................................................................................................ 26
4.2.1 Feni a family tradition ............................................................................................................ 26
4.2.2 Who in family started feni distillation .................................................................................... 26
4.3 Production conditions .................................................................................................................. 27
4.3.1 Number of stills ..................................................................................................................... 27

4 | P a g e
4.3.2 Still ownership ....................................................................................................................... 27
4.3.3 Type of still ............................................................................................................................ 28
4.3.4 Frequency of still change ....................................................................................................... 28
4.3.5 Location of still (for distillation) ............................................................................................. 28
4.3.6 Who supervises ..................................................................................................................... 29
4.4 The Product ................................................................................................................................. 29
4.4.1 Feni’s alcoholic concentration ............................................................................................... 29
4.4.2 Urak’s alcoholic concentration ............................................................................................... 30
4.4.3 Quantity ................................................................................................................................ 31
4.4.4 Price ...................................................................................................................................... 31
4.4.5 Profitability: Urak or Feni ....................................................................................................... 32
4.4.6 Time taken at plantation/hrs per day ..................................................................................... 33
4.5 Quality Issues ............................................................................................................................... 33
4.5.1 Importance of cashew and distillation in determining feni quality ......................................... 33
4.5.2 Test for Quality ...................................................................................................................... 34
4.5.3 Quality comparison to others ................................................................................................ 34
4.6 Sales ............................................................................................................................................ 35
4.6.1 Retail sale of Feni .................................................................................................................. 35
4.6.2 Proportion of Unbranded feni sold ....................................................................................... 35
4.6.3 Brands ................................................................................................................................... 36
4.6.4 Consumers ............................................................................................................................ 36
4.7 Financing Structure ...................................................................................................................... 37
4.8 Member of Association ................................................................................................................ 37
4.9 GI for Feni: Information & Role of Government ............................................................................ 38
5 Conclusion .......................................................................................................................................... 40
Reference .............................................................................................................................................. 41
5 | P a g e
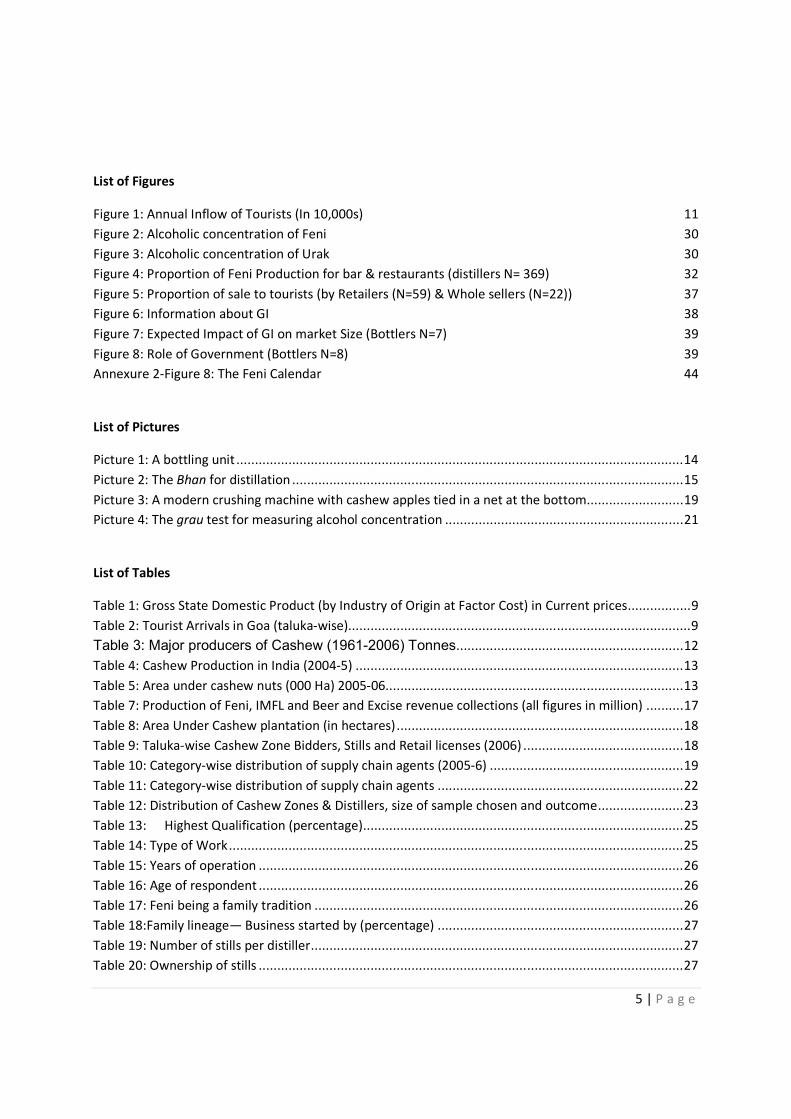
List of Figures
Figure 1: Annual Inflow of Tourists (In 10,000s) 11
Figure 2: Alcoholic concentration of Feni 30
Figure 3: Alcoholic concentration of Urak 30
Figure 4: Proportion of Feni Production for bar & restaurants (distillers N= 369) 32
Figure 5: Proportion of sale to tourists (by Retailers (N=59) & Whole sellers (N=22)) 37
Figure 6: Information about GI 38
Figure 7: Expected Impact of GI on market Size (Bottlers N=7) 39
Figure 8: Role of Government (Bottlers N=8) 39
Annexure 2-Figure 8: The Feni Calendar 44
List of Pictures
Picture 1: A bottling unit ........................................................................................................................ 14
Picture 2: The Bhan for distillation ......................................................................................................... 15
Picture 3: A modern crushing machine with cashew apples tied in a net at the bottom.......................... 19
Picture 4: The grau test for measuring alcohol concentration ................................................................ 21
List of Tables
Table 1: Gross State Domestic Product (by Industry of Origin at Factor Cost) in Current prices ................. 9
Table 2: Tourist Arrivals in Goa (taluka-wise)............................................................................................ 9
Table 3: Major producers of Cashew (1961-2006) Tonnes ............................................................. 12
Table 4: Cashew Production in India (2004-5) ........................................................................................ 13
Table 5: Area under cashew nuts (000 Ha) 2005-06................................................................................ 13
Table 7: Production of Feni, IMFL and Beer and Excise revenue collections (all figures in million) .......... 17
Table 8: Area Under Cashew plantation (in hectares) ............................................................................. 18
Table 9: Taluka-wise Cashew Zone Bidders, Stills and Retail licenses (2006) ........................................... 18
Table 10: Category-wise distribution of supply chain agents (2005-6) .................................................... 19
Table 11: Category-wise distribution of supply chain agents .................................................................. 22
Table 12: Distribution of Cashew Zones & Distillers, size of sample chosen and outcome ....................... 23
Table 13: Highest Qualification (percentage) ...................................................................................... 25
Table 14: Type of Work .......................................................................................................................... 25
Table 15: Years of operation .................................................................................................................. 26
Table 16: Age of respondent .................................................................................................................. 26
Table 17: Feni being a family tradition ................................................................................................... 26
Table 18:Family lineage— Business started by (percentage) .................................................................. 27
Table 19: Number of stills per distiller .................................................................................................... 27
Table 20: Ownership of stills .................................................................................................................. 27

6 | P a g e
Table 21: Rental of Stills ......................................................................................................................... 28
Table 22: Type of Stills ........................................................................................................................... 28
Table 23: Frequency of Still change ........................................................................................................ 28
Table 24: Still location ............................................................................................................................ 28
Table 25: Supervision of work ................................................................................................................ 29
Table 26:Feni price change in last 5 years (percent) ............................................................................... 31
Table 27:Profit ranking between Urak and feni ...................................................................................... 32
Table 28: Time taken at plantation -- hours per day ............................................................................... 33
Table 29: Time taken for Other activities -- hours/per day ..................................................................... 33
Table 30: Importance of different factors in determining feni Quality .................................................... 33
Table 31: Type of test for quality ............................................................................................................ 34
Table 32: Quality comparison ................................................................................................................ 34
Table 33: Sale by distillers ...................................................................................................................... 35
Table 34: Financing sources of Distillers ................................................................................................. 37
Table 35: Producer Groups and Bottlers ................................................................................................. 38

7 | P a g e
Acknowledgements
We would like to thank the following for their help and cooperation at various stages of the
work.
Mr A. Srivastava, Excise Commissioner, Govt. of Goa.
Mr P.S. Reddy, Excise Commissioner, Govt. of Goa.
Mr S . Parab, Assistant Commissioner of Excise, Govt. of Goa.
Santosh Maurya and Suryabhan Mourya did the bulk of the field work. We are also grateful to
them for use of their photographs used in this report. Alex Philip helped with the interviews in
Bardez taluka.
Lizette da Costa took responsibility for data entry.
All the different stake holders, who readily agreed to be interviewed, without whose help and
cooperation this study would not have been possible. They are far too many to be named
individually here so we hope that they accept our gratitude as a group.
In particular we would like to thank Mac Vaz and Gurudutt Bhakta, President and Secretary of
the Goa Feni Distiller’s Association, respectively, who have helped with their time and
knowledge of the industry. They took a special interest in the study and made it possible for us to
meet many people linked to the Feni industry.
Photo courtesy: Santosh Maurya and Suryabhan Mourya

8 | P a g e
1 Preface
Goa is a small state on the western coast of India (area 3702 square kilometers) with a population
of 1.34 million (as per 2001 census). It has 0.14% of the nation’s population but accounts for
0.4% of the nation’s aggregate output. Goa enjoys the highest per capita income (per annum)
among all states in India at Rs 70,112 (current prices in 2005-6) which is about three times larger
than the national average.1
Goa is divided in two administrative districts – North and South Goa and further divided into 11
sub-district administrative zones (called talukas) – Tiswadi, Pernem, Bardez, Sattari, Bicholim,
Ponda (North Goa); Salcete, Quepem, Mormugao, Canacona, Sanguem, (South Goa).
1.1 History
Goa was a Portrugese colony from 1510 to 1961 when it joined the Indian union. The over four
and a half centuries of colonization (much longer than the rest of the Indian mainland under the
British) has given Goa a distinct socio-cultural collage [Couto 2005, de Souza 1994].2 The
Portuguese occupation of Goa happened in two phases – the old conquest areas and the new
conquest areas. The three talukas of Tiswadi, Bardez and Salcete (coastal talukas) came under
Portuguese colonial rule in the 16th century whereas the other talukas were occupied almost two
centuries later (18th century) [Xavier 1993]. It is the talukas of the Old Conquest which have the
bulk of tourist arrivals, infrastructure and associated economic development (see Table 2) [TERI
2000].
1.2 Structure of the Goan Economy:
Goa’s economy is dominated by the services sector even though the industrial sector too has
started becoming fairly important both in terms of employment generation and share in aggregate
state output (See Table 1).
There are two main engines of growth in the Goan economy – the mining sector and the tourism
sector. Though their relative size seems small from Table 1 below but there are a number of
related components in the Secondary and Tertiary sector that are directly related to the health of
these two sub-sectors, e.g., Construction, Transport, Storage and Communication, Real Estate,
Banking and Insurance, etc. These two industries operate in geographically non-overlapping
1 Table 1.1 & 1.8 (page S-3 and 12 respectively) of GoI (2007)
2 This is reflected in cultural practices, the traditional architecture, and cuisine as the most visible forms of
differentiation (see Newman 1999, 2001, Pandit & Mascarenhas 1999).

9 | P a g e
zones. Note that the mining talukas of Sanguem, Bicholim, Sattari and Quepem attract very few
tourists (see Table 2).
Table 1: Gross State Domestic Product (by Industry of Origin at Factor Cost) in Current prices
1995-96 2003-04
Primary Sector 18 11
(in which Mining) 6 4
Secondary Sector 27 38
Tertiary Sector 55 50
(in which Trade Hotel, Restaurant) 14 12
GSDP 100 100
Source: GoG (2007)
Table 2: Tourist Arrivals in Goa (taluka-wise)
Taluka 2005-6 2005-6 2005-6
Domestic Foreign Total (Domestic & Foreign)
1 Goa 1,974,780 342,075 2,316,855
2 North Goa 1,207,668 200,920 1,408,588
3 Tiswadi 555224 73046 628270
4 Bardez 518999 121737 640736
5 Pernem 18539 5063 23602
6 Bicholim 15748 152 15900
7 Satari 0 0 0
8 Ponda 99158 922 100080
9 South Goa 767,112 141,155 1,974,780
10 Sanguem 7553 339 7892
11 Canacona 15184 9160 24344
12 Quepem 0 0 0
13 Salcete 524395 113192 637587
14 Mormugao 219980 18464 238444 Source: GoG (Various Years)
It becomes important to relate these two sectors in the study of feni because they both contribute
to the growth in demand for feni in two different ways. The mining sector workers probably find
this a cheap alcoholic drink. It is not a big surprise that the talukas which are most closely
associated with mining – Sanguem, Bicholim, Sattari and Quepem are also the talukas that have
the highest number of cashew zones, licensed stills and retails outlets for liquor (see Annexure 1
Figure 9 for geographical distribution of talukas).
The growth in demand from the tourism segment, on the other hand, has presumably come from
a different end of the consumer chain. Media stories and travelogues have waxed eloquent about
10 | P a g e
the unique feni experience that Goa provides in addition to the beaches. This helps feni
manufacturers compete with other established and widely known liquors on the restaurant menus
in tourism areas. This is one of the segments of the alcohol market that the branded feni
manufacturers have targeted. It also provides hope for bottlers to find an export market and
compete with beverages like Tequila or Grappa in the long run. It is this incentive that probably
is linked to the search for GI protection for the traditional drink of Goa – Feni.
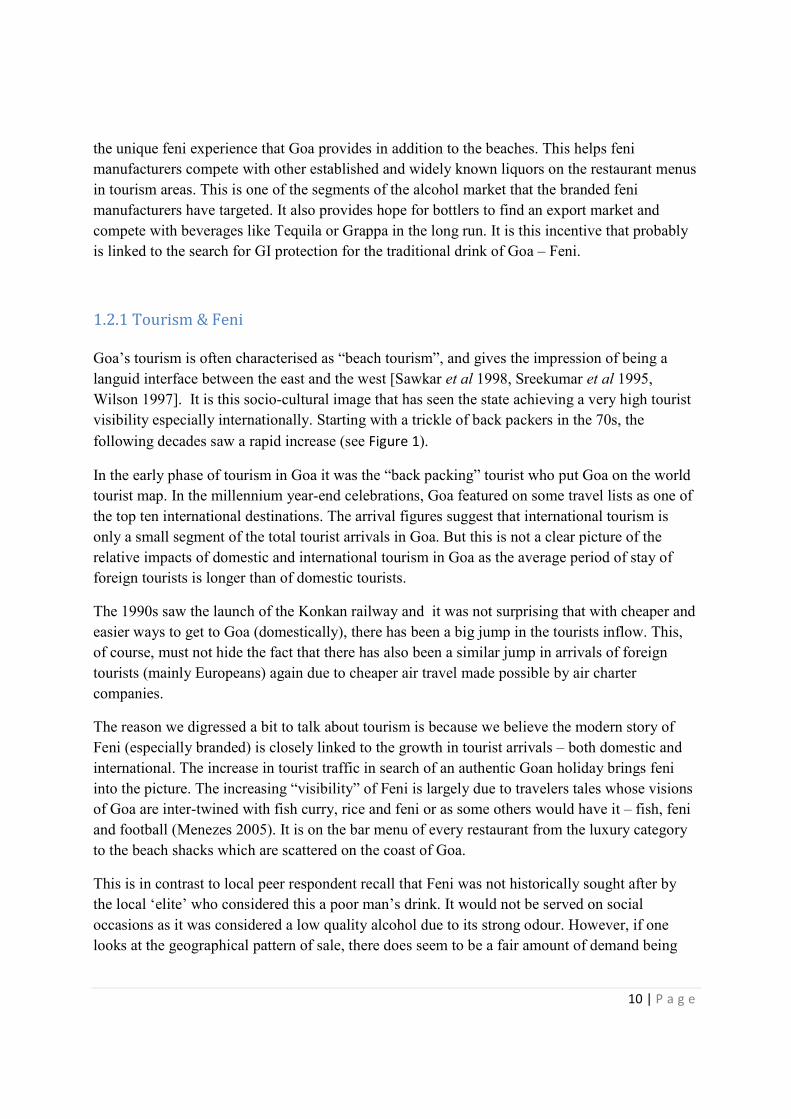
1.2.1 Tourism & Feni
Goa’s tourism is often characterised as “beach tourism”, and gives the impression of being a
languid interface between the east and the west [Sawkar et al 1998, Sreekumar et al 1995,
Wilson 1997]. It is this socio-cultural image that has seen the state achieving a very high tourist
visibility especially internationally. Starting with a trickle of back packers in the 70s, the
following decades saw a rapid increase (see Figure 1).
In the early phase of tourism in Goa it was the “back packing” tourist who put Goa on the world
tourist map. In the millennium year-end celebrations, Goa featured on some travel lists as one of
the top ten international destinations. The arrival figures suggest that international tourism is
only a small segment of the total tourist arrivals in Goa. But this is not a clear picture of the
relative impacts of domestic and international tourism in Goa as the average period of stay of
foreign tourists is longer than of domestic tourists.
The 1990s saw the launch of the Konkan railway and it was not surprising that with cheaper and
easier ways to get to Goa (domestically), there has been a big jump in the tourists inflow. This,
of course, must not hide the fact that there has also been a similar jump in arrivals of foreign
tourists (mainly Europeans) again due to cheaper air travel made possible by air charter
companies.
The reason we digressed a bit to talk about tourism is because we believe the modern story of
Feni (especially branded) is closely linked to the growth in tourist arrivals – both domestic and
international. The increase in tourist traffic in search of an authentic Goan holiday brings feni
into the picture. The increasing “visibility” of Feni is largely due to travelers tales whose visions
of Goa are inter-twined with fish curry, rice and feni or as some others would have it – fish, feni
and football (Menezes 2005). It is on the bar menu of every restaurant from the luxury category
to the beach shacks which are scattered on the coast of Goa.
This is in contrast to local peer respondent recall that Feni was not historically sought after by
the local ‘elite’ who considered this a poor man’s drink. It would not be served on social
occasions as it was considered a low quality alcohol due to its strong odour. However, if one
looks at the geographical pattern of sale, there does seem to be a fair amount of demand being

11 | P a g e
generated (presumably) from workers in the mining sector reflected by the high number of retail
licenses in these talukas as discussed earlier.
So the current media attention and demand for Feni in coastal areas is possibly a consequence of
its acceptance by tourists. It is also a growing realization that there exists a market for feni
internationally – probably from expatriate Goans living abroad. The need for branding probably
arises since (a) tourists, in the absence of local information about the unbranded segment may
rely on labels as an indicator of product standardization, and (b) unlabelled feni cannot be sold
abroad. Press reports seem to indicate that there is an emerging international market for feni even
though this is small currently (see Anon (2007), Roy (2003), Prabhudessai (2002), Kamat
(2002)) necessitating branding of the product.
Figure 1: Annual Inflow of Tourists (In 10,000s)
Date Source: GoG (various years), and Sawkar et al (1997) for 1980-1985 data.
1.3 Cashew & Goa
During the colonial period Goa was an important trading post for the Portuguese who are said to
have introduced the cashew plant from Brazil in the 16th century (Mathew, 2004). The hill slopes

12 | P a g e
in the Konkan region which were semi-arid were found to be conducive for undertaking cashew
plantations and initially were used more for soil protection.
Africa was the largest producer of cashew till the 70s – accounting for about 68 percent of total
world output. Mozambique and Tanzania were the dominant players in the market. In the last
three decades however there has been a transformation in the global production scenario with
Asia overtaking Africa over the last three decades. India till recently led the world production
figures (Ali & Judge 2004). However the current (2006) production data available from FAO
indicate that Vietnam and Nigeria have outstripped India and Brazil in cashew production.
Table 3: Major producers of Cashew (1961-2006) Tonnes
Year World Brazil India Mozambique Nigeria Philippines Tanzania Viet Nam
1961 287535 9670 85000 107000 7000 7500 50000 700
1971 558846 28602 127223 202000 25000 5014 126409 3500
1981 494167 74000 185250 71100 25000 3786 64000 6500
1991 908250 185965 294590 31134 45000 3686 29850 160000
2001 1903915 124073 450000 58000 485000 7000 98600 292800
2006 3103450 236140 573000 68328 636000 113071 90400 941600
Source FAO (2007)
1.4 Indian Cashew
In India, cashew is largely grown in the coastal regions – Kerala, Karnataka, Goa, Maharashtra,
Andhra Pradesh, Orissa and Tamil Nadu (see Table 4 below). As per 2004-2005 production
figures Maharashtra had emerged as the dominant player in the market contributing almost one
third of the national production but accounting for only one fifth of the land area under cashew
cultivation therefore showing a higher efficiency in production – nearly one and half times the
national average productivity. India exports cashew nuts as well as cashew nut shell liquid. In
2005, India exported 0.58 million thousand dollars worth of shelled cashew nuts. There is a push
to increase the export of feni too since 1999 by individual bottlers. The feni export is being
driven by individual bottlers who are attempting to meet demand from expatriate Goan residents
demand (Anon, 2007, Kamat 2002).
The ISO 6477 was introduced in 1988 to standardise cashew nut quality in the international
markets. Incidentally, cashew is the only major plantation crop that is not regulated by an
autonomous board like tea, coffee, cardamom and rubber. Cashew is one of the most neglected

13 | P a g e
plantation crops in India despite its status as a major source of foreign exchange (Ali & Judge
2004).3 Goa accounts for 7.8% of the area under cashew plantation (of the national total) but
Table 4: Cashew Production in India (2004-5)
STATE Area in ‘000 hectares Production in ‘000
Million Tonnes
Average Productivity in
Kilogramme per hectare
Andhra Pradesh 150 88 840
Goa 55 26 660
Orissa 126 74 810
Kerala 102 64 900
Karnataka 95 43 680
Maharashtra 160 174 1200
Tamil Nadu 105 53 610
West Bengal 9 8 800
Others 18 14 800
T O T A L 820 544 810
Source: http://dacnet.nic.in/cashewcocoa/stat1.htm
only 4.3% of the cashew nut crop indicating scope for substantial increases in productivity (Rao
1998). In Goa, Sattari taluka has the largest area (in 2005-06) under cashew plantation and North
Goa accounts for about 75% or more of the cashew plantation in the state (see Table 5).
Table 5: Area under cashew nuts (000 Ha) 2005-06
Tiswadi 4.054
Bardez 6.428
Pernem 8.264
Bicholim 7.738
Satari 10.255
Ponda 3.370
North Goa 40.109
Sanguem 6.955
Canacona 3.241
Quepem 2.448
Salcete 1.915
Mormugao 0.353
South Goa 14.912
Total 55.021 Source: Excise Department, Government of Goa, Panaji, 2007
3 Cashew was the 2nd most important item among all the Agri-Horticultural export commodities from India selling 97,550 MT of cashew kernels valued at Rs.1,776.80 crores during the year 2001-2002. (Source:
http://dacnet.nic.in/cashewcocoa/stat1.htm
14 | P a g e
1.5 The Cashew Apple
The nut is a very high valued product, and therefore little attention is paid to the apple itself.
However, it has many nutrient properties – especially as a source of Vitamin C (it is supposed to
have 5 times more Vitamin C than oranges !) (Ali & Judge 2004). In
West Africa & Brazil, it is used to make fresh juice, jams as well as
wine. In Goa however, it is only used to make feni and related
alcoholic beverages at present.
2 Feni
The word Feni originates from the Konkani word for froth – fen.
When shaken, feni gets a froth on top giving the alcoholic beverage its
name. The name Feni is refers to the distilled cashew apple extract.
Typically, the areas where there were no cashew plantations, a toddy
extract from coconut trees called Maad was prepared (mainly in parts
of South Goa). The two products are distinct in taste and odour though
they share the same basic distillation process. They do not overlap
either in production or consumption. This study looks at the Cashew
feni industry. 4
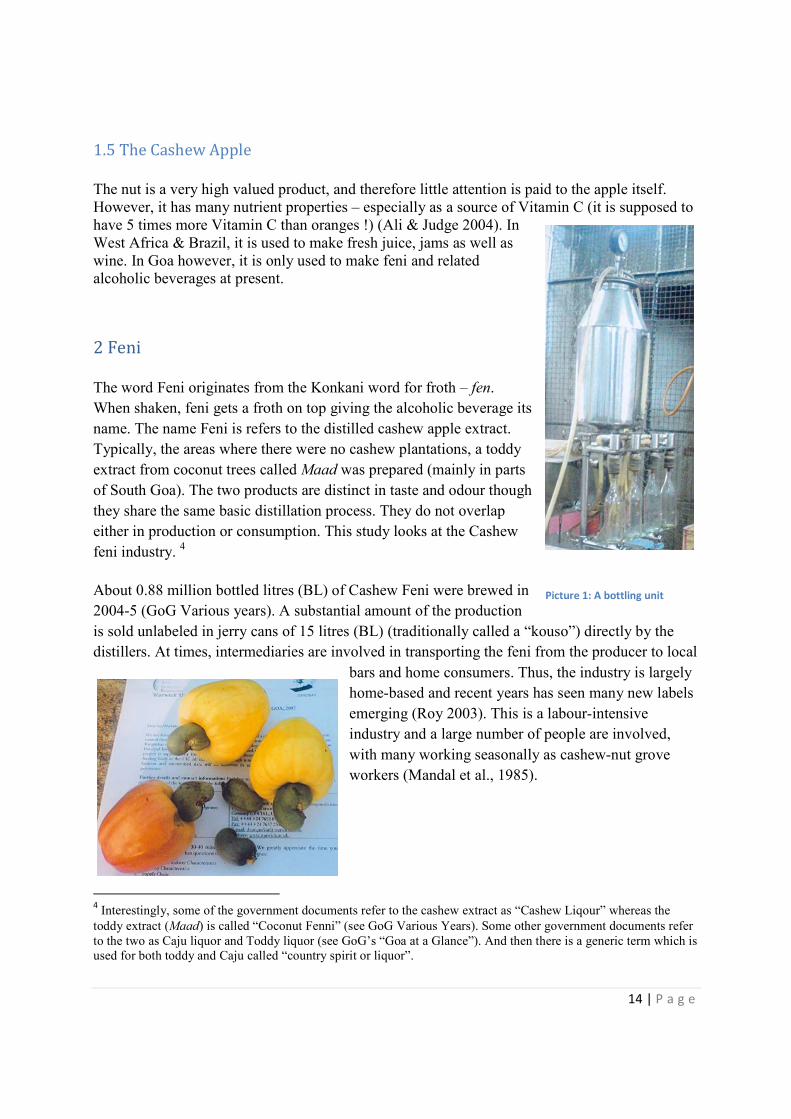
About 0.88 million bottled litres (BL) of Cashew Feni were brewed in
2004-5 (GoG Various years). A substantial amount of the production
is sold unlabeled in jerry cans of 15 litres (BL) (traditionally called a “kouso”) directly by the
distillers. At times, intermediaries are involved in transporting the feni from the producer to local
bars and home consumers. Thus, the industry is largely
home-based and recent years has seen many new labels
emerging (Roy 2003). This is a labour-intensive
industry and a large number of people are involved,
with many working seasonally as cashew-nut grove
workers (Mandal et al., 1985).
4 Interestingly, some of the government documents refer to the cashew extract as “Cashew Liqour” whereas the toddy extract (Maad) is called “Coconut Fenni” (see GoG Various Years). Some other government documents refer
to the two as Caju liquor and Toddy liquor (see GoG’s “Goa at a Glance”). And then there is a generic term which is
used for both toddy and Caju called “country spirit or liquor”.
Picture 1: A bottling unit
15 | P a g e
2.1 The Product and the Process
The Cashew fruit (apple) is plucked when ripe and
then crushed to extract the juice (see the Production
cycle chart “Annexure 2-Figure 10”). This is then
fermented and distilled to produce either the Urak
(first distillate) or Feni (traditionally the third
distillate). A second distillate – Cazulo is no longer
being produced.5
Traditionally feni manufacturing process involves the
following steps – collection of ripe apples and
crushing them to extract juice. Like wine-making in
the West, the apples of cashew were also crushed by
human feet in a stone depression called kolmbi. The
pulp that remained is then tied together in a Nudi
(earlier with creepers, now with ropes) and kept under
a heavy stone to extract the remaining juice. 6 It is
estimated that about 3.5 kgs of apples in this process
gives about 1 litre of juice. Those who have moved to
a more modern pulp squeezing system are able to
extract juice more efficiently almost twice that of the
traditional method (Mandal et al 1985). 7 These
manufacturers use mechanical crushers/squeezers
instead of traditional kolmbi method.
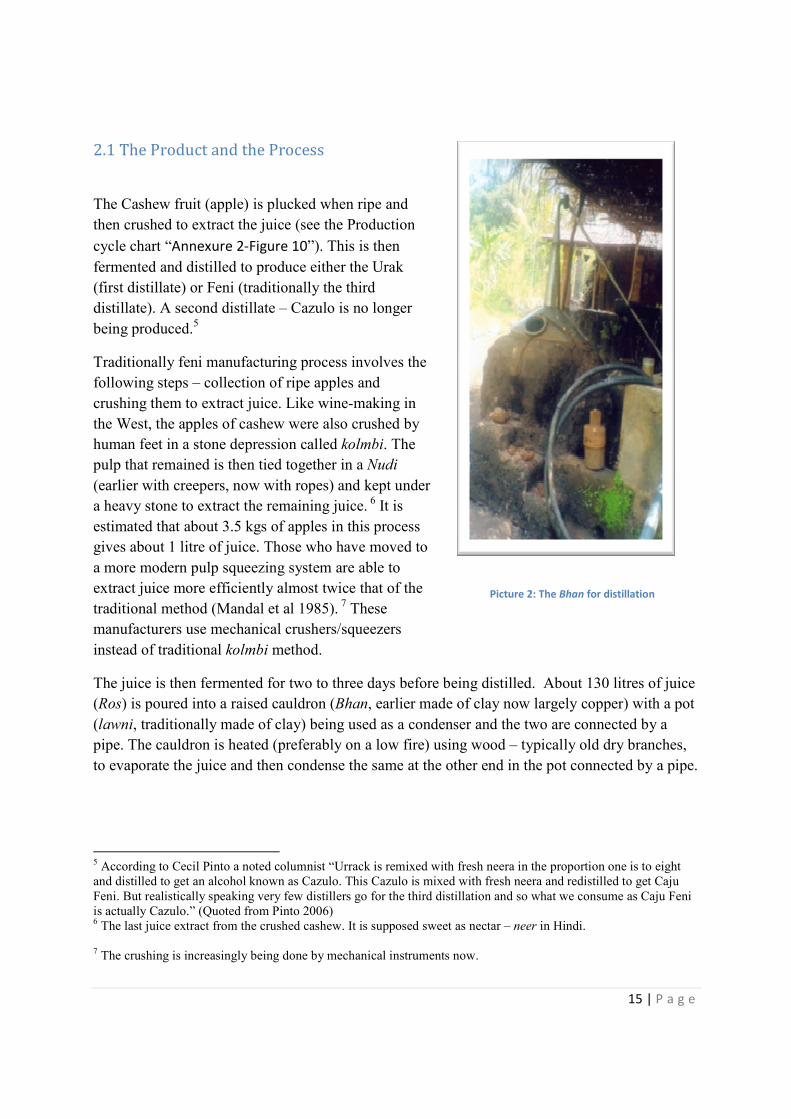
The juice is then fermented for two to three days before being distilled. About 130 litres of juice
(Ros) is poured into a raised cauldron (Bhan, earlier made of clay now largely copper) with a pot
(lawni, traditionally made of clay) being used as a condenser and the two are connected by a
pipe. The cauldron is heated (preferably on a low fire) using wood – typically old dry branches,
to evaporate the juice and then condense the same at the other end in the pot connected by a pipe.
5 According to Cecil Pinto a noted columnist “Urrack is remixed with fresh neera in the proportion one is to eight
and distilled to get an alcohol known as Cazulo. This Cazulo is mixed with fresh neera and redistilled to get Caju
Feni. But realistically speaking very few distillers go for the third distillation and so what we consume as Caju Feni
is actually Cazulo.” (Quoted from Pinto 2006) 6 The last juice extract from the crushed cashew. It is supposed sweet as nectar – neer in Hindi.
7 The crushing is increasingly being done by mechanical instruments now.
Picture 2: The Bhan for distillation

16 | P a g e
About 24 to 26 bottled litres (BL) of liquid is obtained at the end of the distillation process. This
is called the Todap – the first distillate, also sold as Urak. This is meant to have a concentration
of 16% grau approximately but varies (see survey discussion below). 8
In the second round of distillation another 130 liters of fermented juice is mixed with 25 litres of
the first distillate (the todap) and distilled. This on condensation gives 23 to 25 litres of Feni of
19% grau. This is the double distilled Feni. In effect about 440 kgs of apples when crushed at the
efficiency level of 60% juice extraction provides 23-25 litres of BL feni.9
These numbers differ from area to area and are dependent on the crushing method and the type
of cashew apple being used. Mandal et al 1985, e.g., record that production of one litre of feni
requires 30 kg of cashew apples (as different from 22 stated above by some distillers’ personal
communication).
2.2 The state and Feni production
The Feni industry is an important source of revenue to the excise department and contributes to
the Revenue receipts of the state 10 However, the production of beer, IMFL (Indian-made foreign
liquor), seems to be upstaging the tax contribution of feni (see Table 6).11 There are many
reasons for this change in alcohol production profile in the state. This may partly have to do with
consumer tastes and preferences, excise policies, and production techniques.
The production of feni has hit an upper bound as there has not been a significant increase in
either the area under cashew plantations nor the productivity of the existing plantations. As we
have seen earlier, the cashew productivity in Goa is much below other states in India. The
agricultural department in order to increase the productivity of cashew kernels has introduced
new varieties, like the Vengurla varieties, which however are geared towards increasing the
8 The grau is density measuring instrument that provides level of alcohol concentration (see Picture 4).
9 I am grateful to Mr Bhakta for sharing this information.
10 As per the excise department’s report, the following activities are licensed under the feni liquor trade:
Cashew
1. extract cashew juice (Rule 70)
2. select licenses to manufacture cashew liquor (Rule 71)
3. to manufacture cashew liquor (Rule 73).
4. to set up modern distilleries to manufacture cashew liquor on scientific method (notification No.Fin
(Rev/LAG/704/68(A) dated 5-4-1972).
11 Feni falls under the classification of being a Country Liqour. By virtue of this tag, it cannot legally be sold in any
other part of the country – that is excise laws of the country forbid the inter-state trade in country liquors. IMFL –
Indian made foreign liquors (the Indian bottled or manufactured whisky, Rum, Vodka etc.) and beer on the other
hand can be produced in one state and sold in another. This gives the “non-Country liquors” an edge in terms of
reach of market at least in the Indian context.

17 | P a g e
kernel output. This is at the cost of the cashew apple size which is critical for sustaining feni
production. The logic behind this is not hard to guess since the nut has a very high commercial
value. The apples, however, are less juicy on these new trees and according to some of our
respondents the taste too is different from the traditional varieties. Given the boundedness on
both these counts (area & productivity), total feni production could not have increased. Cashew
apple is not normally transported across state borders.12 Therefore, feni manufacturers have to
contend with supply of cashew apples from the state.
There are two ways that this supply barrier could be eased. One, allow import of cashew apple or
cashew juice from other states like neighbouring Karnataka, Maharashtra, or Kerala. Second,
upgrade productivity of plantations and juice extraction devices (a more expensive but desirable
proposition for the long run). Modern crushers which are able to extract a greater amount of juice
from the pulp are a positive technological change in this direction.
Table 6: Production of Feni, IMFL and Beer and Excise revenue collections (all figures in million)
Year
Production
of cashew
liquor
(litres)
Production
IMFL other
than beer
(litres)
Production
of Beer
(litres)
Excise
from
Country
Liquor
(Rs)
State
Excise
(Rs)
Total Tax
revenue
(Rs)
1971 1.089 0.202 1.962 1.939 13.5 48.2
1986 0.986 1.617 10.34 9.461 68.953 605.91
1996 0.736 12.88 23.759 9.25 290.3 3245.091
2000 0.484 14.351 21.301 5.995 390.0 5382.33
2004 0.875 18.99 22.8 10.73 550.0 7657.3 Source: GoG (Various years)
The excise department grants licenses for extraction of cashew juice (by bidding and tendering),
grants licenses for manufacture cashew liquor by erecting stills and also to set up modern
distilleries to manufacture cashew liquor using modern methods. The Annual calendar of Feni
production is provided for illustrative purposes (see Annexure 2-Figure 10)
12 There were however some respondents who said that they receive cashew apple supplies from Maharashtra’s
bordering areas but these numbers were very few.

18 | P a g e
Source: GoG (various years)
In 2006, there were 1532 successful bids for cashew zones in Goa for which license was granted
by the State Excise department for extraction of cashew juice. Sattari accounted for nearly a third
of cashew zones (see Annexure 1 Figure 9 for the Administrative distribution of the state). Once a
bidder is successful in obtaining rights of juice extraction, he or she has to obtain licenses for
distilling it to produce cashew liquor (see Table 8 below). This does not involve a bid but a
purchase of license from the local excise office. Typically, a bidder would obtain licences for 1-3
stills depending on the spread of the cashew zone. He could either operate these stills himself or
give it out to others. A third party may also obtain a license but s/he would do so only if there
was a guarantee of cooperation from the cashew zone bidder. Sometimes more than one still
licenses are obtained for one cashew zone if the plantation covers a large area. It is easier to
crush and distill in locations closer to the point of cashew apple collection rather than pool all the
produce in one place otherwise it would involve walking over large distances in summer in hilly
terrain.
Each zone is delineated according to traditional cashew orchard ownership and geographical
location. Sattari taluka accounts for the largest cashew production with about a third of the total
number of zones and Stills in the state located there. However, Salcete tops the list of cashew
retail licenses and Bardez is a distant second.
Table 8: Taluka-wise Cashew Zone Bidders, Stills and Retail licenses (2006)
No. Talukas Zone/Bids Stills (2005-6) Retailers of CL
1 Canacona 90 110 375
2 Bardez 91 253 1700
3 Bicholim 169 424 325
4 Marmugao 31 51 577
5 Pernem 140 140 303
6 Ponda 128 247 693
Table 7: Area Under Cashew plantation (in hectares)
Year
Total Area Under
Cashew nut (in
Hectares)
Total area sown
under crops (in
hectares)
Cashew as a proportion
of Total Area Sown (%)
Number of licenses
issued for stills
1986 46888 130575 36 3037
1996 51360 165506 31 3991
2000 53767 171356 31 3217
2004 54858 169200 32 3095

19 | P a g e
7 Quepem 79 129 437
8 Salcete 17 78 3200
9 Sanguem 150 221 300
10 Tiswadi 76 150 999
11 Sattari 561 853 191
Total 1532 2656 9145
Source: Excise Department, Government of Goa, Panaji, 2007
2.3 Feni Industry
The stake holders in the industry can be grouped under four broad heads—the distillers, the
retailers, whole-sellers and the bottlers. Table 9 below provides the number of each category who
were reported to be involved the feni business in 2005-6.
Table 9: Category-wise distribution of supply chain agents (2005-6)
Category Numbers
1 Number of Cashew Zones 1532
2 Licensed stills 2656
3 Retailers 9145
4 Whole sellers 94
5 Bottlers 19 Source: Excise Department, Government of Goa, Panaji, 2007
Feni production is done by distillers of varying sizes of
operation. Typically, the feni distiller would sell to whole
sellers, bottlers as well as retail outlets including small
restaurants and tavernas (local bar). Some of them even own a
taverna or restaurant where they sell to customers in unsealed
and unlabelled bottles.
Local Goan consumers do not normally buy bottled and
branded feni but source their supply from distillers whom they
have been associated with traditionally probably
generationally, very often from their own neighbourhood.
They also typically buy bulk quantities – some procure their
annual supply soon after the distillation has taken place, and some buy it in phases in case
stocking is not possible at residences.
Bottlers, most of whom have relatively new brands, have
capitalized on demands for feni from two market segments (a)
Picture 3: A modern crushing machine
with cashew apples tied in a net at the
bottom

20 | P a g e
expatriate Goans (living elsewhere in India) or abroad, and (b) non-traditional Feni drinkers –
tourists who travel to Goa and drink as well as carry back “something local” in memory of their
visit to the state. This category of consumers finds a sealed branded bottle to be more a “reliable”
product. We have discussed this elsewhere in the report.
2.4 Area under Cashew
The area under cashew plantation has increased marginally in the last two decades but as a
proportion of total area sown in the state it has declined. In the last decade or so there has been
stagnancy in the area as well as the proportion mentioned above (see Table 7).

21 | P a g e
3. The Survey
3.1 Objective
The idea of this survey was to create a baseline data readily
accessible in the public domain on the structure of Goa’s Feni
industry. When we began thinking about this study, we were
unable to find much base-line data on the Feni industry. The excise
department and the Directorate of Planning, Statistics and
Evaluation maintain time series data on some variables which
provided basic insight into the industry. In addition, there are some
very knowledgeable people on the subject in Goa who provided
information which was very helpful in planning this study.
Just to get an idea of the number of people reliant on their
livelihoods on this industry, we can use secondary data on the
number of licenses issued in 2005 for this trade – 1532 cashew
zones, 6589 retailers, 94 whole sellers, and 19 bottlers, 2656
licensed stills suggests that a fairly large number of people
dependent on this industry. If on average at least 10 persons at each
unit-level (except the zones) are involved, a conservative estimate
would suggest that about 100,000 persons are dependent partly or
wholly for their livelihood on the feni industry. At a juncture when
a GI application is in process, base line data would be invaluable
not only for understanding the current state of affairs but also be
useful for comparative exercises in future.
3.2 Sampling strategy
Distillers and Retailers: A stratified random sampling technique was
used for this primary survey.
Whole sellers: A simple random sampling strategy was adopted for sample selection.
Bottlers: Survey of all agents
Picture 4: The grau test for
measuring alcohol concentration
22 | P a g e
Interviewees were picked from the sampling frame prepared after getting the complete list of all
agents involved in the trade as categorized into distillers, retailers, whole-sellers, and bottlers,
from the Excise department.
Given the large number of distillers and retailers involved, we used a two-stage stratified random
sampling strategy to pick our sample of 460 bidders (about 30% of the total number of bidders)
and 66 retailers (about 1% of the total number of retailers). There were numerous reasons why
we picked different proportions of stakeholders, i.e. distillers, retailers, whole-sellers and bottlers
for our sample: (a) The most important agents in terms of output are the distillers, so we wanted
a large representation of them in the study sample. Also they do not produce any other alcoholic
beverage and therefore feni is the only reason for involvement in the alcohol industry. The
bottlers were the smallest in number and from our primary information were also solely involved
in the feni business. This prompted us to choose all bottlers for our sample study. We attempted
to select a large proportion of whole-sellers as they were smaller in actual number. The retailers
were the largest in number among all four categories who were linked to the feni trade but they
were also involved in selling of other products – say IMFL, beer and other beverages. So we
chose a smaller proportion of retailers. The whole sellers and retailers represent the tail end of
the feni supply chain (see Table 10).
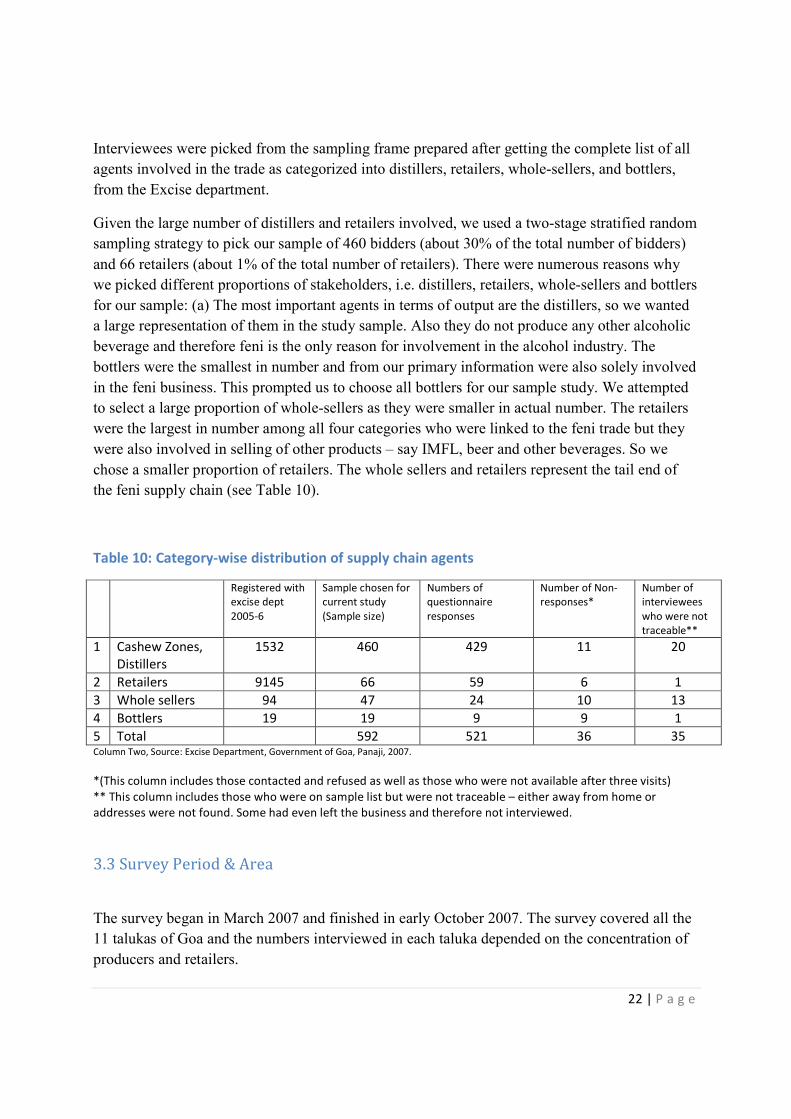
Table 10: Category-wise distribution of supply chain agents
Registered with
excise dept
2005-6
Sample chosen for
current study
(Sample size)
Numbers of
questionnaire
responses
Number of Non-
responses*
Number of
interviewees
who were not
traceable**
1 Cashew Zones,
Distillers
1532 460 429 11 20
2 Retailers 9145 66 59 6 1
3 Whole sellers 94 47 24 10 13
4 Bottlers 19 19 9 9 1
5 Total 592 521 36 35 Column Two, Source: Excise Department, Government of Goa, Panaji, 2007.
*(This column includes those contacted and refused as well as those who were not available after three visits)
** This column includes those who were on sample list but were not traceable – either away from home or
addresses were not found. Some had even left the business and therefore not interviewed.
3.3 Survey Period & Area
The survey began in March 2007 and finished in early October 2007. The survey covered all the
11 talukas of Goa and the numbers interviewed in each taluka depended on the concentration of
producers and retailers.
23 | P a g e
3.5 Questionnaire
Four separate questionnaires were used for surveying the four different stakeholders. The
questionnaires were designed to elicit information on socio-economic background and their
degree of involvement with the feni industry, understand backward and forward linkages. They
are attached as an appendix at the end of this report.
3.6 Survey outcome
We will briefly present here the outcome in meeting respondents from our sample. Of the
targeted 460 distillers, 429 interviewees provided information. In this baseline report we will
discuss some of the responses for which adequate number of responses were received. Reasons
for non-completion of the targeted number (460) are – a) inability to meet the interviewee in
three attempts, (b) interviewees unwilling to be interviewed, or c) inability to locate interviewee.
In the case of Whole sellers and the non-response rate was much higher than in the other
categories (See Table 10 and Table 11).
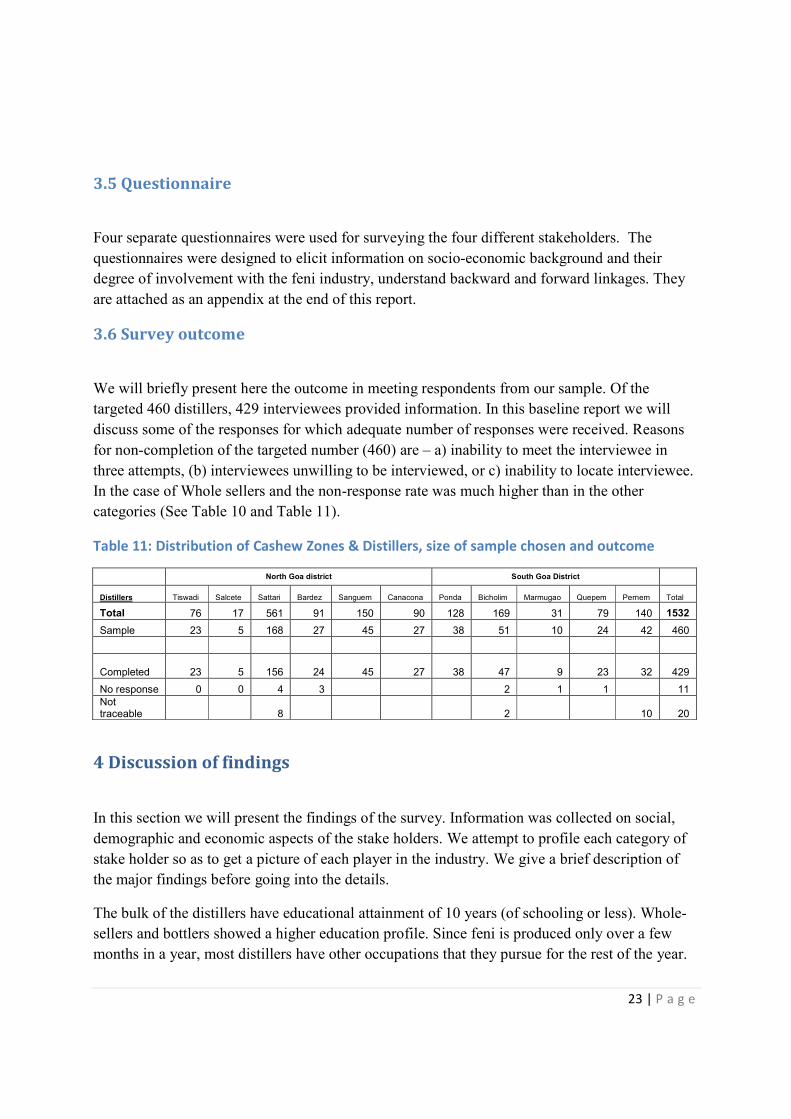
Table 11: Distribution of Cashew Zones & Distillers, size of sample chosen and outcome
North Goa district South Goa District
Distillers Tiswadi Salcete Sattari Bardez Sanguem Canacona Ponda Bicholim Marmugao Quepem Pernem Total
Total 76 17 561 91 150 90 128 169 31 79 140 1532
Sample 23 5 168 27 45 27 38 51 10 24 42 460
Completed 23 5 156 24 45 27 38 47 9 23 32
429
No response 0 0 4 3 2 1 1 11
Not traceable 8 2 10 20
4 Discussion of findings
In this section we will present the findings of the survey. Information was collected on social,
demographic and economic aspects of the stake holders. We attempt to profile each category of
stake holder so as to get a picture of each player in the industry. We give a brief description of
the major findings before going into the details.
The bulk of the distillers have educational attainment of 10 years (of schooling or less). Whole-
sellers and bottlers showed a higher education profile. Since feni is produced only over a few
months in a year, most distillers have other occupations that they pursue for the rest of the year.

24 | P a g e
About half the distillers also claimed that they had been in operation for less than 11 years. Most
agents claimed that the business was started by them. The respondents were almost equally split
in claiming that this was a traditional family business. The stills are almost entirely self owned
(in the sense that there is no rental market) and the production technique is predominantly semi-
traditional. The role of hired hands in the feni distillation in low. Few of the bottlers use their
own distillate to produce brands while the rest procure from smaller distillers.
Urak and Feni do not seem to be homogenous products as there is a fair degree of variation in the
alcoholic concentration. There is some price differentiation at the distiller level but none at the
retailers and whole-seller level.
Distillers sold the bulk of their produce to bars directly. Retailers too sold the bulk of their stock
through restaurants and that too self owned restaurants. Branded sale was a very small proportion
of the unbranded segment of the market. This implies that feni’s largest point of sale is the
restaurant. This is not surprising since the branded bottled segment seems to be a much smaller
proportion of the total feni sales. The grau and taste based methods were the most popular testing
mechanisms. This is largely a self financed industry and also unorganized except for the bottlers.
On the question of GIs, except for the bottlers, the overwhelming majority of the respondents
had no information about GIs or that there was an effort on to get GI protection for Feni.
We now go on to discuss details of the findings starting with the socio-economic profile in the
next sub section.
4.1 Socio-Economic profile
The effort here was to get an idea of what each agent’s socio-economic profile looked like. Here
we present findings on age, education, occupation and years of operation.
4.1.1 Educational level
Most of the distillers interviewed had not gone beyond school (12 years of schooling). In fact,
79% had not studied beyond class 10. Only about 8% held a graduate degree or more. The
retailers showed better educational attainment – 13% had graduate degrees or more. Whole
sellers had lesser number of persons in the below class 8 category but showed greater number of
persona in the Under Class 12 category. Almost 60% of the whole sellers had between 10-12
years schooling. The bottlers however showed the highest level of educational attainment. 86%
of them had completed graduation while the rest had finished 12 years of schooling.

25 | P a g e
Table 12: Highest Qualification (percentage)
S. no. Educational Attainment Distiller
(N=379)
Retailer
(N=46)
Wholesale
(N=15)
Bottlers
(N=8)
1 Illiterate 9 8.7 6.7 0
2 Class 4 or less 18.5 6.5 6.7 0
3 Class 8 or less 19.3 21.7 13.3 0
4 Class 10 or less 32.2 32.6 26.7 0
5 Class 12 or less 13.2 17.4 33.3 14.3
6 Graduate 7.7 10.9 13.3 85.7
7 PG 0.3 2.2 0 0
9 Total 100.0 100.0 100.0 100
4.1.2 Other occupations
Distillers:
For many distillers this is not a full time activity essentially because like the any agricultural
season once the distillation ends at the end of summer their work gets over. Only 3.5% of the
distillers claimed that this was a full time job for them for the whole year. The types of work that
most distillers are also involved in are as below -- the majority of the distillers being involved in
agriculture.
Table 13: Type of Work
Type of work Percent
Agriculture 65.3
Private service 6.5
Government Service 3.7
Industrial work 0.3
Others 24.2
Total 100.0N=323
4.1.3 Years of operation
Three-fourths of the current distillers interviewed have been in operation for less than twenty
five years. And half the sample has 11 years or less of operating experience. This probably
suggests that many of the current distillers are first generation distillers. When complemented
with the fact that 50% of the sample were less than 46 years of age, and 75% of the sample 58
years of age this assessment is likely to be true. This however needs to understood in light of the
discussion in Section 4.2.1.
A similar trend is also found among the retailers. The bottlers seem to have been in business for
longer than many of the distillers and retailers with about 50% of the respondents having been in
business for 22 years or more.

26 | P a g e
Table 14: Years of operation
Percentile Distiller (N=403) Retailer (N=52) Whole seller (N=24) Bottler (N=8)
25 5 5 2
50 11 12.5 22
75 25 28.75 32
Table 15: Age of respondent
Percentile Distiller (N=415) Retailer (N=56) Whole-seller (N=21) Bottler (N=8)
25 35 39 44.5 42
50 46 46 50 48
75 58.5 57.7 60 58
4.2 Production history
We wanted to examine here the inter-generational linkages of the present agents in the feni
industry. How long back could the feni tradition be dated. It is popularly believed that this is a
family tradition that has been handed down from generation to generation. Our survey seems to
suggest otherwise. It is possible (and this is just a hypothesis) that there is neighbourhood effect
– people in the neighbourhood (not necessarily family) may have taken over the distillation.
4.2.1 Feni a family tradition
The distribution of feni production being a family traditional were marginally different –
suggesting an equal number of new entrants into the feni production business. It seems that many
of the producers in Sattari taluka were present generation producers. Sattari was also the taluka
which has the largest number of zones and still licences. In the other talukas the bulk of the
producers said this was a family tradition. Table 16: Feni being a family tradition
Family Tradition Percent
No 51.6
Yes 48.4
Total 100.0
N=364
4.2.2 Who in family started feni distillation
A majority of respondents claimed that theirs is the first generation involved in feni
manufacturing. Your survey results indicate that most of the new entrants are from Sattari taluka
where the bulk of the stills and cashew zones are located. About 29% said that it was their father
who started it and only 12% have been distilling feni for two or more generations. Among the
retailers and whole sellers, the presence of current generation starters is even stronger. This could
be directly related to the boom in tourism business.
27 | P a g e
Table 17:Family lineage— Business started by (percentage)
Distillers (N=383) Retailers (N=46) Whole sale (N=16)
Self 54.3 65.2 81.2
Father 29.2 26.1 12.5
Grand father 12 6.5 6.3
Uncle .3 0 0
Others 3.9 2.2 0
Total 100.0 100.0 100
4.3 Production conditions
In this section we discuss the production conditions in the feni industry. Here we try to
understand the production techniques, the scale of operation, ownership patterns and extent of
hired labour use.
4.3.1 Number of stills
This is predominantly a small-scale industry with the bulk of the distillers (73%) having only one
still for distillation. Less than 3% of the distillers owned five or more stills. Table 18: Number of stills per distiller
Number Percent Cumulative Percent
1 72.9 72.9
2 19.1 92.0
3 3.6 95.6
4 1.3 96.9
5 or more 3.1 100
Total 100.0
N=388
4.3.2 Still ownership
Almost all distillers owned their own still for distillation. A tiny percentage said that they did not
own their own still (2%). Table 19: Ownership of stills
Percent
No 2.5
Yes 97.5
Total 100.0
N=216 Still rented out
There is a small rental market for stills. 95% of the distillers said they do not rent out their stills.

28 | P a g e
Table 20: Rental of Stills
Percent
No 95.4
Yes 4.6
Total 100.0
N=211
4.3.3 Type of still
A majority claimed to use semi-traditional techniques of production – 78%. Also 20% claimed to
using the traditional techniques. By traditional we mean the use of clay or earthen pot for heating
the cashew juice in the distillation process. By semi-traditional we mean various innovations
including the popular use of copper pots instead of clay. There have been innovations to also
change the recipient receptacle where distillation takes place. Modern distillation here means the
use of mechanised crushing equipment and or steel distillation unit/vessels. Table 21: Type of Stills
Type Percent
Traditional 19.9
Semi-traditional 77.5
Modern 2.6
Total 100.0
N=389
4.3.4 Frequency of still change
Distillers when asked how often they change the still equipment, about half said every year and
another half said only when it is damaged. From the information, provided, while the pot is not
changed every year some of the fittings are. The pot and receptacle is replaced only when they
are damaged. So the numbers below have to be carefully interpreted. Table 22: Frequency of Still change
Percent
Every year 48.4
Every 2-5 years 1.1
More than 5 years .8
Only when it is damaged 49.7
Total 100.0
N=376
4.3.5 Location of still (for distillation)
Most of the production is very localized. Bulk of the production takes place in the orchard area
(mainly own orchard – 69%). Some produce it near their home (when orchard area is close by)-
24% and very few produce elsewhere – 7.5%. Table 23: Still location

29 | P a g e
Percent
At or near home 23.5
Own orchard area 69.0
Other's orchard area 6.2
Others 1.3
Total 100.0
N=387
4.3.6 Who supervises
The feni production is almost entirely supervised by self or family. Less than one percent of
distillers used hired hands to supervise the distillation. The retail business even though
dominated by self or family supervision, however, uses more hired managers to supervise than
the distillers. In the whole sale business too there seems to be an involvement of a higher
proportion of hired managers though as in the other categories, self involvement is still very high
(80%).
Table 24: Supervision of work
Supervision Distillation (N=367) Retail (N=58) Whole seller (N=20)
Self 93.5 77.5 80
Family 5.7 8.7 0
Hired Manager .8 13.8 20
Total 100 100 100
All the bottlers have registered companies which are privately held. 85% of them do not produce
feni but bottle and brand it. Only 15 % of the bottlers produce their own feni. The bottlers
employ between 3-12 employees with 53% employing more than 5 or more persons. Most
bottlers procure feni from small distillers and then produce brands for sale.
4.4 The Product
Traditionally there are supposed to be three extracts of the cashew apple juice – urak, cazulo and
feni (the first, second and third distillate). The survey reveals that cazulo is rarely manufactured,
if at all. This section details the findings on the alcoholic concentration of Urak and Feni, the sale
price, the proportion of branded and unbranded sale, etc. It is evident that neither urak nor feni
are homogenous products. They differ in terms of concentration, across distillers as does the
price.
4.4.1 Feni’s alcoholic concentration
The concentration of feni as measured in Grau varied between 17-24% with the bulk of distillers
claiming a concentration between 19-22 -- almost 88% of the distillers. However, 21% was the
most commonly produced concentration (mode). The bottlers said their feni concentration was

30 | P a g e
between 18-25, a shade higher than that of the distillers. 86% of the bottlers however had
concentration levels between 18-21%.
Figure 2: Alcoholic concentration of Feni
4.4.2 Urak’s alcoholic concentration
The concentration of Urak ranged from 12-19 % grau but the bulk of distillers ranged between
14-16 grau (almost 95%).
The manufacture of Urak like feni does not have a defined concentration and ranged between 12-
19. However the bulk of the distillers (93%) claimed concentration of 14-16% grau.
Figure 3: Alcoholic concentration of Urak
N =303
Cazulo does not seem to be produced anymore.

31 | P a g e
4.4.3 Quantity
Almost 91% of the distillers said they on average produce 10 cans of feni every season. In the
case of Urak too 93% of the distillers claimed they produce 10 cans.13 However, the reliability of
this information is doubtful as under reporting of production for tax purposes is not uncommon
as Excise department has flying squads to check on .
4.4.4 Price
The range of prices reported for Urak sale ranged from Rs 200- 1500. However, 67% of the
distillers charged between Rs 400-600 per can. 78% of the distillers of feni on the other hand
charged between– Rs 800-1200 can.
A little more than half the distillers (55%) said they maintain the same price over the year, 45%
said they increase the price as the year goes by. However, while 34% said they charge the same
price to all customers, 66% percent said they have different prices for different customers
depending on whether the customer came and purchased or whether the seller had to go to their
residence to make transaction.
Most of the retailers (82%) too said that they too do not change prices at different times of the
year. The whole sellers too (86%) said that they do not charge different prices at different time of
the year.
The retailers and whole sellers were however unanimous that they do not charge different prices
for different customers. So at least the retail and whole sale market seems more anonymous and
competitive than the distillers selling behavior.
Retailers: The price of cashew feni has gone up according to 71.7 % of the retailers while 25.6%
felt there was no change and 73% felt that this price was due to an increase in demand.
Whole seller: A majority of whole sellers said the price of cashew feni had gone up and about
42% felt there was no change in the last five years.
Table 25:Feni price change in last 5 years (percent)
Retailer (N=39) Whole seller (N=12)
Gone up 71.7 58.3
No change 25.6 41.7
Gone down 3.7 0
Total 100 100
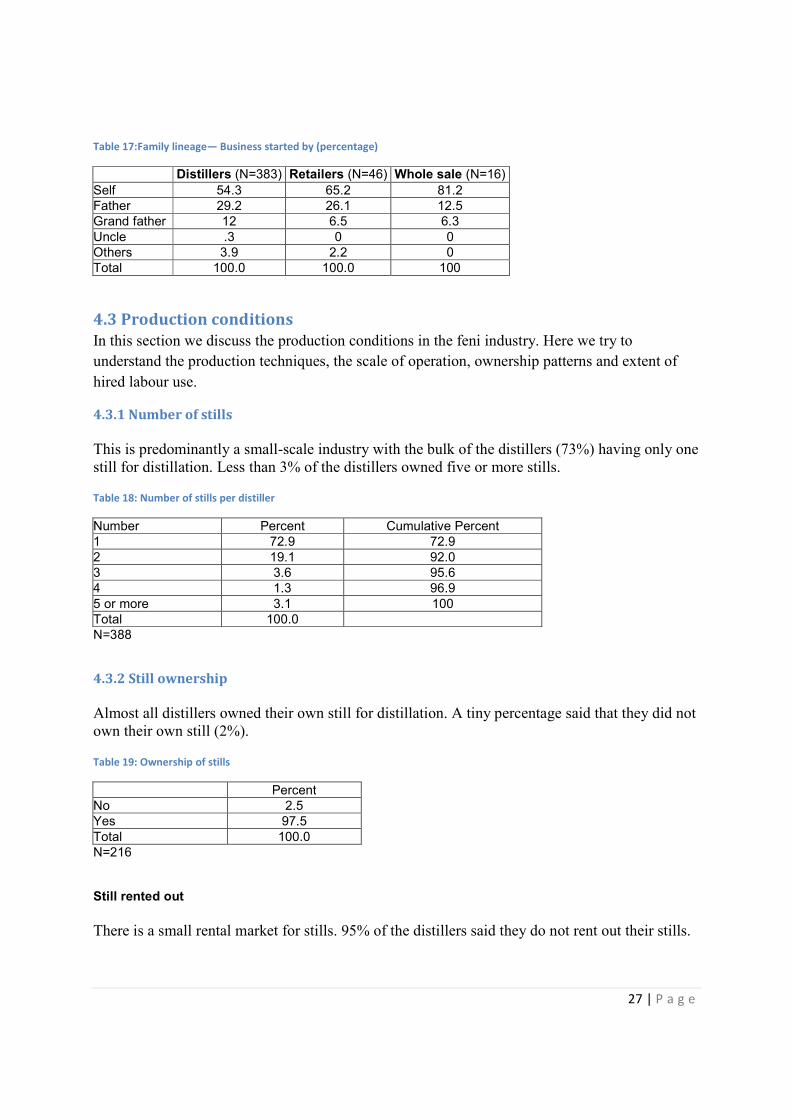
Distillers: 96% percent of the distillers said that they do not produce any Feni for themselves.
The major sales seems to be made to bars directly. 75% of the distillers sell to bars directly more
than ¾ of their product.
13 Each can of feni contains 2.5 causos of feni and each causo is 18 bottles of 750 ml or 15 BL.
32 | P a g e
Figure 4: Proportion of Feni Production for bar & restaurants (distillers N= 369)
Whole sellers: Direct sales to customers constituted 94.5% of the transactions of the whole
sellers. Another 50% said they sold to retailers too. None of them recorded sale to large bottlers,
exports or kept any portion for self consumption.
Bottlers: The bulk of their production is sold through whole sellers. 85% sold their entire
production to whole sellers and another 15% route most of their produce through whole sellers
and some through retailers.
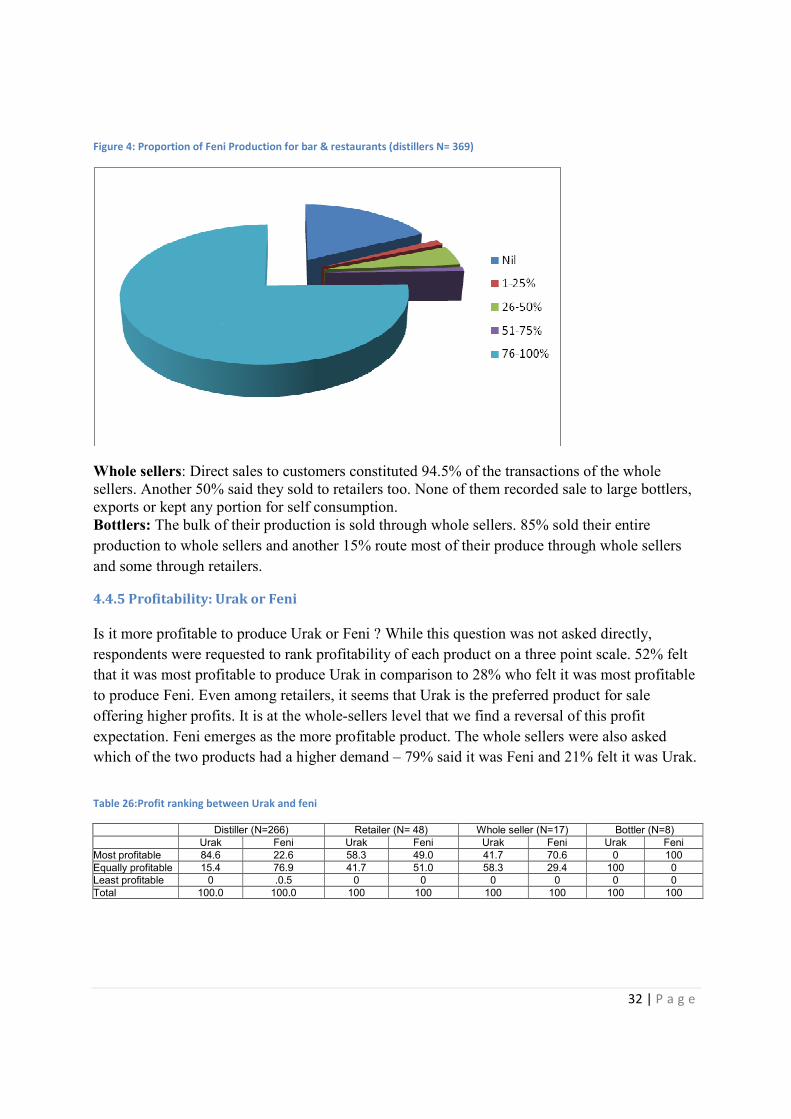
4.4.5 Profitability: Urak or Feni
Is it more profitable to produce Urak or Feni ? While this question was not asked directly,
respondents were requested to rank profitability of each product on a three point scale. 52% felt
that it was most profitable to produce Urak in comparison to 28% who felt it was most profitable
to produce Feni. Even among retailers, it seems that Urak is the preferred product for sale
offering higher profits. It is at the whole-sellers level that we find a reversal of this profit
expectation. Feni emerges as the more profitable product. The whole sellers were also asked
which of the two products had a higher demand – 79% said it was Feni and 21% felt it was Urak.
Table 26:Profit ranking between Urak and feni
Distiller (N=266) Retailer (N= 48) Whole seller (N=17) Bottler (N=8)
Urak Feni Urak Feni Urak Feni Urak Feni
Most profitable 84.6 22.6 58.3 49.0 41.7 70.6 0 100
Equally profitable 15.4 76.9 41.7 51.0 58.3 29.4 100 0
Least profitable 0 .0.5 0 0 0 0 0 0
Total 100.0 100.0 100 100 100 100 100 100

33 | P a g e
4.4.6 Time taken at plantation/hrs per day
Production of feni is a very labour-intensive task. Plantation maintenance takes long hours as
plantations are ranged on undulating hill sides About 86% of the respondents said they spent
upto 8 hours to maintain plantations. At the time of ripening of the cashew apple, there has to be
intensive collecting of the apple (locally called inchta). This is done manually and again 86% of
the respondents said they spend 4 hours a day to collect cashews during this season. They also
spend another 4 hours in distillation (71%).
Table 27: Time taken at plantation -- hours per day
Number of hours Percent
3-7 2.8
8 86.2
9 or more 11
Total 100.0
N=354
Table 28: Time taken for Other activities -- hours/per day
Hours Collecting (N=350) Distillation (N=180)
1-3 6.6 % 18.9%
4 86.3% 71.1%
5 or more 5.1% 10 %
Total 100.0 100.0
69% of the distillers said they had no prior commitment to sell to anyone buyer before
production began in comparison to 31% who said they had prior commitments. 99% of the
distillers said that they do not undertake any form of advertising for their product. The retailers
were unanimous that they do not advertise their feni.
4.5 Quality Issues
4.5.1 Importance of cashew and distillation in determining feni quality
Distillers were asked what might be the factors that determine the taste of feni – like cashew,
distillation process etc. The distillation process was ranked by 70% as the most important
determinant of Feni Quality followed by Cashew quality (67%) as being Important (but not the
most important). Table 29: Importance of different factors in determining feni Quality
Cashew (N=350) Distillation (N=349)
Most imp 29.0 70.4
Important 66.9 9.5

34 | P a g e
Less Important 4.2 19.8
Least Important 0 0.3
Total 100.0 100.0
4.5.2 Test for Quality
Almost all (99%) the distillers said they conduct a test to check for quality of cashew liquor (and
90%) claimed to be using the grau test. 6% used a taste based method while another 5% said
they used traditional methods (like pouring feni from height for froth) to check the feni quality.
Among the retailers, 64% said they do a test for quality and 6% don’t. It is interesting that most
of the retailers do a taste based test for feni. The whole sellers who responded to this question
said that when they did a test it was a grau test. The majority of the bottlers (86%) used the grau
test while 14% said they used a taste based test for quality.
Table 30: Type of test for quality
Distillers (N=370) Retailers
(N=45)
Whole seller
(N=6)
Bottler (N=8)
Grao 88.9 2.2 100 85.7
Taste-based 5.9 73.3 0 14.3
Traditional* 4.6 20.0 0 0
Others 0.5 4.4 0 0
Total 100.0 100.0 100 100
* Pouring in glass and stirring to see if bubbles are formed.
When asked about the quality of their product in comparison to that of their neighbours’ product,
not surprisingly 89% of the respondents felt that their own feni was of better quality and only
11% felt it was same as the others. No one felt that their own quality was worse than others in
the same area. When retailers were asked the same question 97% of them said there quality was
better than the others. Among the bottlers too the feeling amongst the majority was that their feni
was better than the competition (83%) and the rest felt it was the same quality.
4.5.3 Quality comparison to others
The distillers overwhelming (94%) said that quality has remained the same in the last 5-10 years
while the remaining felt is had improved. None said the quality has gone down. Half the bottlers
felt that quality of feni has not changed in the last 5-10 years while the other half felt that it has
improved.
Table 31: Quality comparison
35 | P a g e
Distiller (N=358) Retailer (N=32) Bottler (N=8)
Better 89.4 96.8 83.3
Same as others 10.6 3.2 16.7
Not as good 0 0 0
Total 100 100 100
4.6 Sales
The sale structure suggests that the bulk of sale takes place directly to retail outlets. 75% of the
distillers sell to retailers directly. Around 95% of the distillers to do not sell to Whole sellers,
middlemen, large distilleries or keep for self consumption. Their main sales seem to be retailers
(75%). Interestingly, it also seems that bulk of the sales from retailers is not tourists but to locals.
This could be interpreted in two alternative ways. One possibility is that sellers did not
distinguish between Indian tourists and locals. So when they categorized consumers, only non-
Indians were identified as tourists. The second interpretation could be that the perception that
tourists are major consumers of feni is incorrect and the bulk of the consumers remain locals.
Table 32: Sale by distillers
Retailer Whole seller Middleman Large distillery Self Consumption
No 24.6 96.5 94.4 96.5 96.8
Yes 75.4 3.5 5.6 3.5 3.2
Total 100.0 100.0 100.0 100.0 100.0
N=342
4.6.1 Retail sale of Feni
Retailers responded that almost 80% of the sales is through restaurants and half the retailers sold it through their own restaurants. Restaurant sale
Sale through restaurant
Own restaurant
No 11.9 39.0
Yes 79.7 52.5
999 8.5 8.5
Total 100.0 100.0
4.6.2 Proportion of Unbranded feni sold

36 | P a g e
The sale of feni by the retailers is dominated by unbranded sales. We asked retailers as to what
proportion of their sale is branded and unbranded feni. Almost 88% of the interviewed retailers
said that their entire sales of feni was unbranded. Only 5% of those interviewed said that one
fifth of their sales was branded feni.
Proportion of feni sales Percent
80.00 5.0
90.00 5.0
95.00 2.5
100.00 87.5
Total 100.0
N=40
4.6.3 Brands
Among the most mentioned cashew feni brands sold by retail outlets were: PVV and Big Boss
followed Cashew King, Cazulana, Express, Goan Overseas, Philippines, White House, Cinthol,
Colva, Rambo, Ranger, Bachelor, Blue Sea, Goan Boss, Crown, President, Colva Premium.
The whole sellers mentioned the following as the highest selling brand name: PVV, Big Boss,
Philippines followed by Colva, Premium Goa, Philippines, Rambo, Coromandel, Pacific and
Rainbow.
The bottlers interviewed named the following as their best selling brands: Cazulana, Colva,
Diamond, Goan Salazar, Yes Boss. The second best selling brand of these distillers were: Brut
77, Captain, Cazupina, Goan Boss.
Some bottlers reported that Urak is also being bottled now and some of the brand names that
came up are: Captain, Goa Lords, Cazulana, Cazupina, Ranger.
4.6.4 Consumers
The retailers said that of their total sales less than 39 % of their sales are tourists while 83.3%
sell mainly to locals. The whole sellers reported a slightly larger sale of feni to tourists than the
retailers.

37 | P a g e
Figure 5: Proportion of sale to tourists (by Retailers (N=59) & Whole sellers (N=22))
4.7 Financing Structure
In this section we discuss the structure of financing in the feni industry. This industry is largely
self-financed. 84% of the distillers were able to meet all their financial requirements from own
sources. There is very little borrowing either from a money lender or a formal financial
institution like a bank. A similar response was received from the retailers as well as whole
sellers. The bottlers however had a slightly different financing structure. Table 33: Financing sources of Distillers
Self financing Money lender Bank
0-25 4.8 91.5 95.5
25-50 5.7 7.4 3.1
50-75 15.1 0 0.5
76-80 16.2 0 0.6
81-100 83.8 1.1 0.3
Total 100.0 100.0 100.0
N=352
4.8 Member of Association
Distillers: When asked if they were members of any distiller group, 99% claimed that otherwise.
This once again re-affirms the expectation that this is a largely unorganized industry as far as the

38 | P a g e
distillers, retailers and whole sellers are concerned. However when bottlers were asked about this
71% said they were members of a producer group. Table 34: Producer Groups and Bottlers
Percent
No 28.6
Yes 71.4
Total 100.0
N=8
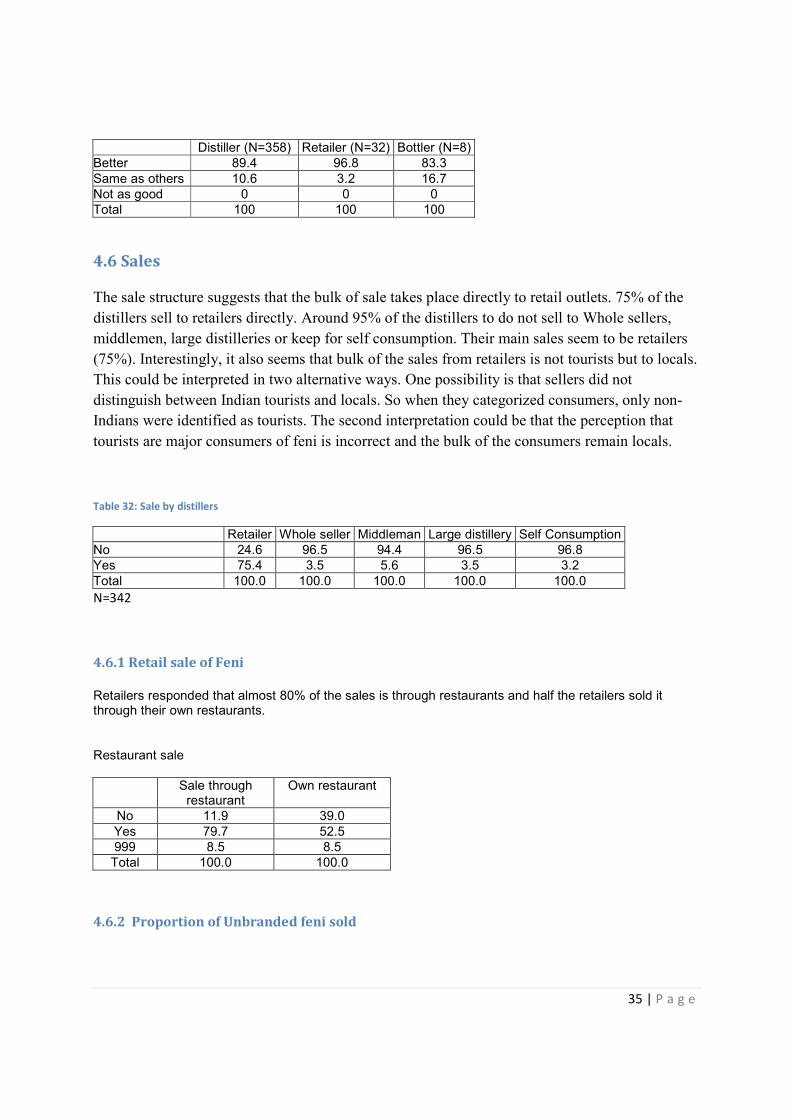
4.9 GI for Feni: Information & Role of Government
Bulk of the distillers (98.5%) had no idea what GI means or that there was an application
pending for registering Feni for GI protection. The same was true for the retailers and whole
sellers too. However, the bottlers were informed about the move for GI protection. Most of them
had received this information from fellow bottlers and some from the media. Figure 6: Information about GI
The bottlers were the only ones who responded to questions on GI and how it might affect the
scenario. They felt that GI protection would increase the branding effort, as well as prices. It
might also be an avenue for opening up of export market.
39 | P a g e
Figure 7: Expected Impact of GI on market Size (Bottlers N=7)
A little more than half the bottlers were not sure if the GI would market size. However, a
sizable proportion either “Agreed” or “Strongly agreed” that GI would increase their market
size. No one felt that market size would decrease.
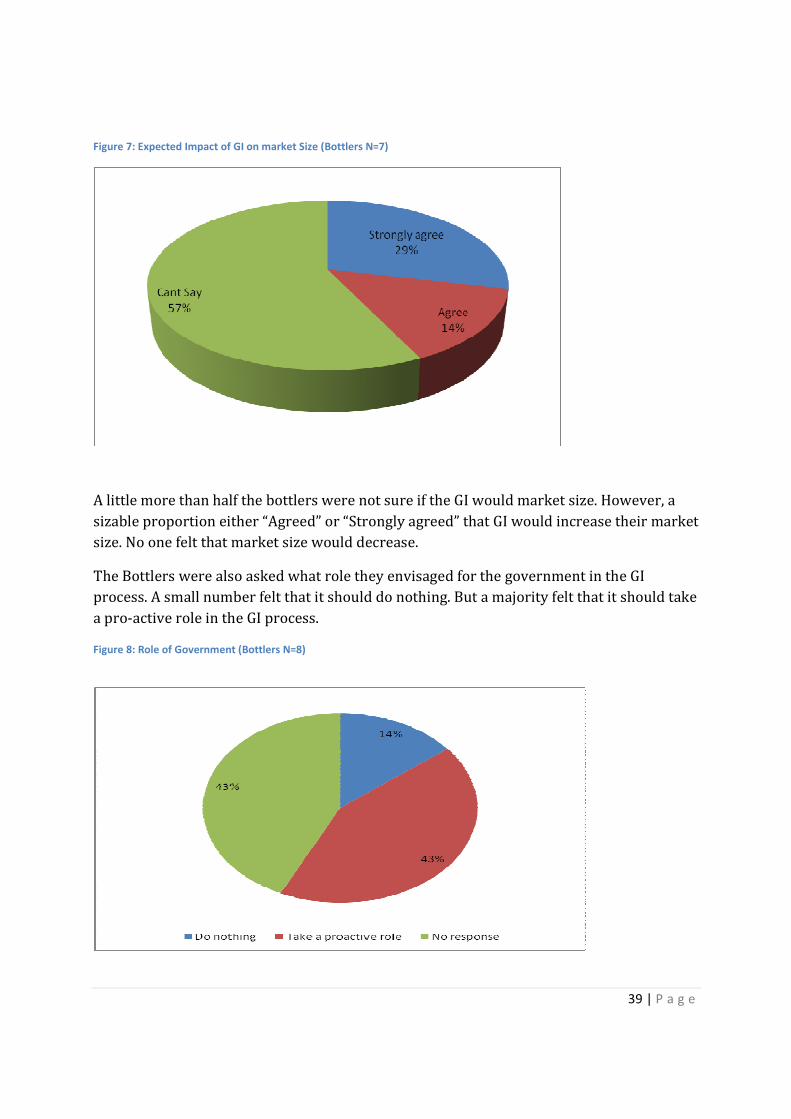
The Bottlers were also asked what role they envisaged for the government in the GI
process. A small number felt that it should do nothing. But a majority felt that it should take
a pro-active role in the GI process.
Figure 8: Role of Government (Bottlers N=8)

40 | P a g e
5 Conclusion
Feni is probably the best known of all country liquors in India. Its “fame” comes from wide
media attention in India on the “Goan USP”, of which feni is an important ingredient.
This survey conducted over the summer and autumn of 2007 covered four categories of agents
involved in the feni trade – the distillers, the retailers (including restaurants and bars),
wholesellers and the bottlers.
The idea of this survey was to create a baseline data readily accessible in the public domain on
the structure of Goa’s Feni industry – a segment of the Goan economy we found missing in the
literature. In 2005 there were 1532 cashew zones, 6589 retailers, 94 whole sellers, and 19
bottlers and 2656 licensed stills. This suggests that a fairly large number of people depend on
this industry for their livelihood.
The distillers on average showed a lower level of educational attainment in comparison to the
whole-sellers and bottlers. Most distillers have other occupations for the period that they are not
engaged in the feni trade or manufacture. There seems to be a fairly large proportion of distillers
who are first generation in the business.
Expectedly being a home industry, the stills are almost entirely self owned and the production
technique is predominantly semi-traditional. Few of the bottlers use their own distillate to
produce brands while the rest procure from smaller distillers.
Interestingly, Urak and Feni do not seem to be homogenous products as distillers reported a
variance in the alcoholic concentration of their product. There is some price differentiation at the
distiller level but none at the retailers and whole-seller level.
Sales of feni seem to be geared to end up in bars. The branded segment of the market is very
small and is largely an unorganized, self financed industry except for the bottlers.
The overwhelming majority of the respondents had no information about GIs or that there was an
effort on to get GI protection for Feni. The only exception were the bottlers who felt that the GI
would lead to an increase in market size for Feni. The bottlers however sought an active role for
the government in the GI process.

41 | P a g e
Reference
AIDA (undated) “With a current sale of Rs 60.75 crore, feni has more markets to be conqured - the
government willing,” All India Distillers’ Association web-site at
http://www.aidaindia.org/aida/canfeni.htm, last accessed December 30,2005.
Ali, S. H. Azam & E. C. Judge (2004) Small-scale cashew nut processing, FAO,
http://www.fao.org/inpho/content/documents/vlibrary/ac306e/ac306e00.htm#Table%20of%20
Contents, last accessed on October 15, 2007
Anon (2007) “Feni Goa-ing Global,” Ambrosia, May pages 28-33.
Couto, Maria Aurora (2005) Goa: A Daughter's Story, Penguin Books, New Delhi.
de Souza, Teotonio R. (1994) Goa to Me, Concept Publishing Company, New Delhi.
FAO (2007) http://faostat.fao.org/site/567/DesktopDefault.aspx?PageID=567, last accessed
November 24, 2007
GoG (2007) Economic Survey 2006-2007, Directorate of Planning and Statistics, Government of Goa,
Government Printing Press, Panaji, March
GoG (Various Years) Statistical Handbook of Goa, Directorate of Planning and Statistics,
Government of Goa, Government Printing Press, Panaji
GoI (2007) Economic Survey 2007-2008. http://indiabudget.nic.in, last accessed June 18, 2007
Kamat, Prakash (2002) “Goan distillery to patent feni, tap potential,” Times News Network ,
May 16.
Mandal, R.C., D.G. Dhangar, C.V. Dhume (1985) “Cashew Apple Liquor Industry in Goa,” Acta
Horticulturae (ISHS),108: 172-175, http://www.actahort.org/books/108/108_32.htm
Mathew, Jose (2004) “Cashing in On Apples,” Times Food Processing Journal, August-September,
http://www.etfoodprocessing.com/aug_sept04/marketmaking.htm, last accessed December 29,
2005.
Menezes, Ervell E. (2005) “The spirit of Goa,” The Tribune, June 12,
http://www.tribuneindia.com/2005/20050612/spectrum/main2.htm. Last accessed October 20,
2007
Newman, R.S. (1999) “The struggle for a Goan Identity,” in N. Dantas (ed.) The Transformation of
Goa, Other India Press, Mapusa, pp.17-42.

42 | P a g e
Newman, R.S. (2001) “Konkani mai Ascends the Throne: The cultural basis of Goan statehood,” in
R.S. Newman (ed.) Of Umbrellas, Goddesses and Dreams, Other India Press, Mapusa, pp. 54-80.
Pandit, H. & A. Mascarenhas (1999) “Houses of Goa”, Architecture Autonomous, Salvador do
Mundo.
Prabhudesai, S. (2002) “Mallya also plans feni export,” August 20, Goa News,
http://www.goanews.com/20aug02.htm, last accessed June 15, 2007.
Pinto, Cecil (2006) With love for Caju Feni, Defending the holy grail from insults, posted December
2006 at http://www.goanet.org/index.php?name=News&file=article&sid=697. Last accessed
October 24, 2007.
Rao, E.V.V. Bhaskara (1998) “Integrated Production Practices Of Cashew In India,” in Integrated
Production Practices Of Cashew In Asia Edited By Minas K Papademetriou, Edward M Herath, Food
And Agriculture Organization Of The United Nations Regional Office For Asia And The Pacific,
Bangkok.
Roy, R. (2003) “Feni now seeks global flavour,” The Times of India, 3 May.
http://www1.timesofindia.indiatimes.com/cms.dll/html/uncomp/articleshow?msid=45195573.
Last accessed June 24, 2007.
Sawkar, K., L. Noronha, A. Mascarenhas, O.S. Chauhan, and S. Saeed (1998) “Tourism and
the Environment: Case Studies on Goa, India, and the Maldives,” Case Study 19681, World Bank Institute, Washington.
Sreekumar,A., A.Siqueira, S.Desouza, A.Botelho, R.Sequeira & M.Khanolkar (1995) Tourism
Critique and Tourism Movements in Goa, Equations, Bangalore.
TERI (2000). ‘Population, Consumption and Environment inter relations: A tourist Spot Scenario’.
TERI Project Report No. 97EM50.Tata Energy Research Institute, New Delhi, India,
http://static.teriin.org/reports/rep16/rep16.pdf , last accessed March 25, 2007
Wilson, D. (1997) "Paradoxes of Tourism in Goa." Annals of Tourism Research. 21(1): 52-75.
Xavier, P. D. (1993) Goa: A Social History (1510–1640), Panaji: Rajhauns Vitaran.

43 | P a g e
Annexure 1 Figure 9: Map of Goa (showing Talukas)
Source: http://en.wikipedia.org/wiki/Image:Goamap.png#file
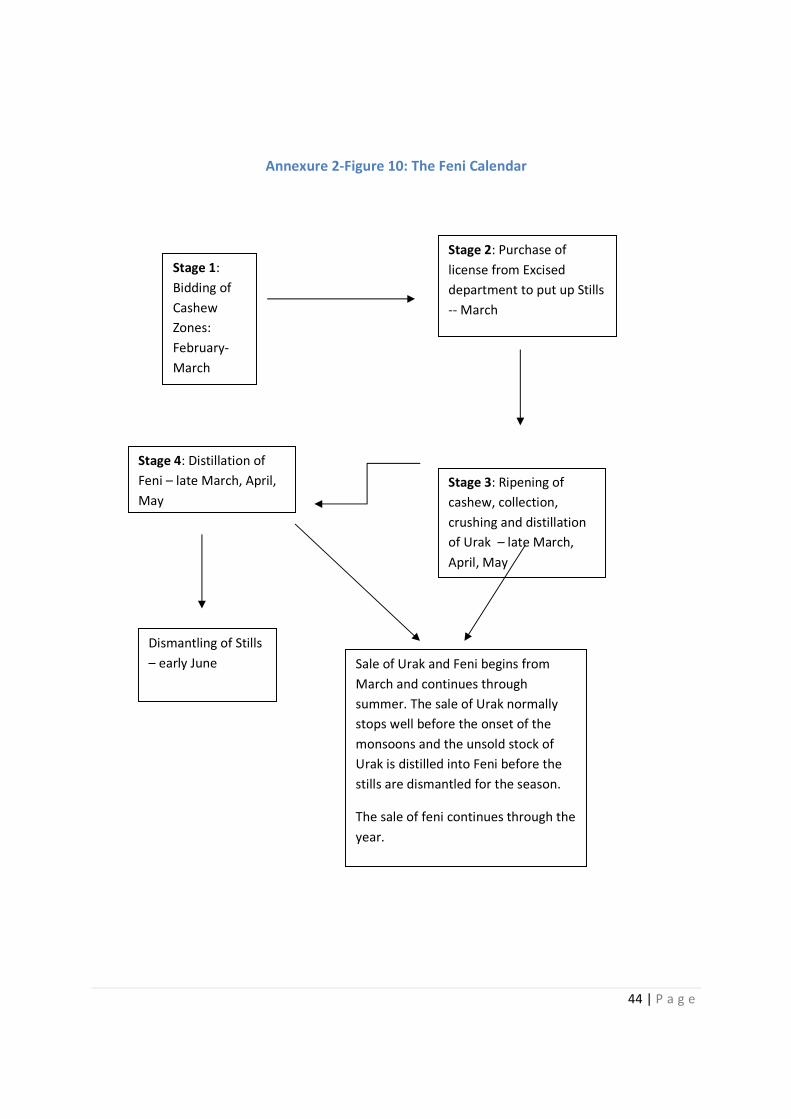
44 | P a g e
Annexure 2-Figure 10: The Feni Calendar
Stage 1:
Bidding of
Cashew
Zones:
February-
March
Stage 2: Purchase of
license from Excised
department to put up Stills
-- March
Stage 3: Ripening of
cashew, collection,
crushing and distillation
of Urak – late March,
April, May
Dismantling of Stills
– early June
Stage 4: Distillation of
Feni – late March, April,
May
Sale of Urak and Feni begins from
March and continues through
summer. The sale of Urak normally
stops well before the onset of the
monsoons and the unsold stock of
Urak is distilled into Feni before the
stills are dismantled for the season.
The sale of feni continues through the
year.