Embed Size (px)
Citation preview

Local government expenditure in Wales: recent trends and future pressures IFS Briefing Note BN131 Rowena Crawford Robert Joyce David Phillips

© Institute for Fiscal Studies, 2012
1
Local Government Expenditure in Wales: Recent Trends and Future Pressures1
Rowena Crawford
Robert Joyce
David Phillips
Copyedited by
Carol Lamble
Institute for Fiscal Studies
7 Ridgmount Street
London WC1E 7AE Tel: +44 (0)20 7291 4800 Fax: +44 (0)20 7323 4780
Email: [email protected]
Website: http://www.ifs.org.uk
© The Institute for Fiscal Studies, October 2012
ISBN: 978-1-903274-94-1
1 This paper was funded by the Welsh Local Government Association (WLGA) and the ESRC Centre for the
Microeconomic Analysis of Public Policy at the Institute for Fiscal Studies (RES-544-28-0001). The authors would like to
thank Carl Emmerson of the IFS, Jon Rae and Steve Thomas at the WLGA for their helpful comments on an earlier draft
of this Briefing Note, and Anthony Newby at StatsWales for the provision of spreadsheet versions of the published data
on Welsh local government expenditure. All remaining errors are the responsibility of the authors. Contact:

© Institute for Fiscal Studies, 2012
2
Contents
Executive summary 3
1.
Introduction 8
2. The economic and fiscal situation 9 3. Local government spending in Wales 16 3.1 Local government spending in Wales: 2012−13 18 3.2 Where has the axe been falling? Cuts between 2009−10 to 2012−13 26 4. Local government settlements and spending: scenarios to 2020−21 41 4.1 The Welsh draft budget: spending to 2014−15 42 4.2 Scenarios for Welsh Government spending to 2020
4.3 Scenarios for Welsh local government spending to 2020 43 46
5. The broader context: welfare and demography 51 5.1 The impact of tax and benefit changes on household incomes in Wales 51 5.2 Demography: the changing population and spending pressures
58
6. Conclusion 64
Appendices 66
Appendix A. Constructing consistent data on local government spending in
England and Wales
Appendix B. A longer run perspective: Local government spending since
2001−02
66
69
Appendix C. Projecting Welsh Government expenditure and local
government spending power to 2020−21
77
References 79

© Institute for Fiscal Studies, 2012
3
Executive summary
The UK is part-way through significant real-terms reductions in government expenditure as it
attempts to deal with the large hole in its public finances. Local government expenditure is not
immune from the cuts, and in the 2012 Green Budget, IFS researchers examined the cuts made in
2010−11 and planned in 2011−12 by local authorities in England. This report focuses instead on
Wales, and examines both the cuts made to date (up to and including 2012−13) and some
scenarios for how much local authorities may have to spend in the period up to 2020−21. It also
contains a brief discussion of the economic and fiscal situation and two other important public
policy issues for the coming years: changes to the welfare system – which are also intended to
reduce public spending – and demographic change.
The key findings of the analysis are:
The economic and fiscal situation
The late 2000s’ financial crisis and associated recession has been followed by only a
modest economic recovery. Indeed, economic output is estimated to have shrunk
between the fourth quarter of 2011 and the second quarter of 2012, putting the UK back
into recession. The poor performance is indicative of a more permanent problem: the
trend level of output (that is the level that is consistent with stable inflation and
unemployment) is now estimated to be a full 13% lower in 2016−17 than was projected
by the Treasury back in 2008, before the severity of the crisis became apparent. This
means that despite a deep recession and weak recovery, there is (if these forecasts are
correct) little spare capacity in the economy and therefore little scope for above-trend
rates of economic growth.
During the recession, government spending increased rapidly as a share of national
income as spending rose (for instance due to more claims for jobseekers allowance) and
national income fell. At the same time, there was a modest fall in tax receipts as a
proportion of national income as tax-rich activities (such as property transactions and
financial services) declined. The significant reduction in the long-term productive
potential of the economy means that a permanent gap between spending and taxes
would be implied by current policy: in the absence of any policy action after March 2008,
the UK Government would be borrowing an estimated 7.6% of national income (£115
billion in today’s prices) every year going forward than previously planned.
The UK Government has responded by setting out plans for significant increases in taxes
and reductions in planned spending, designed to eliminate the increase in borrowing by
2016–17. Most of the increases in taxes and reductions in investment spending are due
to have happened by the end of the current financial year (2012–13), but the majority of
the reduction in non-investment (current) spending on public services as a proportion of
national income – over three quarters – is still to come.
The 2010 Spending Review set out plans for spending on public services for the four
years from 2011–12 to 2014–15. The Welsh Government is set to see a real-terms
reduction in current spending of 8.4% between 2010–11 and 2014–15, with the capital
budget falling by 42.8%. Unlike in England, where the NHS has been largely protected
from planned real-terms spending cuts, the Welsh Government decided to reduce the
NHS budget, allowing for smaller reductions in grants to local government than in
England. The cuts due to take place in 2015–16 and 2016–17 have not yet been allocated
but will very likely mean further reductions in the Welsh Government’s budget, and
hence further cuts in grants to local government.

© Institute for Fiscal Studies, 2012
4
Local Government spending in Wales: the period to 2012−13
Local government net current spending on services in Wales is planned to total £6.35
billion in 2012−13 (or £2,062 per person), of which unitary authorities (UAs) account for
£5.56 billion (or £1,806 per person). The three largest areas of spending are education
(41% of the total), social services (23%) and police services (10%). In contrast spending
on libraries represents less than 1% of the total.
Expenditure per person varies significantly across Wales. Spending per person by UAs is
considerably higher in West Wales and the Valleys (£1,871) than in East Wales (£1,694),
is highest in Merthyr Tydfil (£2,018) and is lowest in Monmouthshire (£1,628).
Local government service expenditure per person has fallen by 8.4% in real terms since
its peak level in 2009−10. This reflects a reduction in grants from the Welsh Government
(which have fallen by 10.1% per person) rather than discretionary policy decisions by
local government. Indeed, council tax revenues per person have increased by 1.4% in
real-terms during the same time period.
The size of spending cuts has varied significantly across Welsh local authorities, in large
part reflecting differences in the size of cuts to grants. The percentage cuts to spending
on services by UAs in East Wales (8.4% per person) exceed those in West Wales and the
Valleys (7.8%), with the biggest reduction taking place in Newport (16.5%) and the
smallest in Carmarthenshire (2.9%).
The scale of spending cuts by Welsh local authorities also differs significantly between
services. Spending on regulation and safety services is set to face the largest cuts
between 2009−10 and 2012−13 (24.6% per person), followed by planning and
development (22.9%) and housing (20.6%), although the timing of cuts differs. Spending
on social services has been relatively protected (falling by 3.8%), perhaps reflecting
increasing demand for such services and councils’ efforts to meet Welsh Government
targets to protect spending in this area. Spending on environmental and refuse services
and education have also been relatively protected, falling by 4.8% and 7.3% per person,
respectively.
In order to compare spending with England, it is necessary to exclude spending on
education as in England much of this bypasses local authorities and goes straight to
schools (for instance, due to the Academy programme). Local government spending in
Wales is higher than the English average and all regions of England bar London,
reflecting both higher relative needs and different policy priorities. Around half of the
difference is explained by higher spending on social services, but it is spending on
culture and leisure (excluding libraries), regulation and safety and planning and
development that exceeds English levels by the most in percentage terms (91%, 72%
and 63%, respectively).
The percentage cuts between 2009−10 and 2012−13 have been significantly larger in
England than in Wales, reflecting the fact that the UK Government chose not to impose
cuts in spending on the NHS in England, necessitating larger cuts elsewhere. Local
government net current service spending (excluding education) is planned to be reduced
by 15.6% over three years in England, versus 9.3% in Wales. Spending cuts have been
even larger in the higher-spending regions of England, at 19.3% in London, 18.7% in the
North East and 18.3% in the North West. This reflects the fact that local government
spending power in these regions is more dependent on grants from central government
than other parts of England, and it is grants that have fallen most (rather than council tax
revenues). Differences in the formulas used to determine grants mean that this pattern is
not observed in Wales.

© Institute for Fiscal Studies, 2012
5
The North East of England, the region of England perhaps most similar to Wales, has
seen larger spending cuts in all service areas with the exception of fire services. For
instance, expenditure on planning and development has been reduced by 57.4% versus
22.9% in Wales, and spending on social services has been reduced by 11.8% versus 3.8%
in Wales. The fact that English local authorities have delivered such deep cuts suggests
that Welsh UAs may be able to deliver further significant reductions in their spending
although not necessarily without reductions in the quality and number of services
provided. The experience of English local authorities also suggests that as the scope for
making further cuts to areas such as planning and development diminishes, important
‘core’ services such as social services cannot be protected as much.
The cuts to expenditure in the three years to 2012−13 have undone around one-third of
the increase in Welsh local government expenditure per person that took place between
2001−02 and 2009−10. Around half of the increase in spending per person on planning
and development has been undone, but expenditure is still 51% higher than in 2001−02
(whereas in England it is over 15% lower), again suggesting further reductions might be
implementable, although the impact of further cuts on service quality would have to be
carefully assessed. On the other hand, whilst only a small part of the increases in
spending on social services and environmental and refuse services have been undone
(around £1 in £8, and £1 in £9, respectively), these may be areas where rising demand
and statutory obligations make cuts more challenging to deliver.
Local government settlements and spending: scenarios to 2020−21
The Welsh Government has set out indicative figures for the size of the general grant it
will give to UAs in 2013−14 and 2014−15. If specific grants change in line with the rest of
Welsh Government expenditure, and council tax receipts grow in line with whole-
economy inflation and the projected increase in household numbers, the real-terms
spending power of UAs will continue to fall at a similar rate to 2012−13: by 1.4% per
person in 2013−14 and 1.9% per person in 2014−15.
The size of grants to UAs after 2014−15 will depend on the spending decisions taken by
the Welsh Government, which in turn will depend on the decisions taken by the UK
Government and hence, the state of the economy and public finances.
The UK Government has announced that it plans further cuts in current expenditure in
2015−16 and 2016−17 but has not yet decided how to allocate these. If it decides to
make £10 billion in further cuts to welfare (benefit and tax credit) spending, and the
Welsh Government sees its budget change in line with public service spending as a
whole, current spending forecasts would see the Welsh current budget fall by around
3.2% per year, on average, in 2015−16 and 2016−17. If no further cuts were made to
welfare spending, the cuts increase to 4.4% per year. Both figures are significantly
greater than the average reduction between 2010−11 and 2014−15 (2.0% per year).
If the Welsh Government allocates the cuts in its budget across all services
proportionally, and council tax receipts continue to grow in line with inflation and the
number of households in Wales, UAs’ spending power would fall by 2.9% per person per
year, on average, in 2015−16 and 2016−17 if further cuts are made to welfare spending.
If welfare expenditure is not cut, this figure increases to 3.8% per person per year. The
reduction in spending power would be much larger if the Welsh Government chose to
protect the NHS from this round of cuts (4.7% and 6.3%, respectively, per person). In
each scenario, the cuts would be larger than made between 2009−10 and 2012−13, and
the projected cuts in 2013−14 and 2014−15.
© Institute for Fiscal Studies, 2012
6
The financial situation for UAs looks difficult until at least 2020−21 (the last year
examined in this report), although there is much uncertainty around this as the state of
the economy and public finances, and government decisions will have a significant
impact on spending power. Even under the most optimistic set of assumptions for
spending power used (overall public spending grows in line with the Office for Budget
Responsibility’s (OBR) long run forecast after 2016−17, further welfare cuts of £10
billion are found, and the Welsh Government chooses not to protect the NHS from cuts),
UAs’ spending power per person in 2020−21 would be 1.6% lower in real terms than in
2012−13. Under our most pessimistic set of assumptions, UAs spending power would be
18% lower (22% lower per person). The continued weakness in the economy and public
finances, and the possibility that reductions in health might not be delivered, mean that
such a scenario is plausible.
Such a large reduction in spending power would represent a significant challenge for
UAs. If overall spending on services was to be reduced by 18%, limiting the reductions in
overall spending to half that level (9%) in areas that have so far been relatively
protected – social services, environmental services and refuse, and education – would
require cuts of 52% in spending on all other services. Such large cuts in addition to those
already made are likely to be very difficult to achieve, meaning that other options would
need to be considered in such circumstances. This may involve making significant cuts to
service areas so far relatively insulated from cuts, local authorities stopping providing
large swathes of services that they traditionally have and attempts to generate
substantially more revenue, whether from council tax or increased fees and charges for
the provision of some services.
The broader context: welfare and demography
As well as reducing spending on public services, the UK Government is increasing taxes
and cutting benefits and tax credits. These act to reduce the net incomes of households in
Wales, although the average reduction by 2014−15 (2.8% of net income) is smaller than
for the UK as a whole (3.0%). The largest average reductions are for households in the
poorest fifth of the population (5.2% in Wales) and those households with dependent
children (4.3% in Wales). This reflects the fact that such households are typically more
reliant on benefits and tax credits than others. Groups impacted most by the benefit and
tax credit cuts may be more vulnerable to cuts by local government or may come to rely
more on local government services (e.g. housing or social services). The introduction of
Universal Credit will act to offset the reduction in benefits and tax credits from 2014,
especially for the poorest fifth of the population.
The ageing population means that the UK (and by extension, the Welsh and local)
Government will continue to face a difficult fiscal situation for decades to come. The
OBR’s Fiscal Sustainability Report’s central estimate is that demographic change could
increase spending by 5.2% of national income by 2060−61, largely driven by additional
spending on health and pensions. If extra taxes cannot be raised, this may mean a
significant further squeeze on other areas of spending such as local government. The
central estimates are based on rather optimistic assumptions about how quickly
productivity will grow in the NHS, however, and if productivity were instead to grow at
the average rate since 1979, spending on the NHS would need to rise by a further 7.5%
of national income, which would require major tax rises or reductions in other spending.
The scale of demographic change varies considerably across Wales. Although the
number of individuals aged 65 and over in Cardiff is projected to increase by 49% by
2033, the number per 1,000 working age residents is expected to increase only modestly

© Institute for Fiscal Studies, 2012
7
(from 191 to 221). However, areas of Wales that are already relatively old are set to see
further rapid aging: the number aged 65 and over per 1,000 working age residents is
expected to increase from 414 to 723 in Powys, from 439 to 660 in Conwy and from 370
to 655 in Monmouthshire. National and local government will need to plan for such
varied changes in demographics (and fo r the considerable uncertainty around these
estimates).

© Institute for Fiscal Studies, 2012
8
1. Introduction
The UK is part-way through significant real-terms reductions in government expenditure as it
attempts to deal with the large hole in its public finances. Local government expenditure is not
immune from the cuts, and in the 2012 Green Budget, IFS researchers examined the cuts made in
2010−11 and planned in 2011−12 by local authorities in England. This report focuses instead on
Wales, and examines both the cuts made to date (up to and including 2012−13) and some
scenarios for how much local authorities may have to spend in the period up to 2020−21. It also
contains a brief discussion of the economic and fiscal situation and two other important public
policy issues for the coming years: changes to the welfare system – which are also intended to
reduce public spending – and demographic change.
The rest of this report proceeds as follows. Chapter 2 describes how the recent financial crisis
and subsequent recession caused long-term damage to the UK public finances and sets out the
planned fiscal consolidation the UK Government is currently undertaking. This provides the
context to Chapters 3 and 4, which focus on local government in Wales. Chapter 3 analyses the
level of local government spending in Wales in 2012−13, how this is allocated across services,
how it varies across the country and how it compares to England. It also examines the real-terms
reductions in spending that have taken place since 2009−10 and how these vary across service
and area. Chapter 4 looks to the future and examines what the Welsh Government’s indicative
budget allocations to 2014−15 may imply for local government budgets. It also looks at some
scenarios for how local government budgets may evolve to 2020−21 depending on the strength
of the public finances and the decisions by the UK Government and Welsh Government on
whether to protect certain areas or not. Chapter 5 looks at two further policy issues that are
likely to impact on local government in the coming years. First, it analyses how planned changes
to the tax and benefit system will affect the incomes of Welsh households, reflecting concerns
that reductions in income may lead to greater demands on local services or weaken local
economies. Second, it looks at how demographic change may increase public spending pressures
and how demographic trends vary across Wales. Chapter 6 concludes. The report also includes
three appendices. Appendix A describes the data used in this report, paying particular attention
to how we calculate our measures of local government spending and spending per person.
Appendix B extends the analysis of Chapter 3 to include fuller details on how local government
spending has changed over a longer time period (since 2001−02). Appendix C provides
information on how we project forward Welsh Government after 2014−15 and local government
spending after 2012−13.

© Institute for Fiscal Studies, 2012
9
2. The economic and fiscal situation
Summary
The late 2000s’ financial crisis and associated recession has been followed by only a modest
economic recovery. Indeed, economic output is estimated to have shrunk between the
fourth quarter of 2011 and the second quarter of 2012, putting the UK back into recession.
The poor performance is indicative of a more permanent problem: the trend level of output
(that is the level that is consistent with stable inflation and unemployment) is now
estimated to be a full 13% lower in 2016−17 than was projected by the Treasury back in
2008, before the severity of the crisis became apparent. This means that despite a deep
recession and weak recovery, there is (if these forecasts are correct) little spare capacity in
the economy and therefore little scope for above-trend rates of economic growth.
During the recession, government spending increased rapidly as a share of national income
as spending rose (for instance due to more claims for jobseekers allowance) and national
income fell. At the same time, there was a modest fall in tax receipts as a proportion of
national income as tax-rich activities (such as property transactions and financial services)
declined. The significant reduction in the long-term productive potential of the economy
means that a permanent gap between spending and taxes would be implied by current
policy: in the absence of any policy action after March 2008, the UK Government would be
borrowing an estimated 7.6% of national income (£115 billion in today’s prices) every year
going forward than previously planned.
The UK Government has responded by setting out plans for significant increases in taxes
and reductions in planned spending, designed to eliminate the increase in borrowing by
2016–17. Most of the increases in taxes and reductions in investment spending are due to
have happened by the end of the current financial year (2012–13), but the majority of the
reduction in non-investment (current) spending on public services as a proportion of
national income – over three quarters – is still to come.
The 2010 Spending Review set out plans for spending on public services for the four years
from 2011–12 to 2014–15. The Welsh Government is set to see a real-terms reduction in
current spending of 8.4% between 2010–11 and 2014–15, with the capital budget falling
by 42.8%. Unlike in England, where the NHS has been largely protected from planned real-
terms spending cuts, the Welsh Government decided to reduce the NHS budget, allowing
for smaller reductions in grants to local government than in England. The cuts due to take
place in 2015–16 and 2016–17 have not yet been allocated but will very likely mean further
reductions in the Welsh Government’s budget, and hence further cuts in grants to local
government.
The UK Government is currently a undertaking a planned seven-year fiscal consolidation,
composed of tax increases and significant spending cuts, aimed at reducing borrowing from its
2009−10 peak of 11.1% of national income back to sustainable levels by 2017−18. The large cuts
in departmental spending by Westminster means large cuts in funding for Wales via the Barnett
formula and, hence, reduced grants to local authorities in Wales. This section aims to provide a
brief summary of the scale of the fiscal consolidation, why such a fiscal consolidation is required,
both in terms of what has happened to the outlook for the economy and why this has had the
effect on the public finances that it has. We then briefly discuss the implications for Welsh
Government spending and the resources available to Welsh local government (Chapters 3 and 4

© Institute for Fiscal Studies, 2012
10
of this report look in more detail at local government spending in Wales). This section concludes
with a brief discussion of some of the longer term pressures on the public finances that the
government will need to address (with Chapter 5 of this report providing further detail).
The state of the economy
The recent financial crisis led to the UK entering recession, with the size of the economy
shrinking in real terms by 6.3% between the first quarter of 2008 and the second quarter of
2009. The UK technically pulled out of recession in the third quarter of 2009 when economic
growth turned positive again.2 However, economic growth was just 1.8% in 2010 and 0.8% in
2011. The Office for Budget Responsibility in its March Budget forecast projected growth of 0.8%
again in 2012. While this did not appear an unduly optimistic forecast at the time − the average of
other independent forecasts that were made in March 2012 was also 0.8% − recent
developments (particularly troubles in the Eurozone) have tended to cause forecasters to revise
down their expectations. The OECD recently revised down its forecast of UK economic growth in
2012 to a contraction of 0.7%, while the average of independent forecasts made in September
2012 was for a contraction of 0.3%. Indeed the UK has technically been back in recession since
the last quarter of 2011, and over the first half of 2012 the economy contracted in real terms by
0.7%.
The medium-term outlook for the UK economy is somewhat better, with independent forecasters
predicting a return to growth in 2013 and the OBR currently forecasting average annual real
growth of 2.3% between 2011 and 2015. However, even that is subject to considerable
uncertainty. Illustrations of uncertainty produced by the OBR in their Economic and Fiscal
Outlook (2012) suggest that while their central forecast for growth in 2016 is 3.0%, if the OBR’s
latest forecast is as accurate as previous official forecasts have been then there is still a 10%
chance that growth will be at most negligible in 2016 (or, on the other hand, a 10% chance that
growth could be greater than 5.7%). And arguably the current climate may be even more
uncertain than in the past.
The weak economic growth currently being experienced by the UK economy is concerning
because it is indicative of a more permanent problem. This is illustrated in Figure 2.1, which
compares forecasts for national income and potential national income. The dark green dashed
line shows the government projection for the level of potential national income that was made in
March 2008 (i.e. before the financial crisis) – the assumption was for real growth of 2.5% per
year.3 The lighter dashed line shows the latest OBR projection for trend growth: they estimate
that the potential capacity of the economy increased by an average of just 0.4% per year between
2007−08 and 2012−13; they currently forecast that it will grow by 2.25% from 2013−14
onwards.4 The implication of this is that the trend level of national income by 2016−17 is now
thought to be a full 13% lower than was projected by the Treasury back in 2008.
2 A ‘recession’ is technically defined as a period beginning with at least two consecutive quarters of negative growth in
real economic output and ending when there are two consecutive quarters of positive growth. 3 For the purposes of the public finance projections, a lower growth in potential national income of 2.25% was assumed.
4 The lack of growth in potential national income during the financial crisis has yet to be adequately explained. In large
part it appears to be due to a lack of productivity growth in the service sector, although again this is not particularly
well understood.

© Institute for Fiscal Studies, 2012
11
Figure 2.1. Forecasts for actual and potential national income
Source: Forecasts for actual GDP from OBR, Economic and Fiscal Outlook: March 2012. Outturn figures for real GDP
from Office for National Statistics, series ABMI. Potential GDP figures from T. Pybus, ‘Estimating the UK’s historical
output gap’, OBR, Working Paper 1, 2011 updated using OBR, Economic and Fiscal Outlook: March 2012.
The actual level of national income is shown by the solid green line, which is an outturn as far as
2011−12 and then the latest OBR forecast thereafter. The 2008 to 2009 recession is evidenced by
the fall in actual national income. However, the low forecast for growth in potential national
income means that, even given the recession, the current level of national income is not forecast
to be too far below the potential level of output. This so-called ‘output gap’ (the difference
between actual and potential national income, expressed as a percentage of potential output) is
estimated by the OBR to be 2.7% in 2012−13. This relatively small estimated output gap means
that, if correct, there is little spare capacity in the economy and therefore little scope for above-
trend rates of economic growth. The relatively slow economic growth forecast is projected to be
sufficient to return the economy to return to its lower level of potential output in 2017−18.
The implications for the public finances
The problem for the public finances arises from the significant reduction in the forecast
productive potential of the economy (as well as a particular decline in tax-rich activities such as
property transactions and financial services). With a smaller economy, a given tax system will
bring in lower revenues and therefore the amount of public spending that can be supported will
be lower. The fiscal consolidation plan is essentially a seven-year transition period over which
time public spending will be reduced and the tax system changed such that sufficient revenues
will be brought in to finance the amount of spending being undertaken given the smaller size of
the economy.
The effect of the recession and the decline in the productive potential of the economy on the
public finances is shown in more detail in Figure 2.2, which illustrates what would have
happened to tax revenues and public spending as shares of national income in the absence of any
new policy action since March 2008.
80
90
100
110
120
130
140 Le
vel o
f G
DP
(In
dex
, act
ual
20
09
-10
GD
P =
10
0)
Potential ("trend") GDP – March 2008
Potential ("trend") GDP – March 2012
Actual GDP (Mar 2012)

© Institute for Fiscal Studies, 2012
12
Figure 2.2. Forecasts for spending and receipts with and without policy action
Note: ‘No action’ ignores the direct impact of all fiscal policy measures that have been implemented since Budget 2008.
Source: Outturn figures for revenues and spending are from HM Treasury, Public Finances Databank, April 2012.
Authors’ calculations using all HM Treasury Budgets and Pre-Budget Reports between March 2008 and March 2012 (up
to the March 2010 Budget) are available at http://www.hm-treasury.gov.uk/budget_archive.htm; June 2010 Budget
onwards available at http://www.hm-treasury.gov.uk/budget.htm) and all OBR Economic and Fiscal Outlooks between
June 2010 and March 2012 (all available at http://budgetresponsibility.independent.gov.uk/economic-and-fiscal-
outlook-march-2012/).
On the receipts side, there would only have been a slight fall in receipts as a share of national
income, since the amount of tax revenue raised is generally related to the amount of activity
undertaken. (In other words, a decline in national income results in a decline in cash value of tax
revenues, but when expressed as a share of national income tax revenues would be largely
unchanged.) There would have been much greater effects on the spending side. In the recession
spending shot up as a share of national income for two reasons: first, because ‘spending
automatically increases in recessions even without direct policy intervention (for example, on
unemployment benefits and debt interest payments); second, because the decline in national
income meant that cash plans for departmental spending that were set in the Comprehensive
Spending Review in 2007 turned out to represent much larger shares of national income than
previously planned. The ‘no policy change’ assumption for public spending in 2008 was for real
growth of 1.8% a year. If national income were forecast to recover to the levels previously
forecast (as in an ‘ordinary’ recession) then over time spending would have fallen again as a
share of national income. However in this case, the productive potential of the economy is now
projected to be significantly smaller in every year going forwards, and therefore public spending
would remain at this significantly higher level in future in the absence of direct government
policy to reduce spending.
The upshot was therefore that the decline in the forecast productive capacity of the economy
meant that the existing levels of spending represented much larger shares of national income
than intended, and consequently borrowing (the difference between tax revenues and spending)
that was much higher than intended. In the absence of any policy action since March 2008 the
Government would have been borrowing 7.6% of national income (or £115 billion in today’s
terms) a year more than it had previously planned every year in the future. This would not have
30
35
40
45
50
55
19
96
–97
19
97
–98
19
98
–99
19
99
–00
20
00
–01
20
01
–02
20
02
–03
20
03
–04
20
04
–05
20
05
–06
20
06
–07
20
07
–08
20
08
–09
20
09
–10
20
10
–11
20
11
–12
20
12
–13
20
13
–14
20
14
–15
20
15
–16
20
16
–17
Per
cen
tage
of
nat
ion
al in
com
e
Total spending (outturn) Receipts (outturn)
Total spending (March 2012) Receipts (March 2012)
Total spending (no action) Receipts (no action)

© Institute for Fiscal Studies, 2012
13
been sustainable and would have left the UK with an ever-increasing national debt that would
have surpassed 100% of national income before the end of the decade and continued rising
thereafter.
Since such a fiscal position was clearly unsustainable, the previous Labour government and
current coalition government both announced a number of tax increases and spending cuts
designed to bring borrowing back to sustainable levels. The forecast profiles for tax revenues and
spending under current policy are also shown in Figure 2.2. Revenues will increase slightly as a
share of national income, but the majority of the consolidation is on the spending side. Some
justification for that could be drawn from the fact that most of the ‘problem’ was also on the
spending side, so that in fact both spending and revenues are being brought back to roughly the
shares of national income that they were before the financial crisis (2002−03 for spending and
2004−05 for revenues).
The pacing and composition of spending cuts
The UK Government’s plans, if delivered, will ultimately entail (by 2016−17) 17% of the fiscal
repair job to have been delivered by net tax increases and 83% to have been delivered by cuts in
public spending. However, the increases in taxes have been ‘front-loaded’, while the cuts to
public spending and especially the cuts to current public service spending have been ‘back-
loaded’. This can clearly be seen in Figure 2.3, which shows the contributions of reductions in
spending and increases in taxes as a proportion of GDP to the fiscal consolidation for each year
between 2010−11 and 2016−17.5
Figure 2.3 shows that only a small part of the cuts to public spending has yet taken place. For
instance, by the end of the last financial year (2011−12), only around 12% of the cuts to benefits
and tax credits planned had been made, which will rise to around 41% by the end of the current
financial year (2012−13).6
Local government spending mostly falls under the ‘other current spending’ category, with most
of the remainder in the ‘investment spending’ category. Cuts to government investment spending
have been more rapid than cuts to current spending: around 35% of the cuts to investment
spending were planned to have been made by 2011−12, with this planned to increase to 67%
during 2012−13. On the other hand, only around 6% of cuts to other current service spending
(including spending on public services) were planned to have been made by 2011−12,7 rising to
23% during 2012−13. In other words, the majority of the cuts (more than three-quarters) to
overall current spending on public services (and a few other items) as a proportion of GDP are
yet to come.8 Chapter 4 of this report examines how these ongoing cuts to public spending may
affect the resources available to Welsh local government in 2013−14 and beyond, which depends
on exactly how the cuts in future years are allocated to different types of spending by the UK and
Welsh Governments, as well as whether the economy and public finances develop as expected
(i.e. whether the planned fiscal consolidation needs to be extended or can be relaxed).
5 Figure 1.3 shows the planned changes in spending and taxes measured as a proportion of GDP as opposed to measured
in ‘real terms’. This means, for instance, that a ‘cut in spending’ means a reduction in spending as a proportion of GDP,
which may entail spending growing in real terms but by less than GDP. 6 These figures assume that there are further cuts to benefits and tax credits in 2015−16 and 2016−17 of around £8
billion per year on top of those already announced for the period up to 2014−15. If these cuts are not made, further cuts
in public service spending or investment spending, or further tax rises will be necessary meaning the fraction of the cuts
already delivered would be lower. 7 A significant under-spend in 2011−12 means that the proportion of cuts actually delivered by 2011−12 was actually
somewhat greater than 6%. 8 The proportion of real-terms cuts (as opposed to cuts relative to GDP) delivered is somewhat greater but a majority
are yet to occur.

© Institute for Fiscal Studies, 2012
14
Figure 2.3. The fiscal consolidation over seven years
Notes: Bars represent the planned fiscal tightening (reduction in government borrowing) measured as a percentage of
GDP, decomposed into tax increases and various types of spending cuts.
Source: Authors’ calculations using all HM Treasury Budgets and Pre-Budget Reports between March 2008 and March
2012 (up to the March 2010 Budget) are available at http://www.hm-treasury.gov.uk/budget_archive.htm; June 2010
Budget onwards available at http://www.hm-treasury.gov.uk/budget.htm) and all OBR Economic and Fiscal Outlooks
between June 2010 and November 2012 (all available at http://budgetresponsibility.independent.gov.uk/economic-and-
fiscal-outlook-march-2012/).
The UK Government set out its plans for spending on public services for the four years from
2011−12 to 2014−15 in the 2010 Spending Review. Table 2.1 shows the planned changes to real-
terms in current and capital Departmental Expenditure Limits (DELs) for each of these years,
both overall and for the major Whitehall spending departments using spending outturns for
2010−11 and updated projections for 2011−12 onwards from the 2012 Public Expenditure
Statistical Analysis (PESA) publication.
DELs set out the amount each department can spend on the parts of their functions subject to
multi-year budgeting and account for a large majority of departments’ spending on public service
provision and administration. DELs for current expenditure (excluding depreciation) in 2014−15
are planned to be 8.4% below the amount spent in 2010−11 after accounting for inflation,
following planned real-terms cuts of 2.0% in 2011−12, 2.4% in 2012−13, 1.3% in 2013−14 and
3.1% in 2014−15.9 DELs for capital expenditure in 2014−15 are planned to be 27% below the
amount spent in 2010−11 after accounting for inflation.
The UK Government has not cut all departments equally, however. For instance, the current and
capital DELs for the NHS are set to increase slightly in real terms over this period (by 1.7% and
0.2%, respectively), while the Home Office, which provides most of the funding for the police, is
set to see large falls in spending (19.7% for current DEL and 43.0% for capital DEL). The
Department for Communities and Local Government, which provides most of the central
government grants for local authorities in England (with the exception of schools, and police and
fire services), is also set to see a large 20.3% cut in its current DEL falls of 20.3% (the cut would
9 In fact, departments underspent in 2011−12, which means that the reduction in that year will have been larger. This
means that if departments spend the planned amount in the current financial year, the percentage cuts between
2011−12 and 2012−13 will be smaller than originally planned.
0
1
2
3
4
5
6
7
8
9
2010–11 2011–12 2012–13 2013–14 2014–15 2015–16 2016–17
Per
cen
tage
of
nat
ion
al in
com
e Other current spend (inc. public services)
Debt interest
Benefits Spending
Investment Spending
Tax increases

© Institute for Fiscal Studies, 2012
15
have been even greater if not for a significant under-spend in 2010−11, which reduces baseline
expenditure), which, together with the freeze in council tax rates in 2011−12 and 2012−13,
explains the large cuts English local authorities are making (Crawford and Phillips, 2012).
Table 2.1 Real change in UK Departmental Spending Limits (selected) 2011−12
to 2014−15 (%)
Department 2011−12 2012−13 2013−14 2014−15 Total
Current
England, NHS (Health) 1.5 -0.3 0.3 0.2 1.7
England, Education -2.3 -0.6 -1.4 -0.7 -4.9
England CLG Local
Government -2.2 -10.2
-1.5 -7.9 -20.3
Defence -4.3 -10.3 -3.6 -3.3 -19.9
Transport 0.0 -7.5 -3.6 -12.9 -22.4
Home Office -1.0 -7.0 -7.5 -5.7 -19.7
Wales -2.6 -2.5 -1.4 -2.2 -8.4
Total -2.0 -2.4 -1.3 -3.1 -8.4
Capital
England, NHS (Health) 3.0 -2.6 -2.3 2.2 0.2
England, Education -30.7 -18.7 -24.4 0.9 -57.1
England, CLG Local
Government
Defence 3.8 -11.3 -1.9 -7.1 -16.1
Transport 2.2 1.8 -9.7 -2.0 -7.9
Home Office -33.6 -3.0 -28.7 24.2 -43.0
Wales -28.2 -10.1 -12.6 1.3 -42.8
Total -13.1 -6.8 -10.2 0.3 -27.0
Source: Table 1.3a, Chapter 1, Departmental Spending, PESA 2012 (HM Treasury) available at:
http://www.hm-treasury.gov.uk/pespub_pesa_budgets.htm, and authors’ calculations.
The Welsh Government is funded via the Barnett formula, which determines changes in grants to
Wales on the basis of changes to UK DELs (see Crawford et al, 2011, for a short explanation of
how this formula works). Overall, the Welsh Government is set to see a cut in its current DEL of
8.4% and its capital DEL of 42.8% by 2014−15: it decides how to allocate this to the various
central departments and Welsh local government.
The Welsh departmental structure differs quite substantially from that of the UK Government,
making it hard to compare spending on specific services,10 and there has been a substantial
reorganisation of departments since 2011. However, it is clear that the Welsh Government has
chosen to distribute the cuts more evenly than the UK Government. For instance, unlike
Westminster where special priority was attached to a (small) real-terms increase in NHS
expenditure, the Welsh Government decided to subject the NHS to cuts. As we shall show in
Chapter 3, this means that Welsh local government has had to make smaller cuts than English
local government. However, the cuts are still set to be substantial, and are likely to continue
beyond 2014−15 as the UK Government seeks to cut expenditure further in 2015−16 and
2016−17 (and potentially even after this) as part of its deficit reduction plan, as is discussed
further in Chapter 4.
10
The PESA data does allow this but only retrospectively (the most recent data are for 2011−12).

© Institute for Fiscal Studies, 2012
16
3. Local government spending in Wales
Summary
Local government net current spending on services in Wales is planned to total £6.35 billion
in 2012−13 (or £2,062 per person), of which unitary authorities (UAs) account for £5.56
billion (or £1,806 per person). The three largest areas of spending are education (41% of
the total), social services (23%) and police services (10%). In contrast spending on libraries
represents less than 1% of the total.
Expenditure per person varies significantly across Wales. Spending per person by UAs is
considerably higher in West Wales and the Valleys (£1,871) than in East Wales (£1,694), is
highest in Merthyr Tydfil (£2,018) and is lowest in Monmouthshire (£1,628).
Local government service expenditure per person has fallen by 8.4% in real terms since its
peak level in 2009−10. This reflects a reduction in grants from the Welsh Government
(which have fallen by 10.1% per person) rather than discretionary policy decisions by local
government. Indeed, council tax revenues per person have increased by 1.4% in real-terms
during the same time period.
The size of spending cuts has varied significantly across Welsh local authorities, in large part
reflecting differences in the size of cuts to grants. The percentage cuts to spending on
services by UAs in East Wales (8.4% per person) exceed those in West Wales and the
Valleys (7.8%), with the biggest reduction taking place in Newport (16.5%) and the smallest
in Carmarthenshire (2.9%).
The scale of spending cuts by Welsh local authorities also differs significantly between
services. Spending on regulation and safety services is set to face the largest cuts between
2009−10 and 2012−13 (24.6% per person), followed by planning and development (22.9%)
and housing (20.6%), although the timing of cuts differs. Spending on social services has
been relatively protected (falling by 3.8%), perhaps reflecting increasing demand for such
services and councils’ efforts to meet Welsh Government targets to protect spending in this
area. Spending on environmental and refuse services and education have also been
relatively protected, falling by 4.8% and 7.3% per person, respectively.
In order to compare spending with England, it is necessary to exclude spending on
education as in England much of this bypasses local authorities and goes straight to schools
(for instance, due to the Academy programme). Local government spending in Wales is
higher than the English average and all regions of England bar London, reflecting both
higher relative needs and different policy priorities. Around half of the difference is
explained by higher spending on social services, but it is spending on culture and leisure
(excluding libraries), regulation and safety and planning and development that exceeds
English levels by the most in percentage terms (91%, 72% and 63%, respectively).

© Institute for Fiscal Studies, 2012
17
The percentage cuts between 2009−10 and 2012−13 have been significantly larger in
England than in Wales, reflecting the fact that the UK Government chose not to impose cuts
in spending on the NHS in England, necessitating larger cuts elsewhere. Local government
net current service spending (excluding education) is planned to be reduced by 15.6% over
three years in England, versus 9.3% in Wales. Spending cuts have been even larger in the
higher-spending regions of England, at 19.3% in London, 18.7% in the North East and
18.3% in the North West. This reflects the fact that local government spending power in
these regions is more dependent on grants from central government than other parts of
England, and it is grants that have fallen most (rather than council tax revenues).
Differences in the formulas used to determine grants mean that this pattern is not observed
in Wales.
The North East of England, the region of England perhaps most similar to Wales, has seen
larger spending cuts in all service areas with the exception of fire services. For instance,
expenditure on planning and development has been reduced by 57.4% versus 22.9% in
Wales, and spending on social services has been reduced by 11.8% versus 3.8% in Wales.
The fact that English local authorities have delivered such deep cuts suggests that Welsh
UAs may be able to deliver further significant reductions in their spending although not
necessarily without reductions in the quality and number of services provided. The
experience of English local authorities also suggests that as the scope for making further
cuts to areas such as planning and development diminishes, important ‘core’ services such
as social services cannot be protected as much.
The cuts to expenditure in the three years to 2012−13 have undone around one-third of the
increase in Welsh local government expenditure per person that took place between
2001−02 and 2009−10. Around half of the increase in spending per person on planning and
development has been undone, but expenditure is still 51% higher than in 2001−02
(whereas in England it is over 15% lower), again suggesting further reductions might be
implementable, although the impact of further cuts on service quality would have to be
carefully assessed. On the other hand, whilst only a small part of the increases in spending
on social services and environmental and refuse services have been undone (around £1 in
£8, and £1 in £9, respectively), these may be areas where rising demand and statutory
obligations make cuts more challenging to deliver.
Chapter 2 set out the general economic and fiscal situation facing the United Kingdom and Wales,
and showed the sheer scale of the ongoing cuts to real-terms expenditure on public services.
Welsh local government has not escaped these cuts, and this chapter (Chapter 3) analyses
spending by Welsh Unitary Authorities, Police Authorities, Fire Authorities and National Parks
since 2001−02, with a particular focus on the cuts that have taken place and are planned to take
place between 2009−10 and 2012−13. Chapter 4 looks to the future and examines a number of
illustrative scenarios for local government settlements and spending in the period to 2020.
The main measure of spending that we focus on in this chapter is ‘net current service
expenditure’. This is the overall level of spending on a particular service, excluding investment,
after accounting for any income obtained from providing that service. In other words it captures
the amount spent by local government on running and managing local services, over and above
that funded by income directly related to providing those services (for example, fees to use
leisure centres or for ‘meals on wheels’). Appendix A provides further information on the data
used in this and the following chapter of the report.
The rest of this chapter proceeds as follows. In Section 3.1, we set out how much local
government in Wales is planning to spend in 2012−13 and on what, and how this varies across

© Institute for Fiscal Studies, 2012
18
Wales. We also discuss briefly how this spending is funded. Section 3.2 examines the cuts in real-
terms expenditure that have taken place since 2009−10, when expenditure on services reached
its highest level in real terms; what areas of local government spending are being cut the most,
and how this, and the size of overall cuts, varies across the country. In each section we compare
the situation in Wales with that in England. With English local authorities forced to make larger
and more rapid cuts due to a less generous local government settlement, the spending decisions
of English councils may provide a foretaste of the scale of cuts ultimately required in Wales.
3.1 Local government spending in Wales: 2012−13
Local government is responsible for ensuring the provision of a wide range of services, either
directly or indirectly by commissioning the service from providers in the private or not-for-profit
sectors. In Wales, there are four main branches of local government, each responsible for
different functions. Unitary Authorities provide services covering education, social services,
transport, environment and refuse, and others, and in 2012−13 plan net current service
expenditure of £5.56 billion (this figure excludes housing benefit payments11). The other
branches of local government are more focused on particular services: Police Authorities
provide police services, and in 2012−13 plan spending of £0.64 billion; Fire Authorities provide
fire services, and in 2012−13 plan spending of £0.14 billion; and National Park Authorities
manage National Parks and in 2012−13 plan spending of around £16 million. Overall, local
governments plan current service spending of £6.35 billion. This is equivalent to £2,062 per
person.12
As shown in Figure 3.1, net current expenditure on education is planned to be the largest single
component of local government expenditure in Wales in 2012−13, accounting for £2.60 billion or
41% of overall planned spending in 2012−13. This is followed by spending on social services
(£1.50 billion or 24% of spending) and on the police (£0.63 billion or 10% of spending). Between
them, these areas of spending account for three-quarters of local government net current service
spending in Wales.
11
Housing Benefit and Council Tax Benefit payments are administered by Unitary Authorities on behalf of the
Department for Work and Pensions, which funds the benefit payments managed by each local authority using
earmarked grants. In Wales, Housing Benefit payments (but not Council Tax Benefit payments) are treated as part of
local government current service expenditure, whereas in England they are counted as part of ‘other current
expenditure’. In order to ensure consistency with analysis for England, and because payments are met by matching
grants, we do not include Housing Benefit payments in the definition of current service spending used in this report. 12 Per-person expenditure figures calculated using authors’ own mid-2012 population projection using the 2011 mid-
year estimates and 2008-based projections for population for 2012. See Appendix A for details on how population
estimates and projections are calculated for years between 2001−02 and 2021−22.

© Institute for Fiscal Studies, 2012
19
Figure 3.1. Local government net current service spending in Wales, 2012−13
Notes: Net current service spending is the overall level of spending on a service net of any income from providing that
service. ‘Central and other services’ include corporate and democratic management and non-distributed costs.
Source: StatsWales, local government expenditure estimates, 2012−13.
Local government net current service spending varies across Wales, both in terms of its overall
level and its composition. Spending on police services, which is planned to average £204 per
person per year for Wales as a whole in 2012−13, varies significantly between the four police
authorities: £195 per person in Dyfed-Powys; £210 per person in Gwent; £206 in North Wales;
and £203 per person in South Wales. There are smaller but evident differences for fire services
too: £44 in Mid and West Wales; £42 in North Wales; and £47 in South Wales.
Unitary Authorities (UAs) account for around 88% of all current service spending by local
government in Wales in 2012−13, which equates to £1,806 per person per year. Figure 3.2 shows
how spending by UAs varies between four ‘regions’ of Wales:
The Valleys (consisting of Blaenau Gwent, Bridgend, Caerphilly, Merthyr, Neath Port
Talbot, Rhondda Cynon Taf and Torfaen)
The Southern Cities (consisting of Cardiff, Newport and Swansea)
North East Wales (consisting of Denbighshire, Flintshire and Wrexham)
Rest-of-Wales (consisting of the remaining local authority areas).
This shows that overall current service expenditure by UAs is highest in The Valleys at £1,925
per person per year, and lowest in The Southern Cities at £1,688 per person per year (in North
East Wales and the Rest-of-Wales, current service expenditure per person is £1,774 and £1,795,
respectively).
Net current service expenditure in The Valleys is higher than the all-Wales average for all service
areas with the exceptions of transport and housing. High levels of expenditure per person on
education (£900 versus £843 nationally) and social services (£535 versus £487) are the biggest
drivers of higher expenditure in cash terms, while, in percentage terms, expenditure exceeds the
Welsh average most for planning and development (13% higher) and regulation and safety
(10%). On the other hand, net current service expenditure in the Southern Cities is lower than
the all-Wales average for all service areas with the exceptions of housing and culture and leisure
(ex. libraries). Low levels of expenditure per person on education (£796 versus £843 nationally)
41%
23%
10%
5%
5%
4%
4%
2%
2% 2% 1% 1% Education services
Social services
Police service
Environment and refuse
Transport
Culture and leisure (ex. libraries)
Central and other services
Fire service
Housing services
Planning and development
Regulation and safety
Library services

© Institute for Fiscal Studies, 2012
20
and social services (£439 versus £487) are the biggest drivers of lower expenditure in cash
terms, while, in percentage terms, expenditure is lowest relative to the national average for
environmental and refuse services (18% lower), regulation and safety services (17% lower), and
planning and development services (16% lower).
It is beyond the scope of this report to investigate whether expenditure is appropriate to needs in
the various parts of Wales. But it is worth noting that The Valleys (especially the upper Valleys)
contain many of the most deprived communities in Wales, with above-average levels of
unemployment, ill-health and below-average educational achievement and life expectancy. Thus
greater needs are likely to play a major role in explaining higher levels of expenditure in this part
of Wales (indeed, such measures of deprivation enter the funding formulas used to determine
grants to local authorities). The Southern Cities are more mixed, and contain some of the most
deprived and also the least deprived communities in Wales. Lower levels of expenditure in these
areas may reflect the fact that the cities are densely populated, meaning that services can be
provided with greater economy of scale. Differences in demographics (such as the proportion of
school-age children and elderly people) will also explain some of the variation in spending across
regions of Wales (and, indeed, local authorities). For instance, Valleys authorities tend to have
both greater proportions of school-age children and elderly people than the cities (which have
greater proportions of people of working age).
Figure 3.2. Net current service expenditure per person by UAs across regions of
Wales, 2012–13
Source: StatsWales, local government expenditure estimates, 2012−13, and authors’ calculations.
Of course, decisions on spending are made at the unitary authority level as opposed to the
‘regional’ level. And, neither are the regions defined homogenous. For instance, while the ‘Rest-
of-Wales’ region has been defined so that it consists of the less urbanised parts of Wales; it
contains both relatively affluent areas such as Monmouthshire and the Vale of Glamorgan, and
relatively poor areas like Anglesey. Table 3.1 shows expenditure by service for all 22 UAs in
Wales.
0
200
400
600
800
1,000
1,200
1,400
1,600
1,800
2,000
The Valleys
The Southern
Cities
North East
Wales
Rest of Wales
Wales
Spen
din
g p
er p
erso
n (
£)
Region of Wales
Libraries
Regulation and Safety
Planning and Development
Housing
Central Services
Culture and Leisure (ex. Libraries) Transport
Environment and Refuse
Social Services
Education

© Institute for Fiscal Studies, 2012
21
Overall planned net current service expenditure per person in 2012−13 is highest in Merthyr
Tydfil (£2,018), Rhondda Cynon Taf (£2,018) and Denbighshire (£2,013), although the service
areas driving this high expenditure differ between these authorities. Planned net current service
expenditure per person in 2012−13 is lowest in Monmouthshire (£1,628), Newport (£1,645) and
Cardiff (£1,672).
The rows shaded grey in Table 3.1 indicate UAs in the ‘West Wales and the Valleys’ region eligible
for Tier 1 European Union (EU) funding, while the rows shaded white indicate UAs in ‘East
Wales’, which is largely ineligible for EU funding. East Wales has a more productive economy
than West Wales and the Valleys: Gross Value Added, a measure of economic output, was around
91% of the UK average in East Wales, and only 63% of the UK average in West Wales and The
Valleys in 2009. Expenditure is less than £1,700 per person in all UAs in East Wales, with the
exception of Powys, a large and sparsely populated county (a factor which, as recognised by the
local government funding formulas, may necessitate higher spending per person than other parts
of East Wales). Expenditure is more than £1,750 per person in all UAs in West Wales and The
Valleys, with the exception of Swansea, which consists of a densely populated city and relatively
affluent rural areas (factors which may mean services can be provided with lower spending per
person than other parts of West Wales and the Valleys).

© Institute for Fiscal Studies, 2012
22
Table 3.1. Net current service expenditure per person by UAs, 2012–13
Unitary Authority Education Social Services
Environment and Refuse
Transport Culture and Leisure (ex Libs)
Central Services
Housing Services
Planning and Development
Regulation and Safety
Libraries TOTAL
Anglesey 803 443 139 150 49 87 32 41 29 15 1,788
Gwynedd 834 507 122 146 63 62 55 45 41 16 1,892
Conwy 815 525 112 89 77 71 46 24 39 18 1,816
Denbighshire 935 552 109 96 83 99 40 37 40 20 2,013
Flintshire 811 470 96 98 59 57 32 27 28 18 1,697
Wrexham 760 470 135 75 61 63 54 27 35 16 1,695
Powys 849 507 121 125 74 51 62 29 27 17 1,864
Ceredigion 844 459 109 154 64 63 20 56 45 17 1,829
Pembrokeshire 880 453 106 97 47 47 37 48 34 16 1,765
Carmarthenshire 841 502 89 106 53 101 39 72 23 14 1,841
Swansea 768 459 81 75 74 111 75 52 28 14 1,737
Neath Port Talbot 818 636 97 108 73 81 48 65 30 20 1,975
Bridgend 873 458 88 84 61 95 47 42 24 15 1,789
Vale of Glamorgan 877 410 93 74 58 68 26 18 34 21 1,679
Rhondda Cynon Taf 973 571 108 86 84 66 27 40 47 15 2,018
Merthyr Tydfil 912 517 124 101 111 112 25 60 39 18 2,018
Caerphilly 890 465 102 113 74 68 25 26 28 23 1,814
Blaenau Gwent 860 584 115 90 106 113 29 36 48 16 1,997
Torfaen 923 518 110 101 62 47 49 54 42 16 1,923
Monmouthshire 720 438 96 100 72 63 56 31 36 16 1,628
Newport 846 460 66 71 83 36 24 16 27 16 1,645
Cardiff 795 417 91 118 84 45 53 26 27 17 1,672
All (Wales) 843 487 101 101 72 71 43 39 33 17 1,806
Source: StatsWales, local government expenditure estimates, 2012−13, and authors’ calculations.

© Institute for Fiscal Studies, 2012
23
Funding local government
Welsh local government net expenditure is funded through a number of different sources,
including council tax, and general and specific grants from the Welsh and UK Governments. But
what is the relative importance of these different sources of funding? Knowing how important
the various sources of funding are to local government is key to understanding what is driving
the spending cuts discussed in the next section (Section 2.2) of this report.
In order to do this we examine the components of Welsh local government’s ‘spending power’.
We define spending power as the amount raised in council tax, along with the amount provided
to local authorities through general and specific grants (with the exception of those for housing
benefit and council tax benefit).13 This differs from the amount spent on providing current
services for a number of reasons including additions to or withdrawals from financial reserves,
and interest payments, but is a better measure for showing the sources of local government
revenue. Figure 3.3 shows the contribution of each source of funding to total revenue
expenditure in Wales in 2012−13. The majority (80% or four-fifths) comes in the form of various
grants from the Welsh Goverment, with just one-fifth coming from council tax (including that
paid for by council tax benefit). Among unitary authorities alone, grants are slightly more
important, contributing 81% of overall spending power, with this varying between 72% in
Monmouthshire and 84% in Newport.
This illustrates the fact that how much the Welsh Government decides to allocate to local
authorities through grants is the key driver of their overall spending power. For instance, a
reduction in grants of 5% would necessitate councils to increase their council tax revenues by
just over 20%, on average, to maintain their spending power. This is an issue to which we return
later.
Figure 3.3. The building blocks of local government spending power, 2012–13
Source: Local Government budget estimates, 2012-13 and authors’ calculations.
13
General grants include redistributed non-domestic (‘business’) rates and the Revenue Support Grant.
48%
14%
3%
15%
20% Revenue Support Grant
National non-domestic rates
Police Grant
Specific Grant
Council tax

© Institute for Fiscal Studies, 2012
24
Comparing local government spending in Wales with England
It is useful to compare the levels of local government spending in Wales with that in England.
Local government net current service spending in England is planned to total £94.6 billion in
2012−13, and Figure 3.4 shows how this is broken down by service area (we use the same order
as Figure 3.1 to allow easy comparison with Wales).
The broad patterns are the same as in Wales. The largest single component of spending is
education services, accounting for 42% of all spending. This is very much higher than in Wales,
where education services account for 41% of local government spending, which may be
surprising given that a large fraction of schools spending now bypasses English local government
and goes directly to schools (including all funding for Academies and Free Schools). As in Wales,
spending on social services (22%) and police services (12%) represent the next largest parts of
overall local government spending. Overall, the three largest services account for 76% of total
local government spending in England versus 74% in Wales.
Culture and leisure represents a much smaller fraction of spending in England (2%) than in
Wales (4%), as does planning and development services (1% versus 2%), largely reflecting
greater spending on economic development in Wales. On the other hand, spending on transport
represents a greater fraction of the budget (6% versus 5% in Wales), reflecting the high levels of
spending in the major metropolitan areas and especially London (net expenditure by Transport
for London on the London Underground, Overground and buses – part of the Greater London
Authority – is counted as part of local government spending).
Figure 3.4. Local government net current service spending in England, 2012−13
Notes: Net current service spending is the overall level of spending on a service net of any income from providing that
service. ‘Central and other services’ include corporate and democratic management and non-distributed costs.
Source: DCLG, local government budget estimates, 2012−13.
It matters not only how the pie is split between services but also how big the pie is in the first
place. Table 3.2 shows the amount spent per person for each service and in total. We also show
the amount in total excluding education given the fact that a large fraction of English schools
spending now bypasses local authorities completely. In the rest of this sub-section we focus on
spending on services excluding education to allow easier comparisons between nations.
The results show that local government spending is higher in Wales for each service area with
the exception of police services (where it is 94% of the English level), although spending in
42%
22%
12%
5%
6%
2% 4%
2% 2% 1%
1% 1%
Education services
Social sevices
Police service
Environment and refuse
Transport
Culture and leisure (ex. libraries)
Central and other services
Fire service
Housing services
Planning and development
Regulation and safety
Library services

© Institute for Fiscal Studies, 2012
25
England is skewed somewhat by especially high spending in London. Expenditure in the rest of
England averages £184 per person, somewhat less than in Wales. Overall, local government
spending (excluding education) is 18% higher in Wales than in England. This is likely to reflect
additional spending needs in Wales (for instance, due to greater levels of deprivation and a more
dispersed population) and differences in policy priorities, particularly during the current
austerity drive (for instance the NHS is protected from cuts in England but not in Wales). In cash
terms, the largest excess is for social services spending at almost £90 per person per year,
perhaps reflecting the older age structure of Wales, the higher levels of poverty and welfare-
reliance, and a more dispersed population.
In percentage terms, Welsh local government spending exceeds that in England by most for
culture and leisure (91%), regulation and safety (72%) and planning and development (63%),
with the latter largely explained by greater spending on economic and community development.
Spending on transport is close to the English average (2% higher), although it should be
remembered that spending in England is skewed by high spending in London and, to a lesser
extent, other metropolitan areas, and outside of these areas spending on transport would be
considerably lower than in Wales.
Table 3.2. Net current service expenditure per person by service, England and
Wales, 2012–13
Service Area England Wales Wales as % of England
Education services 734 843 115%
Social services 397 487 123%
Police service 217 204 94%
Environment and refuse 79 102 129%
Transport 98 101 102%
Culture and leisure (ex. libraries) 39 75 191%
Central and other services 65 74 114%
Fire service 41 45 109%
Housing services 40 43 107%
Planning and development 24 39 163%
Regulation and safety 19 33 172%
Library services 15 17 110%
Total 1,768 2,062 117%
Total (excluding education) 1,035 1,219 118%
Source: DCLG and StatsWales, local government budget estimates, 2012−13.
In our analysis of local government spending in England for the 2012 Green Budget we showed
that levels of local government net current service spending (excluding education) varied
significantly across the regions of England. Figure 3.5 shows where Wales would lie if it were a
region of England: it would have the second highest level of spending after London, and £112 per
person per year higher than in the North East, the region of England with the next highest
spending.

© Institute for Fiscal Studies, 2012
26
Figure 3.5. Spending per person by local government (excluding education)
across the regions of England and Wales, 2012–13
Source: DCLG and StatsWales, local government expenditure estimates, 2012−13
3.2 Where has the axe been falling? Cuts between
2009−10 to 2012−13
The local government spending figures for 2012−13 described in Section 3.1 follow three years of
real-term cuts in both Wales and England. In this section, we examine how the cuts in Welsh local
government spending vary by service and across the country and compare the situation in Wales
with that in England.
Table 3.3 shows net current service expenditure by local government for each year since
2009−10, and the change in spending each year expressed as a percentage of 2009−10 spending.
The first two rows show nominal expenditure and the change in nominal expenditure; the second
two rows show real expenditure (measured in 2012−13 prices) and the change in real
expenditure, and so account for whole-economy inflation (as measured by the GDP deflator); and
the final two rows show real expenditure per person and the change in real expenditure per
person, and so account for inflation and changes in population.
In nominal terms, net current service expenditure has increased from £6.32 billion to £6.35
billion between 2009−10 and 2012−13, an increase of around 0.6%. However, economy-wide
inflation, which is predicted to average about 2.6% per year over these three years, means that
real net current service expenditure is estimated to be reduced by 7.0% between 2009−10 and
2012−13. Population growth of around 0.5% per annum means that the fall in real spending per
person is greater at 8.4%. The biggest falls took place in 2010−11 and the pace of reduction has
fallen in each of the following two years: spending per person was 3.4% below its peak in
2010−11, 6.6% below its peak in 2011−12 and 8.5% below its peak in 2012−13. But it is
important to note that inflation and population growth mean real-terms spending is continuing
to fall in 2012−13 despite an increase in nominal spending.
0
200
400
600
800
1,000
1,200
1,400
1,600
Spen
din
g p
er p
erso
n (
£)
Region of England and Wales

© Institute for Fiscal Studies, 2012
27
Table 3.3. Net current service expenditure per person by Welsh local
government, 2009–10 to 2012–13
2009−10 2010−11 2011−12 2012−13
Expenditure (£ billion, current prices) 6.32 6.30 6.28 6.35
% change (annual, % of 2009−10 level) -0.2% -0.4% 1.2%
% change (cumulative) -0.2% -0.6% 0.6%
Expenditure (£ billion, 2012−13 prices) 6.83 6.63 6.45 6.35
% change (annual, % of 2009−10 level) -3.0% -2.6% -1.4%
% change (cumulative) -3.0% -5.6% -7.0%
Expenditure per person (£, 2012−13 prices) 2,253 2177 2104 2062
% change (annual, % of 2009−10 level) -3.3% -3.2% -1.9%
% change (cumulative) -3.3% -6.6% -8.4%
Source: StatsWales, local government expenditure outturns (2009−10 and 2010−11) and estimates (2011−12 and
2012−13) and authors’ calculations.
Notes: Inflation as measured by the GDP deflator estimated at 2.84% between 2009−10 and 2010−11; 2.38% between
2010−11 and 2011−12; and predicted to be 2.7% between 2011−12 and 2012−13.
The changing funding situation: grants and council tax
The downward pressure on local government budgets during the three years since 2009−10 is
very much driven by real-terms reductions in Welsh Government grants to local government. On
average, general and specific grants have been reduced by 8.6% in real terms since 2009−10 (or
by 10.1% per person), while council tax revenues have increased by 3.0% (or 1.4% per person)
in real terms. As discussed in Section 3.1, grants contribute four-fifths of the spending power of
Welsh local government, which means that when combined with a small real-terms increase in
council tax revenues, overall spending power has been reduced by 6.5% (or 7.9% per person), on
average. In other words, the reductions in spending power and resultant cuts to net current
service expenditure are the result of cuts imposed by central government as opposed to
discretionary decisions by local government.
There is significant variation in the changes in grants and spending power across Wales. For
instance, the real-terms reduction in grants is as large as 16.7% (17.3% per person) in the Isle of
Anglesey and as small as 1.6% in Cardiff (5.6% per person). All councils, with the exception of
Caerphilly (which has implemented a council tax freeze since 2010−11), have seen a real-terms
increase in council tax revenues, with the greatest increase (6.9% or 6.2% per person) being in
the Isle of Anglesey. The real-terms reduction in overall spending power varies is also greatest in
the Isle of Anglesey at 12.9% (13.5% per person) and smallest in Cardiff at 1.0% (5.1% per
person).14 Indeed, the correlation between the reduction in grants and overall spending power is
almost perfect (the correlation coefficient is 0.99, where 1 is the maximum indicating perfect
correlation). This indicates that the differences in the scale of local government spending cuts
across Wales reflect, very largely, differences in the scale of cuts to grants from central
government as opposed to local government spending decisions.
14
Note that per-person reduction in grants and spending power is smaller than in Cardiff in Carmarthenshire, Flintshire,
Torfaen, Wrexham and Rhondda Cynon Taf. This reflects the fact that the population is growing significantly more
slowly in these areas than in Cardiff (the fastest growing UA in Wales).

© Institute for Fiscal Studies, 2012
28
The cuts to net current service spending: variation across Wales
The fact that grants and council tax revenues have evolved differently for different local
authorities means that one may expect the cuts to vary in magnitude across Wales. This is indeed
what is found.
For instance, Police Authorities’ real net current service spending per person is due to be cut by
11.3% between 2009−10 and 2012−13. However, the size of the cut varies between 8.3% in
Gwent and 12.6% in Dyfed-Powys (it is 11.1% in North Wales and 12.1% in South Wales). The
cuts in Fire Authorities’ real net current service spending per person also vary across Wales: the
average cut of 12.3% reflects cuts of 16.2% and 15.2% in West Wales and North Wales,
respectively, but a cut of only 8.6% in South Wales.
There is also variation in the size of cuts being made by different UAs (the average cut is 8.0%).
Figure 3.6 shows the size of the cuts in both cash and percentage terms for the four regions we
defined, and for the two EU regions of Wales (East Wales and West Wales and The Valleys). It
shows that the cuts have been largest in both cash and percentage terms in the Southern Cities
(the area with the lowest spending per person in both 2009−10 and 2012−13) at £180 per
person or 9.7%, and are smallest in cash and percentage terms in North East Wales at £127 or
6.7%. Cuts in The Valleys (the area with the highest spending per person in both 2009−10 and
2012−13) are planned equal to £165 per person or 7.9%, with cuts of £145 or 7.5% in the Rest-
of-Wales. Planned cuts are slightly larger in West Wales and The Valleys than East Wales in cash
terms (£158 versus £156 per person), but higher spending per person in West Wales means the
percentage cuts are slightly smaller (7.8% versus 8.4%).
Figure 3.6. Cuts to net current service expenditure per person by UAs across
regions of Wales, 2009–10 to 2012–13
Source: StatsWales, local government expenditure outturns (2009−10 and 2010−11) and estimates (2011−12 and
2012−13) and authors’ calculations.
As we shall see later, the cuts in local government net current service expenditure in England
were significantly larger in both cash and percentage terms in the poorer, higher-spending areas
-10%
-8%
-6%
-4%
-2%
0%
-200
-180
-160
-140
-120
-100
-80
-60
-40
-20
0
Wal
es
Th
e V
alle
ys
Th
e So
uth
ern
Cit
ies
No
rth
Eas
t W
ales
Res
t o
f W
ales
Eas
t W
ales
Wes
t W
ales
an
d t
he
Val
ley
s
Ch
ange
in r
eal s
pen
din
g (%
)
Ch
ange
in r
eal s
pen
din
g (£
per
per
son
per
yea
r) Cash (left hand axis) Percentage (right hand axis)
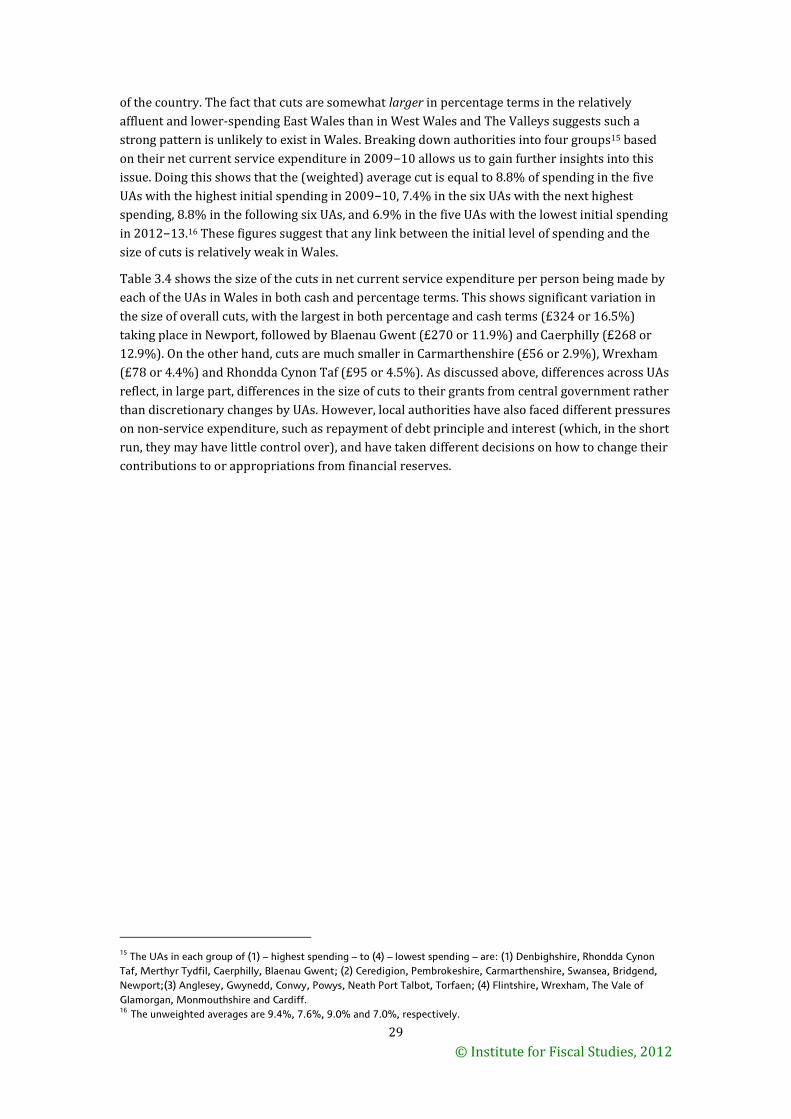
© Institute for Fiscal Studies, 2012
29
of the country. The fact that cuts are somewhat larger in percentage terms in the relatively
affluent and lower-spending East Wales than in West Wales and The Valleys suggests such a
strong pattern is unlikely to exist in Wales. Breaking down authorities into four groups15 based
on their net current service expenditure in 2009−10 allows us to gain further insights into this
issue. Doing this shows that the (weighted) average cut is equal to 8.8% of spending in the five
UAs with the highest initial spending in 2009−10, 7.4% in the six UAs with the next highest
spending, 8.8% in the following six UAs, and 6.9% in the five UAs with the lowest initial spending
in 2012−13.16 These figures suggest that any link between the initial level of spending and the
size of cuts is relatively weak in Wales.
Table 3.4 shows the size of the cuts in net current service expenditure per person being made by
each of the UAs in Wales in both cash and percentage terms. This shows significant variation in
the size of overall cuts, with the largest in both percentage and cash terms (£324 or 16.5%)
taking place in Newport, followed by Blaenau Gwent (£270 or 11.9%) and Caerphilly (£268 or
12.9%). On the other hand, cuts are much smaller in Carmarthenshire (£56 or 2.9%), Wrexham
(£78 or 4.4%) and Rhondda Cynon Taf (£95 or 4.5%). As discussed above, differences across UAs
reflect, in large part, differences in the size of cuts to their grants from central government rather
than discretionary changes by UAs. However, local authorities have also faced different pressures
on non-service expenditure, such as repayment of debt principle and interest (which, in the short
run, they may have little control over), and have taken different decisions on how to change their
contributions to or appropriations from financial reserves.
15
The UAs in each group of (1) – highest spending – to (4) – lowest spending – are: (1) Denbighshire, Rhondda Cynon
Taf, Merthyr Tydfil, Caerphilly, Blaenau Gwent; (2) Ceredigion, Pembrokeshire, Carmarthenshire, Swansea, Bridgend,
Newport;(3) Anglesey, Gwynedd, Conwy, Powys, Neath Port Talbot, Torfaen; (4) Flintshire, Wrexham, The Vale of
Glamorgan, Monmouthshire and Cardiff. 16 The unweighted averages are 9.4%, 7.6%, 9.0% and 7.0%, respectively.
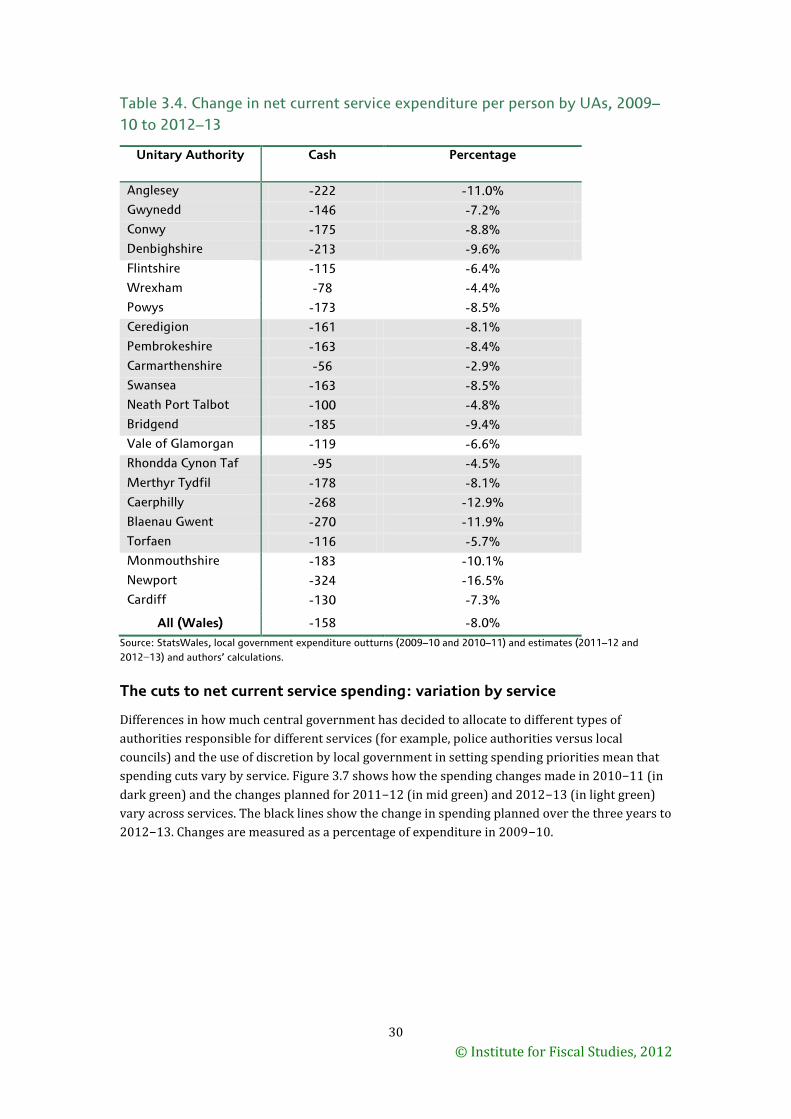
© Institute for Fiscal Studies, 2012
30
Table 3.4. Change in net current service expenditure per person by UAs, 2009–
10 to 2012–13
Unitary Authority Cash Percentage
Anglesey -222 -11.0%
Gwynedd -146 -7.2%
Conwy -175 -8.8%
Denbighshire -213 -9.6%
Flintshire -115 -6.4%
Wrexham -78 -4.4%
Powys -173 -8.5%
Ceredigion -161 -8.1%
Pembrokeshire -163 -8.4%
Carmarthenshire -56 -2.9%
Swansea -163 -8.5%
Neath Port Talbot -100 -4.8%
Bridgend -185 -9.4%
Vale of Glamorgan -119 -6.6%
Rhondda Cynon Taf -95 -4.5%
Merthyr Tydfil -178 -8.1%
Caerphilly -268 -12.9%
Blaenau Gwent -270 -11.9%
Torfaen -116 -5.7%
Monmouthshire -183 -10.1%
Newport -324 -16.5%
Cardiff -130 -7.3%
All (Wales) -158 -8.0%
Source: StatsWales, local government expenditure outturns (2009−10 and 2010−11) and estimates (2011−12 and
2012−13) and authors’ calculations.
The cuts to net current service spending: variation by service
Differences in how much central government has decided to allocate to different types of
authorities responsible for different services (for example, police authorities versus local
councils) and the use of discretion by local government in setting spending priorities mean that
spending cuts vary by service. Figure 3.7 shows how the spending changes made in 2010−11 (in
dark green) and the changes planned for 2011−12 (in mid green) and 2012−13 (in light green)
vary across services. The black lines show the change in spending planned over the three years to
2012−13. Changes are measured as a percentage of expenditure in 2009−10.

© Institute for Fiscal Studies, 2012
31
Figure 3.7. Cuts to local government current service spending in Wales by
service area, 2009–10 to 2012–13
Source: StatsWales, local government expenditure outturns (2009−10 and 2010–11) and budgets (2011−12 and
2012−13) , available at http://statswales.wales.gov.uk/index.htm.
Note: Changes are measured as a percentage of expenditure in 2009−10.
Spending on regulation and safety services is set to face the largest cuts of any service area,
equivalent to 24.6% over three years, with planning and development (22.9%) and housing
services (20.6%) close behind. The timing of the cuts differs significantly, however:
Net current service expenditure per person on regulation and safety services fell 7.0% in
2010−11, 16.3% in 2011−12 and is planned to be reduced by only 1.3% in 2012−13.
Planning and development saw a small rise in spending in 2010−11 (2.3%), but cuts for
2011−12 and 2012−13 are planned to equal 13.0% and 12.3%, respectively.
Spending on housing services fell by 29.6% in 2010−11, but local government budgeted
for increases during the following two years (8.0% in 2011−12 and 1.1% in 2012−13).
Social services and environmental and refuse services have both been relatively protected from
the cuts, seeing reductions in net current service spending per person of only 3.8% and 4.8%,
respectively. This may reflect prioritisation of these services by local authorities, or rising
demands on these budgets that mean there is less scope for spending cuts. Furthermore, the
Welsh Government has stated that it expects UAs to protect spending on social services and
published a set of figures for what it thought this implied for the cash-terms social service
budget.17 It is notable that the real-terms reduction in social services spending took place entirely
between 2010−11 and 2011−12, the first year to which these targets applied. However, the
change in spending between 2010−11 and 2012−13 was more generous than that required to
meet the Welsh Government’s plans. Over the three years since 2009−10, expenditure on central
17
The suggested changes in expenditure were: in 2011−12, -0.33% in cash terms, which is equivalent to -2.65% in real
terms (-3.30% per person), and in 2012−13, +1.58% in cash terms, which is equivalent to -0.78% in real terms (-1.31%
per person). Suggested increase s in cash-terms spending (but reductions in real-terms spending) have also been
published for 2013−14 and 2014−15.
-30%
-20%
-10%
0%
10%
20%
30% R
eal c
han
ge in
sp
end
ing
(2
00
9−
10
to
20
12
−1
3)
Change in 2012−13
Change in 2011−12
Change in 2010−11
Total change

© Institute for Fiscal Studies, 2012
32
services has also fallen by a relatively small amount: 2.6%. However, spending in this area is
volatile and large cuts in 2010−11 (over 25%) were followed by large increases in 2011−12
(over 20%), and so figures for this service area should be treated with caution. It is also worth
noting that ‘central services’ does not include all administration and management functions:
much of this is charged to other service area budgets (e.g. the payroll and computing costs
associated with the education service are included in education spending). Until full spending
outturns are available we cannot say how the cuts within each area have been delivered (e.g.
whether it is via reductions in spending in schools or in central administration).
Spending on education services is planned to be reduced by slightly less than the overall cut:
7.3%, spread across each of the three years. This could suggest that education may not have been
especially protected, but may also reflect the fact lower spending pressures in this area (for
instance, due to the decline in pupil numbers during this period). The Welsh Government has
stated that, along with social services, it also expects UAs to protect spending on education, and
has suggested the same annual changes in expenditure. UAs met these targets in 2011−12 but
planned budgets for 2012−13 do not meet the targets.
Of course, large cuts in the budgets of small departments (e.g. library services or regulation and
safety services) might contribute a smaller fraction of the overall cut than small cuts in the
budgets of large departments (e.g. social services). Figures 3.8a shows the fraction of the total
cuts that have been delivered by each service area for total local government.
The largest service areas have delivered the largest cash contributions to the overall spending
cuts, even where the percentage cuts have been smaller than average. For instance, cuts to
education spending account for 35% of the planned reduction in overall local government net
current service expenditure by 2012−13 (education represents 41% of overall planned spending
in 2012−13), with cuts to police services accounting for 13% of overall cuts (police services
represent 10% of planned spending 2012−13). Reductions in social service spending are the
third largest contributor to the overall cuts (10%), although this is much less than the fraction of
spending absorbed by social services (a planned 24% in 2012−13): this is due to the relatively
small percentage cuts to this service area.
Other services areas, which together account for 26% of planned spending in 2012−13, have
contributed approximately 37% of the overall cuts since 2009−10. Large percentage cuts to
housing services, regulation and safety services and planning services mean that the
contributions of these areas to overall cuts (each contributes 6%) is much larger than their
contribution to overall spending (each contributes around 2%). On the other hand, central
services and environmental services are contributing less to the cuts (1% and 3%, respectively),
than they represent as a fraction of total expenditure (4% and 5%, respectively).

© Institute for Fiscal Studies, 2012
33
Figure 3.8a. Proportion of cuts to overall local government current service
spending delivered by each service area, Wales, 2009–10 to 2012–13
Source: StatsWales, local government expenditure outturns (2009−10 and 2010–11) and budgets (2011−12 and
2012−13), available at http://statswales.wales.gov.uk/index.htm
Figure 3.8b shows the fraction of overall cuts by UAs delivered by each of the services they
provide and, unsurprisingly, shows effectively the same pattern (it is included for reference
purposes).
Figure 3.8b. Proportion of cuts to overall local government current service
spending delivered by each service area, Wales, 2009–10 to 2012–13 (UAs)
Source: StatsWales, local government expenditure outturns (2009−10 and 2010–11) and budgets (2011−12 and
2012−13), available at http://statswales.wales.gov.uk/index.htm
Given that local authorities are facing differential cuts to their overall current service
expenditure, and because they may be prioritising different services, the cuts to each service area
also differ. Full details of the cuts made and planned in each service area can be found in the
35%
10%
13% 3%
8%
8%
1% 3%
6%
6%
6%
1% Education services
Social services
Police service
Environment and refuse
Transport
Culture and leisure (ex. libraries)
Central and other services
Fire service
Housing services
Planning and development
Regulation and safety
Library services
42%
12% 3%
10%
9%
1%
7%
7%
7%
2% Education services
Social services
Environment and refuse
Transport
Culture and leisure (ex. libraries) Central and other services
Housing services
Planning and development
Regulation and safety
Library services

© Institute for Fiscal Studies, 2012
34
accompanying online spreadsheet.18 Here we highlight four UA service areas: education services,
social services, culture and leisure services, and planning and development services.
Table 3.5 shows the planned percentage change in real-terms spending in each of these areas by
each UA, the overall percentage cuts by each UA, and the average figures for Wales. It shows that:
Education spending is planned to be reduced in real terms between 2009−10 and
2012−13 in all UAs. However, the scale of the cuts varies substantially, with five UAs
cutting spending by less than 5% (the smallest reduction is in Conwy where the
reduction is 2.4%), and four reducing spending by more than 10% (the biggest reduction
is in Monmouthshire at 13.1%).
Social services spending is planned to be reduced in 14 out of 22 Welsh UAs, with
increases in the rest. Increases in spending are largest in Pembrokeshire and
Carmarthenshire (around 5%), with the largest cuts in Newport (nearly 14%). It is
notable that the three Southern Cities all plan to have made major cuts to this service
area and, in the case of Cardiff and Swansea, percentage cuts that exceed the average for
all services (the only other UA to do this is Anglesey).
Expenditure on culture and recreation (excluding libraries) is due to be reduced in 18
out of 22 Welsh UAs. Those planning increases in spending are Powys (10.0%), Blaenau
Gwent (9.9%), Ceredigion (5.8%) and Merthyr Tydfil (2.9%). Among those cutting, many
are planning very significant cuts. Cuts exceed 25% in 13 UAs, and exceed 10% in 13
UAs. Percentage cuts exceed the average for all services in 17 out of 22 UAs.
Expenditure on planning and development services is due to be lower in real terms in
2012−13 than in 2009−10 in 18 out of 22 Welsh UAs. Those increasing expenditure are
Neath-Port Talbot (38.3%), Carmarthenshire (33.7%), Torfaen (13.7%) and Swansea
(3.9%). Elsewhere in Wales, the cuts are often large, at up to 75% in Blaenau Gwent, and
over one-third in half (11) of all Welsh UAs. These cuts are mainly due to reductions in
planned spending on economic and community development as opposed to planning
control.
18
The online appendix spreadsheet will be available from 31st October 2012 at
http://www.ifs.org.uk/docs/WelshLGSpending.xlsx

© Institute for Fiscal Studies, 2012
35
Table 3.5. Change in net current service expenditure per person by UAs for
selected services (%), 2009–10 to 2012–13
Unitary Authority Education Social Services
Culture (ex. libraries)
Planning and Development
Total
Anglesey -9.7% -11.4% -29.8% -46.0% -11.0%
Gwynedd -4.3% -4.0% -18.2% -17.3% -7.2%
Conwy -2.4% -4.3% -6.8% -1.4% -8.8%
Denbighshire -7.4% -5.4% -23.2% -18.3% -9.6%
Flintshire -9.7% 1.3% -9.5% -6.5% -6.4%
Wrexham -6.1% -4.1% -6.8% -45.2% -4.4%
Powys -12.3% 2.8% 10.0% -51.7% -8.5%
Ceredigion -7.5% -7.1% 5.8% 12.8% -8.1%
Pembrokeshire -4.9% 4.6% -39.3% -35.3% -8.5%
Carmarthenshire -6.4% 5.5% -29.6% 33.7% -2.9%
Swansea -9.1% -9.9% -17.4% 3.9% -8.6%
Neath Port Talbot -9.2% 3.9% -28.9% 38.3% -4.8%
Bridgend -4.6% -5.6% -23.2% -20.4% -9.4%
Vale of Glamorgan -3.0% -4.5% -20.5% -40.1% -6.6%
Rhondda Cynon Taf -4.7% 0.2% -9.0% -35.0% -4.5%
Merthyr Tydfil -6.6% -7.9% 2.9% -28.4% -8.1%
Caerphilly -9.2% -7.9% -31.6% -26.0% -12.9%
Blaenau Gwent -12.4% 3.6% 9.9% -74.8% -11.9%
Torfaen -6.7% -2.6% -41.4% 13.7% -5.7%
Monmouthshire -13.1% 0.5% -21.9% -26.4% -10.1%
Newport -11.1% -13.8% -19.8% -59.2% -16.5%
Cardiff -4.9% -9.7% -9.0% -34.4% -7.3%
All (Wales) -7.3% -3.8% -16.9% -22.9% -8.5%
Source: StatsWales, local government expenditure outturns (2009−10 and 2010−11) and estimates (2011−12 and
2012−13) and authors’ calculations.
The cuts to net current service spending: comparisons with England
English local government has also been making cuts during this period, and in this section we
compare the size and nature of these cuts to those being made in Wales. As with most of our
comparisons on the level of local government spending in England and Wales, this analysis
excludes spending on education, a large part of which increasingly bypasses local authorities in
England (due to the Academy and Free Schools programme).
Larger cuts to grants and a freeze in council tax rates in virtually all of England have meant that
English local authorities have had to make larger cuts to their net current service expenditure
than those in Wales. The larger cuts in grants in England reflect the fact that the UK Government
has chosen to protect real-terms current spending on the NHS and schools in England,
necessitating larger cuts in other budgets such as local government. The Welsh Government did
not decide to prioritise spending on the NHS or schools as much, allowing it to make smaller cuts
in grants to local authorities. Figure 3.9 shows the size of the cuts in cash and percentage terms
for Wales, England, and each of the regions of England since 2009−10.

© Institute for Fiscal Studies, 2012
36
Figure 3.9. Cuts to local government net current service spending (excluding
education), by region of England and Wales, 2009–10 to 2012–13
Source: DCLG and StatsWales, local government expenditure outturns (2009−10 and 2010−11) and budget estimates
(2011−12 and 2012−13).
Cuts to net current service spending per person (excluding education) total £124 (9.3%) in Wales
and £191 (15.6%) in England. This means English local government has cut spending by around
1.5 times as much per person than in Wales in cash terms, and 1.7 times as much in percentage
terms. Clearly, so far, Welsh local government has fared rather better than English local
government.
We saw earlier (Section 2.1) that in 2012−13, local government spending per person in Wales
was between the levels in the North East of England and London. The contrast between the
experience in Wales and these high-spending regions of England is even starker: spending cuts of
19.3%, 18.7% and 18.3% in London, the North East and North West, respectively, are around
double the level in Wales.
Focusing on England, a clear pattern emerges, where not only the largest cash-terms cuts but also
the largest percentage cuts are found in the regions of England where spending is (and initially
was) highest. Because spending in England tends to be higher in urban areas with high levels of
deprivation in London and the North of England, this means that the cuts in England have hit
poorer parts of the country hard. This reflects the fact that, as in Wales, the cuts in local
government spending in England are largely driven by reductions in grants, which make up a far
larger proportion of total spending power for these poorer, more deprived local authorities than
more affluent ones (revenue from council tax, which the more affluent authorities rely more
upon, has been reduced in real terms due to the council tax freeze, but by significantly less). The
Department for Communities and Local Government (which determines grants to local
authorities in England) sets floors on how much grants could be reduced by, which were
somewhat more generous for authorities that rely more on grants, but were not generous enough
to ensure that they did not face significantly larger reductions in spending power than more
-20.0%
-17.5%
-15.0%
-12.5%
-10.0%
-7.5%
-5.0%
-2.5%
0.0%
-400
-350
-300
-250
-200
-150
-100
-50
0
Wal
es
En
glan
d
Lo
nd
on
No
rth
Eas
t
No
rth
Wes
t
Yo
rksh
ire
and
Hu
mb
er
Wes
t M
idla
nd
s
Eas
t
Sou
th W
est
Sou
th E
ast
Eas
t M
idla
nd
s
Ch
ange
in r
eal s
pen
din
g (%
)
Ch
ange
in r
eal s
pen
din
g (£
per
per
son
per
yea
r) Cash (left hand axis) Percentage (right hand axis)

© Institute for Fiscal Studies, 2012
37
affluent areas. This did not occur in Wales because the method for calculating grants to local
authorities differs significantly.19
Percentage cuts in the South East of England, the area where spending was lowest in 2009−10,20
and perhaps the least deprived region of England, have averaged just 10.7%, with the East and
South West also seeing below average reductions in spending. As we saw above, it does not
appear to be the case that the cuts in Wales are larger in percentage terms in the higher-
spending, poorer areas of Wales: if anything the cuts are slightly larger in percentage terms in the
more affluent East Wales than in West Wales and The Valleys.
We next examine the timing of cuts in England versus Wales. Table 3.6 shows how much of the
overall cuts (excluding education) since 2009−10 were made in each year, expressed in cash
terms and as a percentage of 2009−10 expenditure. The largest cuts in both countries took place
in 2010−11, before the 2010 Spending Review settlements: cuts in spending per person were £58
(4.4%) in Wales and £81 (6.6%) in England in that year. Spending cuts have since slowed
somewhat, especially in Wales, where the cuts to average spending per person (excluding
education) were just £22 (1.6% of 2009−10 spending per person) in 2012−13.
Table 3.6. The timing of the cuts (excluding education), England and Wales,
2009–10 to 2012–13
2009−10 to 2010−11
2010−11 to 2011−12
2011−12 to 2012−13
Total
Wales
Cash -58 -44 -22 -124
Percentage (annual) -4.4% -3.3% -1.6% -9.3%
England
Cash -81 -53 -57 -191
Percentage (annual) -6.6% -4.3% -4.7% -15.6%
Source: DCLG and StatsWales, local government expenditure outturns (2009−10 and 2010−11) and budget estimates
(2011−12 and 2012−13).
Note: Percentage changes are measured as a percentage of expenditure in 2009−10.
It is also instructive to examine which services have seen the largest cuts in spending in England
and compare this to Wales. We first do this for England as a whole, and then for the North East of
England, a region that shares many similarities with Wales in terms of socio-economic and
demographic characteristics but that, as we have seen, has had to make cuts around twice as
large as those in Wales.
Table 3.7 shows the real- terms cut in net current service spending per person between 2009−10
and 2012−13 in England and Wales in both cash and percentage terms (for all services excluding
education).
The cuts to police services, fire services and environmental and refuse services in England are
broadly similar in percentage terms and cash terms to those in Wales (a little higher in the case
of police and a little lower in the case of the other two). However, because the size of the overall
reduction in spending in Wales is smaller, they contribute a considerably higher fraction of the
19
The funding formulas in use in Wales determine the level of spending deemed necessary to provide a standard level of
service given local characteristics (this is called the Standard Spending Assessment). The amount that can be raised
locally from council tax (if the authority changed an ‘average’ level of council tax) is then subtracted from this and the
amount of grant to be provided is calculated as a residual. 20
Spending per person in the East Midlands is now below that in the South East following large spending cuts in 2011−12. In
2009−10 spending per person was between the level in the West Midlands and East of England.

© Institute for Fiscal Studies, 2012
38
total reduction in Wales than in England. These are areas that have been relatively protected in
England, whereas police and fire services have both seen greater than average spending cuts in
Wales.
For all other services, cuts have been considerably higher in percentage terms in England than in
Wales. Spending per person on planning and development has been reduced by 50% (£24 per
person) as opposed to 23% (£12), cuts to regulation and safety services have totalled 32% (£9)
versus 25% (£11), and cuts to libraries have totalled 23% (£5) versus 12% (£2).
Table 3.7. Cuts in real-terms local government spending per person (£s and %),
England and Wales, 2009–10 to 2012–13
Service Area Spending cuts in Wales Spending cuts in England
(£s) (%) (£s) (%)
Social services -19 -3.8% -38 -8.7%
Police service -26 -11.2% -33 -13.1%
Environment and refuse -5 -4.8% -3 -3.5%
Transport -15 -13.2% -37 -27.4%
Culture and leisure (ex.
libraries)
-15 -16.9% -13 -24.7%
Central and other
services
-2 -2.6% -10 -13.7%
Fire service -6 -11.6% -4 -8.3%
Housing services -11 -20.6% -16 -28.8%
Planning and
development
-12 -22.9% -24 -49.8%
Regulation and safety -11 -24.5% -9 -32.2%
Library services -2 -12.1% -5 -23.2%
Source: DCLG and StatsWales, local government expenditure outturns (2009−10 and 2010−11) and budget estimates
(2011−12 and 2012−13).
The reduction in spending on social services has been much larger in England than in Wales –
8.7% (£38 per person) versus 3.8% (£19) – and they have therefore made a larger contribution
to the overall cuts (20% versus 15%). That is, while spending on social care has been relatively
protected in England (the 8.7% reduction is considerably less than the 15.6% average reduction),
it has not enjoyed quite the same degree of protection as in Wales, although this may reflect
differential demand for social services in England and Wales. Transport spending has also been
cut by considerably more in England than in Wales, although in part this is driven by the high
levels of spending and subsequently large cuts in spending in London by Transport for London.
Table 3.8 repeats the analysis, this time comparing Wales and the North East of England. Local
government in the North East of England has made cuts of almost 19% versus just over 9% in
Wales. It has done this by making much larger cuts in a number of service areas including:
social services, where spending has been reducing by 11.8%, or £58 per person per year,
around three times the size of the cuts in Wales;
culture and leisure (ex. libraries), where spending has been reduced by 35.7%, or £28
per person per year, over twice the percentage cuts in Wales;
central and other services, where spending has been reduced by 22.9%, or £25 per
person per year, over ten times the size of the cuts in Wales; and

© Institute for Fiscal Studies, 2012
39
transport, where spending has been reduced by 22.3%, or £27 per person per year
versus £15 per person per year in Wales.
Table 3.8. Cuts in real-terms local government spending per person (£s per
person) and contribution to overall cuts (excluding education), North East
England and Wales, 2009–10 to 2012–13
Service Area Spending cuts in Wales Spending cuts in North East England
(£s) (%) (£s) (%)
Social services -19 -3.8% -58 -11.8%
Police service -26 -11.2% -33 -13.4%
Environment and refuse -5 -4.8% -4 -5.1%
Transport -15 -13.2% -27 -22.3%
Culture and leisure (ex.
libraries)
-15 -16.9% -28 -35.7%
Central and other
services
-2 -2.6% -25 -22.9%
Fire service -6 -11.6% -3 -5.3%
Housing services -11 -20.6% -20 -34.7%
Planning and
development
-12 -22.9% -37 -57.4%
Regulation and safety -11 -24.5% -14 -44.3%
Library services -2 -12.1% -6 -25.1%
Source: DCLG and StatsWales, local government expenditure outturns (2009−10 and 2010−11) and budget estimates
(2011−12 and 2012−13).
While a more generous funding settlement has meant that Welsh local authorities have not had
to make as drastic cuts as those in the North East, further real-terms reductions in grants over
the coming years may necessitate similarly large cuts in Wales. Perhaps the North East of
England provides evidence that this is possible (in that it can be done, although not necessarily
without significant reductions in the quantity or quality of services provided), but that as the
scope for cutting areas such as planning and development and regulation and safety diminishes,
socially important ‘core’ services such as social services cannot be protected as much.
A longer run perspective on local government expenditure
Appendix B contains an analysis of local government spending in England and Wales since
2001−02. However, it is worthwhile highlighting a number of key results from this work.
Between 2001−02 and 2009−10 (and especially the first half of this period) there were
significant real-terms increases in Welsh local government service expenditure (32%), of which
just over one-third have been undone by the cuts planned between 2009−10 and 2012−13. The
areas seeing especially large increases between 2001−02 and 2009−10 were housing services
(largely the result of the ‘Supporting People’ initiative), planning and development, environment
and refuse, regulation and safety and social care. The increases in other service areas (such as
libraries or education) were substantially less.
The cuts over the last three years have also impacted different services differently. Large cuts to
library services and cultural and recreational services have nearly wiped out earlier increases,
meaning real-terms current service spending per person is little higher than in 2001−02.

© Institute for Fiscal Studies, 2012
40
The increase in spending on housing services remains very large at 197%, although this does
mean just over one-quarter of the earlier increases to 2009−10 have since been undone.
Spending per person on planning and development services is set to be 51% above its 2001−02
level in 2012−13, and although this means almost half of the earlier increases have been undone,
it may mean there is scope for further substantial reductions if necessary, although as in all areas,
the impact of any cuts on service quality must be examined carefully. At the very least, it is likely
to be easier to identify spending cuts given that spending is still significantly higher than 12 years
ago than in services that have not seen such spending increases. On the other hand, whilst only a
relatively small part of the increases in spending on environmental and refuse services and social
services has been undone (around £1 in £8 and £1 in £9, respectively), these may be areas where
statutory obligations limit the scope for major reductions.
The appendix also compares the longer run picture in Wales with that in England. One striking
finding is that local government spending per person on planning and development, culture and
leisure (ex. libraries), libraries, and central and other services is over 15% below its 2001−02
level in England. On the other hand, spending on the last three of these services is at similar
levels to that in 2001−02 in Wales, while spending on planning and development services
remains 50% above its 2001−02 level. This provides further evidence that there may still be
scope for further reductions to these budgets, before Welsh local authorities need to shift more of
the cuts to more politically sensitive social care, environment and waste, education and housing
budgets as the spending cuts continue, likely until at least 2016−17.

© Institute for Fiscal Studies, 2012
41
4. Local government settlements and
spending: scenarios to 2020
Summary
The Welsh Government has set out indicative figures for the size of the general grant it will
give to UAs in 2013−14 and 2014−15. If specific grants change in line with the rest of Welsh
Government expenditure, and council tax receipts grow in line with whole-economy
inflation and the projected increase in household numbers, the real-terms spending power
of UAs will continue to fall at a similar rate to 2012−13: by 1.4% per person in 2013−14 and
1.9% per person in 2014−15.
The size of grants to UAs after 2014−15 will depend on the spending decisions taken by the
Welsh Government, which in turn will depend on the decisions taken by the UK
Government and hence, the state of the economy and public finances.
The UK Government has announced that it plans further cuts in current expenditure in
2015−16 and 2016−17 but has not yet decided how to allocate these. If it decides to make
£10 billion in further cuts to welfare (benefit and tax credit) spending, and the Welsh
Government sees its budget change in line with public service spending as a whole, current
spending forecasts would see the Welsh current budget fall by around 3.2% per year, on
average, in 2015−16 and 2016−17. If no further cuts were made to welfare spending, the
cuts increase to 4.4% per year. Both figures are significantly greater than the average
reduction between 2010−11 and 2014−15 (2.0% per year).
If the Welsh Government allocates the cuts in its budget across all services proportionally,
and council tax receipts continue to grow in line with inflation and the number of
households in Wales, UAs’ spending power would fall by 2.9% per person per year, on
average, in 2015−16 and 2016−17 if further cuts are made to welfare spending. If welfare
expenditure is not cut, this figure increases to 3.8% per person per year. The reduction in
spending power would be much larger if the Welsh Government chose to protect the NHS
from this round of cuts (4.7% and 6.3%, respectively, per person). In each scenario, the cuts
would be larger than made between 2009−10 and 2012−13, and the projected cuts in
2013−14 and 2014−15.
The financial situation for UAs looks difficult until at least 2020−21 (the last year examined
in this report), although there is much uncertainty around this as the state of the economy
and public finances, and government decisions will have a significant impact on spending
power. Even under the most optimistic set of assumptions for spending power used (overall
public spending grows in line with the Office for Budget Responsibility’s (OBR) long run
forecast after 2016−17, further welfare cuts of £10 billion are found, and the Welsh
Government chooses not to protect the NHS from cuts), UAs’ spending power per person in
2020−21 would be 1.6% lower in real terms than in 2012−13. Under our most pessimistic
set of assumptions, UAs spending power would be 18% lower (22% lower per person). The
continued weakness in the economy and public finances, and the possibility that reductions
in health might not be delivered, mean that such a scenario is plausible.

© Institute for Fiscal Studies, 2012
42
Such a large reduction in spending power would represent a significant challenge for UAs. If
overall spending on services was to be reduced by 18%, limiting the reductions in overall
spending to half that level (9%) in areas that have so far been relatively protected – social
services, environmental services and refuse, and education – would require cuts of 52% in
spending on all other services. Such large cuts in addition to those already made are likely
to be very difficult to achieve, meaning that other options would need to be considered in
such circumstances. This may involve making significant cuts to service areas so far
relatively insulated from cuts, local authorities stopping providing large swathes of services
that they traditionally have and attempts to generate substantially more revenue, whether
from council tax or increased fees and charges for the provision of some services.
In this section of the report we look to the future and ask how the amount of money available to
local government in Wales may change in the coming years. Unfortunately, the data available and
method used (which involves projecting forward central government spending allocations and
council tax receipts as described in more detail in Appendix C) mean that we cannot project
forward net current service expenditure, the definition of spending used in the previous chapter.
Instead we show various scenarios for a measure of spending by Welsh UAs that accounts for
that funded by council tax, general grants and specific grants (excluding housing and council tax
benefit grants). This is similar to what is termed revenue expenditure in England (note that the
Welsh definition of revenue expenditure is somewhat different and less meaningful for the
analysis of trends in local government spending) and, as in Chapter 3, we call this the ‘spending
power’ of local government. Note that unlike in Chapter 3 our focus here is exclusively on unitary
authorities, and the figures presented from now on exclude the budgets of police, fire and
National Park authorities.
The rest of this chapter proceeds as follows. In Section 4.1 we briefly examine what planned
changes in the Welsh Government’s local government budget item (which is effectively the
general grant to local government), together with a number of assumptions about other grants
and council tax revenues, imply for the resources available to Welsh local government to
2014−15. We then look beyond the period covered by the UK Government’s 2010 Spending
Review and look at how different economic prospects, decisions by the UK Government and by
the Welsh Government could affect the cash available to UAs in Wales. Section 4.2 sets out a
number of scenarios for the overall resources available to the Welsh Government based on
different paths for the overall level of public spending (for instance due to a stronger or weaker
performance in the macro-economy) and whether the UK Government makes further cuts to
welfare expenditure. Section 4.3 then examines what these scenarios may imply for the spending
power of Welsh local government, given that the Welsh Government may wish to protect certain
parts of its budget going forwards (e.g. the NHS).
4.1 The Welsh draft budget: spending to 2014−15
The UK Government’s 2010 Spending Review has set the budget of the Welsh Government as far
as 2014−15, and the Welsh Government has now published draft budgets for each year to
2014−15. Furthermore, the Local Government Financial Settlement for 2012−13 includes
indicative figures for how much the Welsh Government plans to allocate to local government
through general grants (termed ‘Aggregate External Finance’).
This is only part of the resources available to local government, however, with specific grants to
fund particular services or meet specific needs, and council tax providing the rest. In order to
estimate the overall resources available to unitary authorities in 2013−14 and 2014−15 we need
to make some assumptions about how these evolve. We assume that:

© Institute for Fiscal Studies, 2012
43
specific grants change at the same rate as the Welsh Government’s current expenditure
on things other than general grants to local government;
council tax receipts grow by the rate of inflation (GDP deflator) plus the rate of
household growth, proxying an increase in council tax rates in line with inflation.
Table 4.1 shows each of these components of local government’s spending power in real terms
(2012−13 prices) for each year between 2010−11 and 2014−15, together with the percentage
change in spending power and spending power per person in each year. Remember this is a
projection based on budgeted spending and the authors’ assumptions.
Table 4.1. Local government spending power, Wales, 2010–11 to 2014–15, in
2012–13 prices (scenario)
Unitary Authority 2010−11 2011−12 2012−13 2013−14 2014−15
Level (2012−13 prices)
General Grant 4,246 4,104 4,017 3,970 3,895
Specific Grants 1,103 950 961 941 919
Council Tax 1,147 1,159 1,160 1,173 1,186
Spending Power (Total) 6,460 6,213 6,138 6,085 6,001
% Change
Spending Power -4.4 -1.2 -0.9 -1.4
Spending Power per Person -5.0 -1.7 -1.4 -1.9
Source: Specific grants and council tax in 2010−11 to 2012−13 from StatsWales, projections based on OBR (2012) and
Welsh Government Budget 2012. General Grant from Welsh Local Government Financial Settlement, 2012. Authors’
calculations and assumptions.
The results show that the spending power of Welsh UAs would continue to fall in real terms in
2013−14 and 2014−15 at broadly the same rate as in 2012−13, driven by falls in the real-terms
level of the general grant and specific grants, only partially offset by anticipated growth in real
council tax receipts (driven by growth in the number of households).21 It is true that the pace of
cuts has moderated substantially since 2011−12 (and 2010−11), but local authorities may still
need to take difficult decisions on service provision as budgets fail to keep pace with inflation.
The Local Government Financial Settlement for 2013−14 is due to be published before the end of
2012, providing final figures for grants in 2013−14 and updated indicative figures for 2014−15.
4.2 Scenarios for Welsh Government spending to 2020
The current UK Government Spending Review period covering the years up to 2014−15 involves
significant cuts to the Welsh Government’s budget. Welsh Government DEL is to be reduced by an
average of 3.2% per year in real terms (or 12.2% in total) from £15.9 billion in 2010−11 to £13.9
billion in 2014−15 (both measured in 2012−13 prices). The reduction is greatest for the capital
budget, which is being reduced by an average of 13.0% per year (although these cuts were front
loaded), while the Welsh Government’s current DEL is being reduced by an average of 2.0% each
year.
21
Under this scenario, UAs’ spending power in nominal terms (i.e. unadjusted for inflation) is set to increase from
£6,138 million to £6,304 million in 2014−15.

© Institute for Fiscal Studies, 2012
44
But in order to examine the prospects for the spending power of Welsh local government in the
years to 2020−21, one must also examine scenarios for the resources available to the Welsh
Government in the period 2015−16 to 2020−21. These resources will depend on how much the
Welsh Government is allocated by the UK Government going forwards, which in turn will depend
on the state of the economy (which determines how much there is to spend overall), and the UK
Government’s tax and spending decisions.
The UK Government announced it would make further cuts in current expenditure in the years
2015−16 and 2016−17 in the 2011 Autumn Statement when it became clear that its initial plans
to eliminate the structural budget deficit by 2014−15 were not sufficient to do so (it now plans to
do so by 2016−17, and according to the latest OBR forecast it is on track). However, it has yet to
decide whether these cuts will take the form of reductions in spending on benefits and tax credits
(welfare spending) or spending on public services, let alone which departments will be cut.
Furthermore, plans for public spending for 2017−18 and beyond have yet to be announced by the
UK Government. Hence, in order to proceed we examine a number of scenarios for the path of the
economy and government spending. In particular we have two alternative assumptions about
overall public spending:
Overall public spending follows the path set out by the UK Government in its 2012
Budget until 2016−17, and then grows in line with the OBRs’ long-term GDP forecast
(2.4% per year in real terms). This can be seen as the central scenario.
Alternatively, overall public spending follows the path set out by the UK Government,
but remains at its 2016−17 real-terms level in 2020−21, perhaps reflecting further
weakness in the economy and public finances. This can be seen as a pessimistic
scenario, although ongoing weakness in the economy (see Chapter 1) means it is entirely
possible that further downward pressure on public spending is required after 2016−17.
We also need to make an assumption about how the UK Government allocates overall spending
between benefits and tax credits and public services, and different departments after 2014−15,
and we use the following two variants:
Further spending cuts in 2015−16 and 2016−17 are allocated between public service
spending and welfare spending such that £10 billion further welfare cuts are made. In
2017−18 and beyond, social benefits rise in line with the OBR’s fiscal sustainability
report, with public service spending calculated as a residual. The Welsh Government
DEL changes in line with overall public service spending during the entire period.
Further spending cuts in 2015−16 and 2016−17 are allocated entirely to public service
spending. In 2017−18 and beyond, social benefits rise in line with the OBR’s fiscal
sustainability report, with public service spending calculated as a residual. The Welsh
Government DEL changes in line with overall public service spending during the entire
period.
Together, this gives four scenarios, with the least favourable scenario being that which combines
the real freeze post 2016−17 with the allocation of cuts to public service spending only prior to
that (and the most favourable settlement being the one that combines overall spending growth
post 2016−17 and welfare cuts prior to that). In doing this it should be noted that these
scenarios are indicative only and do not put upper or lower bounds on the amount Wales
might receive. Because we are unable to project the allocation across public service
departments (e.g. Department of Health, Department for Work and Pensions), we are unable to
simulate the workings of the Barnett formula, which tends to mean Wales gets smaller
percentage rises in spending than England (and likewise smaller cuts when spending is being
reduced). This is another reason to see the results as indicative only.

© Institute for Fiscal Studies, 2012
45
Table 4.2 shows the budgets for the devolved Welsh Government under each of the four
scenarios. Four years are shown: 2010−11, 2014−15 (both unaffected by the scenarios), 2016−17
and 2021-22. Information on the calculations underlying these figures can be found in Appendix
B.
Table 4.2. Some scenarios for Welsh Government DEL (capital and current)
2010–11 to 2020–21, £s million, in 2012–13 prices
Scenario
2010−11
2014−15
2016−17
2020−21
% change per annum 2014−15
to 2016−17
% change per annum 2016−17
to 2020−21
Economy in-line with
OBR post 2016−17
Welfare spending cut 15,887 13,945 13,132 14,722 -3.0% 2.9%
Welfare spending not cut 15,887 13,945 12,833 14,393 -4.1% 2.9%
Economy performs
poorly
Welfare spending cut 15,887 13,945 13,132 12,536 -3.0% -1.2%
Welfare spending not cut 15,887 13,945 12,833 12,238 -4.1% -1.2%
Source: Public Expenditure Statistical Analysis Budget tables, OBR Economic and Fiscal Outlook, OBR Fiscal
Sustainability Report and authors’ calculations.
The first thing to notice is that the period between 2014−15 and 2016−17 is likely to involve
significant real reductions in the Welsh Government DEL, irrespective of whether further cuts are
made to the welfare budget. If welfare spending is cut by a further £10 billion per year by
2016−17, and the Welsh DEL is reduced in real terms at the same rate as public service spending
as a whole, the Welsh Government will see a reduction in its budget of, on average, 3.0% per year
in 2015−16 and 2016−17. Given that capital spending has already been cut so drastically, the UK
Government has pledged to protect it from further cuts,22 which would imply that the Welsh
Government’s current DEL would need to be reduced by 3.2% per year, on average. This is more
than one-and-a-half times as large as the average falls between 2010−11 and 2014−15 (2.0%).
Because Welsh Government grants to support local government current spending are financed
from the current DEL, we use this figure in the next section when examining the implications for
the budgets of Welsh unitary authorities.
If, on the other hand, no further cuts are made to the welfare budget, spending on public services
would need to fall by an average of 4.1% a year in real terms in 2015−16 and 2016−17. If the
Welsh Government’s DEL was reduced at the same rate, this would imply a reduction of spending
of around £1.1 billion in real terms between 2014−15 and 2016−17, around £0.3 billion more
than if welfare expenditure were further reduced (both in 2012−13 prices). Again, protection for
capital budgets implies an even larger reduction in the current DEL of 4.4% a year, on average,
which is more than twice as much as the average annual reduction between 2010−11 and
2014−15.
The picture after 2016−17 depends crucially upon the overall resources available to the UK
Government. If overall public spending grows in line with the long-run forecast for growth in
22
Here, we interpret that to mean there will be no further real-terms reductions in capital expenditure as opposed to no
further reductions as a proportion of GDP.

© Institute for Fiscal Studies, 2012
46
potential GDP (2.4% growth per year in real terms), the forecasts for welfare spending and debt
interest imply that spending on public services would be able to increase by 2.9% per year in real
terms, on average. If Welsh Government DEL followed this path, this would mean the Welsh
Government having more to spend in 2020−21 in real terms than in 2014−15 (£13.9 billion),
whether benefits share some of the pain between 2014−15 and 2016−17 (in which case the
2020−21 budget is an estimated £14.7 billion) or not (in which case the 2020−21 budget is an
estimated £14.4 billion). The same is true for Welsh Government current DEL under these
scenarios: £13.6 billion or £13.3 billion, respectively, compared to £12.9 billion in 2014−15. But
both total and current Welsh Government DEL would remain below the real-terms 2010−11 level
of £15.9 and £14.0 billion. This shows that even with relatively robust growth in budgets after
2016−17, the resources available to the Welsh Government will be less than they were prior to
the fiscal retrenchment.
If, on the other hand, total government spending is held constant in real terms between 2016−17
and 2020−21 (for instance, if the economy continues to perform poorly and the Government’s
revised target of eliminating the structural deficit by 2016−17 is not met), the picture looks much
bleaker. Anticipated growth in interest payments and welfare expenditure during this period
would require spending on public services to be cut by 1.2% in real terms per year, on average.
Under this scenario Welsh Government DEL in 2021−21 could be 23% below its 2010−11 level
and 12% below its 2014−15 level, in real terms, if welfare spending is protected from further
cuts between 2014−15 and 2016−17. This shows that if further austerity is required beyond
2016−17, the Welsh Government is likely to face a very tough budget settlement that will have
major ramifications for Welsh unitary authorities.
4.3 Scenarios for Welsh local government spending to
2020
We now examine what these scenarios for Welsh Government DEL may mean for Welsh local
government given two possible allocations of Welsh Government resources (there are, of course,
many other possibilities). Again, it is important to note that these scenarios are indicative only
and the Welsh Government may decide to allocate resources differently across departments. The
two scenarios we examine are:
(1) the Welsh Government allocates the cuts proportionally across services; or
(2) the Welsh Government protects the NHS from any further cuts post 2014−15 and allocates
cuts proportionally across other services.
Table 4.3 shows how UA’s spending power may change between 2014−15, 2016−17 and
2020−21, given the scenarios for Welsh Government current DEL if the cuts are allocated
proportionally across all services (scenario (1)). Note that, together with the assumptions in
Section 4.2, this implies that grants to Welsh UAs change at the same rate as overall current
public service spending for the UK as a whole. We maintain the assumption that real council tax
revenues increase in line with the projected growth in the number of households in Wales.
The first thing to note is that irrespective of whether the UK Government further reduces welfare
expenditure, under our assumptions, Welsh UAs would see substantially larger year-on-year
reductions in their spending power in 2015−16 and 2016−17 than are planned for the period
2013−14 and 2014−15 (see Table 3.1). The reduction in spending power would also exceed those
made between 2009−10 and 2012−13, which have averaged 2.0% per year for UAs (2.2% per
year for local government as a whole). However, whether the UK Government makes further cuts
to the welfare budget does make a significant difference to the size of the cuts required of current

© Institute for Fiscal Studies, 2012
47
public service expenditure, and hence, potentially, the cuts to the UAs’ spending power. With £10
billion of further cuts to welfare spending, under our assumptions, the cuts would amount to
2.3% per year versus 3.3% per year if no further cuts were made to welfare. These reductions are
somewhat smaller than the projected cuts in Welsh Government current DEL (3.2% and 4.4%,
respectively), because our assumption is that there will be modest growth in real-terms council
tax receipts (driven by growth in the number of households).
What happens after 2016−17 will depend crucially on whether further austerity is required
beyond that already planned by the UK Government (e.g. if the economy continues to perform
poorly). If the economy performs in-line with the OBR’s long-run forecast, under our
assumptions, the spending power of Welsh UAs would increase by 2.5% per year, on average,
between 2016−17 and 2020−21. This is somewhat slower than the growth in the Welsh
Government’s current DEL under our assumptions, reflecting the fact that council tax revenues
are projected to increase only slowly. If UAs’ spending power followed this trend, it would exceed
its current (2012−13) level by 2020−21, whether or not further cuts to welfare are made
between 2014−15 and 2016−17.
If, on the other hand, the economy performs poorly, necessitating public spending to be held
constant between 2016−17 and 2020−21, spending power could come under further pressure.
Under this scenario, Welsh UAs would see their spending power reduced by 0.7% per year
between 2016−17 and 2020−21, with small increases in council tax revenues only partially
offsetting declining grants from the Welsh Government. This means under the scenarios we
investigate, spending power in 2020−21 would be between 9% and 11% below its 2012−13
level.
Table 4.3. Some scenarios for Welsh local government spending power, 2012–
13 to 2020–21, in 2012–13 prices (constant share of Welsh current DEL), £
millions
Scenario
2012−13
2014−15
2016−17
2020−21
% change per annum 2014−15
to 2016−17
% change per annum 2016−17
to 2020−21
Economy in-line with
OBR
Welfare spending cut 6,138 6,001 5,722 6,321 -2.3% 2.5%
Welfare spending not cut 6,138 6,001 5,611 6,199 -3.3% 2.5%
Economy performs
poorly
Welfare spending cut 6,138 6,001 5,722 5,566 -2.3% -0.7%
Welfare spending not cut 6,138 6,001 5,611 5,455 -3.3% -0.7%
Source: Specific grants and council tax in 2010−11 to 2012−13 from StatsWales, and general grant is from Local
Government financial settlement 2012. Projections based on Public Expenditure Statistical Analysis Budget tables, OBR
Economic and Fiscal Outlook, OBR Fiscal Sustainability Report, Welsh Government Budget 2012 and authors’
assumptions and calculations.
Table 4.4 shows how the scenarios for UAs’ overall spending power translate into spending per
person. Projected growth in the Welsh population between 2014−15 and 2020−21 means that
the change in the UAs’ spending power per person is around 0.6 percentage points lower per
year than the change in their aggregate spending power. The key point to take from this table is
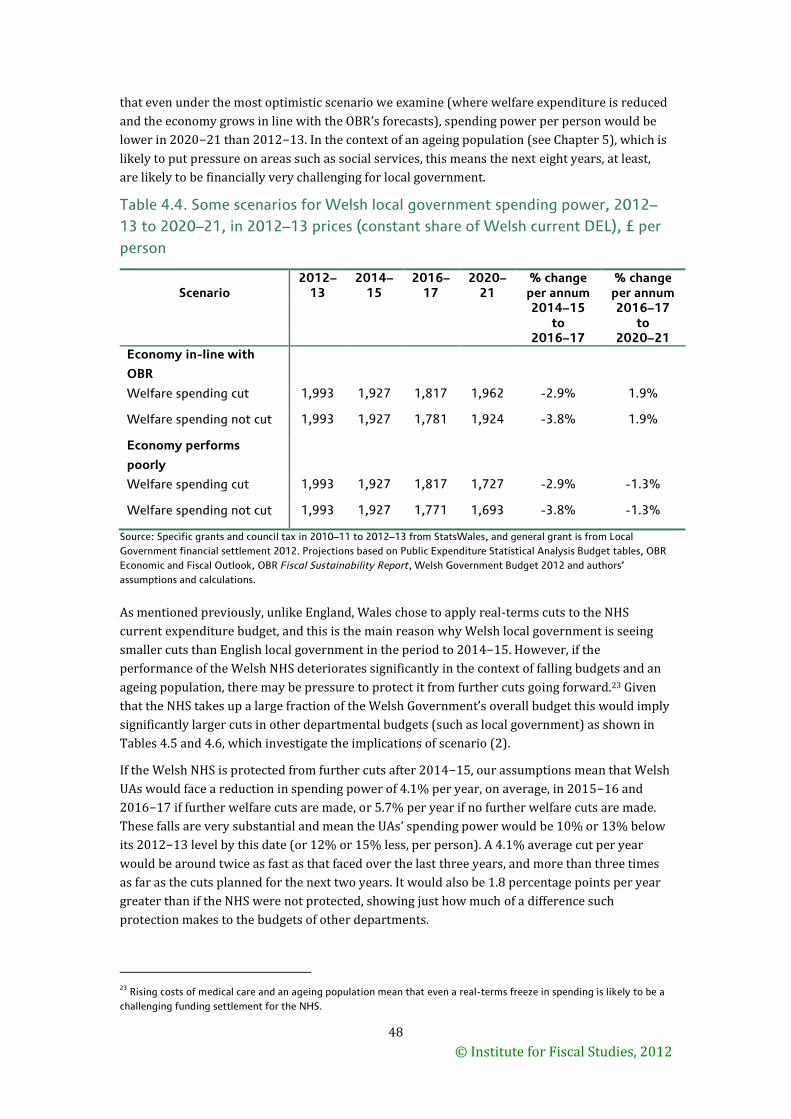
© Institute for Fiscal Studies, 2012
48
that even under the most optimistic scenario we examine (where welfare expenditure is reduced
and the economy grows in line with the OBR’s forecasts), spending power per person would be
lower in 2020−21 than 2012−13. In the context of an ageing population (see Chapter 5), which is
likely to put pressure on areas such as social services, this means the next eight years, at least,
are likely to be financially very challenging for local government.
Table 4.4. Some scenarios for Welsh local government spending power, 2012–
13 to 2020–21, in 2012–13 prices (constant share of Welsh current DEL), £ per
person
Scenario
2012−13
2014−15
2016−17
2020−21
% change per annum 2014−15
to 2016−17
% change per annum 2016−17
to 2020−21
Economy in-line with
OBR
Welfare spending cut 1,993 1,927 1,817 1,962 -2.9% 1.9%
Welfare spending not cut 1,993 1,927 1,781 1,924 -3.8% 1.9%
Economy performs
poorly
Welfare spending cut 1,993 1,927 1,817 1,727 -2.9% -1.3%
Welfare spending not cut 1,993 1,927 1,771 1,693 -3.8% -1.3%
Source: Specific grants and council tax in 2010−11 to 2012−13 from StatsWales, and general grant is from Local
Government financial settlement 2012. Projections based on Public Expenditure Statistical Analysis Budget tables, OBR
Economic and Fiscal Outlook, OBR Fiscal Sustainability Report, Welsh Government Budget 2012 and authors’
assumptions and calculations.
As mentioned previously, unlike England, Wales chose to apply real-terms cuts to the NHS
current expenditure budget, and this is the main reason why Welsh local government is seeing
smaller cuts than English local government in the period to 2014−15. However, if the
performance of the Welsh NHS deteriorates significantly in the context of falling budgets and an
ageing population, there may be pressure to protect it from further cuts going forward.23 Given
that the NHS takes up a large fraction of the Welsh Government’s overall budget this would imply
significantly larger cuts in other departmental budgets (such as local government) as shown in
Tables 4.5 and 4.6, which investigate the implications of scenario (2).
If the Welsh NHS is protected from further cuts after 2014−15, our assumptions mean that Welsh
UAs would face a reduction in spending power of 4.1% per year, on average, in 2015−16 and
2016−17 if further welfare cuts are made, or 5.7% per year if no further welfare cuts are made.
These falls are very substantial and mean the UAs’ spending power would be 10% or 13% below
its 2012−13 level by this date (or 12% or 15% less, per person). A 4.1% average cut per year
would be around twice as fast as that faced over the last three years, and more than three times
as far as the cuts planned for the next two years. It would also be 1.8 percentage points per year
greater than if the NHS were not protected, showing just how much of a difference such
protection makes to the budgets of other departments.
23
Rising costs of medical care and an ageing population mean that even a real-terms freeze in spending is likely to be a
challenging funding settlement for the NHS.

© Institute for Fiscal Studies, 2012
49
Table 4.5. Some scenarios for Welsh local government spending power, 2012–
13 to 2020–21, in 2012–13 prices (Welsh NHS protected post 2014–15), £
millions
Scenario
2012−13
2014−15
2016−17
2020−21
% change per annum 2014−15
to 2016−17
% change per annum 2016−17
to 2020−21
Economy in-line with
OBR
Welfare spending cut 6,138 6,001 5,515 6,088 -4.1% 2.5%
Welfare spending not cut 6,138 6,001 5,327 5,881 -5.7% 2.5%
Economy performs
poorly
Welfare spending cut 6,138 6,001 5,515 5,218 -4.1% -1.4%
Welfare spending not cut 6,138 6,001 5,327 5,031 -5.7% -1.4%
Source: Specific grants and council tax in 2010−11 to 2012−13 from StatsWales, and general grant is from Local
Government financial settlement 2012. Projections based on Public Expenditure Statistical Analysis Budget tables, OBR
Economic and Fiscal Outlook, OBR Fiscal Sustainability Report, Welsh Government Budget 2012 and authors’
assumptions and calculations.
Table 4.6. Some scenarios for Welsh local government spending power, 2012–
13 to 2020–21, in 2012–13 prices (Welsh NHS protected post 2014–15), £ per
person
Scenario
2012−13
2014−15
2016−17
2020−21
% change per annum 2014−15
to 2016−17
% change per annum 2016−17
to 2020−21
Economy in-line with
OBR
Welfare spending cut 1,990 1,925 1,749 1,887 -4.7% 1.9%
Welfare spending not cut 1,990 1,925 1,690 1,823 -6.3% 1.9%
Economy performs
poorly
Welfare spending cut 1,990 1,925 1,749 1,618 -4.7% -1.9%
Welfare spending not cut 1,990 1,925 1,690 1,559 -6.3% -2.0%
Source: Specific grants and council tax in 2010−11 to 2012−13 from StatsWales, and general grant is from Local
Government financial settlement 2012. Projections based on Public Expenditure Statistical Analysis Budget tables, OBR
Economic and Fiscal Outlook, OBR Fiscal Sustainability Report, Welsh Government Budget 2012 and authors’
assumptions and calculations.
Protection of the NHS budget would mean that even with public spending growing in line with
the OBR’s long-run economic forecast after 2016−17, Welsh UAs’ spending power in 2020−21
would be below its 2012−13 level. For instance, even under the most optimistic scenario we
investigate (where welfare expenditure is reduced), spending power would be around 1% below
its 2012−13 level (around 5% per person). If the economy performs poorly and total public
spending is held constant in real terms between 2016−17 and 2020−21, protection of the Welsh

© Institute for Fiscal Studies, 2012
50
NHS budget from the necessary cuts to current public service spending would imply deeper cuts
to other budgets such as local government. Under our assumptions, Welsh UAs would face
reductions in their spending power of 1.4% per year (or 1.9% per person per year), roughly
double the 0.7% reductions if the Welsh NHS were not protected. Under the most ‘pessimistic’
(but plausible) scenario where no further welfare cuts are found, public spending is frozen in real
terms between 2016−17 and 2020−21 and the Welsh NHS is protected from cuts, the spending
power of Welsh UAs in 2020−21 would be around 18% below its 2012−13 level. This equates to a
reduction of 22% per person over eight years, and means that the 7.5% reduction in spending
power per person that UAs have faced between 2009−10 and 2012−13 would represent only
one-quarter of the overall reduction faced by 2020−21.
Summary and discussion
Three clear messages emerge from this analysis. First, is the fact that even if the economy grows
reasonably robustly, further welfare savings can be found, and grants to local government
changes in line with overall current public service spending (our most optimistic scenario),
Welsh UAs are likely to face a difficult financial situation until at least 2020−21. Second, is the
overriding importance of how the economy, public finances and overall public spending evolve in
the coming years. If further spending cuts are required after 2016−17, which is plausible given
the ongoing weakness in the economy and public finances, Welsh UAs are likely to share in that
pain. Third, is the impact of decisions to protect other budgets from further cuts. If, for instance,
the welfare and/or NHS budgets are protected, Welsh local government may face significantly
larger cuts. The UK and Welsh Governments therefore face clear and difficult trade-offs when
deciding whether to protect such budgets.
Finally, it is worthwhile briefly discussing what the reductions on the scale of our most
pessimistic (but still plausible) scenario may mean for UAs’ spending on different public services.
The cuts that UAs have made so far have differed by service with planning and development,
housing and regulation and safety facing much larger cuts than areas such as social services,
environmental and refuse services and education. What if these latter areas continue to be
protected? Because spending on these services makes up nearly 80% of all spending by UAs, it
would not be possible to protect these areas from any further real-terms cuts: delivering a
reduction in overall net current service expenditure of 18% would require cutting net spending
on other services by 87%. Indeed, even limiting the real-terms cuts in spending on social
services, environmental and refuse services and education to half the average cut (9%) would
imply cuts of 52% for the non-protected services. This illustrates that if Welsh UAs do see such
large reductions in their grants, very difficult choices must be faced. This may involve making
significant cuts to service areas so far relatively insulated from cuts, local authorities stopping
providing large swathes of services that they traditionally have and attempts to generate
substantially more revenue whether from council tax or increased fees and charges.24
24
The Local Government Association has recently published a report (LGA, 2012) suggesting that local government in
England faces very similar challenges.

© Institute for Fiscal Studies, 2012
51
5. The broader context: welfare and
demography
Summary
As well as reducing spending on public services, the UK Government is increasing taxes and
cutting benefits and tax credits. These act to reduce the net incomes of households in
Wales, although the average reduction by 2014−15 (2.8% of net income) is smaller than for
the UK as a whole (3.0%). The largest average reductions are for households in the poorest
fifth of the population (5.2% in Wales) and those households with dependent children
(4.3% in Wales). This reflects the fact that such households are typically more reliant on
benefits and tax credits than others. Groups impacted most by the benefit and tax credit
cuts may be more vulnerable to cuts by local government or may come to rely more on local
government services (e.g. housing or social services). The introduction of Universal Credit
will act to offset the reduction in benefits and tax credits from 2014, especially for the
poorest fifth of the population.
The ageing population means that the UK (and by extension, the Welsh and local)
Government will continue to face a difficult fiscal situation for decades to come. The OBR’s
Fiscal Sustainability Report’s central estimate is that demographic change could increase
spending by 5.2% of national income by 2060−61, largely driven by additional spending on
health and pensions. If extra taxes cannot be raised, this may mean a significant further
squeeze on other areas of spending such as local government. The central estimates are
based on rather optimistic assumptions about how quickly productivity will grow in the
NHS, however, and if productivity were instead to grow at the average rate since 1979,
spending on the NHS would need to rise by a further 7.5% of national income, which would
require major tax rises or reductions in other spending.
The scale of demographic change varies considerably across Wales. Although the number of
individuals aged 65 and over in Cardiff is projected to increase by 49% by 2033, the number
per 1,000 working age residents is expected to increase only modestly (from 191 to 221).
However, areas of Wales that are already relatively old are set to see further rapid aging:
the number aged 65 and over per 1,000 working age residents is expected to increase from
414 to 723 in Powys, from 439 to 660 in Conwy and from 370 to 655 in Monmouthshire.
National and local government will need to plan for such varied changes in demographics
(and fo r the considerable uncertainty around these estimates).
The previous two chapters analysed the spending decisions made by local government to date,
and the prospects for the funding available to local government up to 2020. In this chapter we
look at the broader policy context and discuss two issues that may impact upon local government
finances: the ongoing cuts to benefits and tax credits; and the long-term issue of demographic
change.
5.1 The impact of tax and benefit changes on household
incomes in Wales
Net increases in taxes are planned to contribute around 25% of the overall fiscal consolidation
planned by 2014−15 (which is around three-quarters of the full consolidation planned by
2016−17), with net reductions in the generosity of benefits and tax credits providing a further

© Institute for Fiscal Studies, 2012
52
15%.25 This increased takeaway from and giveaway to household budgets may mean significant
reductions in disposable income for many households. This section details the scale and
distributional impact of the tax and benefit changes in Wales and shows that poorer households
and households with children will be hit harder than other parts of the population.
Tax and benefit changes up to 2012–13
A number of changes have already come in to effect by the current tax year, including a majority
of the tax increases, and a number of cuts to benefits and tax credits particularly affecting
families with children.
The main rate of VAT increased from 17.5% to 20.0% in January 2011, and employer, employee
and self-employed National Insurance (NI) rates increased by 1 percentage point (to 14.8%,
12.0% and 9.0%, respectively), although there were also increases in the point at which
employees and employers start paying NI, which means that some lower paid workers would
have seen their NI bill cut. Together these tax rises are predicted to raise £4.2 billion in 2012−13
across the UK as a whole. In terms of income tax, the personal allowance was increased in both
April 2011 and April 2012 by more than indexation, costing £4.8 billion, including the impact of
some reductions in the higher rate threshold to limit the gains to higher rate taxpayers. Further
reductions in the higher rate tax threshold are set to raise £0.9 billion. There have also been
increases in alcohol and tobacco duty.
In terms of benefits, the main reforms to have taken place so far include: a reduction in the
generosity of many benefits through the switch to CPI-uprating (CPI inflation is generally lower
than RPI inflation);26 reductions in the generosity of child benefit, and the child, childcare and
working tax credits for many families (although there have been increases in the generosity of
the child tax credit for the poorest families with full entitlement); and reductions in the
generosity of local housing allowance, which helps low income private sector tenants pay their
rent.
Figure 5.1 shows the distributional impact of the tax and benefit changes to date for Wales and
for the UK as a whole for five groups of households from richest to poorest.
25
By 2016−17, net tax rises are set to account for 17% of the overall fiscal consolidation if no further tax rises are
announced. If the UK Government makes a further £10 billion of cuts in 2015−16 and 2016−17, net cuts to benefits/tax
credits expenditure will account for 14% of the overall fiscal consolidation. 26
This change also applies to public service pensions and certain tax thresholds.

© Institute for Fiscal Studies, 2012
53
Figure 5.1. Impact of tax and benefit reforms introduced by current government up to
April 2012, by income quintile group
Source: Author’s calculations using TAXBEN, the IFS tax and benefit microsimulation model, run on uprated 2009–10
Family Resources Survey data.
Overall, the tax and benefit reforms implemented since June 2010 are estimated to reduce
household incomes by around 2.1% in Wales slightly less than the 2.4% reduction for the UK as a
whole. Due to their lower incomes, Welsh households benefit, on average, from the reforms to
income tax and NI during this period (by around £2 per week), while across the UK as a whole
there are small losses, on average (around 36p per week). Welsh households lose slightly more
from the benefits changes during this period (£8.10 per week versus £7.40), partly reflecting
their greater reliance on disability benefits. The increases in indirect taxes (largely VAT) cost
Welsh households £5.17 per week versus £6.67 a week in the UK as a whole, reflecting lower
household expenditure.
Losses are largest towards the bottom of the income distribution: 3.7% for Welsh households
among the poorest fifth of the population (3.3% UK), and 3.4% for the next poorest fifth (3.0%
UK); versus 0.9% and 1.8% for the second richest and richest fifth, respectively (1.7% and 2.5%
UK). Large losses for poorer households are explained by the fact that they are heavily reliant on
benefits and tax credits for their income, and therefore have lost a larger fraction of their income
as benefits and tax credits have been cut. The increase in VAT has taken up a relatively large
fraction of their income, and such households often contain no income tax payers and therefore
have not benefited from the increase in the personal allowance (conversely, they are unlikely to
have been hit by the increase in NI either). That losses are proportionally larger for the 5th
quintile group than the 4th quintile group is likely to reflect the reductions in the higher rate tax
threshold, increases in NI rates and changes in tax relief on pensions that particularly affect
households towards the top of the income distribution.
Figure 5.2 shows the impact by type of household and shows that pensioner households have
been hit much less hard, on average, than households with children: tax and benefit changes have
reduced the incomes of households with children in Wales by around 3.3% (3.5% in the UK as a
whole) versus around 0.9% for pensioners in Wales. This reflect the fact that many of the benefit
-6%
-5%
-4%
-3%
-2%
-1%
0%
Poorest 2 3 4 Richest All
Inco
me
gain
(%
)
Whole-population income quintile group
Wales UK

© Institute for Fiscal Studies, 2012
54
cuts to date have affected benefits claimed exclusively or overwhelmingly by households with
children (e.g. child benefit and tax credits), while pensioners have been protected from the
benefit cuts (for instance the switch to CPI uprating does not affect the state pension).
Figure 5.2. Impact of tax and benefit reforms introduced by current government up to
April 2012, by household type
Source: Author’s calculations using TAXBEN, the IFS tax and benefit microsimulation model, run on uprated 2009–10
Family Resources Survey data.
Tax and benefit changes up to 2014–15 (without Universal Credit)
Further changes to the tax and benefit system are planned in 2013−14 and 2014−15 which will,
on average, further reduce net incomes.
On the tax side, there will be a further increase in the income tax personal allowance in April
2013 benefiting basic-rate taxpayers, although this will be mostly offset for higher-rate taxpayers
by a reduction in the higher-rate threshold. The biggest change is a reduction in the additional
rate of income tax (payable on incomes over £150,000) from 50% to 45% in April 2013, although
we do not model that here (the data used in our simulations does not capture the very top of the
income distribution well).
From October 2013, Universal Credit will begin to replace a number of means-tested benefits for
working-age people. However, the roll-out is not expected to be complete until the end of 2017,
and many existing claimants will still be receiving the existing set of benefits and tax credits in
2014−15. However, other changes are planned between now and 2014−15 including: ongoing
reductions in generosity due to the shift to CPI uprating; further reductions in the generosity of
housing benefit; withdrawal of child benefit from families with someone with an income of over
£50,000; a tightening of the eligibility criteria for disability benefits; and a £500 per week cap on
benefits for out-of-work working-age families.
Figure 5.3 shows the distributional impact of the tax and benefit changes due by 2014−15
(excluding the introduction of Universal Credit) for Wales and for the UK as a whole for five
groups of households from richest to poorest. Figure 5.4 shows the impact by type of household.
-6%
-5%
-4%
-3%
-2%
-1%
0%
Households with children
Pensioner households
Working-age households
without chidlren
All
Inco
me
ga
in (
%)
Wales UK

© Institute for Fiscal Studies, 2012
55
Figure 5.3. Impact of tax and benefit reforms introduced or planned by current
government up to April 2014, by income quintile group (ignoring Universal Credit)
Source: Author’s calculations using TAXBEN, the IFS tax and benefit microsimulation model, run on uprated 2009–10
Family Resources Survey data.
Figure 5.4. Impact of tax and benefit reforms introduced or planned by current
government up to April 2014, by household type (ignoring Universal Credit)
Source: Author’s calculations using TAXBEN, the IFS tax and benefit microsimulation model, run on uprated 2009–10
Family Resources Survey data.
By 2014, losses due to tax and benefit reform will have increased to around 2.8% of net income
in Wales and 3.0% of net income for the UK as a whole. This reflects gains from changes to direct
taxes that increase household incomes in Wales by £3.24 a week (£0.60 per week for the UK as a
-6%
-5%
-4%
-3%
-2%
-1%
0%
Poorest 2 3 4 Richest All
Inco
me
gain
(%
)
Whole-population income quintile group
Wales UK
-6%
-5%
-4%
-3%
-2%
-1%
0%
Households with children
Pensioner households
Working-age households
without chidlren
All
Inco
me
ga
in (
%)
Wales UK

© Institute for Fiscal Studies, 2012
56
whole), cuts to benefits and tax credits amount to an average £12.39 a week (£11.57 for the UK as
a whole), and increases in indirect taxes that cost Welsh households £5.93 a week (£7.41 for the
UK as a whole). This means while the benefit cuts hit Wales slightly harder – due to its higher
levels of welfare dependency – the tax changes hit Wales slightly less hard than the UK as a whole.
As with the changes, to date, poorer households and households with children look set to see the
biggest percentage falls in their income as a result of the tax and benefit changes. Welsh
households among the poorest fifth of the population are set to see tax and benefit reforms up to
2014−15 reduce their income reduced by 5.2% on average (4.7% for the UK as a whole) relative
to the 2010 tax and benefit system, with the next poorest fifth being 4.6% worse off as a result of
reforms (4.1% for the UK as a whole). Households in the 4th quintile group will lose the least,
proportionally (1.4% in Wales, 2.1% in the UK as a whole).
Interestingly, unlike for the UK as a whole, pensioner households in Wales look set to lose a
slightly larger fraction of their income than working-age households without children, although it
must be noted that among those in receipt of benefits and tax credits, the losses are considerably
higher for working-age households without children (relatively few of whom are in receipt of
benefits and tax credits).
Tax and benefit changes up to 2014–15 (with Universal Credit)
Universal Credit is designed to increase work incentives for those currently facing the weakest
incentive to enter work or progress in work and does this by increasing income disregards,
reducing the rate at which benefits are withdrawn as income increases, by increasing the
stringency of work conditions and simplifying the claims process. One feature of Universal Credit
is increased entitlements for many households with small levels of employment income, which
acts to offset a large part of the reductions in the average incomes of households in the poorest
fifth (and to a lesser extent the 2nd quintile group) resulting from the earlier reforms.
Figure 5.5 shows the impact of reforms up to 2014−15, assuming Universal Credit was fully in
place by then across the income distribution.27 This will reduce the average loss to Welsh
households to 2.3% of net income (reflecting the increased generosity of Universal Credit to
those with small amounts of earned income).
With Universal Credit fully in place, reforms to the tax and benefit system since 2010 are set to
result in a 2.0% reduction in income, on average, for Welsh households in the poorest fifth of the
population (this compares with 5.2% without Universal Credit). Those in the next poorest
quintile group see a reduction in the size of their losses from tax and benefit reforms after
accounting for Universal Credit: 3.7% versus 4.6% without Universal Credit. Interestingly,
however, Universal Credit makes a much smaller difference to the incomes of households in the
second quintile that live in Wales (0.9% increase) than in the UK as a whole (1.6%). It is again
noteworthy that pensioner households in Wales look to be hit harder by the changes to the
benefit and tax credit system than working-age adults, in contrast to the UK as a whole (Figure
5.6).
27
Universal Credit will be fully in place by the end of 2017. The purpose of modelling it as if it were fully in place in
2014 is to show how Universal Credit will affect the distributional impact of reforms once it is fully in place.

© Institute for Fiscal Studies, 2012
57
Figure 5.5. Impact of tax and benefit reforms introduced or planned by current
government up to April 2014, by income quintile group (Universal Credit fully in place)
Source: Author’s calculations using TAXBEN, the IFS tax and benefit microsimulation model, run on uprated 2009–10
Family Resources Survey data.
Figure 5.6. Impact of tax and benefit reforms introduced or planned by current
government up to April 2014, by household type (Universal Credit fully in place)
Source: Author’s calculations using TAXBEN, the IFS tax and benefit microsimulation model, run on uprated 2009–10
Family Resources Survey data.
-6%
-5%
-4%
-3%
-2%
-1%
0%
Poorest 2 3 4 Richest All
Inco
me
gain
(%
)
Whole-population income quintile group
Wales UK
-6%
-5%
-4%
-3%
-2%
-1%
0%
Households with children
Pensioner households
Working-age households
without chidlren
All
Inco
me
ga
in (
%)
Wales UK

© Institute for Fiscal Studies, 2012
58
Summary
Changes to the tax and benefit system are set to reduce the disposable incomes of households
substantially in the next few years. However, not all types of households will be hit equally hard:
those with children, and at least until Universal Credit is substantially rolled-out, those towards
the bottom of the income distribution, see their incomes fall by a larger percentage as a result of
reforms than other types of households. These are groups that are already more likely to rely on
local government services (e.g. schools and social services), and reductions in income may
increase the importance of such services to them. Local authorities might also want to consider
the differential reductions in household incomes when determining which services to cut back
and which services to increase charges for. However, when considering spending and policy
decisions, it is important that local government recognises that these aggregate distributional
analyses can provide only a limited amount of information. Some households will lose much
more than average (e.g. those with especially high housing costs who lose housing benefit, or
those who are deemed to be no longer entitled to disability benefits) while others will gain. And
the reforms also entail substantial changes in conditionality and claims processes that are
designed to encourage work. IFS researchers are currently undertaking a research project for the
Welsh Government, which will estimate the impact of welfare reforms on the labour market
participation rate and hours of work of people in Wales. A fuller understanding of the potential
effects of welfare reform on local government needs a detailed assessment of all these factors,
along with an analysis of the determinants of the demands for local authority services that is
beyond the scope of this report.
5.2 Demography: the changing population and spending
pressures
The government’s fiscal consolidation plan would be sufficient, at least on current forecasts, to
return borrowing back to sustainable levels by the end of the forecast horizon, currently
2016−17. The cyclically adjusted current budget (government revenues less non-investment
spending, adjusted for the ups and downs of the economic cycle) is forecast to be 0.5% of
national income in surplus in 2016−17, thereby satisfying the Chancellor’s fiscal mandate that it
would be balanced or in surplus by the end of the forecast horizon.
However, unfortunately, the difficult choices facing the UK (and, by extension, the Welsh and
local) Government do not stop there. Increasing longevity, and the relatively large cohorts of the
late 1940s, 1950s and 1960s, means that the coming decades will see a significant increase in the
fraction of the population aged 65 or over, and a decline in the fraction of working-age adults and
children. The proportion of the population aged over 65 is forecast to increase from 17.2% to
25.7% by 2061, with the proportion aged over 85 forecast to increase from 2.4% to 7.1%.28 This
change in the age structure of the population will put greater pressure on the public finances.
This section discusses the magnitude of these spending pressures and examines how
demographic change is projected to differentially impact different parts of Wales.
The impact of demographic change on the UK public finances
An ageing population will tend to increase government spending on areas that are exclusively or
disproportionately benefit older people, for example state provided pensions, healthcare and
social care. The OBR in its recent Fiscal Sustainability Report estimated that spending on these
28
National Office for Statistics 2010-based population projections available at:
http://www.ons.gov.uk/ons/publications/re-reference-tables.html?edition=tcm%3A77-229866
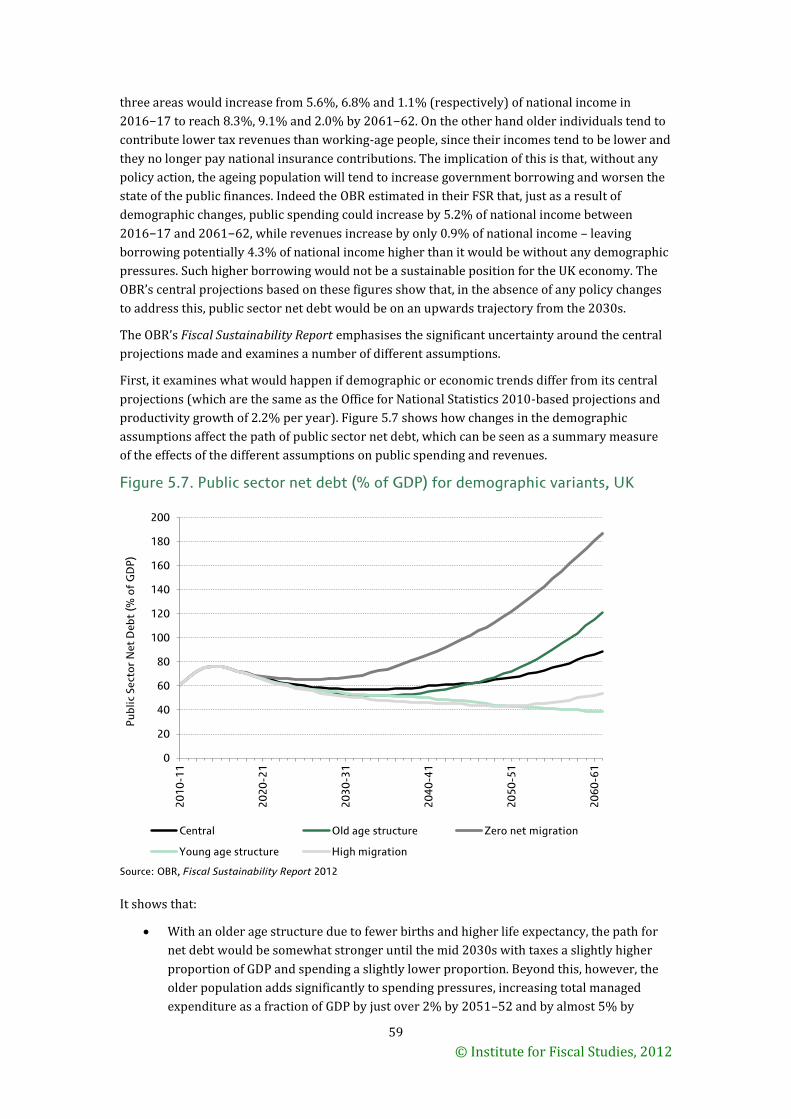
© Institute for Fiscal Studies, 2012
59
three areas would increase from 5.6%, 6.8% and 1.1% (respectively) of national income in
2016−17 to reach 8.3%, 9.1% and 2.0% by 2061−62. On the other hand older individuals tend to
contribute lower tax revenues than working-age people, since their incomes tend to be lower and
they no longer pay national insurance contributions. The implication of this is that, without any
policy action, the ageing population will tend to increase government borrowing and worsen the
state of the public finances. Indeed the OBR estimated in their FSR that, just as a result of
demographic changes, public spending could increase by 5.2% of national income between
2016−17 and 2061−62, while revenues increase by only 0.9% of national income – leaving
borrowing potentially 4.3% of national income higher than it would be without any demographic
pressures. Such higher borrowing would not be a sustainable position for the UK economy. The
OBR’s central projections based on these figures show that, in the absence of any policy changes
to address this, public sector net debt would be on an upwards trajectory from the 2030s.
The OBR’s Fiscal Sustainability Report emphasises the significant uncertainty around the central
projections made and examines a number of different assumptions.
First, it examines what would happen if demographic or economic trends differ from its central
projections (which are the same as the Office for National Statistics 2010-based projections and
productivity growth of 2.2% per year). Figure 5.7 shows how changes in the demographic
assumptions affect the path of public sector net debt, which can be seen as a summary measure
of the effects of the different assumptions on public spending and revenues.
Figure 5.7. Public sector net debt (% of GDP) for demographic variants, UK
Source: OBR, Fiscal Sustainability Report 2012
It shows that:
With an older age structure due to fewer births and higher life expectancy, the path for
net debt would be somewhat stronger until the mid 2030s with taxes a slightly higher
proportion of GDP and spending a slightly lower proportion. Beyond this, however, the
older population adds significantly to spending pressures, increasing total managed
expenditure as a fraction of GDP by just over 2% by 2051–52 and by almost 5% by
0
20
40
60
80
100
120
140
160
180
200
20
10
-11
20
20
-21
20
30
-31
20
40
-41
20
50
-51
20
60
-61
Pu
bli
c S
ect
or
Ne
t D
eb
t (%
of
GD
P)
Central Old age structure Zero net migration
Young age structure High migration

© Institute for Fiscal Studies, 2012
60
2061–62 relative to the baseline scenario. This pushes public debt above 120% of
national income (GDP) by 2061–62 and would necessitate a much larger fiscal
tightening.
With a younger age structure driven by higher fertility, higher migration and lower life
expectancy, the path for net debt would be stronger from the 2030s onwards with total
managed expenditure as a fraction of GDP 3.4% lower than under the baseline
assumptions by 2051–52 and 5.5% lower by 2061–62. This reflects both lower demand
for spending on health, pensions and personal care (due to smaller fraction of old
people) and higher output due to a larger working-age population.
Zero net migration would lead to a significantly weaker picture for the public finances,
especially after 2030–31, with debt approaching 200% of GDP by 2061–62. This is
because migrants tend to be fairly young, and hence, without them, the population would
age much more rapidly, leading to relatively higher demands for age-related spending
(spending would be 1.2% of GDP higher than under the baseline assumptions by 2031–
32, rising to 5.6% by 2051–52 and 8.2% by 2061–62).
Conversely, higher net migration would improve the public finances as the younger
population held down the relative costs of ageing. This shows clearly that net migration
of younger working-age people in to the UK can help ameliorate the effects of an ageing
population quite substantially, although allowing large net inflows will result in a
significantly larger population, which may entail costs not accounted for in these
projections (e.g. a more urban county).
Productivity growth half a percentage point lower or higher is shown to result in spending being
2.6% higher or 2.0% lower as a proportion of GDP by 2061–62, showing that the rate at which
the economy grows over the long run will have a substantial effect on the size of fiscal
adjustment needed to cope with demographic change.
The OBR’s report then examines what would happen if productivity in the NHS did not keep pace
with in the rest of the economy (its central assumption), but either stalled or grew by a slower
0.8% per year (one estimate of the average growth in productivity since 1979). For instance, if
productivity were to grow by 0.8% versus 2.2% per year in the economy as a whole, in order to
increase the quantity of health services provided at the same rate as other output (2.2% per
year), real terms spending on health would need to increase by 3.6% per year: that is 2.2% plus
an additional 1.4% (2.2%–0.8%) to ensure wages in the health sector keep up with those in the
rest of the economy despite lagging productivity (if wages do not keep up then it would become
difficult to recruit doctors, nurses etc.). Of course, the quantity of health care required is expected
to grow by more than other output as the older population puts greater strain on the NHS. The
OBR forecasts that if healthcare productivity does grow by only 0.8% a year, an additional 7.5%
of GDP would need to be allocated to healthcare by 2061–62 in addition to the 2.3% additional
amount needed to cope with ageing under the central projections. In other words, if productivity
in providing public services does lag behind private sector productivity, a larger fraction of
income would need to be paid in taxes to support these services. And if this is politically difficult
to implement, either the path of public borrowing and debt becomes rapidly unsustainable or
swingeing cuts in other public spending must be made.
Finally, the OBRs report examines the prospects for revenues and finds evidence that certain
existing taxes such as North Sea taxes, corporation tax and fuel duties will come under pressure
in coming years, meaning additional revenue streams may need to be found. Without this, the
path of public debt would again look even worse in the long-run, or cuts to spending would be
necessary (difficult given the demands caused by ageing).

© Institute for Fiscal Studies, 2012
61
Taken together, these findings mean that the key messages from the OBR’s report are that:
Ageing will have a significant impact on the public finances in the coming decades, with a
need to increase spending on health, pensions and long-term social care of the elderly.
This may put pressure on other types of spending unless significant new revenues
(above and beyond the increases needed to fix the current poor state of the public
finances) are found.
The exact impact is highly uncertain and could be very major if the population ages more
quickly than expected (due to lower birth rates and/or higher life expectancy and/or
lower net immigration), or if productivity improvements in the NHS continue to lag
behind that of the economy more generally.
If additional revenues cannot be found to fund the necessary increase in the NHS and
state pensions, grants to local government may come under further significant pressure
well beyond 2020−21. This is at the same time as local authorities face rising demand for
social care services.
Demographic change in Wales
The demographic pressures facing the UK will be felt in Wales and by Welsh local government.
Wales is older and ageing at a similar rate to the rest of the UK: the fraction of the population
aged 65 or over is projected to increase from 19.3% in 2012 to 27.6% in 2061, while the fraction
of the population aged 85 or over is expected to increase from 2.5% to 7.6%.
Demographic change is not set to affect all parts of Wales equally, however. Table 5.1 shows the
number of adults aged 65+ and the number of children aged 15 or under per 1,000 ‘working-age
adults’ (aged 16–64) as projected for 2012 and 2033, the most distant date for which we have
local authority level projections, as well as the percentage change in the population of these
groups during that period. 29
The first thing to note is that different age groups are not equally represented across Wales in
2012. The ratio of children per 1,000 working-age adults ranges from 232 in Ceredigion to 325 in
Newport, with most UAs (13) having a ratio between 290 and 310. Cardiff also stands out as an
area with a low ratio (259) reflecting its large population of students and younger working-age
people. The ratio of over-65s to 1000 working-age adults varies even more dramatically, with
Cardiff recording the lowest figure of 191, and Conwy recording the highest of 439. A clear
pattern of higher ratios of over-65s to working-age adults in more rural counties, and lower
ratios in the major cities and urban areas of South and North East Wales can be seen.
The table also shows that some areas will be more affected by demographic change than others.
Most parts of Wales will see a small increase in the ratio of children to working-age adults (the
only exceptions being Pembrokeshire, Rhondda Cynon Taf and Caerphilly), as the number of
children increases, or at least falls less quickly than the number of working-age adults. This may
suggest a need to prioritise spending on children over spending on the shrinking number of
working-age adults. Dramatic projected increases in the number of children in Cardiff and, to a
lesser extent, Swansea, mean these districts need long-term plans to expand schools capacity and
the provision of other services for children.
29
The state pension age is set to increase to 66 in 2020, 67 between 2026 and 2028 and 68 between 2046 and 2048.
We use a fixed definition of the ‘working-age’ population here to show more clearly the pure effects of ageing over
time as opposed to changes in pension-age policy. Projections are 2008-based and are consistent with the local
authority population figures used in Chapter 2 of this report.

© Institute for Fiscal Studies, 2012
62
Across Wales as a whole though, the big story is the rise in the number of older people. However,
some areas will be affected more than others. Cardiff, for instance, is expected to see an increase
of 49% in the number of elderly people during this period, but sizable growth in the working-age
population too means an increase in the old-age dependency ratio of only 30 from 191 to 221.
Increases in the ratio of elderly people to working-age adults are much greater in the rest of
Wales. However, those UAs with the oldest populations already are, with some exceptions, set to
see the largest increases in this ratio: from 414 to 737 in Powys; 439 to 660 in Conwy; and 370 to
655 in Monmouthshire, for instance. On the other hand: Newport will see an increase from 275 to
382; Swansea from 294 to 365; and Rhondda Cynon Taff from 277 to 402. All local authorities
will have to plan for greater demands placed on services by elderly residents going forwards.
Most obvious are services such as residential and social care, but other services such as libraries
or recreational services may need to change to better reflect the needs of older people. But it is
clear that these pressures will affect some local authorities more than others. The Welsh
Government should also take this into account (along with variations in the change in child
population) when setting grant allocations to UAs in Wales.
Table 5.1. Child and old-age dependency ratios and population changes (%) for Welsh
UAs, 2012 and 2033
Unitary Authority Children (under 16) Elderly (65 or over) Overall % change in
population 2012 2033 % change in
population 2012 2033 % change in
population
Anglesey 301 329 0% 395 605 40% 4%
Gwynedd 275 292 3% 344 462 31% 5%
Conwy 294 304 -4% 439 660 39% 5%
Denbighshire 297 314 4% 378 593 54% 12%
Flintshire 294 307 -8% 299 514 51% 1%
Wrexham 295 303 4% 288 439 54% 11%
Powys 286 309 -2% 415 737 60% 9%
Ceredigion 232 246 2% 355 535 45% 8%
Pembrokeshire 307 307 -4% 387 595 48% 8%
Carmarthenshire 295 308 6% 360 540 53% 14%
Swansea 271 298 19% 294 365 35% 15%
Neath Port Talbot 287 304 2% 314 489 50% 8%
Bridgend 303 308 2% 303 470 55% 11%
Vale of Glamorgan 313 334 9% 313 473 54% 13%
Rhondda Cynon Taf 294 293 -4% 277 402 40% 4%
Merthyr Tydfil 315 346 3% 278 419 41% 4%
Caerphilly 308 307 -5% 278 439 49% 4%
Blaenau Gwent 292 319 2% 305 449 37% 3%
Torfaen 300 319 -7% 316 506 40% -2%
Monmouthshire 292 321 -3% 370 655 57% 5%
Newport 325 360 10% 275 382 38% 9%
Cardiff 259 293 46% 191 221 49% 34%
All (Wales)
Source: 2008-based population projections, available from StatsWales website
Summary
Projected demographic change over the coming decades means local government finances are
likely to face continuing long-run pressure. In particular, increasing demand for social care, and

© Institute for Fiscal Studies, 2012
63
especially long-term care by elderly people, will take place at the same time as central
government may be tempted to reduce grants to local government as it struggles to fund
additional spending on health and state pensions. Hence, without reforms to increase tax
revenues at either the central or local level, local authorities may need to seek alternative sources
of finance (e.g. increased user charges) or face further pressure to limit spending on services in
the decades after 2020. This means it will be important for the UK, Welsh and local governments
to work together to plan how they will address the spending pressures caused by the major
demographic changes just beginning,

© Institute for Fiscal Studies, 2012
64
6. Conclusion
This report has examined the cuts made by Welsh local government since 2009−10 and placed
these in the context of the wider economic and fiscal situation, and policy environment. Net
spending per person has been reduced by 8.4% in real terms, undoing over one-third of the
increase in spending that had taken place over the previous nine years, and back below its
2005−06 level. Not all services have been equally as hard hit, with spending on areas like
regulation and safety, planning and development and housing services being reduced by more
than 20%, whilst spending on social services and environmental and refuse services has been
reduced by less than 5%. This shows clearly that local government has been prioritising some
areas over others – perhaps in part due to room for manoeuvre being constrained by rising
demand and statutory obligations. This may also reflect the fact that the Welsh Government
informed local authorities that it expected them to protect, at least in relative terms, spending on
social services (along with education).
The most important lesson from the analysis is that the spending cuts look set to continue for at
least the next four years and, perhaps, even longer. Even under the most optimistic set of
assumptions outlined in this report, the unitary authorities’ (UAs) spending power per person
would be 9% lower in real terms in 2016−17 than in 2012−13; it would still be 1.6% lower in
real terms in 2020−21 even if government spending grew in line with the OBR’s long term
forecasts for economic growth after 2016−17. In the context of rising demand for key services
(such as social services), this means the financial situation for UAs looks challenging for at least
the next eight years.
However since the OBR’s March 2012 Budget forecast the economy has underperformed
expectations and borrowing in 2012–13 is on course to be greater than projected. This means the
probability that further cuts in government spending will be required after 2016−17 has
increased; we may find out if this is expected in the Chancellor’s Autumn Statement. The
scenarios we examine where total public spending remains at its 2016−17 real-terms level in
2020−21 are therefore a real possibility, and not necessarily “worst case scenarios”. If this
happens, and both welfare spending and the Welsh NHS are protected from further reductions in
spending, under the assumptions we make, UAs spending power would be 18% lower (22%
lower per person) in 2020−21 than in 2012−13.
It is beyond the scope of this report to examine how local authorities could and should respond
to the likely financial challenge lying ahead: this would require a detailed study of the demands
facing each service area, the scope for cost-cutting and efficiencies, and the statutory obligations
faced by local authorities. However, an analysis of expenditure figures can help inform such
detailed qualitative work.
First, it is informative to examine how English local government has allocated the considerably
bigger cuts in overall spending across services. The North East of England, the region of England
most similar to Wales, has seen a reduction in overall spending (excluding education) around
twice as large as that in Wales (18.7% versus 9.3%). This has involved larger spending cuts in all
service areas with the exception of fire services. The cuts in some areas have been very great
indeed. For instance, expenditure on planning and development has been reduced by 57.4%
versus 22.9% in Wales, and spending on regulation and safety has been reduced by 44.3% versus
24.5%. This suggests that Welsh UAs may be able to deliver further significant reductions in
spending in such areas although not necessarily without reductions in the quality and number of
services provided. However, local authorities in the North East have also had to make much

© Institute for Fiscal Studies, 2012
65
larger reductions in spending on social services (11.8% versus 3.8% in Wales), suggesting that as
the scope for making further cuts to areas like planning and development diminishes, important
‘core’ services such as social services cannot be protected as much.
An examination of longer-run trends in local government spending can also be helpful. This
shows that despite significant cuts, local government spending on planning and development in
Wales remains around 50% higher than its level in 2001−02. This again suggests that there may
be scope for reductions in spending in this area, although the contribution to overall spending
cuts is limited given the fact that this area accounts for less than 2% of local government
expenditure. However, one must be careful to consider the demands and obligations that local
government faces. For instance, whilst only a small part of the large increases in spending on
social services and environmental and refuse services have been undone (around £1 in £8, and
£1 in £9, respectively), these may be areas where rising demand and statutory obligations may
make cuts more challenging to deliver.
Simple calculations also show that if cuts on the scale of our “pessimistic” scenario are required,
UAs and national government face very difficult trade-offs. For instance, limiting the real-terms
cuts in spending on social services, environmental and refuse services and education – those
areas which have been relatively protected thus far – to half the average cut (9%) would imply
cuts of 52% for the non-protected services (such as housing, transport, culture and planning and
development). If, as seems likely, these were not deemed feasible, other difficult changes would
need to be made. This may involve making significant cuts to service areas so far relatively
insulated from cuts, local authorities stopping providing large swathes of services they
traditionally have and attempts to generate substantially more revenue whether from council tax
or increased fees and charges.
The report has also argued that the longer-term challenges to the UK public finances caused by
demographic change could mean that local government faces a difficult financial situation for
decades to come. The OBR’s Fiscal Sustainability Report’s central estimate is that demographic
change could increase spending by 5.2% of national income by 2060−61, largely driven by
additional outlays on health and pensions. If extra taxes cannot be raised, this may mean a
significant further squeeze on other areas of spending such as local government. The central
estimates are based on rather optimistic assumptions about how quickly productivity will grow
in the NHS, however, and if productivity were to instead grow at the average rate since 1979,
spending on the NHS would need to rise by a further 7.5% of national income (well over £100
billion in today’s prices). Dealing with this would require some combination of major tax rises,
large reductions in other areas of spending, a radical change in the way healthcare is funded, or a
decline in healthcare service quality. How government chooses to address these long-term issues
is not yet clear. But what is clear is that demographic change will present local and national
government with a significant financial challenge far beyond 2020.

© Institute for Fiscal Studies, 2012
66
Appendix A. Constructing consistent data
on local government spending in England
and Wales
This appendix describes the data used in this report and how we construct consistent data on net
current service expenditure for England and Wales, and how we have adjusted historical
population figures and projections in the light of the recently announced 2011 Census results
when calculating expenditure per person.
Local government expenditure statistics
This report uses local government expenditure outturns data for years between 2001−02 and
2010−11, the last year for which data are available at the time of analysis, and local government
budget estimates for 2011−12 and 2012−13. Final expenditure in these last two years may differ
from estimates as resources are shifted across spending areas and/or if contributions or
withdrawals from reserves differ from what was planned. Data for Wales are available from the
StatsWales website (http://statswales.wales.gov.uk/index.htm) and for England are available
from the Department for Communities and Local Government’s (DCLG) website
(http://www.communities.gov.uk/localgovernment/localregional/localgovernmentfinance/stati
stics/revenueexpenditure/). However, readers should note that we obtained the spreadsheets
underlying the StatsWales website from the Welsh Government, which contained exactly the
same data, but in an easier-to-use format.
The data on spending outturns includes detailed information on expenditure by detailed sub-
category of expenditure, and breaks down expenditure in to various components (e.g. teacher’s
salaries, other running costs and administration costs in the case of education). In addition to net
expenditure it also includes information on gross expenditure and income received from fees,
charges and other sources. In this report we make use of only information on overall net
expenditure on particular broader service items.
As there are too many sub-categories to meaningfully analyse, we aggregate spending in to a
number of aggregate categories:
Education
Social services
Police services
Environmental and refuse services
Transport
Culture and leisure (excluding libraries)
Central and other services
Fire services
Housing services
Planning and development
Regulation and safety
Library services
These categories were chosen to reflect broad functional areas that are of policy interest.
However, they differ somewhat from the aggregate categories used by the Welsh and UK

© Institute for Fiscal Studies, 2012
67
Governments. In particular, library and other cultural and leisure services are generally one
category (cultural services), as are environmental and refuse services and regulation and safety
(environmental and regulatory services). We chose to split these categories because we
considered there to be particular interest in expenditure on libraries and on environmental and
refuse services.
The split between libraries and other culture and leisure is self evident. However, it is
worthwhile identifying the sub-categories of spending that make up environmental and refuse
services and regulation and safety. The items listed are the category names for Wales in 2012−13,
and although names may differ in England and/or for earlier years, we have been careful to
ensure that we are consistent across years.
Environmental and refuse services consist of:
Coast protections
Street cleansing
Flood defence and land drainage
Agriculture and fisheries services
Waste collection
Waste disposal
Trade waste
Recycling
Wage minimisation
Climate change costs
Conservation of the natural environment
Regulation and safety services consist of:
Cemetery, cremation and mortuary services
Regulatory services – Environmental Health
Community safety (safety services)
Community safety (CCTV)
Community safety (crime reduction excluding CCTV)
Regulatory services – trading standards
In order to make comparisons across years we deflate expenditure by the GDP deflator (a
measure of whole-economy inflation) and express amounts in 2012−13 prices. In order to
ensure, as far as possible, we are comparing like-for-like expenditure across time and between
areas, we exclude spending on magistrates courts for those years in which it was counted as part
of local government, and exclude education from much of our comparative analysis of
expenditure in England and Wales.
Adjusting historical population figures and population projections
In order to provide figures on expenditure per person we divide expenditure by the estimated
mid-year population of the relevant geographic unit. For instance, spending per person by Cardiff
council in 2001−02 is calculated by dividing expenditure by Cardiff council in 2001−02 by an
estimate of the population in Cardiff in mid-2001.
Official mid-year estimates exist for each year between 2001 and 2011, and projections based on
2008 mid-year estimates in Wales (2010 in England) are available for each year to 2020 (and
beyond). However, the 2011 census found approximately 40,000 more people in Wales and more
than 400,000 more people in England than expected. This suggests that the mid-year estimates
for 2010 and earlier under-estimated the English and Welsh populations (although the size and

© Institute for Fiscal Studies, 2012
68
even direction of the discrepancy varies by local authority),and hence, forecasts for future years
based on the these earlier estimates also appear to be too low. If this is true, use of the
unadjusted mid-year estimates and forecasts would lead to inaccurate estimates of expenditure
per person. In particular, it would lead to a jump in the assumed population in 2011−12 and a fall
in 2012−13 which would act to overstate the cut in expenditure per person in 2011−12 and
understate the cut in expenditure per person in 2012−13.
For this reason, we adjust the official mid-year estimates population figures for 2002 to 2010 and
the projections for 2012 onwards on the following basis:
First, we assume that the mid-year estimates for 2001 and 2011 are correct (these are
based on the census conducted in that year).
We then calculate a projection for mid-2011 based on the mid 2010 population estimate.
This is done by assuming that the population would have increased at the same
percentage rate between 2010 and 2011 as in the official 2008-based projections.
Next, we calculate the discrepancy between this projection for 2011 and the actual mid-
year estimate for 2011. This gives an estimate of how ‘inaccurate’ the previous mid-year
estimates were.
We then update the mid-year estimates for 2002 to 2010 by assuming that the
discrepancy grew at a constant rate over time between 2001 and 2011. Hence, if the mid
year estimate for 2011 is 1% more than our 2010-based projection for 2011, we assume
that the population was (approximately) 0.1% higher than initially estimated in 2002,
0.2% higher in 2003, 0.3% in 2004 and so on.
Projections for 2012 onwards are updated by taking the mid-year estimate for 2011 and
assuming that the population grows at the same percentage rate between then and
future years as in the official 2008-based projections. In other words, we update the
baseline level of the population but not subsequent growth rates.
It is important to note that this is an ad-hoc method of adjustment, and that updated mid-year
estimates for past years and projections will be produced by the Office for National Statistics in
due course. Further details of the calculations are available from the authors on request.

© Institute for Fiscal Studies, 2012
69
Appendix B. A longer run perspective: Local government
spending since 2001−02
In this appendix we discuss how local government spending in Wales has changed over the last
11 years and the extent to which recent cuts have undone previous increases in spending.
Figure B.1 shows real terms current service spending per person by local government in Wales,
indexed to 100 in 2001−02. It also separately shows spending by UAs, police authorities and fire
authorities, also indexed to 100 in 2001−02.
Figure B.1. Real terms local government spending per person in Wales since
2001−02 (indexed so that 2001−02 level = 100)
Source: StatsWales, local government expenditure out-turns (2001−02 to 2010–11) and budgets (2011−12 and
2012−13) , available at http://statswales.wales.gov.uk/index.htm
Overall local government spending per person increased by 32% between 2001−02 and 2009−10
(from £1,700 per person to £2,253 per person), with the most rapid increases – almost half of the
total – taking place in between 2001−02 and 2003−04. The cuts undertaken and planned for
between 2009−10 and 2012−13 undo just over a third of this increase and will leave real-terms
local government spending per person 21% higher than in 2001−02.
The trends in overall local government spending have been driven by changes in spending by
UAs (remember these account for around £7 out of every £8 of local government spending). Real-
terms spending per person by UAs increased each year between 2001−02 and 2009−10, peaking
at 34% above its 2001−02 level. Subsequent cuts mean that UA spending per person in 2012−13
is planned to be 24% above its 2001−02 level.
The trends for expenditure by fire and police authorities are quite different: slower increases
initially (especially for fire authorities), followed by large increases in 2005−06 and 2006−07.
2006−07 was, in fact, the year when spending by both the police and fire services reached their
highest levels (34% and 21% above the 2001−02 levels, respectively), and since then, both have
fallen substantially. Police expenditure per person has fallen in real-terms each year, whilst fire
service expenditure has been more volatile. By 2012−13, around three-quarters of the increase in
police authorities net current service spending per person between 2001−02 and 2006−07 is
90
100
110
120
130
140
20
01
–0
2
20
02
–0
3
20
03
–0
4
20
04
–0
5
20
05
–0
6
20
06
–0
7
20
07
–0
8
20
08
–0
9
20
09
–1
0
20
10
–1
1
20
11
–1
2
20
12
–1
3
Exp
en
dit
ure
in
20
01
−0
2 =
10
0
Total Unitary Authorities Police Authorities Fire Authorities

© Institute for Fiscal Studies, 2012
70
planned to have been unwound, leaving spending 8% above its 2001−02 level. Fire authorities
have fared even worse with planned spending per person around 1% lower in 2012−13 than in
2001−02.
The longer run picture: variation across Wales
The increases in spending since 2001−02 are not equal across Wales as shown in Figure B.2.
Figure B.2. Changes in net current service expenditure per person by UAs across
regions of Wales, since 2001−02
Source: StatsWales, local government expenditure outturns (2001−02 to 2010−11) and estimates (2011−12 and
2012−13) and authors’ calculations.
The percentage increases in spending, both to 2009−10 and 2012−13 are fairly similar to the
Welsh average in The Valleys and Rest of Wales regions: increases similar to the average have
been followed by cuts similar to the average. The Southern Cities saw smaller increases in
spending per person than Wales as a whole up to 2009−10 (29% versus 34%), and larger-than-
average cuts mean spending per person is planned to be only 17% above its 2001−02 level in
2012−13 (versus 24% nationally). On the other hand, North East Wales saw larger increases in
UA spending per person up to 2009−10 (42%) and smaller-than-average cuts mean this has
fallen back by less than in Wales as a whole (to 33% above its 2001−02 level).
Looking at the NUTS-2 regions of Wales, local government spending per person rose more over
the 8 years to 2009−10 in West Wales and the Valleys (36%) than East Wales (31%). Slightly
higher percentage cuts in spending in East Wales mean that this difference is maintained when
looking at the 11 years to 2012−13: a 26% increase in spending per person in West Wales and
the Valleys versus a 20% increase in spending per person in East Wales.
As can be seen in table B.1, below, these differential changes mean the relative levels of spending
across Wales have changed. For instance, spending in North East Wales has caught up a long way
with the Welsh average: UA spending per person was less than 2% below the Welsh average in
2012−13, versus over 8% below the Welsh average in 2001−02. On the other hand, spending in
0%
5%
10%
15%
20%
25%
30%
35%
40%
45%
Wal
es
Th
e V
alle
ys
Th
e So
uth
ern
Cit
ies
No
rth
Eas
t W
ales
Res
t o
f W
ales
Eas
t W
ales
Wes
t W
ales
an
d t
he
Val
leys
Ch
ange
in r
eal s
pen
din
g (£
per
per
son
per
yea
r) to 2009−10 to 2012−13

© Institute for Fiscal Studies, 2012
71
the Southern Cities has fallen from less than 2% below the Welsh average to almost 7% below
the Welsh average during the same period.
Table B.1. Net current service expenditure per person by UAs (£s per year,
2012−13 prices), 2001−02 and 2012–13
Region 2001−02 2012−13
The Valleys 1,544 1,925
The Southern Cities 1,441 1,688
North East Wales 1,339 1,774
Rest of Wales 1,442 1,795
East Wales 1,407 1,694
West Wales and the Valleys 1,489 1,871
Wales 1,460 1,806
Source: StatsWales, local government expenditure outturns (2001−02 to 2010−11) and estimates (2011−12 and
2012−13) and authors’ calculations.
There is even more variation in spending trends when one looks at UAs as opposed to regions of
Wales. Table B.2 shows spending per person by each UA in 2001−02 and 2009−10 and 2012−13,
along with the overall percentage change in spending between 2001−02 and 2012−13. It shows
that:
Five UAs have increased their spending by less than 20% per person since 2001−02,
whilst four have increased their spending by 30% or more during the same period.
Large increases in North East Wales reflect above-average increases in all three UAs
(Denbighshire, Flintshire and Wrexham). Denbighshire has seen the largest per-person
increases during this period (over 40%), with spending per person now over £200 per
person above the Welsh average versus £26 below the Welsh average in 2001−02.
Small increases in the Southern Cities reflect below-average increases in all three UAs
(Swansea, Newport and Cardiff), with Cardiff and Newport seeing the smallest
percentage increases of any Welsh UAs over the 11 year period (although it must be
noted Newport’s figures show an increase up to 2009−10 a little above the Welsh
average, followed by very substantial cuts). Indeed, Cardiff has gone from having a level
of spending per person roughly equal to the Welsh average to over £140 per person
below it (the gap was an even-greater £167 in 2009−10).

© Institute for Fiscal Studies, 2012
72
Table B.2. Levels (£s per annum, 2012−13 prices) of and changes (%) in net
current service expenditure per person by UAs
Unitary Authority 2001−02 2009−10 2012−13 % change 2001−02 to 2012−13
Anglesey 1,500 2,010 1,788 19.2%
Gwynedd 1,573 2,038 1,892 20.3%
Conwy 1,381 1,991 1,816 31.5%
Denbighshire 1,434 2,226 2,013 40.4%
Flintshire 1,306 1,812 1,697 29.9%
Wrexham 1,307 1,773 1,695 29.7%
Powys 1,576 2,037 1,864 18.3%
Ceredigion 1,425 1,990 1,829 28.4%
Pembrokeshire 1,393 1,928 1,765 26.7%
Carmarthenshire 1,437 1,897 1,841 28.1%
Swansea 1,413 1,900 1,737 22.9%
Neath Port Talbot 1,591 2,075 1,975 24.2%
Bridgend 1,450 1,974 1,789 23.4%
Vale of Glamorgan 1,347 1,798 1,679 24.7%
Rhondda Cynon Taf 1,591 2,113 2,018 26.8%
Merthyr Tydfil 1,664 2,196 2,018 21.2%
Caerphilly 1,483 2,082 1,814 22.3%
Blaenau Gwent 1,630 2,267 1,997 22.5%
Torfaen 1,463 2,040 1,923 31.5%
Monmouthshire 1,314 1,811 1,628 23.8%
Newport 1,442 1,970 1,645 14.1%
Cardiff 1,462 1,802 1,672 14.4%
All (Wales) 1,460 1,963 1,806 23.7%
Source: StatsWales, local government expenditure outturns (2009−10 and 2010−11) and estimates (2011−12 and
2012−13) and authors’ calculations.
The longer run picture: variation across services
As with geography, there is variation in the longer-run trends across service areas. Figure B.3
shows the percentage change in net current service spending per person for each service area
between: 2001−02 and 2009−10 (dark green), a period when spending was broadly increasing;
and 2001−02 and 2012−13 (light green) which includes subsequent declines. This again allows
us to examine what fraction of the increase in spending up to 2009−10 has since been unwound.

© Institute for Fiscal Studies, 2012
73
Figure B.3. Increase in real terms local government spending per person (%) by
service since 2001−02, Wales
Source: StatsWales, local government expenditure out-turns (2001−02 to 2010–11) and budgets (2011−12 and
2012−13) , available at http://statswales.wales.gov.uk/index.htm
The first thing to notice is that certain service areas saw much greater increases in expenditure
than others during the ‘good times’ up to 2009−10. Housing services in particular saw a very
large increase: spending per person increased by 274% in real terms between 2001−02 and
2009−10, reflecting the introduction of the ‘Supporting People’ initiative in the intervening
period. Other areas to see large increases in spending including:
Planning and development (95%), largely as a result of increased spending on economic
development;
Environment and refuse services (62%), perhaps reflecting the additional costs
associated with a drive for recycling and the landfill tax;
Regulation and safety (54%), and;
Social care (51%), perhaps reflecting increasing demands from a growing elderly
population (although this is expected to impact more in coming years)
On the other hand, increases in net current service spending per person on culture and
recreation (22%), libraries (16%), police (22%) and fire (13%) services were much smaller, and
spending on central services fell slightly (2%). Perhaps surprisingly, education spending also
increased considerably less than the average, increasing by 22% per person between 2001−02
and 2009−10. But it should be borne in mind that this period corresponded to a significant
reduction in the school-age population in Wales (by 6.6% from 510,178 to 476,363), that means
education spending per student looks to have increased by rather more.
Section 2.2 of this report showed that spending cuts varied by services, and together with
previous varied rates of increases, this means changes in spending between 2001−02 and
2012−13 also vary significantly across services.
The increase in spending on housing services remains very large at 197%, although this does
mean just over one-quarter of the earlier increases to 2009−10 have since been undone.
Spending per person on planning and development services is set to be 51% above its 2001−02
level in 2012−13, and although this means almost half of the earlier increases have been undone,
-50 0 50 100 150 200 250 300
Library services
Regulation and safety
Planning and development
Housing services
Fire service
Central and other servies
Culture and leisure (ex. Libaries)
Transport
Environment and Refuse
Police service
Social services
Education services
to 2009−10 to 2012−13

© Institute for Fiscal Studies, 2012
74
it may mean there is scope for further substantial reductions if necessary (and at the very least, it
will be easier to identify spending cuts given that spending is still significantly higher than 12
years ago than in services that have not seen such spending increases). On the other hand, whilst
only a relatively small part of the increases in spending on environmental and refuse services and
social services have been undone (around £1 in £8 and £1 in £9, respectively), these may be
areas where statutory obligations limit the scope for major reductions.
Large cuts to library services and cultural and recreational services have nearly wiped out earlier
increases, meaning real-terms current service spending per person is little higher than in
2001−02. Finally, cuts to education budgets mean that spending per person is now only 13%
higher than in 2001−02, although again, the picture looks somewhat rosier for spending per
school pupil. But it is worth noting that if cuts to education spending continue at the same pace,
spending per person will be little higher in 2016−17 (the last year of planned cuts to overall
public spending, see Chapter 1) than in 2001−02.
The longer run picture: comparison with England
How has local government spending in England fared over a longer time period and how does
this compare to Wales? This is the question we now turn to.
Figure B.4 shows how local government spending (excluding education) has evolved in England
and Wales since 2001−02, indexing the real-terms level of spending per person in Wales in
2001−02 to 100 (this allows us to compare both growth rates and relative levels). This shows
that local government net current service spending per person (excluding education) was around
6% above the English average in 2001−02. Following strong increases in local government
spending in both England and Wales over the four years to 2005−06, this gap was around 5%.
Since then it has widened somewhat. First, relatively stronger growth in local government
spending in both 2006−07 and 2008−09 in Wales meant that this gap increased to around 9% by
2009−10. Significantly larger spending cuts in England since 2009−10 have increased this gap to
almost 18% in 2012−13.
Figure B.4. Real terms local government spending per person in Wales since
2001−02 (indexed so that 2001−02 level in Wales = 100)
Source: StatsWales and DCLG, local government expenditure out-turns (2001−02 to 2010–11) and budgets (2011−12
and 2012−13) and authors calculations.
90
100
110
120
130
140
150
20
01
–0
2
20
02
–0
3
20
03
–0
4
20
04
–0
5
20
05
–0
6
20
06
–0
7
20
07
–0
8
20
08
–0
9
20
09
–1
0
20
10
–1
1
20
11
–1
2
20
12
–1
3
Wale
s, 2
00
1−0
2 =
10
0
Wales England

© Institute for Fiscal Studies, 2012
75
This means that while local government net current service spending (excluding education) was
only around £50 per head higher in Wales than in England in 2001−02 (£957 versus £905 in
2012−13 prices), the gap is planned to be over £180 per head in 2012−13 (£1,219 versus
£1,035).
It is also instructive to compare how the amount spent on different services has changed in
England relative to Wales. Figure B.5a shows the percentage change in spending per person for
each service in England and Wales between 2001−02 and 2009−10, while Figure B.5b covers the
longer period from 2001−02 to 2012−13, allowing us to examine whether the cuts have more-
than-undone earlier increases.
Figure B.5a. Increase in real terms local government spending per person (%) by
service between 2001−02 and 2009−10, England and Wales
Figure B.5b. Increase in real terms local government spending per person (%) by
service between 2001−02 and 2012−13, England and Wales
Source: StatsWales, and DCLG local government expenditure out-turns (2001−02 to 2010–11) and budgets (2011−12
and 2012−13)
-50 0 50 100 150 200 250 300
Library services
Regulation and safety
Planning and development
Housing services
Fire service
Central and other servies
Culture and leisure (ex. Libaries)
Transport
Environment and Refuse
Police service
Social services
England Wales
-50 0 50 100 150 200 250 300
Library services
Regulation and safety
Planning and development
Housing services
Fire service
Central and other servies
Culture and leisure (ex. Libaries)
Transport
Environment and Refuse
Police service
Social services
England Wales

© Institute for Fiscal Studies, 2012
76
Between 2001−02 and 2009−10, the pattern of spending changes in England was similar to that
in Wales. Housing saw the largest increases in both nations (169% in England versus 274% in
Wales), in part reflecting spending under the ‘Supporting People’ programme. Social services,
environmental and refuse services, planning and development and regulation and safety also saw
increases in spending per person of over 40% in both nations (the increases were somewhat
larger in Wales than England), whilst spending on transport rose by over 35% in Wales and over
65% in England (although spending in England is skewed by Transport for London). On the other
hand, per-person net current spending on central services was reduced in both countries, and
spending on the libraries and the fire service barely grew.
How do the cuts since 2009−10 change this picture? The first thing to notice is that in both
England and Wales, spending on social care, environmental and refuse services, housing services,
and to a lesser extent, transport services, remains well above the levels of 2001−02. Perhaps the
most striking finding is that local government spending per person on planning and
development, culture and leisure (ex. libraries), libraries, and central and other services is over
15% below its 2001−02 level in England. On the other hand, spending on the last three of these
services is at similar levels to in 2001−02 in Wales, while spending on planning and development
services remains 50% above its 2001−02 level. This provides further evidence that there may
still be significant scope for further reductions to these budgets, before Welsh local authorities
need to shift more of the cuts to more politically sensitive social care, environment and waste and
housing budgets as the spending cuts continue, likely until at least 2016−17.

© Institute for Fiscal Studies, 2012
77
Appendix C. Projecting Welsh
Government expenditure and local
government spending power to 2020−21
This appendix provides further explanation of how we project unitary authorities’ (UAs)
spending power to 2020−21 and identifies the data sources used.
The first task is to calculate UAs spending power in 2010−11, 2011−12 and 2012−13 and project
it for the period covered by the current UK Government spending review (i.e. 2013−14 and
2014−15). To do this we make use of the following data sources:
The Welsh Local Government Revenue and Capital Settlement’s 2012−13 and 2011−12
(http://wales.gov.uk/topics/localgovernment/finandfunding/settlement/?lang=en).
Local government expenditure outturns for 2010−11 and local government budget
estimates for 2011−12 and 2012−13 (http://statswales.wales.gov.uk/index.htm)
Spending power in 2010−11, 2011−12 and 2012−13 is calculated by adding the general grants
(termed aggregate external finance or AEF) and specific grants (excluding those for housing
benefit) outlined in the Local Government Settlement to the actual or expected council tax
receipts listed in the local government expenditure tables.
The 2012−13 Settlement includes indicative allocations for the general grant (AEF) for 2013−14
and 2014−15. We assume that specific grants change in line with Welsh Government current
expenditure on items other than general grants to local authorities (available at
http://wales.gov.uk/funding/budget/suppbudget1213/?lang=en). Council tax receipts are
expected to grow in line with inflation plus the change in the number of households in Wales
(http://wales.gov.uk/topics/statistics/theme/housing/estimate/hsehold-proj/?lang=en).
We then examine various scenarios for local government’s spending power post 2014−15 (see
Chapter 4). In order to do this we use data on planned public expenditure available at
(http://budgetresponsibility.independent.gov.uk/pubs/March-2012-EFO1.pdf) which includes
estimates of spending on welfare, debt interest and public services to 2016−17. We use these
forecasts to project how Welsh Government DEL would change during this period if it followed
the path of overall public service spending (total spending minus welfare spending and debt
interest) both if no further cuts to welfare are made and if they are not made.
To project the level of Welsh Government DEL in 2020 under our various scenarios, we use the
OBR’s long run forecasts of economic growth, welfare expenditure (available at
http://budgetresponsibility.independent.gov.uk/fiscal-sustainability-report-july-2012/). We
assume that total public service expenditure either grows in line with the long-run real-terms
growth rate (2.4%) contained in the OBR’s Fiscal Sustainability Report or is fixed in real terms at
its 2016−17 level. Welfare expenditure is assumed to grow in line with the forecasts contained in
Table 1.1 of the Supplementary tables to the OBR’s report (suitably adjusted for whether the
scenario assumes welfare spending is cut between 2014−15 and 2016−17) and debt interest
payments are assumed to increase from £65.5 billion 2016−17 to £80.0 billion in 2020−21.
Welsh Government DEL is assumed to change in line with overall public service spending but any
cuts after 2014−15 are assumed to hit current as opposed to capital DEL (which the UK
Government has said is protected). We take figures for Welsh Government DEL from tables 1.3a

© Institute for Fiscal Studies, 2012
78
and 1.6 of the Public Expenditure Statistical Analysis (PESA) budget tables (available at
http://www.hm-treasury.gov.uk/d/pesa_2011_tables_chapter1.xlsx).
Finally, we project Welsh Government grants to UAs and add on projections for council tax
revenue (which is assumed to continue to grow in line with inflation and household growth) to
calculate UAs’ spending power. This is relatively simple under the assumption that the Welsh
NHS is not protected from further cuts: in that case the change in grants after 2014−15 is the
same as the change in the Welsh Government current DEL. If the Welsh NHS is protected from
further cuts, we need to work out how much larger cuts to other areas (such as grants to the UAs)
would need to be in order that overall spending is reduced in line with the fall in the current DEL.
To do this we use draft figures for spending on the NHS and other areas in Wales in 2014−15
from the 2012 Budget (http://wales.gov.uk/funding/budget/suppbudget1213/?lang=en).

© Institute for Fiscal Studies, 2012
79
References
Crawford, R., C. Emmerson, D. Phillips and G. Tetlow (2011), “Public spending cuts: pain shared?”,
Chapter 6, in IFS Green Budget 2012, M. Brewer, C. Emmerson and H. Miller (eds)
Crawford, R. and D. Phillips (2012), “Local government spending: where is the axe falling?”,
Chapter 6, in IFS Green Budget 2011, C. Emmerson, P. Johnson and H. Miller (eds)
Office for Budget Responsibility (2012), “Economic and Fiscal outlook – March 2012”
Office for Budget Responsibility (2012), “Fiscal Sustainability report – July 2012”
Pybus, T. (2011), “Estimating the UK’s historical output gap”, Working Paper 1, Office for Budget
Responsibility
For information on data sources see appendices A and C.