Embed Size (px)
Citation preview
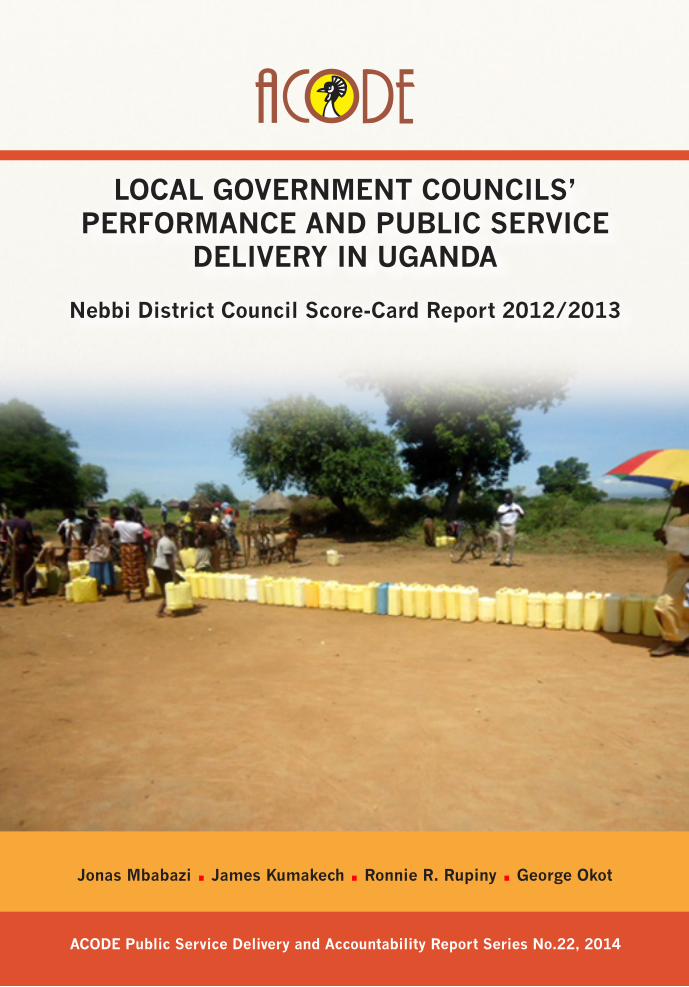
Jonas Mbabazi . James Kumakech . Ronnie R. Rupiny . George Okot
ACODE Public Service Delivery and Accountability Report Series No.22, 2014
LOCAL GOVERNMENT COUNCILS’ PERFORMANCE AND PUBLIC SERVICE
DELIVERY IN UGANDA
Nebbi District Council Score-Card Report 2012/2013
LOCAL GOVERNMENT COUNCILS’ PERFORMANCE AND PUBLIC SERVICE
DELIVERY IN UGANDA
Nebbi District Council Score-Card Report 2012/2013
Jonas Mbabazi . James Kumakech . Ronnie R. Rupiny . George Okot
ACODE Public Service Delivery and Accountability Report Series No.22, 2014
Published by ACODEP. O. Box 29836, KampalaEmail: [email protected]; [email protected]: http://www.acode-u.org
Citation:
Mbabazi, J., et.al. (2014). Local Government Councils’ Performance and Public Service Delivery in Uganda: Nebbi District Council Score-Card Report 2012/13. ACODE Public Service Delivery and Accountability Report Series No.22, 2014. Kampala.
© ACODE 2014
All rights reserved. No part of this publication may be reproduced, stored in a retrieval system or transmitted in any form or by any means electronic, mechanical, photocopying, recording or otherwise without the prior written permission of the publisher. ACODE policy work is supported by generous donations and grants from bilateral donors and charitable foundations. The reproduction or use of this publication for academic or charitable purposes or for purposes of informing public policy is excluded from this restriction.
ISBN: 978 9970 34 019 4
Cover Illustrations:
Residents waiting with their jerrycans lined-up at a water point in Pakwach sub-county, Nebbi District.

CONTENTSLIST OF TABLES AND FIGURES ............................................................. IABBREVIATIONS .................................................................................. IIACKNOWLEDGEMENT ......................................................................... IVEXECUTIVE SUMMARY ......................................................................... V1. BACKGROUND ................................................................................. 1
1.1 Introduction .............................................................................. 11.2 District profile ........................................................................... 11.3 District leadership ..................................................................... 21.4 Methodology ............................................................................. 41.4.1The Score-card ......................................................................... 41.4.2 Score-card Administration ....................................................... 41.4.3 Data Management and Analysis ............................................... 6
2. BUDGET ARCHITECTURE AND SERVICE DELIVERY IN NEBBI DISTRICT ........................................................................................ 7
2.1. Nebbi District Budget Performance..................................... 72.1.1. Nebbi District Local Government Resource Envelope ........ 72.1.2. Budget Expenditure and intra-Sectoral Allocations ........... 82.2 State of Service Delivery in Nebbi District ........................... 92.2.1 Primary Education ......................................................... 112.2.2 Functional Adult Literacy (FAL) ....................................... 122.2.3. Health Sector ................................................................ 122.2.4 Agriculture ..................................................................... 132.2.5 Roads ............................................................................ 132.2.6. Water and Sanitation ..................................................... 142.2.7 Environment and Natural Resources ............................... 15
3. THE SCORE-CARD FINDINGS AND INTERPRETATION ................... 163.1 Performance of the District Council ................................... 163.2 Performance of the District Chairperson ............................ 183.3 Performance of the District Speaker .................................. 203.4 Performance of District Councilors .................................... 213.5 Interpretation of Results ................................................... 253.5.1 Internal Factors .............................................................. 253.5.2 External Factors ............................................................. 26

4. GENERAL CONCLUSION AND RECOMMENDATIONS ...................... 274.1 Conclusion .............................................................................. 274.2 Recommendations ................................................................... 27
REFERENCES ..................................................................................... 30ANNEXES ........................................................................................... 33PUBLICATIONS IN THIS SERIES ......................................................... 36
LIST OF TABLESTable 1: Summary of Key Demographic Indicators of Nebbi District Local
Government ........................................................................................... 10
Table 2: Nebbi District Leadership 2012-2013 ............................................... 11
Table 3: Service Delivery Indicators in Nebbi District ..................................... 16
Table 4: Chairperson Score-Card 2012-2013 ............................................... 17
Table 5: Speaker’s Performance in 2012-2013 .............................................. 18
Table 7: Score-card performance for Nebbi District Councillors in
FY2012/13 ............................................................................................ 23
i

LIST OF FIGURESFigure 1: Composition of the Resource Envelope for Nebbi District ................... 8
Figure 2: Nebbi District Intra-Sectoral Budget Allocations ................................ 9
Figure 3: P1 Pupils at Pajago P.S and Staff house at Boro Primary School ..... 12
Figure 4: Nearly impassable road to Acayo ps and Akaba-Kucwiny-Wadelai
road (Right) ........................................................................................... 14
Figure 5: Fully packed water point in Pakwach sub-county ............................ 15
ii
LIST OF ACRONYMSACODE Advocates Coalition for Development and Environment
CAO Chief Administrative Officer
DCC District Contract Committee
DGF Democratic Governance Facility
DLB District Land Board
DRC Democratic Republic of Congo
DSC District Service Commission
EU European Union
FAL Functional Adult Literacy
FDG Focus Group Discussion
LGCSI Local Government Council Score-Card Initiative
MoLG Ministry of Local Government
NAADS National Agricultural Advisory Development Services
NECSOC Nebbi Cultural and Social Center
NMS National Medical Stores
NUSAF Northern Uganda Social Action Fund
PAC Public Account Committee
PLE Primary Leaving Examination
PRDP Peace Recovery Development Plan
RDC Resident District Commissioner
SAGE Social Assistance Grant for the Elderly
UK United Kingdom
ULGA Uganda Local Governments Association
iii

ACKNOWLEDGEMENTThis score-card was prepared as part of the Local Government Councils’ Score-Card Initiative (LGCSCI) assessment for FY 2012/13. The initiative is a partnership between the Uganda Local Governments Association (ULGA) and the Advocates Coalition for Development and Environment (ACODE)-an independent public policy research and advocacy think-tank based in Kampala, Uganda. This report is an output of assessment of the political leadership of Nebbi District, consultations with the district technical team as well as selected community members in sub-counties within the district.
We acknowledge the contribution of the LGSCI project team at ACODE and researchers in Nebbi District who gathered information upon which this report is premised. The production of this report would not have been possible without the contributions of several institutions and persons. We are particularly indebted to the offices of the District Chairperson, the District Speaker, the Chief Administrative Officer, the District Clerk to Council and the District Councilors (the prime focus of this score-card) for the support accorded to the research team during the assessment process. The team is grateful to Drake Rukundo for peer reviewing and Mukotani Rugyendo for technical editing of this report.
We are indebted to the Democratic Governance Facility (DGF) and its contributing partners: the United Kingdom (UK), Denmark, Norway, Ireland, Sweden, The Netherlands, Austria and the European Union (EU) for providing the financial support for this Initiative. While we have taken due care to ensure that where information is available, it is presented as accurately as possible. We take responsibility for any errors or omission.
iv
EXECUTIVE SUMMARY
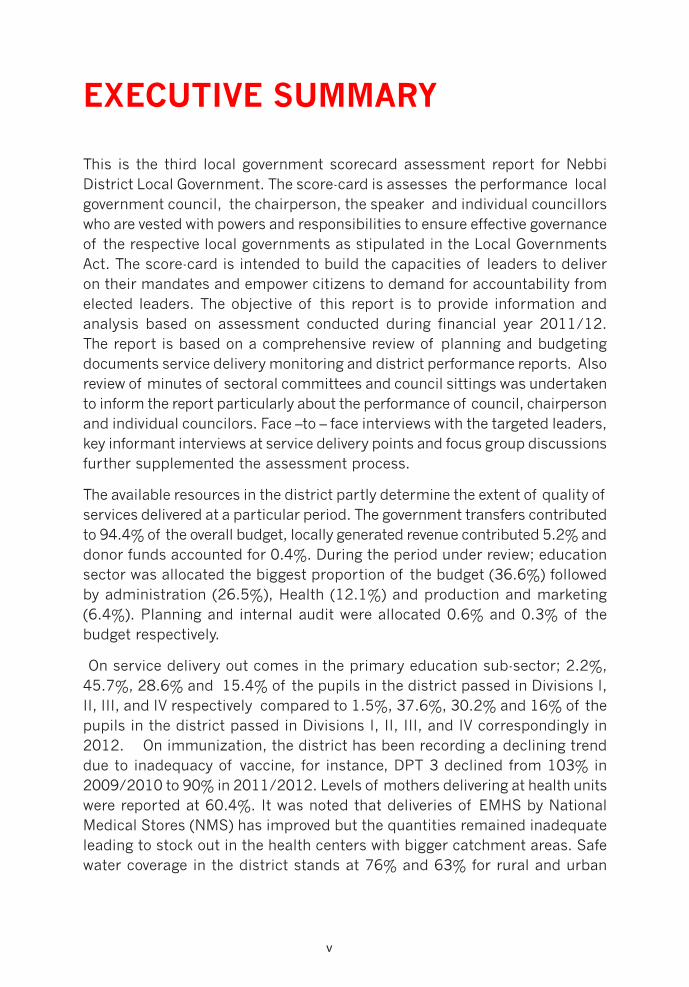
This is the third local government scorecard assessment report for Nebbi District Local Government. The score-card is assesses the performance local government council, the chairperson, the speaker and individual councillors who are vested with powers and responsibilities to ensure effective governance of the respective local governments as stipulated in the Local Governments Act. The score-card is intended to build the capacities of leaders to deliver on their mandates and empower citizens to demand for accountability from elected leaders. The objective of this report is to provide information and analysis based on assessment conducted during financial year 2011/12. The report is based on a comprehensive review of planning and budgeting documents service delivery monitoring and district performance reports. Also review of minutes of sectoral committees and council sittings was undertaken to inform the report particularly about the performance of council, chairperson and individual councilors. Face –to – face interviews with the targeted leaders, key informant interviews at service delivery points and focus group discussions further supplemented the assessment process.
The available resources in the district partly determine the extent of quality of services delivered at a particular period. The government transfers contributed to 94.4% of the overall budget, locally generated revenue contributed 5.2% and donor funds accounted for 0.4%. During the period under review; education sector was allocated the biggest proportion of the budget (36.6%) followed by administration (26.5%), Health (12.1%) and production and marketing (6.4%). Planning and internal audit were allocated 0.6% and 0.3% of the budget respectively.
On service delivery out comes in the primary education sub-sector; 2.2%, 45.7%, 28.6% and 15.4% of the pupils in the district passed in Divisions I, II, III, and IV respectively compared to 1.5%, 37.6%, 30.2% and 16% of the pupils in the district passed in Divisions I, II, III, and IV correspondingly in 2012. On immunization, the district has been recording a declining trend due to inadequacy of vaccine, for instance, DPT 3 declined from 103% in 2009/2010 to 90% in 2011/2012. Levels of mothers delivering at health units were reported at 60.4%. It was noted that deliveries of EMHS by National Medical Stores (NMS) has improved but the quantities remained inadequate leading to stock out in the health centers with bigger catchment areas. Safe water coverage in the district stands at 76% and 63% for rural and urban
v
water supply serving a total population of 255,153. Functionality of water facilities stood at 69% as at 21st December, 2012.
Nebbi district was among the 26 Districts that were assessed in FY 2012/13. The District council had a total of 26 councilors all of whom were assessed. With regard to the score-card performance, the district council scored a total 69 out of a possible 100 points an improvement from 51 points in the previous assessment in FY 2011/12. The best performance was exhibited under planning and budgeting (13 out of 20), accountability to citizens (18 out of 25) and the third was legislative role (16 out of 25). The District Chairperson, Robert Okumu scored 74 out of the possible 100 points. This shows an improvement with 9 points compared to the 2011/12 assessment. The District speaker scored 73 out of the possible points of 100- an improvement from 65 out of 100 points in FY 2011/12. The best performing councilor in Nebbi District Councilor was Hon. Terence Akera who represents Pakwach Town Council with 81 points out of possible 100 total points. This is an improvement with 11 points compared to the 2011/12 assessment. Hon. Grace Owonda representing Erussi Sub-county was the best female councilor with 58 points- an improvement from 48 points in FY 2011/12. Councilors registered their best performance in legislative. There was general improvement monitoring and evaluating service delivery with an average score of approximately 18 points compared to 10.5 points out of 45 in FY 2011/12.
A number of challenges that constrain the performance of the council and political leaders mainly arise from internal weaknesses some of which had been identified in the previous assessment but had not been addressed. These include: poor documentation and record keeping among councilors; poor communication between the lower local governments, the district Council and the citizens, poor time keeping among councilors and technical officials(service providers), and over dependency on central government funding. The report makes recommendations on: orientation of district councilors and the community; boosting the local economy, periodic monitoring and reporting; and advocacy for a change in the budget architecture among others.
vi
Local Government Councils’ Performance and Public Service Delivery in Uganda: Nebbi District Council Score-Card Report 2012/13 1
1. BACKGROUND
1.1 IntroductionThis is a score-card assessment report for Nebbi district local government for the financial year 2012/2013. Nebbi district has been part of the score-card assessment since 2009.This rigorous and innovative initiative is spearheaded by ACODE under the Uganda Local Government Council Score-Card Initiative (LGCSCI), a project that is implemented in partnership with ULGA. The long term goal of the initiative is to strengthen citizens’ demand-side for good governance and accountability in a bid to promote effective and efficient service delivery at local government level. The score-card also seeks to empower district councilors with knowledge and skills in order to boost and foster professional conduct among the political leaders. The initiative was launched in 2009 originally with 10 districts and has progressively moved to 26 districts during the third and fourth years of the assessment.
1.2 District ProfileNebbi district local government was gazetted from the former districts (South-West Nile) in 1974. The South West Nile district had a polyglot society in which the various ethnic groupings (Alur, Jonam, Kebu, Lendu, Madi and Lugbara). At the moment, Nebbi district is made up of the two counties of Jonam and Padyere1 and in its current form, Nebbi district local government is bordered by Arua district to the North, Nwoya to the East, Bulisia to the South-East, Zombo to the West and Democratic Republic of Congo to the South-West. It is this geo-political entity that is the focus of the 2012/2013 score-card assessment.
1.2.1 Demographic Characteristics
Nebbi district, with its proximity to the Democratic Republic of Congo and at the gate way to West Nile, hosts a projected population of approximately 328,400 people. Available demographic information further shows that Nebbi district local government has a high population growth rate of over 2.7% with
1 Nebbi district consists of 15 sub-counties of Pakwach town council, Pakwach sub-county, Alwi, Panyango, Panyimur, Wadelai, Kucwiny, Akworo, Parombo, Erussi, Ndheu, Atego, Nyaravur, Nebbi sub-county and Nebbi town council.

Local Government Councils’ Performance and Public Service Delivery in Uganda: Nebbi District Council Score-Card Report 2012/132 Local Government Councils’ Performance and Public Service Delivery in Uganda: Nebbi District Council Score-Card Report 2012/13
estimated population density of >100 for Padyere county and <100 for Jonam county per sq. km. Table 1 below shows the population figures since 1991.
Table 1: Summary of Key Demographic Indicators of Nebbi District Local Government
INDICATORLiteracy ratio 61.7%Average Growth Rate (1991 – 2002) 2.7%Infant Mortality Rate (per 1000) 88/10,000Under five Mortality Rate -Total fertility rate 6
Household size 67,740
Latrine coverage 82%
Percentage urban population 9.8%
Percentage of male-headed households -
Sex ratio (males per females) 92.7
Population density (Number of persons per km2) >100 p’ple
Percentage of individuals below poverty line 54.5%
Maternal Mortality Rate 505/100,000
Life expectancy 45 Years
Household number 67,744
Safe water coverage 69.5%
Primary school enrolment 114,478
Percentage of female headed households -
Source: Nebbi District Development Plan 2010/2011-2014/2015
1.3 Nebbi District LeadershipNebbi district local government is headed by Chairman Robert Okumu working with 28 elected councilors, including the speaker. In terms of gender, 17 of the councilors including the chairperson and speaker, were male while 12 are female. The business of the council is steered by the district speaker; who presides and guides the council proceedings. On the other hand, the political wing is assisted by the technical team, headed by the Chief Administrative Officer (CAO) who ensures that lawful council decisions are effectively and efficiently executed. There is the RDC, a resident presidential appointee, who keenly monitors and supervises government programmes in the district and ensures their effective implementation. The RDC is also chairperson of the district security committee and reports directly to the president.
Nebbi District Council conducts its regular and oversight role through three standing committees. These committees plan and undertake monitoring of service delivery on behalf of the district council. These committees are headed
Local Government Councils’ Performance and Public Service Delivery in Uganda: Nebbi District Council Score-Card Report 2012/13 3
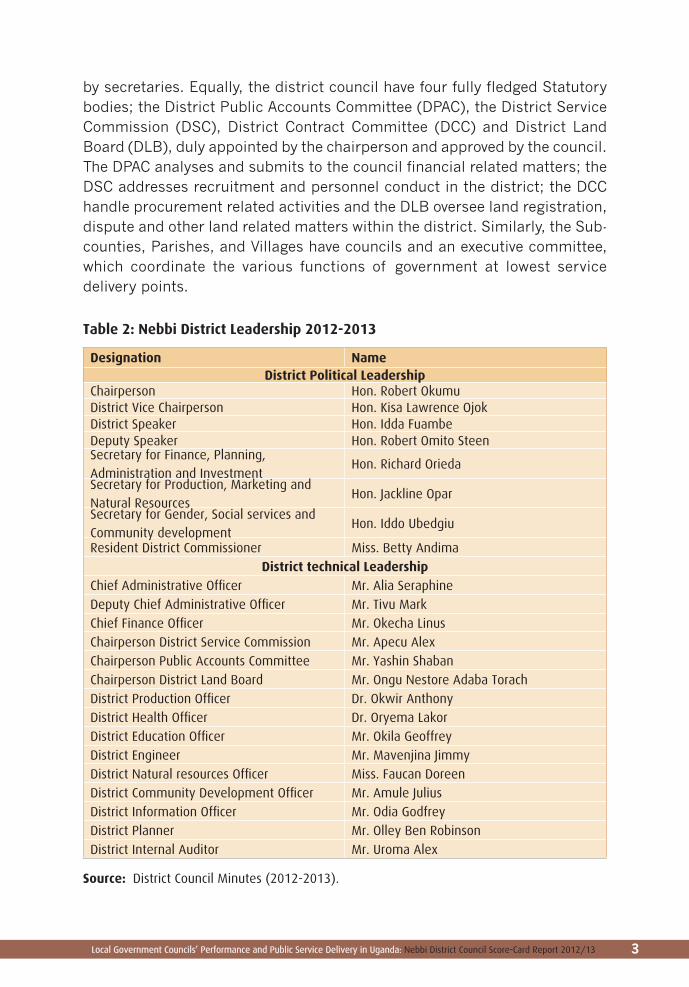
by secretaries. Equally, the district council have four fully fledged Statutory bodies; the District Public Accounts Committee (DPAC), the District Service Commission (DSC), District Contract Committee (DCC) and District Land Board (DLB), duly appointed by the chairperson and approved by the council. The DPAC analyses and submits to the council financial related matters; the DSC addresses recruitment and personnel conduct in the district; the DCC handle procurement related activities and the DLB oversee land registration, dispute and other land related matters within the district. Similarly, the Sub-counties, Parishes, and Villages have councils and an executive committee, which coordinate the various functions of government at lowest service delivery points.
Table 2: Nebbi District Leadership 2012-2013
Designation Name District Political Leadership
Chairperson Hon. Robert Okumu District Vice Chairperson Hon. Kisa Lawrence OjokDistrict Speaker Hon. Idda Fuambe Deputy Speaker Hon. Robert Omito SteenSecretary for Finance, Planning, Administration and Investment
Hon. Richard Orieda
Secretary for Production, Marketing and Natural Resources
Hon. Jackline Opar
Secretary for Gender, Social services and Community development
Hon. Iddo Ubedgiu
Resident District Commissioner Miss. Betty Andima
District technical LeadershipChief Administrative Officer Mr. Alia Seraphine
Deputy Chief Administrative Officer Mr. Tivu Mark
Chief Finance Officer Mr. Okecha Linus
Chairperson District Service Commission Mr. Apecu Alex
Chairperson Public Accounts Committee Mr. Yashin Shaban
Chairperson District Land Board Mr. Ongu Nestore Adaba Torach
District Production Officer Dr. Okwir Anthony
District Health Officer Dr. Oryema Lakor
District Education Officer Mr. Okila Geoffrey
District Engineer Mr. Mavenjina Jimmy
District Natural resources Officer Miss. Faucan Doreen
District Community Development Officer Mr. Amule Julius
District Information Officer Mr. Odia Godfrey
District Planner Mr. Olley Ben Robinson
District Internal Auditor Mr. Uroma Alex
Source: District Council Minutes (2012-2013).
Local Government Councils’ Performance and Public Service Delivery in Uganda: Nebbi District Council Score-Card Report 2012/134 Local Government Councils’ Performance and Public Service Delivery in Uganda: Nebbi District Council Score-Card Report 2012/13
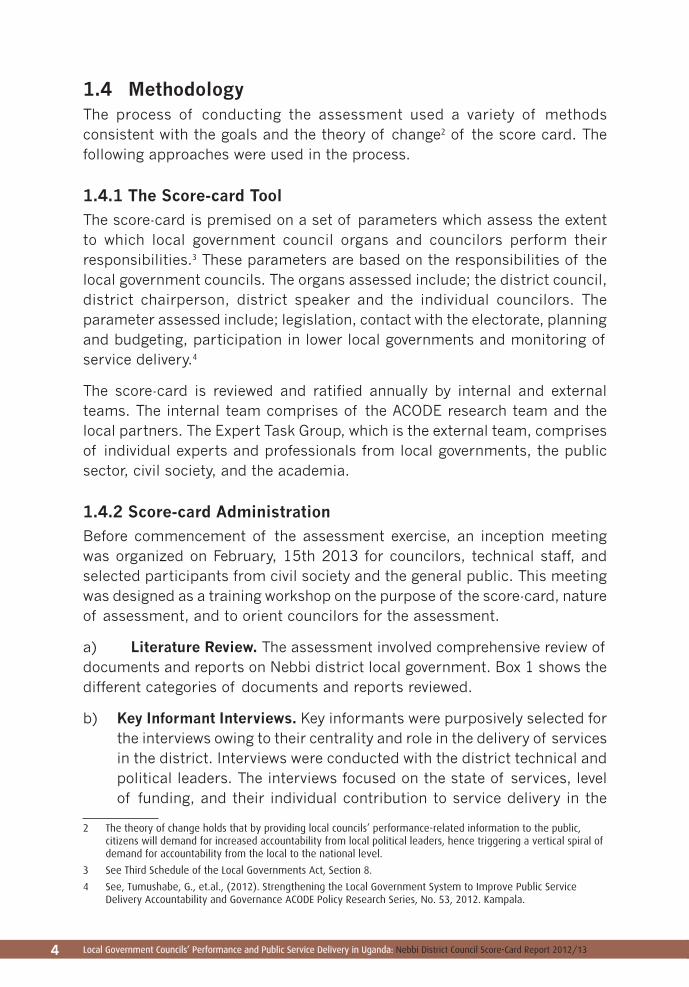
1.4 MethodologyThe process of conducting the assessment used a variety of methods consistent with the goals and the theory of change2 of the score card. The following approaches were used in the process.
1.4.1 The Score-card ToolThe score-card is premised on a set of parameters which assess the extent to which local government council organs and councilors perform their responsibilities.3 These parameters are based on the responsibilities of the local government councils. The organs assessed include; the district council, district chairperson, district speaker and the individual councilors. The parameter assessed include; legislation, contact with the electorate, planning and budgeting, participation in lower local governments and monitoring of service delivery.4
The score-card is reviewed and ratified annually by internal and external teams. The internal team comprises of the ACODE research team and the local partners. The Expert Task Group, which is the external team, comprises of individual experts and professionals from local governments, the public sector, civil society, and the academia.
1.4.2 Score-card AdministrationBefore commencement of the assessment exercise, an inception meeting was organized on February, 15th 2013 for councilors, technical staff, and selected participants from civil society and the general public. This meeting was designed as a training workshop on the purpose of the score-card, nature of assessment, and to orient councilors for the assessment.
a) Literature Review. The assessment involved comprehensive review of documents and reports on Nebbi district local government. Box 1 shows the different categories of documents and reports reviewed.
b) Key Informant Interviews. Key informants were purposively selected for the interviews owing to their centrality and role in the delivery of services in the district. Interviews were conducted with the district technical and political leaders. The interviews focused on the state of services, level of funding, and their individual contribution to service delivery in the
2 The theory of change holds that by providing local councils’ performance-related information to the public, citizens will demand for increased accountability from local political leaders, hence triggering a vertical spiral of demand for accountability from the local to the national level.
3 See Third Schedule of the Local Governments Act, Section 8.
4 See, Tumushabe, G., et.al., (2012). Strengthening the Local Government System to Improve Public Service Delivery Accountability and Governance ACODE Policy Research Series, No. 53, 2012. Kampala.
Local Government Councils’ Performance and Public Service Delivery in Uganda: Nebbi District Council Score-Card Report 2012/13 5
district. For the political leaders, these interviews are the first point of contact with the researchers and they generate assessment values that feed into the score card. They also offer an opportunity for civic education on roles and responsibilities of political leaders. Interviews with the technical leaders provide an independent voice and an opportunity to verify information.
c) Focus Group Discussions (FGDs). Focus Group Discussions (FGDs) were conducted based on the criteria set in the scorecard FGD guide. A total of 28 FGDs were organized in 14 sub-counties in the district.FGDs were platforms for civic education and empowerment about the roles of councilors and other political leaders. They were mainly organized to enable voters verify informationprovided by their respective councilors. In total, 320 people participated in the FGDs where 115 were women and 205 were men.
d) Service Delivery Unit Visits. Field visits to Service Delivery Units (SDUs) were undertaken in each sub-county by the research team. In each sub-county, visits were made to primary schools, health centers, water source points, demonstration sites, FAL centers, and roads. Field visits were mainly observatory, and where possible, interviews were conducted with the personnel at the SDUs. These visits were also meant to verify the accuracy of the information provided by the political leaders.
Box 1: Categories of Official District Documents used in the Assessment
Planning Documents
• NebbiDistrictDevelopmentPlan(DDP)2010/11-2014/15
• NebbiDistrictLocalGovernmentRevenueEnhancementPlan
• NebbiDistrictapprovedCapacityBuildingPlan
Budgeting Documents
• BudgetFrameWorkPaperFY2012/2013
• ApprovedBudgetFY2012/2013
• BudgetSpeech2012/2013
Reports
• QuarterlymonitoringreportsFY2012/2013
• ProductionreportsforFY2012/2013
• CommitteeReportsFY2012/2013
Minutes
• OrdinaryCouncilMinutesFY2012/2013
• StandingCommitteeMinutesFY2012/2013
• DistrictExecutiveCommitteeMinutesFY2012/2013
• BusinessCommitteeMinutesFY2012/2013
Local Government Councils’ Performance and Public Service Delivery in Uganda: Nebbi District Council Score-Card Report 2012/136 Local Government Councils’ Performance and Public Service Delivery in Uganda: Nebbi District Council Score-Card Report 2012/13
1.4.3 Data Management and AnalysisThe data collected during the assessment is both qualitative and quantitative. Qualitative data is categorized thematically for purposes of content analysis. Thematic categorization helps in the identification of the salient issues in service delivery. Quantitative data is generated through assigning values based on individual performance on given indicators. These data are used to generate frequency and correlation matrices that help make inferences and draw conclusions on individual and general performance.
Local Government Councils’ Performance and Public Service Delivery in Uganda: Nebbi District Council Score-Card Report 2012/13 7
2. BUDGET ARCHITECTURE AND SERVICE DELIVERY IN NEBBI DISTRICT
The primary function of the district council is to ensure that, the service delivery is effectively and efficiently delivered to improve on the socio-economic status of the citizens. In the event that there are challenges, council debates and deliberates with an aim to pursue options to improve service delivery. For the council to ably address this, budget is a very important tool used to make appropriate decisions on how the government policies through development initiatives can be financed and implemented. Article 190 of the Constitution of the Republic of Uganda (1995, amended) confers authority on the district council to annually prepare comprehensive plans for lower local governments and ensure that; budget execution meets the set standards as approved by the council. This section presents information on the district budget and illustration of the state of service delivery generally.
2.1 Nebbi District Budget Performance
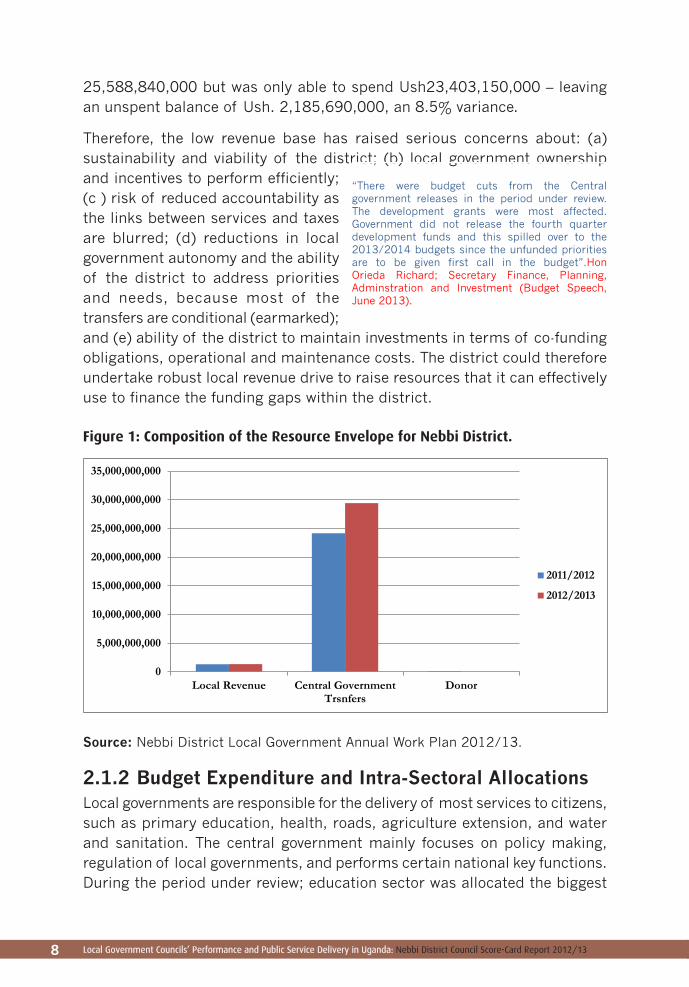
2.1.1 Nebbi District Resource EnvelopeNebbi District Local Government derives large portion of its revenue from the central government in the form of: unconditional and conditional government transfers and equalisation grants. These transfers also include grant support under PRDP; NUSAF2, and NAADS among others. The government transfers contributed to 94.4% of the overall budget, locally generated revenue contributed 5.2% and donor funds accounted for 0.4%. During the financial year; there were efforts to improve local revenue generation including: intensification of revenue mobilization and enforcement by the district council; regulation of market reserved prices, among others. It is important to assert that; the over reliance of the district on the central government for the bulk of its budget financing still remains conditional with tight guidelines giving the district council minimal flexibility reallocate this funds to other local priorities.
There were reported delays in remittances and this affected absorption rate and service delivery. For instance; during the FY 2011/2012 the district Ush
Local Government Councils’ Performance and Public Service Delivery in Uganda: Nebbi District Council Score-Card Report 2012/138 Local Government Councils’ Performance and Public Service Delivery in Uganda: Nebbi District Council Score-Card Report 2012/13
25,588,840,000 but was only able to spend Ush23,403,150,000 – leaving an unspent balance of Ush. 2,185,690,000, an 8.5% variance.
Therefore, the low revenue base has raised serious concerns about: (a) sustainability and viability of the district; (b) local government ownership and incentives to perform efficiently; (c ) risk of reduced accountability as the links between services and taxes are blurred; (d) reductions in local government autonomy and the ability of the district to address priorities and needs, because most of the transfers are conditional (earmarked); and (e) ability of the district to maintain investments in terms of co-funding obligations, operational and maintenance costs. The district could therefore undertake robust local revenue drive to raise resources that it can effectively use to finance the funding gaps within the district.
Figure 1: Composition of the Resource Envelope for Nebbi District.
Source: Nebbi District Local Government Annual Work Plan 2012/13.
2.1.2 Budget Expenditure and Intra-Sectoral AllocationsLocal governments are responsible for the delivery of most services to citizens, such as primary education, health, roads, agriculture extension, and water and sanitation. The central government mainly focuses on policy making, regulation of local governments, and performs certain national key functions. During the period under review; education sector was allocated the biggest
“There were budget cuts from the Central government releases in the period under review. The development grants were most affected. Government did not release the fourth quarter development funds and this spilled over to the 2013/2014 budgets since the unfunded priorities are to be given first call in the budget”.Hon Orieda Richard; Secretary Finance, Planning, Adminstration and Investment (Budget Speech, June 2013).
0
5,000,000,000
10,000,000,000
15,000,000,000
20,000,000,000
25,000,000,000
30,000,000,000
35,000,000,000
Local Revenue Central GovernmentTrsnfers
Donor
2011/2012
2012/2013
Local Government Councils’ Performance and Public Service Delivery in Uganda: Nebbi District Council Score-Card Report 2012/13 9
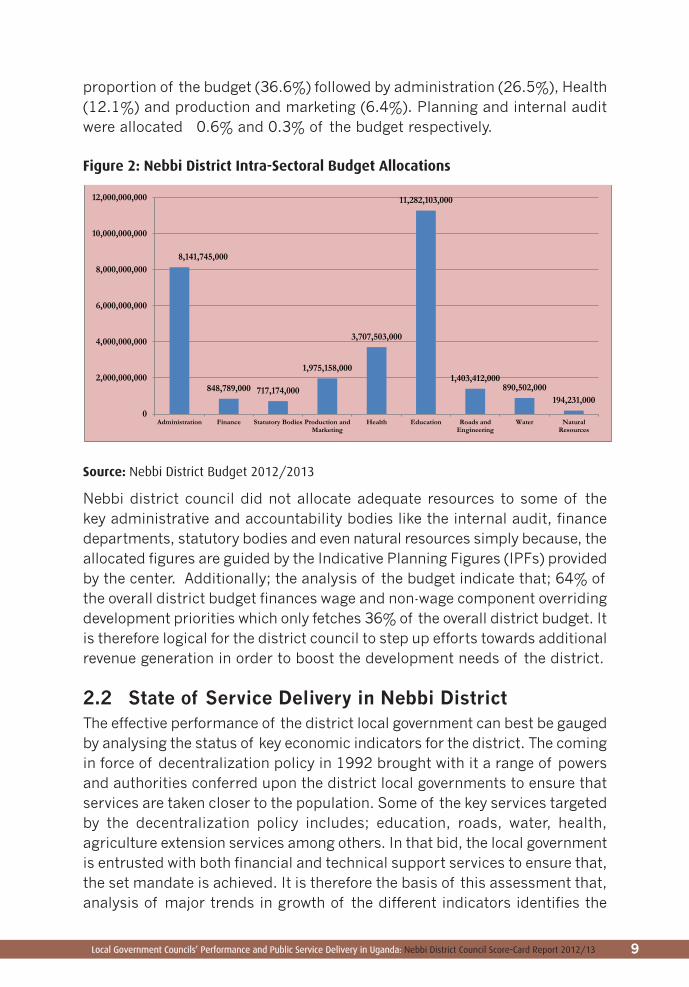
proportion of the budget (36.6%) followed by administration (26.5%), Health (12.1%) and production and marketing (6.4%). Planning and internal audit were allocated 0.6% and 0.3% of the budget respectively.
Figure 2: Nebbi District Intra-Sectoral Budget Allocations
Source: Nebbi District Budget 2012/2013
Nebbi district council did not allocate adequate resources to some of the key administrative and accountability bodies like the internal audit, finance departments, statutory bodies and even natural resources simply because, the allocated figures are guided by the Indicative Planning Figures (IPFs) provided by the center. Additionally; the analysis of the budget indicate that; 64% of the overall district budget finances wage and non-wage component overriding development priorities which only fetches 36% of the overall district budget. It is therefore logical for the district council to step up efforts towards additional revenue generation in order to boost the development needs of the district.
2.2 State of Service Delivery in Nebbi DistrictThe effective performance of the district local government can best be gauged by analysing the status of key economic indicators for the district. The coming in force of decentralization policy in 1992 brought with it a range of powers and authorities conferred upon the district local governments to ensure that services are taken closer to the population. Some of the key services targeted by the decentralization policy includes; education, roads, water, health, agriculture extension services among others. In that bid, the local government is entrusted with both financial and technical support services to ensure that, the set mandate is achieved. It is therefore the basis of this assessment that, analysis of major trends in growth of the different indicators identifies the
8,141,745,000
848,789,000 717,174,000
1,975,158,000
3,707,503,000
11,282,103,000
1,403,412,000 890,502,000
194,231,000 0
2,000,000,000
4,000,000,000
6,000,000,000
8,000,000,000
10,000,000,000
12,000,000,000
Administration Finance Statutory Bodies Production andMarketing
Health Education Roads andEngineering
Water NaturalResources

Local Government Councils’ Performance and Public Service Delivery in Uganda: Nebbi District Council Score-Card Report 2012/1310 Local Government Councils’ Performance and Public Service Delivery in Uganda: Nebbi District Council Score-Card Report 2012/13
service gaps and proposed remedies developed for the common good of the citizens. The section also draws analysis of the actions and inactions of the district council and its respective organs in addressing the dare needs of the people and deficiency in service delivery in the district. Comparison compares the changes in indicators over the years. Table 3 shows the service delivery indicators for the different sectors.
Table 3: Service Delivery Indicators in Nebbi District
Sect
or
Indicators
National
standard/ NDP
target
Level of
achievement
2011/12
District Target
2012/13
Level of achievement
2012/13
Educ
atio
n -
Pri
mar
y Ed
ucat
ion
Children of primary school-going age
(6-12)-
Enrolment - 99,125 No target 111,125
Pupil Classroom Ratio (PCR) 55:1 80:1 No target 70:1
Pupil Teacher Ratio (PTR) 55:1 57:1 No target 57:1
Pupil to Desk Ratio (PDR) 3:1 6:1 No target 6:1
PLE Performance -
Div I- 1.6%
Div II-37.6%
Div III- 30.2%
Div IV-15.1%
Div U-9.6%
Div X-5.0%
No target
Div I- 2.2%
Div II-45.7%
Div III- 28.6%
Div IV-15.4%
Div U-8.2%
Div X-4.7%
Hea
lth
Car
e se
rvic
es
ANC 4th Visit 60% 34.3% No target 34%
Deliveries in Health Centres 35% 56.6% No target 59.7%
Total beds - 782 No target 768
Access to Maternity services - 56.6%
MMR 506
IMR 87%
Staffing Levels - 46% 61%
Staffing Levels - 44%
Roa
d Su
b-se
ctor
Km of roads under routine maintenance -
Km of roads rehabilitated -
Km of roads under periodic maintenance
Proportion of roads in good condition
Construction of bridges -
Opening up new community roads -

Local Government Councils’ Performance and Public Service Delivery in Uganda: Nebbi District Council Score-Card Report 2012/13 11
Wat
er a
nd
San
itat
ion
Water coverage 74% No Target 76%
Number of boreholes sunk - 12 No Target 16
Number of boreholes rehabilitated - 9 No Target 19
Functionality of water sources 80% 57% No Target 75%
Proportion of the population within 1km
Pit latrine coverage 90% 84.5% No Target 74.8%
Agr
icul
ture
Number of extension workers per S/
county - 2.2 2.5
Number of service points - 2,717 1,379
Number of demonstration farms - 118 86
Technical back-up visits - 120 98
Number of NAADS beneficiaries 2,606
Number of demonstration farmers
FAL
Number of instructors
Number of participants
Number of service centres -
Level of coverage -
Envi
ron
men
t an
d N
atur
al R
esou
rces
Staffing Level 2
Conduct Environmental monitoring and
assessment- 8 15 8
Production and update District State of
the Environment Report (DSOER)- 1 ( p r o d u c e d 1 1 (produced annually)
District Environment Action Plan - 1 1 1
Preparation of District Wetland - 1 (in progress) 1 1 (in progress)
Monitor wetland systems in the district - 3 5 Compliance
Establishment of Agro-forestry nurseries 35 44
District Wetland Action Plan - Not done
Ordinance on Environmental Conservation No target Nothing done
Source: District’s Departmental Reports (2012-2013).
2.2.1 Primary Education ServicesNebbi district has a total of 193 primary schools (153, government, 15 non-formal and 27 community schools). The district education performance level is low compared to the national standards. For instance, during the year under review, total enrolment was at 114,478 with 1818 teachers. This implies that the average Teacher-Pupil Ratio was 1:63. The PTR progressively reduces in upper classes since the completion rate for the pupils continue to reduce considerably. Concerning PLE performance, 89% of the pupils who sat for PLE in 2012 passed with only 2.2% in first grade. With regard to infrastructure
Local Government Councils’ Performance and Public Service Delivery in Uganda: Nebbi District Council Score-Card Report 2012/1312 Local Government Councils’ Performance and Public Service Delivery in Uganda: Nebbi District Council Score-Card Report 2012/13
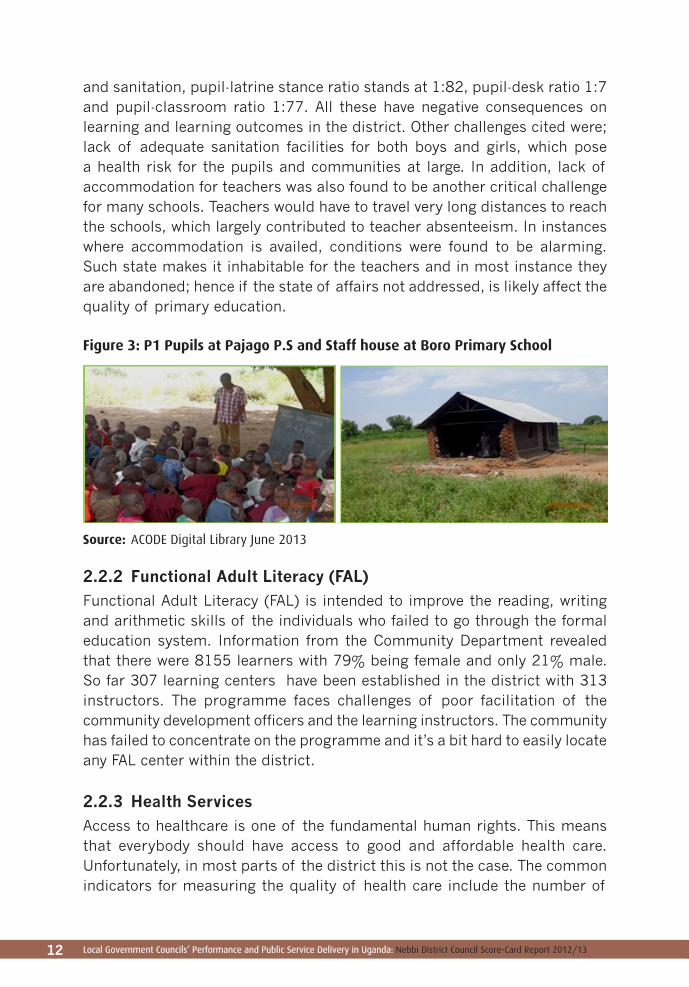
and sanitation, pupil-latrine stance ratio stands at 1:82, pupil-desk ratio 1:7 and pupil-classroom ratio 1:77. All these have negative consequences on learning and learning outcomes in the district. Other challenges cited were; lack of adequate sanitation facilities for both boys and girls, which pose a health risk for the pupils and communities at large. In addition, lack of accommodation for teachers was also found to be another critical challenge for many schools. Teachers would have to travel very long distances to reach the schools, which largely contributed to teacher absenteeism. In instances where accommodation is availed, conditions were found to be alarming. Such state makes it inhabitable for the teachers and in most instance they are abandoned; hence if the state of affairs not addressed, is likely affect the quality of primary education.
Figure 3: P1 Pupils at Pajago P.S and Staff house at Boro Primary School
Source: ACODE Digital Library June 2013
2.2.2 Functional Adult Literacy (FAL)Functional Adult Literacy (FAL) is intended to improve the reading, writing and arithmetic skills of the individuals who failed to go through the formal education system. Information from the Community Department revealed that there were 8155 learners with 79% being female and only 21% male. So far 307 learning centers have been established in the district with 313 instructors. The programme faces challenges of poor facilitation of the community development officers and the learning instructors. The community has failed to concentrate on the programme and it’s a bit hard to easily locate any FAL center within the district.
2.2.3 Health ServicesAccess to healthcare is one of the fundamental human rights. This means that everybody should have access to good and affordable health care. Unfortunately, in most parts of the district this is not the case. The common indicators for measuring the quality of health care include the number of
Local Government Councils’ Performance and Public Service Delivery in Uganda: Nebbi District Council Score-Card Report 2012/13 13
health facilities,5 immunization rates, and health unit utilization. Millennium Development Goals 4, 5 and 6 target considerable reduction of child-mortality, maternal mortality and HIV/AIDS, malaria and other major diseases. Nebbi district currently has 42 health units spread all over the two health sub districts of Jonam and Padyere. All the health units were reported to be operational. On immunization, the district has been recording a declining trend due to inadequacy of vaccine, for instance, DPT 3 declined from 103% in 2009/2010 to 90% in 2011/2012. Levels of mothers delivering at health units were reported at 60.4%. It was noted that deliveries of EMHS by National Medical Stores (NMS) has improved but the quantities remained inadequate leading to stock out in the health centers with bigger catchment areas. Other challenges included late opening and early closings of health units, especially health center IIs, and shortages of medical staff (for instances, most health center IIs).
2.2.4 AgricultureAgriculture remains the major source of livelihood in the district with over 87% involved in the sector. It is the major determinant of economic wellbeing of the people in the district. Main food crops grown in Nebbi include; cassava, maize, simsim, sorghum, banana, beans, sunflowers, and groundnuts. The major cash crop is cotton. Rearing of animals and small ruminants also takes place on subsistent basis. The National Agricultural Advisory Services (NAADS) has been at the centre of transformation of agriculture in the district. Therefore, the majority of farmers are accessing agricultural extension services through the NAADS programme. Farmers are progressively recognizing the contribution of NAADS in the district. However, this has had it’s a number of challenges that NAADS has faced. These included: abrupt government policy changes and directives; budget cuts to the programme affecting operational efficiency, weather changes as a result of too much rain or lack of it, co-funding challenges on the side of the farmers, and minimal efforts by the farmers in promoting the selected enterprises.
2.2.5 Roads Sub-sector Roads are a critical component of the district’s transportation infrastructure. The maintenance and rehabilitation of district roads ensures that the movement of people, as well as goods and services, continues effectively and efficiently. Nebbi district currently maintains a total road network of 888.7 km under routine and periodic maintenance. A total of 370.5 Km is District Roads, 108 Km are urban roads (Town Council – Pakwach and Nebbi) while 410.2
5 Health policy requires for every district to establish Health center I at village level, Health center II at every parish, Health center III in every sub-county, Health center IV at county level and district hospitals at the district.
Local Government Councils’ Performance and Public Service Delivery in Uganda: Nebbi District Council Score-Card Report 2012/1314 Local Government Councils’ Performance and Public Service Delivery in Uganda: Nebbi District Council Score-Card Report 2012/13
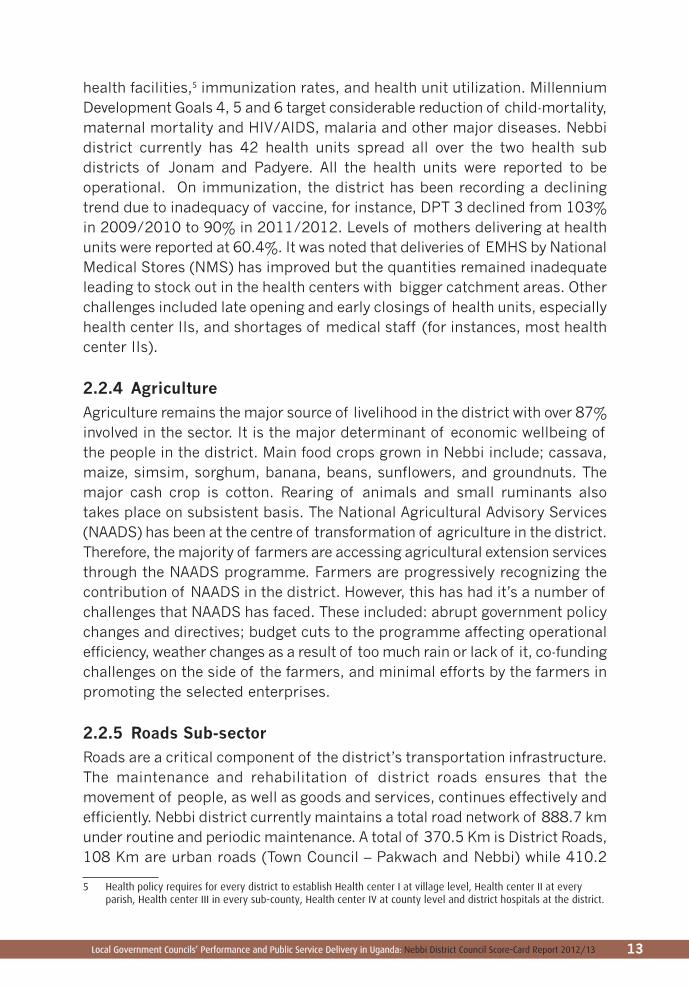
Km are Community Access Roads (CAR) in 13 sub counties. During the year under review the district roads were in a deplorable state and most networks were either closed or inaccessible due to inadequate routine maintenance and the impact of heavy rain during the year. This severely affected trading and agricultural activities in the district. There were cases where bridges were over flooded. A case in point was a bridge on Oraa river in Wadelai sub-county. Though there were efforts by the district to upgrade and maintain the roads, the heavy downpour during the year destroyed most of the roads that were worked on. For example, Panyimur-Akworo-Parombo road, Parombo-Nyaravur road, Akaba-Kucwiny-Wadelai road, Acwera-Atego-Ndhew-Erussi road, Nebbi-Ndhew-Eruss road, and Omyer-Kalwang road were among those roads heavily affected by the rains and rendered impassible. Some of these roads have developed gallows, and some have become bushy and narrow.
Figure 4: Nearly impassable road to Acayo Primary School and Akaba-Kucwiny-Wadelai road (Right)
Source: ACODE Digital Library, October 2013
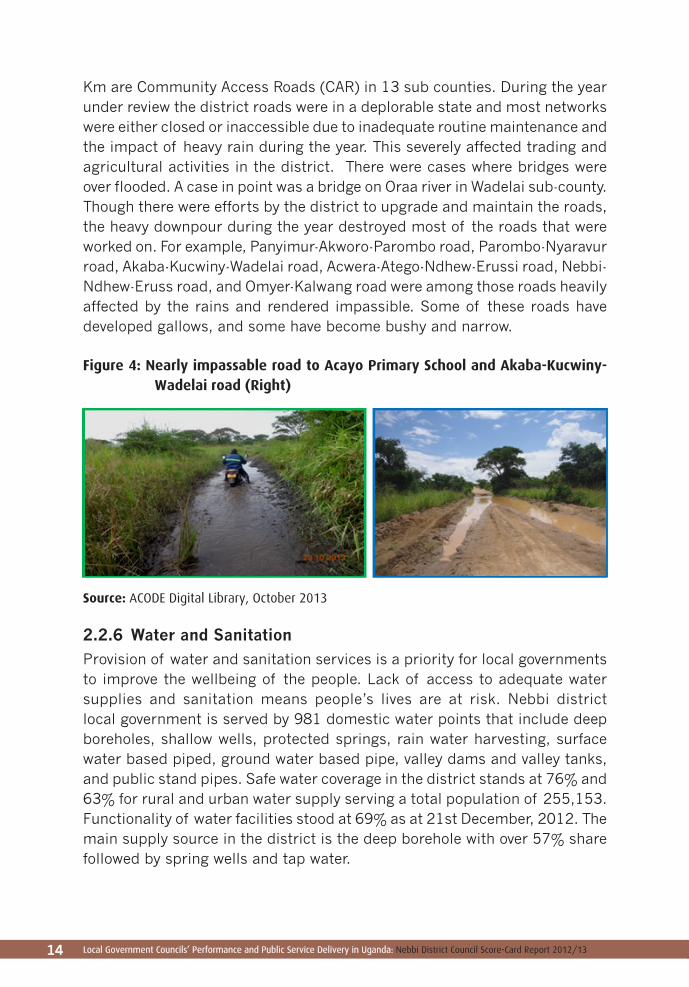
2.2.6 Water and Sanitation Provision of water and sanitation services is a priority for local governments to improve the wellbeing of the people. Lack of access to adequate water supplies and sanitation means people’s lives are at risk. Nebbi district local government is served by 981 domestic water points that include deep boreholes, shallow wells, protected springs, rain water harvesting, surface water based piped, ground water based pipe, valley dams and valley tanks, and public stand pipes. Safe water coverage in the district stands at 76% and 63% for rural and urban water supply serving a total population of 255,153. Functionality of water facilities stood at 69% as at 21st December, 2012. The main supply source in the district is the deep borehole with over 57% share followed by spring wells and tap water.

Local Government Councils’ Performance and Public Service Delivery in Uganda: Nebbi District Council Score-Card Report 2012/13 15
The water sector in Nebbi has continued to be confronted by challenges of scanty aquifers, especially in Alwi water-stressed corridor, high salinity and iron content along the Nile Valley, as well as low hygiene and sanitation standards resulting in water borne diseases such as cholera, which are rampant in Panimur, Akworo, Parombo during rainy seasons. Also reported were; unreliable tap water supply in Pakwach and Nebbi town councils and yet these areas are not fully covered by boreholes. There were also reports of unreliable water supply in the areas of Abindu, Pubithi, Namrwotho in Nebbi town council and Amor, Puvungu, Mubogo in Pakwach town council.
Figure 5: Water Jerricans lined-up at a water point in Pakwach sub-county
Source: ACODE Digital Library, September 2013
2.2.7 Environment and Natural ResourcesNebbi district is endowed with Albert and River Nile that breed a wide range of fish species and other aquatic animals. In addition, Namrwotho River also offers opportunities for hydro-electricity power generation. There are also vast mineral deposits like oil and petroleum resources, gold and diatomite. Meanwhile, there also exists a wide range of forest resources which provide opportunity for timber industry. The presence of these resources notwithstanding, there are overarching challenges such as the limited budget for the ENR sector. The annual budget cut in environment from 1.4% during the previous year (2011/2012) to seemingly 0.6% in the current year (2012/2013) poses a threat to the sector viability. Addressing teething challenges of encroachment, bush burning, among others becomes a challenge to the department. There is also a need to stem up an awareness campaign on environmental resource management to the general public given the various environmental risks activities taking place within the district including the oil mineral exploration activities along the Albert Nile and River Nile waters.
Local Government Councils’ Performance and Public Service Delivery in Uganda: Nebbi District Council Score-Card Report 2012/1316 Local Government Councils’ Performance and Public Service Delivery in Uganda: Nebbi District Council Score-Card Report 2012/13
3. THE SCORE-CARD FINDINGS AND INTERPRETATION
The district local government council and the sub-county council are established as corporate legal entities under the Local Government Act. At their respective levels, the councils are vested with powers and responsibilities to (i) enact local laws necessary for the effective governance of the areas within their jurisdiction; (ii) ensure accountability and transparency in the conduct of council business and utilization of council funds; (iii) ensure effective planning and budgeting to spur development and the delivery of public services to the local population; and (iv) monitor the delivery of public service on priority national programme. The parameters in the score-card are based on these key responsibilities of the local government councils and assesses the political organs which includes; the district chairperson, the district speaker, the district council and the individual district councilors. The Ministry of Local Government annually conducts the Annual Assessment of Minimum Conditions and Performance Measures for Local Governments. This assessment targets technical staff in district departments. LGCSCI complements this by assessing performance of District Council which is the political arm of the district.
3.1 Performance of the District Council The Local Government Council is the highest authority within local government with political, legislative, administrative and executive powers. The score-card for the council is derived from the functions of the local government councils as stipulated under the Local Government Act. The assessment of the local government councils is aimed at establishing the extent to which a council uses its political, legislative, administrative and planning powers to address the issues that affect the electorate within its jurisdiction. The council is the platforms where councilors are supposed to debate and pass appropriate decisions that addresses development needs of the district, and the citizens in particular.
Local Government Councils’ Performance and Public Service Delivery in Uganda: Nebbi District Council Score-Card Report 2012/13 17
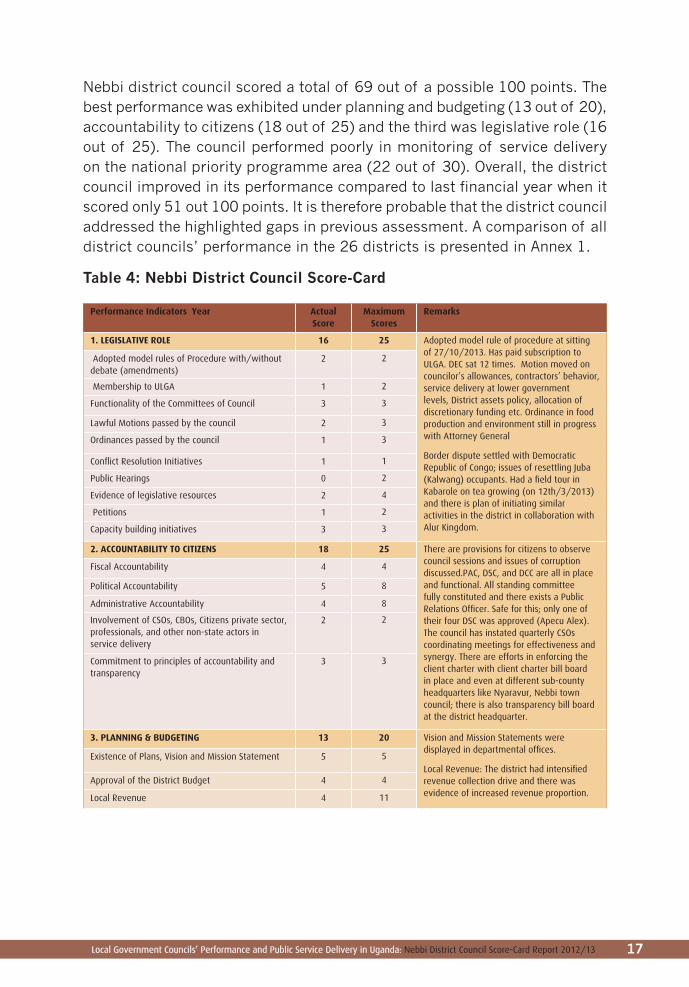
Nebbi district council scored a total of 69 out of a possible 100 points. The best performance was exhibited under planning and budgeting (13 out of 20), accountability to citizens (18 out of 25) and the third was legislative role (16 out of 25). The council performed poorly in monitoring of service delivery on the national priority programme area (22 out of 30). Overall, the district council improved in its performance compared to last financial year when it scored only 51 out 100 points. It is therefore probable that the district council addressed the highlighted gaps in previous assessment. A comparison of all district councils’ performance in the 26 districts is presented in Annex 1.
Table 4: Nebbi District Council Score-Card
Performance Indicators Year Actual Score
Maximum Scores
Remarks
1. LEGISLATIVE ROLE 16 25 Adopted model rule of procedure at sitting of 27/10/2013. Has paid subscription to ULGA. DEC sat 12 times. Motion moved on councilor’s allowances, contractors’ behavior, service delivery at lower government levels, District assets policy, allocation of discretionary funding etc. Ordinance in food production and environment still in progress with Attorney General
Border dispute settled with Democratic Republic of Congo; issues of resettling Juba (Kalwang) occupants. Had a field tour in Kabarole on tea growing (on 12th/3/2013) and there is plan of initiating similar activities in the district in collaboration with Alur Kingdom.
Adopted model rules of Procedure with/without debate (amendments)
2 2
Membership to ULGA 1 2
Functionality of the Committees of Council 3 3
Lawful Motions passed by the council 2 3
Ordinances passed by the council 1 3
Conflict Resolution Initiatives 1 1
Public Hearings 0 2
Evidence of legislative resources 2 4
Petitions 1 2
Capacity building initiatives 3 3
2. ACCOUNTABILITY TO CITIZENS 18 25 There are provisions for citizens to observe council sessions and issues of corruption discussed.PAC, DSC, and DCC are all in place and functional. All standing committee fully constituted and there exists a Public Relations Officer. Safe for this; only one of their four DSC was approved (Apecu Alex). The council has instated quarterly CSOs coordinating meetings for effectiveness and synergy. There are efforts in enforcing the client charter with client charter bill board in place and even at different sub-county headquarters like Nyaravur, Nebbi town council; there is also transparency bill board at the district headquarter.
Fiscal Accountability 4 4
Political Accountability 5 8
Administrative Accountability 4 8
Involvement of CSOs, CBOs, Citizens private sector, professionals, and other non-state actors in service delivery
2 2
Commitment to principles of accountability and transparency
3 3
3. PLANNING & BUDGETING 13 20 Vision and Mission Statements were displayed in departmental offices.
Local Revenue: The district had intensified revenue collection drive and there was evidence of increased revenue proportion.
Existence of Plans, Vision and Mission Statement 5 5
Approval of the District Budget 4 4
Local Revenue 4 11
Local Government Councils’ Performance and Public Service Delivery in Uganda: Nebbi District Council Score-Card Report 2012/1318 Local Government Councils’ Performance and Public Service Delivery in Uganda: Nebbi District Council Score-Card Report 2012/13
4. MONITORING SERVICE DELIVERY ON NPPAs 22 30 Although most NPPAs were monitored, reports submitted and discussed in council as presented by chairperson standing committees and some actions were taken on some areas; except little attention were focused on FAL; instead more emphasis was made on SAGE.
Education 5 5
Health 5 5
Water and Sanitation 3 4
Roads 4 4
Agriculture and Extension 3 4
Functional adult Literacy 0 4
Environment and Natural Resources 2 4
TOTAL 69 100 Performance is above Average
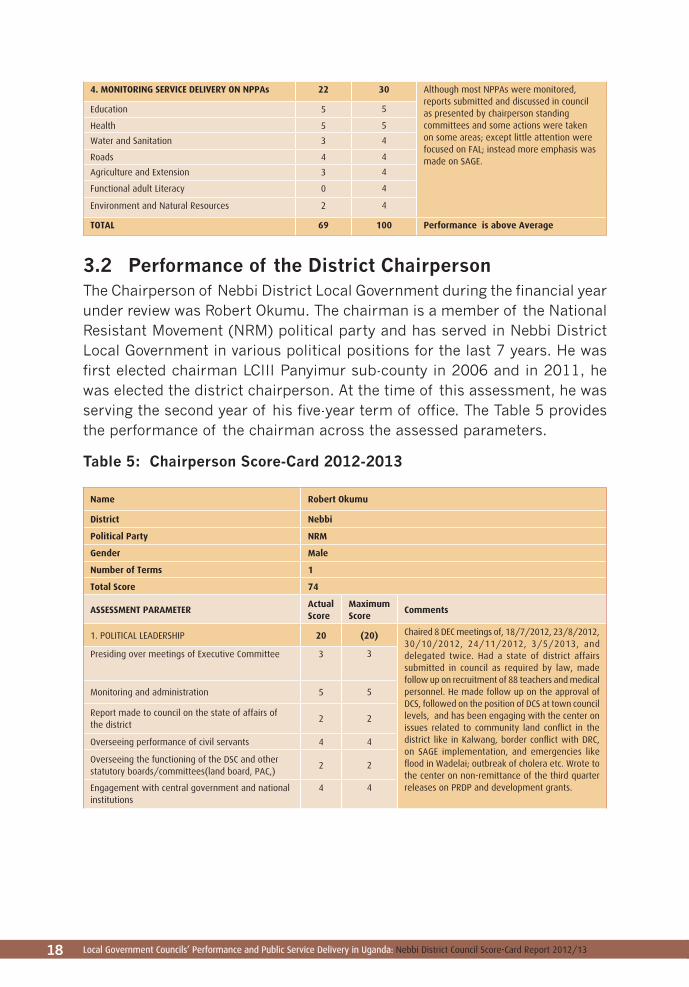
3.2 Performance of the District ChairpersonThe Chairperson of Nebbi District Local Government during the financial year under review was Robert Okumu. The chairman is a member of the National Resistant Movement (NRM) political party and has served in Nebbi District Local Government in various political positions for the last 7 years. He was first elected chairman LCIII Panyimur sub-county in 2006 and in 2011, he was elected the district chairperson. At the time of this assessment, he was serving the second year of his five-year term of office. The Table 5 provides the performance of the chairman across the assessed parameters.
Table 5: Chairperson Score-Card 2012-2013
Name Robert Okumu
District Nebbi
Political Party NRM
Gender Male
Number of Terms 1
Total Score 74
ASSESSMENT PARAMETERActual Score
Maximum Score
Comments
1. POLITICAL LEADERSHIP 20 (20) Chaired 8 DEC meetings of, 18/7/2012, 23/8/2012, 30/10/2012, 24/11/2012, 3/5/2013, and delegated twice. Had a state of district affairs submitted in council as required by law, made follow up on recruitment of 88 teachers and medical personnel. He made follow up on the approval of DCS, followed on the position of DCS at town council levels, and has been engaging with the center on issues related to community land conflict in the district like in Kalwang, border conflict with DRC, on SAGE implementation, and emergencies like flood in Wadelai; outbreak of cholera etc. Wrote to the center on non-remittance of the third quarter releases on PRDP and development grants.
Presiding over meetings of Executive Committee 3 3
Monitoring and administration 5 5
Report made to council on the state of affairs of the district
2 2
Overseeing performance of civil servants 4 4
Overseeing the functioning of the DSC and other statutory boards/committees(land board, PAC,)
2 2
Engagement with central government and national institutions
4 4
Local Government Councils’ Performance and Public Service Delivery in Uganda: Nebbi District Council Score-Card Report 2012/13 19
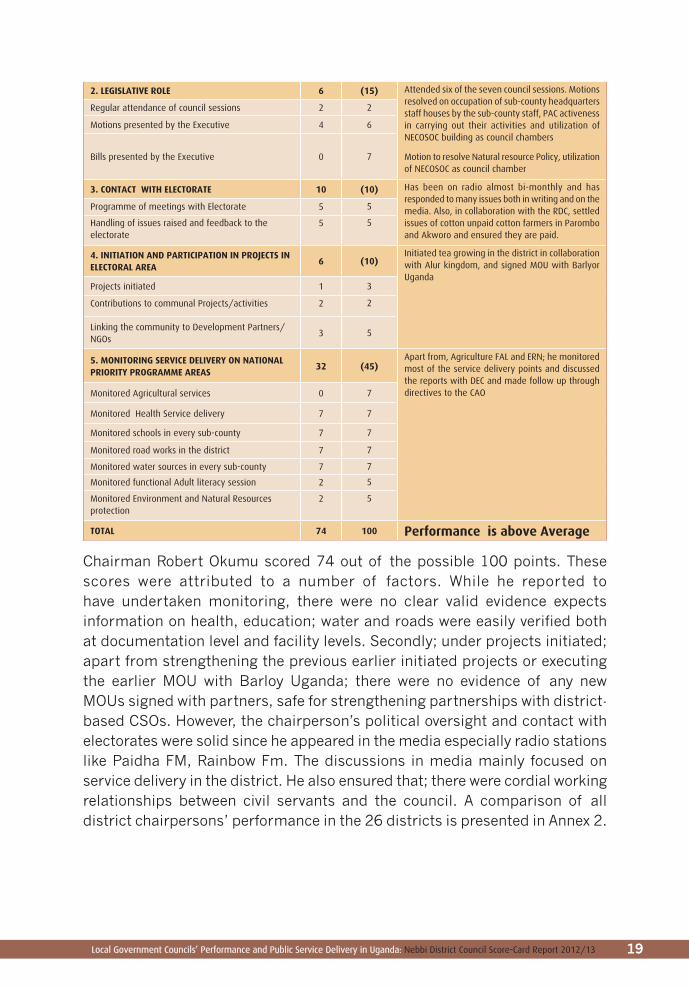
2. LEGISLATIVE ROLE 6 (15) Attended six of the seven council sessions. Motions resolved on occupation of sub-county headquarters staff houses by the sub-county staff, PAC activeness in carrying out their activities and utilization of NECOSOC building as council chambers
Motion to resolve Natural resource Policy, utilization of NECOSOC as council chamber
Regular attendance of council sessions 2 2
Motions presented by the Executive 4 6
Bills presented by the Executive 0 7
3. CONTACT WITH ELECTORATE 10 (10) Has been on radio almost bi-monthly and has responded to many issues both in writing and on the media. Also, in collaboration with the RDC, settled issues of cotton unpaid cotton farmers in Parombo and Akworo and ensured they are paid.
Programme of meetings with Electorate 5 5
Handling of issues raised and feedback to the electorate
5 5
4. INITIATION AND PARTICIPATION IN PROJECTS IN ELECTORAL AREA
6 (10)Initiated tea growing in the district in collaboration with Alur kingdom, and signed MOU with Barlyor Uganda
Projects initiated 1 3
Contributions to communal Projects/activities 2 2
Linking the community to Development Partners/NGOs
3 5
5. MONITORING SERVICE DELIVERY ON NATIONAL PRIORITY PROGRAMME AREAS
32 (45)Apart from, Agriculture FAL and ERN; he monitored most of the service delivery points and discussed the reports with DEC and made follow up through directives to the CAO Monitored Agricultural services 0 7
Monitored Health Service delivery 7 7
Monitored schools in every sub-county 7 7
Monitored road works in the district 7 7
Monitored water sources in every sub-county 7 7
Monitored functional Adult literacy session 2 5
Monitored Environment and Natural Resources protection
2 5
TOTAL 74 100 Performance is above Average
Chairman Robert Okumu scored 74 out of the possible 100 points. These scores were attributed to a number of factors. While he reported to have undertaken monitoring, there were no clear valid evidence expects information on health, education; water and roads were easily verified both at documentation level and facility levels. Secondly; under projects initiated; apart from strengthening the previous earlier initiated projects or executing the earlier MOU with Barloy Uganda; there were no evidence of any new MOUs signed with partners, safe for strengthening partnerships with district-based CSOs. However, the chairperson’s political oversight and contact with electorates were solid since he appeared in the media especially radio stations like Paidha FM, Rainbow Fm. The discussions in media mainly focused on service delivery in the district. He also ensured that; there were cordial working relationships between civil servants and the council. A comparison of all district chairpersons’ performance in the 26 districts is presented in Annex 2.

Local Government Councils’ Performance and Public Service Delivery in Uganda: Nebbi District Council Score-Card Report 2012/1320 Local Government Councils’ Performance and Public Service Delivery in Uganda: Nebbi District Council Score-Card Report 2012/13
3.3 Performance of District SpeakerThe effective functioning and output of a District Local Government Council is highly dependent on the performance of the district speaker. Hon Idda Fuambe was the speaker during the year under review. This was the fourth time the speaker is in council having served as Councillor representing Nyaravur Sub-county since 1996. Currently, the speaker represents Atego and Nyaravur sub-counties in the district council. Table 6 shows the performance of the Speaker.
Table 6: Speaker’s Performance in 2012-2013
Name Idda Fuambe Level of Education O Level
District Nebbi Gender Female
Sub County Nyaravur/Atego Number of Terms 4
Political Party NRM Total 73
ASSESSMENT PARAMETERActual Score
Maximum Score
Comments
1. PRESIDING AND PRESERVATION OF ORDER IN COUNCIL
21 (25)Chaired more than 6 council sessions, and delegated once to the vice. Meetings of 28/8/2012, 27/10/2012, 30/10/2012 22-23/1/2013 27/1/2013, 30/4/2013, and delegated 25/8/2012 to the deputy.
Adopted council rules of procedure in the council meeting of 27/Oct/2012 and the speaker had records of motions/issues presented to her office. She presided over business committee and ensured timely production of the minutes. She guided councilors on presentation of motions and how they could present and forward their motions. No evidence of written paper presented; but had formal interactions with female councilors on their roles and responsibilities since she is TOT in local governance.
She always referred to the rules of procedure during the meeting.
Chairing lawful council/ meetings 3 3
Rules of procedure 9 9
Business Committee 3 3
Records book with Issues/ petitions presented to the office
2 2
Record of motions/bills presented in council 2 3
Provided special skills/knowledge to the Council or committees.
2 5
2. CONTACT WITH ELECTORATE 18 (20) Records of letters sent to his office were filed. She has a coordinating centre at Nyaravur (Her home), with all necessary documents; assisted by her manager. She had meetings in Mbaro, Pamora upper, Paceru, Pamora lower on 22/8/2012, 3/11/2012, 22/2/2013, 5/3/2013 and 4/5/2013.
Meetings with Electorate 9 11
Office or coordinating centre in the constituency 9 9
3. PARTICIPATION IN LOWER LOCAL GOVERNMENT 10 (10)Attended all the council meetings held in Nyaravur and three in Atego. Also chaired reports with the LLGs; meetings she attended included; 30/8/2012, 4/10/2012, 23/2/2013 and 27-28/6/2013.
Attendance in sub-county Council sessions 10 10
Local Government Councils’ Performance and Public Service Delivery in Uganda: Nebbi District Council Score-Card Report 2012/13 21
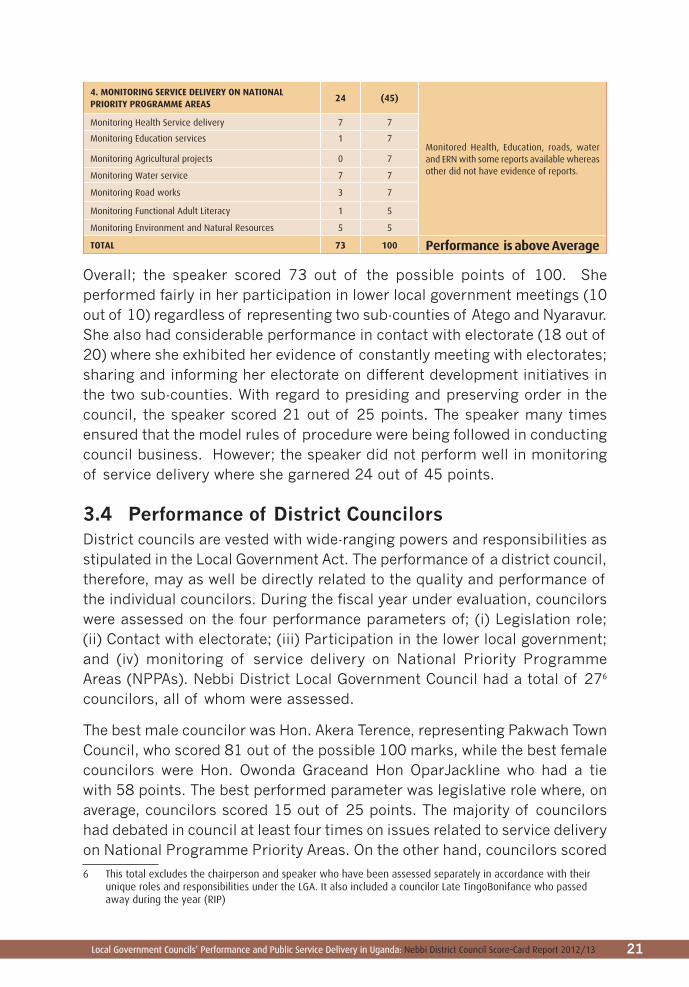
4. MONITORING SERVICE DELIVERY ON NATIONAL PRIORITY PROGRAMME AREAS
24 (45)
Monitored Health, Education, roads, water and ERN with some reports available whereas other did not have evidence of reports.
Monitoring Health Service delivery 7 7
Monitoring Education services 1 7
Monitoring Agricultural projects 0 7
Monitoring Water service 7 7
Monitoring Road works 3 7
Monitoring Functional Adult Literacy 1 5
Monitoring Environment and Natural Resources 5 5
TOTAL 73 100 Performance is above Average
Overall; the speaker scored 73 out of the possible points of 100. She performed fairly in her participation in lower local government meetings (10 out of 10) regardless of representing two sub-counties of Atego and Nyaravur. She also had considerable performance in contact with electorate (18 out of 20) where she exhibited her evidence of constantly meeting with electorates; sharing and informing her electorate on different development initiatives in the two sub-counties. With regard to presiding and preserving order in the council, the speaker scored 21 out of 25 points. The speaker many times ensured that the model rules of procedure were being followed in conducting council business. However; the speaker did not perform well in monitoring of service delivery where she garnered 24 out of 45 points.
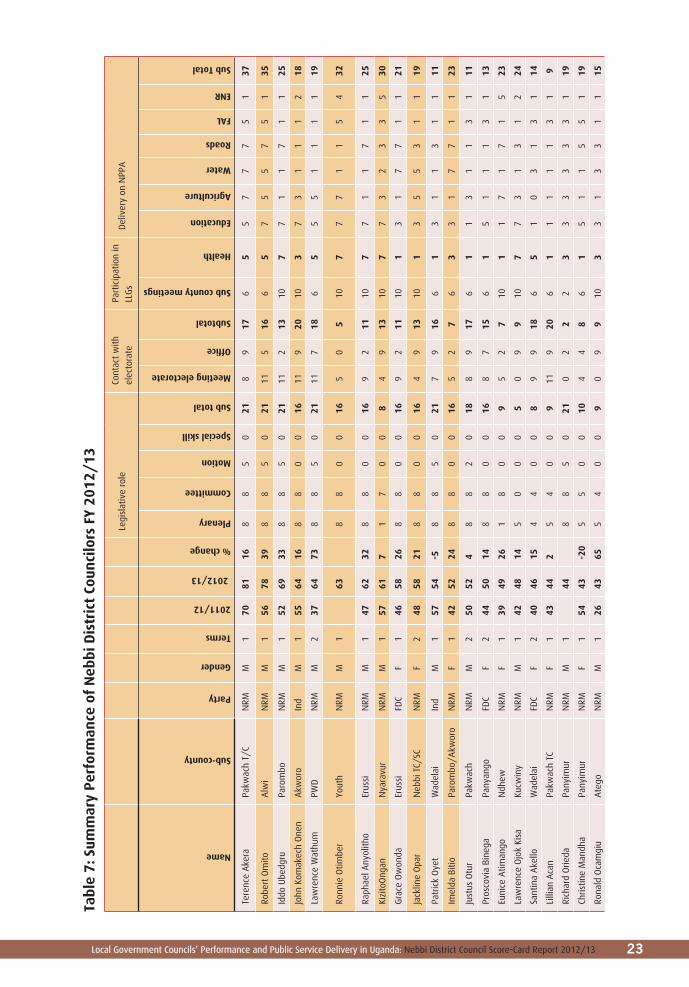
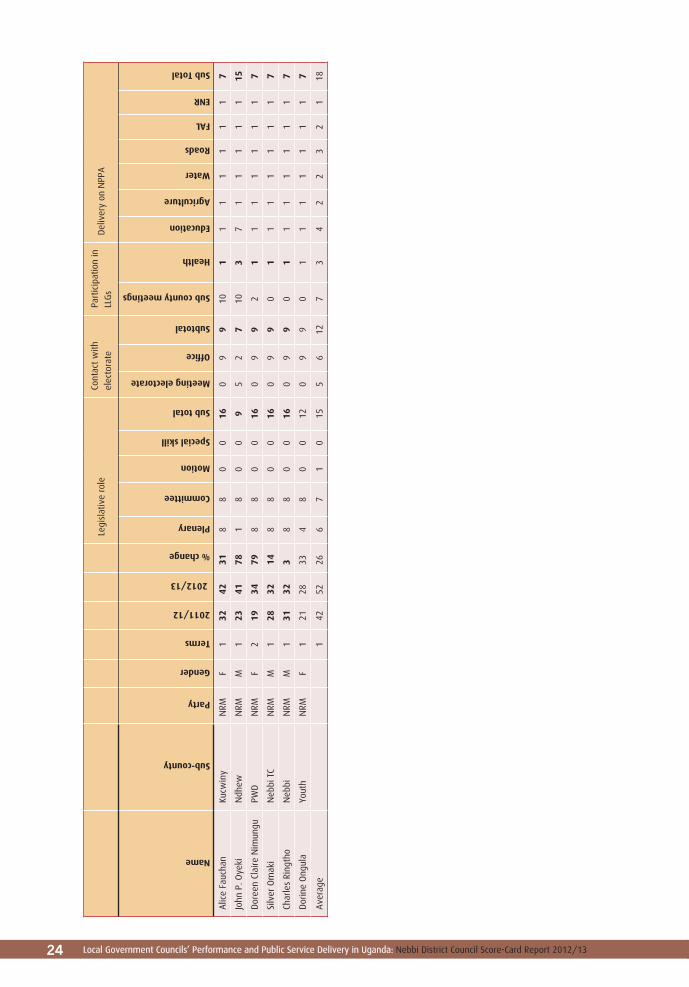
3.4 Performance of District CouncilorsDistrict councils are vested with wide-ranging powers and responsibilities as stipulated in the Local Government Act. The performance of a district council, therefore, may as well be directly related to the quality and performance of the individual councilors. During the fiscal year under evaluation, councilors were assessed on the four performance parameters of; (i) Legislation role; (ii) Contact with electorate; (iii) Participation in the lower local government; and (iv) monitoring of service delivery on National Priority Programme Areas (NPPAs). Nebbi District Local Government Council had a total of 276 councilors, all of whom were assessed.
The best male councilor was Hon. Akera Terence, representing Pakwach Town Council, who scored 81 out of the possible 100 marks, while the best female councilors were Hon. Owonda Graceand Hon OparJackline who had a tie with 58 points. The best performed parameter was legislative role where, on average, councilors scored 15 out of 25 points. The majority of councilors had debated in council at least four times on issues related to service delivery on National Programme Priority Areas. On the other hand, councilors scored
6 This total excludes the chairperson and speaker who have been assessed separately in accordance with their unique roles and responsibilities under the LGA. It also included a councilor Late TingoBonifance who passed away during the year (RIP)
Local Government Councils’ Performance and Public Service Delivery in Uganda: Nebbi District Council Score-Card Report 2012/1322 Local Government Councils’ Performance and Public Service Delivery in Uganda: Nebbi District Council Score-Card Report 2012/13
poorly on the monitoring role with an average score of 18 out of 45 possible points. The reason for this poor performance was poor record keeping and lack of evidence for monitoring of activities undertaken during the financial year. In addition, concerns relating to limited financial resources to transverse the large constituencies were reported to be a major impediment to the fulfilment of this responsibility. Table 7 provides a detailed analysis of all the assessed councilors and their performance.
Local Government Councils’ Performance and Public Service Delivery in Uganda: Nebbi District Council Score-Card Report 2012/13 23
Legi
slat
ive
role
Cont
act
with
elec
tora
te
Part
icip
atio
n in
LLG
sD
eliv
ery
on N
PPA
Name
Sub-county
Party
Gender
Terms
2011/12
2012/13
% change
Plenary
Committee
Motion
Special skill
Sub total
Meeting electorate
Office
Subtotal
Sub county meetings
Health
Education
Agriculture
Water
Roads
FAL
ENR
Sub Total
Tere
nce
Ake
raPa
kwac
h T/
CN
RMM
170
8116
88
50
218
917
65
57
77
51
37
Robe
rt O
mito
Alw
i N
RMM
156
7839
88
50
2111
516
65
75
57
51
35
Iddo
Ube
dgru
Paro
mbo
NRM
M1
5269
338
85
021
112
1310
77
11
71
125
John
Kom
akec
h O
nen
Akw
oro
Ind
M1
5564
168
80
016
119
2010
37
31
11
218
Law
renc
e W
athu
mPW
DN
RMM
237
6473
88
50
2111
718
65
55
11
11
19
Ronn
ie O
timbe
rYo
uth
NRM
M1
63
8
80
016
50
510
77
71
15
432
Raph
ael A
nyol
itho
Erus
siN
RMM
147
6232
88
00
169
211
107
71
17
11
25
Kizi
toO
ngan
Nya
ravu
rN
RMM
157
617
17
00
84
913
107
73
23
35
30
Gra
ce O
won
daEr
ussi
FDC
F1
4658
268
80
016
92
1110
13
17
71
121
Jack
line
Opa
rN
ebbi
TC/
SCN
RMF
248
5821
88
00
164
913
101
35
53
11
19
Patr
ick
Oye
tW
adel
aiIn
dM
157
54-5
88
50
217
916
61
31
13
11
11
Imel
da B
itio
Paro
mbo
/Akw
oro
NRM
F1
4252
248
80
016
52
76
33
17
71
123
Just
us O
tur
Pakw
ach
NRM
M2
5052
48
82
018
89
176
11
31
13
111
Pros
covi
a Bi
nega
Pany
ango
FDC
F2
4450
148
80
016
87
156
15
11
13
113
Euni
ce A
timan
goN
dhew
NRM
F1
3949
261
80
09
52
710
11
71
71
523
Law
renc
e O
jok
Kisa
Kucw
iny
NRM
M1
4248
145
00
05
09
910
77
31
31
224
Sant
ina
Ake
lloW
adel
aiFD
CF
240
4615
44
00
89
918
65
10
31
31
14
Lilli
an A
can
Pakw
ach
TCN
RMF
143
442
54
00
911
920
61
11
11
31
9
Rich
ard
Orie
daPa
nyim
urN
RMM
1
44
88
50
210
22
23
33
33
31
19
Chris
tine
Man
dha
Pany
imur
NRM
F1
5443
-20
55
00
104
48
61
51
15
51
19
Rona
ld O
cam
giu
Ate
goN
RMM
126
4365
54
00
90
99
103
31
33
11
15
Tabl
e 7:
Sum
mar
y P
erfo
rman
ce o
f N
ebbi
Dis
tric
t Co
unci
lors
FY
2012
/13
Local Government Councils’ Performance and Public Service Delivery in Uganda: Nebbi District Council Score-Card Report 2012/1324 Local Government Councils’ Performance and Public Service Delivery in Uganda: Nebbi District Council Score-Card Report 2012/13
Legi
slat
ive
role
Cont
act
with
elec
tora
te
Part
icip
atio
n in
LLG
sD
eliv
ery
on N
PPA
Name
Sub-county
Party
Gender
Terms
2011/12
2012/13
% change
Plenary
Committee
Motion
Special skill
Sub total
Meeting electorate
Office
Subtotal
Sub county meetings
Health
Education
Agriculture
Water
Roads
FAL
ENR
Sub Total
Alic
e Fa
ucha
nKu
cwin
yN
RMF
132
4231
88
00
160
99
101
11
11
11
7
John
P. O
yeki
Ndh
ewN
RMM
123
4178
18
00
95
27
103
71
11
11
15
Dor
een
Clai
re N
imun
guPW
DN
RMF
219
3479
88
00
160
99
21
11
11
11
7
Silv
er O
mak
iN
ebbi
TC
NRM
M1
2832
148
80
016
09
90
11
11
11
17
Char
les
Ring
tho
Neb
bi
NRM
M1
3132
38
80
016
09
90
11
11
11
17
Dor
ine
Ong
ula
Yout
hN
RMF
121
2833
48
00
120
99
01
11
11
11
7
Ave
rage
142
5226
67
10
155
612
73
42
23
21
18

Local Government Councils’ Performance and Public Service Delivery in Uganda: Nebbi District Council Score-Card Report 2012/13 25
3.5 Interpretation of ResultsThe performance of Nebbi district council and the general political leadership have a bearing on service delivery in the district. The report highlights key issues that affect the operational capacity of the district council and this is categorized as internal and external factors.
3.5.1 Internal Factors
i) Poor record keeping
Despite providing each of Nebbi District Councillors with a councillors’ dairy during the year under review, the assessment revealed poor utilization of these diaries. This was mainly attributed to councillors’ poor culture in regard to keeping records of the activities undertaken.
ii) Conflict of interest
The assessment also notices varying conflict of interest among the political and administrative leaders. This was mainly in awarding contracts where both civil servants and political leaders were reported to have peddled influence in the award of such contract without due regard to PPDA procedures and guidelines.
iii) Limited contact between Councillors and the Electorate
Citizens reported difficulty in accessing their area councillors. Some of the councillors were reported not to be staying in their electoral areas and have no contact office. This somehow widened the relationships between the citizens and the political leaders hence affecting services.
iv) Poor monitoring of service delivery
Monitoring of service delivery on national priority programme areas has continued to be a challenge for the district; and in cases where they are done, not many follow-up actions and decisions are made. The finds of the Monitoring exercises are not put to use in making appropriate decision and taking actions to address the reported challenges.
v) Delay in taking action on appointing members to the District Service Commission (DSC)
This has remained a big challenge for the district since only one out of the four nominees was approved to sit on DSC. This has affected the work of the service commission particularly in recruitment and deployment of new staff.
Local Government Councils’ Performance and Public Service Delivery in Uganda: Nebbi District Council Score-Card Report 2012/1326 Local Government Councils’ Performance and Public Service Delivery in Uganda: Nebbi District Council Score-Card Report 2012/13
3.5.2 Internal Factorsa) Over dependence on the Central Government for financing
Like most of the local governments in Uganda, Nebbi district continued to finance most of its activities with the Central Government transfers. However, considering the conditionality of the grants and unpredictable budget cuts by the center, a number of planned activities were affected through the terms of delay in implementation; or rolling of implementation of such activities to another FY. This scenario was worsened by the poor performance in generation of local revenue.
b) Staffing gap
This remains a challenge to the district both at the district and sub-county levels especially in situation where the government has put staff ceiling for the different categories of staff.
c) Delay in procurement process
Bids are usually awarded late compared to planned start and finish time. This greatly affects delivery by the contractors as well as utilisation of such services by the users. This was mainly reported in the road sub-sector.
d) Low civic awareness among citizens
For the community members to hold their leaders accountable, they ought to be knowledgeable about their roles and responsibilities. However, the citizens still have low levels of awareness about their personal roles and responsibilities and those of their leaders. This partially explains the laxity on the part of the political leaders
Local Government Councils’ Performance and Public Service Delivery in Uganda: Nebbi District Council Score-Card Report 2012/13 27
4. GENERAL CONCLUSION AND RECOMMENDATIONS
4.1 ConclusionThe findings from the district score-card (69 points) leaves a lot to be desired since a number of internal and external factors, as well as structural, policy and operational factors, impinge on the quality of services and thus explains the disconnect. While some councilors may be aware of their duties, roles, and obligations as enshrined in the Local Government Act, commitment to its implementation remain glaring. In addition, there is continued poor record keeping and documentation on the part of the political leaders, and a discernable detachment from the electorate. The assessment specifies some key recommendation that the council can take as a means of improving on the economic and political vibrancy of the district as well as its relevancy to the citizens.
4.2 Recommendations
4.2.1 Advocacy for a Changed Budget ArchitectureA critical analysis of Nebbi District Budget reveals its high dependency on the Central Government. This dependency makes the district a mere agent of the Central Government rather than a fully-fledged local government as envisaged under Article 189 of the 1995 Constitution. Nebbi district should work with other 25 districts under the scorecard to advocate for a change in the current architecture. It should as well conduct exchange visits to some of the best performing local governments like Wakiso (Central Uganda); where it can generate considerable local revenue resources which it then can allocate to sectors with little funding. Learning and experience obtained from such interactions will help the district make appropriate decision on local revenue raising for improved services.

Local Government Councils’ Performance and Public Service Delivery in Uganda: Nebbi District Council Score-Card Report 2012/1328 Local Government Councils’ Performance and Public Service Delivery in Uganda: Nebbi District Council Score-Card Report 2012/13
4.2.2AdoptMinimumEducationQualificationsforCouncil Members
Although the current legal framework does not stipulate minimum academic qualifications for council members, Nebbi District Council together with other District Local Councils can cause an amendment to the Local Government Act to require persons seeking to be members of the council to possess and present minimum qualifications suitable for a district councilor. Appropriate academic qualifications are essential in ensuring quality and vibrant debate in council and the supervision of council senior technical staff that are often educated up to a graduate level.
4.2.3 Formulation of a Comprehensive and Integrated Long-Term Development Plan
Nebbi district should be managed with a more long-term development plan of ten to fifteen years. Such a plan should be able to outlive regimes and their leaders. The current five-year plan, which is presented in form of annual work plans, does not address the strategic long-term development interests of the district. Such a plan will enable the district council to set long-term development targets and periodic performance benchmarks on the basis of which it can evaluate its performance progress.
4.2.4 Continued Orientation of the Councilors and Citizens on Their Roles
Though the orientation of councilors on their roles is carried out by the Ministry of Local Government on assumption of duties; ideally on annual basis such orientations and backstopping support are to be conducted on: the role and functions of the council in delivery of public service, the strategic focus of the district council, mechanism of accountability to the electorate. Similarly; platforms like Barazas, Intensive Dissemination and SMS Platform should be strengthened for the citizens to be able to hold the leaders accountable while also providing platform for civic awareness on their roles and obligations and the roles of the district councilors.
4.2.5 Strengthen Monitoring of Government ProgrammePolitical leaders (district chairperson and councilors) in Nebbi should strengthen their monitoring in order to ensure that the right quality and quantity of services are delivered to the electorate, because they are people’s representatives and their monitoring roles are to be taken seriously. The district council should ensure that a frame work for councilors is put in place to monitor programme inputs, as well as processes and results that are required
Local Government Councils’ Performance and Public Service Delivery in Uganda: Nebbi District Council Score-Card Report 2012/13 29
for the provision of quality services. Monitoring indicators at all these levels should be identified to guide councilors in the monitoring process.
Local Government Councils’ Performance and Public Service Delivery in Uganda: Nebbi District Council Score-Card Report 2012/1330 Local Government Councils’ Performance and Public Service Delivery in Uganda: Nebbi District Council Score-Card Report 2012/13
ReferencesNebbi District Local Government 2010/2011-2014/2015 District Development Plan
_______________(2012) Budget Framework Paper
_______________(2012) Approved District Budget
_______________(2012) Annual Work Plan
_______________(2012) District Local Government Revenue Enhancement Plan
_______________(2012) Approved District Capacity Building Plan
_______________(2012) District State of Affairs Report Nebbi District Local Government
_______________(2012) Budget Speech
_______________(2012) Minutes for Ordinary Council Meeting held on 28th August, 2012
_______________(2012) Minutes for Ordinary Council Meeting held on 27th October, 2012
_______________(2012) Minutes for Ordinary Council Meeting held on 31st October, 2012
_______________(2013) Minutes of Ordinary Council Meeting held on 22-23rd January 2013
_______________(2013) Minutes of Ordinary Council Meeting held on 27th February 2013
_______________(2013) Minutes of Ordinary Council Meeting held on 30th April 2013
_______________(2013) Minutes of Ordinary Council Meeting held on 27th June 2013
_______________(2012) Minutes of Business Committee Meeting held on 23rd August 2012
_______________(2012) Minutes of Business Committee Meeting held on 30th October 2012

Local Government Councils’ Performance and Public Service Delivery in Uganda: Nebbi District Council Score-Card Report 2012/13 31
_______________(2013) Minuets of Business Committee Meeting held on 18th January 2013
_______________(2013) Minutes of Business Committee Meeting held on 28th April 2013
_______________(2013) Minutes of Business Committee Meeting held on 24th June 2013
_______________(2012) Minutes of Finance, Planning, Administration and Investment Meeting held on 18th August 2012
_______________(2012) Minutes of Finance, Planning, Administration and Investment Meeting held on 11th October 2012
______________(2013) Minutes of Finance, Planning, Administration and Investment Meeting held on 28th March 2013
_____________(2012) Minuets of Production, Environment and Natural Resources Committee Meeting held on 10th August 2012
_____________(2012) Minutes of Production, Environment and Natural Resources Committee Meeting held 10th October 2012
_____________(2013) Minutes of Production, Environment and Natural Resources Committee Meeting held on 4th April 2013
_____________(2012) Minutes of Social Services Committee meeting held on 12th October 2012
_____________(2013) Minutes of Social Services Committee meeting held on 27th March 2013
_____________(2012) Minutes of Works and Technical Services Committee meeting held on 8th Oct 2012
____________(2012) Minutes of Works and Technical Services Committee meeting held on 17th Dec 2012
____________(2013) Minutes of Works and Technical Services Committee meeting held on 25th Mar 2013
____________Republic of Uganda (1995) Constitution of the Republic of Uganda
____________(1997) Local Governments Act 1997

Local Government Councils’ Performance and Public Service Delivery in Uganda: Nebbi District Council Score-Card Report 2012/1332 Local Government Councils’ Performance and Public Service Delivery in Uganda: Nebbi District Council Score-Card Report 2012/13
Tumushabe, G., et al (2010), Monitoring and Assessing the Performance of Local Government Councils in Uganda: Background, Methodology and Score-Card. ACODE Policy Research Series NO.42 2011, Kampala
Tumushabe, G., et al (2010), Uganda Local Government Score-card Report 2009/2010; A comparative Analysis of Findings and Recommendations for action. ACODE Policy Research Series No. 45 2011, Kampala
Tumushabe, G., et al (2012), Strengthening the Local Government System to improve public Service Delivery, Accountability and Governance. ACODE Policy Research Series, No. 53, 2012. Kampala.
Uganda Bureau of Statistics (UBOS) Report, 2011
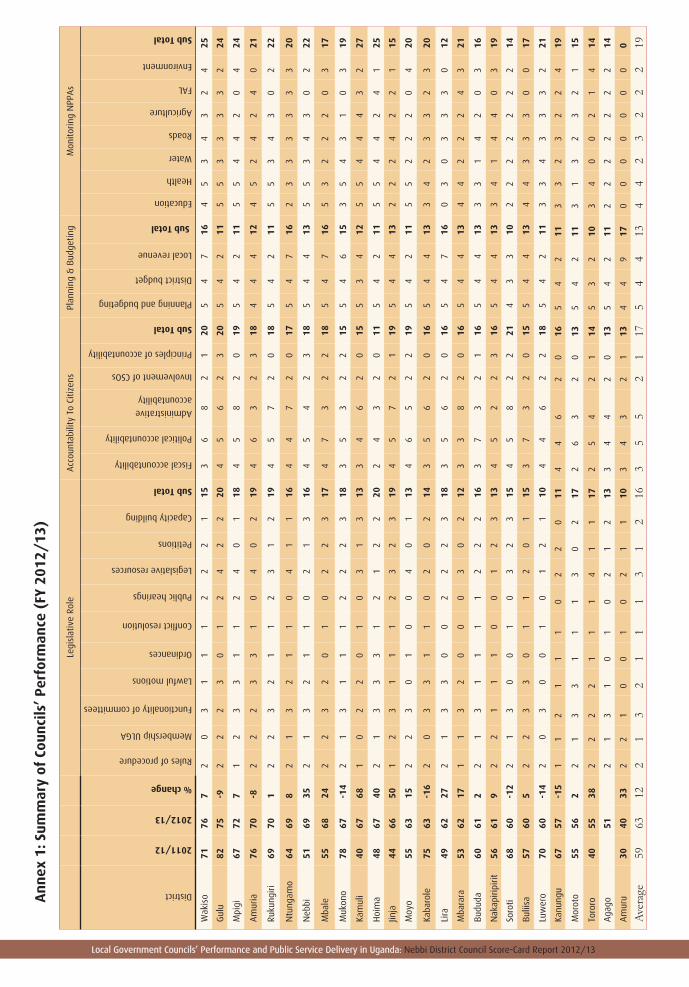
Local Government Councils’ Performance and Public Service Delivery in Uganda: Nebbi District Council Score-Card Report 2012/13
An
nex
1: S
umm
ary
of C
oun
cils
’ P
erfo
rman
ce (
FY 2
012/
13)
Legi
slat
ive
Role
Acc
ount
abili
ty T
o Ci
tizen
sPl
anni
ng &
Bud
getin
gM
onito
ring
NPP
As
District
2011/12
2012/13
% change
Rules of procedure
Membership ULGA
Functionality of committees
Lawful motions
Ordinances
Conflict resolution
Public hearings
Legislative resources
Petitions
Capacity building
Sub Total
Fiscal accountability
Political accountability
Administrative
accountability
Involvement of CSOs
Principles of accountability
Sub Total
Planning and budgeting
District budget
Local revenue
Sub Total
Education
Health
Water
Roads
Agriculture
FAL
Environment
Sub Total
Wak
iso
7176
72
03
11
12
22
115
36
82
120
54
716
45
34
32
425
Gul
u82
75-9
22
23
01
24
22
204
56
23
205
42
115
53
33
32
24
Mpi
gi67
727
12
33
11
24
01
184
58
20
195
42
115
54
42
04
24
Am
uria
7670
-82
22
33
10
40
219
46
32
318
44
412
45
24
24
021
Ruku
ngiri
6970
12
23
21
12
31
219
45
72
018
54
211
55
34
30
222
Ntu
ngam
o64
698
21
32
11
04
11
164
47
20
175
47
162
33
33
33
20
Neb
bi51
6935
21
32
11
02
13
164
54
23
185
44
135
53
43
02
22
Mba
le55
6824
22
32
01
02
23
174
73
22
185
47
165
32
22
03
17
Muk
ono
7867
-14
21
31
11
22
23
183
53
22
155
46
153
54
31
03
19
Kam
uli
4067
681
02
20
10
31
313
34
62
015
53
412
55
44
43
227
Hoi
ma
4867
402
13
33
12
12
220
24
32
011
54
211
55
44
24
125
Jinja
4466
501
23
11
12
32
319
45
72
119
54
413
22
24
22
115
Moy
o55
6315
22
30
10
04
01
134
65
22
195
42
115
52
22
04
20
Kaba
role
7563
-16
20
33
11
02
02
143
56
20
165
44
133
42
33
23
20
Lira
4962
272
13
30
02
22
318
35
62
016
54
716
03
03
33
012
Mba
rara
5362
171
13
20
00
30
212
33
82
016
54
413
44
22
24
321
Budu
da60
612
21
31
11
12
22
163
73
21
165
44
133
31
42
03
16
Nak
apir
ipiri
t56
619
22
11
10
01
23
134
52
23
165
44
133
41
44
03
19
Soro
ti68
60-1
22
13
00
10
32
315
45
82
221
43
310
22
22
22
214
Bulii
sa57
605
22
33
01
12
01
153
73
20
155
44
134
43
33
00
17
Luw
ero
7060
-14
20
30
01
01
21
104
46
22
185
42
113
34
33
32
21
Kanu
ngu
6757
-15
11
21
11
02
20
114
46
20
165
42
113
32
32
24
19
Mor
oto
5556
22
13
31
11
30
217
26
32
013
54
211
31
32
32
115
Toro
ro40
5538
22
22
11
14
11
172
54
21
145
32
103
40
02
14
14
Aga
go
51
21
31
01
02
12
133
44
20
135
42
112
22
22
22
14
Am
uru
3040
332
21
00
10
21
110
34
32
113
44
917
00
00
00
00
Aver
age
5963
122
13
21
11
31
216
35
52
117
54
413
44
23
22
219
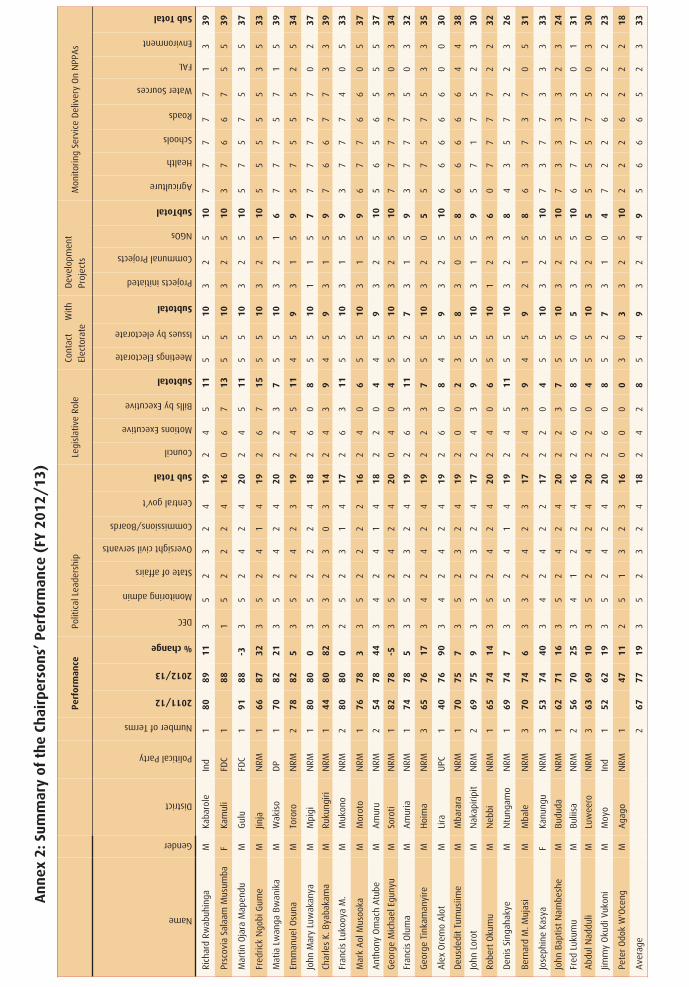
An
nex
2: S
umm
ary
of t
he
Chai
rper
son
s’ P
erfo
rman
ce (
FY 2
012/
13)
Per
form
ance
Polit
ical
Lea
ders
hip
Legi
slat
ive
Role
Cont
act
W
ith
Elec
tora
te
Dev
elop
men
t
Proj
ects
Mon
itori
ng S
ervi
ce D
eliv
ery
On
NPP
As
Name
Gender
District
Political Party
Number of Terms
2011/12
2012/13
% change
DEC
Monitoring admin
State of affairs
Oversight civil servants
Commissions/Boards
Central gov’t
Sub Total
Council
Motions Executive
Bills by Executive
Subtotal
Meetings Electorate
Issues by electorate
Subtotal
Projects initiated
Communal Projects
NGOs
SubTotal
Agriculture
Health
Schools
Roads
Water Sources
FAL
Environment
Sub Total
Rich
ard
Rwab
uhin
gaM
Kaba
role
Ind
180
8911
35
23
24
192
45
115
510
32
510
77
77
71
339
Prsc
ovia
Sal
aam
Mus
umba
FKa
mul
iFD
C1
881
52
22
416
06
713
55
103
25
103
76
67
55
39
Mar
tin O
jara
Map
endu
MG
ulu
FDC
191
88-3
35
24
24
202
45
115
510
32
510
57
57
53
537
Fred
rick
Ngo
bi G
ume
MJin
jaN
RM1
6687
323
52
41
419
26
715
55
103
25
105
55
55
35
33
Mat
ia L
wan
ga B
wan
ika
MW
akis
oD
P1
7082
213
52
42
420
22
37
55
103
21
67
77
57
15
39
Emm
anue
l Osu
naM
Toro
roN
RM2
7882
53
52
42
319
24
511
45
93
15
95
75
55
25
34
John
Mar
y Lu
wak
anya
MM
pigi
NRM
180
800
35
22
24
182
60
85
510
11
57
77
77
70
237
Char
les
K. B
yaba
kam
aM
Ruku
ngiri
NRM
144
8082
33
23
03
142
43
94
59
31
59
76
67
73
339
Fran
cis
Luko
oya
M.
MM
ukon
oN
RM2
8080
02
52
31
417
26
311
55
103
15
93
77
74
05
33
Mar
k A
ol M
usoo
kaM
Mor
oto
NRM
176
783
35
22
22
162
40
65
510
31
59
67
76
60
537
Ant
hony
Om
ach
Atu
beM
Am
uru
NRM
254
7844
34
24
14
182
20
44
59
32
510
56
56
55
537
Geo
rge
Mic
hael
Egu
nyu
MSo
roti
NRM
182
78-5
35
24
24
200
40
45
510
32
510
77
77
30
334
Fran
cis
Olu
ma
MA
mur
iaN
RM1
7478
53
52
32
419
26
311
52
73
15
93
77
75
03
32
Geo
rge
Tink
aman
yire
MH
oim
aN
RM3
6576
173
42
42
419
22
37
55
103
20
55
75
75
33
35
Ale
x O
rem
o A
lot
MLi
raU
PC1
4076
903
42
42
419
26
08
45
93
25
106
66
66
00
30
Deu
sded
it Tu
mus
iime
MM
bara
raN
RM1
7075
73
52
32
419
20
02
35
83
05
86
66
66
44
38
John
Lor
otM
Nak
apir
ipit
NRM
269
759
33
23
24
172
43
95
510
31
59
57
17
52
330
Robe
rt O
kum
uM
Neb
biN
RM1
6574
143
52
42
420
24
06
55
101
23
60
77
77
22
32
Den
is S
inga
haky
eM
Ntu
ngam
oN
RM1
6974
73
52
41
419
24
511
55
103
23
84
35
72
23
26
Bern
ard
M. M
ujas
iM
Mba
leN
RM3
7074
63
32
42
317
24
39
45
92
15
86
37
37
05
31
Jose
phin
e Ka
sya
FKa
nung
uN
RM3
5374
403
42
42
217
22
04
55
103
25
107
37
73
33
33
John
Bap
tist
Nam
besh
eM
Budu
daN
RM1
6271
163
52
42
420
22
37
55
103
25
107
33
33
23
24
Fred
Luk
umu
MBu
liisa
NRM
256
7025
34
12
24
162
60
85
05
32
510
67
77
30
131
Abd
ul N
addu
liM
Luw
eero
NRM
363
6910
35
24
24
202
20
45
510
32
05
55
57
50
330
Jimm
y O
kudi
Vuk
oni
MM
oyo
Ind
152
6219
35
24
24
202
60
85
27
31
04
72
26
22
223
Pete
r O
dok
W'O
ceng
MA
gago
NRM
147
112
51
32
316
00
00
30
33
25
102
22
62
22
18
Ave
rage
267
7719
35
23
24
182
42
85
49
32
49
56
66
52
333

An
nex
3: S
umm
ary
of D
istr
ict
Spea
kers
’ P
erfo
rman
ce F
Y 20
12/
13
Per
form
ance
Pres
idin
g A
nd P
rese
rvat
ion
Of
Ord
er In
Co
unci
lCo
ntac
t W
ith
Elec
tora
tePa
rtic
ipat
ion
In L
LGM
onito
ring
NPP
As
Name
Political Party
District
sub county
Gender
Terms
2011/12
2012/13
% Change
Chairing council
Rules of procedure
Business Committee
Records book
Record of motions
special skills
Sub Total
Meetings with Electorate
Coordinating center
Sub Total
Participation in LLG
Health
Education
Agriculture
Water
Roads
FAL
Environment
Sub total
Sam
uel B
amw
ole
NRM
Kam
uli
Naw
anya
goM
387
37
32
30
1811
920
107
77
77
04
39
Pete
r D
ougl
as O
kello
NRM
Gul
uLa
logi
M1
8984
-63
93
23
525
119
208
55
51
55
531
Jam
es K
ezaa
la K
unob
wa
NRM
Muk
ono
Seet
a N
amug
anga
M2
7379
83
63
23
320
79
1610
55
75
33
533
Julie
t Je
mba
NRM
Mpi
giM
udum
a/Ki
ring
ente
F2
4078
953
63
23
017
119
2010
77
15
70
431
Muh
amm
ed M
afab
iIn
dM
bale
Bubw
angu
M2
7577
33
43
23
217
119
2010
33
77
35
230
Mar
tin O
cen
Ody
ekU
PCLi
raRa
ilway
M1
2675
188
39
32
35
253
69
27
77
77
31
39
Dan
Nab
iman
yaN
RMN
tung
amo
Ruko
ni W
est
M1
6675
143
93
23
020
99
1810
71
55
50
427
Hen
ry N
dyab
ahik
aN
RMRu
kung
iriBu
hung
aM
264
7517
39
32
30
205
914
67
65
57
14
35
Rich
ard
May
engo
NRM
Jinja
Maf
ubir
a B
M3
6873
73
93
23
222
89
178
55
51
15
426
Pros
covi
a N
aman
saN
RMLu
wer
oKa
tikam
u/F
364
7314
39
30
30
1811
920
107
70
47
00
25
Idda
Fua
mbe
NRM
Neb
biN
yara
vur/
Ate
goF
468
737
39
32
22
219
918
107
10
73
15
24
Dau
di B
yekw
aso
Muk
iibi
NRM
Wak
iso
Kaki
riM
375
73-3
29
32
30
199
918
105
57
05
04
26
Jam
es P
aul M
ichi
NRM
Toro
roEa
ster
n D
iv.
M1
3269
116
26
32
35
217
916
23
34
55
55
30
Chris
toph
er O
dong
kara
NRM
Am
uru
Pabb
oM
151
6935
29
30
30
179
918
66
27
47
11
28
Char
les
Eche
mu
Engo
ruN
RMA
mur
iaA
sam
ukM
241
6866
29
00
32
166
915
107
74
50
04
27
Char
les
Besh
esya
NRM
Kanu
ngu
M1
6168
113
93
23
020
119
202
55
15
51
426
Clov
is M
ugab
oN
RMKa
baro
leM
ugus
uM
254
6622
39
32
32
2211
920
105
15
11
01
14
Did
an A
mam
aIn
dBu
liisa
Ngw
edo
M1
3165
110
36
20
00
1111
920
07
73
37
34
34
Nat
han
Kitw
e Is
ingo
ma
NRM
Hoi
ma
Busi
siM
133
6494
39
32
32
227
916
61
33
37
12
20
Will
iam
K. T
ibam
anya
NRM
Mba
rara
Ru
gand
oM
158
6410
39
32
30
207
916
25
51
55
14
26
Mic
hael
Mat
syet
sye
NRM
Budu
daBu
mas
heti
M2
3563
803
63
23
017
116
174
14
55
51
425
Mar
tin C
haig
aN
RMM
oyo
Moy
oM
244
6343
39
22
30
1911
920
07
70
13
15
24
And
rew
Odo
ngo
FDC
Soro
tiW
/Div
M1
6160
-23
93
23
525
119
204
21
11
11
411
Ceas
ar L
omet
oN
RMM
orot
oYo
uth
M1
4954
103
62
23
016
79
166
35
50
11
116
Joth
am L
oyor
NRM
Nak
apiri
pirit
Kako
mon
gole
M3
6244
-29
34
22
30
147
29
43
51
51
11
17
John
Bos
tify
Ow
eka
FDC
Aga
goO
mot
M1
232
63
03
014
02
20
11
11
11
17
Ave
rage
255
6838
38
32
31
199
817
65
44
44
23
26
Local Government Councils’ Performance and Public Service Delivery in Uganda: Nebbi District Council Score-Card Report 2012/1336 Local Government Councils’ Performance and Public Service Delivery in Uganda: Nebbi District Council Score-Card Report 2012/13
Publications in this SeriesNamara-Wamanga, S., et.al., (2013). Local Government Councils’ Performance and Public Service Delivery in Uganda: Luwero District Council Score-Card Report 2011/12. ACODE Public Service Delivery and Accountability Report Series
No.1, 2013. Kampala.
Muyomba-Tamale, L., et.al., (2013). Local Government Councils’ Performance and Public Service Delivery in Uganda: Mpigi District Council Score-Card Report 2011/12. ACODE Public Service Delivery and Accountability Report Series
No.2, 2013. Kampala.
Namara-Wamanga, S., et.al., (2013). Local Government Councils’ Performance and Public Service Delivery in Uganda: Wakiso District Council Score-Card Report 2011/12. ACODE Public Service Delivery and Accountability Report Series
No.3, 2013. Kampala.
Otile, O., M., et.al., (2013). Local Government Councils’ Performance and Public Service Delivery in Uganda: Amuru District Council Score-Card Report 2011/12. ACODE Public Service Delivery and Accountability Report Series No.4, 2013. Kampala.
Owor, A., et.al., (2013). Local Government Councils’ Performance and Public Service Delivery in Uganda: Gulu District Council Score-Card Report 2011/12. ACODE Public Service Delivery and Accountability Report Series No.5, 2013. Kampala.
Egunyu, M., et.al., (2013). Local Government Councils’ Performance and Public Service Delivery in Uganda: Mbale District Council Score-Card Report 2011/12. ACODE Public Service Delivery and Accountability Report Series No.6, 2013. Kampala.
Mbabazi, J., et.al., (2013). Local Government Councils’ Performance and Public Service Delivery in Uganda: Lira District Council Score-Card Report 2011/12. ACODE Public Service Delivery and Accountability Report Series No.7,
2013. Kampala.
Asimo, N., et.al., (2013). Local Government Councils’ Performance and Public Service Delivery in Uganda: Kamuli District Council Score-Card Report 2011/12. ACODE Public Service Delivery and Accountability Report Series No.8, 2013. Kampala.
Bainomugisha, A., et.al., (2013). Local Government Councils’ Performance and Public Service Delivery in Uganda: Mbarara District Council Score-Card
Local Government Councils’ Performance and Public Service Delivery in Uganda: Nebbi District Council Score-Card Report 2012/13 37
Report 2011/12. ACODE Public Service Delivery and Accountability Report Series No.9, 2013. Kampala.
Ssemakula, E., et.al., (2013). Local Government Councils’ Performance and Public Service Delivery in Uganda: Tororo District Council Score-Card Report 2011/12. ACODE Public Service Delivery and Accountability Report Series No.10, 2013. Kampala.
Muyomba-Tamale, L., et.al., (2013). Local Government Councils’ Performance and Public Service Delivery in Uganda: Mukono District Council Score-Card Report 2011/12. ACODE Public Service Delivery and Accountability Report Series, No.11 , 2013. Kampala.
Mbabazi, J., et.al., (2013). Local Government Councils’ Performance and Public Service Delivery in Uganda: Nebbi District Council Score-Card Report 2011/12. ACODE Public Service Delivery and Accountability Report Series, No.12 , 2013. Kampala.
Asimo, N., et.al., (2013). Local Government Councils’ Performance and Public Service Delivery in Uganda: Jinja District Council Score-Card Report 2011/12. ACODE Public Service Delivery and Accountability Report Series, No.13 , 2013. Kampala.
Mbabazi, J., et.al. (2013). Local Government Councils’ Performance and Public Service Delivery in Uganda: Lira District Council Score-Card Report 2012/13. ACODE Public Service Delivery and Accountability Report Series No.14, 2013. Kampala.
Namara, S., W., et.al. (2013). Local Government Councils’ Performance and Public Service Delivery in Uganda: Luwero District Council Score-Card Report 2012/13. ACODE Public Service Delivery and Accountability Report Series No.15, 2013. Kampala.
Muyomba, L., T., et.al. (2013). Local Government Councils’ Performance and Public Service Delivery in Uganda: Mpigi District Council Score-Card Report 2012/13. ACODE Public Service Delivery and Accountability Report Series No.16, 2013. Kampala.
Muyomba, L., T., et.al. (2013). Local Government Councils’ Performance and Public Service Delivery in Uganda: Mukono District Council Score-Card Report 2012/13. ACODE Public Service Delivery and Accountability Report Series No.17, 2013. Kampala.
Namara, S., W., et.al. (2013). Local Government Councils’ Performance and Public Service Delivery in Uganda: Wakiso District Council Score-Card Report
Local Government Councils’ Performance and Public Service Delivery in Uganda: Nebbi District Council Score-Card Report 2012/1338 Local Government Councils’ Performance and Public Service Delivery in Uganda: Nebbi District Council Score-Card Report 2012/13
2012/13. ACODE Public Service Delivery and Accountability Report Series No.18, 2013. Kampala.
Owori, A., et.al. (2013). Local Government Councils’ Performance and Public Service Delivery in Uganda: Gulu District Council Score-Card Report 2012/13. ACODE Public Service Delivery and Accountability Report Series No.19, 2013. Kampala
Owori, A., et.al. (2013). Local Government Councils’ Performance and Public Service Delivery in Uganda: Gulu District Council Score-Card Report 2012/13. ACODE Public Service Delivery and Accountability Report Series No.19, 2013. Kampala.
Otile, M., O., et.al. (2013). Local Government Councils’ Performance and Public Service Delivery in Uganda: Gulu District Council Score-Card Report 2012/13. ACODE Public Service Delivery and Accountability Report Series No.20, 2013. Kampala.
Mbabazi, J., et.al. (2014). Local Government Councils’ Performance and Public Service Delivery in Uganda: Agago District Council Score-Card Report 2012/13. ACODE Public Service Delivery and Accountability Report Series No.21, 2014. Kampala.

Local Government Councils’ Performance and Public Service Delivery in Uganda: Nebbi District Council Score-Card Report 2012/13
ABOUT THE AUTHORS
Jonas Mbabazi is a Research Officer at ACODE. He was a Project Development Consultant with REEV Consult International. He holds a Bachelor in Social Work and Social Administration of Makerere University. He has amassed skills in performance measurement of public institutions and analysis of policy initiatives. He has a lot of experience in project proposal design, qualitative and quantitative research and has been involved in various research assignments including Baselines, Mid Term and post ante evaluations of various organizations.
James Kumakech is the Programme Coordinator for Community Uplift and Welfare Development (CUWEDE). He has undertaken a number of field work assignments in Agricultural Financing, Agricultural Marketing, Public Expenditure Tracking, Poverty Resource Tracking Surveys, Roads and Water Governance among others. James holds a Bachelor’s Degree in Development Studies from Gulu University.
Robert Rupiny Ronnie is the Focal Person for Emergency Preparedness Response (EPR), Dissemination and Tracing, Uganda Red Cross Society Nebbi Branch. He holds a Bachelor of Arts Degree from Makerere University Kampala.
Okot George is the Programme Coordinator Nebbi District NGO Forum. He holds a Bachelor’s Degree in Community Leadership and Development from Uganda Christian University (UCU) Mukono.
Advocates Coalition for Development and Environment
Plot 96, Kanjokya Street, Kamwokya
P. O. Box 29836, Kampala
Tel: +256 312 812150
Email: [email protected]; [email protected]
Website: www.acode-u.org
ISBN: 978 9970 34 019 4