Embed Size (px)
Citation preview
Local Drug Markets' Response to Focused Police EnforcementAuthor(s): Jonathan P. CaulkinsSource: Operations Research, Vol. 41, No. 5 (Sep. - Oct., 1993), pp. 848-863Published by: INFORMSStable URL: http://www.jstor.org/stable/171651 .
Accessed: 09/05/2014 19:33
Your use of the JSTOR archive indicates your acceptance of the Terms & Conditions of Use, available at .http://www.jstor.org/page/info/about/policies/terms.jsp
.JSTOR is a not-for-profit service that helps scholars, researchers, and students discover, use, and build upon a wide range ofcontent in a trusted digital archive. We use information technology and tools to increase productivity and facilitate new formsof scholarship. For more information about JSTOR, please contact [email protected].
.
INFORMS is collaborating with JSTOR to digitize, preserve and extend access to Operations Research.
http://www.jstor.org
This content downloaded from 194.29.185.77 on Fri, 9 May 2014 19:33:06 PMAll use subject to JSTOR Terms and Conditions
LOCAL DRUG MARKETS' RESPONSE TO FOCUSED POLICE ENFORCEMENT
JONATHAN P. CAULKINS Carnegie Mellon University, Pittsburgh, Pennsylvania
(Received December 1990; revision received January 1993; accepted January 1993)
This paper introduces a model that describes how local drug markets might respond to intensive local enforcement operations known as crackdowns. The model supports the intuition of some drug policy analysts and makes concrete suggestions for how crackdowns should be managed.
Crackdowns are being promoted as a new I ~~ approach to drug enforcement (see, e.g., Hayeslip 1989). Kleiman (1988) discusses crackdowns at length, but, for present purposes, a working defini- tion is: "an intensive local enforcement effort directed at a particular geographic target." Frequently the tar- get is a so-called open-air drug market, a location where there is a high concentration of dealing and the market participants fairly flaunt their presence. Crack- downs are distinguished both from day-to-day enforcement operations, which generally spread resources more or less uniformly over the problem, and from other special operations that target individ- uals, organizations, a particular drug, a class of users, or an ethnic group rather than a geographic target.
Despite the attention local-level enforcement in gen- eral, and crackdowns in particular, have received, there is no consensus about how well they work. This paper attempts to contribute to the debate by devel- oping a mathematical model which describes how a local drug market might respond to a crackdown.
1. CURRENT THINKING ABOUT LOCAL ENFORCEMENT
At the highest level drug policy is a resource allocation problem. Resources can be devoted to supply side or demand side measures. Supply side measures include source country control, interdiction, high-level domes- tic investigations, and street-level enforcement. The Reagan Administration generally stressed supply side
measures other than street-level enforcement, but over the last few years there has been renewed interest in street-level enforcement.
There are many reasons for this, but one of the most compelling was the realization that higher- level enforcement affects primarily price, not avail- ability. Even the massive, 20-ton cocaine seizure in Los Angeles in the fall of 1989 did not cause spot shortages (International Drug Report 1989, p. 17). And respected researchers (e.g., Reuter, Crawford and Cave 1988) have also questioned interdiction and source country control's ability to influence prices. Furthermore, even if high-level enforcement could drive up prices, it is not clear that the increase would be desirable. Estimates of price elasticities of demand for illicit drugs are necessarily rough, but there is reason to believe that prices of illicit drugs are relatively inelastic (Reuter and Kleiman 1986, pp. 298-300, Reuter, Crawford and Cave 1988, pp. 20-23). Therefore, expenditures on drugs might increase if prices rose. This would increase dealers' incomes, would further impoverish users, and could lead to more property crime. The last effect has never been proved; however, it is plausible, and there is some evidence that it exists (Brown and Silverman 1974, Kleiman 1988).
Street-level enforcement, on the other hand, essen- tially has no impact on the dollar price. Instead, it affects so-called search time costs, which are the non- monetary costs of locating, purchasing, and using drugs (Moore 1973, Kleiman 1988). These are real
Subject classifications. Economics: markets for illicit drugs. Judicial/legal: drug policy. Area of review: New OR NONTRADITIONAL AREAS.
Operations Research 0030-364X/91/4105-0848$01.25 Vol. 41, No. 5, September-October 1993 848 ? 1993 Operations Research Society of America
This content downloaded from 194.29.185.77 on Fri, 9 May 2014 19:33:06 PMAll use subject to JSTOR Terms and Conditions
Drug Markets' Response to Enforcement / 849
costs, so presumably consumption decreases when they rise; and, since dollar price is not affected, dollar expenditures would decline as well.
The potential of local enforcement is limited, how- ever, because there are more dealers than existing criminal justice resources can handle. Furthermore, because of the hierarchical nature of the distribu- tion networks, most dealers are low-level dealers. Nationally there are probably on the order of three- quarters of a million street dealers (Reuter and Kleiman p. 294), and Washington D.C. alone is thought to have roughly 24,000 street dealers in total or about 14,000 full-time equivalents (Reuter et al. 1990). Concerted efforts to arrest as many of these dealers as possible can swamp the criminal justice system (see, for example, the description by Pitt 1989). But the very existence of brazen, open-air dealing shows that less concentrated efforts often yield unsat- isfactory results.
One response has been to focus efforts geographi- cally by concentrating on the markets in one or a few neighborhoods within a city. The hope is that some of the promise of local enforcement can be realized without overwhelming the criminal justice system. Crackdowns have been tried in over a dozen cities. Some have succeeded; others have failed. (See Zimmer 1987, Chaiken 1988, and Caulkins, Larson and Rich 1991 for descriptions of some of them.)
Crackdowns are not without their drawbacks. In the interest of space these drawbacks will simply be listed here, but Caulkins (1990, Chapter 4) discusses them in greater length. Crackdowns can easily lead to gross violations of civil liberties; they do not address so- called "quiet" dealing that does not take place on the street; the work can be dangerous and demoralizing for enforcement officers; and corruption is always a risk with enforcement of laws against consensual crimes. The main concerns, however, are with the obvious inequity of putting more effort into one neigh- borhood than another and the possibility that crack- downs will simply displace market participants into other markets.
There is no simple answer to the charge of inequity. The hope is that by concentrating resources they will become more effective. Increasing effectiveness would make society as a whole better off, but the people living in the neglected neighborhoods would probably suffer. Not surprisingly, the choice of target neighbor- hoods can become a highly sensitive and political decision.
Displacement is a complex issue and is addressed in depth by Caulkins (1992). For present purposes,
though, note that the worst plausible case is, at least by some criteria, still better than no crackdown. If the participants in the target market were to move en masse to a new location, then according to most definitions of success the crackdown would have failed. But this outcome is highly unlikely because there is generally no way for the participants to coordinate their actions.
When a market is eliminated, each participant decides more or less independently to 1) give up drugs or drug sales, 2) switch to "quiet" markets (in bars, in people's homes etc.), or 3) move to another, pre- existing street market. If some choose 1, the crack- down clearly generates benefits. To the extent that some choose 2, progress will have been made because "quiet" dealing probably creates fewer negative exter- nalities per kilogram sold than does open dealing. But even if every participant chooses 3, there would be one fewer market. The remaining N markets would be (1 OO/N)% larger, but availability would be reduced. Furthermore, in as much as not all participants switch to the same new market, connections between dealers and customers will be disrupted, which raises search time costs.
In summary, even if there is complete displacement, as long as it does not take the form of movement en masse to one place that was not previously a market, the crackdown will have accomplished something.
2. HARTFORD, CONNECTICUT
Despite the drawbacks described above, cities con- tinue to plan focused enforcement operations. Hartford, Connecticut is one such city. Historically, the Hartford Police Department's efforts were dis- persed throughout the city. But during the summer of 1989 it began planning to concentrate on a sub- set of the 22 markets it believed existed in Hartford. Hence, the Hartford Police Department needed to decide:
1. How many and which of the 22 markets should be attacked first?
2. How much pressure should be maintained on mar- kets that have already been cleaned up when the main thrust goes on to other markets?
3. Under what conditions should a crackdown be initiated in order to have the greatest likelihood of succeeding?
This paper describes a model that gives at least partial answers to pragmatic questions such as these, as well
This content downloaded from 194.29.185.77 on Fri, 9 May 2014 19:33:06 PMAll use subject to JSTOR Terms and Conditions
850 / CAULKINS
as to some more general questions raised in the next section.
Although the model was formulated with Hartford in mind, it should generalize. For a variety of reasons, despite its small size (population 138,000), Hartford's drug problem has more in common with those of major metropolitan centers like New York City than it does with those of other cities of less than 250,000 people (Sullivan 1988, Caulkins 1990, pp. 130-131).
3. MENTAL MODELS THAT LED TO THE MATHEMATICAL MODEL
Much remains to be learned about crackdowns. This paper tries to move toward a better understanding by formalizing two mental models that arose during discussions in Hartford.
The first mental model is the "balloon metaphor" (proposed in this context by Richard C. Larson). To understand it, imagine a map of the city of interest with sheets of rubber covering each market. At any point, the rubber is puffed up (hence, the name bal- loon metaphor) to a height that is proportional to the density of dealing at that point, and thus the volume under one bubble measures the size of that market.
Cracking down on a market can be visualized as pressing down on the balloon covering that market. Displacement would occur if the balloons covering different markets were connected so air could flow from one balloon to another. If displacement was not possible, changes in the balloon's volume could be thought of as air escaping to, or entering from, the atmosphere.
Another mental model, which is not confined to local enforcement, is the idea that enforcement can generate "positive feedback" (explained to the author by Mark Kleiman; see, e.g., Kleiman 1988, pp. 25-26). As enforcement increases, some dealers who are particularly sensitive to enforcement pressure exit the market. That increases the amount of enforcement per participant among those who remain, which might encourage still more to leave. The departure of this second group, even if total enforcement pressure remains the same, further increases the ratio of enforcement to the size of the market.
If the market is small enough relative to the level of enforcement, this positive feedback effect might col- lapse the market. In effect, for any given level of enforcement there is a minimum viable market size.
These mental models suggest the following questions:
1. Is there any advantage to focusing effort on one market?
2. How much pressure must be applied to reduce the size of a market by a given amount?
3. If one pushes down hard enough, will a market suddenly collapse?
4. If so, how much will it gradually deflate (shrink) before it collapses?
5. If one pushes down hard enough to partially deflate the market, but not hard enough to make it collapse, will the market spring back?
6. When a market is partially deflated or completely collapsed, is the dealing simply displaced to other markets or is it truly eliminated?
7. If it is displaced, does it move only to adjacent markets or is it spread more or less uniformly over all the other markets?
8. How much pressure is needed to keep a collapsed market from springing back?
9. Is the effort required to collapse a market propor- tional to its size; to the square of its size; to some other power of its size?
10. What affects the proportionality constant?
The next section develops a model that gives answers to many of these questions.
4. MODEL FORMULATION
Imagine a city with a large number of identical dealers spread over a large number of drug markets. Suppose that each day every dealer goes to the market that offers the best "opportunity." On any given day a dealer could also choose not to deal; to avoid con- stantly adding this qualification, not dealing will be thought of as going to a null market.
Note that since no distinction is made between going to other markets and not dealing, this model is agnostic with respect to the extent to which displace- ment occurs. This prevents the model from answering questions about displacement, but has the distinct advantage of making it consistent with any level of displacement, from none to complete.
Opportunity, as it is used here, is not synonymous with expected dollar profit. It includes nonmonetary factors, such as the risks of enforcement and non- monetary costs (e.g., threats of violence) imposed by other participants in the market. Nevertheless, merely positing that dealers rationally maximize a utility function of any form is a significant assumption that may not be realistic in every case. Its justification here rests primarily on the observations that utility max- imization models are useful in a variety of contexts (Becker 1976) and that drug dealing is an activity which is typically undertaken voluntarily for personal gain. Also, it is not claimed that this is the only
This content downloaded from 194.29.185.77 on Fri, 9 May 2014 19:33:06 PMAll use subject to JSTOR Terms and Conditions
Drug Markets' Response to Enforcement / 851
paradigm which can shed light on drug market behav- ior, but merely one such paradigm.
If dealers are identical, they share the profits and the burden of enforcement equally. Hence, all dealers in a market do equally well, and one can think of an expected return, or utility, from dealing in that market.
Furthermore, movement of dealers ensures that in equilibrium the utility would be the same in all mar- kets that have any dealers. To see this, suppose that one market had a lower return, for instance because enforcement pressure had just been increased there. Presumably dealers in that market would consider moving. If the change in enforcement were not too great, it might be that only a few dealers would leave that market. This would leave more customers per dealer for those who remain, compensating them for the increased risk and, perhaps, restoring parity between markets. If the increase in enforcement were large enough, however, equilibrium might not be restored until all the dealers left that market.
Realistically, not all dealers can go to all markets. Some markets might be simply too distant; others may be inaccessible because the dealers and/or neigh- bors there are of a different ethnic background and would not welcome an outsider; and others may be on the "turf' of a rival gang. The model does not, however, require such extreme mobility. It assumes only that there is sufficient mobility to prevent dealers in one market from consistently earning higher returns than the dealers in other markets.
The assumptions that dealers are identical and move around to balance the opportunities available are cer- tainly artificial, but without some such assumptions the analysis would be hopelessly complex. Given the dearth of reliable data (Caulkins 1990, Chapter 2), it is unrealistic to expect to calibrate more detailed models that, for example, subdivide the dealing pop- ulation on the basis of prior arrests.
These assumptions are similar in spirit to those commonly made in microeconomics. The dealers are analogous to firms and the markets to industries. It is assumed in elementary economics that industries are made up of a large number of identical firms and that free entry and exit ensure zero long-run profits. No one believes that those assumptions accurately model the business world, but at least some people believe that macroeconomic theories based on them help explain phenomena in the real world.
The model developed below will explore the effects of cracking down on one market. If there are many markets in the city, then what happens in one will not greatly affect the others. So this common level of
utility, denoted wo, will be treated as an exogenous constant. Since this level of utility is always available, if the utility in a market falls below wo, dealers will leave that market. If it rises above wo, dealers will enter. Thus, wo is the reservation wage of the dealers.
It will further be assumed that all drug sales are identical, and they yield a generalized profit ir. The term generalized profit is used instead of net profit as a reminder that many of the costs are nonmonetary. That is, the generalized profit equals the sale price minus the dealer's cost of doing business, including the costs imposed by other market participants and conventional police enforcement. Conventional enforcement includes enforcement by uniformed patrol officers not specifically directed toward making narcotics arrests. Crackdowns, in contrast, are more likely to be conducted by plainclothes narcotics detec- tives and specially assigned uniformed patrols. The costs associated with crackdowns are dealt with separately.
Since dealers are assumed to be identical, one value of ir should pertain within a given market, but it is possible that ir varies across markets. Some observers (e.g., Garreau 1989) believe that dollar prices, for a given quantity and quality, are uniform across a city, but there is a lore suggesting otherwise, e.g., that there were substantial differences in heroin prices in New York City between the lower east side and Harlem. Furthermore, nonmonetary factors, such as violence from other market participants, might vary from market to market.
The assumption that all transactions are identical also ignores differences between different kinds of drugs. Explicitly distinguishing between sales of differ- ent drugs would add more notational complexity than insight to the model, so drugs are treated as a homo- geneous commodity. It should be clear, however, that the model does not apply to drugs, such as diverted pharmaceuticals, that are not widely sold in street markets.
There are two reasonable metrics for the size of a market: the number of dealers and the number of sales. These quantities will be represented as:
N = the number of dealers in the market of interest; and
Q(N) = the number of sales per day in that market.
The number of sales depends on the number of dealers, but discussion of the nature of this depen- dence is deferred momentarily. Note that specific units are used in the definitions above and elsewhere for clarity of exposition, but it should be clear that other units would be equally acceptable.
This content downloaded from 194.29.185.77 on Fri, 9 May 2014 19:33:06 PMAll use subject to JSTOR Terms and Conditions
852 / CAULKINS
Since dealers are assumed to be identical, each dealer in the market earns wage irQ(N)/N. Now let
E = the increment in enforcement effort, above and beyond the baseline level, that is placed on the market during the crackdown.
The definition of E is intentionally vague, in no small part because crackdown strategies vary from city to city, depending on the nature of the problem (Hayeslip 1989). It is some function of the number of police hours allocated to the market, the likelihood an arrest will lead to a conviction, the likelihood of punishment in the case of a conviction, and so on. Introducing a detailed model of the criminal justice system would distract attention from the characteris- tics of the market itself, which is the subject of interest. Treating enforcement pressure as a single exogenous variable in this manner is similar to microeconomists treating the wage rate as a fixed, exogenous parameter.
It will further be assumed that the cost or disutility the crackdown imposes on the dealers is proportional to the enforcement effort and is independent of the number of dealers in the market.
Some might be troubled by the second half of this assumption, that the cost imposed is independent of the number of dealers. They might argue, for example, that the cost imposed by a given level of enforcement effort should be an increasing function of N, because it might be easier for the police to apprehend a given number of suspects when there are many targets. While this may be true to some extent, there are at least four reasons why the dependence on N is likely to be relatively weak.
First, in order to punish a drug dealer the criminal justice system must do much more than arrest that dealer. The bulk of the resources are expended trying the individual in court and incarcerating him or her. Hence, if the limiting factor in the criminal justice system's ability to punish is prison space or court time, not arrest capacity, then the total amount of punishment meted out would not depend greatly on how difficult it is to apprehend a dealer. Second, even narcotics officers do not spend all of their time search- ing for and chasing suspects. A large fraction of their time is spent obtaining warrants, doing paperwork, processing arrested individuals, and testifying in court, and the time per arrest required to perform these activities does not depend on the number of dealers on the street. Third, although actually observing a deal may become more difficult as the number of dealers declines, the efficiency of other tactics, such as buy- busts, may not be greatly affected. So, the police might be able to maintain their productivity by stressing
tactics whose effectiveness are relatively insensitive to the number of dealers. Finally, as the crackdown progresses, there may be more potential informants (previously arrested dealers) and more cooperation from neighbors (who may be less intimidated by deal- ers once they see the number of dealers beginning to decrease). Hence, there are at least four reasons why it is not entirely unreasonable to assume that the cost imposed on dealers per unit of enforcement effort is independent of N.
If one accepts that enforcement imposed costs are linear in E and independent of N, then, since dealers are identical and share the burden of enforce- ment equally, each experiences a crackdown-related enforcement cost which is proportional to E/N. Since units of E have not been specified, they can be selected without loss of generality so that this proportionality constant is unity.
If the dealers' utility depends only on their wage and the enforcement pressure, then one simple model of the flow of dealers in and out of a market is
dN FtrQ(N) E 1 dT=C ,U I ') - WO forN>O (1)
where U(x, y) is the utility a dealer derives from a wage of x when the crackdown enforcement pressure experienced is y.
Equation 1 suggests that if dealers in a particular market have a utility greater than the utility available elsewhere, then more dealers will move to this market, whereas if their utility is smaller, some will exit. The constant c, governs how quickly this adjustment is made. If c, is large, then dealers change markets quickly. If c, is small, then differences in utility between markets could persist for some time.
Some assumption must be made about the func- tional form of U(x, y) for the analysis to proceed. It is clear that U(x, y) should be increasing in x and decreasing in y. Furthermore, since the first argument is a measure of profits and the second of cost (risk), it seems reasonable that U(x, y) should have the form U(x, y) = f(x) - g( y).
The utility of income is generally modeled as being concave, but approximated as linear for small ranges. This approximation will be used here; so U(x, y) =
x - g( y) For people who are risk neutral, risks can be sum-
marized by taking the expected cost of the correspond- ing risk. In that case, g( y) would be linear in y. One might think dealers are risk neutral, perhaps even risk- seeking. After all, they have selected a very risky profession. But most people, probably even dealers, are at least somewhat risk-averse, suggesting that
This content downloaded from 194.29.185.77 on Fri, 9 May 2014 19:33:06 PMAll use subject to JSTOR Terms and Conditions
DrugMarkets' Response to Enforcement / 853
g"( y) > 0. Analytically, the most convenient increas- ing, convex function is g(y) = y- for y 7 1, so that function will be used.
Finally, some assumptions must be made about how changes in the number of dealers affect the number of sales, i.e., about Q(N). Before addressing the dependence on N, though, note that by writing Q(N) it is implicitly being assumed that sales depend on enforcement against dealers (E) only through its effect on the number of dealers.
This assumption may be a significant limitation because some crackdowns explicitly seek to arrest users. However, the arrest risk for users, even during a crackdown, is quite low. Caulkins (1990) examines some of the issues surrounding how effort against dealers should be balanced against efforts to control demand, but this is clearly an area for further research.
It is not known exactly how the number of sales depends on the number of dealers, but it seems likely that increasing the number of dealers would probably never reduce the number of sales (Q'(N) > 0). In addition, because of diminishing returns, it would probably increase sales at a decreasing rate (Q"(N) < 0).
This last comment need not hold. It may be that the presence of many dealers creates a sense of social acceptability or peer pressure that may induce cus- tomers to buy more. In that case, sales could increase more than proportionally in the number of dealers. It can be seen from the analysis below, however, that there can be no stable market equilibrium at a size N such that Q"(N) > 0. That is, synergistic effects may occur, but even if they do, the market will grow to a point at which they no longer occur.
Beyond these observations, it is difficult to say much for certain about Q(N). A reasonably general but analytically convenient, increasing, concave function is
Q(N) = wn3, E E (0, 1], (2)
so that will be used below. At first, one might think that Q(N) would be almost
linear in N, and so f3 would be close to 1. That would fit the old-fashioned view that dealers are "pushers" who create their demand, but that view has been largely rejected (Kaplan 1983, pp. 25-32).
Nevertheless, sales are likely to increase somewhat with N because mobile customers prefer markets with lots of dealers. Customers are more likely to score quickly in markets with lots of dealers, and they have an incentive not to spend any more time in the market than is absolutely necessary. Also, when there are many dealers, competition might lead them to give
not zero, dN/dt is negative for sufficiently small N. Hence, it seems reasonable to augment (3a) with better service and, perhaps, even discounts. Finally, there is safety in numbers. If the market is large, then even if the police decide to arrest a user, there is less chance that any particular user will get caught.
Given these assumptions, (1) becomes
N = c [7raN"' (- ) - wo] for N > O. (3a)
Equation 3a holds only for N > 0. As long as E is not zero, dN/dt is negative for sufficiently small N. Hence, it seems reasonable to augment (3a) with
-N =0 forN=O. (3b) dt
That is, markets do not normally form spontaneously. This is supported by the observation that the vast majority of street corners are not markets.
Ideally, one would solve (3) to find the number of dealers N as a function of the enforcement pressure E, and time. This is difficult to do, however, except for particular values of 3 and fy. Fortunately, analyzing the steady-state solution obtained by setting (3) equal to zero is all that is needed to derive many useful insights. This steady-state approach is actually pre- ferred, in some sense, because one can feel a great deal more confidence in the statement that
Sgn([) Sgn(iN' -N -wo for N> 0
than one can in the exact form of (3a); and, (4) (with (3b)) is all that is needed for the steady-state analysis. Furthermore, even if the form of (3a) were correct, there is little hope of measuring the parameter c,.
Because what follows is a steady-state analysis, how- ever, one must be careful when interpreting statements about how characteristics of the market, such as the number of dealers, are related to the enforcement pressure E. For example, it will be determined that the steady-state number of dealers is decreasing in E. This should be interpreted as follows. If the market is in steady state with a particular level of enforcement El and if enforcement is subsequently increased to a new level E2, then after the market has returned to equilibrium there will be fewer dealers than before. Furthermore, if the new level of enforcement had been E3 rather than E2, and E3 was greater than E2, then the new equilibrium number of dealers would have been even smaller. One should not think of the level of enforcement E as steadily increasing, unless it changes slowly enough that a quasistatic equilibrium,
This content downloaded from 194.29.185.77 on Fri, 9 May 2014 19:33:06 PMAll use subject to JSTOR Terms and Conditions
854 / CAULKINS
of the sort assumed in elementary thermodynamics, is maintained.
Before analyzing the model, it may be useful to briefly review the key assumptions that have been made:
Al: Dealers are identical and interchangeable; A2: Dealers go to the market offering the greatest
return; A3: The number of dealers can be modeled as a
continuous variable; A4: Cracking down on one of many markets in a city
does not significantly influence dealing in the other markets;
A5: All drug sales yield the same generalized profit 7r;
A6: All dealers experience a crackdown pressure of E/N;
A7: Dealers maximize a utility function comprised of their expected (generalized) profit x and the indi- vidual enforcement pressure suffered y which can be modeled as U(x, y) = x - ye;
A8: Dealers enter the market if and only if U(x, y) is greater than the dealers' reservation wage w0; and
A9: Sales are a function only of the number of dealers N, and are not a function of the enforcement pressure E directly. And, this function can be modeled as Q(N) = aMN for A E (0, 1].
5. ANALYSIS OF THE MODEL
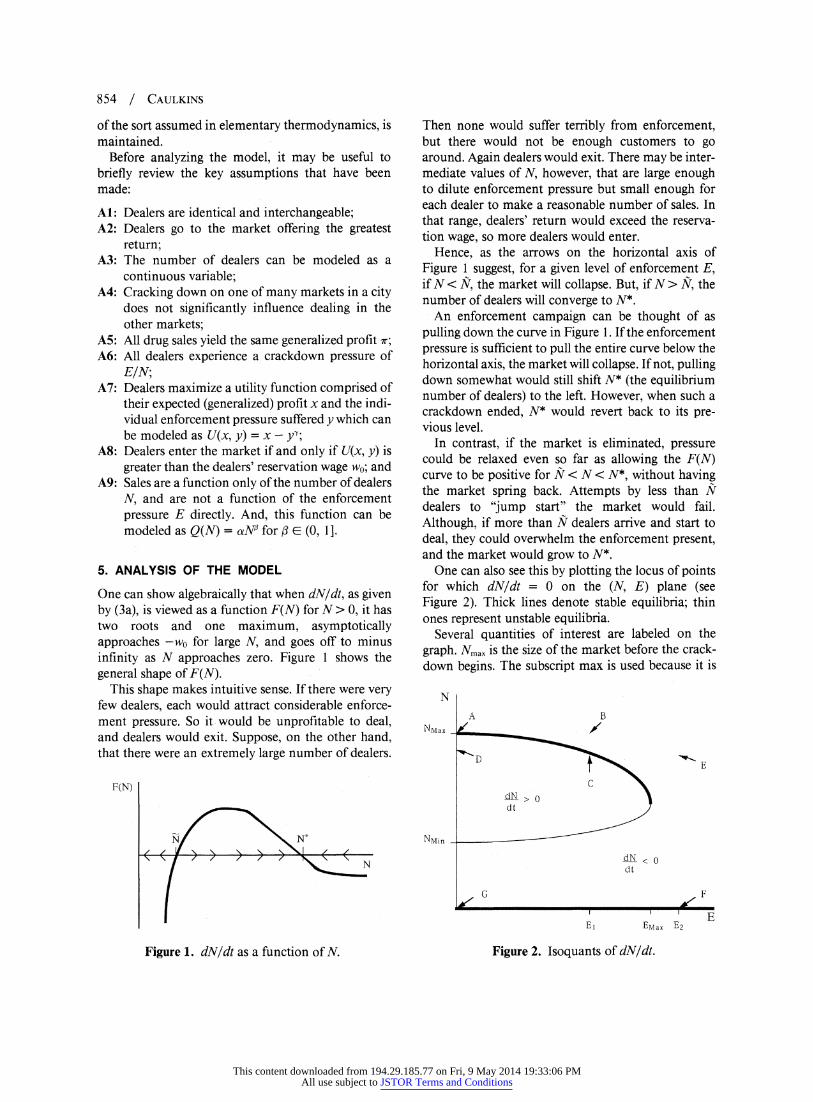
One can show algebraically that when dN/dt, as given by (3a), is viewed as a function F(N) for N > 0, it has two roots and one maximum, asymptotically approaches -w0 for large N, and goes off to minus infinity as N approaches zero. Figure 1 shows the general shape of F(N).
This shape makes intuitive sense. If there were very few dealers, each would attract considerable enforce- ment pressure. So it would be unprofitable to deal, and dealers would exit. Suppose, on the other hand, that there were an extremely large number of dealers.
Then none would suffer terribly from enforcement, but there would not be enough customers to go around. Again dealers would exit. There may be inter- mediate values of N, however, that are large enough to dilute enforcement pressure but small enough for each dealer to make a reasonable number of sales. In that range, dealers' return would exceed the reserva- tion wage, so more dealers would enter.
Hence, as the arrows on the horizontal axis of Figure 1 suggest, for a given level of enforcement E, if N < A, the market will collapse. But, if N > N, the number of dealers will converge to N*.
An enforcement campaign can be thought of as pulling down the curve in Figure 1. If the enforcement pressure is sufficient to pull the entire curve below the horizontal axis, the market will collapse. If not, pulling down somewhat would still shift N* (the equilibrium number of dealers) to the left. However, when such a crackdown ended, N* would revert back to its pre- vious level.
In contrast, if the market is eliminated, pressure could be relaxed even so far as allowing the F(N) curve to be positive for N < N < N*, without having the market spring back. Attempts by less than N dealers to 'jump start" the market would fail. Although, if more than N dealers arrive and start to deal, they could overwhelm the enforcement present, and the market would grow to N*.
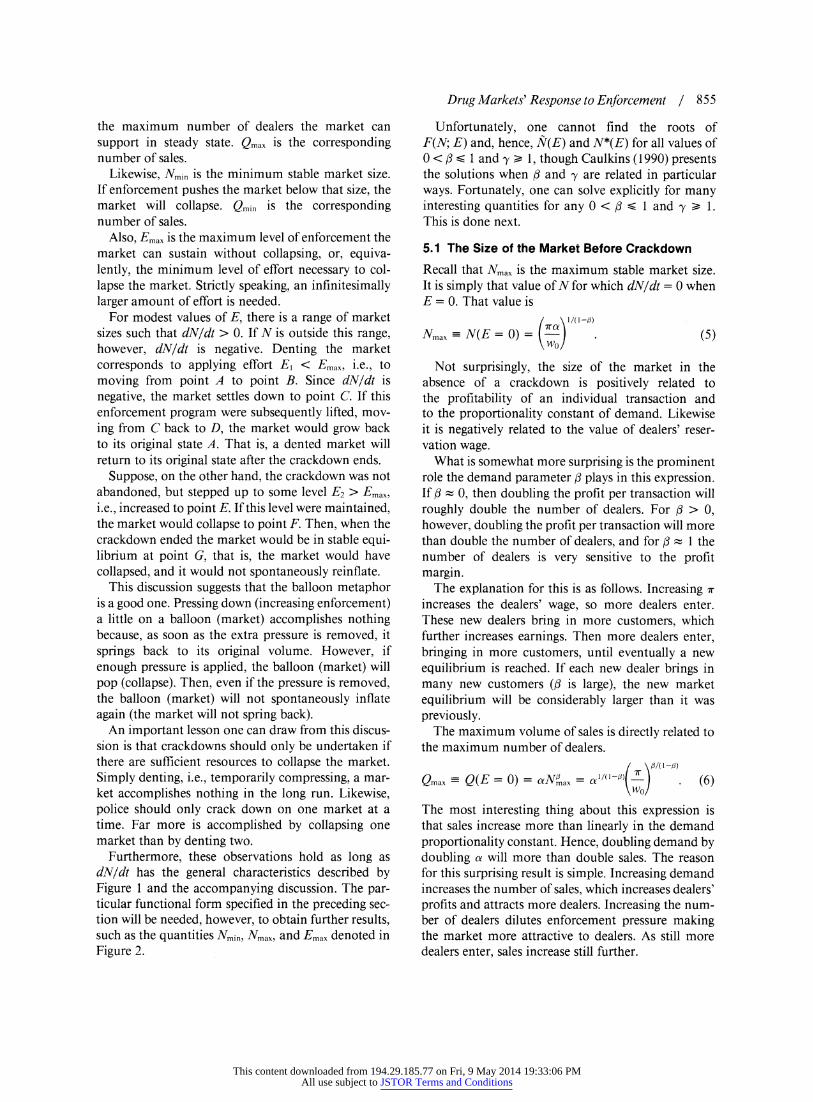
One can also see this by plotting the locus of points for which dN/dt = 0 on the (N, E) plane (see Figure 2). Thick lines denote stable equilibria; thin ones represent unstable equilibria.
Several quantities of interest are labeled on the graph. Nina. is the size of the market before the crack- down begins. The subscript max is used because it is
F(N)
N N*
Figure 1. dN/dt as a function of N.
N
A B NMax / X
D E B ~~~~~~~~~~~~E
C
AN > o dt
NMi_
giN < o dt
iG =,F E
E, EMax B2
Figure 2. Isoquants of dN/dt.
This content downloaded from 194.29.185.77 on Fri, 9 May 2014 19:33:06 PMAll use subject to JSTOR Terms and Conditions
DrugMarkets'ResponsetoEnforcement / 855
the maximum number of dealers the market can support in steady state. Qrax is the corresponding number of sales.
Likewise, Nmin is the minimum stable market size. If enforcement pushes the market below that size, the market will collapse. Qmin is the corresponding number of sales.
Also, Emax is the maximum level of enforcement the market can sustain without collapsing, or, equiva- lently, the minimum level of effort necessary to col- lapse the market. Strictly speaking, an infinitesimally larger amount of effort is needed.
For modest values of E, there is a range of market sizes such that dN/dt > 0. If N is outside this range, however, dN/dt is negative. Denting the market corresponds to applying effort El < Emax, i.e., to moving from point A to point B. Since dN/dt is negative, the market settles down to point C. If this enforcement program were subsequently lifted, mov- ing from C back to D, the market would grow back to its original state A. That is, a dented market will return to its original state after the crackdown ends.
Suppose, on the other hand, the crackdown was not abandoned, but stepped up to some level E2 > Emax, i.e., increased to point E. If this level were maintained, the market would collapse to point F. Then, when the crackdown ended the market would be in stable equi- librium at point G, that is, the market would have collapsed, and it would not spontaneously reinflate.
This discussion suggests that the balloon metaphor is a good one. Pressing down (increasing enforcement) a little on a balloon (market) accomplishes nothing because, as soon as the extra pressure is removed, it springs back to its original volume. However, if enough pressure is applied, the balloon (market) will pop (collapse). Then, even if the pressure is removed, the balloon (market) will not spontaneously inflate again (the market will not spring back).
An important lesson one can draw from this discus- sion is that crackdowns should only be undertaken if there are sufficient resources to collapse the market. Simply denting, i.e., temporarily compressing, a mar- ket accomplishes nothing in the long run. Likewise, police should only crack down on one market at a time. Far more is accomplished by collapsing one market than by denting two.
Furthermore, these observations hold as long as dN/dt has the general characteristics described by Figure 1 and the accompanying discussion. The par- ticular functional form specified in the preceding sec- tion will be needed, however, to obtain further results, such as the quantities Nmin, Nmax, and Emax denoted in Figure 2.
Unfortunately, one cannot find the roots of F(N; E) and, hence, N(E) and N*(E) for all values of 0 < 0 < 1 and y > 1, though Caulkins (1990) presents the solutions when / and y are related in particular ways. Fortunately, one can solve explicitly for many interesting quantities for any 0 < I S 1 and y ? 1. This is done next.
5.1 The Size of the Market Before Crackdown
Recall that Nma, is the maximum stable market size. It is simply that value of N for which dN/dt = 0 when E = 0. That value is
I AI -O)
Nmax-N(E=0= wo (5)
Not surprisingly, the size of the market in the absence of a crackdown is positively related to the profitability of an individual transaction and to the proportionality constant of demand. Likewise it is negatively related to the value of dealers' reser- vation wage.
What is somewhat more surprising is the prominent role the demand parameter d plays in this expression. If A / 0, then doubling the profit per transaction will roughly double the number of dealers. For : > 0, however, doubling the profit per transaction will more than double the number of dealers, and for / _ 1 the number of dealers is very sensitive to the profit margin.
The explanation for this is as follows. Increasing wr
increases the dealers' wage, so more dealers enter. These new dealers bring in more customers, which further increases earnings. Then more dealers enter, bringing in more customers, until eventually a new equilibrium is reached. If each new dealer brings in many new customers (/ is large), the new market equilibrium will be considerably larger than it was previously.
The maximum volume of sales is directly related to the maximum number of dealers.
Qmax, Q(E 0) = yNMLax = a. (6)
The most interesting thing about this expression is that sales increase more than linearly in the demand proportionality constant. Hence, doubling demand by doubling a will more than double sales. The reason for this surprising result is simple. Increasing demand increases the number of sales, which increases dealers' profits and attracts more dealers. Increasing the num- ber of dealers dilutes enforcement pressure making the market more attractive to dealers. As still more dealers enter, sales increase still further.
This content downloaded from 194.29.185.77 on Fri, 9 May 2014 19:33:06 PMAll use subject to JSTOR Terms and Conditions
856 / CAULKINS
The key to this feedback is that dealers' costs decrease as the market grows. This is an economy of scale, and economies of scale can give rise to downward sloping supply curves. Caulkins (1990, Chapter 7) discusses some of the interesting implica- tions of downward sloping supply curves for illicit drugs.
Equation 6 also shows that, no matter what the demand parameter d is,
Qmax = Nmax. (7) 7r
Thus, the volume of sales in a market before a crack- down is proportional to the number of dealers. Fur- thermore, since the reservation wage wo is the same for all markets, the proportionality constant is gov- erned by ir. If, for example, two markets have similar 7r's and one market has twice as many dealers as another, it probably also generates about twice as many sales. The ability to draw such inferences is important because, while it is difficult to measure the number of dealers, it is next to impossible to measure directly the volume of sales. Equation 7 gives an indirect way to measure sales.
5.2. The Amount of Effort Needed to Collapse a Market
The quantity Emax is the maximum enforcement effort the market can sustain without collapsing. It is the effort needed to make
Max IF(N)} 0. (8) N>O
The solution is
Emax =/ ( y
WO Nmax (9)
Since wo is constant across all markets in a city, (9) implies that the amount of effort needed to collapse a market is proportional to the market's size. Combin- ing (7) and (9) gives Emax
-K- + A) wU ') 4 rQmax. (10)
So, this result holds whether market size is measured in terms of the number of dealers or the volume of sales, as long as 7r does not vary appreciably from market to market.
That the effort needed to collapse a market is pro- portional to its size is certainly plausible, but a priori other results would have been plausible too. Without the model it would be hard to argue persuasively that
the effort needed is not proportional to the square of the market's size or to the size of the market raised to some other power.
If the effort required is proportional to the size of the market it makes sense to speak of a critical ratio of enforcement pressure to market size, as Kleiman hypothesized would be the case (Kleiman pp. 25-26 and p. 29). Kleiman notes that the Lynn crackdown, which he considers a success, involved about one officer for every 75 users. In contrast, the Lawrence crackdown, which seems not to have achieved lasting results, involved about one officer for every 150 users. It may be that the ratio of Emax to the size of the market for markets like those (assuming they are similar) is between 1/150 and 1/75 when measured in these units.
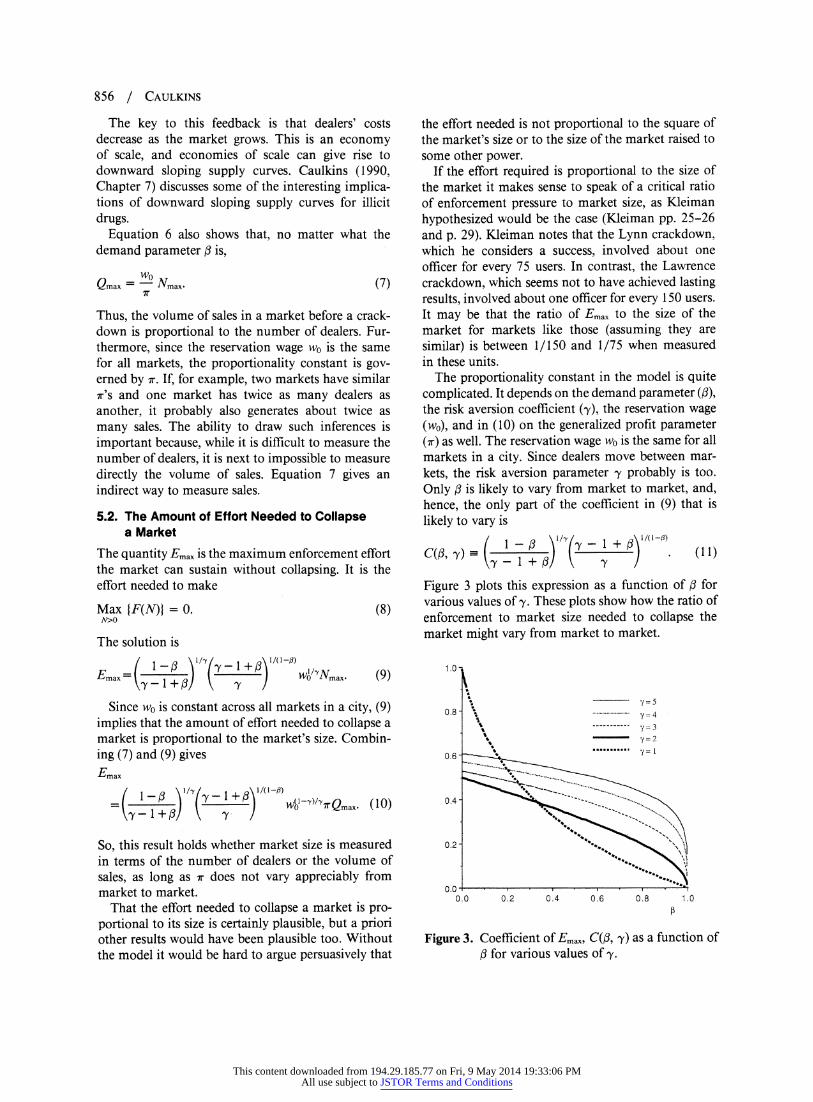
The proportionality constant in the model is quite complicated. It depends on the demand parameter (.), the risk aversion coefficient (y), the reservation wage (w0), and in (10) on the generalized profit parameter (wr) as well. The reservation wage w0 is the same for all markets in a city. Since dealers move between mar- kets, the risk aversion parameter My probably is too. Only d is likely to vary from market to market, and, hence, the only part of the coefficient in (9) that is likely to vary is
) I( - 1 /Y' + F) (
/0 -) (1
Figure 3 plots this expression as a function of fi for various values of y. These plots show how the ratio of enforcement to market size needed to collapse the market might vary from market to market.
1.0
75 0.8 % ...... y=4
-----------= -{=3 is - i y=2
0.6 . -
0.4
04 _=
-
0.2 "b
0.0 0.0 0.2 0.4 0.6 0.8 1.0
Figure 3. Coefficient of Emax, C(f, y) as a function of f for various values of y.
This content downloaded from 194.29.185.77 on Fri, 9 May 2014 19:33:06 PMAll use subject to JSTOR Terms and Conditions
Drug Markets' Response to Enforcement / 857
The ratio of Emax to the size of the market is greatest for smaller values of fi. When y is not too large, the variation can be substantial.
Consider how this information could be used. Sup- pose that police are confronted with two markets of the same size, but one of the markets is a "buyers' market" (fi is small) and the other is a "sellers' market" (fi is closer to 1). Since C(Q, ey) decreases in fi, it would probably be easier, perhaps even much easier, to col- lapse the second market.
Markets with large Ol's are sellers' markets because dealers are in relatively short supply in the sense that the number of customers would increase if the number of dealers did. In contrast, when /3 is small, it is a buyer's market. There is a relative surplus of dealers because changes in the number of dealers would not appreciably affect the number of customers.
This suggests following the maxim, "Go for the weak link." For markets of a given size, enforcement aimed at dealers will be more effective if availability of dealers is the limiting factor, i.e., if f is close to 1. If , is small so customers are in short supply, some other tactic, such as demand reduction measures designed to reduce a, might be more effective (see Caulkins 1990, Chapter 4 for more on this).
The result above is also one of many in which the demand parameter fi plays an important role. This raises the question of how fi might be measured. Two possible ways are to measure the elasticity of market size with respect to demand and the elasticity of demand with respect to the number of dealers. In symbols, these quantities are
%ANmax _ dNmax ae 1 (12)
%Aa dot Nmax 1 -(2
and
%AQ dQ N (13)
Note that the first result is the same whether one measures market size in terms of dealers or number of sales.
Neither of these elasticities can be measured empir- ically because the independent variable is not control- lable (or even easy to measure, particularly in the first case). The first is also difficult to estimate subjectively because it is directly affected by easing the positive feedback effect and systems with feedback are difficult to understand intuitively.
Someone with first-hand knowledge of the market in question (for example, that neighborhood's patrol officer) might, however, be able to guess at the answer to the question, "By what fraction would sales increase
if the number of dealers increased by 10%?" (Of course, to be precise, one would ask about infinitesi- mal changes; but, that might only confuse someone who is not accustomed to thinking in those terms.) That answer would give an estimate of d directly.
A little reflection might reveal which of two markets has the larger fi, even if neither value can be measured. For example, compare a market on a dead-end or little traveled street with one on a street that leads to other markets. The former probably has the larger A
because customers will only visit it if they think there are dealers there. In contrast, customers will travel the second street even if there are no dealers out.
Similarly, a market in which most of the dealers carry beepers may have a larger /3 if the dealers instruct their customers to come to that street to make their purchase. The more dealers there are, the more cus- tomers will come to that street. Likewise, if a large fraction of the customers are mobile, then fi would likely be large because such customers would naturally gravitate toward busy markets.
5.3. The Minimum Viable Market Size
The value of Nmin is just N(Emax), i.e., the value of N for which F(N) = 0 when E = Emax. This value is
Nmax( (14)
So Nmin is proportional to Nmax. That is, for given values of A and y, no matter what the market's original size, it will have to be reduced by the same fraction before it collapses. This is true whether size is mea- sured in terms of the number of dealers or the volume of sales since
Qrnin = a Nm= a(1 - 1 NO
= (i- 1 _fl):/([' lQrnax. (15)
SO Qmin is proportional to Qmax. The proportionality constants differ. In particular,
defining
Nmi1 1 A/I -() nlmin ( 1 - (16)
and
qmin =m (a a ) (17)
This content downloaded from 194.29.185.77 on Fri, 9 May 2014 19:33:06 PMAll use subject to JSTOR Terms and Conditions
858 / CAULKINS
one can see that
qmin =min. (18)
Since nmin < 1 and A < 1, this says that just before the market collapses, the volume of sales will be reduced by a smaller fraction than the number of dealers will be.
A moment's reflection reveals that this is really a consequence of the assumption that sales increase less than linearly in the number of dealers, which seems to be a reasonable assumption. As a result, one is left with the disturbing conclusion that local operations may accomplish less than it appears they do, at least if the underlying objective is to reduce sales and the surrogate measure for sales is the number of active dealers. In particular, this suggests that drug-use related property crime probably falls by a smaller fraction than does the number of dealers.
Taking derivatives shows that both nmim and qm-n are increasing in a, although they are increasing at a decreasing rate. This is reasonable. The more risk averse the dealers, the less enforcement can shrink the market before it collapses.
The dependence on d is more complex. First, nt,,n is increasing in 3, while qIn is a decreasing function of d. To understand why this is so, think about a market in which there is a surplus of dealers (3 is small). Then even after a great deal of pressure has been applied, sales will not necessarily decrease sub- stantially because there was originally a surplus of dealers. So, qmln is large for small d. In contrast, the enforcement pressure can be expected to be relatively successful at driving away dealers because it was a buyer's market and, hence, was relatively unappealing to the dealers. Therefore, nfmin is small for small d.
Equation 7 indicates the average number of sales a dealer makes per day when there is no (extra) enforce- ment (N = Nmax and Q = Qmax) is wo/w. By (14) and (1 5), just before enforcement bursts the market
Q _Qm in _O t r 8 WO >w ~~~~~~ ~ ~
> -(1 9) N Nmin \ + I 1r I
Thus, in a market that is squeezed by local enforce- ment but not yet burst, one would expect to see fewer dealers. However, these dealers would each be con- ducting more business and making more money than they were before the crackdown. This makes sense because dealers in that market must be compensated for the additional risk they incur. If dealers are risk averse and/or it is a sellers' market (d is close to 1), the number of sales per dealer will be larger when enforcement pressure is applied, but not much larger. However, if dealers are almost risk neutral and the
market was originally a buyers' market (f is small), the relatively few dealers who remain active just before the market collapses make many more sales per day than they did originally.
This section has shown that Emax is proportional to Nmax and Qmax; Nmin is proportional to Nmax; and Qmi is proportional to Qmax. Thus, the size of the market does not affect by what fraction one must push down to collapse the market; rather it is the nature of the demand and risk aversion, i.e., of d and y.
For a market of a given size, the smaller d is, the harder one must work to collapse the market. Also, the smaller d is, the farther one must push down before the market collapses when size is measured in terms of the number of dealers; however, when market size is measured in terms of the volume of sales, one has to push down farther to make the market collapse when : is large.
It is difficult to say how the effort needed to collapse the market depends on the risk aversion parameter - for two reasons. First, the coefficient C(3, y) is not monotonic in -y. Second, Emax = C(3, y)wo0,Nmax, and wo is not known quantitatively.
However, it is true that the more risk averse dealers are, the less the market can shrink before it collapses, no matter whether market size is measured in terms of the number of dealers or the volume of sales.
5.4. General Solution of E(N)
Although one cannot solve for N(E) for all 0 < I ? 1 and -y - 1, one can solve for the inverse function E(N). In equilibrium
-a ()-wo = 0, (20)
so
E = (OraNe - wo)"IN (21)
for Nmin - N < Nmax. Using the definition N nfNmax,
this implies
E = (n+-l -fnl)'1w Nmax. (22)
For two markets of the same size in one city, WO11^Nmax is a constant. Hence, the effort required to reduce the size of the market (measured in terms of the number of dealers) for given values of d and 7y is determined by (n+"-' - n)"1T. Denote this expression by e(n, ad, my). Taking derivatives shows that
de(n, 1, 7) 0, (23a)
5gnt ( - Sgn(n:' - y) (23b) d132
This content downloaded from 194.29.185.77 on Fri, 9 May 2014 19:33:06 PMAll use subject to JSTOR Terms and Conditions
DrugMarkets'ResponsetoEnforcement / 859
sgnde(n, j, o ) < 0, (23c)
dn d 2e(n, f3, y) dn
< ,(23d)
dny Sg(de(n, Sgnn - (1) ) (23e)
and
d2e(n, /3 ) < 0 if and only if d y
/1 1 -13( 1 N 11-3
(2) kI + eJ < (23f) Some of these derivatives can be translated into
simple English statements. For instance, (23a) con- firms that when d is small one needs to exert a larger fraction of the effort needed to collapse the market in order to achieve a given reduction in the size of the market. This means that when / is small a crackdown could be close to collapsing a market before much progress is apparent. In contrast, in a market with d 1, if little progress has been made after a significant fraction of the available resources have been applied, it is less likely that the market will collapse, even if all available enforcement resources are focused on that market. In that case, it might be wise to choose a smaller target.
This distinction is important because several researchers have advocated taking a "try it and see" approach (e.g., Kleiman 1988 and Barnett 1988). If d
is large, this seems sensible. If : is small, it may or may not be a good idea. If the trial program collapses the market, one would have a definitive answer about the effectiveness of the program. But if d is small and the crackdown does not make a substantial dent in the market, one cannot safely say that a modest incre- ment in effort would not be enough to collapse the market.
Equation 23c simply says that the more enforce- ment pressure that is applied, the smaller the market will be; (23d), however, is much more significant. It demonstrates that there is positive feedback for all values of y and F. That is, the marginal decrement in market size for a given increment in enforcement will increase in absolute value as enforcement pressure increases. In other words, there are economies of scale in local enforcement. So, according to the model, crackdowns do, in fact, produce efficiency gains that might justify their obvious inequity.
The derivatives with respect to y are harder to interpret. Also, they are less important because My would generally be constant throughout the city.
5.5. Will the Market Spring Back After a Crackdown?
A key question is, Do crackdowns produce lasting results? To be more specific, after a "successful" crack- down has eliminated dealing in a market, will the market spring back when the extra pressure applied during the crackdown is removed?
In general, the answer is that even a small amount of pressure can keep individuals from beginning to deal again because they would attract the full burden of the enforcement. However, if a group of dealers arrives at one time, they may be able to 'jump start" the market. A natural question then is, "How much enforcement pressure must be maintained to prevent a given number of dealers from jump starting a market?
Let N be the number of dealers attempting to revive the market. If N > Nmin, then one needs to have enforcement E = Emax. If N < Nmin, less pressure is needed. The minimum amount needed is that level of enforcement for which dN/dt is initially negative. That level is sufficient because as N decreases dN/dt becomes more negative.
So, E must be large enough that
- (I)- W <0. (24)
Letting n- N/Nina, and eN= E/Emax, this implies that one needs
/T+ d- 10/-Y 1 AI -0)
VN 1 I JV +: -
1
* In - n (25)
For any given market, 3 and My are constant. There- fore, the effort needed as a function of n' is propor- tional to
[n+:-- - [ ni - I]in. (26)
What is most striking about this expression is how quickly the requisite maintenance pressure increases as a function of n'. This has important implications. First, it helps explain why coordinating mechanisms, such as gangs, can catalyze the creation of drug markets.
Imagine the situation after a market has collapsed. There are likely to be many former and would-be dealers nearby. None would volunteer to be the first to step out on the street and deal because that individ- ual would suffer the full brunt of the enforcement. But many would be happy to deal if they could be assured that others would start dealing at the same time, so that no one individual would be too likely to
This content downloaded from 194.29.185.77 on Fri, 9 May 2014 19:33:06 PMAll use subject to JSTOR Terms and Conditions
860 / CAULKINS
be arrested. In short, the dealers suffer from a lack of coordination, and it is conceivable that organized gangs can provide the level of coordination required to jump start the market.
Note that gangs can play a decisive role in the creation of markets even if they do not ultimately control a large fraction of the sales. To see this, sup- pose that n = 0.2 gang members jump start a market. Then as many as four times that many individual entrepreneurs will join the nascent market. So, when someone observes a mature market they might incor- rectly assume gangs played a minor role in creating that market because they are only making 20% of the sales.
This discrepancy is further compounded if the gang continues to colonize new markets. For a period after the gang first colonizes a market, its members earn wages exceeding the reservation wage; that is why other dealers enter. However, once the market matures, all dealers make wo. This gives gangs an incentive to colonize new markets. Hence, one gang that currently accounts for a relatively small fraction of the dealing in one fairly mature market may actually have been responsible for the creation of that market and others like it.
Equation 26 also underscores the value of nipping a nascent market in the bud. It is far easier to stamp out a nascent market than it is to clean up a mature market.
A third implication is that, even if police manage to clean up several markets, they might have to allocate so much effort to maintenance that they can no longer muster the strength needed to collapse- any of the remaining markets.
The two preceding points, taken together, suggest that the police may not be able to carry out a crack- down campaign alone; they may need assistance from the community. If community cohesiveness is restored in the former markets, residents promptly report any resurgence of dealing in a collapsed market, and the police respond promptly to these reports, then the police will not have to provide such a large mainte- nance presence. The need for police-community coop- eration is one of the fundamental tenets of community policing, and Moore and Kleiman (1990) discuss its importance in the context of the drug problem. This section backs up their statements by describing an explicit scenario in which such cooperation is vital.
The need for community support implies that police need to do crackdowns "nicely." In particular, they need to avoid aggravating racial tensions and aliena- tion from authorities. If the police cannot complete a crackdown without damaging police-community rela- tions, it is probably not worth undertaking the crack-
down because the dealing could very possibly spring back.
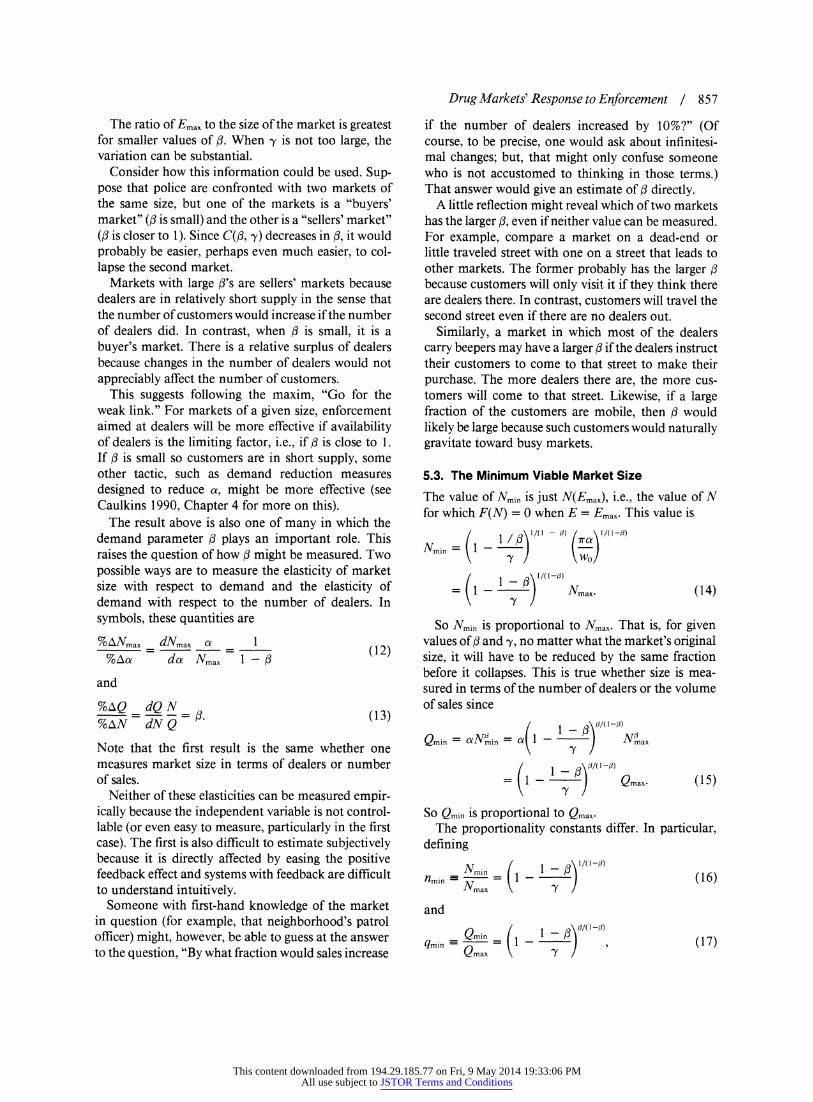
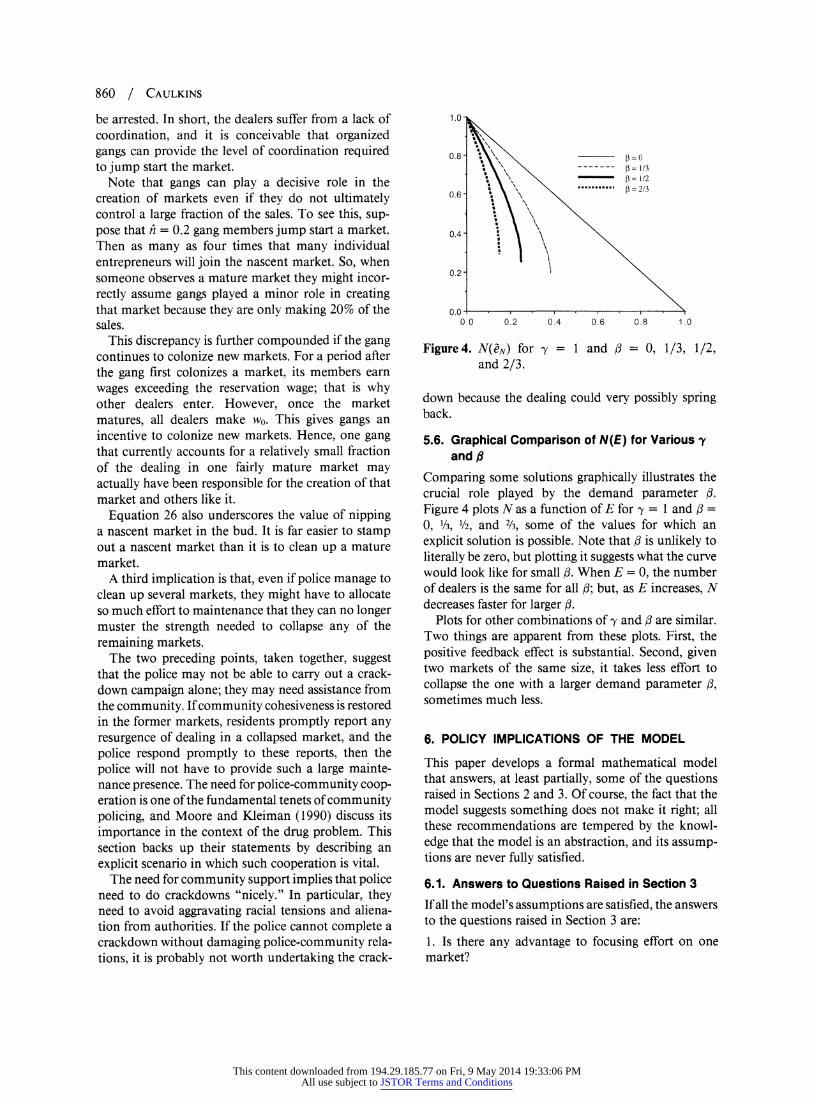
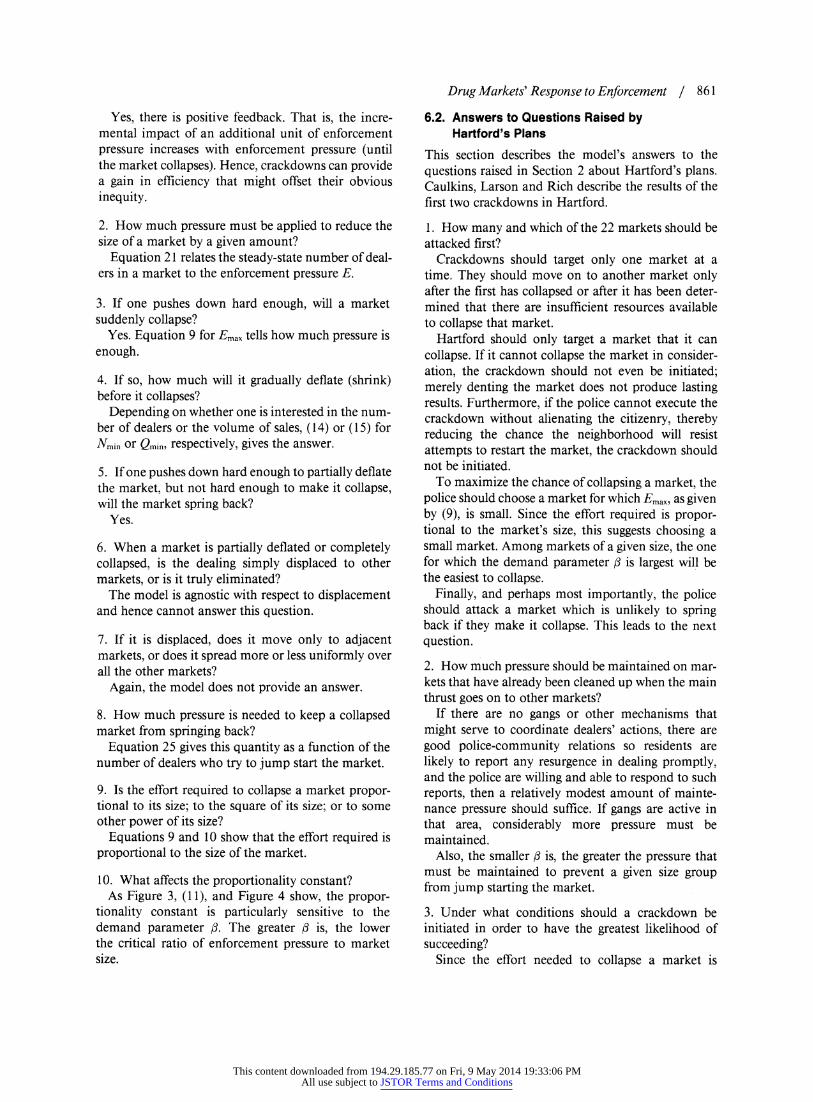
5.6. Graphical Comparison of N(E) for Various y and ,8
Comparing some solutions graphically illustrates the crucial role played by the demand parameter d. Figure 4 plots N as a function of E for Py = 1 and d
0, 1'3, 1/2, and 2/3, some of the values for which an explicit solution is possible. Note that d is unlikely to literally be zero, but plotting it suggests what the curve would look like for small d. When E = 0, the number of dealers is the same for all A; but, as E increases, N decreases faster for larger A.
Plots for other combinations of Py and d are similar. Two things are apparent from these plots. First, the positive feedback effect is substantial. Second, given two markets of the same size, it takes less effort to collapse the one with a larger demand parameter A, sometimes much less.
6. POLICY IMPLICATIONS OF THE MODEL
This paper develops a formal mathematical model that answers, at least partially, some of the questions raised in Sections 2 and 3. Of course, the fact that the model suggests something does not make it right; all these recommendations are tempered by the knowl- edge that the model is an abstraction, and its assump- tions are never fully satisfied.
6.1. Answers to Questions Raised in Section 3
If all the model's assumptions are satisfied, the answers to the questions raised in Section 3 are:
1. Is there any advantage to focusing effort on one market?
1.0
0.8 30 --- - - 3 - 1/3
132= 0
0.6 *=2/3
0.4
0.2
0.0 . 0.0 0.2 0.4 0.6 0.8 1.0
Figure 4. N(eN) for Iy = 1 and f = 0, 1/3, 1/2, and 2/3.
This content downloaded from 194.29.185.77 on Fri, 9 May 2014 19:33:06 PMAll use subject to JSTOR Terms and Conditions
DrugMarkets' Response to Enforcement / 861
Yes, there is positive feedback. That is, the incre- mental impact of an additional unit of enforcement pressure increases with enforcement pressure (until the market collapses). Hence, crackdowns can provide a gain in efficiency that might offset their obvious inequity.
2. How much pressure must be applied to reduce the size of a market by a given amount?
Equation 21 relates the steady-state number of deal- ers in a market to the enforcement pressure E.
3. If one pushes down hard enough, will a market suddenly collapse?
Yes. Equation 9 for Emax tells how much pressure is enough.
4. If so, how much will it gradually deflate (shrink) before it collapses?
Depending on whether one is interested in the num- ber of dealers or the volume of sales, (14) or (15) for Nmin or Qin, respectively, gives the answer.
5. If one pushes down hard enough to partially deflate the market, but not hard enough to make it collapse, will the market spring back?
Yes.
6. When a market is partially deflated or completely collapsed, is the dealing simply displaced to other markets, or is it truly eliminated?
The model is agnostic with respect to displacement and hence cannot answer this question.
7. If it is displaced, does it move only to adjacent markets, or does it spread more or less uniformly over all the other markets?
Again, the model does not provide an answer.
8. How much pressure is needed to keep a collapsed market from springing back?
Equation 25 gives this quantity as a function of the number of dealers who try to jump start the market.
9. Is the effort required to collapse a market propor- tional to its size; to the square of its size; or to some other power of its size?
Equations 9 and 10 show that the effort required is proportional to the size of the market.
10. What affects the proportionality constant? As Figure 3, (11), and Figure 4 show, the propor-
tionality constant is particularly sensitive to the demand parameter d. The greater A is, the lower the critical ratio of enforcement pressure to market size.
6.2. Answers to Questions Raised by Hartford's Plans
This section describes the model's answers to the questions raised in Section 2 about Hartford's plans. Caulkins, Larson and Rich describe the results of the first two crackdowns in Hartford.
1. How many and which of the 22 markets should be attacked first?
Crackdowns should target only one market at a time. They should move on to another market only after the first has collapsed or after it has been deter- mined that there are insufficient resources available to collapse that market.
Hartford should only target a market that it can collapse. If it cannot collapse the market in consider- ation, the crackdown should not even be initiated; merely denting the market does not produce lasting results. Furthermore, if the police cannot execute the crackdown without alienating the citizenry, thereby reducing the chance the neighborhood will resist attempts to restart the market, the crackdown should not be initiated.
To maximize the chance of collapsing a market, the police should choose a market for which Emax, as given by (9), is small. Since the effort required is propor- tional to the market's size, this suggests choosing a small market. Among markets of a given size, the one for which the demand parameter d is largest will be the easiest to collapse.
Finally, and perhaps most importantly, the police should attack a market which is unlikely to spring back if they make it collapse. This leads to the next question.
2. How much pressure should be maintained on mar- kets that have already been cleaned up when the main thrust goes on to other markets?
If there are no gangs or other mechanisms that might serve to coordinate dealers' actions, there are good police-community relations so residents are likely to report any resurgence in dealing promptly, and the police are willing and able to respond to such reports, then a relatively modest amount of mainte- nance pressure should suffice. If gangs are active in that area, considerably more pressure must be maintained.
Also, the smaller f is, the greater the pressure that must be maintained to prevent a given size group from jump starting the market.
3. Under what conditions should a crackdown be initiated in order to have the greatest likelihood of succeeding?
Since the effort needed to collapse a market is
This content downloaded from 194.29.185.77 on Fri, 9 May 2014 19:33:06 PMAll use subject to JSTOR Terms and Conditions

862 / CAULKINS
proportional to its size, the crackdown should begin when the market is already smaller than usual, not when the dealing is "fast and furious." The police may want to attack a busy market for other reasons, for example, if their goal is to make as many arrests as possible. If the objective is to collapse a market, how- ever, they should crack down when the market is relatively quiet. That is, the crackdown should begin when the demand parameter (a) is small, the profita- bility per transaction (ir) is small, and/or the reserva- tion wage (w0) is large.
The demand parameter a is probably smallest dur- ing the week (and not over the weekend), on days other than pay day and welfare check days, and in bad weather. The generalized profit per sale ir is probably relatively constant, unless it decreases when there is an outburst of dealer-dealer violence. Cracking down during an episode of such violence might also increase the chances of obtaining community support. It may be that w0 is largest during the school year because the younger dealers have something to do besides dealing. Obviously, w0 will be higher during good economic times, but a might also increase when the economy is strong. Furthermore, waiting for a change in the nation's economy before beginning a local crackdown might be difficult to explain to the citizenry.
7. EXTENSIONS, REFINEMENTS, AND FURTHER WORK
The basic model presented here makes pragmatic recommendations for conducting local drug enforce- ment, but the model invites extensions and further work. Some of this work is included in Caulkins (1990), some is being pursued by Baveja (e.g., Baveja et al. 1992, 1993), but much more remains to be done.
An obvious extension would be to model displace- ment and multimarket effects. One would like to close down all the markets in a city by attacking each in succession. In the latter part of such a campaign the basic model's assumption that the police are cracking down on one or a few of many markets in a city would be violated. A related issue of interest is market formation. Where do new markets form, and why?
The second broad area for further work is determin- ing the optimal rate of evolution of enforcement pres- sure. The model presented here suggests a new way of thinking about local enforcement. In the past, the objective has typically been to arrest as many drug dealers as possible, but arrests are really more a means than an end. The model suggests making the objective to minimize the resources expended (including the
number of arrests made) subject to the constraint that a particular goal (such as collapsing a market) is achieved. Hence, an optimal control paradigm may be appropriate.
To illustrate this, consider the following problem. Design an enforcement program of some finite dura- tion that minimizes the total cost to society from both the market and enforcement, subject to the constraint that the market be eliminated by the end of the program. In other words,
rT min J C(E(t), N(t)) dt
TO<E(t)<T 0
subject to
dN ErcdNP 1E 1 = c1LN -woJ -WoJ, N(T) =0 (27)
where C(E(t), N(t)) is a cost function. In general this is a difficult problem, but Baveja et al. (1993) solve the special case in which C(E(t), N(t)) = E(t).
Another refinement would be to relax the assump- tions that all markets, all dealers, and all customers are interchangeable. Caulkins, Larson and Rich con- sider how differences in local geography can affect the relative success of crackdowns on different markets. Caulkins (1990, Chapter 4) discusses the implications of heterogeneity in dealers' reservation wages, but other forms of heterogeneity (such as capacity for violence) are worth studying as well. Finally, differ- ences between customers in different markets almost certainly exceed what can be captured in the single parameter 3.
Another area for further work would be explicitly modeling different enforcement tactics. In the basic model, enforcement pressure is intentionally modeled abstractly by a single variable E. A more detailed model might distinguish between "buy busts," "jump- outs," "reverse stings," high-visibility patrol, under- cover surveillance, and other tactics. Such a model would also have to consider different dealing strategies (anonymous street sales, dealing from houses, beeper sales, etc.) and the interplay between enforcement and sales strategies. Such a model might shed light on the optimal mix of enforcement tactics and the optimal division of effort between enforcement against dealers and enforcement against users.
8. CONCLUSIONS
This paper presents a model of how a street market for illicit drugs might respond to a crackdown. It leads to concrete suggestions for how cities should manage
This content downloaded from 194.29.185.77 on Fri, 9 May 2014 19:33:06 PMAll use subject to JSTOR Terms and Conditions
Drug Markets' Response to Enforcement / 863
their local enforcement operations and suggests a number of extensions and refinements that could lead to further insights.
In general, drug policy is an important public policy issue that has largely been neglected by the operations research community. The structure provided by math- ematical models could, however, clarify many of the vexing issues in this area and, hence, contribute to the policy debate.
ACKNOWLEDGMENT
The author thanks his thesis supervisor Arnold I. Barnett and the other members of his committee, Richard C. Larson and Mark A. R. Kleiman, for their assistance with this work. He also thanks detectives Chris Lyons and Rich Perotta, Lieutenant Brian Kelley, and the rest of Hartford's Vice and Narcotics Division for giving him the chance to observe drug markets first-hand.
REFERENCES
BARNETT, A. 1988. Drug Crackdowns and Crime Rates: A Comment on the Kleiman Report. In Street- Level Drug Enforcement: Examining the Issues, Marcia R. Chaiken (ed.). National Institute of Justice, Washington, D.C.
BAVEJA, A., R. BATTA, J. P. CAULKINS AND M. H. KARWAN. 1992. Collapsing Street Markets for Illicit Drugs: The Benefits of Being Decisive. Mimeo, State University of New York at Buffalo.
BAVEJA, A., R. BATTA, J. P. CAULKINS AND M. H. KARWAN. 1993. Modeling the Response of Illicit Drug Markets to Local Enforcement. J. Socio-Econ. Plan. Sci. (to appear).
BECKER, G. S. 1976. The Economic Approach to Human Behavior. The University of Chicago Press, Chicago.
BROWN, G. F., AND L. P. SILVERMAN. 1974. The Retail Price of Heroin: Estimation and Applications. J. Am. Statis. Assoc. 69 (347), 595-606.
CAULKINS, J. P. 1990. The Distribution and Consump- tion of Illicit Drugs: Some Mathematical Models and Their Policy Implications. Ph.D. Dissertation, Operations Research Center, Massachusetts Institute of Technology, Cambridge, Mass.
CAULKINS, J. P. 1992. Thinking About Displacement in Drug Markets: Why Observing Change of Venue Isn't Enough. J. Drug Issues 22 (1), 17-30.
CAULKINS, J. P., R. C. LARSON AND T. F. RICH. 1993.
Geography's Impact on the Success of Focused Local Drug Enforcement Operations. J. Socio-Econ. Plan. Sci. (to appear).
CHAIKEN, M. R. (ED.). 1988. Street-Level Drug Enforce- ment: Examining the Issues. National Institute of Justice, Washington, D. C.
GARREAU, J. 1989. Washington's Underworld Entrepre- neurs: Applying Free-Market Analysis to the Drug Trade in Our Nation's Capital. The Washington Post National Weekly Edition. April 10-16, 10-1 1.
HAYESLIP, D. W., JR. 1989. Local-level Drug Enforce- ment: New Strategies. National Institute of Justice, NIJ Reports, No. 213, 2-7.
International Drug Report. 1989. Record 20 Tons of Cocaine Seized in Los Angeles Warehouse. Interna- tional Narcotic Enforcement Officers Association, 30 (10), Albany, N. Y.
KAPLAN, J. 1983. The Hardest Drug: Heroin and Public Policy. The University of Chicago Press, Chicago.
KLEIMAN, M. A. R. 1988. Crackdowns: The Effects of Intensive Enforcement on Retail Heroin Dealing. In Street-Level Drug Enforcement: Examining the Issues, M. R. Chaiken (ed.), National Institute of Justice, Washington, D.C.
MOORE, M. H. 1973. Policies to Achieve Discrimination on the Effective Price of Heroin. Am. Econ. Rev. 63 (2), 270-277.
MOORE, M. H., AND M. A. R. KLEIMAN. 1989. The Police and Drugs. Perspectives on Policing, No. 11, National Institute of Justice, Washington, D.C.
PITT, D. E. 1989. Surge in New York Drug Arrests Sets Off Criminal-Justice Crisis. The New York Times, April 4, p. B1.
REUTER, P., G. CRAWFORD AND J. CAVE. 1988. Sealing the Borders: The Effects of Increased Military Par- ticipation in Drug Interdiction. R-3594-USDP, The RAND Corporation, Santa Monica, Calif.
REUTER, P., AND M. A. R. KLEIMAN. 1986. Risks and Prices: An Economic Analysis of Drug Enforcement. In Crime and Justice: An Annual Review of Research, Vol. 7, M. Tonry and N. Morris (eds.). University of Chicago Press, Chicago, 289-340.
REUTER, P., R. MACCOUN, P. MURPHY, A. ABRAHAMSEN AND B. SIMON. 1990. Money From Crime: A Study of the Economics of Drug Retailing. R-3894-RF, The RAND Corporation, Santa Monica, Calif.
SULLIVAN, B. R. 1988. Hartford Police Department Study and Recommendations. Mimeo, Hartford Police Department, Hartford, Conn.
ZIMMER, L. 1987. Operation Pressure Point: The Disrup- tion of Street-Level Drug Trade on New York's Lower East Side. Occasional Papers from The Center for Research in Crime and Justice, New York University School of Law, New York.
This content downloaded from 194.29.185.77 on Fri, 9 May 2014 19:33:06 PMAll use subject to JSTOR Terms and Conditions