Embed Size (px)
Citation preview

LOCAL BUCKLING OF
STEEL TUBULAR COLUMNS
by
David Ford Grimm
A Thesis
Presented to the Graduate Co~~ittee
of Lehigh University
in Candidacy for the Degree of
Master of Science
in
Civil Engineering
FRITZ ENGINEERING LABORATORY UBRARYJ
Lehigh University
Dece:nbe~ 1979 450.7T"


ACKNOWLEDGMENTS
This investigation is part of two research projects on the local
buckling of cylindrical tubular columns being conducted at the Fritz
Engineering Laboratory, Lehigh University. Dr. Lynn S. Beedle is the
director of the Laboratory and Dr. David A. VanHorn is the chairman
of the Civil Engineering Department. This research has been sponsored
for the most part by the American Petroleum Institute.
The author wishes to gratefully acknowledge the guidance provided
by Dr. Alexis Ostapenko, his thesis advisor, who devoted a considerable
amount of time and effort to the project.
Sincere thanks are expressed to Dr. Roger G. Slutter and the
technical staff of the laboratory, especially Messrs. Robert Dales,
Kermit Eberts, Charles Hittinger, and Russell Logenbach, for their
assistance in setting up and conducting the tests. Special thanks
are due to Messrs. Michael Salley and Andre Vaucher for their valuable
assistance during the tests and in the reduction of the experimental
data. Gratitude is also expressed to Ms. Barbara Bryan, Shirley
Matlock, and Ruth Kneller for their patience and expertise in typing
the manuscript.
Finally, the author wishes to thank his wife, Debra, and his
daughters for their loving patience and support over the past year.
iii
TABLE OF CONTENTS
ABSTRACT
1 . INTRODUCTION
1.1 Background
1.2 Previous Research at Lehigh University
1.3 Objectives of Present Research
2. DESCRIPTION OF THE TEST SPECIMENS
2.1 Geometric Parameters
2.2 Material Properties
2.3 Fabrication Process
3. INITIAL GEOMETRIC IMPERFECTIONS
3.1 Standard Imperfections
3 .l.l 3 .1.2 3 .1.3
Definitions and Methods of Measurements Discussion of Imperfections Comparison with API Recommendations
3.2 Initial Shape
3.3 Local Imperfections
4. RESIDUAL STRESSES
4.1 General
4.2 Method of Measurement
4.3 Discussion of Residual Stresses
5. TEST PROCEDURE
5.1 Test Setup
5.2 Instrumentation
5.3 Test Sequence
iv
Page
.. - 1
3
3
4
4 . 6
6
6
9
11
11
11 12 13
14
14
16
16
17
18
21
21
. 21
23

6. TEST RESULTS
6.1 General Specimen Behavior
6.1.1 6.1.2 6 .1.3
Prebuckling Behavior Behavior at Buckling Post-Buckling Behavior
6.2 Behavior of Individual Specimens
6.2.1 6.2.2 6.2.3 6.2.4 6.2.5 6.2.6 6.2.7
Behavior of Specimen Tl Behavior of Specimen T2 Behavior of Specimen T3 Behavior of Specimen T4 Behavior of Specimen T5 Behavior of Specimen PlO Behavior of Specimen Pll
7. DISCUSSION OF TEST RESULTS
7.1 General Specimen Behavior
7 .1.1 7 .1.2 7 .1.3
Prebuckling Behavior Behavior at Buckling Post-Buckling Behavior
7.2 Comparison of Specimen Behavior
7.2.1 7.2.2 7.2.3
Comparison of Specimens Tl and T5 Comparison of Specimens T2, T3, and T4 Comparison of Specimens PlO, Pll, and P9
7.3 Effect of Initial Imperfections
7.4 Effect of Residual Stresses
7.5 Effect of D/t Ratio
7.6 Effect of a and c
7.7 Comparison with Design Curves
8. SUMMARY AND CONCLUSIONS
9 . RECOMMENDATIONS
10. LIST OF SYMBOLS
11. REFERENCES
12. TABLES
13. FIGURES
14. VITA
v
24
24
24 27 28
29
29 30 31 32 33 34 34
36
36
36 38 39
39
39 40 41
42
43
44
45 45
47
so
51
52
54
61
109

LIST OF TABLES
Page
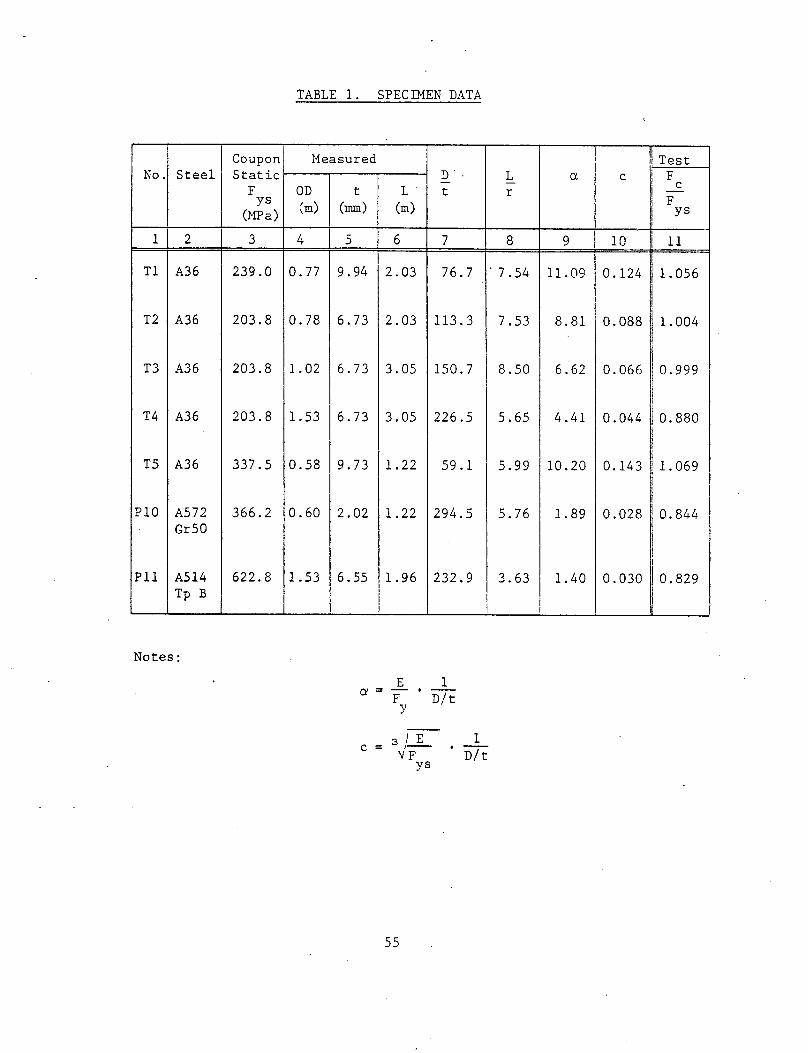
Table 1. Specimen Data (SI units) 55
Table lA. Specimen Data (English units) 56
Table 2. Tensile Coupon Results (SI) 57
Table 2A. Tensile Coupon Results (English) 58
Table 3. Initial Geometric Imperfections (SI) 59
Table 3A. Initial Geometric Imperfections (English) 60
vi

LIST OF'FIGURES
Fig. 1 Typical A36 Coupon Stress-Strain Curves
for Strains Less Than 0.010
Fig. 2 Initial Out-of-Roundness in T5
Fig. 3 Local Imperfections in P11
Fig. 4 Residual Stress Measurement Hole Locations
Fig. 5 Residual Stress Distribution in T2
Fig. 6 Residual Stress Distribution in T4
Fig. 7 Residual Stress Distribution in P10
Fig. 8 Schematic of General Test Setup
Fig. 9 Stress-Strain Curve for T1
Fig. 10 Stress-Strain Curve for T2
Fig. 11 Stress-Strain Curve for T3
Fig. 12 Stress-Strain Curve for T4
Fig. 13 Stress-Strain Curve for T5
Fig. 14 Stress-Strain Curve for P10
Fig. 15 Stress-Strain Curve for P11
Fig. 16 Lateral Deflection Profiles for T3
Fig. 17 Lateral Deflection Profiles for T5
Fig. 18 Stress-Deformation Curve for T1
Fig. 19 Stress-Deformation Curve for T2
Fig. 20 Stress-Deformation Curve for T3
Fig. 21 Stress-Deformation Curve for T4
vii
62
63
64
65
66
67
68
69
70
71
72
73
74.
75
76
77
78
79
·so
81
82

Page
Fig. 22 Stress-Deformation Curve for TS 83
Fig. 23 Stress-Deformation Curve for PlO 84
Fig. 24 Stress-Deformation Curves for Pll and P9 85
Fig. 25 Expanded Scale Stress-Deformation Curve for T5 86
p· -~g. 26 Comparison of Stress-Deformation
Curves for Tl and TS 87
Fig. 27 Extensive Yielding in Tl 88
Fig. 28 Test Setup for T2 89
Fig. 29 Overall View of T2 After
Formation of Ring Bulge 90
Fig. 30 Close-up of Ring Bulge in T2 91
Fig. 31 Post-Buckling Deformations in T2 92
Fig. 32 Test Setup for TS 93
Fig. 33 Longitudinal Wave-Like Buckles in T5 94
Fig. 34 Formation of Ring Bulge in TS 95
Fig. 35 Post-Buckling Deformations in TS 96
Fig. 36 Diamond-Shaped Buckles in Pll 97
Fig. 37 .Post-Buckling Deformations in Pll 98
Fig. 38 Polygon Post-Buckling Pattern in Tl 99
Fig. 39 Polygon Post-Buckling Pattern in T2 100
Fig. 40 Polygon Post-Buckling Pattern in T3 101
Fig. 41 Polygon Post-Buckling Pattern in T4 102
Fig. 42 Polygon Post-Buckling Pattern in TS 103
Fig. 43 Diamond-Shaped Buckling Pattern in P10 104
viii

Page
Fig. 44 Diamond-Shaped Buckling Pattern in Pll 105
Fig. 45 Buckling Stresses vs. D/t 106
Fig. 46 Buckling Stresses vs. a 107
Fig. 47 Buckling Stresses vs. c 108
ix

ABSTRACT
The economical design of tubular steel columns against local
buckling is handicapped by a rather wide variation among the current
design rules. To promote a better understanding of the local buckling
phenomenon, tests were conducted on seven specimens which were
fabricated by cold-rolling and welding. The specimens were made from
steel plate with static yield stresses ranging from 204 to 623 MPa
(29.56 to 90.32 ksi). Thicknesses ranged from 2.02 to 9.94 mm (0.080
in.to 0.391 in~ and diameter-to-thickness ratios (D/t) from 59 to 294.
The slenderness ratios (length-to-radius of gyration) were less than 9
to preclude the effect of overall column buckling.
The ultimate stress was limited by the formation of the local
buckles in five of the specimens. In the remaining two, stresses
were reached slightly above those at which buckling was observed. The
nondimensional buckling stresses ranged from 0.829 to 1.069 F/F and ys
generally decreased with increasing D/t ratios.
The initial geometric imperfections and the longitudinal welding
residual stresses appeared to have no influence on either the location
or the pattern of the local buckles. In the post-buckling range the
specimens were able to reach capacities of 12 to 23% of their buckling
strength.
1
The test results were compared using several different design
parameters and equations. Current American design equations were
found to be conservative for all of the specimens. An equation is
proposed to predict the local buckling strength of fabricated tubular
members.
2
1. INTRODUCTION
1.1 Background
The. symmetry of a tubular member permits it _to be efficiently
used to resist the three-dimensional loadings that occur in structures
such as offshore platforms, elevated storage tanks, and transmission
towers. When these members are subjected to compression, one of the
possible failure mechanisms is that of local buckling. Yet despite
its importance as a design parameter, there are no methods currently
available for accurately predicting the local buckling strength.
There is considerable disagreement among the various theories
that have been proposed and generally poor correlation between these
theories and the test results (1,2,3,4). Many of the theories are
based on tests conducted principally on small tubes of various
materials manufactured by extrusion, electric resistance welding, and
other manufacturing processes, but the tubular members being used in
large structures are made of steel and are usually fabricated by cold
rolling and welding. This fabrication process generally results in
more severe imperfections and higher residual stresses than the
manufacturing processes (1,2). Unfortunately, there have been rela
tively few tests conducted on such members even though the behavior
of the member would be expected to be influenced to some extent by both
its size and the particular production process used. Thus, there is
3

a need to develop an accurate local buckling theory based on tests
conducted on large fabricated tubular members.
1.2 Previous Research at Lehigh University
In order to promote a better understanding of the phenomenon of
local buckling of fabricated high-strength steel columns, ten speci
mens were tested in a research program at Lehigh University (5,6,7).
An equation was developed to predict the local buckling stress of
members fabricated from steels with a yield stress of 350 MPa (50 ksi)
(4).
1.3 Objectives of Present Research
The emphasis of the research described here was to investigate
the local buckling strength of five tubular columns fabricated from
ASTM A36 steel (8) with a nominal yield stress of 250 MPa (36 ksi) and
to propose a suitable design method. Two areas of particular interest
were whether the design equation proposed in Ref. 4 could also be
applied to members made of 250 MPa (36 ksi) steel, and whether the
consistency observed in the test results of Refs. 5, 6 and 7 could
also be achieved for the 250 MPa (36 ksi) specimens since the test
results for this steel reported by others showed considerable scatter
(9,10). Additional tests were conducted on a 350 (50 ksi) specimen
and on a 700 MPa (100 ksi) specimen which was made by modifying a
column tested in the previous research program (7). Geometric
4

imperfections were measured in all of the specimens and welding
residual stresses in three.
5

2. DESCRIPTION OF THE TEST SPECIMENS
2.1 Geometric Parameters
The.dimensions and other physical parameters of the tubular
specimens are listed in Tables 1 (SI units) and lA (English units).
The outside diameters ranged from 0.58 m (23.02 i~) to 1.53 m
(60.30 inJ and the thicknesses from 2.02 mm (0.080 inJ to 9.94 mm
(0.391 in.). The diameter-to-thickness ratios (D/t) ranged from 59
to 294. The length-to-radius of gyration ratios (L/r) of the speci
mens were less than 9.0 in order to preclude the effect of overall
column buckling.
2.2 Material Properties
Specimens Tl to T5 were fabricated from ASTM A36 steel plate with
a nominal yield stress of 250 MPa (36 ksi) (8). The intent of the
project that the mill test results should deviate no more than 10%
from the ASTM nominal· yield stress was maintained for Specimens Tl
to T4. The plate for Specimen T5 was taken from the fabricator's
stockyard, and its yield stress was substantially higher. Specimen
PlO was fabricated from ASTM Grade 50 steel with a nominal yield
stress of 350 MPa (50 ksi) and Pll from ASTM A514 Type B with a
nominal yield stress of 700 MPa (100 ksi).
The static yield stress for each specimen is given in Column 3
of Tables 1 and lA. The yield stresses for Specimens Tl to T4 were
6

obtained as the average of six standard eight-inch gage length tensile
coupons of each thickness cut in the longitudinal direction of the
specimens. One set of three coupons of each plate thickness was
tested at Lehigh University, and the second set was tested at the
Chicago Bridge & Iron Company (CB&I). For the 9.94 mm (3/8 in~ plate
used in Specimen Tl, the average static yield stress was 239 MPa
(34.67 ksi) and the dynamic yield stress was 265 MPa (38.50 ksi). For
the 6.73 mm (1/4 in~ plate used in Specimens T2, T3, and T4, the
static yield stress was 204 MPa (29.56 ksi) and the dynamic was 239
MPa (34.67 ksi). These dynamic yield stresses were determined at a
crosshead speed of 1042 micrometers/m/sec (~m/m/sec). This speed is
a standard ASTM testing rate (11) which is commonly used by steel
suppliers.
The yield stresses for Specimen TS were determined as the average
of four standard eight-inch gage length tensile coupons cut in the
longitudinal direction of the specimen. The static yield stress was
338 MPa (48.95 ksi) and the dynamic was 360 MPa (50.72 ksi) at a rate
of 52 ~m/m/sec. These results are pending on additional results to be
furnished by CB&I.
Even though a rather large range existed among the yield stresses
determined in the three A36 steel plates, the variation in a given
plate at a given testing rate was small. The maximum difference in
the static yield stress for the 9.94 mm (0.391 in~ plate was 14.9 MPa
(2.16 ksi), or 6.2% of the average static yield stress. The static
yield stress and the dynamic yield stresses at two different crosshead
7

speeds are listed for individual coupons in Tables 2 and 2A.
Typical stress-strain curves for one coupon of each plate of the A36
steel specimens are shown in Fig. 1 for strains up to 0.010. None of
the coupons had a sharp yield point but all reached clearly defined
yield plateaus. Locations where the static yield stresses were
determined are shown for each coupon. Reference 12 describ£s the
procedure which was used for determining the static yield stress.
This reference also gives a description of the significance of using
the static yield stress in the analysis of test data.
For the 6.73 mm (0.265 in.) plate (Specimens T2, T3, and T4)
an increase of 10% existed between the static and the dynamic yield
stresses determined at a crosshead speed of 52 ~m/m/sec. An increase
of 17% existed between the static and the dynamic yield stresses
determined at a maximum ASTM rate of 1042 ~m/m/sec. These yield
stresses are about 4% higher than the increases predicted by the
equations developed in Ref. 12. The effect of strain rate was not as
severe in the 9.94 mm (0.391 in~ plate (Specimen Tl) as the dynamic
yield stress was 8% higher than the static at 52 ~m/m/sec and 11%
higher at 1042 ~m/m/sec.
The yield stresses for Specimen PlO were determined as the
average of three six-inch gage length coupons cut in the longitudinal
direction of the specimen. The static yield stress \vas 366.3 NPa
(,?.3.~3 ksi) and the dynamic 1-vas 381.4 HPa (55.31 ksi) at 52 f.!m/m/sec
This dynamic yield stress was 4% higher than the static. A similar
8

increase was observed in the 9.73 mm (0.383 in.) A36 plate, which had a
static yield stress of 338 MPa (48.95 ksi).
The yield stresses' for Specimen P10 were determined as the average
of three six-inch gage length coupons cut in the longitudinal direction
of the specimen. The static yield stress was 366.3 MPa (53.13 ksi) and
the dynamic at 52 ~m/m/sec was 381.4 MPa (55.31 ksi). This dynamic
yield stress was 4% higher than the static. A similar increase was
observed in the 9.73 mrn (0.383 in.) A36 plate, which had a static
yield stress of 338 HPa (48.95 ksi).
The material properties of Specimen P 11 vvere assumed to be those of
the original Specimen P9. The static yield stress was 623 MPa
(90. 32 ksi) and the dynamic v~as 645 MPa (93. 60 ksi) at 52 ~r,t/m/sec (7).
2.3 Fabrication Process
All of the specimens were formed into cylinders in a pyramid
three-roll bending machine by repeatedly cold-rolling the plate to a
smaller and smaller radius until the opposite edges met. In Specimens
Tl to T4 the edges were joined with a two-pass butt weld made from
one end of the specimen to the other by the automatic submerged-arc
process. Welding caused a flattening of the wall in the vicinity of
the weld, so to restore circularity the specimens were re-rolled. In
order to permit re-rolling, the excess \veld material had to be ground
off. After re-rolling, steel end rings 22 mm thick by 127 rnm wide
(7/8 in. x 5 in.) were welded to the ends of the specimens.
9

In Specimen T5 most of the welding distortions were prevented by
small struts which had been tack welded inside the specimen near the
longitudinal joint. The edges were joined with a two-pass single-bevel
weld made manually by the submerged-arc process. After welding, the
struts were removed and the end rings added.
Specimen P10 was welded manually by a two-pass shielded metal-arc
process. The inside pass was welded first, and each pass was begun
near the center of the specimen and proceeded outward to the ends. The
steel end rings added were 6.35 rnm thick by 127 mm wide (~in. x 5 in.).
Specimen Pl1 was made from Specimen P9, ~vhich had been tested in
a previous project at Lehigh University (7). The length of the original
specimen containing the buckles (approximately 0.5 m, or 19 in.) was
removed by flame cutting. However, some small portions of the
buckles that were not removed, since they were expected to recover
elastically, failed to fully straighten out. These remaining dents
were partially straightened by preheating both sides of the specimen
wall and hammering. Finally, the end ring was rewelded to the
shortened end. The local imperfections which remained are discussed
in Chapter 3.
10

3. INITIAL GEOMETRIC ll~ERFECTIONS
3.1 Standard Imperfections
3.1.1 Definitions and Methods of Measurement
A standard measure of initial geometric imperfections in a tubular
member is given by the out-of-roundness and the out-of-straightness.
The out-of-roundness at any given cross section is defined by:
OD - OD . OUT-OF-ROUNDNESS max m1n
OD (1)
where OD and OD . are the maximum and the minimum outside diameters max m1n
of the cross section and OD is the mean outside diameter. The outside
diameters at each end of the specimen were computed as the difference
between the knmvn diameter of a reference circle and the distances
measured in approximately radial directions between the reference
circle and the grid lines marked on the specimen. The mean diameter
was comp~ted from the average of the measured circumferences at each
end of the specimen. The out-of-roundness of other cross sections was
determined from the end diameters and the offsets between the specimen
wall and straight lines connecting the grid points on the end circum-
ferences.
The out-of-straightness is defined by the maximum offset between a
ll

longitudinal straight line and the specimen wall in any 1.5 m (5 ft)
length. The measurements were taken with the dial gage rig, and the
offsets were determined as the differences between reference readings
taken against a flat surface and the initial readings taken on the
specimen.
3.1.2 Discussion of Imperfections
A summary of the out-of-roundness and the out-of-straightness
measurements on each specimen is given in Tables 3 and 3A. The
largest difference between the maximum and minimum outside diameters
in the A36 specimens was 11.7 mm(0.46 in.) in Specimen T4. Specimen T5
was the most out-of-round at 0.0132, and T2 deviated the most from
straightness with an initial inward deflection of 3.05 rom (0.120 in.).
Figs. 2 and 41 show the cross sections of Specimens T4 and T5
where the ma~imum imperfections were measured. The imperfections at
the cross section near the location where the buckling occurred in
each specimen are shown in Figs. 38 to 44. In these figures the ref
erence circle is shown by the light dashed lines and the initial shape
by the solid dark line indicated. The offsets between the two shapes
are the initial deviations magnified by a factor of 10.
Specimen Pll had the largest difference between diameters in any
specimen with 18.3 rom (0.72 in.) at the bottom. This measurement may
not, however, give a true indication of the imperfections in the
specimen due to the presence of the local dents which are described in
12

Section 3.3. The inward out-of-straightness in Specimen P10 of 2.5 mm
(0.099 in.) was the only offset other than the local dents in P11 which
exceeded the thickness of the specimen wall.
There seemed to be no correlation between the magnitude of the
initial imperfections and the dimensions of the specimen. However, the
maximum out-of-straightness was consistently observed in the two gage
lines along either side of the weld.
3.1.3 Comparison with API Recommendations
The American Petroleum Institute recommends the following standards
for allowable imperfections (13): 1) the difference between the
maximum and the minimum outside diameters should not exceed 1% of the
nominal diameter (out-of-roundness) or 6.35 mm (\in.), and 2) the
out-of-straightness should not exceed 3.18 mm (1/8 in.) in any 3.05 m
(10 ft) length.
Specimens T4, T5, PlO, and Pll exceeded the recommended standards
for out-of-roundness. Specimen P11 exceeded the maximum difference
between diameters requirement by 188% (11.9 mm, or 0.47 in.), and
Specimens T5 and PlO exceeded the requirement by 22% (1.4 mm or 0.055
in.). These specimens also exceeded the out-of-roundness criteria by
19 to 32%. Specimen T4 exceeded the difference between diameters
requirement by 84% (5.4 mm, or 0.21 in.) but met the out-of-roundness
criteria. Based on a 3.05 m (10 ft) length, all of the specimens met

the out-of-straightness criteria. These comparisons indicate that only
Specimens Tl, T2, and T3 were fabricated in accordance with current
industrial practice.
3.2 Initial Shape
The initial shape of a specimen was determined with respect to an
"ideal cylinder" which was visualized to have been superimposed over
the specimen. The diameter of the ideal cylinder was computed as the
average of the circumferences measured at each end of the specimen. The
ends of the ideal cylinder were ·set to balance the inward and out;:ard
deviations of the specimen wall at the ends. This was approximately
achieved by making the ideal cylinder (actually, the ideal circle at
the ends) to pass through the t\.;ro nearest grid points which straddled
the largest diameter of the specimen. With the location of the ideal
cylinder established, the offsets from this cylinder to the specimen
wall were computed at each dial gage point along each gage line.
These offsets are the initial deviations shown between the reference
and the initial shape in Figs. 2, 16 and 17, and 38 to 44.
3.3 Local Imperfections
Some local imperfections were present in Specimens T3 and P11 that
would not normally exist in fabricated tubular members. In Specimen T3
there were five areas of laminar separations which caused a local
reduction of the wall thickness. Four of the areas were -located near
14

gage line 5 and one near gage line 8. All were more than 0.56 m (22 in.)
from the top of the specimen (where local buckling occurred) and more
than 1.0 m (40 in.) from the weld. The most severe area was located
near gage line 8 and was approximately 38 mm long by 19 mm wide by
1.5 mm deep (1.5 in. x 0.75 in. x 0.06 in.).
In Specimen Pll there were three dents which remained after the
modification of the previously tested Specimen P9 to P11. The dents, as
shown in Fig. 3, were located within 0.1 m (4 in.) of the top of the
specimen and were directed radially inward up to 7.9 mm (0.31 in.)
from a straight line along the ~all of the specimen.
15
4. RESIDUAL STRESSES
4.l General
The effect of residual stresses on the strength of steel structural
members can be significant, and the magnitude and distribution of such
stresses are greatly influenced by the method of fabrication and the
geometry of the cross section. The objective of this investigation was
to determine the influence of residual stresses on the pattern and the
location of local buckles.
Circumferential stresses due to cold-rolling vary through the
thickness of the plate, but the stresses are essentially constant
around a cross section and are not expected to affect the buckling
pattern (14). Longitudinal stresses from the Poisson's ratio effect
in cold-rolling and from the original cooling of the plate can be con
sidered to be negligible in comparison to the welding residual stresses
(15). Thus, the longitudinal residual stresses due to welding were of
primary interest in this study. These stresses were computed from
measurements taken on Specimens T2, T4, and PlO.
16
(
4.2 Hethod of Heasurement
The residual stresses were computed from the strain caused by the
welding process. These strains were determined from the change in the
distance between pairs of target holes which were located on the inside
and outside surfaces of the specimen wall. The distances between the
pairs of holes were measured with a Whittemore mechanical strain gage
with a 0.25 m (10 in.) gage length after the specimen had been rolled,
but prior to welding the longitudinal seam, and then again after
welding. As shown in Fig. 4, the ·holes were located 0.76 m (30 in.)
from one end on Specimens T2 and T4 and 0.48 m (19 in.) on PlO to pre
clude the effect of the free end. The inside and outside pairs of
holes were located opposite each other and were circumferentially
spaced closer near the weld where the stresses were expected to be
higher. The holes were 1.2 mrn in diameter by approximately 4 mrn in
depth (3/64 in. x 3/16 in.), and each had a countersunk shoulder on
which to seat the tip of the measurement gage.
In Specimens T2 and T4 the holes were drilled directly into the
wall of t.he specimen. In Specimen P 10 the thinness of the wall ( 2. 02 mrn,
or 0.080 in.) prevented such drilling and a modified technique was
followed. Predrilled brass targets approximately 6.4 mrn (~ in.) square
were attached to the inside and outside surfaces of the specimen with
a five minute epoxy. The epoxy was allowed to set for about 30 minutes
before any measurements were taken. This latter technique proved to be
the more efficient since the quality of the holes was improved (holes
17

could be drilled much more quickly and accurately with a drill press)
and the time required in the fabrication shop to glue the targets was
much less than that required for drilling the holes into the wall of the
rolled specimen.
4.3 Discussion of Residual Stresses
The residual stress distributions computed in Specimens T2 and T4
are shown in Figs. 5 and 6, and the distribution in PlO is shown in
Fig. 7. For the purpose of presentation, the stress distribution
around the circumference of the specimen is shown on a tube visualized
to have been cut, unfolded, and laid out flat. The vertical line
through the center corresponds to the weld seam, and the right and left
edges correspond to the line which is diametrically opposite the weld
on the specimen. The distance from the weld is given by the abscissa,
and the stress is given by the ordinate. Computed stresses from both
the inside and outside surfaces are plotted for a given distance from
the weld, and the averages of these stresses are connected with a
smooth curve.
At some locations there is a rather large difference between the
inside and outside surface stresses. These differences may be attributed
to longitudinal curvature or warping in the specimen wall, grinding of
the weld prior to re-rolling, holes not being located exactly opposite
one another, disturbance of the targets, or damaged holes. Despite
these differences, the smooth curve connecting the average of these
18
readings does not vary significantly from the patterns determined
previously (5, 6, 16). The above reasons may also explain why the
residual stress patterns presented are not fully symmetric about the
weld, and why the stresses are not self-equilibrating.
The band of compressive stress extends from about 0.05 to 0.40 mm
(2 to 15 in.) on either side of the weld in Specimen T2 and has an
average maximum stress of approximately 40 HPa (6 ksi). This zone in
Specimen T4 extends from about 0. 03 to 0. 65 m (1 to 25 in.) from the
weld and has an average maximum stress of approximately 60 MPa (9 ksi).
In Specimen P10 this band extends from about 0. 03 to 0. 23 m (1 to
9 in.) from the weld and has an average maximum stress of approxi
mately 83 MPa (12 ksi). The width of the residual compressive stress
band increased with increasing specimen diameter, and the magnitudes of
the maximum stress in Specimens T2 and T4 were 50 and 75% of the stress
in P10. Beyond the compression zones the magnitude of the stress
diminishes and tends to fluctuate between compression and tension in
a wave-like pattern.
Specimens T2 and T4 can also be compared to three other tubular
specimens fabricated from 350 MPa (50 ksi) steel whose welding residual
stresses were measured previously. Specimen T2 was similar in geometry
to Specimens P1 and P2 of Ref. 16. The width of the compressive bands
was similar in all three tubes (approximately 0.45 m,or 18 in.), but
the maximum compressive stress in Specimen T2 was only about 65% of the
stresses found for Specimens P 1 and P2 (16) . Specimen T4 was geometric-
~9-
(
ally similar to Specimen PS of Ref. 5. The compressive stress bands
were approximately 0.60 m (2!: in.) in width, but the maximum stress in
Specimen T4 was again only about 65% of the stress measured in Speci
men PS (5). Thus, it appears that the width of the compressive band
is dependent on the geometry of the specimen, whereas the magnitude of
the maximum stress is dependent on the yield stress.
20

(
5. TEST PROCEDURE
5.1 Test Setup
The general test setup for the specimens is shown schematically
in Fig. 8. As illustrated in Fig. 28, the larger specimens stood in a
five million pound hydraulic testing machine between the loading head
and the machine floor. For convenience in taking measurements during
the testing, Specimens T5 and PlO stood between the loading head and
the machine pedestal, as illustrated in Fig. 32. The specimens were
whitewashed with a lime solution in order to give a visual indication
of the surface yielding during the test.
Alignment was accomplished by centering the specimen in the
testing machine and by plumbing with a four foot level. To further
assure the application of a uniform, concentric load to the specimen,
a layer of gypsum ('~ydrostone") grout was placed between each of the
end rings and the testing machine components. In order to form
smooth contact surfaces, a small initial load (less than 2.5% of the
predicted buckling load) was applied to the specimen before the grout
could set.
5.2 Instrumentation
The instrumentation consisted of both mechanical dial gages and
electric-resistance strain gages. Four mechanical dial gages at the
corners of the machine head were used to measure the longitudinal

shortening of the specimen. Two additional mechanical dial gages
located diametrically opposite one another were attached between the
end rings close to the wall of Specimens Tl to TS. Three electric
resistance strain gages located at third points around the circum
ference and at approximately midheight of the specimen served .as a
check on the concentricity of the load and as an additional means for
determining longitudinal deformations. For Specimens T2, T4, and PlO
these deformations were further checked with Whittemore strain gage
readings which were taken periodically between the residual stress
target holes.
The lateral deflection of the specimen wall relative to its ends
was measured by means of the special movable dial gage rig shown
standing near the right of the specimen in Figs. 28 and 32. The rig
consisted of seven or eight mechanical dial gages attached to either
an aluminum truss or an aluminum channel. The bottom of the rig sat
on the end ring and touched the specimen wall, and an electromagnet
held the top of the rig against the specimen. Readings were taken
at nine to thirteen locations around the circumference by successively
repositioning the rig.
22

5.3 Test Sequence
Following the alignment of. the specimen, readings were taken of
all gages to serve as the initial reference. Generally, load incre
ments of 445 kN (100 kips) were slowly applied until the load reached
approximately 85% of the expected buckling load. The load increments
were then reduced to 220 kN (50 kips) as the buckling load was
approached.
At all load levels prior to buckling readings were taken of the
longitudinal dial gages and the electric-resistance strain gages. At
several of the load levels, readings from the dial gage rig were also
taken. In addition, on Specimens T2, T4, and PlO, Whittemore strain
gage readings were periodically made. After buckling only the longi
tudinal dial gages and the electric-resistance strain gages were read
since the buckling prevented the use of the dial gage rig.
23

6. TEST AESULTS
6.1 General Specimen Behavior
6.1.1 Frebuckling Behavior
The behavior of a test specimen prior to buckling can be
described by its stress-strain relationship. The stress-strain
curves for Specimens T1 to TS, FlO, and Fll are shown in Figs. 9
to 15, respectively. The ordinate-in these figures is the average
axial stress nondirnensionalized with respect to the static yield stress,
and the abscissa is the strain. In this investigation the strain was
obtained by several different methods. Two measures of strain obtained
for all of the specimens were: 1) the average of the three electric
resistance strain gage readings, and 2) the average axial deformation
measured by the four corner longitudinal dial gages divided by the
overall specimen length. In Specimens Tl to TS strain was also com
puted as the average axial deformation measured by the two near longi
tudinal dial gages divided by the overall specimen length. In addition,
in Specimens T2, T4, and FlO average strains were computed from
Whittemore strain gage readings.
The strain curves computed from longitudinal deformations generally
had initial nonlinear regions (due to self-adjustments in the grouted
ends) up to about 0.1 F/F ys
The deviation from linearity was greater
in the curves computed from the corner deformations than in the curves
24
computed from deformations measured near the specimen wall. The strain
curves based on electric-resist.ance and Whittemore readings were linear
from the start and agreed almost identically with one another. All of
the curves remained linear to a stress of approximately 0.7 F/F . - ys
Specimens T1 and T5 became nonlinear near this stress and strained
extensively with increasing stress prior to the formation of the
buckles. Specimens T2 and T3 behaved linearly up to stresses of approxi-
mately 0.9 F/F before becoming nonlinear. The behavior of Specimens ys
T4, PlO, and Pll remained essentially linear up_to the buckling stress.
Lateral deflections were measured in the specimens prior to the
formation of the buckles. Typical profiles are shown in Figs. 16 and
17 for Specimens T3 and T5. The sketch to the left (not drawn to scale)
shows the buckled specimen, and the three profiles are for the gage
lines indicated. The profiles that are opposite the sketch of the
buckled specimen are the deflections from the ideal cylinder. The
additional profile for gage line 9 in Fig. 17 is based on deflections
from the initial out-of-straightness measurements along the line.
The small circled numbers indicate the sequence of the profile during
the testing. The Profile numbered 3 was measured just prior to
buckling.
The changes in the lateral deflections in Specimen T3 are gener?lly
less than those in T5, which seems to be consistent with the appearance
of the buckled specimen. However, the profiles do not seem to correspond
to the actual shape of the specimen. This is apparent in Fig. 17 for
25

Specimen TS, as the frequency and the amplitude of wave-like pattern
were of such magnitude that the pattern should have been approximated
by the measurements.
26
6.1.2 Behavior at Buckling
At stresses near buckling the elastic response of Specimens Tl,
T2, T3, and TS became quite sensitive to the rate of loading .. After
a load level was reached and during the time when instrumentation
readings were being taken the load registered by the testing machine
dropped to a static level even though the rate of loading was very
slow. When testing was resumed the load climbed above the previously
reached level, but again fell when the machine was stopped. This
behavior is shown in Fig. 25 by the dashed lines between the static
and the dynamic (at a very slmv rate of loading) load-deflection
curves. Since the buckling and the ultimate stresses were reached
during the application of a load increment in all of the specimens
except T4, the maximum load reached is used in the description of the
prebuckling and the buckling behavior.
Local buckling occurred in all of the test specimens. The ultimate
stress reached was limited by the formation of the buckle in all of the
specimens except T1 and T5. The stress in these two specimens contin
ued to climb above the stress at which buckling was first observed.
The nondimensional buckling stress of each specimen is listed in
ColUmn 11 of Tables 1 and 1A.
Specimens Tl to TS buckled at one end through the gradual formation
of a uniform, circumferential ring bulge approximately 0;10 to 0.15 m
2]
(4 to 6 in.) in width. Surface yielding was quite extensive over the
length of Specimens Tl and TS, but the yielding was localized in the
buckled regions of the other specimens. Specimens Tl and TS also
showed a tendency of forming additional ring bulges (in a \vave-like
pattern) along the length of the specimen prior to buckling at the end.
Typical ring bulges are illustrated in Figs. 30 and 34. Specimens PlO
and Pll each buckled suddenly with an explosive sound into a diamond
shaped pattern, as illustrated in Fig. 36 for Pll.
6.1.3 Post-Buckling Behavior
Buckling was followed by a sudden reduction in the applied stress
in Specimens T2, T3, T4, PlO, and Pll. Specimens Tl and TS continued
to carry significant additional stresses after buckling had been visibly
detected. After local buckling occurred, most of the increase in defor
mation was concentrated in the buckled regions. The strains from the
electric-resistance gages and the average strains did not accurately
represent the behavior of the buckled portion of the specimen. A
more valid representation of the overall specimen behavior in the post
buckling.range is the stress-deformation relationship. These curves
are sho~m for each specimen in Figs. 18 to 24. In these figures the
ordinate is the nondimensional stress and the abscissa is the average
longitudinal deformation measured by the four corner dial gages.
The postbuckling capacities of the specimens stabilized at 12 to
23% of the bucKling strength at an overall longitudinal shortening of
75 to 150 mm (3 to 6 in.). As illustrated in Figs. 31 and 35, further
28
longitudinal compression resulted in the transformation of the ring
bulge into a polygonal shape. The orientation of the polygon'with
respect to the Held was random, but the number of sides increased \.Jith
increasing specimen diameter.
Additional compression always resulted in the specimen wall folding
over onto itself, and after the folds contacted either the specimen
wall or an end ring, slightly increased loads could be carried until
a second layer of buckles formed. These increases in stress are indi-
cated by the rising portions of the curves in the post-buckled regions
of Figs. 18, 19, 21, and 22.
6. 2 Be.havi.or of Individual Specimens
6.2.1 Behavior of Specimen T1
The stress-strain curves for Specimen Tl are shmm in Fig. 9. The
strains computed from longitudinal deformations measured near the speci-
men wall were nearly the same as those read from the electric resistance
gages, and these strains wer~ approximately 0.0003 less than the strains
obtained from the corner longitudinal deformations. The curves began
to devia~e from linearity at approximately 0.7 F/F . At a stress of ys
0.85 F/F , surface yielding became apparent as the whitewash began ys
flaking off the specimen along both sides of the weld over the full
length of the specimen (regions of maximum residual compressive stress).
Yielding soon spread completely around the specimen at midheight, and
later progressed to form 14 to 16 equally spaced circumferential rings,
as illustrated in Fig. 27. The specimen seemed to be on the verge of
29

forming a series of ring bulges (which would have given the specimen a
corrugated appearance), but the lateral deflections did not develop over
the length. Small ring bulges did initially appear at both ends of the
specimen. Upon reaching the ultimate stress of 1.07 F/F the deforys
mation became concentrated in the bottom ring, and the top ring relaxed
into a nearly straight position.
As the compression was continued beyond the maximum load, the
bottom ring bulge was transformed into a three-sided polygon. As
shown in Fig. 23, the post-buckling capacity stabilized at approxi-
mately 0.23 F/F , and the capacity increased to approximately 0.50 ys
F/F prior to the formation of the second set of buckles. The second ys
set was also three-sided, but it was offset by a half wave just above
the first pattern.
6.2.2 Behavior of Specimen T2
The stress-strain behavior of Specimen T2 is shown in Fig. 10.
The strains computed from the longitudinal deformations measured near
the specimen were approximately midway between the strains read from
the strain gages and the strains computed from the corner longitudinal
deformations. At a stress of approximately 0.90 F/F the curves ys
became nonlinear and surface yielding was observed along both sides of
the weld near the top of the specimen. At the ultimate stress of 1.00
F/F , the uniform ring bulge illustrated in Figs. 29 and 30 appeared ys
at the top. These photographs also show that surface yielding occurred
30

only in the buckled portion of the specimen. Fig. 19 shows the decrease
in the applied stress that immediately follm.-ed buckling. After
additional compression, the ring bulge was transformed into a three-
sided pattern, and a stable post-buckling capacity of 0.18 F/F ys
occurred at approximately 90 mm (3.5 in.). Prior to the formation of
the second set of buckles illustrated in Fig. 31, a maximum post-
buckling stress of 0.37 F/F was reached. ys
6.2.3 Behavior of Specimen T3
Fig. 11 shows the stress-strain curves for Specimen T3. The
strains computed from the longitudinal deformations measured near the
specimen were very similar to those read from the electric-resistance
strain gages. In the linear portion of the curves these strains were
approximately 0.0002 less than the strains computed from the longitud-
inal deformations measured at the corners of the loading head.
Specimen T3 was loaded to a stress of 0.80 F/F during the first ys
day of testing and then unloaded to 0.40 F/F before leaving it overys
night. When testing was resumed the previous loading path was retraced,
and a stress of approximately 0.90 F/F was reached before the behavior ys
became nonlinear. Yielding was first observed at the top of the speci-
men in a very narrow band along the weld toe of the end ring at a stress
of 0.97 F/F . At a stress of 1.00 F/F a ring bulge began to form at ys ys
the top. Two additional load increments were applied before the ring
bulge extended completely around the specimen. Fig. 20 sho\.JS that
31

immediately after buckling the applied stress dropped to approximately
0.50 F/F and later stabilized in the post-buckling region at 0.18 ys
F/F ys
The ring bulge developed into a four-sided polygon during this
post-buckling deformation.
6.2.4 Behavior of Specimen T4
The stress-strain behavior of Specimen T4 is sho~n in Fig. 12. The
strains computed from longitudinal deformations measured near the speci-
men wall were approximately midway between the strains read from the
electric-resistance gages and those computed from the corner longitud-
inal deformations.
At a stress of 0.47 F/F some local yielding was observed at the ys
top of the specimen along the weld toe of the end ring. The yielding
did not spread significantly until stresses were near the ultimate, and
the stress-strain and the load-deformation curves remained linear.
During the first day of testing a stress of 0.54 F/F was reached, ys
but the specimen was unloaded to 0.37 F/F before leaving it overnight. ys
When testing was resumef the following day, these same linear paths
were followed. The behavior remained essentially linear up to the ul-
timate stress of 0.88 F/F ys
The ultimate stress was reached under
essentially static conditions, as no loading was being applied and
instrumentation readings were being taken when buckling occurred. The
ring bulge formed rather suddenly and was followed by the large drop in
the applied stress level shown in Fig. 21. The post-buckling stress
32

stabilized at approximately 0.13 F/F ys
With additional deformation the ring bulge eventually transformed
into a six-sided polygon. Testing continued until a second set of
buckles formed. As the specimen wall folded over, in a manner similar
to that illustrated in Fig. 31, cracks appeared just under the folds.
6.2.5 Behavior of Specimen T5
The stress-strain curves for Specimen T5 are shovm in Fig. 13. The
strains computed from longitudinal- deformations near the specimen Hall
were essentially the same as the strains read from the electric-resis-
tance gages. For a given increase in stress, these strains increased
at a slightly slower rate than the corresponding strains computed from
the corner longitudinal deformations. The difference betiveen the strains
read from the curves varies from about 0.0005 to 0.0008.
Surface yielding was first observed near the weld at a stress of
0.94 F/F ys
Two yield lines formed at 0.20 and 0.38 m (8 and 15 in.)
from the top of the specimen and a third yield line later appeared
between t/1e two. At a stress of 1.07 F/F surface yielding became ys
concentrated near the bottom of the specimen, and a wave-like pattern
of four buckles formed along the length. The shadow cast on the speci-
men in Fig. 33 shows the wave-like pattern, which was most pronounced
near the weld. At a stress near 1.11 F /F the bottom Have gre"-' into the ys
ring bulge shov."'!l in Fig. 34, and the level of stress dropped as shown in
Fig. 22. The stress level stabilized at 0.25 F/F • and a threeys·
33
sided polygon pattern developed from the ring bulge.
As the wall of the specimen deformed as shown in Fig. 35, the weld
cracked at the fold. The wave-like rings retained most of their
initial magnitudes during the post-buckling deformation.
6.2.6 Behavior of Specimen PlO
The stress-strain curves for Specimen PlO are shown in Fig. 14.
The strains computed from the corner longitudinal deformations had a
greater magnitude and also a greater rate of increase than the strains
read from the electric-resistance gages.
The behavior of the specimen remained essentially linear up to the
buckling stress. The first two buckles to form appeared suddenly with
a "popping" sound on each side of the weld just above midheight of the
specimen. Six additional buckles appeared without further loading to
form a circumferential series of diamond-shaped buckles similar to
those illustrated in Figs. 36 and 37. The ultimate stress of 0.84
F/F was reached at buckling. As shown in Fig. 23, the applied stress ys
dropped rapidly after buckling and later stabilized at a stress of
approximately 0.10 F/F . ys
6.2.7 Behavior of Specimen Pll
Fig. 15 shows the stress-strain behavior of Specimen Pll. During
the first day of testing a stress of 0.80 F/F (87% of the buckling ys
stress of Specimen P9) was reached, then the specimen Has unloaded to
34

0.26 F/F before levaing it overnight. \men testing '"as resumed, the ys
stress-strain curve computed from longitudinal deformations was paral-
lel, but offset, from the previous curve, thus indicating the presence
of some plastic deformations. Strains read from the electric-resistance
gages were also slightly offset, but the differences were negligible
for the scale used in the figure. For a given increase in stress, the
strains computed from the corner longitudinal deformations increased at
a slightly greater rate than the corresponding strains read from the
electric-resistance gages. The curves deviate only slightly from
linearity just prior to reaching the buckling stress.
Buckling occurred with an explosive bang at an ultimate stress of
0.83 F/F ys
Initially three diamond-shaped buckles formed near the top
of the specimen, two on one side of the weld and one on the other.
Without further loading, seven additional buckles formed and the
resulting pattern shown in Fig. 36 circled the specimen.
As shown in Fig. 24, the applied stress dropped suddenly after
buckling, and the post-buckling strength stabilized at a stress of
0.10 F/F ys
During additional compression, the wall of the specimen
folded over as shown in Fig. 37, and cracks appeared under the folds.
35

7. DISCUSSION OF TEST RESULTS
7.1 General Specimen Behavior
7.1.1 Prebuckling Behavior
The stress-strain curves in Figs. 9 to 12 show a considerable
difference among the strains measured at a particular stress. The
larger initial strains computed from the dial gage readings may be
attributed to the compression of the capping grout on the specimens
and other initial adjustments that would affect the overall deforma
tion of the specimen but would not be reflected in the local strains
measured by the electric-resistance gages. After the initial non
linearities, the slopes of the stress-strain curves are very similar
and compare favorably with the assumed modulus of elasticity of
203,400 MPa (29,500 ksi).
This consistency among the slopes of the A36 specimens with yield
stresses near the nominal was not observed in the specimens with yield
stresses near or above 300 MPa (50 ksi) or in previous tests conducted
on high-strength steel specimens (16). It was assumed that the
difference in slopes may have been caused by the deflection of the
corners of the testing machine loading platen. To check this assump
tion, Specimens Tl to T5 had two dial gages located near the specimen
wall to measure the longitudinal deformations. The strains computed
from the two near gages would then be expected to approach the strains
read from the electric-resistance gages since the effects of plate
36

bending in the machine would be eliminated. This theory does not
appear valid, however, since the slopes of the stress-strain curves
for Specimens Tl to T4 were very similar. It appears more likely
that the consistency was related to the differences in the yield
stress.
There is one additional inconsistency that exists in the magni
tude of the strains computed from the two near dial gages. Figures
10 and 12 (Specimens T2 and T4) indicate, as expected, that these
strains are between the strains read from the electric-resistance
gages and those computed from the corner longitudinal deformations.
However, Figs. 8, 10, and 12 (Specimens Tl, T3, and TS) show that the
strains computed by the two near gages were nearly the same as those
read from the electric-resistance gages. No explanation other than
the particular conditions of the individual tests can be made.
The lateral deflections shown in Figs. 16 and 17 must be viewed
with some caution. When measurements were being taken with the dial
gage rig it was assumed that the ends of the rig were positioned at
a fixed location on a straight line relative to the ends of the
specimen. However, in some specimens the magnet holding the rig
against the specimen wall was near the location where the ring bulges
appeared. Consequently, any lateral deflections in this region would
have affected the dial gage readings. It was also observed that the
variation among readings which were taken against the flat reference
surface may have exceeded the magnitude of the actual deflection in
the specimen for a given load increment. It is difficult to evaluate
37

the accuracy of these measrirements, but from Fig. 17 it does not
appear that the profile obtained from the dial gage readings corres
ponds to the observed profile.
7.1.2 Behavior at Buckling
In most specimens buckling occurred at one end. A possible
explanation for this is that due to Poisson's ratio the wall of the
specimen desires to expand laterally as the specimen is compressed.
The ends of the specimen are restrained from expansion by the end rings,
thus inducing large local bending moments that act in combination with
the axial load. In previous research where end rings were not added,
buckling still commonly occurred at the ends (5). In these cases the
restraint was probably offered by the friction between the ends of the
specimen and the testing machine. This preferential location for
buckling was not so obvious in Specimens Tl and T5, as both showed a
tendency to form ring bulges at other locations along the length.
The buckling stress was not clearly defined in the specimens with
low D/t ratios and high straining capacities. Ring bulges were
observed in Specimens Tl and T5 at stresses below the ultimate. For
such specimens the use of a critical strain may perhaps be a. more
meaningful parameter to define the point of buckling.
38

7.1.3 Post-Buckling Behavior
The post-buckling stress qf the specimens stabilized within a
range of 12 to 23%ofthe buckling stress. This range is similar to
that previously observed for high-strength specimens (4,16). Some
additional stresses could be carried after the wall of the specimen
had folded over and come into contact with the unbuckled wall or an
end ring. It appears that the points of contact provided the addi-
tional longitudinal support required for the formation of the second
set of buckles.
7.2 Comparison of Specimen Behavior
7.2.1 Comparison of Specimens Tl and TS
Specimens Tl and TS had D/t ratios less than 80, 1/r ratios less
than 8, and a nominal thickness of 9.5 mm(3/8 inJ. Figures 9 and 13
show that the specimens had the capacity to strain quite extensively
prior to buckling. The extensive surface yielding which occurred
prior to buckling is illustrated in Figs. 27 and 33. Each specimen
was able to carry a stress above the stress at which the formation of
buckles became visible. Each specimen showed a tendency of forming a
series of longitudinal waves (or circumferential ring bulges).along
its length with the larger initial rings near the ends. The final ring
bulge formed near the bottom of the specimen, and it transformed into
a three-sided polygonal pattern during the post-buckling deformation.
Figure 26 shows that the stress-deformation behavior was nearly
identical up to a stress of 1.00 F/F ; and also that the postys
39

b.uckling behavior ~•as simiiar. The post-buckling stress stabilized at
approximately 0.24 F/F at a deformation of approximately 0.12-0.13 m ys .
(5 in).
7.2.2 Comparison of Specimens T2, T3, and T4
Specimens T2, T3, and T4 were fabricated from the same plate but
had D/t ratios that ranged from 113 to 226 and L/r ratios that ranged
from 5.6 to 8.5. Figures 10 to 12 and 19 to 21 indicate that the
specimens deviated very little from linear behavior prior to buckling.
The buckling strain was approximately 0.001 to 0.002, and the deforma-
tion at buckling was approximately 6 mm (0.24 in). The buckling
stresses were near 1.00 F/F for Specimens T2 and T3 but only 0.88 ys
F/F for T4. The stable post-buckling stress level for Specimen T4 ys
was about 20% less than that of T2 or T3. Formation of the ring bulge
occurred near the top of each specimen with relatively little prior
surface yielding.
The premature local yielding which was observed in Specimen T4 arrl
the comparatively lower ultimate stress may lead to some suspicions
concerning the magnitude of the buckling stress. The local yielding
described in Section 6.2.4 was probably caused by the concentrated
stresses that could have resulted from insufficient grout covering
over some metal projections on the top end ring of the specimen.
However, a similar pattern of local yielding was observed in Specimen
T3 (but at a higher level of stress), which had no metal projections.
The facts that linearity in the stress~strain and the stress-
40

deformation curves (Figs. 12 and 21) was not disturbed and that the
stable post-buckling stress was also lower than the corresponding
stresses in T2 and T3 lend credibility to the buckling stress
results.
7.2.3 Comparison of Specimens P10, P11, and P9
Specimen Pll was made by modifying previously tested Specimen
P9 (7). As shown in Fig. 24, Specimen P11 followed nearly the same
linear stress-deformation path as P9 but buckled at a stress of
0.83 F/F compared to 0.91 F/F for P9. Two pr.evious retests ys ys
showed that the buckling stress should be nearly the same in both the
original and the modified sp~cimens (Specimens P3 and P3A of Ref. 5
and P6 and P8 of Refs. 6 and 7). This indicates an apparent effect
of the relatively large geometric imperfections, which are described
in Chapter 3 and Section 7.3, on the buckling stress. The level of
the stable post-buckling stress was 0.008 to 0.10 F/F for the ys
specimens.
The behavior of Specimens P10 and Pll remained essentially
linear up to the buckling stress. Each specimen buckled suddenly
with an accompanying noise into a series of diamond-shaped buckles as
illustrated in Fig. 36. The circumferential buckling pattern extended
from near the top to a lower position around the specimen. The
post-buckling stress of PlO also stabilized at approximately 0.10 F/F ys
41

7.3 Effect of Initial Imperfections
There seemed to be no correlation in the A36 specimens between the
initial imperfections and the buckling pattern or location, as each of
these specimens failed initially through the formation of a ring bulge.
Column 8 of Tables 3 and 3A lists the type and the location of the
initial local buckling in each specimen. Figures 38 to 42 show the
polygonal post-buckling patterns superimposed on the initial shape of
Specimens Tl to TS. The buckled shape, shown by the dark solid line
in the figures, does not represent a particular stress level nor is it
drawn to a specific scale. A comparison among the figures indicates
that no correlation exists between the orientation of the polygon post
buckling pattern and the initial deflections. Figure 43 indicates no
apparent correlation between the initial deflections and the pattern of
the diamond-shaped buckles in Specimen PlO.
The initial indentations and the buckling pattern of Specimen Pll
are shown in Fig. 44. Two of the initial dents are near the locations
where the specimen buckled inward, but the third dent was located
where the specimen buckled outward. The reduction in the buckling
stress of Specimen Pll compared to that of P9 seems to indicate that
imperfections with magnitudes that approach the thickness of the
specimen wall, and with patterns similar to the potential buckling
pattern, may have some effect on the level of the buckling stress.
42

During testing, no local yielding or other disturbances were
observed near the laminations that existed in Specimen T3. The
laminations seemed to have no effect on either the buckling stress
or the buckle pattern.
7.4 Effect of Residual Stresses
Figures 5, 6, and 7 indicate that a narrow band of high tensile
residual stress exists at the longitudinal weld. The existence of
this region is confirmed by Fig. 27, which shows a lack of surface
yielding (light areas on the photograph) along th~ weld in an other
wise extensively yielded specimen. Figures 5 to 7 also indicate the
regions and magnitude of maximum compressive residual stress, and
these were generally the first to show signs of surface yielding.
However, each of the A36 specimens (Tl to T5) failed initially through
the formation of a uniform, circumferential ring bulge at one end,
and as shown in Figs. 39 and 41, the polygonal post-buckling pattern
that later developed was randomly oriented. Comparisons of Figs. 7
and 43 indicate no apparent correlation between the residual stresses
and the pattern of tQe d:tamond,shaped buckles in Specimen PlO. Thus,
it appears that the welding residual stresses had no effect on the
buckling pattern of the tubular specimens. This confirms the conclu~
sion that was reached previously for the effect of residual stresses
on high-strength steel tubular specimens (5, 16).
43

7.5 Effect of D/t Ratio
The nondimensional buckling stress of each specimen and the D/t
ratio are listed in Tables 1 and lA and plotted in Fig. 45. Also shown
in the figure are some of the results from previous tests conducted on
fabricated tubular columns (5,6,7,9).
The buckling stresses generally decreased with increasing D/t
ratios. At D/t ratios less than 100 the buckling stress was nearly
equal to or exceeded the static yield stress. The increase in the
specimen yield stress was probably·caused by strain-hardening due to
the cold working of the rolling process.
7.6 Effect of a and c
Alpha and c are nondimensional parameters used in the presentation
of test data that tend to reduce the scatter among the results for
specimens with varying yield stress. The parameter a is defined by
E 1 F • D/t
y (2)
Alpha and the buckling stress for each specimen are given in Tables 1
and lA and plotted in Fig. 46. Also shown are some of the results
from previous tests conducted on fabricated tubular columns (5,6,7,9).
The use of a reduced the scatter between Specimens PlO and Pll that
~~isted in Fig. 45, but had little effect on the scatter among the
A36 specimens.
44

Previous research conducted on high-strength steel specimens
reported a trend for the mode of buckling to be dependent on a'(l6).
The A36 specimens followed this trend, that is for a greater than
2.4 buckling occurred gradually through the formation of a uniform
ring bulge. There were no A36 specimens tested with a less than 2.4.
Specimens PlO and Pll, each with ~ less than 2, also followed this
guideline by failing suddenly through the formation of a series of
diamond-shaped buckles.
The parameter c was used in R~f. 4 to propose a design equation
to predict the local buckling strength of 350 MPa (50 ksi) steel
tubular columns. Cis defined by
c = 3jFE • D~t . ys
(3)
C and the buckling stress for each specimen are given in Tables 1 and
lA and plotted in Fig. 47. The use of c seemed to reduce the scatter
among test results more effectively than a.
7.7 Comparison with Design Curves
Shown in Fig. 45 is a design curve that is currently being
proposed by the API mini-committee on tubular columns (19). The
curve is defined
for D/t < 60
= 1. 00
45
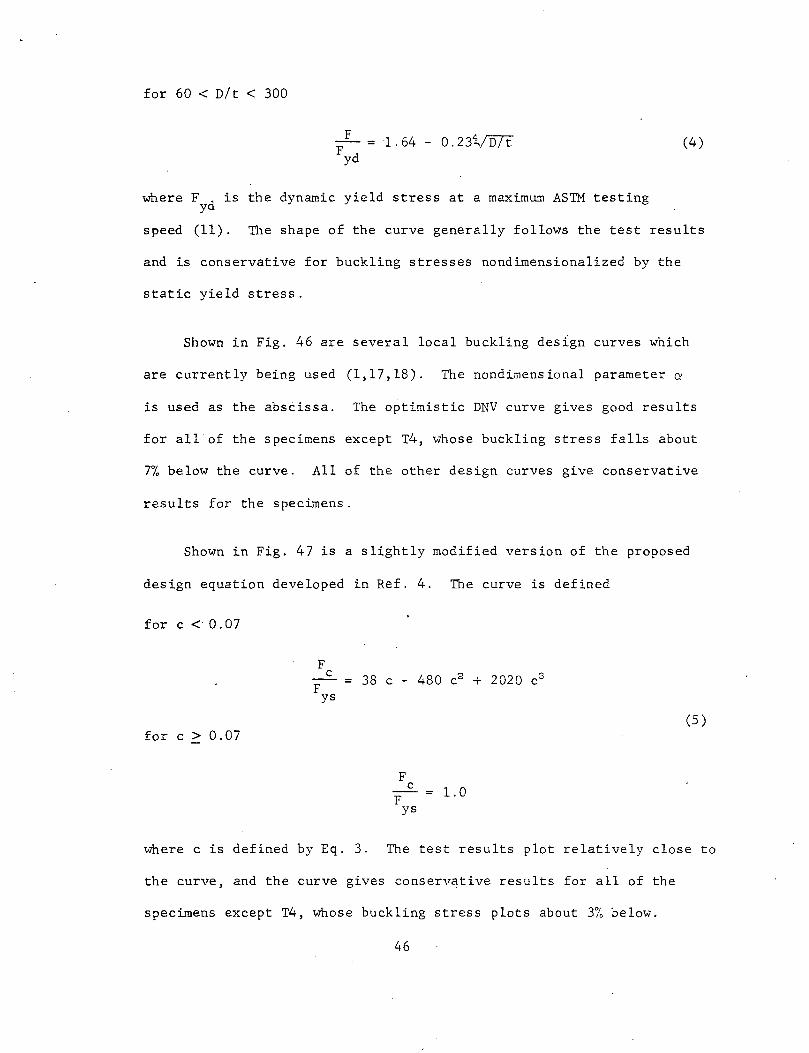
for 60 < D/t < 300
F - 1.64- 0.23\/Dlt Fyd
where Fyd is the dynamic yield stress at a maximum ASTM testing
(4)
speed (11). The shape of the curve generally follows the test results
and is conservative for buckling stresses nondimensionalized by the
static yield stress.
Shown in Fig. 46 are several local buckling des{gn curves which
are currently being used (1,17,18). The nondimensional parameter a
is used as the abscissa. The optimistic DNV curve gives good results
for all of the specimens except T4, whose buckling stress falls about
7% below the curve. All of the other design curves give conservative
results for the specimens.
Shown in Fig. 47 is a slightly modified version of the proposed
design equation developed in Ref. 4. The curve is defined
for c < 0.07
for c > 0.07
F c
F ys 38 c - 480 c2 + 2020 c3
F c
F ys
1.0
(5)
where c is defined by Eq. 3. The test results plot relatively close to
the curve, and the curve gives conservative results for all of the
specimens except T4, whose buckling stress plots about 3% below.
46

8. SUMMARY AND CONCLUSIONS
Local buckling tests were conducted on seven tubular specimens
fabricated by cold-rolling flat plate into a cylindrical shape and
then welding the joint. Five of the specimens were made from 250 MPa
(36 ksi) steel, one from 350 }~a (50 ksi) steel, and one by modifying
a 350 MPa (100 ksi) specimen tested previously. The outside diameters
ranged from 0.58 m (23.02 in) to 1.53 m (60.30 in) and the thicknesses
from 2.02 m;n(0.080 in) to 9.S4 mm (0.391 in.). The corresponding
diameter-to-thickness ratios (D/t) ranged from 59 to 294. The slender
ness ratios (length-to-radius of gyration) were less than 9 to preclude
the effect of overall column buckling.
Local buckling occurred in each of the specimens. The ultimate
stress reached was limited by the buckling in five of the specimens,
but in Tl and T5 a slight increase in stress was achieved after the
buckling could be visibly detected. The influence of initial geometric
imperfections and welding residual stresses on the location and pattern
of the buckles was examined, as well as the behavior of the specimens
in the post-buckling region. The test results were examined using
several design parameters and equations, and recommendations were made.
The following conclusions can be drawn from the results of these
tests:
47
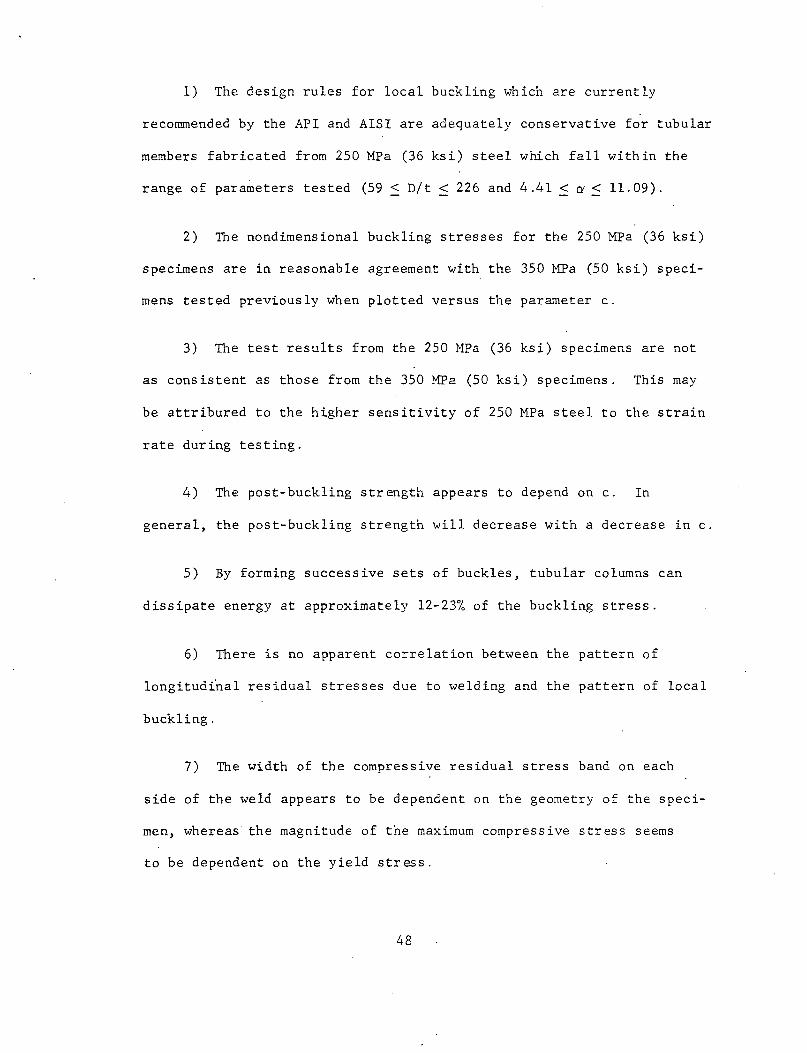
1) The design rules for local buckling which are currently
recommended by the API and AISI are adequately conservative for tubular
members fabricated from 250 MPa (36 ksi) steel which fall within the
range of parameters tested (59~ D/t S 226 and 4.41 <aS 11.09).
2) The nondimensional buckling stresses for the 250 MPa (36 ksi)
specimens are in reasonable agreement with the 350 MPa (50 ksi) speci
mens tested previously when plotted versus the parameter c.
3) The test results from the 250 MPa (36 ksi) specimens are not
as consistent as those from the 350 MPa (50 ksi) specimens. This may
be attribured to the higher sensitivity of 250 MPa steel to the strain
rate during testing.
4) The post-buckling strength appears to depend on c. In
general, the post-buckling strength will decrease with a decrease in c.
5) By forming successive sets of buckles, tubular columns can
dissipate energy at approximately 12-23% of the buckling stress.
6) There is no apparent correlation between the pattern of
longitudi'nal residual stresses due to welding and the pattern of local
buckling.
7) The width of the compressive residual stress band on each
side of the weld appears to be dependent on the geometry of the speci
men, whereas the magnitude of the maximum compressive stress seems
to be dependent on the yield stress.
48

8) The initial geometric imperfections whose magnitudes are of
the order of those established by the API recommendations appear to
have no apparent influence on either the local buckling stress or the
pattern of the buckles for the range of parameters tested.
9) Imperfections of the order of magnitude of the plate thick
ness and distributed in a manner similar to the buckling pattern
appeared to influence the buckling stress in one specimen.
10) The mode of initial buckling conformed to previously estab
lished guidelines which were based on the value of a. For specimens
with a greater than 3.6 (Specimens Tl to T5) a uniform ring bulge
gradually formed, and for specimens with a less than 2.4 (Specimens
PlO and Pll) a series of di&~ond-shaped buckles suddenly formed.
49

9. RECOMMENDATIONS
The API design recommendation defined by Eq. 4 was nondimension-
alized using the dynamic yield stress. Since the static yield stress
can be obtained much more consistently than any dynamic yield stress,
the equation should probably be nondimensionalized by F and the conys
stants adjusted. It also appears that a straight-line approximation
of the test data may be adequate for design purposes.
Even though the proposed design curve defined by Eq. 5 was
developed for tubular columns fabricated from 350 MPa (50 ksi) steel,
it appears to give reasonable results for the A36 specimens. It is
therefore recommended that the design curve defined by Eq. 5 be used
for predicting the local buckling stregnth of tubular members fabri-
cated from either 350 MPa (50 ksi) or 250 MPa (36 ksi) steel.
50

10. LIST·OF SYHBOLS
A cross-sectional area
c nondimensional parameter
D mean outside diameter
E modulus of elasticity
F nominal axial stress
F local buckling stress c
F yield stress y
F static yield stress ys
Fyd dynamic yield stress
L length
L/r slenderness ratio
P axial load
3(£. VF
y
OD-t
1 D/t
203, 400 MPa (29,500 ksi)
= p A
r radius of gyration = -{[
t thickness
nondimensional parameter
51
E F
y
1 D/t

11. REFERENCES
1. Johnston, B. G., Editor GUIDE TO STABILITY DESIGN CRITERIA FOR METAL STRUCTURES~ Chapter 10, Structural Stability Research Council, 3rd ed., John Wiley and Sons, Inc., New York, N.Y., 1976.
2. Schilling, C. G. BUCKLING STRENGTH OF CIRCULAR TUBES, Journal of the Structural Division, ASCE, Vol. 91, No. STS, p. 325, (October 1965).
3. Miller, C. D. BUCKLING OF AXIALLY COMPRESSED CYLINDERS, Journal of the Structural Division, ASCE, Vol. 103, No. ST3, p. 695, (March 1977).
4. Ostapenko, A. LOCAL BUCKLING OF WELDED TUBULAR COLUMNS, Proceedings of the International Colloquium on Stability of Structures under Static and Dynamic Loads (Washington, D.C., May 1977), ASCE, New York, p. 367' 1977.
5. Ostapenko, A. and Gunzelman, S. X. LOCAL BUCKLING OF TUBULAR STEEL COLUMNS, Proceedings, Methods of Structural Analysis, Vol. II, ASCE, New York, N.Y., p. 549, 1976.
6. Ostapenko, A. and Gunzelman, S. X. LOCAL BUCKLING TESTS ON THREE STEEL LARGE-DIAMETER TUBULAR COLUMNS, Proceedings of the Fourth International Conference on . Cold-Formed Steel Structures, St. Louis, Missouri, p. 409, (June 1978).
7. Marzullo, M. A. and Ostapenko, A. TESTS ON TWO HIGH-STRENGTH STEEL LARGE-DIAMETER TUBULAR COLUMNS, Paper 3086, Proceedings of the lOth Offshore Technology Conference, Houston, Texas, (May 1978).
8. American Society for Testing and Materials 1974 ANNUAL BOOK OF ASTI1 STANDARDS, PART 4, Specification A36-74, American Society of Testing and Materials, Philadelphia,· Pennsylvania, 1974.
9. \\Tilson, W. M. and Newmark, N.H. THE STRENGTH OF THIN CYLINDRICAL SHELLS AS COLUMNS, Bulletin No. 255, Engineering Experiment Station, University of Illinois, (February 1933).
52

10. Wilson, W. M. TESTS OF STEEL COLUMNS, THIN CYLI~~RICAL SHELLS, LACED COLUMNS, ANGLES, Bulletin No. 292, Engineering EA~eriment Station, University of Illinois, (April 1937).
11. American Society for Testing and Materials 1971 ANNUAL BOOK OF ASTM STANDARDS, PART 31, ASTM Specification ES-69, American Society for Testing and Materials, Philadelphia, Pennsylvania, 1971.
12 .. Rae, N. R., Lohrman, M., and Tall, L. EFFECT OF STRAIN RATE ON THE YIELD STRESS OF STRUCTURAL STEELS, Journal of Materials, Vol. 1, No. 1, P. 241, (March 1966).
13. American Petroleum Institute, Division of Production API SPECIFICATION 2B, SPECIFICATION FOR FABRICATED STRUCTURAL STEEL PIPE, 2nd ed., Dallas, Texas, (October 1972).
14. Chen, W. F. and Ross, D. A. TESTS OF FABRICATED TUBULP~ COLl~S, Journal of the Structural Division, ASCE, Vol. 103, No. ST3, p. 619, (March 1977).
15. Rao, N. R. and Tall, L. RESIDUAL STRESSES IN WELDED PLATES, Fritz Laboratory Report 249.7, Lehigh University, Bethlehem, Pennsylvania (October 1960).
16. Gunzelman, S. X. EXPERIME~~AL LOCAL BUCKLING OF FABRICATED HIGH-STRENGTH STEEL TUBULAR COLUMNS, Master's Degree Thesis, Fritz Laboratory Report 406.8T, Lehigh University, Bethlehem, Pennsylvania (October 1976).
17. Amer·i.can Petroleum Institute, Division of Production AP7 RP 2A, RECOMMEN~ED PRACTICE FOR PLANNING, DESIGNING, AND CONSTRUCTION FIXED OFFSHORE PLATFORMS, lOth ed., Dallas, Texas, p. 21, (March 1979).
18. Det Norske Veritas TENTATIVE RULES FOR DESIGN, CONSTRUCTION, ~~ INSPECTION OF FIXED OFFSHORE STRUCTURES, Rule Proposal RNT-1-73, (October.· 1973).
19. API PRAC Project No. 16 Committee Correspondence from R.K. Kinra to J.L. Hubbard dated August 23, 1979.

12. TABLES
54
Coupon i
No. Steel Static F ys
(MPa)
1 2 3
T1 A36 239.0
T2 A36 203.8
T3 A36 203.8
T4 A36 203.8
T5 A36 337.5
FlO A572 366.2 Gr50
Pll A514 622.8 Tp B
Notes:
TABLE 1. SPECIMEN DATA
Measured
OD (m)
4
0. 77
0.78
1.02
1.53
0.58
0.60
1.53
D -t L. t
(mm) (m)
5 6 7
9.94 2.03 76.7
6.73 2.03 113.3
6.73 3.05 150.7
6.73 3.05 226.5
9.73 1.22 59.1
2.02 1.22 294.5
6.55 1. 96 232.9
I I I
E 1 Ct = F . D/t
y
c = 3 /_L_ VF
ys
55
1 D/t
Test L a c F c r -
F ys
8 9 10 I 11 I
. 7.54 11.09 0.124 1.056
7.53 8.81 0.088 11.004
8.50 6.62 0.066 ! 0.999 I I I
5.65 4.41 0.044 I o. 88o I
! 5.99 10.20 o.143 11 1. 069
I I !
5.76 1. 89 0.028 I 0.844
i I I
3.63 1.40 0.030 0.829
! I

I Coupon I I Static
No. Steel F ys (ksi)
1 2 3
T1 A36 34.67
T2 A36 29.56
T3 A36 29.56
T4 A36 29.56
T5 A36 48.95
P10 A572 53.13 Gr50
Pll A514 90.32 Tp B
Notes:
TABLE 1A. SPECIMEN DATA
OD
(in.)
4
30.40
30.30
40.21
60.30
23.02
23.64
60.29
Measured
!
D -t L t
(in.) (in.
5 6 7
0.391 80 76.7
0.265 80 113.3
0.265 120 150.7
0.265 120 226.5
0.383 48 59.1
0.080 48 294.5
0.258 77 232.9
i
E 1 Ci = F . D/t
y
56
Test L a c F - _c_ r
F ys
8 9 10 11 .
7.54 11.09 0.124 1.056
7.53 8.81 0.088 1. 0041
8.50 6.62 0.066 0.999
5.65 4.41 0.044 0.880
5.99 10.20 0.143 1.069
5.76 1. 89 0.028 0.844
3.63 1.40 0.030 1,0.829 i 1 r : I i
-·

TABLE 2~ TENSILE COUPON RESULTS
I I I
' Yield Stress (MPa)
Th:lck-F
Fyd Fyd Fyd Coupon ness
I ys 521,1m/
F 1042 \.1m Source* No. (mm) (MPa) m/sec ys /m/sec
1 2 3 4 5 6 7
·Spec4ttens T2, T3, and T4: nomina.l 6.4 mm plate
1 262.0+ 2 T22 6.78 203.3 222.6 1.09
T23 6.79 206.8 222.9 1.08 T24 6.79 202.4 218.4 1.08
3 L7 6.68 204.1 226.2 1.11 239.3 L8 6.65 203.4 224.8 1.10 239.9 L9 6.69 202.7 225.5 1.11 237.9
4 L2 264.1: L3 257.9+ L4 279.2
Average 6.73 ! 203.8 223.4 1.10 239.0
Specimen Tl: ·nominal 9.5 mm plate
1 I 268.2 2 T11 9.87 242.7 255.7 1.05
Tl2 9.90 246.6 270.1 1.09 Tl4 9.90 244.3 265.5 1.09 Tl5 9.98 231.7 251.0 1.08 259.9 Tl9 9.99 235.1 257.2 1.09 271.0 T20 9.99 233.7 255.1 1.09 265.5
Average 9.94 239.0 259.1 1.08 265.5
Specimen T5: nomina.l 9.5 mm plate
5 363.4 2 T51 9.74 339.5 349.9 1.03
T53 9.74 336.0 361.6 1.08 T54 9.74 337.4 349.6 1.04 T55 9. 72 337.2 349.7 1.04
Average 9.73 337.5 349.7 1.04
*Sources: 1 -2 -3 -4 -
Bethlehem Steel Corp. (Mill Test Report) Fritz Lab, Lehigh University Chicago Bridge and Iron Co. Bethlehem Steel Corporation Lukens Steel Co. (Mill Test Report) + Values not included in average
5 -
Fyd F F u
ys (MPa)
8 9 -·--
-
367.2 368.6 369.5
1.17 1.18 1.17
1.17 t 368.4
i i
424.5 420.0 422.5 I
1.12 1.15 1.14
1.11 I ,422.3 -
491.5 I 494.2
I 494.0 490.4
1494.0. l

TABLE 2A. TENSILE COUPON RESULTS
Yield Stress (ks i)
Thick- Fyd Fyd Fyd Coupon ness F S2}.Lin/ F 1042 }.Lin
Source* No. (in) ys in/sec ys /in/sec
1 2 3 4 s 6 7 ··--
Specimens T2, T3, and T4: nominal ~ in plate
1 38.0+ 2 T22 .2668 29.48 32.2S 1.09
T23 .2672 30.00 32.33 1:08 T24 .266S 29.3S 31.68 1.08
3 L7 .263 29.6 32.8 1.11 34.7 L8 .262 29.S 32.6 1.10 34.8 L9 .263S 29.4 32.7 1.11 34.S+
4 L2 38.3+ L3 37.4+ L4 40.S
Average .2648 29.S6i 32.40 I 1.10 34.67 1
Specimen Tl: nominal 3/8 in. plate I
l I 38.9 2 Tll .3888 3S.20i 37.09 LOS
Tl2 .3897 3S.76 39.18 1.09 Tl4 .3896 3S.43 38.Sl 1.09 T15 .393 33.6 36.4 1. 08 37.7 Tl9 .3935 34.1 37.3 1.09 39.3 T20 .3935 33.9 37.0 1.09 38.5
Average .3914 34.671 37.S8 I 1. 08 I 38.S
Specimen TS: nominal 3/8 in. plate
5 S2.7 2 T51 .. 3834 49.24 S0.74+ 1. 03
T53 .3834 48.73 52.44 1. 08 TS4 .3834 48.93 50.71 1.04 T5S .382S 48.91 so. 72 1. 04
Average .3832 48.9S so. 72 1.04 i
*Sources: 1 - Bethlehem Steel Corp. (Mill Test Report) 2 - Fritz Lab, Lehigh University 3- Chicago Bridge and Iron Co. 4 - Bethlehem Steel Corporation
+ 5 - Lukens Steel Co. (Mill Test Report) Values not included in average
Fyd F F u
ys (ksi)
8 9. ·~· -
.. I
S3.2S S3.46 S3.S9
1.17 1.18 1.17
' 1.17 S3.43
I 6l.S6 60.92 61.28
1.12 1.15 1.14
I 1.11 ! 61. 2S
.. i ! I
71.28 71.76 71.65 71.13
71.65 I ' I
' !

TABLE 3.· INITIAL GEOMETRIC IMPERFECTIONS
Maximum Maximum OUT-OF-ROUNDNESS OUT-OF-STRAIGHTNESS
OD -max Location Offset Location No. OD min Col. 2 from Top ** from Top (mm) OD (m) (mm) (m)
1 2 3 4 5 6
Tl 7.60 0.0075 2.03 +1.55 1.14
T2 5.56 0. 0072 0.0 -3.05 0.89
T3 5.94 0.0058 l. 75 +2.46 l. 75
T4 11.71 0.0076 0.24 +1.83 1.44
T5 7.75 0. 0132 0.0 -2.21 0.80
PlO 7.75 0.0129
I
0.0 -2.52 0.62
I I
Pll 18.29 0. 0119 1.96 +2 .36 I 0.33 i! I :
*Type and location of buckling failure: RB-T = Ring bulge at top of specimen RB-B = Ring bulge at bottom W = Wave-like pattern along length DB-T,M = Diamond-shaped buckles at top and middle
**A negative offset is inward, a positive is outward
59
GL
7
8
9
2
2
1
1
13
Type* and
Location of
Buckles
8
RB-B
RB-T
RB-T
RB-T
W,RB-B
DB-T,M
I DB-T,M
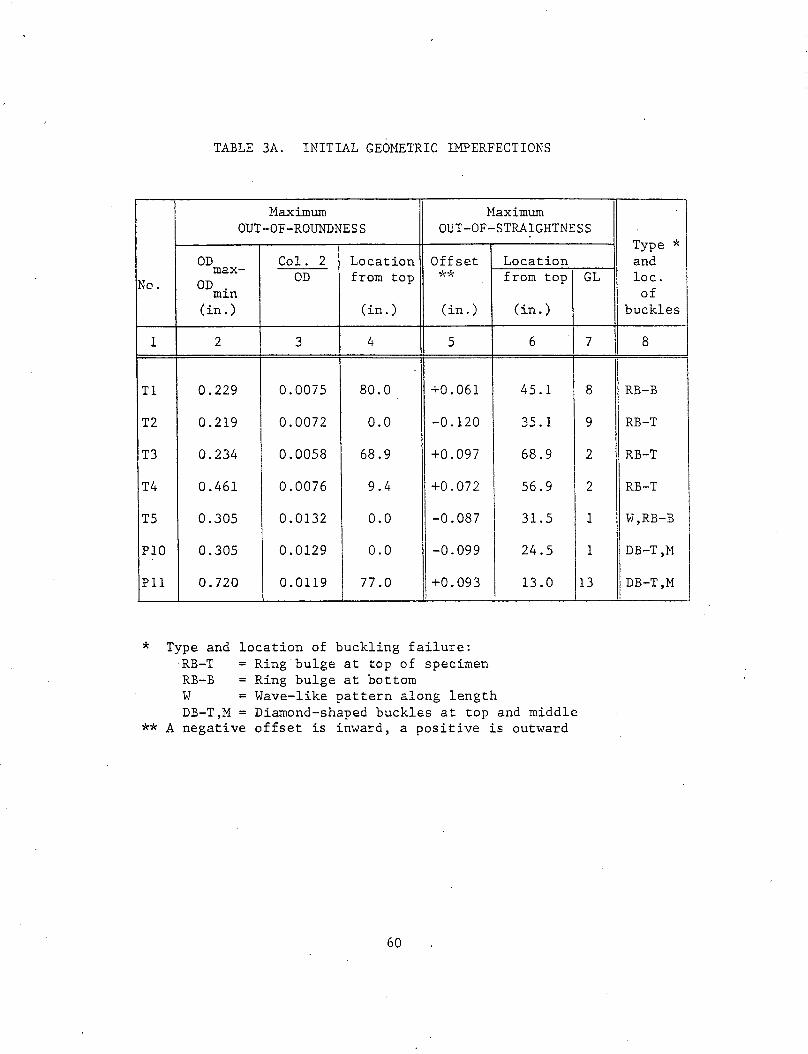
TABLE 3A. INITIAL GEOMETRIC IMPERFECTIONS
Maximum Maximum OUT-OF-ROUNDNESS OUT-OF-STRAIGHTNESS
OD Col. 2 Location Offset Location max- OD from top *~~ from top No. OD min
(in.) (in.) (in.) (in.)
1 2 3 4 5 6
Tl 0.229 0.0075 80.0 +0.061 45.1
T2 0.219 0. 0072 0.0 -0.120 35.1
T3 0.234 0.0058 68.9 +0.097 68.9
T4 0.461 0.0076 9.4 +0 .072 56.9
T5 0.305 0.0132 0.0 -0.087 31.5
PlO 0.305 0.0129 0.0 -0.099 24.5
Pll 0. 720 0.0119 77.0 +0.093 13.0 i
* Type and location of buckling failure: RB-T Ring-bulge at top of specimen RB-B Ring bulge at bottom W Wave-like pattern along length DB-T,M =Diamond-shaped buckles at top and middle
** A negative offset is inward, a positive is outward
60
GL
7
8
9
2
2
1
1
13
Type * and loc. of
buckles
8
I I RB-B
RB-T
RB-T
RB-T
W,RB-B
DB-T,M
! DB-T,M

13. FIGURES
61

MPa ksi
50
300-
40
F
200- 30
20
100
10
0
I I
j E= 203,400 MPa
I I
I
tt= ·-- _j
T54 (Specimen T5)
Tl4 (Specimen Tl)
\_ T22 (Specimens T2, T3, and T4)
STRAIN
'Fig. 1 Typical A36 Coupon Stress-Strain Curves for Strains Less Than 0.010
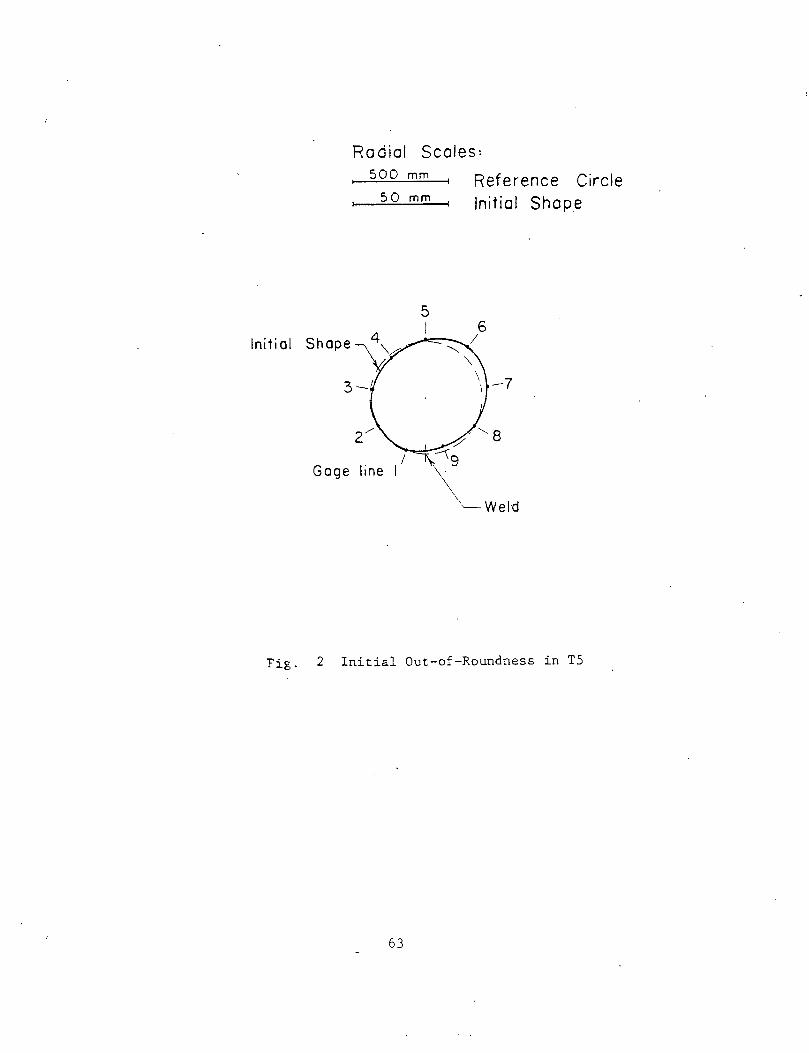
Radial Scoles: 500 mm
50 mm
5 I
Initial Shope
3-.
Gage line
Reference Circle Initial Shope
-7
Fig. 2 Initial Out-of-Roundness in TS
63
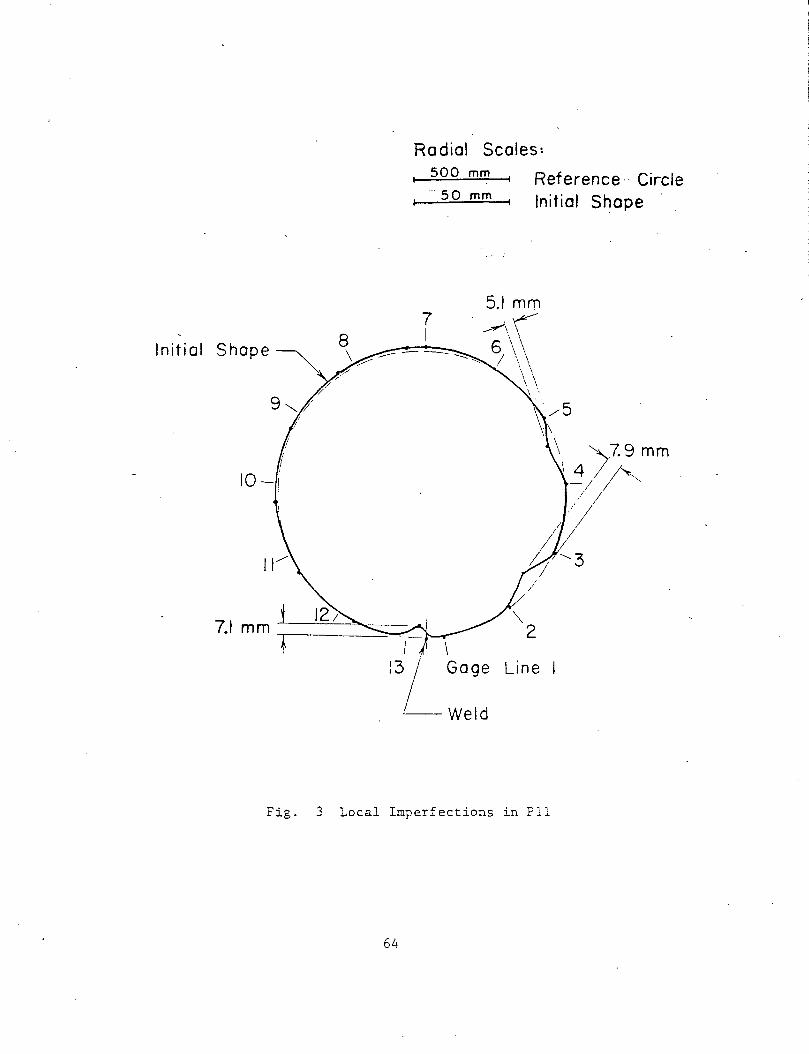
Initial Shape 8
/
Radial Scoles~
500 mm
-50 mm Reference·· Circle Initial Shape
7 I
5.1 mrn ~A"\\ 6\\
I \ \\ \ '.
:\
/ 0
Line
\ )7.9 mm \4 ·A," -;I /I
/ I / I
I
Fig. 3 Local Imperfections in Pll
64
' t f. !
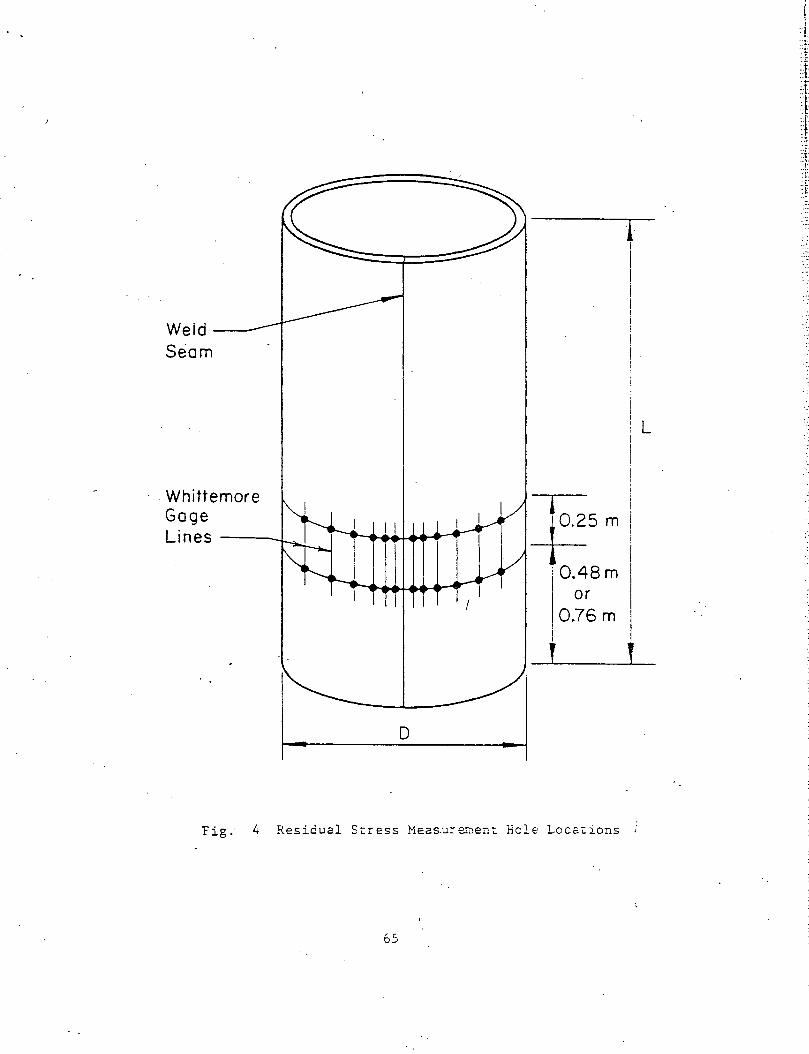
Weld--~
Seam
. Whittemore Gage Lines ----...L
I I I
D
l -?=5m i 0.48 m · or j 0.76 m I
1 I \ I I i ! I i . !
t J
Fig. 4 Residual Stress Meas.u:::-e.1·nen-c Bole Locctions ;
65
L
' [
i ::t: : ~

I Developed Plate Width I 1- -I I Outside 0
I I 6 Inside ::::: FY (tension)
I I 1 Weld Seam I
30 I J
0
oo -60
~05 ksi) -90~ Line Opposite
Weld Seam
Fig. 5 Residual Stress Distribution in T2
66 I

I o Outside
A Inside
I I I I
Weld Seam
J___ Line Opposite
I Weld Seam
I
Developed Plate Width
~ Fy (tension)
30
-30
(13.05 -90 MPo
0
Line Opposite~ Weld Seam
Fig. 6 Residual Stress Distribution in T4

1-Developed Plate Width
o Outside I A Inside
I I I Weld I Seam
I I 6
A 0.5m
~Fy (tension)
60
30
0.5m
-30
-60
0 -90 MPa ( -13.05 ksi)
~Line Opposite/ Weld Seam
Fig. 7 Residual Stress Distribution in PlO
68

p
t Loading Head
of Machine
Leveling Grout--+---+--/ At Both Ends
Electrical Strain Gages
End Rings-Welded To Both E n.ds
o I
I
~Magnet
Test Specimen
Near Longitudinal Dial Gage
/
Corner · Longitudinal . Dial Gage Machine
Floor or 7~~~~~;;~~~~~~~~Jt~~----p e de st a I // / /. / · / . '/ / / /
rig. 8 Sch~atic o-.c' Ge 1 T nera est Setu~ 1:"
69
I· ~j :.!

--.1 0
1.20
J E= 203,400 MPa
}.00 I
""' I I ""' I
"'" I I
' .eo I I I
.60 lp ~
F /Fys Corner Deformations + L
0' Near Deformations + L L .4-0 Strain Gages
t p .20
o.oo--------~-----4------~------4-------+-----~~-----+------~----~ o.ooo 4.000 e.ooo
STRAIN 12.000
Fig. 9 Stress-Strain Curve for Tl
16.000Xl0

-~~---· ·~ .. -..... .... ~ . ., .............. ~ ........... .,.. ____ ............... .
}.00
.so
.60 ...... ~
F /Fy5
.40
.20
JE= 203,400 MPa I I
Corner Deformations + L
Near Deformations + L
Strain Gages
Whittemore Gages
tp 6.
a~ L
t p
o.oo.-------~------~----~-------4-------+-------+------~------~------4 o.ooo 4.000 B.OOO
STRAIN 12.000
Fig. 10 Stress-Strain Curve for T2
L6.000XLD
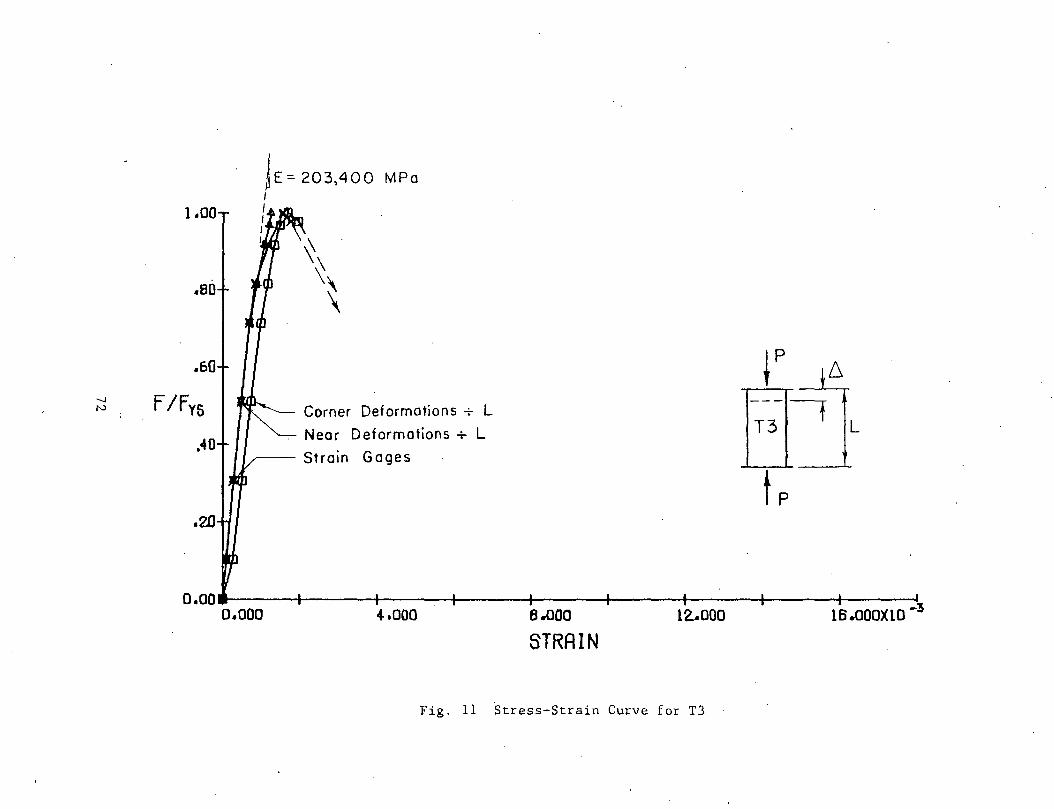
-..J N
}.00
.so
.60
F /fvs
.40
.20
JE: 203,400 MPa I I I I J
Corner Deformations -:- L
Near Deformations + L
Strain Gages
*p 6
a~ L
t p
o.oo------~~----~------+-----~------~------+-----~-------r----~3 o.ooo 4.ooo e.ooo 12..ooo ts.oooxto-STRAIN
Fig. 11 Stress-Strain Curve for T3 ·

-....! w
j E= 203,400 MPo }.00
I I
.80 ,"-,,
"" ,, "'
.60 tp 6
F /Fys Corner Deformations -:- L
a~ Near Deformations + L L .40 Strain Gages
Whittemore Gages
t p
.20
o.ooa-------+-------~------~----~-------4-------+------~------~------~ o.ooo 4.000 8.000
STRAIN 12.000
Fig. 12 Stress-Strain Curve·for T4
16.000X10

1.oo
.eo
...... .60 tp ~ .!> · Corner Deformations + L
F /Fy5 Near Deformations + L Eit ---Strain Gages L-.40
t p .. 20
o.oo------~~----~-------r------~------r------4-------+------,_----~ 0.000 4-.000 5.000 12.000 16.000Xtll"-3
STRAIN
· Fig. 13 Stress-Strain Curve for TS

1.001
.80
.60
.40
.20
n E = 203.400 I
MPa
I I I
Corner Deformations + L
Strain Gages
-- Whittemore Gages
o.oo~----~------~------r-----~------~------~-----+------~----~ 0.00 4.00 8.00
STRAIN
12.00
Fig. 14 Stress-Strain Curve for PlO
16.00 X 10 -_

1.00! j E = 203,400 MPa
I I
I I .so
\ \
~ p " .60 \ ~ ()'\
F/ Fys El' L .40 Deformations + L
Strain Gages tp .20
O.OOB------+------+------+------+------4------4-----~------~----~ 0.00 4.00 8.00 12.00 16.00 x I0-3
STRAIN
Fig. 15 Stress-Strain Curve for Pll

Gage Line 2 GL 6 GL II
T3
(i)
I.Om
Scales: 1 2 mm
1
Fig. 16 Lateral. Deflection Profiles for T3

Gage Line 9 GL 5 GL I
T5
Scales: 2 mm
GL 9
3 __..,....(Deflections from initial out- of-straightness)
Fig. 17 Lateral Deflection Profiles for TS

t.oo
.eo
.60
F /Fy5 '-1 '!) .... o
.20
o.oo o.oo
o.oo
I'
il (Probable path
: \ . : \ I .
I
I \ I l \ I
\ \
I I
I I I
~ / y\_ I I
1 1 Unloaded I I
I f Overnight I I II II II
z.oo 4.00 s.oo
60.00 too.oo UiJ.OO
AVG. AXIAL DEFORMATION, 6
Fig. 18 Stress-Deformation Curve for Tl
tp 6.
E[' L
t p
a.oo
200.00
' )
IN
Mt1

---------- ~--------
t.oo -~ p 6
.eo a~ L
.so t p
F /Fy5 00 0 .... o
o.oo~-----b----~------+------+----~r-----4-----~~~--~----~ 0.00 2.00 4.00 6.00 B.OO · IH
o.oo 50.00 100.00 lBJ.OO roo.oo Mtt
AVG. AXIAL DEFORMATION, 6
Fig. 19 Stress-Deformation Curve for T2

t.oo
.ao
lp 6 .60 o~ L
F /Fy5-co I-'
t p .c\-0
.20
0.00~----~----~~----~----~------~-----+------+------+----~ o.oo 2.oo ct-.oo 6.00 a.oo IN
o.oo 50.00 100.00 150.00 roo.oo Ml1
AVG. AXIAL DEFORMATION. 6
Fig. 20 Stress-Deformation Curve for T3

1.oo
.eo
tp 6. .60
a~ F /Fys ~L
co N
.40
t p
·20
~ o.oo~----~------~----~----~~----~-----4------~----~----~ o.oo 6.00 a.oo IN
o.oo 50.00 100.00 l&J.OO eoo.oo Mt1
RVG. AXIAL DEFORMATION, 6.
Fig. 21 Stress-Deformation Curve for T4

t.oo
~p 6
.ao a~ L
.so t p
F /Fy5 00 w
.... o
0.00~----~----~------+------+----~~----~-----+------~----~ o.oo 2.00 4.00 s.oo a.oo IN
o.oo 60.00 100.00 160.00 200.00 Mt1
AVG. AXIAL DEFORMATION, 6
F~g. 22 Stress-Deformation Curve for TS

t.oo
.BO
~~ .60 o-T F /Fy5 t 00
.j::--
t .40
.20
0.00~----~------r------r------r-----~----~------~-----+----~ o.oo 2.oo 4a00 6.00 a.oo IN
o.oo 50.00 100.00 150.00 200.00 Mt1
AVG. AXIAL DEFORMATION, 6 ·
Fig. 23 Stress-Deformation Curve for PlO

-- ----
1.00
.eo
.60 _!: ~ F /Fys E[til CX>
V1
.4-0 t t p
.20
o.oow------+------~-----r~~~r-----~-----4~----;-----~----__, o.oo 2.oo 4-.00 6.00 a.oo IN
o.oo 60.00 100.00 l&J.OO 200.00 Mt1
AVG. AXIAL DEFORMATION, 6
Fig. 24 .. Stress-Deformation Curves for Pll and P9
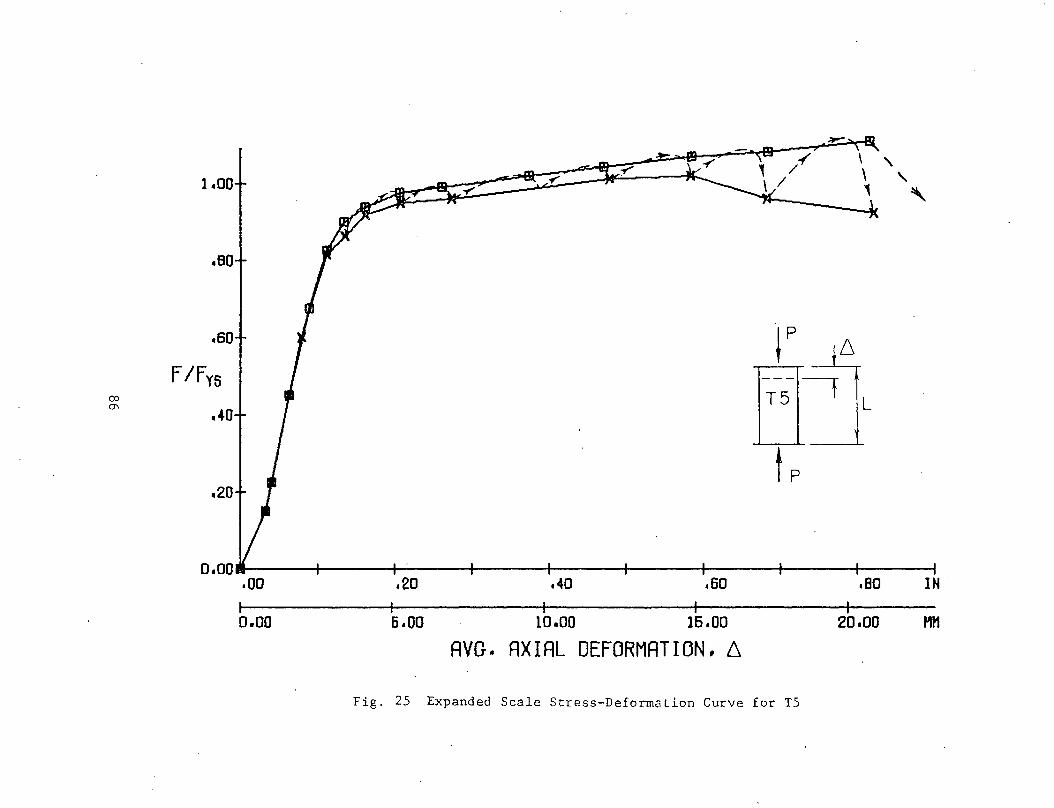
1.00
.eo
.so tp 6 F /Fy5 a~ co L (J\
.40
t p .20
o.ooa------4------~----~------~------~-----r------+------+----~ .oo .20 .40 .Bo .eo IH ·
o.oo 5.00 10.00 15.00 20.00 t1t1
AVG. AXIAL DEFORMATION, 6
Fig. 25 Expanded Scale Stress-Deformation Curve for TS

t.oo tp 6
.eo ]Jt L
t p .60
00 F /Fy5 -..J
.... o
.20
o.oo-------+------~----~------~----~~----~------~-----+----~ o.oo 4.00 6.00 a.oo IH
o.oo so.oo 1oo.oo Lso.oo 200.00 Ml1
AVG. AXIAL DEFORMATION, 6 Fig. 26 Comparison of Stress-Deformation Curves for Tl and TS

Fig. 27 Extensive Yielding in Tl
88

Fig. 28 Test Setup for T2
89

Fig. 29 Over~ll View of T2 After Formation of Ring Bulge
90

2
Fig. 30 Close-up of Ring Bulge in T2
91

T2
Fig. 31 Post-Buckling Deformations in T2
92

Fig . 32 Test Setup for TS
93

Fig. 33 Longitudinal Wave-Like Buckles in TS
94

-----------
Fig. 34 Formation of Ring Bulge in TS
q-s
r
I I t l.
l
--;

i ' .
I ~J r. \
i [ r'sr ~ . . .,.
I . I
Fig. 35 Post-Buckling Deformations in TS
9_6

.. r
7 • ' 0 H 1-i I
'
\
Fig. 36 Diamond-Shaped Buckles in P 11
9J
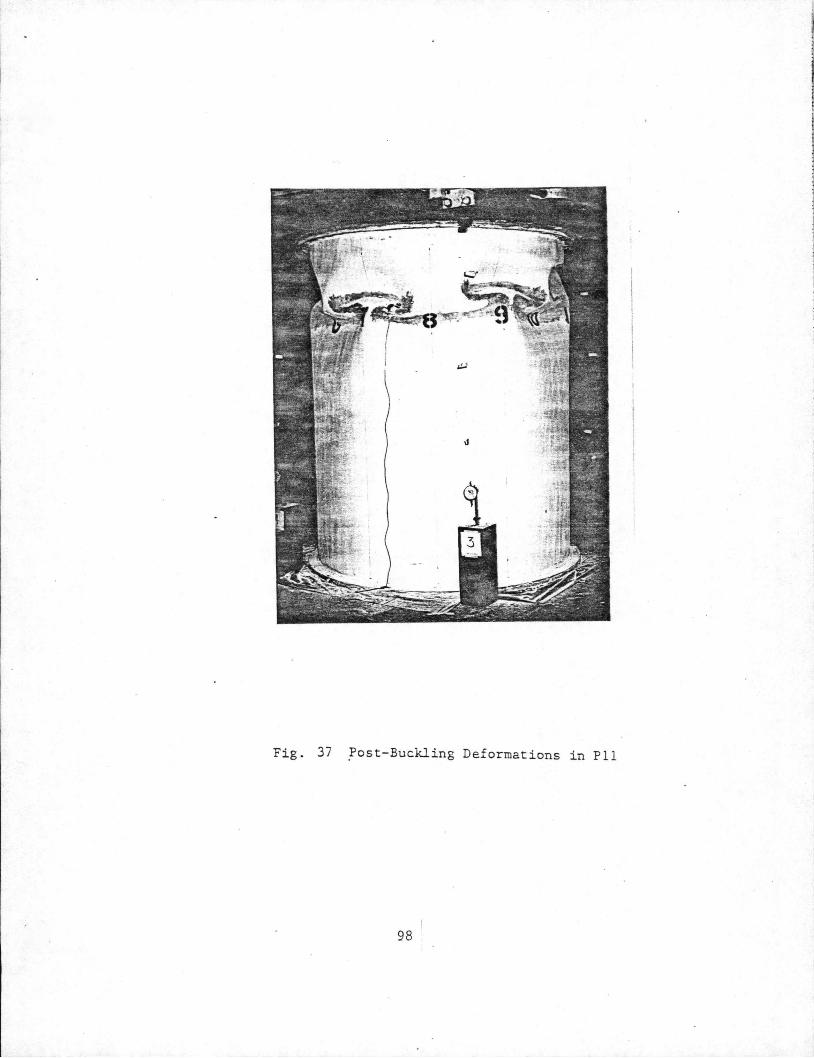
Fig. 37 .P ost-Buckling Deformations in P 11
98
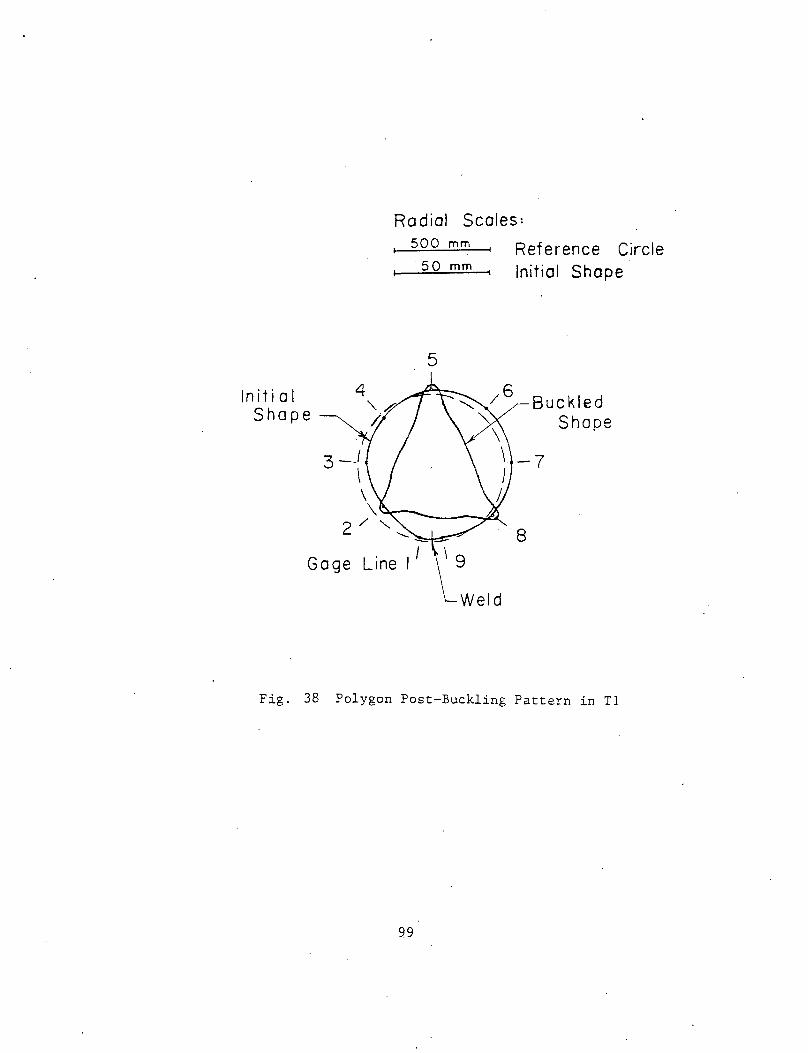
Radial Scoles:
In it i a I Shape
3 __ { \ \
500 mm
·50 mm
5
\~----(!J. 2 / "'-
Gage Line 11
Reference Circle Initial Shope
-7
8
Fig. 38 Polygon Post-Buckling Pattern in Tl
99

In itia I Shape
3-
Gage Line
Radial .Scales: 500 mm
50 mm
5
Reference Circle _Initial Shop.e
Buckled Shape
Fig. 39 Polygon Post-Buckling Pattern in T2
100
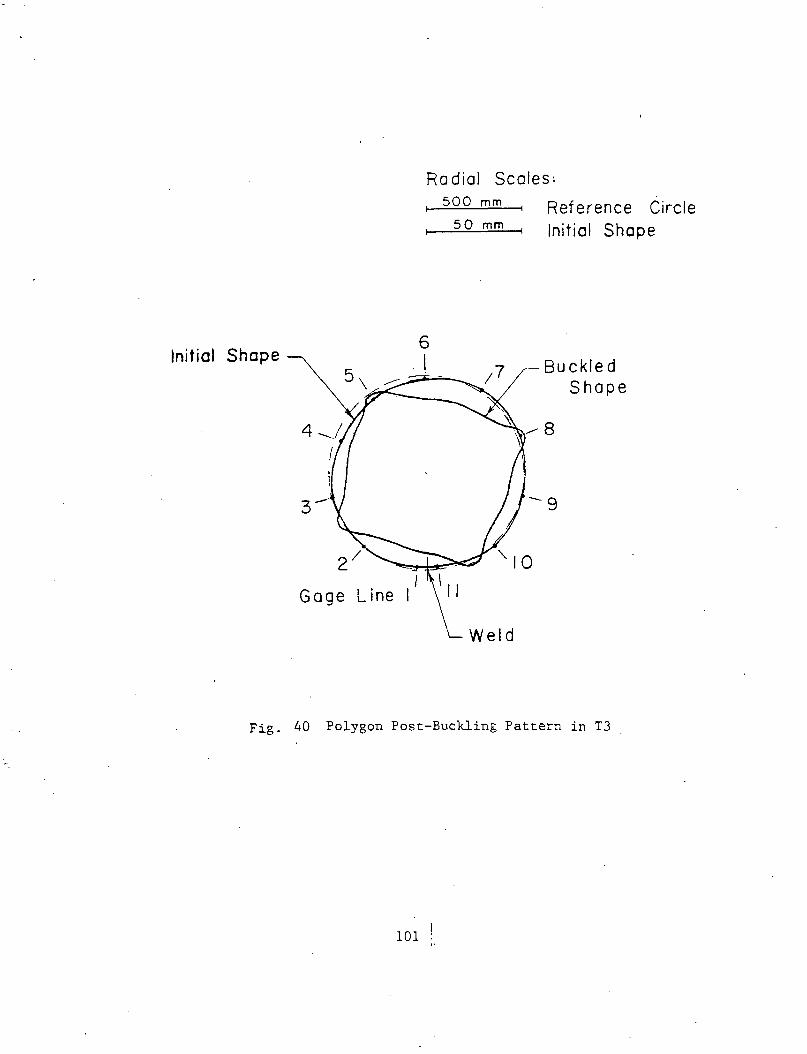
Initial Shope
Gage Line
Ro dial Scales:
6 - I
500 mm
50 mm Reference Circle Initial Shape
Buckled Shape
Fig. 40 Polygon Post-Buckling Pattern in T3
101

Initial Shope
Radial Scales: 500 mm
50 mm
7 I
--·-·--- -
Gage Line 11
Weld
Reference Circle Initial Shape
Buckled Shape
Fig. 41 Polygon Post-Buckling Pattern in T4
102

Radial Scales: 500 mm
50 mm
Initial Shape~ -5
4" /-
3-/ I \
(
2/\~ --=
. I Gage L1ne I
Reference Circle Initial Shape
Buckled Shape
Fig. 42 Polygon Post-Buckling Pattern in TS
103
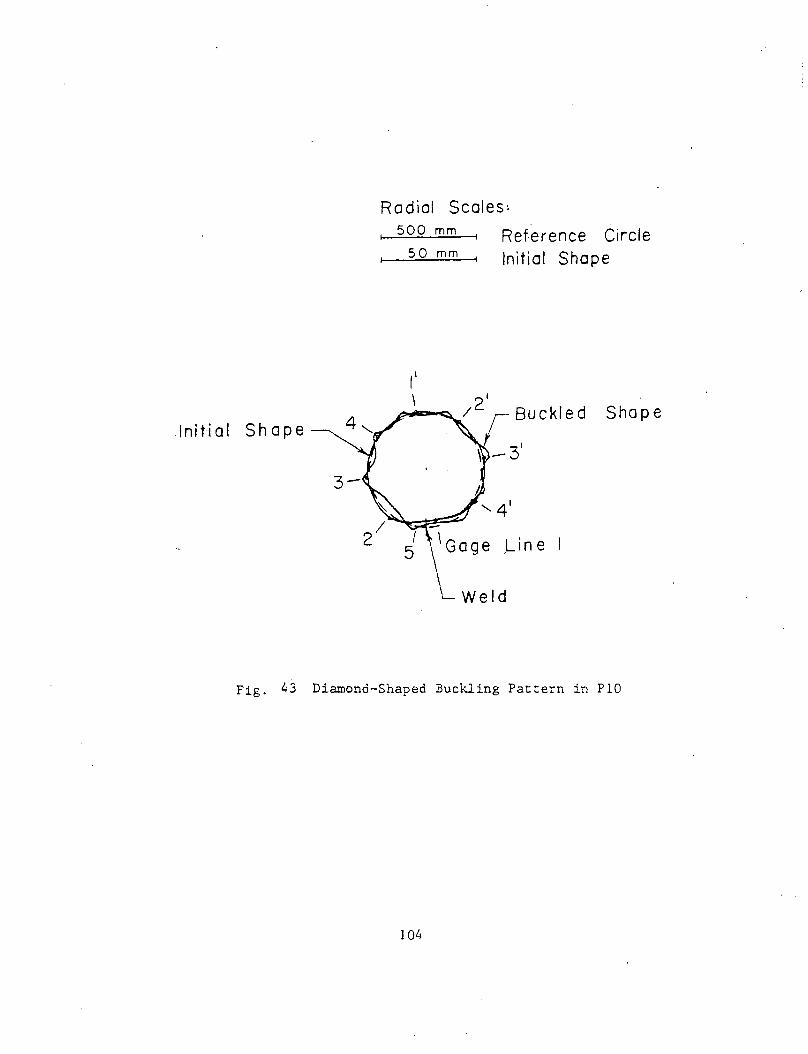
Initial Shape
Radial Scales: 500 mm
50 mm
I' \
Reference Circle Initial Shape
Buckled Shape
Fig. 43 Diamond-Shaped Buckling Pattern in PlO
104

Initial Shope
10
Radial Scales: soo·.mm -50 mm
7 I
\
Reference · Circle Initial Shape
Shope
13 Gage Line
.____Weld
Fig. 44 Diamond-Shaped Buckling Pattern in Pll
105
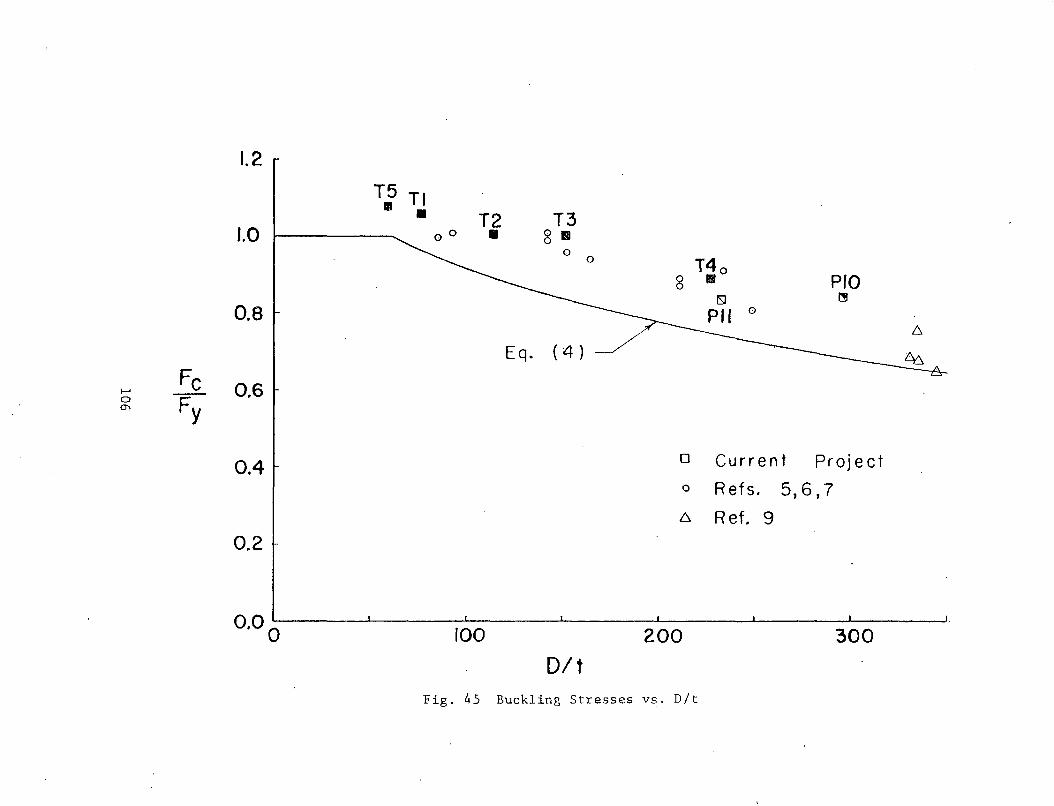
1.2
T5 Tl • • T2 T3
1.0 0 0 • 8 11 0
0 T4o 8 Ill PJO
~
0.8
(4)~ 6.
Eq.
I-' Fe 0.6
0
Fy ~
0.4 0 Current Project 0 Refs. 5,6,7 6 Ref. 9
0.2
100 200 300
Dlt Fig. 45 Buckling Stresses vs. D/t

0.8
0.6
Fc I--' Fy 0.4 8
API
0 2 4
T2
Plante rna A lSI
Donnell B Wan (U= 0.0006)
6 8 10
Et a = F D
y
o Current Project o Refs. 5,6,7 6 Ref. 9
I I I 12 14 16
Fig. 46 Buckling Stresses vs. a
I 18

1.20
T,l T5 • •
1.00
.80 Fe o Current Project Fys
i-o . 60 Eq. (5) o Refs. 5,6,7 .
0 (X)
:40
.20
o.oo~----~~----~~~--~------~------~--~--~------~--. 0.00 0.04 0.08 0.12
c - ~fr_ . I ~ Fys. 0/ t
Fig. 47 Buckling Stresses vs. c

14. VITA
David F. Grimm, son of Dolores and David F. Grimm, Sr., was born
on November 24, 1952, in Steubenville, Ohio. The author grew up in
Richmond, Ohio, and he was the valedictorian of the Jefferson Union
High School Class of 1971.
The author was a co-operative student with the Weirton Steel
Division of National Steel Corporation while he did his undergraduate
studies at the Georgia Institute of Technology in Atlanta. He
graduated with High Honors from Georgia Tech in 1976, and then joined
Pittsburgh-DesMoines Steel Company as a design engineer and began
taking evening courses at the University of Pittsburgh. In 1977 he
was transferred to a nuclear power construction site in Pottstown,
Pennsylvania, where he was a field engineer with both Pittsburgh
DesMoiO:es Steel and Bechtel Power Corporation. In August, 1978, he
left Bechtel to accept a Research Assistantship in Civil Engineering
at Fritz Engineering Laboratory, Lehigh University. He received his
Master of Science in Civil Engineerin& majoring in structural engi
neering, from Lehigh in December 1979.
The author married Debra Kay Bendle on August 30, 1975, and they
are the parents of two daughters, Pepper Shawn and Cristina Shaye. He
has recently accepted a position in the Offshore Structural Engineering
Department of Hudson-McDermott Engineering Corporation in Houston,
Texas.
10.9


![Sidesway Web Buckling of Steel Beams[1]](https://img.dokumen.tips/doc/110x75/55cf92b2550346f57b98d6e6/sidesway-web-buckling-of-steel-beams1.jpg)