Embed Size (px)
Citation preview
ISSN 1063�7761, Journal of Experimental and Theoretical Physics, 2010, Vol. 111, No. 1, pp. 57–63. © Pleiades Publishing, Inc., 2010.Original Russian Text © A.V. Glushkov, 2010, published in Zhurnal Éksperimental’noі i Teoreticheskoі Fiziki, 2010, Vol. 138, No. 1, pp. 67–73.
57
1. INTRODUCTION
Investigating the cosmic rays (CRs) that produceextensive air showers (EASs) with ultrahigh energies(E0 ≥ 1017 eV) is one of the most difficult astrophysicalproblems. Many experiments and calculations havebeen performed since their detection, but as yet thereis no unequivocal understanding of the nature of thisphenomenon. In [1–17], it was shown that CRs withE0 ≥ 1017 eV have a certain correlation with the planesof the Galaxy and the Supergalaxy (the Local Super�cluster of galaxies). Evidence for the presence of bothglobal and small�scale anisotropies in various energyranges is provided in [5–16]. On this basis, CRs wereassumed to consist of two components. One of thecomponents is extragalactic in origin and can be gen�erated by quasars [7, 9, 11, 13]. Recently, the group ofauthors [18] reported that the main sources of CRswith E0 ≥ 5.7 × 10¹⁹ eV are active galactic nucleilocated in the local volume of space with a radius of75 Mpc. On their way to the Earth, ultrahigh�energyparticles “sound” the Supergalaxy and the Galaxy.Some of them enter into nuclear reactions with gaswhose concentration is highest in the disks of thesestructures. This largely explains the picture observed in[1–18]. The equatorial plane of our Solar system isalso a region with a relatively high concentration ofmatter. It may well be that it can somehow affect theCR anisotropy. We investigated this issue. Below, wepresent our experimental results that reveal some newfeatures in the anisotropy of CRs with the above energies.
2. THE DATA PROCESSING AND ANALYSIS METHOD
We considered EASs with E0 ≥ 1017 eV and zenithangles θ ≤ 60° recorded on the Yakutsk array over theperiod 1974–2009. For our analysis, we selected show�ers whose arrival directions were determined from four
or more observing stations. Their angular accuracy is atleast 3°–5° and, at E0 ≥ 5 × 10¹⁸ eV, at least 2°–3°. Theenergy E0 was found from the relations
(1)
(2)
(3)
where ρs, 600(θ) is the charged particle density mea�sured by ground�based scintillation detectors at thedistance R = 600 m from the shower axis with an accu�racy of about 30%.
We investigated the global anisotropy of this sampleby the standard method of Fourier analysis [19] inequatorial coordinates. Basically, it consists in choos�ing the best amplitude A1 and phase ϕ1 of the function
(4)
by minimizing
(5)
where Ni is the number of showers in the ith sector(Δα)i, α is the right ascension in equatorial coordi�nates,
(6)
fmax and fmin are the maximum and minimum ampli�tudes of the sine wave.
E0 eV[ ] 4.8 1.6±( ) 1017ρs 600,
1.0 0.0± 0( ),×=
ρs 600, 0( ) m2–[ ] ρs 600, θ( ) 1020 θsec 1–
λρ
����������������⎝ ⎠⎛ ⎞ ,exp=
λρ g/cm2[ ] 450 44±( ) 32 15±( ) ρs 600, 0( ),log+=
f α( ) f0 1 A1 α ϕ1–( )cos+[ ]=
X2 fi Ni–( )2
fi
������������������,
i 1=
n
∑=
f01n�� Ni
i 1=
n
∑Nn���,= =
A1 fmax fmin–( )/ fmax fmin+( ),=
NUCLEI, PARTICLES, FIELDS,GRAVITATION, AND ASTROPHYSICS
Local Anisotropy of Cosmic Rays with E0 ≥ 1017 eV from Yakutsk EAS Array Data
A. V. GlushkovShafer Institute of Space Physics and Aeronomy, Yakutsk Research Center, Siberian Branch,
Russian Academy of Sciences, Yakutsk, 677891 Russiae�mail: [email protected]
Received October 6, 2009
Abstract—The arrival directions of primary cosmic ray particles with energies E0 ≥ 1017 eV and zenith anglesθ ≤ 60° recorded on the Yakutsk array over the period 1974–2009 are analyzed. These events are shown tohave different anisotropies in different energy ranges.
DOI: 10.1134/S1063776110070058

58
JOURNAL OF EXPERIMENTAL AND THEORETICAL PHYSICS Vol. 111 No. 1 2010
GLUSHKOV
The anisotropy was studied in the intervals h =Δ logE0 = 0.2 by successively shifting them in energyby 0.4h. This was done to study in more detail thebehavior of the phase of the first harmonic ϕ1 in indi�vidual energy ranges, where its rapid changes areobserved [9, 10, 13, 20]. In my opinion, these are notrandom but are caused by the actual multipolar anisot�ropy of the primary cosmic radiation in space.
A measure of the presence of anisotropy is theamplitude A1 of the first harmonic. If it exceedsnoticeably (its value is larger than the standard error σby a factor of 3) the amplitude of an appropriate iso�tropic flux, then the phase ϕ1 is assumed to reflect theactual anisotropy in this case. It is compared with theamplitude ΔA1 for an isotropic flux in which the num�ber of events is equal to the actual number of showersN. The amplitude ΔA1 can be found from Monte Carlosimulations or analytically [19]:
(7)
Relation (7) suggests that nonzero amplitudeswhose values increase with decreasing number ofevents N will always be observed in an experiment,even in the absence of actual anisotropy. This occurs asthe energy E0 of the showers being analyzed increases,i.e., a random distribution can imitate the energydependence of the amplitude of the first harmonicexpected from physical considerations. The distribu�tion of parameters for the observed anisotropy vectorthat results from the sample being limited at small Nwas considered by Linsley [19], who introduced thecoefficient k = N(A1/2)2 and the probability that theobserved value of A1 could be obtained for an isotropicflux:
(8)
3. THE RESULTS
Figure 1a shows the measured and calculated (fromEq. (7)) amplitudes. The corresponding probabilities(8) and phases ϕ1 are displayed in Figs. 1b and 1c.These values were obtained for a sample of events inthe band of declinations 15°–30°. The middle of thisband (23.5°) occurs at the maximum of summer sol�stice, when the ecliptic plane falls best within the fieldof view of the Yakutsk array. This can be seen fromFig. 2, which shows a full sky map in Galactic coordi�nates on which the equatorial coordinates were addi�tionally plotted. Curves EC and SG indicate the eclip�tic and Supergalactic planes, respectively. The eclipticplane is inclined to the plane of the celestial equator(the curve with δ = 0) at an angle of 23.44°. Thecrosses indicate the arrival directions of CRs withenergy E0 = 1018.7–18.9 eV.
In Fig. 1a, we clearly see peaks 1 and 2 in the energyintervals Δ logE0 = 18.0–18.2 and 18.7–18.9 withprobabilities of their chance outcome p ≈ 4 × 10⁻⁴ andp ≈ 6 × 10⁻⁴. The former includes 2892 showers. Itsphase ϕ1 = 5° ± 16° is in no way related to the Galacticplane, whence an anisotropy of the charged CR parti�cle flux might seemingly be expected in the diffusionmodel of their propagation. This direction points toone of the sectors in the equatorial region of theSupergalaxy (arrow 1 in Fig. 2). The second sector atα ≈ 180° is at the minimum of the general distribution
ΔA1 1.25 2/N.≈
p ≥A1( ) e–k.=
17
ϕ1, deg
logE0 [eV]18 19
(c)
120
360
0
240
17
p
18 19
(b)
10−4
10−2
10−3
10−1
100
12
17
A1
18 19
(a)
10−3
10−2
1
2
10−1
100
Fig. 1. Amplitude (a), probability (b), and phase (c) of thefirst harmonic versus CR energy for the sample of events inthe band of declinations δ = 15°–30°: the dots representthe experimental data; the curve represents the expectedamplitude of the first harmonic A1 for an isotropic flux;1 and 2 are statistically significant values.

JOURNAL OF EXPERIMENTAL AND THEORETICAL PHYSICS Vol. 111 No. 1 2010
LOCAL ANISOTROPY OF COSMIC RAYS 59
of events (the histogram in Fig. 3a). The distributionsin Fig. 3 exhibit a pronounced north–south Galacticasymmetry (see Fig. 2). It can be easily understood ifsome of the CRs in this energy interval are assumed tobe extragalactic in origin. In [7, 9, 11, 13], it wasshown that quasars could be the possible sources ofultrahigh�energy CRs. They are among the most pow�erful sources in the Metagalaxy. These objects arelocated at cosmological distances that exceed consid�erably the sizes of the Supergalaxy. On their way to theEarth, CRs of such energies “sound” the latter. Thedensest central part of the Supergalaxy (CSG in Fig. 2)occurs exactly at the minimum of the distribution inFig. 3a. We believe that the peak flux in a direction ϕ ≈ 5°is attributable to this circumstance or, more specifi�cally, to the relatively stronger absorption of Metaga�lactic CRs by the central region of the Supergalaxythan by its opposite, less dense part toward the anti�center (ACSG in Fig. 2).
Let us now consider peak 2 in Fig. 1. Its phase ϕ1 =119 ± 18° (the maximum of curve (4) on histogram 2in Fig. 3b) was found for 193 showers with energy E0 =1018.7–1018.9 eV. There are 96 showers in the sectorwith α = 15°–165° and 58 showers in the oppositesector with α = 195°–345°. The excess of events in thefirst sector above the second one is
This is a statistically significant excess caused by someastrophysical factor. It is unlikely that we can continueto talk about the influence of the Supergalactic struc�ture here. It is also hard to find a clear relationship to
96 58–
96 58+( )/2��������������������������� 38
8.77�������� 4.3σ.≈ ≈
the Galaxy to explain the result obtained. The phaseϕ1 ≈ 119° is in no way related to its plane. Although, ofcourse, we can suggest that the sector α = 15°–165°covers the part of the sky toward the Galactic anti�
90°CSG
−90°ACSG
−60°
−30°
0°360°
−60°
−30°
30° 30°
60°60°
N
SEC
SG
120°240°
δ = −30° δ = 0°
α = 90°δ = −60°
δ = 60° α = 270°
δ = 0°α = 0°1
2
Fig. 2. Arrival directions in Galactic coordinates for 193 showers with energy E0 = 1018.7–1018.9 eV in the band of declinationsδ = 15°–30° (crosses): arrows 1 and 2 indicate the phases of the first harmonics ϕ1 ≈ 5° and 119° for the samples of events with
E0 = 1018.0–1018.2 and 1018.7–1018.9 eV, respectively; α and δ are the right ascension and declination (equatorial coordinates);N and S are the Earth’s North and South Poles; SG, CSG, and ACSG are the Supergalactic disk, center, and anticenter, respectively;EC is the ecliptic.
360α, deg
120 240
(b)
4
12
0
8
16
360120 240
(a)
43
129
0
86
172N
Fig. 3. Distribution of EASs with energies E0 = 1018.0–
1018.2 (a) and 1018.7–1018.9 (b) eV in right ascension in theband of declinations δ = 15°–30°; the smooth curves rep�resent the first harmonic (4).

60
JOURNAL OF EXPERIMENTAL AND THEORETICAL PHYSICS Vol. 111 No. 1 2010
GLUSHKOV
center that is more transparent to extragalactic CRsthan that covered by the sector α = 195°–345°, whichis accounted for by the denser part of its disk with alongitude lG ≈ 60° (see Fig. 2).
However, a different interpretation related to theecliptic is possible here. Arrow 2 in Fig. 2 points to thepart of the sky where the Sun, planets, and variousbodies of our Solar system execute their annualmotion visible for the Yakutsk array (curve EG inFig. 2). On their way to the Earth, ultrahigh�energyparticles “sound” the ecliptic. It may well be that someof them enter into nuclear reactions with gas and dustwhose concentration is highest in the ecliptic plane. Ifsome new particles that cause anomalous showersrecorded more efficiently by the “master” (trigger)system of the array are produced, then an observableanisotropy is quite possible. This hypothesis is con�firmed to some extent by the lateral distribution func�tions of charged particles shown in Fig. 4. The circlesindicate the mean distribution functions for showerswhose arrival directions lie in the ecliptic plane (within
±5°) and for the remaining showers located outsidethis region. The curves indicate the fits to the experi�mental data by a function of the form [21]
(9)
where r = R/70, Cs is the normalization constant, Ns isthe total number of charged particles at the level ofobservation, gs and bs are the parameters being varied.The former was taken to be gs = 1 [21], while the latterwas found by the least�squares method from all datapoints at a logarithm of the distance from the axislogR ≥ 2.2 equally represented in both samples (theirvalues are given in the table). Both lateral distributionfunctions were obtained for showers whose axes werewithin a central circle 1 km in radius and were foundwith an accuracy of at least 50 m. The mean energyand zenith angle of these samples are ≈ 18.77
and ≈ 0.69.
We see that the distribution function of chargedparticles from the equatorial region of the ecliptic isvery steep. The difference in parameters bs in the tableis 0.42, which is approximately a factor of 10 greaterthan the largest errors of its determination. Accordingto [21], the distribution function (9) for the aboveenergy and zenith angle must be much flatter with bs ≈3.0. Calculations of the EAS development show thatthe distribution function becomes steeper mainlybecause the depth of the maximum in the cascadecurve is shifted to the level of observation. As a result,the total number Ns of charged particles increases. Inour case, this is observed: Ns in the first column of thetable is approximately a factor of 2.3 larger than that inthe second one. The distribution function itself forevents outside the equatorial region of the ecliptic issimilar in shape to that observed in [21].
Subsequently, we investigated the lateral distribu�tion function of charge particles for the sample ofevents referring to peak 1 in Fig. 1. We consideredindividual sky regions in the band of declinations 15°–30° but found no significant differences in EAS devel�opment. Within the experimental error limits, theresults obtained were in agreement with each otherand consistent with the data of [21]. This suggests thatthe anisotropy referring to the above peak is not relatedto the change in primary CR particle composition.
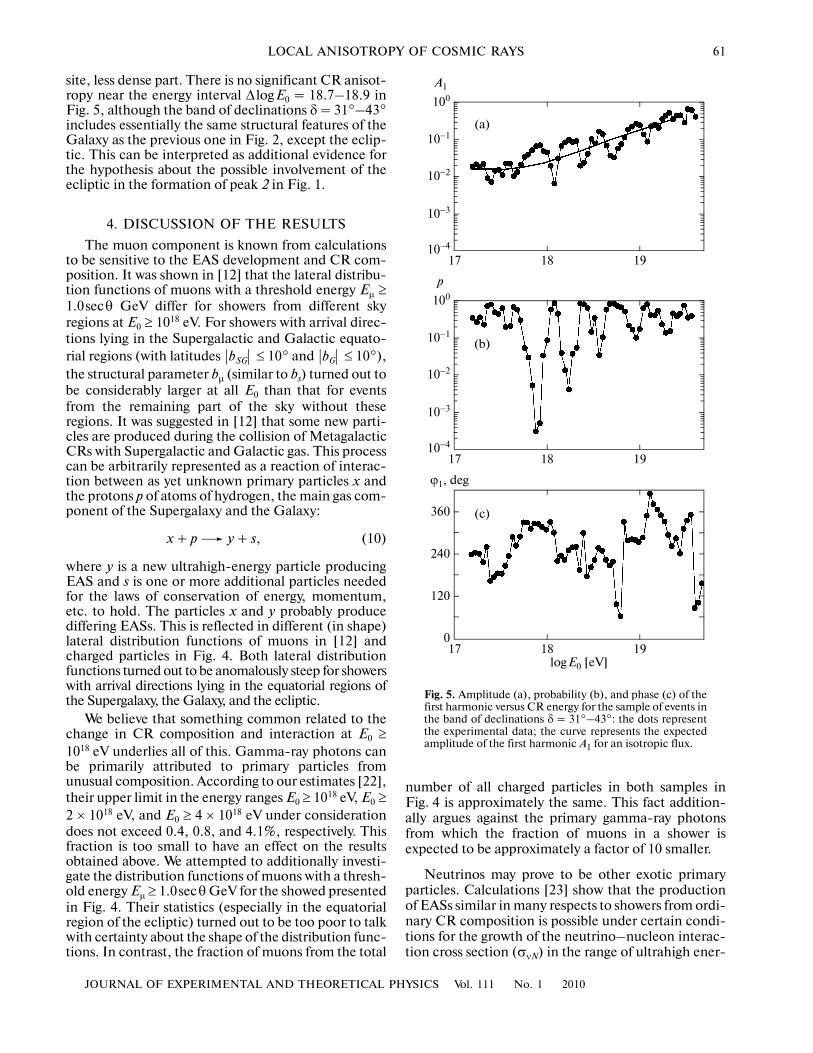
Let us additionally analyze the CR anisotropy inthe band of declinations δ = 31°–34° adjacent to thatconsidered above. Figure 5 shows distributions similarto those in Fig. 1. We see only one significant peak inthe interval logE0 = 17.8–18.0 with a probability of itschance outcome p ≈ 3 × 10⁻⁴. It is located in energynear peak 1 (see Fig. 1) and has a phase ϕ1 = 330° ±15° that is close to ϕ1 = 5° ± 16°, within the error lim�its. We believe that both these phases are attributable tothe same factor discussed above: the relatively strongerabsorption of Metagalactic CRs by the central regionof the Supergalaxy (CSG in Fig. 2) than that by its oppo�
ρs R( ) NsCsr1.3– 1 r+( )
1.3 bs–1 R/2000+( )
gs,=
E0⟨ ⟩log
θcos⟨ ⟩
Fig. 4. Lateral distributions of charges particles in EASswith E0 = 1018.7–1018.9 eV whose arrival directions within±5° lie in the ecliptic plane (filled circles); the open circlesindicate the remaining events; the solid and dashed curvesrepresent the fits based on Eq. (9) with the parameters pre�sented in the table.
Parameters of the best fits based on Eq. (9) for the lateraldistribution function of charged particles presented in Fig. 4
In ecliptic disk Outside ecliptic disk
Number of showers 31 80
gs 1 1
bs 3.35 ± 0.05 2.93 ± 0.04
logρs, 600 0.56 ± 0.01 0.65 ± 0.01
logNs 8.42 ± 0.02 8.06 ± 0.01
R, m102 103
100
102
10−1
101
104
103
ρs, m−2
JOURNAL OF EXPERIMENTAL AND THEORETICAL PHYSICS Vol. 111 No. 1 2010
LOCAL ANISOTROPY OF COSMIC RAYS 61
site, less dense part. There is no significant CR anisot�ropy near the energy interval Δ logE0 = 18.7–18.9 inFig. 5, although the band of declinations δ = 31°–43°includes essentially the same structural features of theGalaxy as the previous one in Fig. 2, except the eclip�tic. This can be interpreted as additional evidence forthe hypothesis about the possible involvement of theecliptic in the formation of peak 2 in Fig. 1.
4. DISCUSSION OF THE RESULTS
The muon component is known from calculationsto be sensitive to the EAS development and CR com�position. It was shown in [12] that the lateral distribu�tion functions of muons with a threshold energy Eμ ≥1.0secθ GeV differ for showers from different skyregions at E0 ≥ 1018 eV. For showers with arrival direc�tions lying in the Supergalactic and Galactic equato�rial regions (with latitudes ≤ 10° and ≤ 10°),the structural parameter bμ (similar to bs) turned out tobe considerably larger at all E0 than that for eventsfrom the remaining part of the sky without theseregions. It was suggested in [12] that some new parti�cles are produced during the collision of MetagalacticCRs with Supergalactic and Galactic gas. This processcan be arbitrarily represented as a reaction of interac�tion between as yet unknown primary particles x andthe protons p of atoms of hydrogen, the main gas com�ponent of the Supergalaxy and the Galaxy:
x + p y + s, (10)
where y is a new ultrahigh�energy particle producingEAS and s is one or more additional particles neededfor the laws of conservation of energy, momentum,etc. to hold. The particles x and y probably producediffering EASs. This is reflected in different (in shape)lateral distribution functions of muons in [12] andcharged particles in Fig. 4. Both lateral distributionfunctions turned out to be anomalously steep for showerswith arrival directions lying in the equatorial regions ofthe Supergalaxy, the Galaxy, and the ecliptic.
We believe that something common related to thechange in CR composition and interaction at E0 ≥1018 eV underlies all of this. Gamma�ray photons canbe primarily attributed to primary particles fromunusual composition. According to our estimates [22],their upper limit in the energy ranges E0 ≥ 1018 eV, E0 ≥2 × 10¹⁸ eV, and E0 ≥ 4 × 10¹⁸ eV under considerationdoes not exceed 0.4, 0.8, and 4.1%, respectively. Thisfraction is too small to have an effect on the resultsobtained above. We attempted to additionally investi�gate the distribution functions of muons with a thresh�old energy Eμ ≥ 1.0secθ GeV for the showed presentedin Fig. 4. Their statistics (especially in the equatorialregion of the ecliptic) turned out to be too poor to talkwith certainty about the shape of the distribution func�tions. In contrast, the fraction of muons from the total
bSG bG
number of all charged particles in both samples inFig. 4 is approximately the same. This fact addition�ally argues against the primary gamma�ray photonsfrom which the fraction of muons in a shower isexpected to be approximately a factor of 10 smaller.
Neutrinos may prove to be other exotic primaryparticles. Calculations [23] show that the productionof EASs similar in many respects to showers from ordi�nary CR composition is possible under certain condi�tions for the growth of the neutrino–nucleon interac�tion cross section (σνN) in the range of ultrahigh ener�
17
ϕ1, deg
logE0 [eV]18 19
(c)
120
360
0
240
17
p
18 19
(b)
10−4
10−2
10−3
10−1
100
17
A1
18 19
(a)
10−4
10−2
10−3
10−1
100
Fig. 5. Amplitude (a), probability (b), and phase (c) of thefirst harmonic versus CR energy for the sample of events inthe band of declinations δ = 31°–43°: the dots representthe experimental data; the curve represents the expectedamplitude of the first harmonic A1 for an isotropic flux.

62
JOURNAL OF EXPERIMENTAL AND THEORETICAL PHYSICS Vol. 111 No. 1 2010
GLUSHKOV
gies. The hypothesis about ultrahigh�energy neutrinosthat interact with relic neutrinos in the Earth’s neigh�borhoods and that lead to “Z�boson” showers is con�sidered in [24, 25]. All of this requires further in�depthdevelopment of the theory before its application to realdata.
Note one curious circumstance. Three characteris�tic segments are known to be clearly distinguished inthe primary CR energy spectrum at E0 ≥ 1017 eV. Thefirst corresponds to a power�law change in the inten�sity of the energy spectrum,
(11)
with an exponent γ1 = 3.02 ± 0.02. The second in theenergy range E0 = (0.7–9.0) × 1018 eV obeys the law(11) with γ2 = 3.27 ± 0.05. Finally, the third reflects theflattest segment of the spectrum with an exponent γ3 =2.62 ± 0.17 (see, e.g., [13]). We see that the peaks inFigs. 1 and 5 near E0 ≈ 1018 eV are located exactlywhere the spectrum rapidly becomes steeper in shape,while peak 1 in Fig. 1 near E0 ≈ 5 × 10¹⁸ eV is locatedwhere the spectrum again becomes very flat. Theremay be some common factor in the origin of ultrahigh�energy CRs behind all of this that has not yet beenstudied thoroughly and comprehensively. The opinionthat ultrahigh�energy CRs consist mostly of chargedparticles, protons and nuclei of various chemical ele�ments, prevails so far. They are strongly mixed by theGalactic magnetic field and have a nearly isotropicdistribution on the celestial sphere. It is hard to detectany anisotropy in these conditions. However, this viewis not indisputable, because as yet there are no directmeasurements of the composition of ultrahigh�energyCRs, while the conclusions from EAS data are stillambiguous and contradictory.
5. CONCLUSIONS
If we sum up the aforesaid, then the following pic�ture emerges. In the band of declinations δ = 15°–30°in Fig. 1 in the energy intervals Δ logE0 = 18.0–18.2and Δ logE0 = 18.7–18.9, we clearly see peaks 1 and 2with probabilities of their chance outcome p ≈ 4 × 10⁻⁴
and p ≈ 6 × 10⁻⁴, respectively. They are attributable toa pronounced CR anisotropy (see Fig. 3) with phasesϕ1 = 5° ± 16° and 119° ± 18°, respectively. In the adja�cent band of declinations 31°–43° in the energy inter�val logE0 = 17.8–18.0, a statistically significant CRanisotropy is also observed. It lies in energy near peak 1(see Fig. 1) and has a phase ϕ1 = 330° ± 15° close toϕ1 = 5° ± 16°, within the error limits. We believe thatboth these phases are attributable to the same factor—the relatively stronger absorption of extragalactic CRsby the central region of the Supergalaxy (CSG in Fig. 2)than that by its opposite, less dense part.
J E0( ) E0γ–,∝
Peak 2 in Fig. 1 with the phase ϕ1 = 119° ± 18°points to the sky region where the part of the eclipticplane is visible for the Yakutsk array (curve EC inFig. 2). On their way to the Earth, ultrahigh�energyparticles “sound” the ecliptic. It may well be that someof them enter into nuclear reactions with gas and dustwhose concentration is highest in the ecliptic plane. Ifsome new particles causing anomalous showersrecorded more efficiently by the master system of thearray are produced, then an observable anisotropy isquite possible. This hypothesis is confirmed to someextent by the lateral distribution functions of chargedparticles (see Fig. 4). These are unlikely to be gamma�ray photons, because, according to our estimates [22],their fraction at E0 ≥ 4 × 10¹⁸ eV does not exceed 4%.Here, there are still many questions that require fur�ther investigation.
REFERENCES
1. J. Szabelsky, J. Wdowczyk, and A. W. Wolfendale,J. Phys. G: Nucl. Phys. 12, 1433 (1986).
2. T. Stanev, P. L. Biermann, J. Lloyd�Evans, J. P. Rachen,and A. A. Watson, Phys. Rev. Lett. 75, 3056 (1995).
3. N. Hayashida, M. Nagano, D. Nishikawa, H. Ohoka,N. Sakaki, M. Sasaki, M. Takeda, M. Teshima,R. Torii, T. Yamamoto, S. Yoshida, K. Honda,N. Kawasumi, I. Tsushima, N. Inoue, E. Kusano,K. Shinozaki, N. Souma, K. Kadota, F. Kakimoto,K. Kamata, S. Kawaguchi, Y. Kawasaki, H. Kitamura,Y. Matsubara, K. Murakami, Y. Uchihori, andH. Yoshii, Astropart. Phys. 10, 303 (1999).
4. A. A. Mikhailov, Pis’ma Zh. Éksp. Teor. Fiz. 72 (4), 233(2000) [JETP Lett. 72 (4), 160 (2000)].
5. A. V. Glushkov, Pis’ma Zh. Éksp. Teor. Fiz. 73 (7), 355(2001) [JETP Lett. 73 (7), 313 (2001)].
6. A. V. Glushkov and M. I. Pravdin, Zh. Éksp. Teor. Fiz.119 (6), 1029 (2001) [JETP 92 (6), 887 (2001)].
7. A. V. Glushkov and M. I. Pravdin, Pis’ma Astron. Zh.28 (5), 341 (2002) [Astron. Lett. 28 (5), 296 (2002)].
8. A. V. Glushkov, Yad. Fiz. 66 (7), 1292 (2003) [Phys. At.Nucl. 66 (7), 1252 (2003)].
9. A. V. Glushkov, Yad. Fiz. 67 (5), 983 (2004) [Phys. At.Nucl. 67 (5), 961 (2004)].
10. A. V. Glushkov and M. I. Pravdin, Zh. Éksp. Teor. Fiz.128 (1), 103 (2005) [JETP 101 (1), 88 (2005)].
11. A. V. Glushkov, Yad. Fiz. 68 (2), 262 (2005) [Phys. At.Nucl. 68 (2), 237 (2005)].
12. A. V. Glushkov and M. I. Pravdin, Zh. Éksp. Teor. Fiz.130 (6), 963 (2006) [JETP 103 (6), 831 (2006)].
13. A. V. Glushkov, Yad. Fiz. 70 (2), 353 (2007) [Phys. At.Nucl. 70 (2), 326 (2007)].
14. A. V. Glushkov and M. I. Pravdin, Pis’ma Zh. Éksp.Teor. Fiz. 87 (7), 406 (2008) [JETP Lett. 87 (7), 345(2008)].
15. A. V. Glushkov, Yad. Fiz. 72 (1), 91 (2009) [Phys. At.Nucl. 72 (1), 85 (2009)].

JOURNAL OF EXPERIMENTAL AND THEORETICAL PHYSICS Vol. 111 No. 1 2010
LOCAL ANISOTROPY OF COSMIC RAYS 63
16. A. V. Glushkov, Zh. Éksp. Teor. Fiz. 136 (5), 893 (2009)[JETP 109 (5), 770 (2009)].
17. A. A. Ivanov, A. D. Krasilnikov, and M. I. Pravdin, inProceedings of the 28th International Cosmic Ray Confer�ence, Tsukuba, Japan, July 31–August 7, 2003, Ed. byT. Kajita, Y. Asaoka, A. Kawachi, Y. Matsubara, andM. Sasaki (Universal Academy Press, Tokyo, Japan2003), Vol. 1, p. 341.
18. The Pierre Auger Collab., arXiv:astro�ph//0711.2256v1.19. J. Linsley, Phys. Rev. Lett. 34, 1530 (1975).20. A. A. Watson, Nucl. Phys. B, Proc. Suppl. 28B, 3
(1992).
21. A. V. Glushkov, M. I. Pravdin, I. E. Sleptsov,V. R. Sleptsova, and N. N. Kalmykov, Yad. Fiz. 63 (8),1557 (2000) [Phys. At. Nucl. 63 (8), 1477 (2000)].
22. A. V. Glushkov, I. T. Makarov, M. I. Pravdin,I. E. Sleptsov, D. S. Gorbunov, G. I. Rubtsov, andS. V. Troitsky, arXiv:0907.0374v1.
23. L. Anchordoqui, H. Goldberg, T. McCauley, T. Paul,S. Reucroft, and J. Swain, arXiv:hep�ph/0011097.
24. D. Fargion, B. Mele, and A. Salis, Astrophys. J. 517,725 (1999).
25. T. J. Weiler, Astropart. Phys. 11, 303 (1999).