Embed Size (px)
Citation preview
Solar Resource Forecasting Webinar, 27th January 2016 1 1
Local and regional PV power forecasting based on
PV measurements, satellite data and numerical weather predictions
Elke Lorenz, Jan Kühnert, Björn Wolff, Annette Hammer, Detlev Heinemann
Energy Meteorology Group, Institute of Physics, University of Oldenburg
1

Solar Resource Forecasting Webinar, 27th January 2016 2
Outline background: grid integration of PV power in Germany
overview on PV power prediction system
evaluation:
different data and models for different forecast horizons
combination of different models
summary and outlook
2

Solar Resource Forecasting Webinar, 27th January 2016
Contribution of photovoltaic (PV) systems to electricity supply in Germany installed PV power (end 2015): 39.5 GWpeak up to 50% of electricity demand from PV
3

Solar Resource Forecasting Webinar, 27th January 2016
Contribution of photovoltaic (PV) systems to electricity supply in Germany installed PV power (end 2015): 39.5 GWpeak up to 50% of electricity demand from PV
strong variability of solar power
3

Solar Resource Forecasting Webinar, 27th January 2016
Grid integration of PV Power: marketing at the European Energy Exchange by Transmission System Operators regional forecasts
direct marketing local forecasts
4
control areas

Solar Resource Forecasting Webinar, 27th January 2016
Grid integration of PV Power: marketing at the European Energy Exchange by Transmission System Operators regional forecasts
direct marketing local forecasts
forecast horizons
4

Solar Resource Forecasting Webinar, 27th January 2016
Grid integration of PV Power: marketing at the European Energy Exchange by Transmission System Operators regional forecasts
direct marketing local forecasts
forecast horizons need for forecast errors high price balancing power
4

Solar Resource Forecasting Webinar, 27th January 2016
Grid integration of PV Power: marketing at the European Energy Exchange by Transmission System Operators regional forecasts
direct marketing local forecasts
forecast horizons need for forecast errors high price balancing power
4
accurate solar power forecasts important for
cost efficient and reliable system integration of solar power
Solar Resource Forecasting Webinar, 27th January 2016
9
PV power measurement
satellite cloud motion forecast CMV
days hours
NWP: numerical weather prediction
forecast horizon
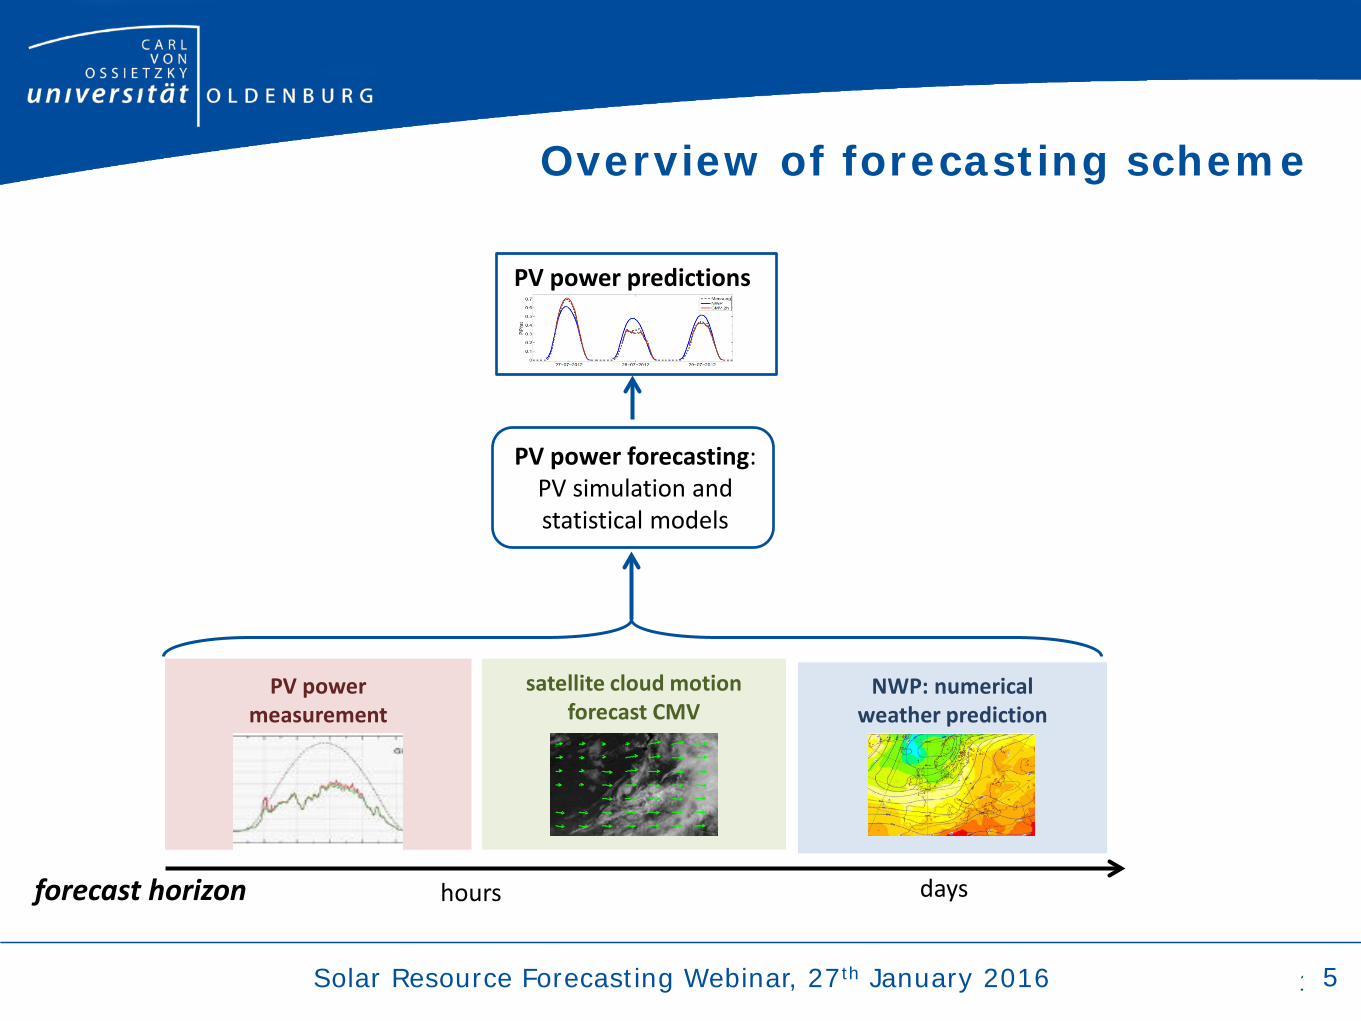
Overview of forecasting scheme
5
Solar Resource Forecasting Webinar, 27th January 2016
10
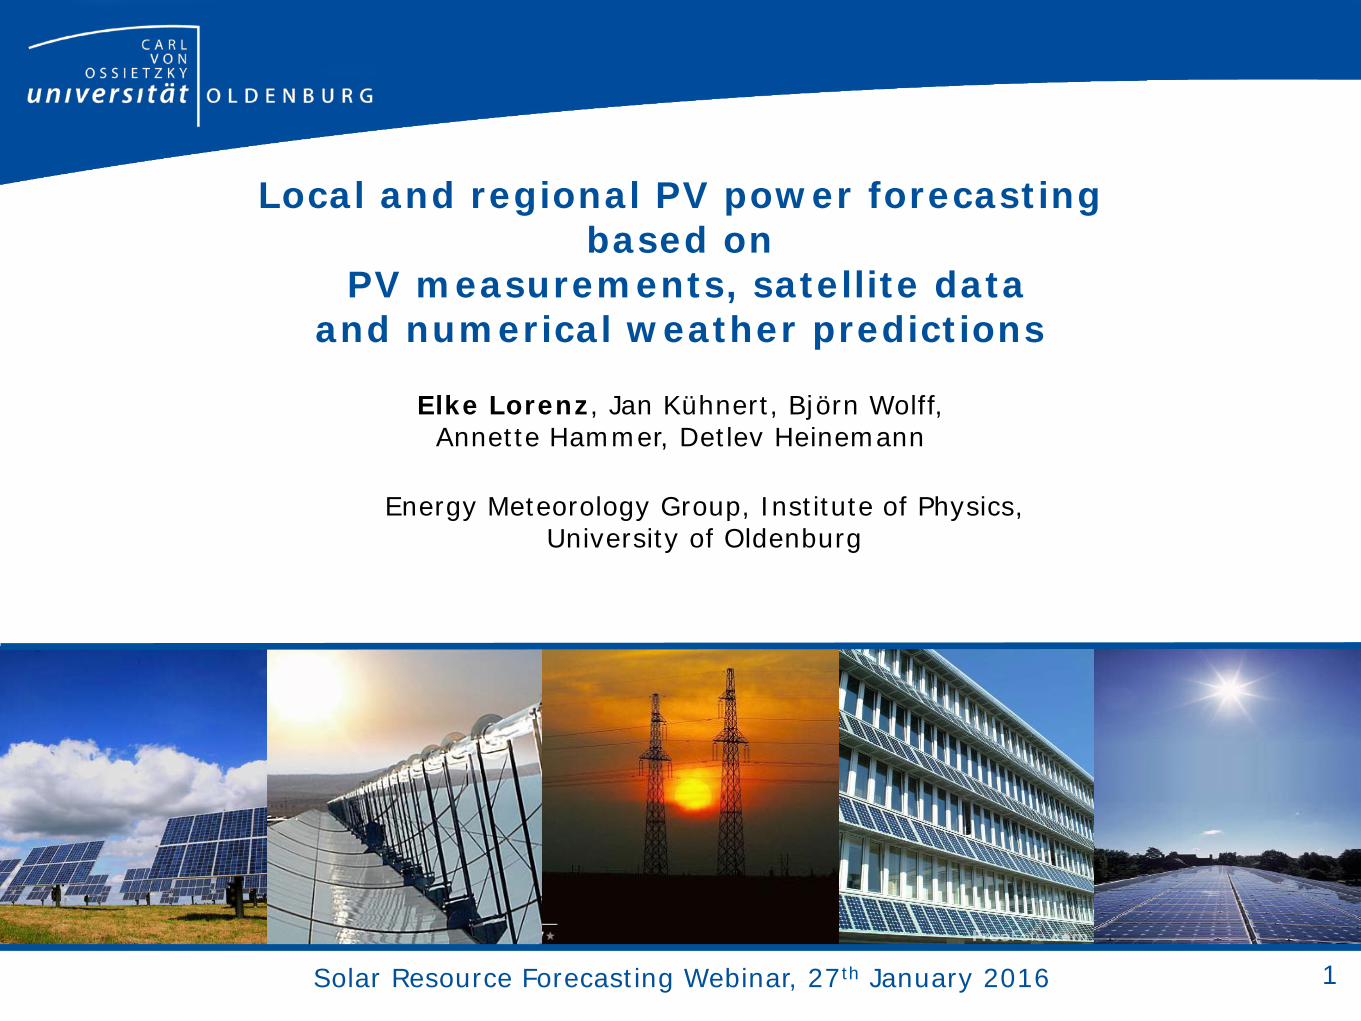
PV power predictions
PV power measurement
satellite cloud motion forecast CMV
days hours
PV power forecasting: PV simulation and statistical models
NWP: numerical weather prediction
forecast horizon
Overview of forecasting scheme
5

Solar Resource Forecasting Webinar, 27th January 2016
Numerical weather predictions global model forecast (IFS) of the European Centre for Medium-Range Weather Forecasts (ECWMF)
regional model forecasts (COSMO EU) of the German Meteorological service (DWD)
COSMO EU, dir. irradiance 2104-05-02, 12:00
6

Solar Resource Forecasting Webinar, 27th January 2016
Numerical weather predictions global model forecast (IFS) of the European Centre for Medium-Range Weather Forecasts (ECWMF)
regional model forecasts (COSMO EU) of the German Meteorological service (DWD)
Post processing: bias correction and combination
with linear regression
COSMO EU, dir. irradiance 2104-05-02, 12:00
6

Solar Resource Forecasting Webinar, 27th January 2016
Meteosat Second Generation (high resolution visible range)
cloud index from Meteosat images with Heliosat method* resolution in Germany 1.2km x 2.2 km 15 minutes
Irradiance prediction based on satellite data
7
*Hammer et al 2003

Solar Resource Forecasting Webinar, 27th January 2016
cloud index from Meteosat images with Heliosat method
cloud motion vectors by identification of matching cloud structures in consecutive images
extrapolation of cloud motion to predict future cloud index
Irradiance prediction based on satellite data
Meteosat Second Generation (high resolution visible range)
7

Solar Resource Forecasting Webinar, 27th January 2016
satellite derived irradiance maps
cloud index from Meteosat images with Heliosat method
cloud motion vectors by identification of matching cloud structures in consecutive images
extrapolation of cloud motion to predict future cloud index
irradiance from predicted cloud index images with Heliosat method
Irradiance prediction based on satellite data
7

Solar Resource Forecasting Webinar, 27th January 2016
Measurement data March- November 2013
15 minute values
921 PV systems1) in Germany
information on PV system tilt and orientation
16
1)Monitoring data base of Meteocontrol GmbH
8

Solar Resource Forecasting Webinar, 27th January 2016
17
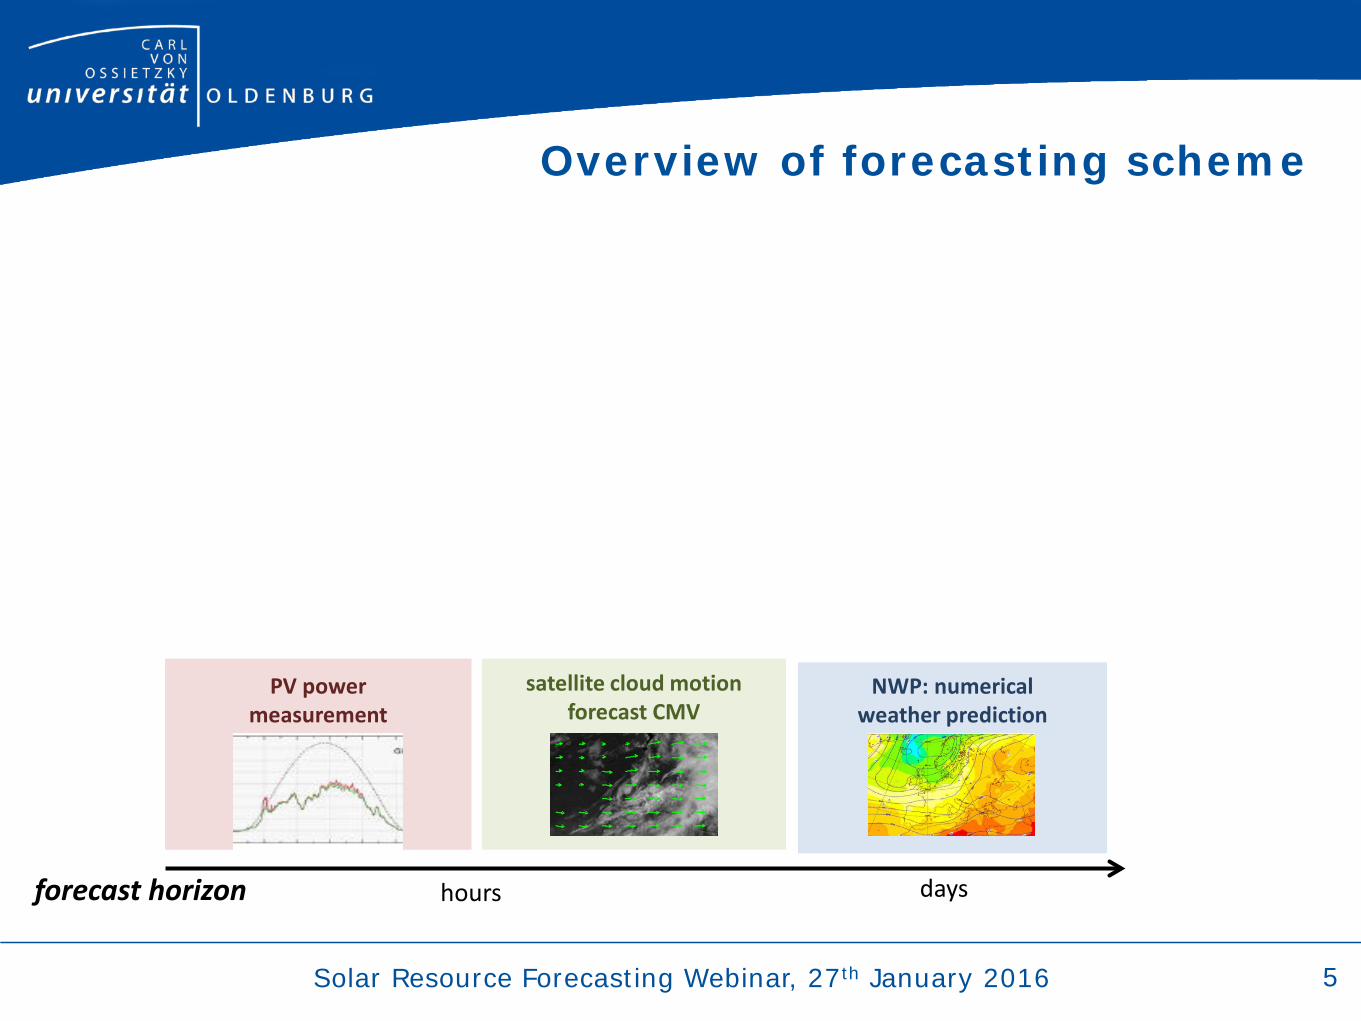
PV power predictions
PV power measurement
satellite cloud motion forecast CMV
days hours
PV power forecasting: PV simulation and statistical models
NWP: numerical weather prediction
forecast horizon
Overview of forecasting scheme
9

Solar Resource Forecasting Webinar, 27th January 2016
18
PV power predictions
PV power measurement
satellite cloud motion forecast CMV
days hours
NWP: numerical weather prediction
forecast horizon
Overview of forecasting scheme
9
Pmeas(t-∆t)
Pclear(t-∆t)
persistence: constant ratio of measured PV power Pmeas to clear sky PV power Pclear Ppers (t)= Pclear(t)

Solar Resource Forecasting Webinar, 27th January 2016
Different input data and models
19
PV power predictions
PV power measurement
satellite cloud motion forecast CMV
days hours
NWP: numerical weather prediction
forecast horizon
persistence
9
PV simulation:
global horizontal irradiance
irradiance on plane of array: tilt conversion model
PV Power output: parametric model for MPP efficiency
post processing: linear regression

Solar Resource Forecasting Webinar, 27th January 2016
PV power predictions
PV power measurement
satellite cloud motion forecast CMV
days hours
PV simulation
NWP: numerical weather prediction
forecast horizon
Different input data and models
PV simulation
persistence
9

Solar Resource Forecasting Webinar, 27th January 2016
PV power predictions
PV power measurement
satellite cloud motion forecast CMV
days hours
PV simulation
NWP: numerical weather prediction
forecast horizon
Different input data and models
PV simulation
persistence
9
Evaluation: here forecast horizons 15 min to 5 hours ahead

Solar Resource Forecasting Webinar, 27th January 2016
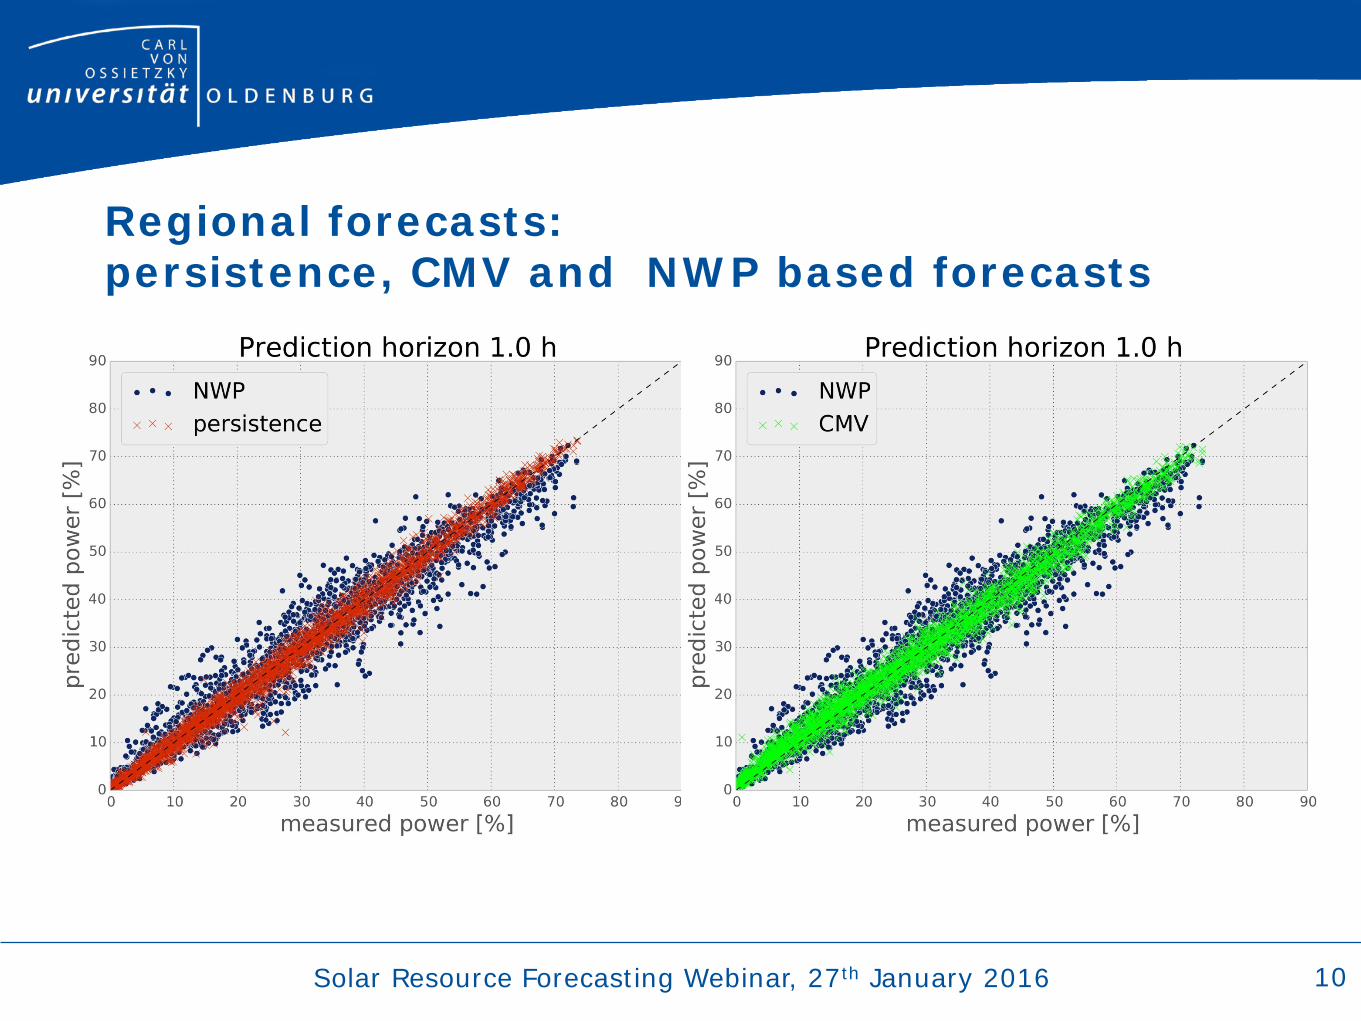
Regional forecasts: persistence, CMV and NWP based forecasts
10
Solar Resource Forecasting Webinar, 27th January 2016 10
Regional forecasts: persistence, CMV and NWP based forecasts

Solar Resource Forecasting Webinar, 27th January 2016 10
Regional forecasts: persistence, CMV and NWP based forecasts

Solar Resource Forecasting Webinar, 27th January 2016 10
Regional forecasts: persistence, CMV and NWP based forecasts

Solar Resource Forecasting Webinar, 27th January 2016 10
Regional forecasts: persistence, CMV and NWP based forecasts

Solar Resource Forecasting Webinar, 27th January 2016
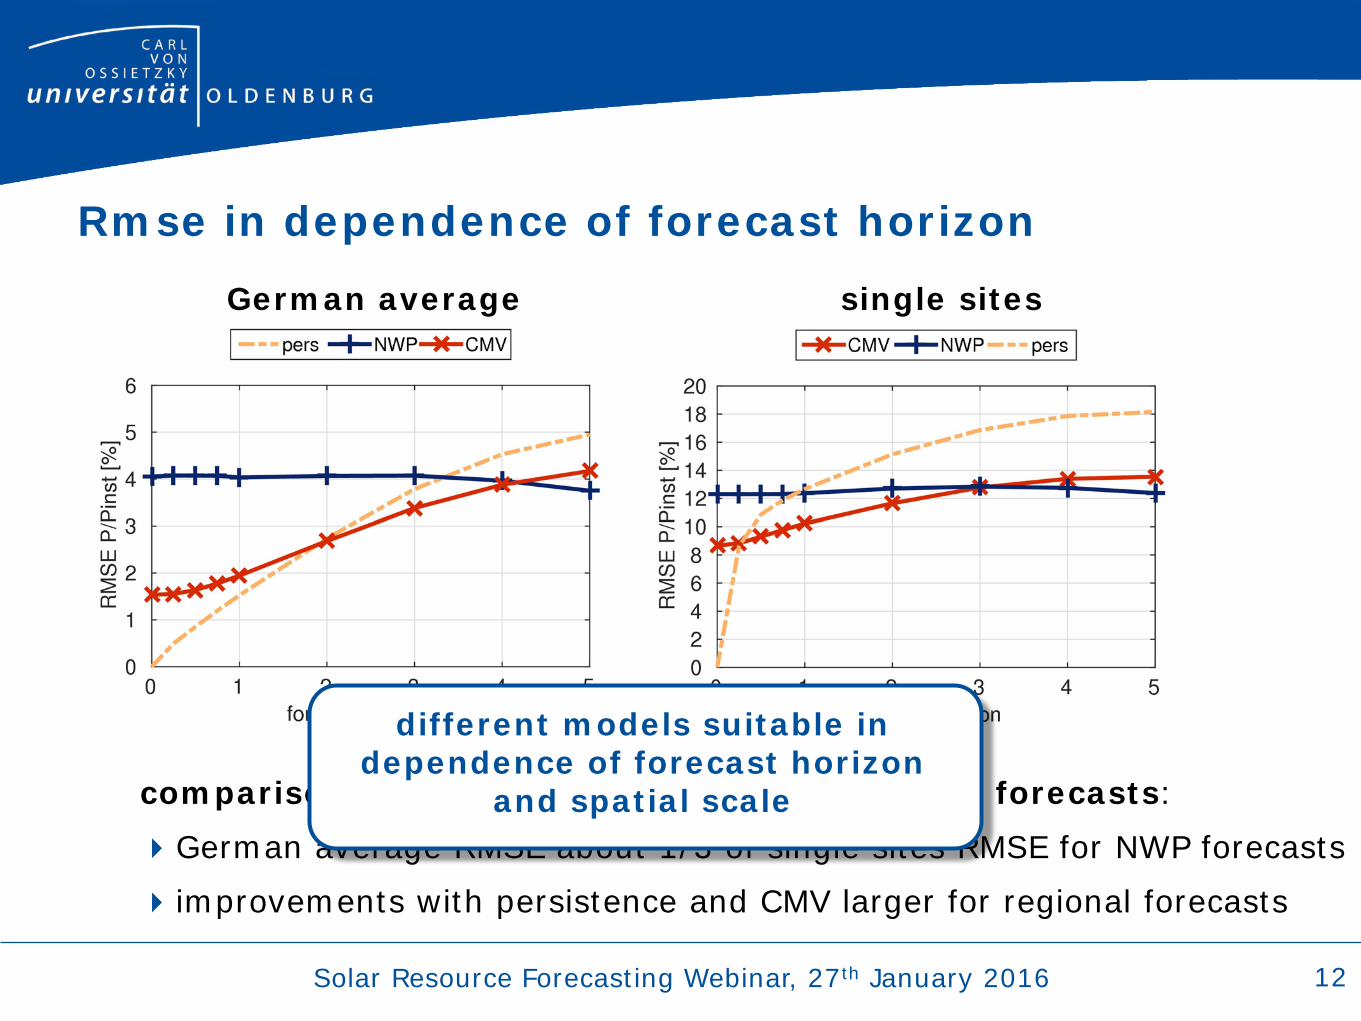
Rmse in dependence of forecast horizon
15 minute values
normalization to installed power Pinst only daylight values, calculation time of CMV: sunel > 10° only hours with all models available included in dependence of forecast horizon
∑=
−=
N
iinst
pred
inst
meas
PP
PP
Nrmse
1
21
11
German average

Solar Resource Forecasting Webinar, 27th January 2016
Rmse in dependence of forecast horizon
CMV forecasts better than NWP based forecast up to 4 hours ahead
11
∑=
−=
N
iinst
pred
inst
meas
PP
PP
Nrmse
1
21
15 minute values normalization to installed power Pinst only daylight values, calculation time of CMV: sunel > 10° only hours with all models available included in dependence of forecast horizon
German average

Solar Resource Forecasting Webinar, 27th January 2016
Rmse in dependence of forecast horizon
CMV forecasts better than NWP based forecast up to 4 hours ahead
persistence better than CMV forecasts up to 1.5 hour ahead
11
∑=
−=
N
iinst
pred
inst
meas
PP
PP
Nrmse
1
21
15 minute values normalization to installed power Pinst only daylight values, calculation time of CMV: sunel > 10° only hours with all models available included in dependence of forecast horizon
German average

Solar Resource Forecasting Webinar, 27th January 2016
Rmse in dependence of forecast horizon
12
comparison of German average and single site forecasts:
German average RMSE about 1/3 of single site RMSE for NWP forecasts
German average single sites

Solar Resource Forecasting Webinar, 27th January 2016
Rmse in dependence of forecast horizon
12
comparison of German average and single site forecasts:
German average RMSE about 1/3 of single site RMSE for NWP forecasts
German average single sites

Solar Resource Forecasting Webinar, 27th January 2016
Rmse in dependence of forecast horizon
12
comparison of German average and single site forecasts:
German average RMSE about 1/3 of single site RMSE for NWP forecasts
German average single sites

Solar Resource Forecasting Webinar, 27th January 2016
Rmse in dependence of forecast horizon
12
comparison of German average and single site forecasts:
German average RMSE about 1/3 of single sites RMSE for NWP forecasts
improvements with persistence and CMV larger for regional forecasts
German average single sites
Solar Resource Forecasting Webinar, 27th January 2016
comparison of German average and single site forecasts:
German average RMSE about 1/3 of single sites RMSE for NWP forecasts
improvements with persistence and CMV larger for regional forecasts
Rmse in dependence of forecast horizon
12
German average single sites
different models suitable in dependence of forecast horizon
and spatial scale

Solar Resource Forecasting Webinar, 27th January 2016
35
PV power predictions
PV power measurement
satellite cloud motion forecast CMV
days hours
PV simulation*
NWP: numerical weather prediction
forecast horizon
Different input data and models
PV simulation*
persistence
13
*)PV simulation with bias correction

Solar Resource Forecasting Webinar, 27th January 2016
36
PV power predictions
PV power measurement
satellite cloud motion forecast CMV
days hours
PV simulation
NWP: numerical weather prediction
forecast horizon
Combination of different models
PV simulation
persistence
combination
13

Solar Resource Forecasting Webinar, 27th January 2016
14
Combination of forecasting methods combination of forecast models with linear regression:
Pcombi=aNWPPNWP + aCMVPCMV + apersistPpersist + a0
coefficients aNWP, aCMV, apersist, a0 are fitted to measured data
in dependence of
forecast horizon
hour of the day
training data:
daily update with measurements of last 30 days
for single site forecasts: each PV system separately
for regional forecasts: average of sites

Solar Resource Forecasting Webinar, 27th January 2016
Regional forecasts regression coefficients in dependence of forecast horizon
15
bars: standard deviation for all hours
regression coefficients (weights) reflect horizon dependent forecast performance of different models

Solar Resource Forecasting Webinar, 27th January 2016
Regional forecasts Rmse in dependence of forecast horizons
15
Considerable improvement with combined model over single model forecasts

Solar Resource Forecasting Webinar, 27th January 2016
Regression coefficients
16
bars: standard deviation for all hours & sites
horizon dependent regression coefficients different for regional and single site forecasts
German average single sites

Solar Resource Forecasting Webinar, 27th January 2016
Rmse in dependence of forecast horizon
forecast combination outperforms single model forecasts for all horizons improvements with combination larger for regional forecasts
17
German average single sites

Solar Resource Forecasting Webinar, 27th January 2016
Rmse in dependence of forecast horizon
forecast combination outperforms single model forecasts for all horizons improvements with combination larger for regional forecasts
17
German average single sites
considerable improvement by combining different models
with statistical learning

Solar Resource Forecasting Webinar, 27th January 2016
44
Summary PV power prediction contributes to successful grid integration of more than 39 GWpeak PV power in Germany
18

Solar Resource Forecasting Webinar, 27th January 2016
45
Summary PV power prediction contributes to successful grid integration of more than 39 GWpeak PV power in Germany
PV power forecasts based on satellite data (CMV) significantly better than NWP based forecasts up to 4 hours ahead
18

Solar Resource Forecasting Webinar, 27th January 2016
46
Summary PV power prediction contributes to successful grid integration of more than 39 GWpeak PV power in Germany
PV power forecasts based on satellite data (CMV) significantly better than NWP based forecasts up to 4 hours ahead
significant improvement by combining different forecast models with PV power measurements, in particular for regional forecasts
18

Solar Resource Forecasting Webinar, 27th January 2016
Thank you for your attention!
EU-FP7 grant agreement no: 308991
19