Embed Size (px)
Citation preview
Lobe-based Estimating Ventilation and Perfusion from 3D CT scans of the Lungs
Travis McPhail
Joe Warren Rice University
Thomas Guerrero, M.D.
M.D. Anderson Cancer Center
Introduction Lung cancer is a deadly disease that kills on the order of 175,000 Americans per year [Henschke 2002]. Standard treatment for lung cancer includes surgical removal or radiation therapy. 3D imaging technologies such CT, MRI and SPECT have significantly improved the treatment for lung cancer by allowing the physician to plan treatment strategies based on the location of the cancer with respect to the 3D structure of the patient’s lungs. Two critical pieces of knowledge essential for improved treatment of lung tumors are the ventilation (air flow) and perfusion (blood flow) in the patient’s lungs. Given the flow of air and blood through the patient’s lung during the breath cycle, the treating physician can plan treatment that spares areas of the lungs with high air/blood flow and, thus, preserve as much of the patient’s lung function as possible. The current state of the art technology for assessing the ventilation in a patient’s lungs is a technique known as SPECT (single photon emission computed tomography) [National Research Council 1996]. Using SPECT, the patient breathes a mildly radioactive tracer gas and a gamma camera collects a set of 2D images that record the flow of the gas through the patient’s lung. This set of 2D images is then used to reconstruct a 3D image of airflow using standard tomographic techniques. There are two primary difficulties with the use of SPECT to estimate lung function. First, the resolution of SPECT images is low; voxels in the resulting images have a resolution on the order of 1 centimeter. Second, the creation of the radioactive tracer gas involves unreliable, expensive hardware. (One of the most popular commercial gas generators has just been recalled [cite].) Instead of using SPECT, we propose an alternative approach to computing ventilation and perfusion using a newer imaging technique known as 4D CT. In 4D CT, the scanner computes a sequence of 4D CT scans of the patient’s lungs during the breath cycle.

Current 4D CT scanners are capable of computing approximately 10 3D scans, each with millimeter resolution, during a 3 second breath cycle. In this paper, we consider the possibility of computing ventilation and perfusion from this sequence of 3D images by tracking the deformation that the lungs undergo during the breath cycle. Observe that if this computation is feasible, using 4D CT to compute ventilation and perfusion avoids the two major drawbacks of SPECT; 4D CT has millimeter resolution as opposed to the centimeter resolution for SPECT and CT imaging does not require the use of a tracer gas.
Basic Approach Given a 4D CT scan of the patient’s lungs, our approach to estimating ventilation and perfusion for use in the planning of treatment for lung cancer has three parts:
• Construct a lobed-based surface model of the patient’s lungs for each 3D CT image during the breath cycle.
• Compute feature points in the 3D CT images and track their motion during the breath cycle.
• Compute a time-varying 3D deformation of the lungs based on the tracked position of these feature points
• Estimate ventilation and perfusion from this deformation. Some preliminary comments on each of these steps are in order. In the first step, we construct a lobe-based model for two reasons. First, ventilation and perfusion are usually estimated on a lobe-by-lobe basis for treatment planning. Second, having the lobe boundaries available makes generation of feature points on the lobe boundaries easy in the second step. The second and third steps focus on constructing the time-varying 3D deformation that the lungs undergo during the breath cycle. We take a point-based approach to determining this deformation for several reasons. First, tracking corresponding feature points in successive CT images reduces to a local image matching problem that can be solved using simple technique such as cross-correlation. Second, the quality of this automated point tracking can be assessed by the imaging technician using simple visualization techniques and the resulting correspondence manually adjusted if deemed not sufficiently accurate. Finally, there are several point-based deformations such thin-plate splines [Coselmon 2004] and moving least squares [Warren 2006] that are simple to implement, fast to evaluate and that yield reasonable classes of deformation that interpolate point data. Ultimately, the fourth step is the crux of this paper. Our goal in this paper is to show that computing both perfusion and ventilation from time-varying CT images of the lungs is feasible. In particular, we will show how to estimate both the volume change (air flow) and mass change (blood flow) in given lung volume from the time-varying 3D
deformation computed in step three. Surprisingly, the derivation of these quantities follows from first principles based on the physics of CT imaging and the mathematics of deformations. The focus on step four of the process explains some of our choices in steps 1 and 2. To accurately estimate ventilation and perfusion, we need a time-varying 3D deformation that captures the behavior of the lungs during the breath cycle. Thus, steps 1 and 2 include a large component of human interaction to assure that high-quality deformation are used in step 4. In the future, we envision further research on fully automating steps 1 and 2 once the efficacy of estimating ventilation and perfusion from 4D CT has been fully established. Related work The problem of constructing lobe-based models has been investigated in previous work [Zhang 2000]. However, in that framework, the lobe surfaces were extracted manually from a single high-resolution CT image. In our problem, we are limited to only medium-resolution CT images due to the technical limitations of 4D CT scanning. There has also been extensive work on registration of 3D images like those produced by CT scanning . (For example, see [Toga 2001] for an introduction.) These methods fall into three general categories:
• Volume-based methods that attempt to warp an entire 3D input image onto an output 3D image. Most of these methods such as optical flow [Berthold 1981] attempt to setup and solve large-scale systems of equation.
• Surface-based methods that attempt to warp a set of input surfaces onto a set of output surfaces. Most of these methods impose a penalty function on the surfaces for bending and attempt to solve some variant of the iterated closest point problem.
• Point-based methods that attempt to warp an input point set onto an output point set. Most of these method use some variant of a point-based interpolation method such thin-plate splines [Coselmon 2004] or moving least squares [Warren 2006] to compute an interpolating deformation.
One of the authors (Guerrero) has developed a method based on optical flow for computing a 3D deformation between pairs of 3D CT images of the lungs [Guerrero 2007]. Unfortunately, the deformations produced by optical flow tend to contain unrealistic high-frequency components due to the fact that optical flow attempts to locally preserve mass under the deformation. (In reality, the local mass in the CT images is not preserved due to local compression or expansion.) In this paper, we consider smoother classes of point-based deformation that we believe more realistically model the true deformations taking place during the breath cycle. These point-based deformation methods are also simpler to implement and compute. Finally, the idea of estimating ventilation and perfusion from 3D deformations has also been considered in [Guerrero 2006]. In that paper, Guerrero and others developed an ad-

hoc model for estimating ventilation and perfusion from a 3D deformation between pairs of 3D CT images of lungs. In this paper, we also present a more robust model for estimating ventilation and perfusion motivated by basic math and physics.
Construction of the lobe-based lung model We next consider each of the steps in our four step process in more detail. The first step is to construct a model of the lobe boundaries from a single medium-resolution (approximately 1 mm3) 3D CT of the lungs. Our method consists of four simpler steps
• Extract the outer boundaries of the lungs using a simple combination of thresholding and majority filtering of 3D images
• Process 3D lung images to enhance the interior lobe boundaries. • Extract the 2D cross-sections of the lobe boundaries from this enhanced image via
a semi-automatic method based on dynamic programming. To illustrate these steps, figure 1 shows a typical horizontal 2D cross-section of a 3D CT image of a patient’s lungs being processed.
(a) (b) (c)
(d) (e) (f)
Figure 1: Original 2D cross section (a). Contour of low and high density voxels (b). Outer boundary after max filter pass (c). Lungs with enhanced lobes (d). Traced paths between user points (e). Lobes overlaid on cross section (f).
Outer lung boundary construction We begin by computing a rough approximation to the outer boundary of the lungs by thresholding the raw CT data into a binary image consisting of low-density voxels (black) and high-density voxels (white). Figure 1b shows the 2D contour that separates these two sets of voxels on our typical cross-section.

While this contour does include two large connected volumes of low-density voxels corresponding to the lungs, the contour includes numerous extra components due to the presence of high-density voxels that model pulmonary arteries and other higher-density anatomical structures interior to the lungs. To smooth these two volumes and eliminate interior white voxels, we apply several rounds of majority filtering. Each round of majority filtering recolors a voxel based on the majority color of the 3x3x3 block of voxels surrounding it. This filtering erodes noisy features on the outer boundaries of the lungs and eliminates small features from the interior of the lung volumes. The curve in figure 1c is a 2D cross-section of this smoothed volume. Interior lobe boundary enhancement As is apparent in figure 1a, the interior boundaries of the lobes are faint edges that are barely visible, even to the expert eye, in 2D CT cross-section. To aid in the accurate reconstruction of these lobe boundaries, we first enhance these images to emphasize the interior lobe boundaries. To this end, we filter the 3D image based on locally fitting a quadratic function to the image. At a particular voxel, we fit (in a least squares sense) a quadratic function of the form
222 222),,( gzfyzeydxzcxybxazyxq ++++++= to the 5x5x5 neighborhood of intensity values centered at this voxel. (For sake of simplicity, we assume that the voxel in question is at the origin.) Next, we construct the 3x3 matrix corresponding to the pure quadratic portion of q(x,y,z),
⎟⎟⎟
⎠
⎞
⎜⎜⎜
⎝
⎛
gfdfecdcb
.
Finally, we compute the dominant eigenvalue of this matrix. If the dominant eigenvalue is negative, the fitting quadratic has a primarily decreasing parabolic shape. Near a lobe boundary, the peak of this parabola aligns with the lobe boundary with parabola decreasing towards the low-intensity regions adjacent to the lobe boundary. Our classification method consists of determining if the dominant eigenvalue is negative and testing whether the voxel intensity lies in the range (0.05, 0.08) typical of voxels on the lobe boundary. (Here, the voxel image intensities are normalized to be in the range from 0 to 1.) Figure 1d shows the effect of applying our filter to a typical cross-section of a 3D CT image. Interior lobe boundary construction The final task for this step is to construct the actual lobe boundaries from the enhanced images. To this end, we propose a semi-automatic method for constructing the interior boundaries on a cross-section by cross-section basis. Given the outer lobe boundaries for a horizontal cross-section, the user place places two points on the outer boundary of the
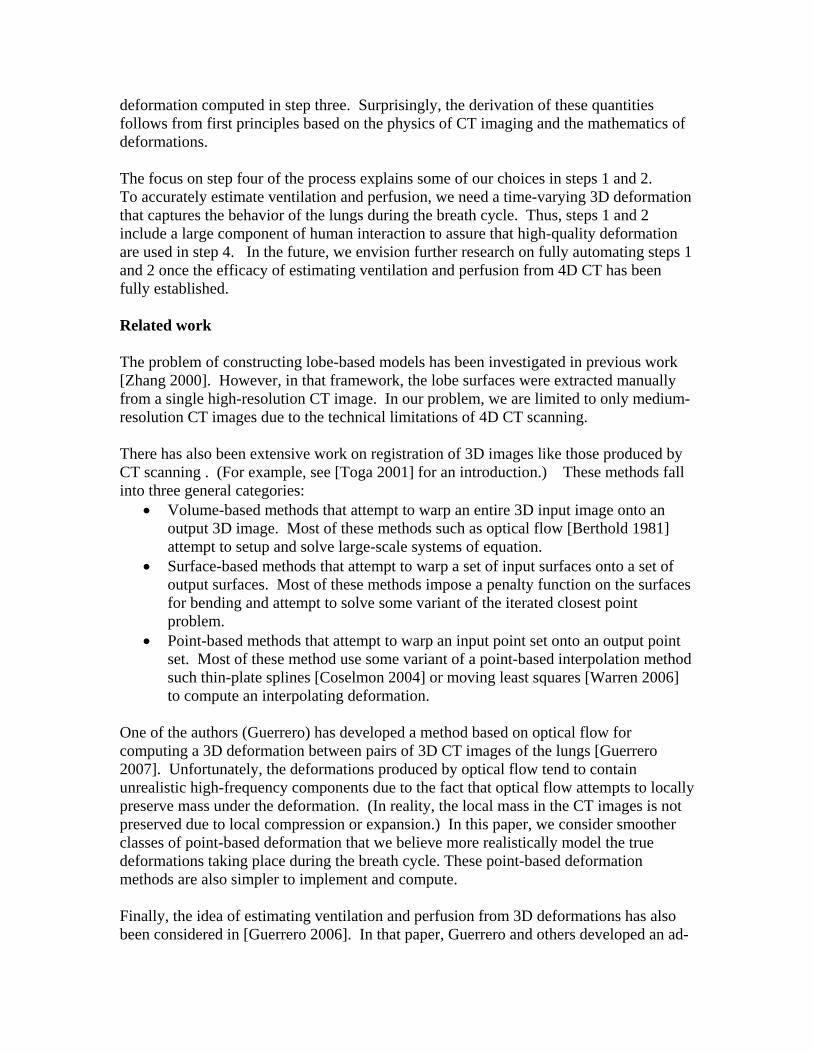
lungs and the system automatically traces a path between these two points by following potential lobe pixels in the enhanced image. This path following process can be easily automated by using a standard shortest path algorithm such as Dijkstra’s algorithm [Cormen 2001]. In the case where three lobes meet at a point (such as in figure 1e), the user may create each of the three interior boundary curves meeting at this point separately. Given these interior boundary curves, we then combine the interior and exterior boundary curves to form closed curves bounding each separate lobe in the cross-section. These regions are then automatically labeled as corresponding to a particular lobe based their rough anatomical position. To compute a complete lobe-based model of the lungs, the user cycles through the various horizontal cross-sections comprising the lungs. Since there are hundreds of such cross-sections, we allow the user to inherit the interior lobe geometry (and topology) from one processed section onto an adjacent cross-section. Typically, the user makes some minimal adjustment of the endpoints of the interior boundary curves that requires on the order of 5-10 seconds of attention. The result of this process is that an experienced user can assemble an accurate lobe-based model of the lungs in a timeframe on the order of 15-20 minutes. Given this sequence of curve networks for horizontal cross-sections, we may optionally assemble this sequence of curve networks into a surface network that partitions the lungs into lobes [cite]. Figure 2 shows such a lobe-based surface model. Due to our need to visualize the interior of the lungs later, we typically render the outer lung shape using only the curve model.
(a) (b) (c)
Figure 2: Lobe-based surface model (a). Subset of right lobes (b) and (c).
As side note, one might wonder whether using more sophisticated 3D deformable model technology would have allowed us to avoid the need to manually construct the interior lobe boundaries. In our experience, the anatomical variation in lobe geometry between various patients’ lungs (especially diseased lungs) makes constructing an accurate 3D atlas suitable for applying traditional 3D deformable modeling techniques to this problem difficult.
Construction of a 3D deformation between successive CT scans
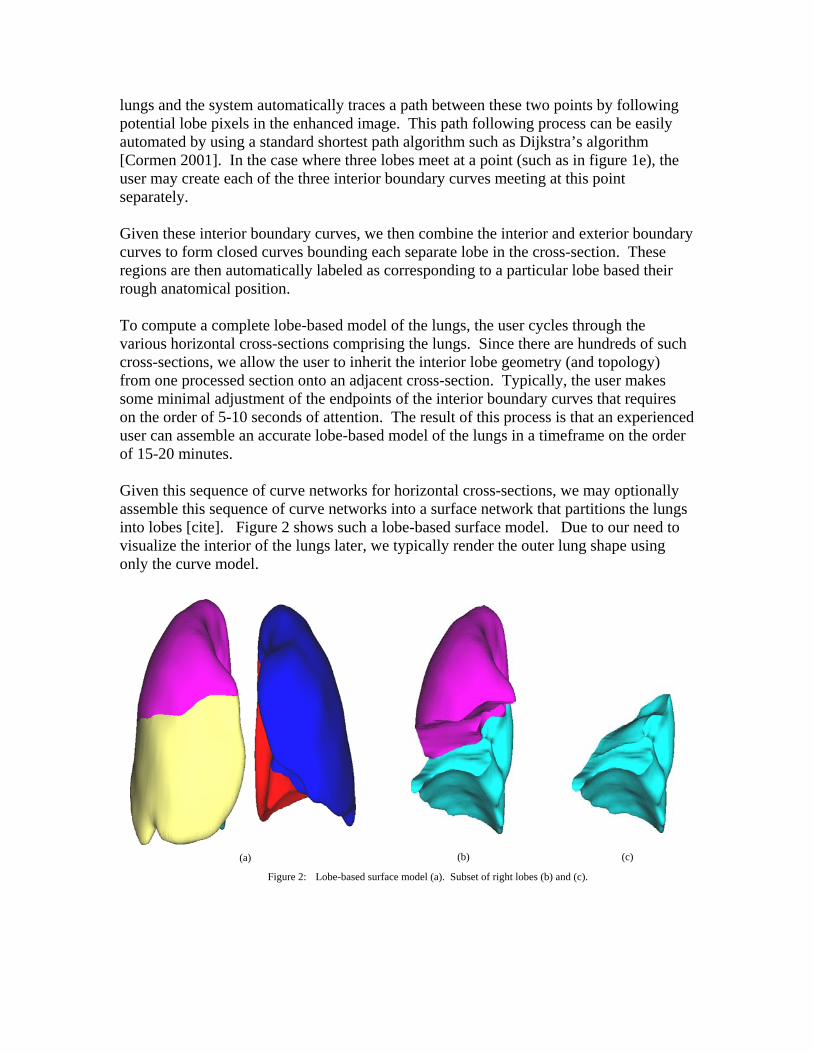
Given time-varying sequence of 3D CT scans, section will focus on computing 3D deformation between consecutive pairs. For simplicity, consider an inhale image I(p) and an exhale image E(p). The goal is determine a “reasonable” deformation f(x) such that the difference between the deformed inhale image I(p) and the exhale image E(f(p)) is minimized. Figure 3 shows an example of a typical pair of inhale and exhale images. Note the material surrounding the lungs have been stripped away and the interior of the lungs visualized as a semi-translucent material using a technique known as volume visualization [Westermann 1998]. In this view, the structure of the pulmonary arties and bronchial tubes is readily apparent.
Figure 3: Inhale/exhale lung pair. Inhale on the left colored in red and exhale on the right colored in blue
As noted in the introduction, there are a wide range of methods for computing 3D deformations between pairs of 3D images. For example, software toolkits such as ITK [Kitware 1999] are often suggested for use on such a problem. In the author’s experience, these methods suffer from two critical deficiencies. First, the deformations

provided by such a toolkit are often too limited to capture the desired deformation. For example, the deformations are restricted to be global polynomials in Air. Second, these methods include numerous free parameters that must be tuned to the particular In one attempt by the authors to apply the ITK toolkit to the problem of warping mouse brains [Warren 2005], the authors literally spent weeks searching for a combination of these free parameters that produced even plausible results.
Since the focus of this paper is to demonstrate that 3D deformations can be used to estimate ventilation and perfusion, we instead focused on a simple, point-based method for computing 3D deformations. Constructing such a deformation consists of three steps:
• Selection of a set of “feature” points pi on the inhale image I.
• Determination of a set of corresponding points q on the exhale image E. i
• Computation of a 3D deformation f(x) satisfying the f(p )=q . i i
Again, we will describe each of these steps in more details.
Given a point p, let BBp be a 3D box centered at the point p. In our application, a feature point in the inhale image is a point p in the lung volume where the image I(Bp) has a high likelihood of having a unique corresponding point q in the exhale image E such that I(Bp) and E(Bq) are similar. Our approach to compute such feature points is to compute a set of candidate feature points and then allow the user to cull these points as desired.
Our automatic method is simple. Starting for the thresholded input image used in the previous step, we used a variant of majority filtering to determine feature points. For each high-density (white) voxel, we consider a 5x5x5 neighborhood centered at the voxel. If less than 20% of the neighbors are white, the voxel is discarded as being noise. If more than 45% of the neighbors are white, the voxel is discarded as being average. We classify the remaining voxels as being possible feature points. To avoid producing too many such points, we cull feature points so that no two candidates are within some user-defined tolerance.
Figure 4: Curve model for lungs with correspondence points(inhale in red and exhale in blue).
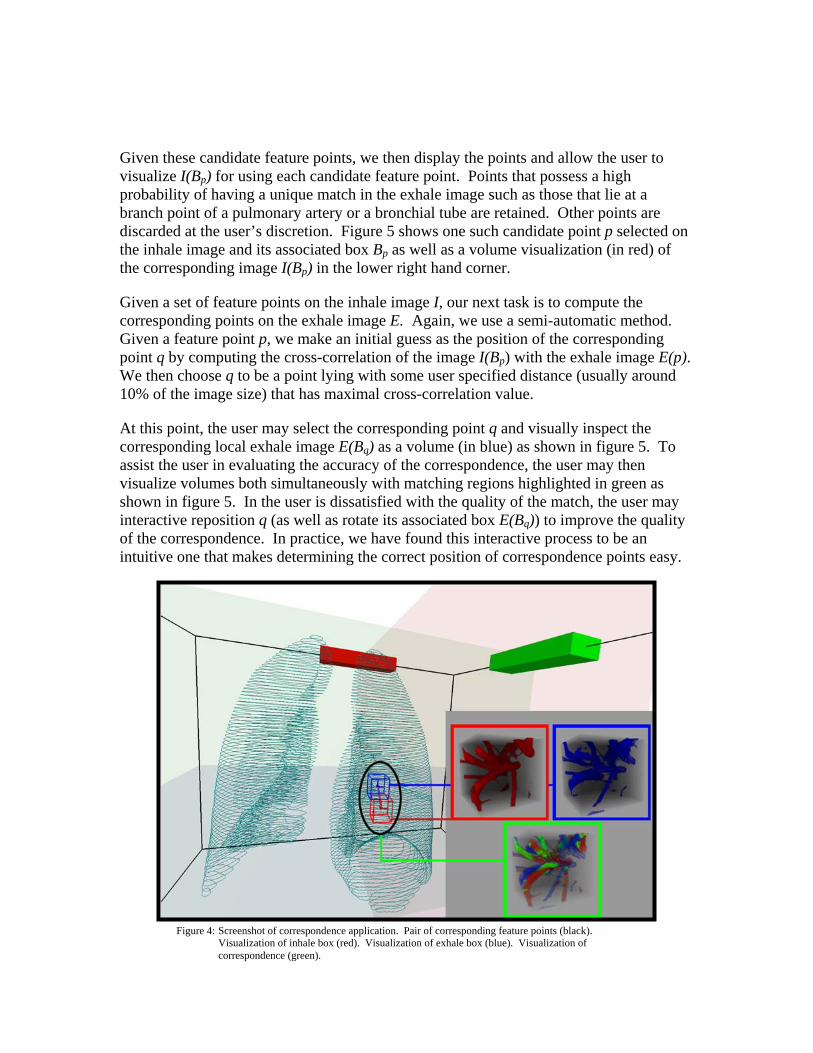
Given these candidate feature points, we then display the points and allow the user to visualize I(Bp) for using each candidate feature point. Points that possess a high probability of having a unique match in the exhale image such as those that lie at a branch point of a pulmonary artery or a bronchial tube are retained. Other points are discarded at the user’s discretion. Figure 5 shows one such candidate point p selected on the inhale image and its associated box BBp as well as a volume visualization (in red) of the corresponding image I(B ) in the lower right hand corner. p
Given a set of feature points on the inhale image I, our next task is to compute the corresponding points on the exhale image E. Again, we use a semi-automatic method. Given a feature point p, we make an initial guess as the position of the corresponding point q by computing the cross-correlation of the image I(Bp) with the exhale image E(p). We then choose q to be a point lying with some user specified distance (usually around 10% of the image size) that has maximal cross-correlation value.
At this point, the user may select the corresponding point q and visually inspect the corresponding local exhale image E(Bq) as a volume (in blue) as shown in figure 5. To assist the user in evaluating the accuracy of the correspondence, the user may then visualize volumes both simultaneously with matching regions highlighted in green as shown in figure 5. In the user is dissatisfied with the quality of the match, the user may interactive reposition q (as well as rotate its associated box E(BBq)) to improve the quality of the correspondence. In practice, we have found this interactive process to be an intuitive one that makes determining the correct position of correspondence points easy.
Figure 4: Screenshot of correspondence application. Pair of corresponding feature points (black). Visualization of inhale box (red). Visualization of exhale box (blue). Visualization of correspondence (green).
Given the set of feature points p on the inhale image and the corresponding points qi i on the exhale image, our last task to construct a 3D deformation f(x) that interpolates the pairs on points; i.e; f(p )=qi i. To construct such a deformation, we have a number of methods at our disposal such as thin-plate splines. In the interest of simplicity, we choose to a deformation method based on least squares that is simple to implement and very fast to evaluate. This method, known as Moving Least Squares [Warren 2006], constructs the desired f(x) as the solution a weighted least squares problem.
To compute f(x) at an arbitrary point v, we first solve for a linear function lv(x) that minimizes the expression
2|)(| iivi i qplw −∑ . Where the weights w are of the form i
2||1
vpw
ii −
= .
Note that the weights w depend on the position of v and, thus, the linear function li v(x) also depends on the position of the pi. Now, the desired deformation is simply f(v)=lv(v). Observe that as v approaches p , the corresponding weight wi i approaches infinity and, thus, the function f interpolates, (i.e; f(p )=q ). i i MLS has a number of advantages that makes it well suited for construction deformations. MLS produces smooth global deformations in which the effect of a single point correspondence on the resulting deformation is localized to the pair of points in question. If the correspondence points qi are simply a global affine transformation (such a translation or rotation) of the feature points, MLS exactly reproduces this affine transformation. Finally, MLS deformations can be computed extremely quickly by performing only a minimal amount of pre-computation [Warren 2006]. This pre-computation allows for interactive visualization of the resulting deformations as the positions of the correspondence points are manipulated.
To visually assess the resulting deformation, we compute a dense grid of points gi on the inhale image I and sampled the exhale image E at the positions of the points on this grid after deformation; i.e; compute E(f(gi)). We then compare the two resulting volumes on a cross-section by cross-section basis. Figure 8 shows a cross-section of the raw inhale image and the deformed exhale image. High-density regions in the inhale image are colored red; high-density regions in the deformed exhale are colored blue; matching high-intensity regions are colored green. (Accurate deformation should result in mainly green images.)
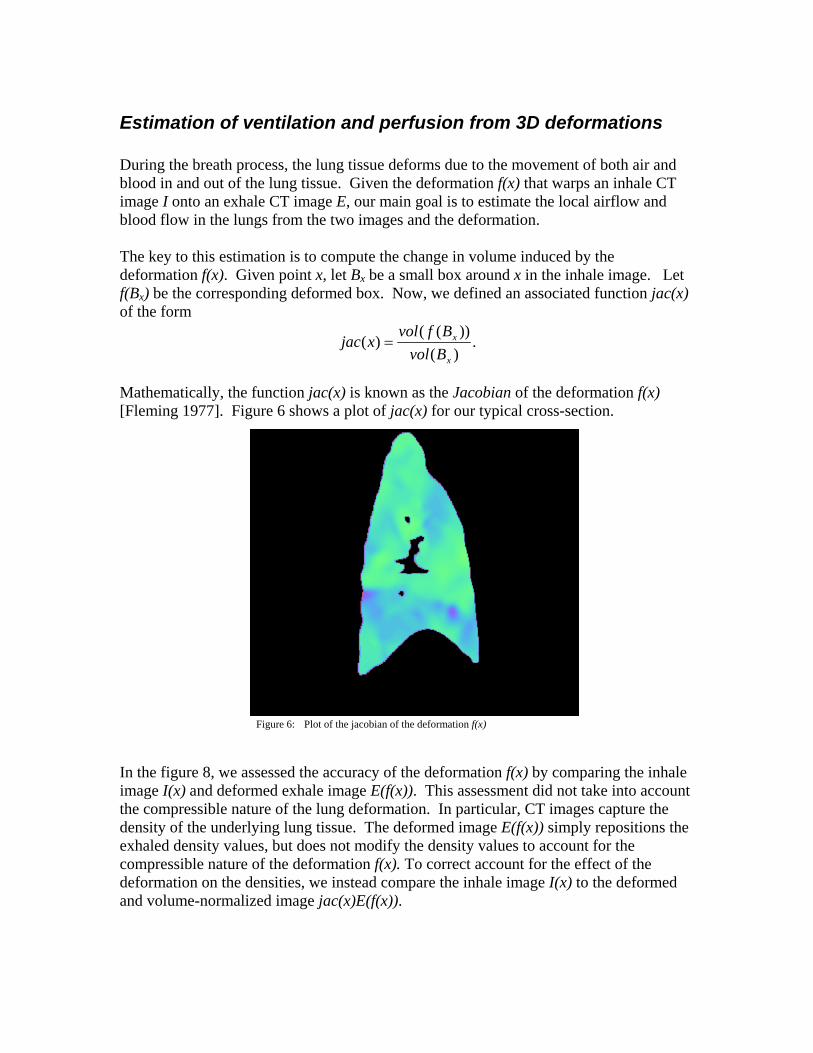
Estimation of ventilation and perfusion from 3D deformations During the breath process, the lung tissue deforms due to the movement of both air and blood in and out of the lung tissue. Given the deformation f(x) that warps an inhale CT image I onto an exhale CT image E, our main goal is to estimate the local airflow and blood flow in the lungs from the two images and the deformation. The key to this estimation is to compute the change in volume induced by the deformation f(x). Given point x, let BBx be a small box around x in the inhale image. Let f(BxB ) be the corresponding deformed box. Now, we defined an associated function jac(x) of the form
.)())((
)(x
x
BvolBfvol
xjac =
Mathematically, the function jac(x) is known as the Jacobian of the deformation f(x) [Fleming 1977]. Figure 6 shows a plot of jac(x) for our typical cross-section.
Figure 6: Plot of the jacobian of the deformation f(x)
In the figure 8, we assessed the accuracy of the deformation f(x) by comparing the inhale image I(x) and deformed exhale image E(f(x)). This assessment did not take into account the compressible nature of the lung deformation. In particular, CT images capture the density of the underlying lung tissue. The deformed image E(f(x)) simply repositions the exhaled density values, but does not modify the density values to account for the compressible nature of the deformation f(x). To correct account for the effect of the deformation on the densities, we instead compare the inhale image I(x) to the deformed and volume-normalized image jac(x)E(f(x)).
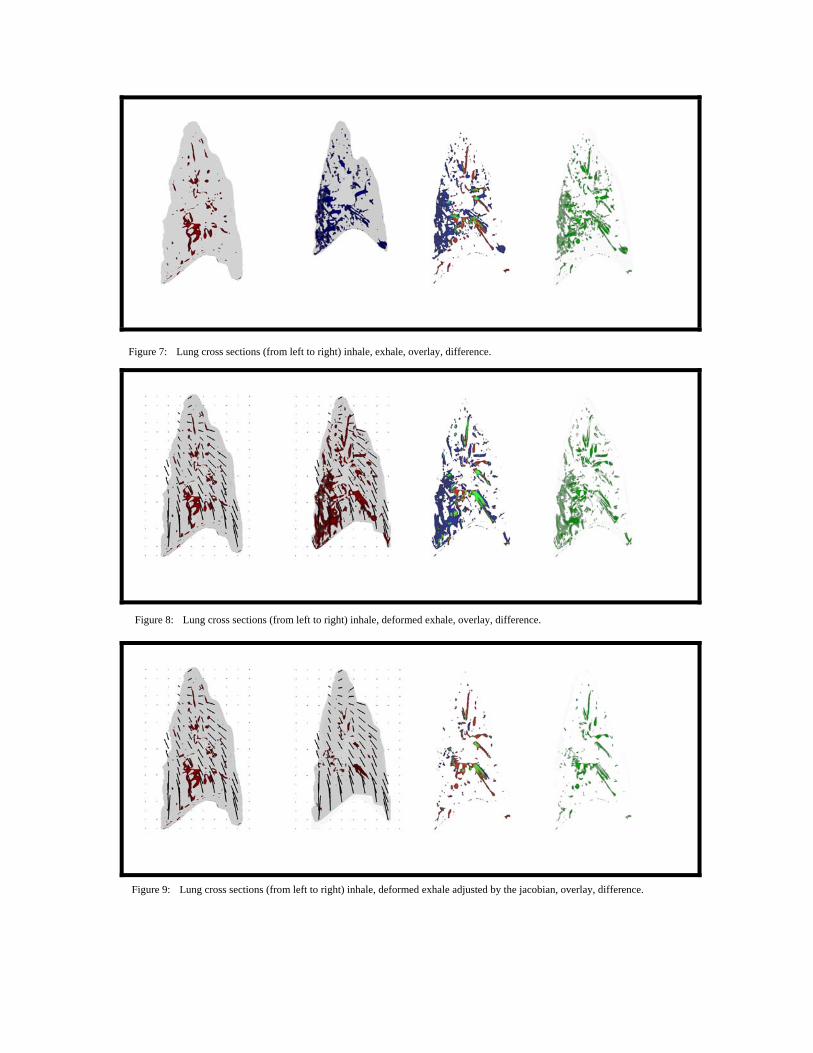
Figure 7: Lung cross sections (from left to right) inhale, exhale, overlay, difference.
Figure 8: Lung cross sections (from left to right) inhale, deformed exhale, overlay, difference.
Figure 9: Lung cross sections (from left to right) inhale, deformed exhale adjusted by the jacobian, overlay, difference.
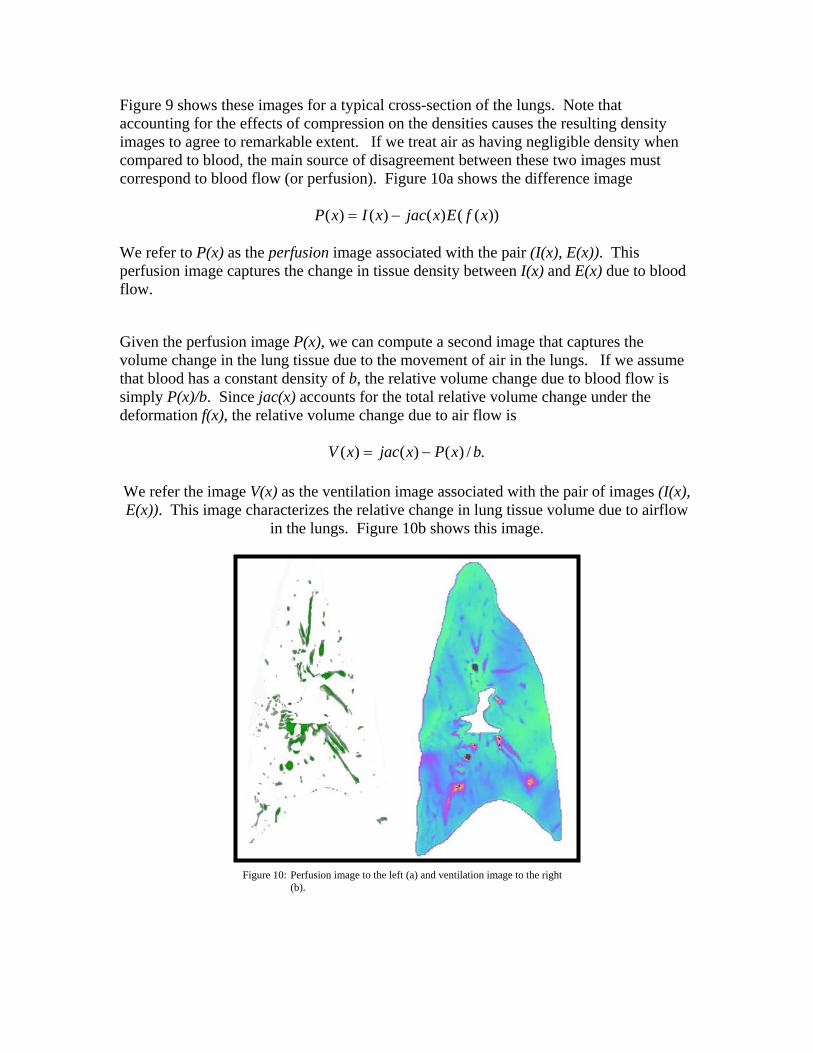
Figure 9 shows these images for a typical cross-section of the lungs. Note that accounting for the effects of compression on the densities causes the resulting density images to agree to remarkable extent. If we treat air as having negligible density when compared to blood, the main source of disagreement between these two images must correspond to blood flow (or perfusion). Figure 10a shows the difference image
))(()()()( xfExjacxIxP −=
We refer to P(x) as the perfusion image associated with the pair (I(x), E(x)). This perfusion image captures the change in tissue density between I(x) and E(x) due to blood flow.
Given the perfusion image P(x), we can compute a second image that captures the volume change in the lung tissue due to the movement of air in the lungs. If we assume that blood has a constant density of b, the relative volume change due to blood flow is simply P(x)/b. Since jac(x) accounts for the total relative volume change under the deformation f(x), the relative volume change due to air flow is
./)()()( bxPxjacxV −=
We refer the image V(x) as the ventilation image associated with the pair of images (I(x), E(x)). This image characterizes the relative change in lung tissue volume due to airflow
in the lungs. Figure 10b shows this image.
Figure 10: Perfusion image to the left (a) and ventilation image to the right (b).

Bibliography TAO, J., WARREN J., EICHELE G., THALLER, C., CHIU, W., CARSON, J. “A
Geometry Database for Gene Expression Data.” Eurographics Symposium on Geometry Processing, (2003): 166-176.
JU, T., WARREN J. “Gene Atlas.” Baylor College of Medicine, Rice University,
University of Houston. 2005 http://geneatlas.org SCHAEFER, S., MCPHAIL, T., WARREN. “Image Deformation Using Moving Least
Squares.” ACM SIGGRAPH Computer Graphics. (2006): 533-540. CASTILLO, E. ZHANG, Y., TAPIA, R., GUERRERO, T. “Compressible image
registration for thoracic computed tomography images.”, 2007. GUERRERO, T., SANDERS, K., CASTILLO, E., ZHANG, Y., BIDAUT, L., PAN, T.,
KOMAKI, R. “Dynamic ventilation imaging from four-dimensional computed tomography.” Physics in Medicine & Biology. 51.4 (2006): 777-791.
INSTITUTE OF MEDICINE BOARD ON BIOBEHAVIORAL SCIENCES AND
MENTAL DISORDERS, NATIONAL RESEARCH COUNCIL (U.S.). “Mathematics and Physics of Emerging Biomedical Imaging.” Single Photon Emission Computed Tomography. National Academies Press, 1996, 89-102.
BOOKSTEIN, F.L. “Principal warps: thin-plate splines and the decomposition of
deformations.” IEEE Transactions on Pattern Analysis and Machine Intelligence 11.6 (1989): 567-585.
COSELMON, M., BALTER, JAMES, MCSHAN, D., KESSLER, M. “Mutual
information based CT registration of the lung at exhale and inhale breathing states using thin-plate splines.” American Association of Physicists in Medicine. 2004.
FLEMING, W. “Functions of Several Variables.” New York: Springer-Verlag, 1977. TOGA A., THOMPSON, P. “The role of image registration in brain mapping.” Image
and Vision Computing 19.1 (2001): 3-24. ZHANG, L., REINHARDT, J. “3D pulmonary CT image registration with a standard
lung atlas.” Medical Imaging 2000: Physiology and Function from Multidimensional Images, (2000): 67-77.
WESTERMANN, R., ERTL, T. “Efficiently Using Graphics Hardware in Volume
Rendering Applications.” ACM SIGGRAPH Computer Graphics. 32.4 (1998): 169-179.

BERTHOLD, K., SCHUNCK, B. “Determining Optical Flow.” Artificial Intelligence.
(1981): 185-203. KITWARE INC. “National Library of Medicine Insight Segmentation and Registration
Toolkit.” University North Carolina Chapel Hill. 1999 < http://www.itk.org> HENSCHKE, C., MCCARTHY, P., WERNICK, S. “Lung Cancer: Myths, Facts, Choices
– and Hope” W. W. Norton & Company, Inc. New York, 2002.


![Ventilation Perfusion Relationships Auto Saved]](https://img.dokumen.tips/doc/110x75/577d34911a28ab3a6b8e5543/ventilation-perfusion-relationships-auto-saved.jpg)