Embed Size (px)
Citation preview
Loanable Funds and Financial Markets
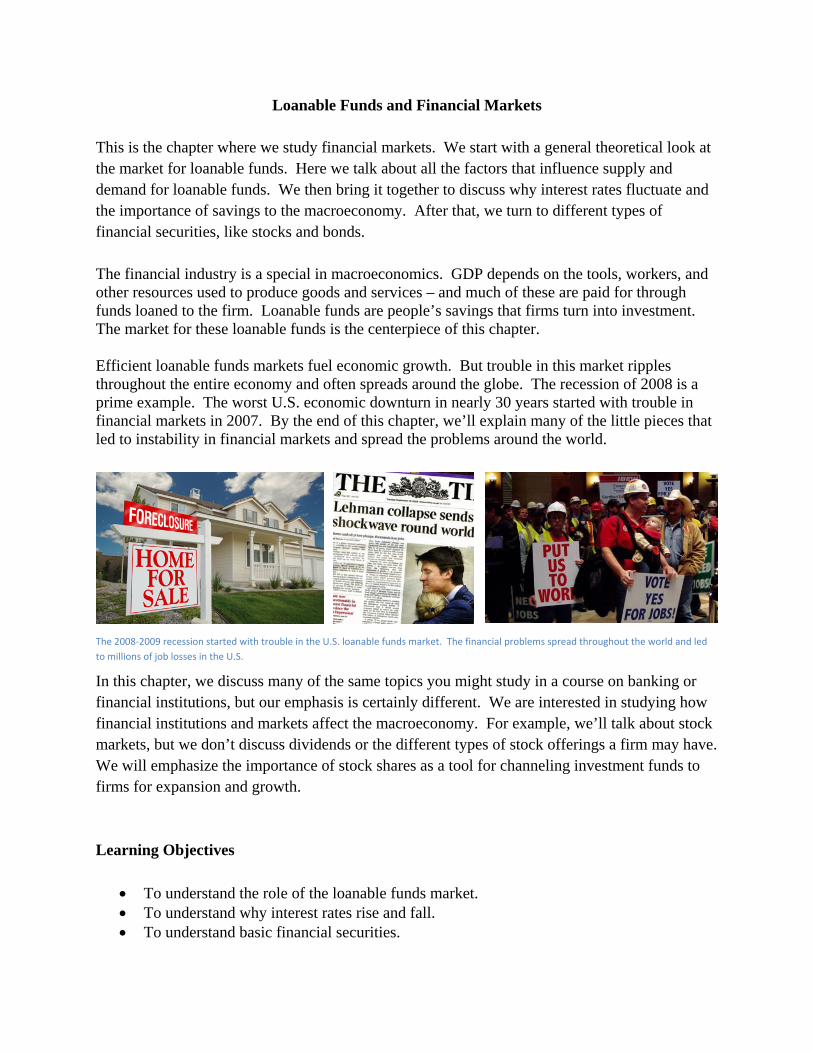
This is the chapter where we study financial markets. We start with a general theoretical look at the market for loanable funds. Here we talk about all the factors that influence supply and demand for loanable funds. We then bring it together to discuss why interest rates fluctuate and the importance of savings to the macroeconomy. After that, we turn to different types of financial securities, like stocks and bonds. The financial industry is a special in macroeconomics. GDP depends on the tools, workers, and other resources used to produce goods and services – and much of these are paid for through funds loaned to the firm. Loanable funds are people’s savings that firms turn into investment. The market for these loanable funds is the centerpiece of this chapter. Efficient loanable funds markets fuel economic growth. But trouble in this market ripples throughout the entire economy and often spreads around the globe. The recession of 2008 is a prime example. The worst U.S. economic downturn in nearly 30 years started with trouble in financial markets in 2007. By the end of this chapter, we’ll explain many of the little pieces that led to instability in financial markets and spread the problems around the world.
In this chapter, we discuss many of the same topics you might study in a course on banking or financial institutions, but our emphasis is certainly different. We are interested in studying how financial institutions and markets affect the macroeconomy. For example, we’ll talk about stock markets, but we don’t discuss dividends or the different types of stock offerings a firm may have. We will emphasize the importance of stock shares as a tool for channeling investment funds to firms for expansion and growth. Learning Objectives
To understand the role of the loanable funds market. To understand why interest rates rise and fall. To understand basic financial securities.
The 2008‐2009 recession started with trouble in the U.S. loanable funds market. The financial problems spread throughout the world and led
to millions of job losses in the U.S.

To understand the role of secondary security markets.
[A] The Loanable Funds Market The center of financial markets is what economists call the loanable funds market. This is where borrowers from all over the economy come to get funds and savers come to lend. It is not a single physical location, but includes places like stock exchanges, investment banks, mutual fund firms and the commercial banks where we all have accounts. Figure 23.1 illustrates the role of the loanable funds market. Savings flows in and this is translated into loans for borrowers. We could call it the market for savings, or even the market for loans. The term “loanable funds” captures the information in both: peoples’ savings are funds available for loans to borrowers, or loanable funds. On the left side, the suppliers of funds (savers) include households, and foreign entities. These foreign entities include both the private citizens and governments that decide to save in the United States. For most of our applications, it helps us to focus on households (private individuals/families) as the primary suppliers of loanable funds. If you have a checking or savings account at a bank, you are a supplier of loanable funds. Household savings in retirement accounts, stocks, bonds, and mutual funds are other big sources of loanable funds. Going forward, with few exceptions, we’ll focus on households as the suppliers of loanable funds.
The demanders of loanable funds include business firms, and governments. We’ll cover government borrowing in Chapters 29 and 30. For now, we focus on firms as the primary borrowers of loanable funds.
Figure 23.1 The Loanable Funds Market is the Center of all Saving and Borrowing
Savers Households
Foreign Entities
BorrowersFirms
Governments
Loanable
Funds
Market
Banks
Bonds
Stocks
$$$ $$$
Savings Loans
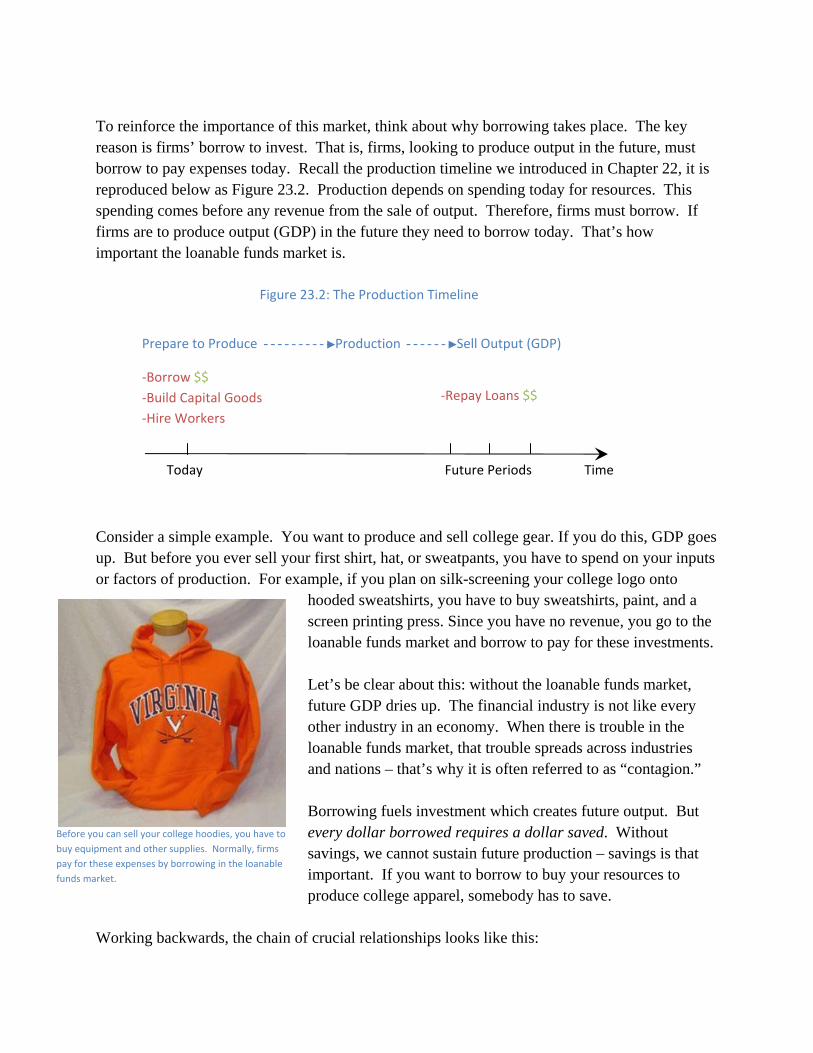
To reinforce the importance of this market, think about why borrowing takes place. The key reason is firms’ borrow to invest. That is, firms, looking to produce output in the future, must borrow to pay expenses today. Recall the production timeline we introduced in Chapter 22, it is reproduced below as Figure 23.2. Production depends on spending today for resources. This spending comes before any revenue from the sale of output. Therefore, firms must borrow. If firms are to produce output (GDP) in the future they need to borrow today. That’s how important the loanable funds market is.
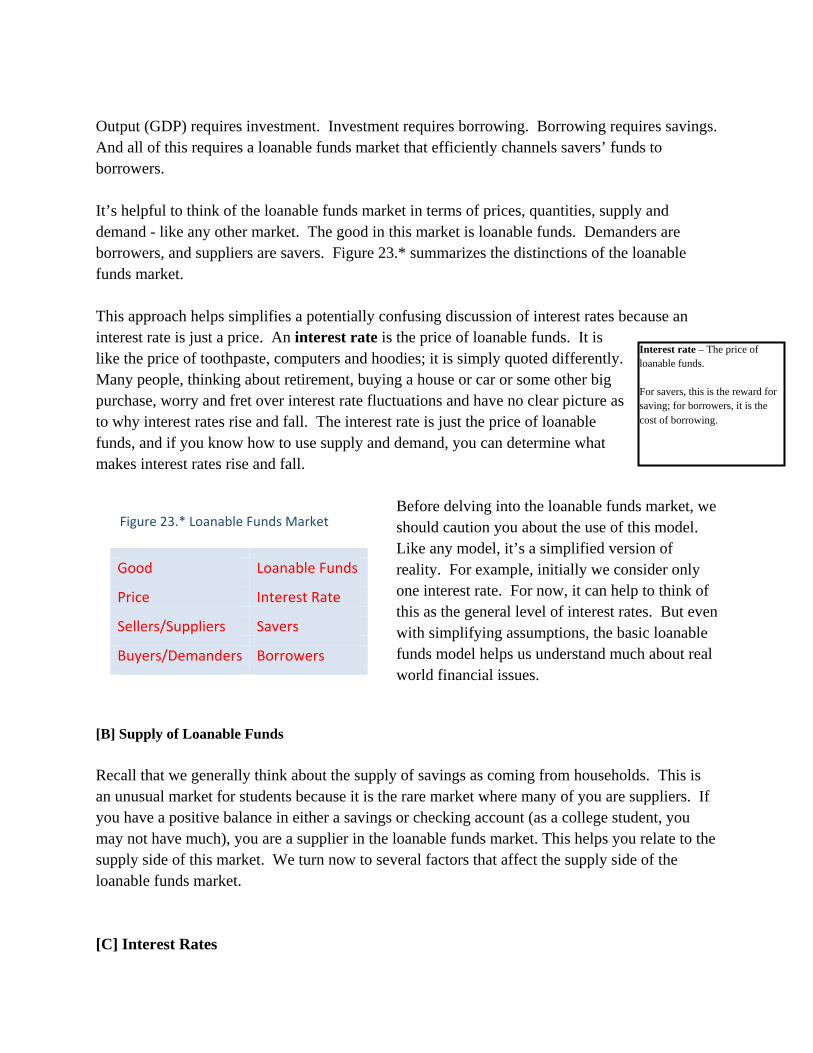
Consider a simple example. You want to produce and sell college gear. If you do this, GDP goes up. But before you ever sell your first shirt, hat, or sweatpants, you have to spend on your inputs or factors of production. For example, if you plan on silk-screening your college logo onto
hooded sweatshirts, you have to buy sweatshirts, paint, and a screen printing press. Since you have no revenue, you go to the loanable funds market and borrow to pay for these investments. Let’s be clear about this: without the loanable funds market, future GDP dries up. The financial industry is not like every other industry in an economy. When there is trouble in the loanable funds market, that trouble spreads across industries and nations – that’s why it is often referred to as “contagion.” Borrowing fuels investment which creates future output. But every dollar borrowed requires a dollar saved. Without savings, we cannot sustain future production – savings is that important. If you want to borrow to buy your resources to produce college apparel, somebody has to save.
Working backwards, the chain of crucial relationships looks like this:
Today Future Periods Time
‐Borrow $$
‐Build Capital Goods
‐Hire Workers
Production Sell Output (GDP)Prepare to Produce
‐Repay Loans $$
Figure 23.2: The Production Timeline
Before you can sell your college hoodies, you have to
buy equipment and other supplies. Normally, firms
pay for these expenses by borrowing in the loanable
funds market.
Output (GDP) requires investment. Investment requires borrowing. Borrowing requires savings. And all of this requires a loanable funds market that efficiently channels savers’ funds to borrowers. It’s helpful to think of the loanable funds market in terms of prices, quantities, supply and demand - like any other market. The good in this market is loanable funds. Demanders are borrowers, and suppliers are savers. Figure 23.* summarizes the distinctions of the loanable funds market. This approach helps simplifies a potentially confusing discussion of interest rates because an interest rate is just a price. An interest rate is the price of loanable funds. It is like the price of toothpaste, computers and hoodies; it is simply quoted differently. Many people, thinking about retirement, buying a house or car or some other big purchase, worry and fret over interest rate fluctuations and have no clear picture as to why interest rates rise and fall. The interest rate is just the price of loanable funds, and if you know how to use supply and demand, you can determine what makes interest rates rise and fall.
Before delving into the loanable funds market, we should caution you about the use of this model. Like any model, it’s a simplified version of reality. For example, initially we consider only one interest rate. For now, it can help to think of this as the general level of interest rates. But even with simplifying assumptions, the basic loanable funds model helps us understand much about real world financial issues.
[B] Supply of Loanable Funds
Recall that we generally think about the supply of savings as coming from households. This is an unusual market for students because it is the rare market where many of you are suppliers. If you have a positive balance in either a savings or checking account (as a college student, you may not have much), you are a supplier in the loanable funds market. This helps you relate to the supply side of this market. We turn now to several factors that affect the supply side of the loanable funds market. [C] Interest Rates
Figure 23.* Loanable Funds Market
Good Loanable Funds
Price Interest Rate
Sellers/Suppliers Savers
Buyers/Demanders Borrowers
Interest rate – The price of loanable funds. For savers, this is the reward for saving; for borrowers, it is the cost of borrowing.
If you are a saver, the interest rate is the return you get for supplying funds. For example, let’s say your parents stocked you with some funds when you came to college. After buying some textbooks, supplies and basic necessities, you have $500 left. So you consider saving this $500. You go to a bank near your campus and inquire about a new account. In this transaction, the bank is the buyer, and they offer certain prices they are willing to pay for your savings. When they do offer prices, they are not in dollars, as we are used to. They quote price in interest rates, or as a
percentage of how much you save. But it is really the same thing. So if you are saving $500, they might tell you: “We’ll give you 6% if you save that money for a year.” But this is equivalent to: “we’ll give you $30 if you save that money for a year.” For savers, the interest rate is a reward. Every dollar saved today returns more in the future. The higher the interest rate, the greater the returns in the future. Table 23.* illustrates how interest rates affect $500 worth of savings. Let’s say your bank is offering you 6% interest on your savings account. If you save $500 for one year, this brings you $530 next year, which is computed as: $500 + 6% of $500 = $500 + 0.06*$500 = $500 + $30 = $530. The higher the interest rate, the greater the incentive to save. If you can find a bank that pays you 10% interest, you could have $550 after just one year of saving. Higher interest rates induce more savings, as people respond to these incentives. This is the loanable funds version of the law of supply: the quantity of savings rises when the interest rate rises.
Incentives
Picture of Bank
lobby sign with
various interest
rates
Banks are willing to pay you for your
savings. The price they pay is the
interest rate.
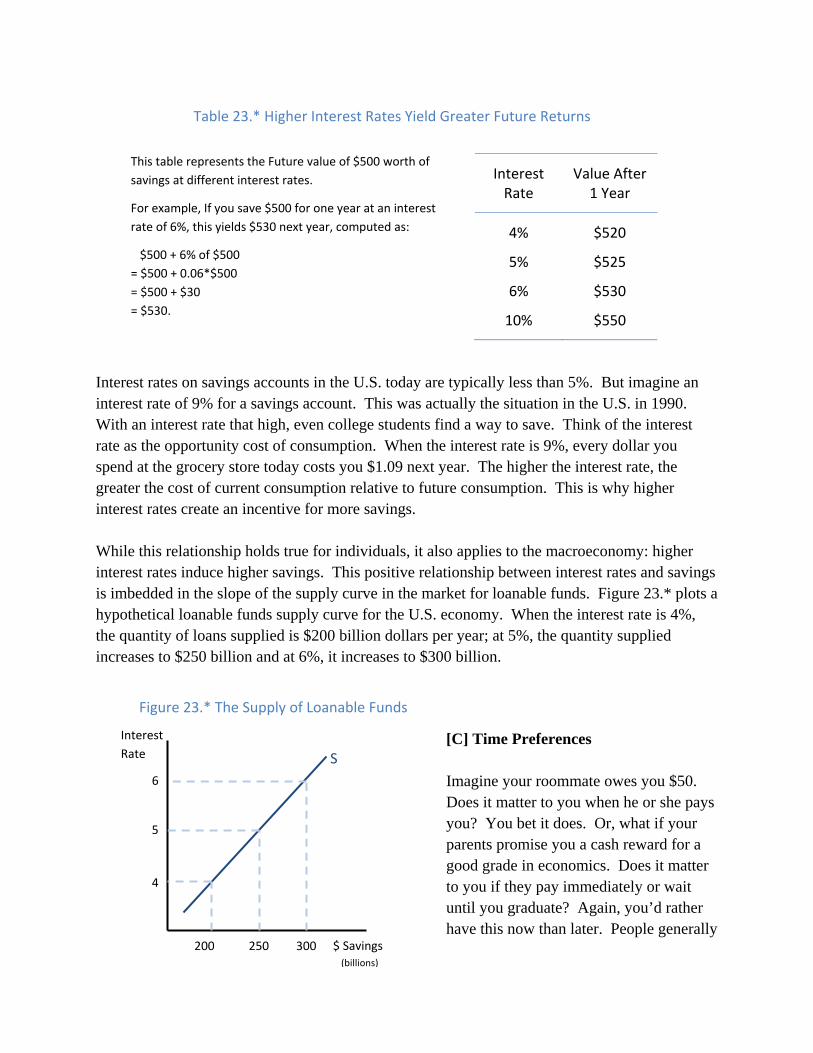
Interest rates on savings accounts in the U.S. today are typically less than 5%. But imagine an interest rate of 9% for a savings account. This was actually the situation in the U.S. in 1990. With an interest rate that high, even college students find a way to save. Think of the interest rate as the opportunity cost of consumption. When the interest rate is 9%, every dollar you spend at the grocery store today costs you $1.09 next year. The higher the interest rate, the greater the cost of current consumption relative to future consumption. This is why higher interest rates create an incentive for more savings. While this relationship holds true for individuals, it also applies to the macroeconomy: higher interest rates induce higher savings. This positive relationship between interest rates and savings is imbedded in the slope of the supply curve in the market for loanable funds. Figure 23.* plots a hypothetical loanable funds supply curve for the U.S. economy. When the interest rate is 4%, the quantity of loans supplied is $200 billion dollars per year; at 5%, the quantity supplied increases to $250 billion and at 6%, it increases to $300 billion.
[C] Time Preferences Imagine your roommate owes you $50. Does it matter to you when he or she pays you? You bet it does. Or, what if your parents promise you a cash reward for a good grade in economics. Does it matter to you if they pay immediately or wait until you graduate? Again, you’d rather have this now than later. People generally
Table 23.* Higher Interest Rates Yield Greater Future Returns
Interest Rate
Value After 1 Year
4% $520
5% $525
6% $530
10% $550
This table represents the Future value of $500 worth of
savings at different interest rates.
For example, If you save $500 for one year at an interest
rate of 6%, this yields $530 next year, computed as:
$500 + 6% of $500
= $500 + 0.06*$500
= $500 + $30
= $530.
Interest
Rate
Figure 23.* The Supply of Loanable Funds
S
5
6
4
200 250 300 $ Savings(billions)
prefer goods sooner than later, and the same applies to services and funds. This is a principle economists have noticed about individual preferences – we’d rather have things now than wait for them. Economists refer to this general tendency as time preferences. Time preferences imply that when people are promised delivery of goods, services or funds, they prefer sooner delivery to later delivery. This is why you must pay somebody if you borrow from them; and the longer you borrow something, the more you pay.
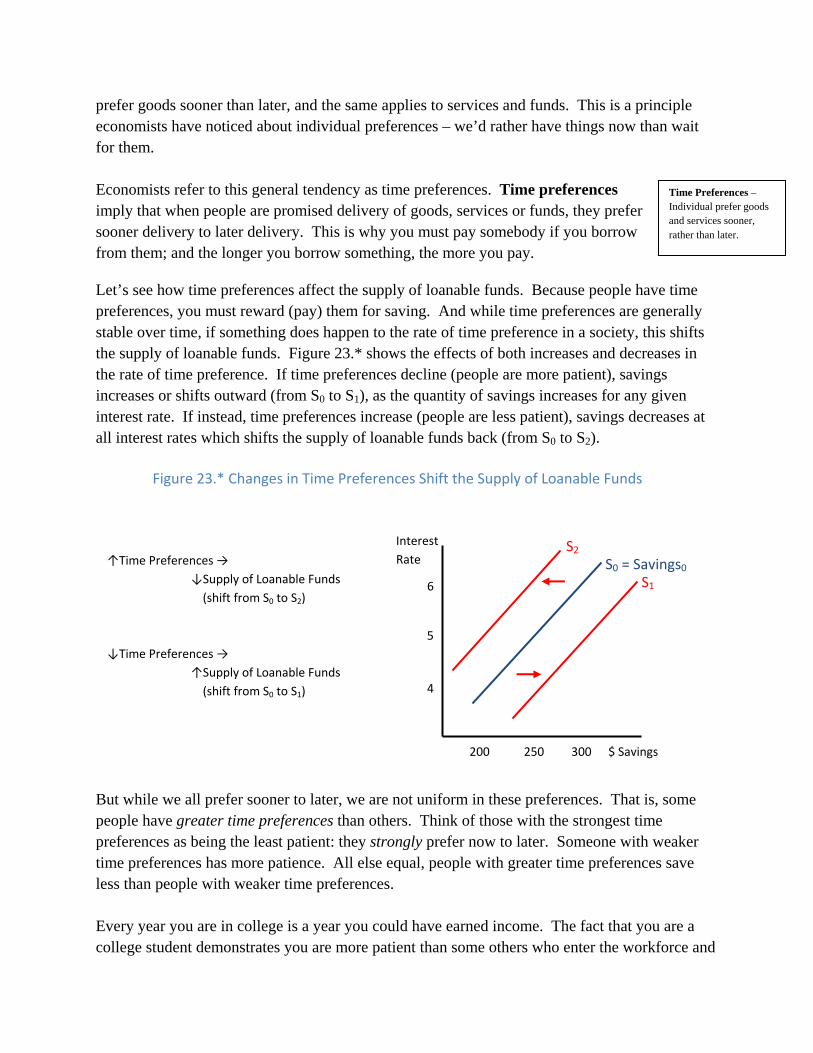
Let’s see how time preferences affect the supply of loanable funds. Because people have time preferences, you must reward (pay) them for saving. And while time preferences are generally stable over time, if something does happen to the rate of time preference in a society, this shifts the supply of loanable funds. Figure 23.* shows the effects of both increases and decreases in the rate of time preference. If time preferences decline (people are more patient), savings increases or shifts outward (from S0 to S1), as the quantity of savings increases for any given interest rate. If instead, time preferences increase (people are less patient), savings decreases at all interest rates which shifts the supply of loanable funds back (from S0 to S2).
But while we all prefer sooner to later, we are not uniform in these preferences. That is, some people have greater time preferences than others. Think of those with the strongest time preferences as being the least patient: they strongly prefer now to later. Someone with weaker time preferences has more patience. All else equal, people with greater time preferences save less than people with weaker time preferences. Every year you are in college is a year you could have earned income. The fact that you are a college student demonstrates you are more patient than some others who enter the workforce and
Time Preferences – Individual prefer goods and services sooner, rather than later.
Interest
Rate
$ Savings
Figure 23.* Changes in Time Preferences Shift the Supply of Loanable Funds
S0 = Savings0
5
6
4
200 250 300
S1
S2
↑Time Preferences →
↓Supply of Loanable Funds
(shift from S0 to S2)
↓Time Preferences →
↑Supply of Loanable Funds
(shift from S0 to S1)
earn income directly out of school. The truly impatient enter the workforce immediately so they can earn income (and spend on consumption) immediately.
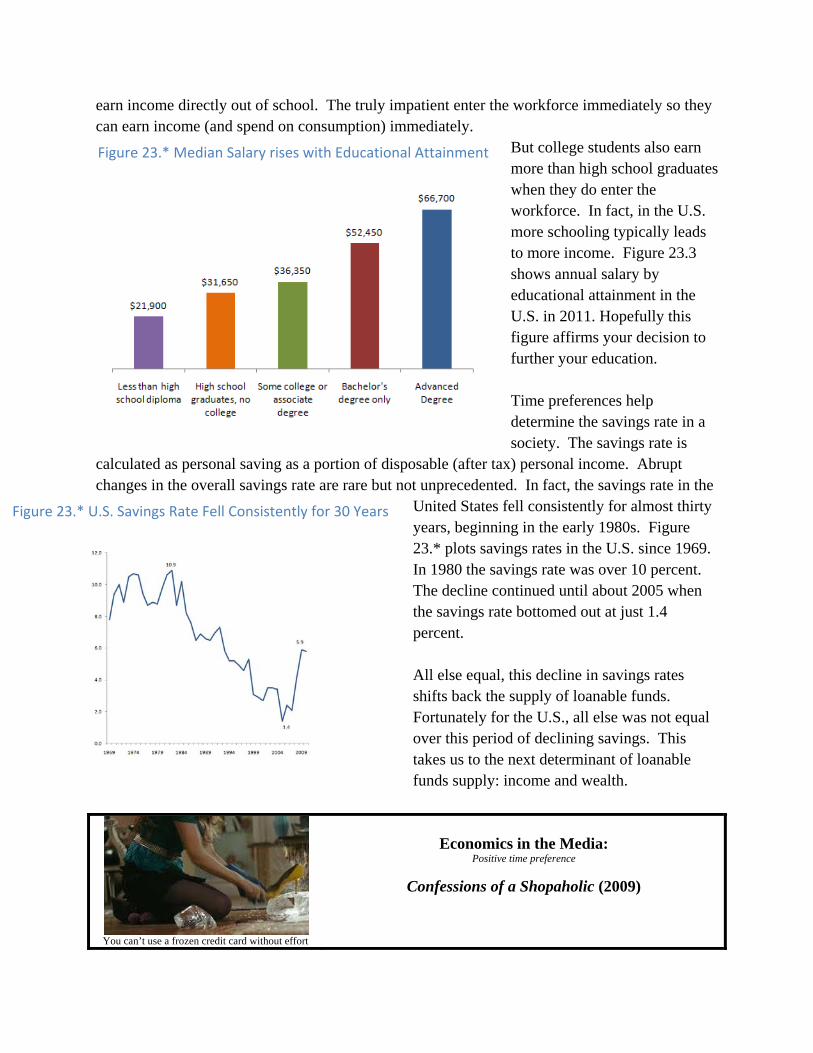
But college students also earn more than high school graduates when they do enter the workforce. In fact, in the U.S. more schooling typically leads to more income. Figure 23.3 shows annual salary by educational attainment in the U.S. in 2011. Hopefully this figure affirms your decision to further your education. Time preferences help determine the savings rate in a society. The savings rate is
calculated as personal saving as a portion of disposable (after tax) personal income. Abrupt changes in the overall savings rate are rare but not unprecedented. In fact, the savings rate in the
United States fell consistently for almost thirty years, beginning in the early 1980s. Figure 23.* plots savings rates in the U.S. since 1969. In 1980 the savings rate was over 10 percent. The decline continued until about 2005 when the savings rate bottomed out at just 1.4 percent. All else equal, this decline in savings rates shifts back the supply of loanable funds. Fortunately for the U.S., all else was not equal over this period of declining savings. This takes us to the next determinant of loanable funds supply: income and wealth.
You can’t use a frozen credit card without effort
Economics in the Media: Positive time preference
Confessions of a Shopaholic (2009)
Figure 23.* U.S. Savings Rate Fell Consistently for 30 Years
Figure 23.* Median Salary rises with Educational Attainment

This movie follows a fashion junkie, Rebecca Bloomwood, who must come to terms with her exploding debt. She is legally broke and being followed by a debt collector. To make matters worse she can’t stop spending and owes almost $20,000 on her credit cards. When she finally realizes the mess she is in she attends a Shopaholics Anonymous meeting at the request of one of her friends. This is where the fun really begins. Rebecca, like many other first time visitors, is reluctant to tell her story. After listening to others recant their trials during the past week, the leader turns to Becky and she begins to tell her story. Her innocence, and pure joy of shopping, is immediately obvious to the others members of the support group. As they listen to her describe the feeling she gets from making new purchases they long to feel the same way. Her story is not so much about repentance but about the need to shop more and this tests creates a euphoric response. After talking for a short time, Becky has convinced herself, and most of the group, to go on a shopping spree. She bolts from the meeting, races, home to her apartment, and unthaws her frozen credit card and heads off to find something new to purchase. What this film conveys is just how easy it is to get into unmanageable debt. The desire to individuals to borrow, driven by a time preferences, reduces the supply of loanable funds. In this movie we see how easy it is to get into debt and how hard it is to break the cycle.
[C] Income and Wealth All else equal, increases in income generally increase savings. If income declines, people generally save less. We recognize this propensity in both domestic and foreign savers. To be clear, we are saying that people save more dollars as dollar income rises, even if they do happen to save a lower portion of their additional income. As nations around the globe gain wealth, they save more too. Over the past couple of decades, the increase in foreign savings has often made its way into the U.S. loanable funds market. The reason is that, during this time, U.S. financial markets often offered safer and greater returns than elsewhere around the globe. The key implication is that as global economies have grown, this has led to an increase in savings in the U.S. Figure 23.* illustrates how an increase in foreign savings increases in the supply of loanable funds (from S0 to S1). This increase in foreign savings came at a good time for the United States. Recall that domestic savings was falling throughout most of this period. Without the influx of foreign funds, U.S. firms would have had difficulty funding investment. There is no guarantee that foreign savings will continue to flow into the U.S. at the same rates as in the past. But, as we’ll show below, foreign savings offers new opportunities for domestic forms to borrow for investment.

[C] Consumption Smoothing Over the course of a typical lifetime, income varies drastically. Early in life, income levels are low relative to midlife. At retirement, income levels fall again. This typical economic lifecycle is illustrated with the green line in Figure 23.*. Income (the green line) is highest in the middle “prime earning years,” and lower at both the beginning and end of life. But people generally like to smooth consumption over the lifecycle. Consider your current situation: college students typically spend more (on tuition, room and board, etc.) than they earn in income. While some of this deficit is made up with help from parents, much of the difference is often financed by borrowing. Then, sometime after you graduate and get a job, you’ll want to buy your first home. For this, you’ll likely borrow again. So early in a typical life, consumption is less than income. The difference is made up through borrowing. In Figure 23.*, the vertical distance between income and consumption is a picture of the borrowing.
Income reaches it’s highest level in midlife during your “prime earning years.” This is when you pay off your loans and save for retirement. In Figure 23.*, this is the time when income (green line) exceed consumption (blue). Then, later in life, when income is lower (due to retirement), most people live off their savings. Economists call this dissaving. Here’s what consumption smoothing implies about the market for loanable funds. Savings is highest when people are in midlife. Now if we have a generally stable flow of people working
Figure 23.* Savings changes over a typical lifecycle
Prime Earning
Years Early Life Later Life
Income,
Consumption
Income
Consumption
Saving
Dissaving
Borrowing
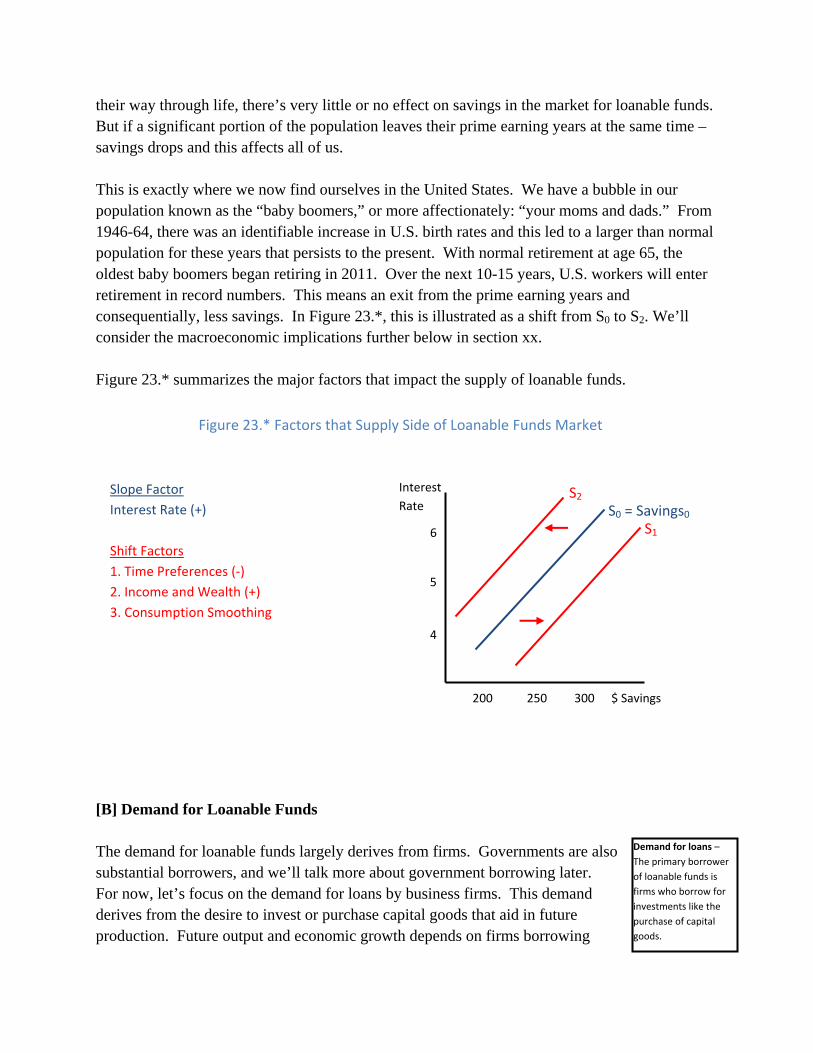
their way through life, there’s very little or no effect on savings in the market for loanable funds. But if a significant portion of the population leaves their prime earning years at the same time – savings drops and this affects all of us. This is exactly where we now find ourselves in the United States. We have a bubble in our population known as the “baby boomers,” or more affectionately: “your moms and dads.” From 1946-64, there was an identifiable increase in U.S. birth rates and this led to a larger than normal population for these years that persists to the present. With normal retirement at age 65, the oldest baby boomers began retiring in 2011. Over the next 10-15 years, U.S. workers will enter retirement in record numbers. This means an exit from the prime earning years and consequentially, less savings. In Figure 23.*, this is illustrated as a shift from S0 to S2. We’ll consider the macroeconomic implications further below in section xx. Figure 23.* summarizes the major factors that impact the supply of loanable funds.
[B] Demand for Loanable Funds The demand for loanable funds largely derives from firms. Governments are also substantial borrowers, and we’ll talk more about government borrowing later. For now, let’s focus on the demand for loans by business firms. This demand derives from the desire to invest or purchase capital goods that aid in future production. Future output and economic growth depends on firms borrowing
Interest
Rate
$ Savings
Figure 23.* Factors that Supply Side of Loanable Funds Market
S0 = Savings0
5
6
4
200 250 300
S1
S2 Slope Factor
Interest Rate (+)
Shift Factors
1. Time Preferences (‐)
2. Income and Wealth (+)
3. Consumption Smoothing
Demand for loans –
The primary borrower
of loanable funds is
firms who borrow for
investments like the
purchase of capital
goods.
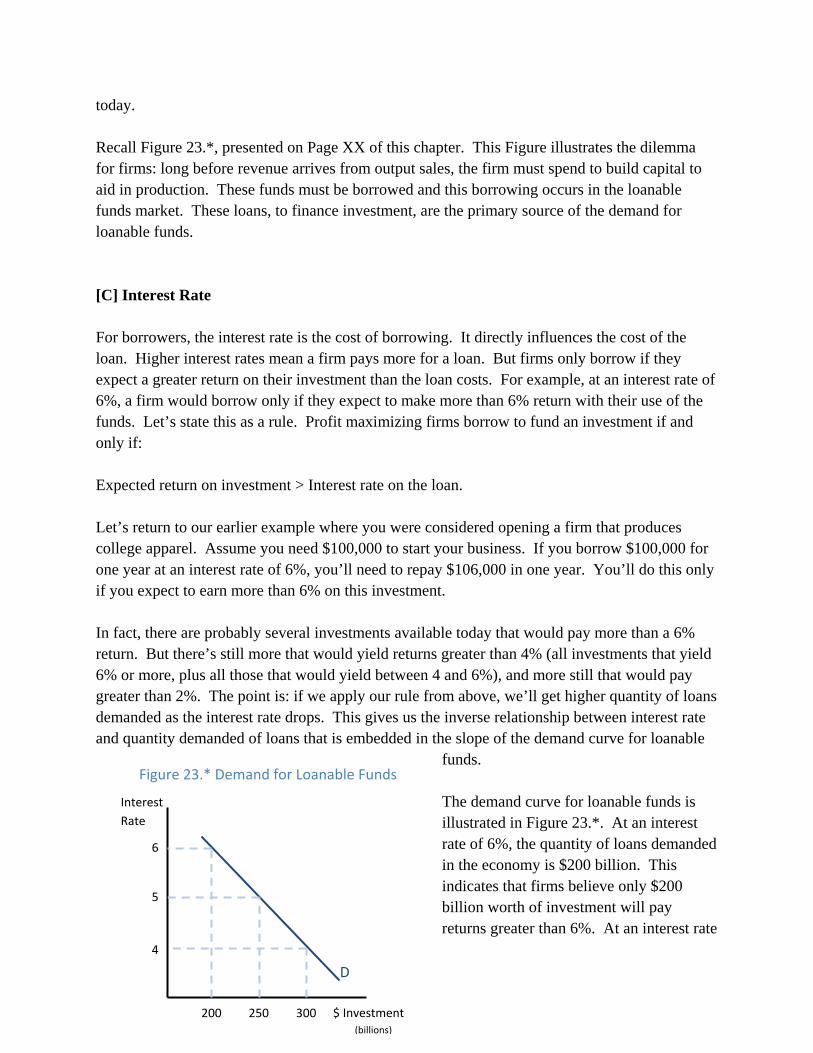
today. Recall Figure 23.*, presented on Page XX of this chapter. This Figure illustrates the dilemma for firms: long before revenue arrives from output sales, the firm must spend to build capital to aid in production. These funds must be borrowed and this borrowing occurs in the loanable funds market. These loans, to finance investment, are the primary source of the demand for loanable funds. [C] Interest Rate For borrowers, the interest rate is the cost of borrowing. It directly influences the cost of the loan. Higher interest rates mean a firm pays more for a loan. But firms only borrow if they expect a greater return on their investment than the loan costs. For example, at an interest rate of 6%, a firm would borrow only if they expect to make more than 6% return with their use of the funds. Let’s state this as a rule. Profit maximizing firms borrow to fund an investment if and only if: Expected return on investment > Interest rate on the loan. Let’s return to our earlier example where you were considered opening a firm that produces college apparel. Assume you need $100,000 to start your business. If you borrow $100,000 for one year at an interest rate of 6%, you’ll need to repay $106,000 in one year. You’ll do this only if you expect to earn more than 6% on this investment. In fact, there are probably several investments available today that would pay more than a 6% return. But there’s still more that would yield returns greater than 4% (all investments that yield 6% or more, plus all those that would yield between 4 and 6%), and more still that would pay greater than 2%. The point is: if we apply our rule from above, we’ll get higher quantity of loans demanded as the interest rate drops. This gives us the inverse relationship between interest rate and quantity demanded of loans that is embedded in the slope of the demand curve for loanable
funds. The demand curve for loanable funds is illustrated in Figure 23.*. At an interest rate of 6%, the quantity of loans demanded in the economy is $200 billion. This indicates that firms believe only $200 billion worth of investment will pay returns greater than 6%. At an interest rate
Interest
Rate
$ Investment(billions)
Figure 23.* Demand for Loanable Funds
D
5
6
4
200 250 300
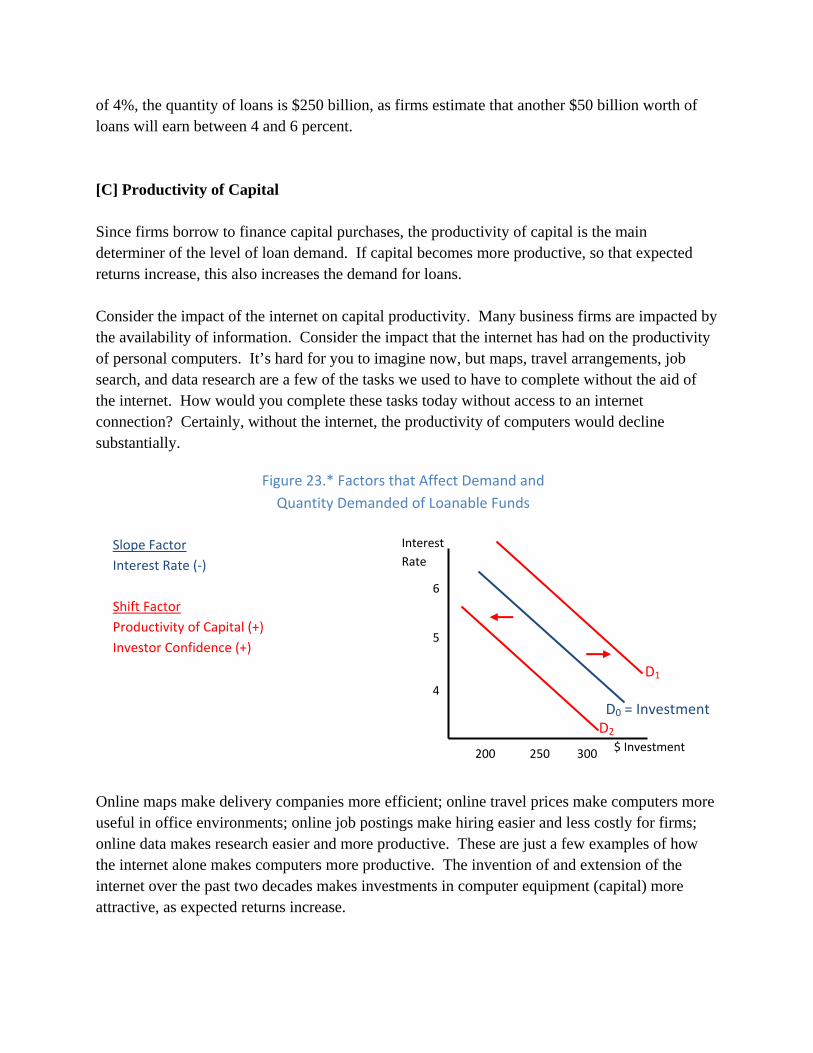
of 4%, the quantity of loans is $250 billion, as firms estimate that another $50 billion worth of loans will earn between 4 and 6 percent. [C] Productivity of Capital Since firms borrow to finance capital purchases, the productivity of capital is the main determiner of the level of loan demand. If capital becomes more productive, so that expected returns increase, this also increases the demand for loans. Consider the impact of the internet on capital productivity. Many business firms are impacted by the availability of information. Consider the impact that the internet has had on the productivity of personal computers. It’s hard for you to imagine now, but maps, travel arrangements, job search, and data research are a few of the tasks we used to have to complete without the aid of the internet. How would you complete these tasks today without access to an internet connection? Certainly, without the internet, the productivity of computers would decline substantially.
Online maps make delivery companies more efficient; online travel prices make computers more useful in office environments; online job postings make hiring easier and less costly for firms; online data makes research easier and more productive. These are just a few examples of how the internet alone makes computers more productive. The invention of and extension of the internet over the past two decades makes investments in computer equipment (capital) more attractive, as expected returns increase.
Interest
Rate
$ Investment
Figure 23.* Factors that Affect Demand and
Quantity Demanded of Loanable Funds
D0 = Investment
5
6
4
200 250 300
D1
D2
Slope Factor
Interest Rate (‐)
Shift Factor
Productivity of Capital (+)
Investor Confidence (+)
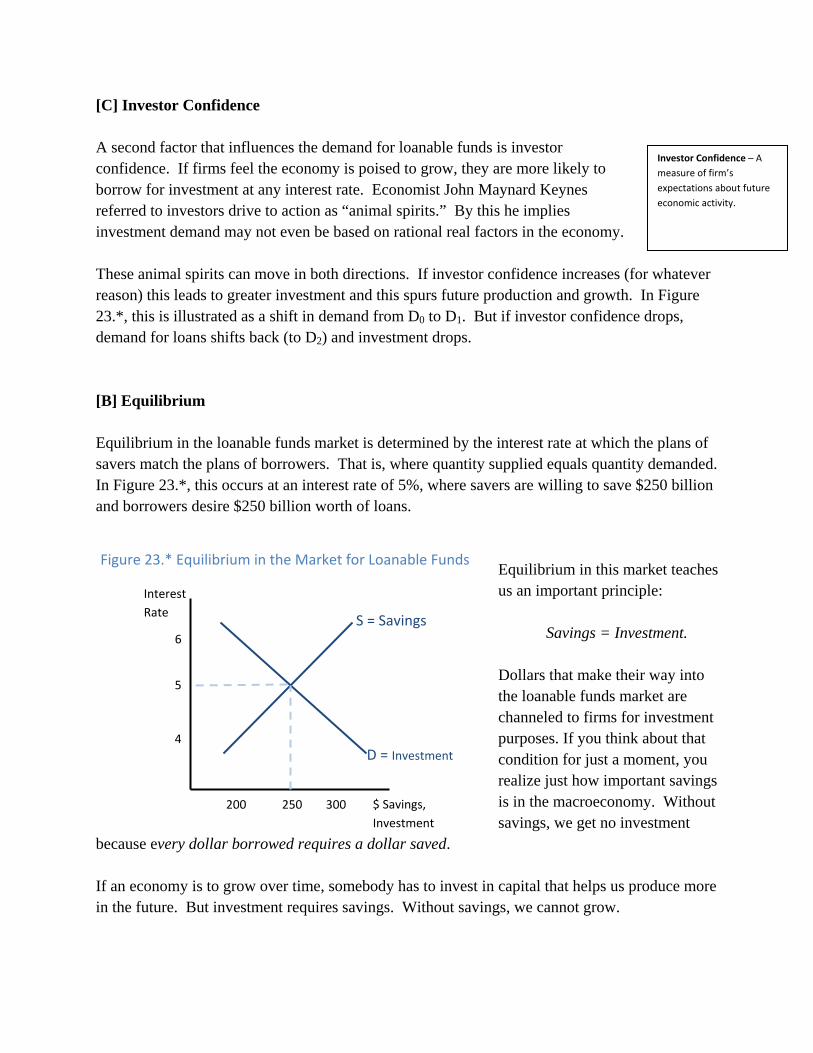
[C] Investor Confidence A second factor that influences the demand for loanable funds is investor confidence. If firms feel the economy is poised to grow, they are more likely to borrow for investment at any interest rate. Economist John Maynard Keynes referred to investors drive to action as “animal spirits.” By this he implies investment demand may not even be based on rational real factors in the economy. These animal spirits can move in both directions. If investor confidence increases (for whatever reason) this leads to greater investment and this spurs future production and growth. In Figure 23.*, this is illustrated as a shift in demand from D0 to D1. But if investor confidence drops, demand for loans shifts back (to D2) and investment drops. [B] Equilibrium Equilibrium in the loanable funds market is determined by the interest rate at which the plans of savers match the plans of borrowers. That is, where quantity supplied equals quantity demanded. In Figure 23.*, this occurs at an interest rate of 5%, where savers are willing to save $250 billion and borrowers desire $250 billion worth of loans.
Equilibrium in this market teaches us an important principle:
Savings = Investment. Dollars that make their way into the loanable funds market are channeled to firms for investment purposes. If you think about that condition for just a moment, you realize just how important savings is in the macroeconomy. Without savings, we get no investment
because every dollar borrowed requires a dollar saved. If an economy is to grow over time, somebody has to invest in capital that helps us produce more in the future. But investment requires savings. Without savings, we cannot grow.
Interest
Rate
$ Savings,
Investment
D = Investment
5
6
4
200 250 300
S = Savings
Investor Confidence – A
measure of firm’s
expectations about future
economic activity.
Figure 23.* Equilibrium in the Market for Loanable Funds
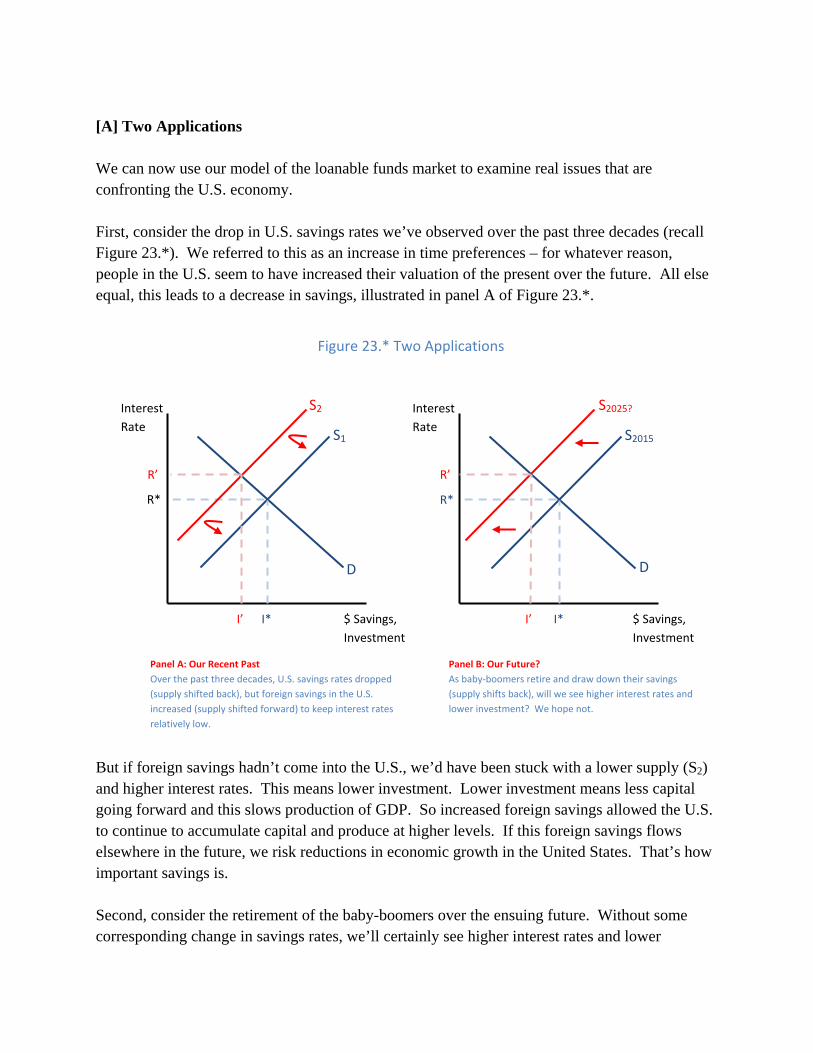
[A] Two Applications We can now use our model of the loanable funds market to examine real issues that are confronting the U.S. economy. First, consider the drop in U.S. savings rates we’ve observed over the past three decades (recall Figure 23.*). We referred to this as an increase in time preferences – for whatever reason, people in the U.S. seem to have increased their valuation of the present over the future. All else equal, this leads to a decrease in savings, illustrated in panel A of Figure 23.*.
But if foreign savings hadn’t come into the U.S., we’d have been stuck with a lower supply (S2) and higher interest rates. This means lower investment. Lower investment means less capital going forward and this slows production of GDP. So increased foreign savings allowed the U.S. to continue to accumulate capital and produce at higher levels. If this foreign savings flows elsewhere in the future, we risk reductions in economic growth in the United States. That’s how important savings is. Second, consider the retirement of the baby-boomers over the ensuing future. Without some corresponding change in savings rates, we’ll certainly see higher interest rates and lower
Interest
Rate
$ Savings,
Investment
Figure 23.* Two Applications
D
R*
R’
I’ I*
S2015
Interest
Rate
R*
I*
S1
$ Savings,
Investment
D
S2 S2025?
Panel A: Our Recent Past
Over the past three decades, U.S. savings rates dropped
(supply shifted back), but foreign savings in the U.S.
increased (supply shifted forward) to keep interest rates
relatively low.
Panel B: Our Future?
As baby‐boomers retire and draw down their savings
(supply shifts back), will we see higher interest rates and
lower investment? We hope not.
I’
R’
investment. All else equal, this means reduced investment and reduced GDP growth going forward. We don’t mean to alarm you with this forecast, but it may well happen. On the other hand, many other factors may change over the next few years to increase savings n the U.S. One possibility is that Americans begin saving more again. Data from 2010 and 2011 indicate this may already be happening. Also, as other nations grow, foreigners may continue to increase savings in the U.S. If these factors change enough, they could offset the effects of the baby-boomer retirement and keep interest rates low for U.S. firms.
Economics in the Real World:
Varying Interest Rates
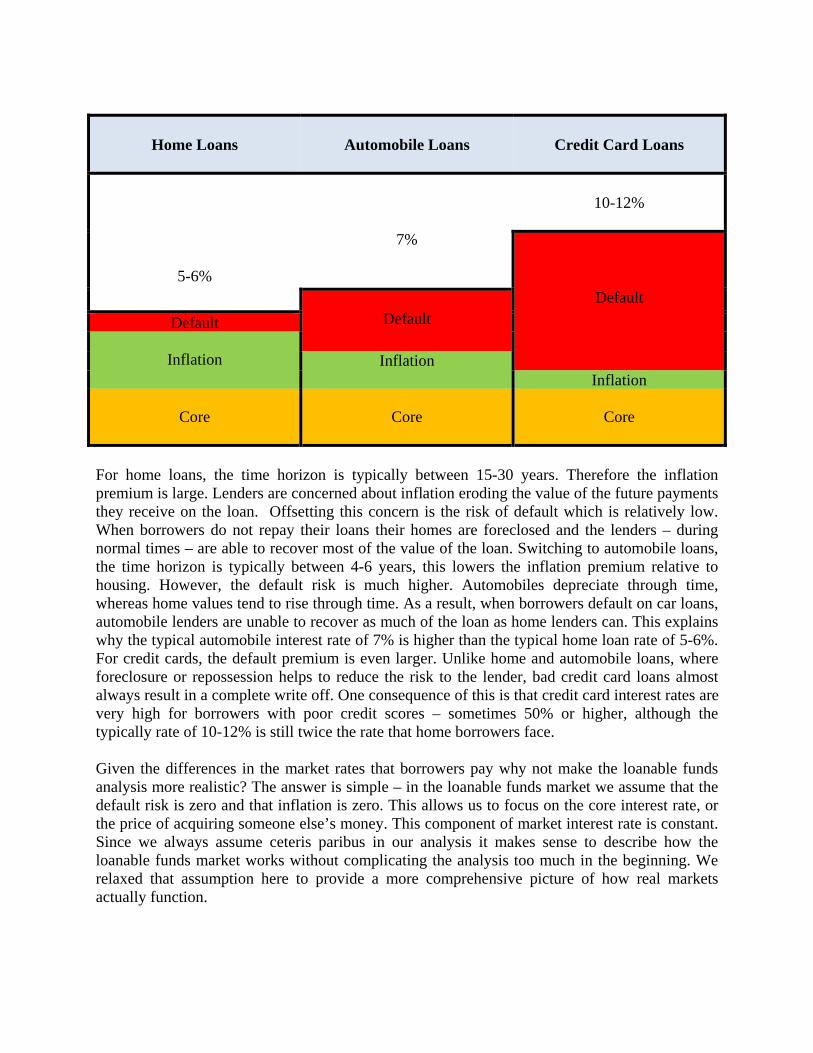
Our development of the loanable funds market has treated the interest rate as if it was a single value. The overall impression that this leaves does not seem realistic. In this box we take at look at how the markets for homes, automobiles and credit cards work to explain why the interest rates in those markets differ. There are three factors that determine the interest rates that consumers pay: the opportunity cost of borrowing someone else’s money, the risk of default, and the time horizon it takes to repay the loan. This relative importance of each of these factors to home, automobile and credit cards is shown in the table below.
Home Loans
Automobile Loans
Credit Card Loans
5-6%
7%
10-12%
Default Default Default
Inflation Inflation
Inflation
Core
Core
Core
For home loans, the time horizon is typically between 15-30 years. Therefore the inflation premium is large. Lenders are concerned about inflation eroding the value of the future payments they receive on the loan. Offsetting this concern is the risk of default which is relatively low. When borrowers do not repay their loans their homes are foreclosed and the lenders – during normal times – are able to recover most of the value of the loan. Switching to automobile loans, the time horizon is typically between 4-6 years, this lowers the inflation premium relative to housing. However, the default risk is much higher. Automobiles depreciate through time, whereas home values tend to rise through time. As a result, when borrowers default on car loans, automobile lenders are unable to recover as much of the loan as home lenders can. This explains why the typical automobile interest rate of 7% is higher than the typical home loan rate of 5-6%. For credit cards, the default premium is even larger. Unlike home and automobile loans, where foreclosure or repossession helps to reduce the risk to the lender, bad credit card loans almost always result in a complete write off. One consequence of this is that credit card interest rates are very high for borrowers with poor credit scores – sometimes 50% or higher, although the typically rate of 10-12% is still twice the rate that home borrowers face. Given the differences in the market rates that borrowers pay why not make the loanable funds analysis more realistic? The answer is simple – in the loanable funds market we assume that the default risk is zero and that inflation is zero. This allows us to focus on the core interest rate, or the price of acquiring someone else’s money. This component of market interest rate is constant. Since we always assume ceteris paribus in our analysis it makes sense to describe how the loanable funds market works without complicating the analysis too much in the beginning. We relaxed that assumption here to provide a more comprehensive picture of how real markets actually function.
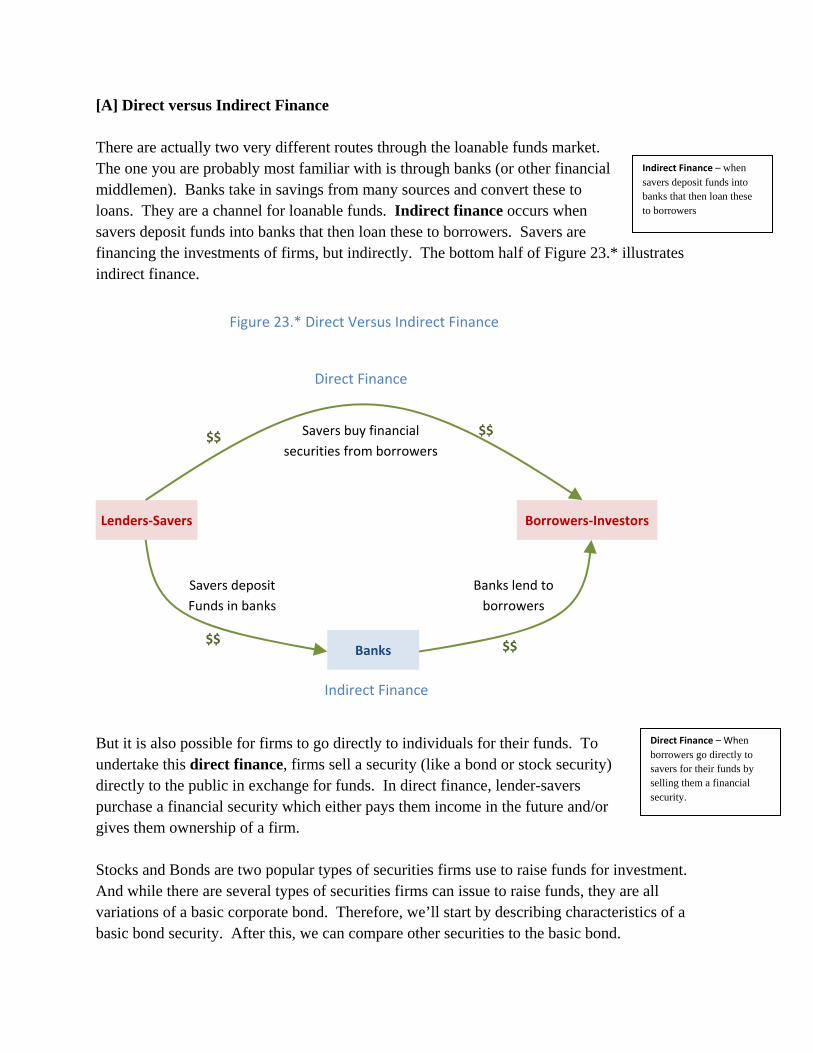
[A] Direct versus Indirect Finance There are actually two very different routes through the loanable funds market. The one you are probably most familiar with is through banks (or other financial middlemen). Banks take in savings from many sources and convert these to loans. They are a channel for loanable funds. Indirect finance occurs when savers deposit funds into banks that then loan these to borrowers. Savers are financing the investments of firms, but indirectly. The bottom half of Figure 23.* illustrates indirect finance.
But it is also possible for firms to go directly to individuals for their funds. To undertake this direct finance, firms sell a security (like a bond or stock security) directly to the public in exchange for funds. In direct finance, lender-savers purchase a financial security which either pays them income in the future and/or gives them ownership of a firm. Stocks and Bonds are two popular types of securities firms use to raise funds for investment. And while there are several types of securities firms can issue to raise funds, they are all variations of a basic corporate bond. Therefore, we’ll start by describing characteristics of a basic bond security. After this, we can compare other securities to the basic bond.
Lenders‐Savers
Borrowers‐Investors
Banks
Direct Finance
Indirect Finance
Savers buy financial
securities from borrowers
Savers deposit
Funds in banks
Banks lend to
borrowers
Figure 23.* Direct Versus Indirect Finance
$$
$$$$
$$
Indirect Finance – when savers deposit funds into banks that then loan these to borrowers
Direct Finance – When borrowers go directly to savers for their funds by selling them a financial security.
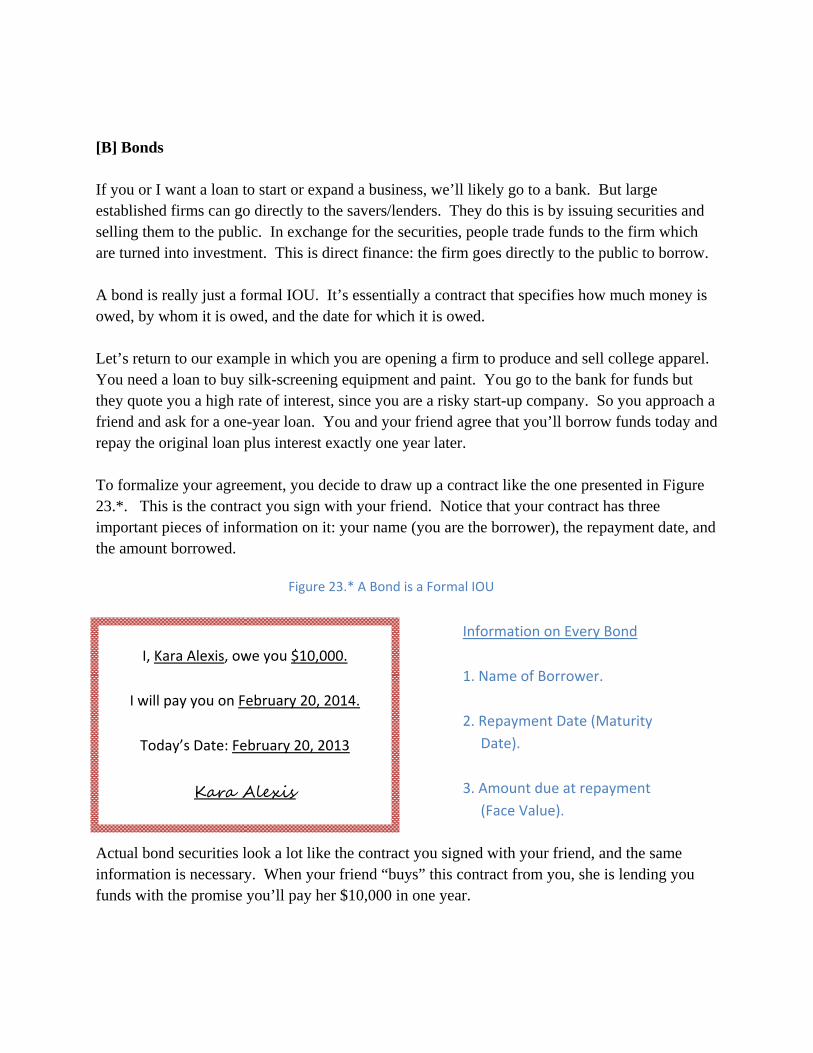
[B] Bonds If you or I want a loan to start or expand a business, we’ll likely go to a bank. But large established firms can go directly to the savers/lenders. They do this is by issuing securities and selling them to the public. In exchange for the securities, people trade funds to the firm which are turned into investment. This is direct finance: the firm goes directly to the public to borrow. A bond is really just a formal IOU. It’s essentially a contract that specifies how much money is owed, by whom it is owed, and the date for which it is owed. Let’s return to our example in which you are opening a firm to produce and sell college apparel. You need a loan to buy silk-screening equipment and paint. You go to the bank for funds but they quote you a high rate of interest, since you are a risky start-up company. So you approach a friend and ask for a one-year loan. You and your friend agree that you’ll borrow funds today and repay the original loan plus interest exactly one year later. To formalize your agreement, you decide to draw up a contract like the one presented in Figure 23.*. This is the contract you sign with your friend. Notice that your contract has three important pieces of information on it: your name (you are the borrower), the repayment date, and the amount borrowed.
Actual bond securities look a lot like the contract you signed with your friend, and the same information is necessary. When your friend “buys” this contract from you, she is lending you funds with the promise you’ll pay her $10,000 in one year.
I, Kara Alexis, owe you $10,000.
I will pay you on February 20, 2014.
Today’s Date: February 20, 2013
Kara Alexis
Figure 23.* A Bond is a Formal IOU
Information on Every Bond
1. Name of Borrower.
2. Repayment Date (Maturity
Date).
3. Amount due at repayment
(Face Value).
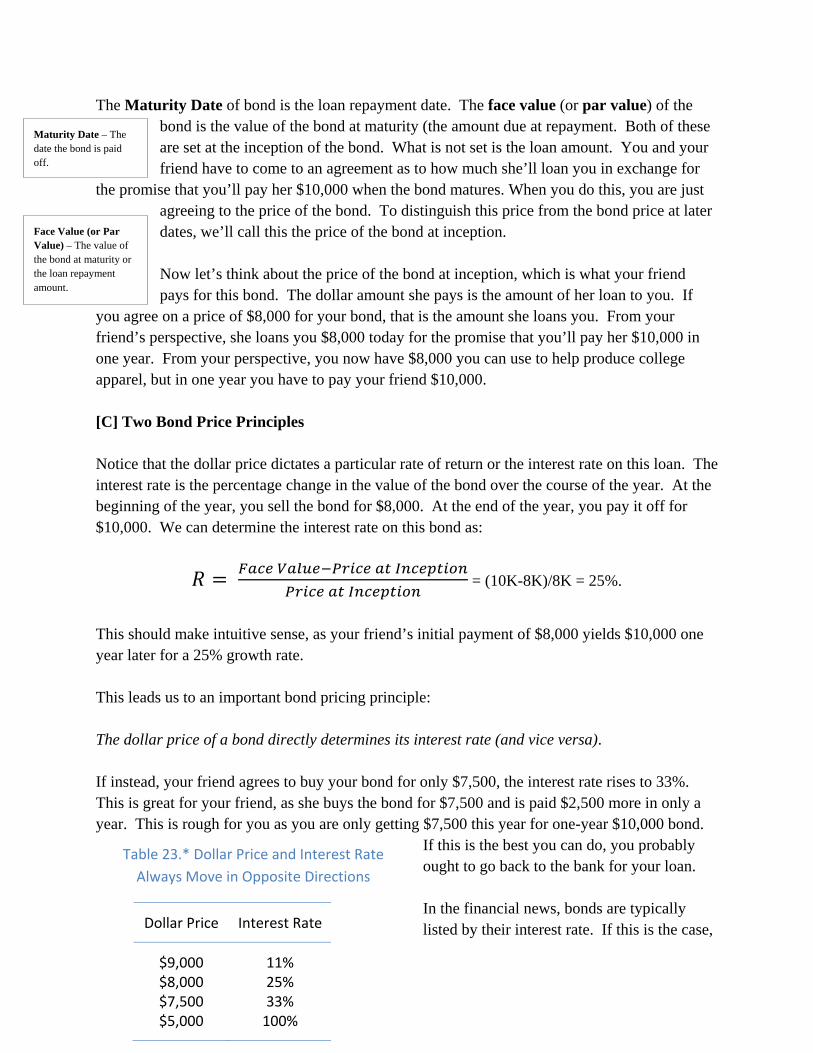
The Maturity Date of bond is the loan repayment date. The face value (or par value) of the bond is the value of the bond at maturity (the amount due at repayment. Both of these are set at the inception of the bond. What is not set is the loan amount. You and your friend have to come to an agreement as to how much she’ll loan you in exchange for
the promise that you’ll pay her $10,000 when the bond matures. When you do this, you are just agreeing to the price of the bond. To distinguish this price from the bond price at later dates, we’ll call this the price of the bond at inception. Now let’s think about the price of the bond at inception, which is what your friend pays for this bond. The dollar amount she pays is the amount of her loan to you. If
you agree on a price of $8,000 for your bond, that is the amount she loans you. From your friend’s perspective, she loans you $8,000 today for the promise that you’ll pay her $10,000 in one year. From your perspective, you now have $8,000 you can use to help produce college apparel, but in one year you have to pay your friend $10,000. [C] Two Bond Price Principles Notice that the dollar price dictates a particular rate of return or the interest rate on this loan. The interest rate is the percentage change in the value of the bond over the course of the year. At the beginning of the year, you sell the bond for $8,000. At the end of the year, you pay it off for $10,000. We can determine the interest rate on this bond as:
= (10K-8K)/8K = 25%.
This should make intuitive sense, as your friend’s initial payment of $8,000 yields $10,000 one year later for a 25% growth rate. This leads us to an important bond pricing principle: The dollar price of a bond directly determines its interest rate (and vice versa). If instead, your friend agrees to buy your bond for only $7,500, the interest rate rises to 33%. This is great for your friend, as she buys the bond for $7,500 and is paid $2,500 more in only a year. This is rough for you as you are only getting $7,500 this year for one-year $10,000 bond.
If this is the best you can do, you probably ought to go back to the bank for your loan. In the financial news, bonds are typically listed by their interest rate. If this is the case,
Maturity Date – The date the bond is paid off.
Face Value (or Par Value) – The value of the bond at maturity or the loan repayment amount.
Dollar Price Interest Rate
$9,000 11% $8,000 25% $7,500 33% $5,000 100%
Table 23.* Dollar Price and Interest Rate
Always Move in Opposite Directions
you can easily determine the dollar price of the bond by working through the above formula in reverse. That is, if you know a $10,000 bond is selling with an interest rate of 25%, the dollar price is $8,000.
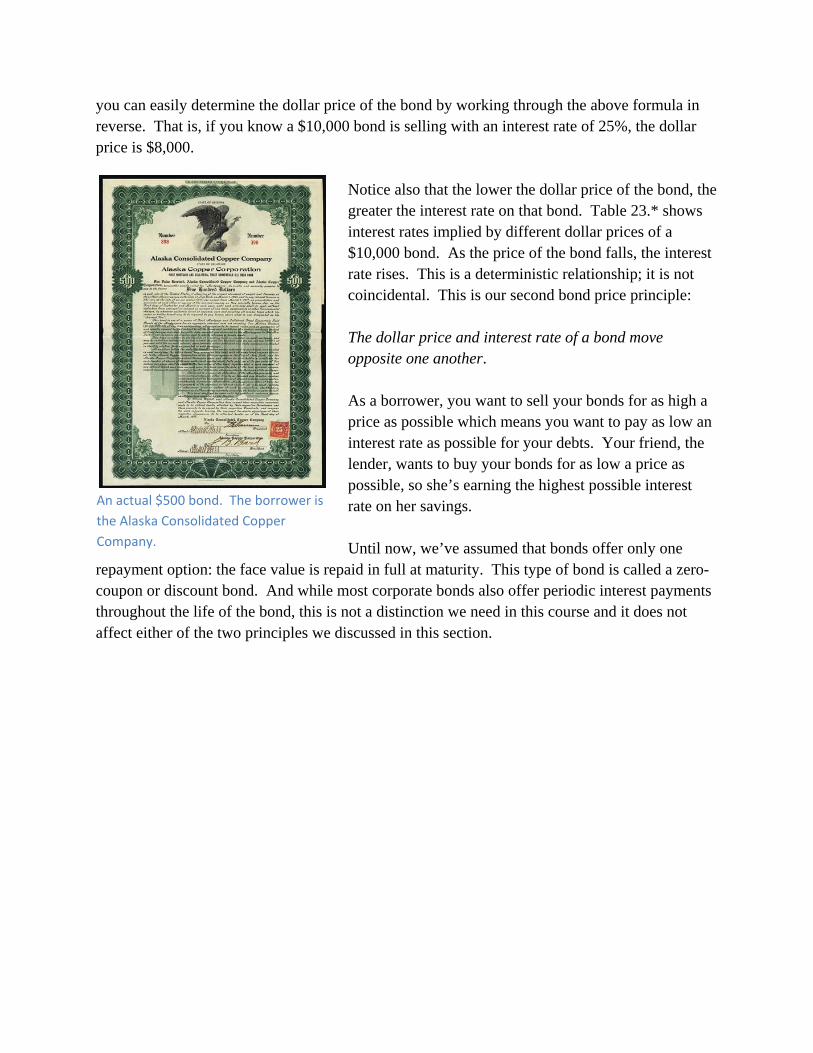
Notice also that the lower the dollar price of the bond, the greater the interest rate on that bond. Table 23.* shows interest rates implied by different dollar prices of a $10,000 bond. As the price of the bond falls, the interest rate rises. This is a deterministic relationship; it is not coincidental. This is our second bond price principle: The dollar price and interest rate of a bond move opposite one another. As a borrower, you want to sell your bonds for as high a price as possible which means you want to pay as low an interest rate as possible for your debts. Your friend, the lender, wants to buy your bonds for as low a price as possible, so she’s earning the highest possible interest rate on her savings. Until now, we’ve assumed that bonds offer only one
repayment option: the face value is repaid in full at maturity. This type of bond is called a zero-coupon or discount bond. And while most corporate bonds also offer periodic interest payments throughout the life of the bond, this is not a distinction we need in this course and it does not affect either of the two principles we discussed in this section.
An actual $500 bond. The borrower is
the Alaska Consolidated Copper
Company.
Practice What You Know! Determine the interest rate on the following bonds:
(1) A one-year bond with a face value of $1,000 and a price of $950.00
(2) A one-year bond with a face value of $1,000 and a price of $833.33.
Answers: (1) Using the formula:
,
We compute: R = ($1,000 - $950)/$950 = $50/$950 = 5.26%
(2) R = ($1,000 - $833.33)/$833.33 = $166.67/$833.33 = 20%
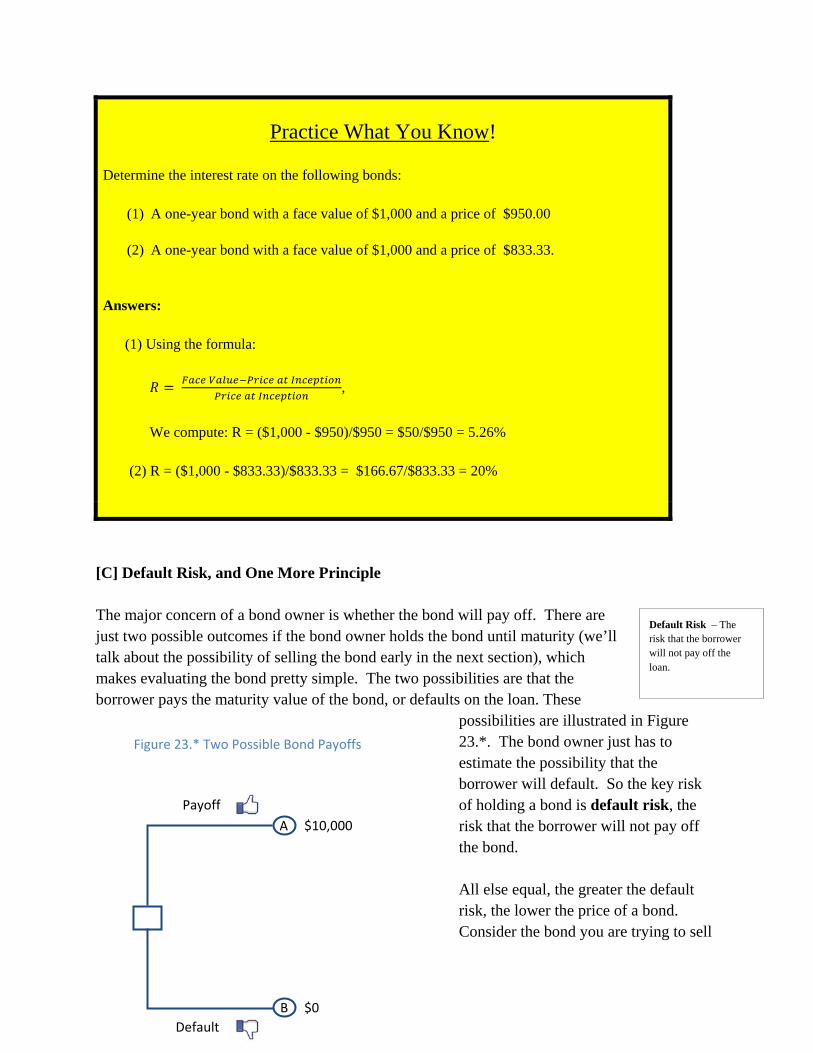
[C] Default Risk, and One More Principle The major concern of a bond owner is whether the bond will pay off. There are just two possible outcomes if the bond owner holds the bond until maturity (we’ll talk about the possibility of selling the bond early in the next section), which makes evaluating the bond pretty simple. The two possibilities are that the borrower pays the maturity value of the bond, or defaults on the loan. These
possibilities are illustrated in Figure 23.*. The bond owner just has to estimate the possibility that the borrower will default. So the key risk of holding a bond is default risk, the risk that the borrower will not pay off the bond. All else equal, the greater the default risk, the lower the price of a bond. Consider the bond you are trying to sell
Payoff
Default
$10,000
$0
Figure 23.* Two Possible Bond Payoffs
A
B
Default Risk – The risk that the borrower will not pay off the loan.
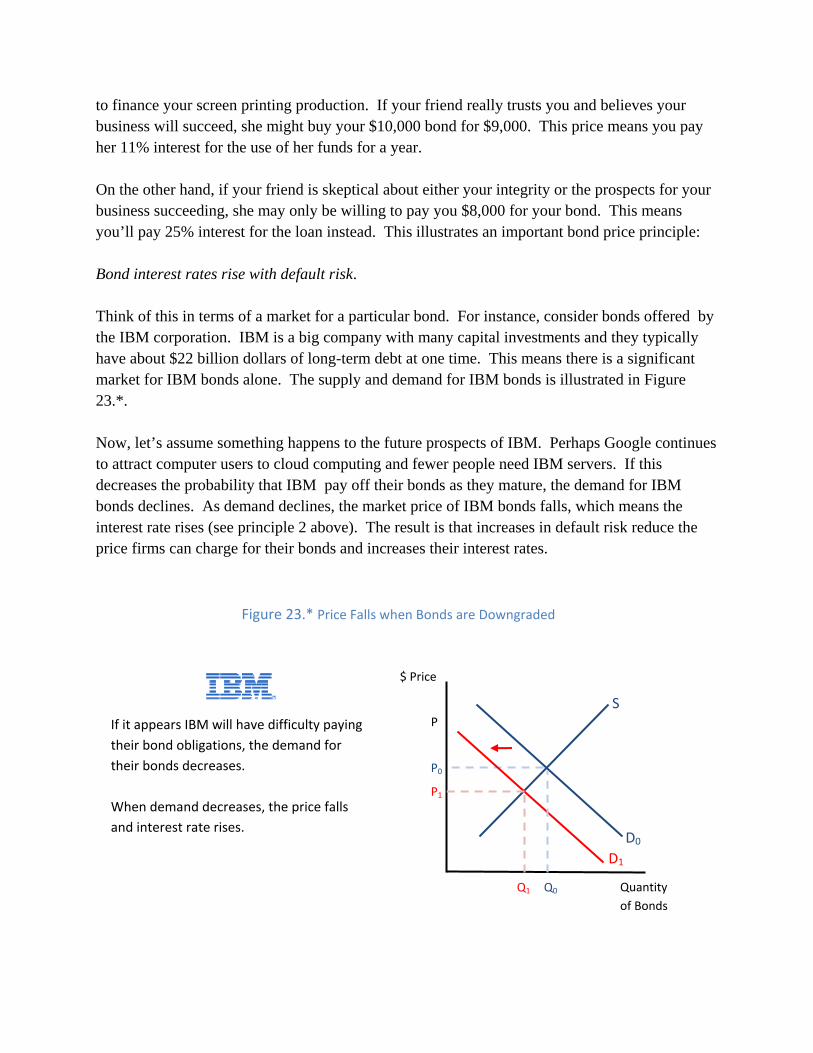
to finance your screen printing production. If your friend really trusts you and believes your business will succeed, she might buy your $10,000 bond for $9,000. This price means you pay her 11% interest for the use of her funds for a year. On the other hand, if your friend is skeptical about either your integrity or the prospects for your business succeeding, she may only be willing to pay you $8,000 for your bond. This means you’ll pay 25% interest for the loan instead. This illustrates an important bond price principle: Bond interest rates rise with default risk. Think of this in terms of a market for a particular bond. For instance, consider bonds offered by the IBM corporation. IBM is a big company with many capital investments and they typically have about $22 billion dollars of long-term debt at one time. This means there is a significant market for IBM bonds alone. The supply and demand for IBM bonds is illustrated in Figure 23.*. Now, let’s assume something happens to the future prospects of IBM. Perhaps Google continues to attract computer users to cloud computing and fewer people need IBM servers. If this decreases the probability that IBM pay off their bonds as they mature, the demand for IBM bonds declines. As demand declines, the market price of IBM bonds falls, which means the interest rate rises (see principle 2 above). The result is that increases in default risk reduce the price firms can charge for their bonds and increases their interest rates.
$ Price
Quantity
of Bonds
Figure 23.* Price Falls when Bonds are Downgraded
D0
P0
P
P1
Q1 Q0
If it appears IBM will have difficulty paying
their bond obligations, the demand for
their bonds decreases.
When demand decreases, the price falls
and interest rate rises.
S
D1
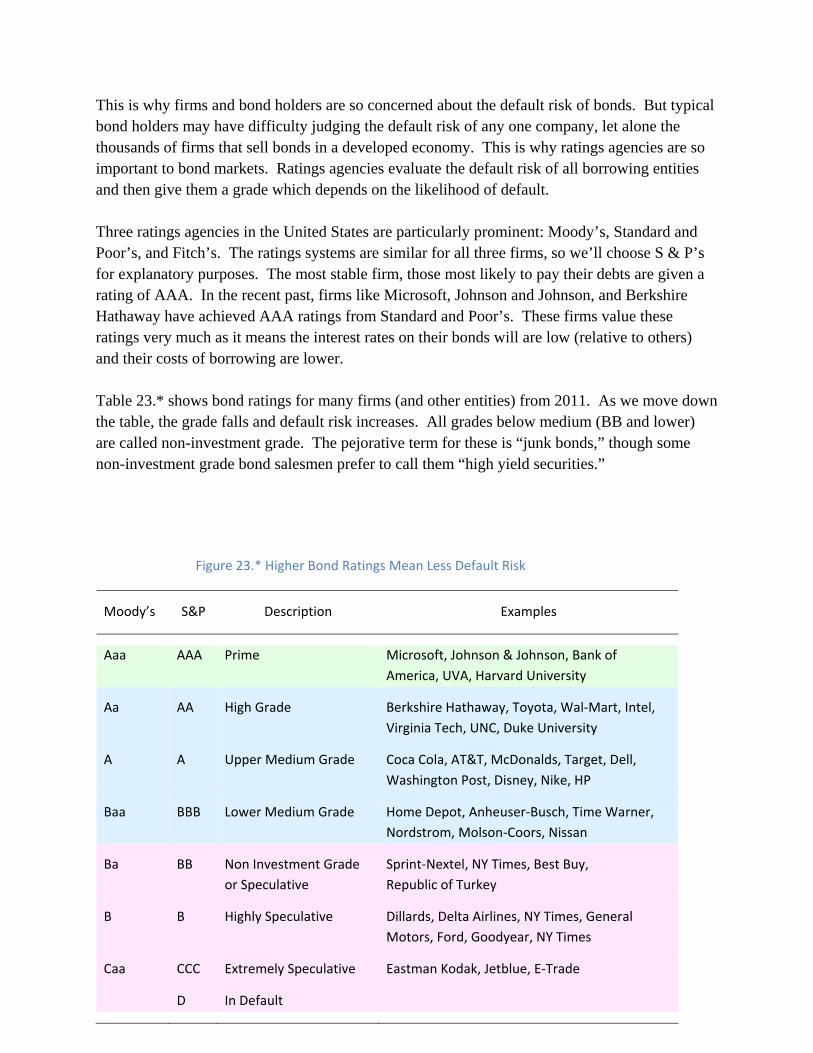
This is why firms and bond holders are so concerned about the default risk of bonds. But typical bond holders may have difficulty judging the default risk of any one company, let alone the thousands of firms that sell bonds in a developed economy. This is why ratings agencies are so important to bond markets. Ratings agencies evaluate the default risk of all borrowing entities and then give them a grade which depends on the likelihood of default. Three ratings agencies in the United States are particularly prominent: Moody’s, Standard and Poor’s, and Fitch’s. The ratings systems are similar for all three firms, so we’ll choose S & P’s for explanatory purposes. The most stable firm, those most likely to pay their debts are given a rating of AAA. In the recent past, firms like Microsoft, Johnson and Johnson, and Berkshire Hathaway have achieved AAA ratings from Standard and Poor’s. These firms value these ratings very much as it means the interest rates on their bonds will are low (relative to others) and their costs of borrowing are lower. Table 23.* shows bond ratings for many firms (and other entities) from 2011. As we move down the table, the grade falls and default risk increases. All grades below medium (BB and lower) are called non-investment grade. The pejorative term for these is “junk bonds,” though some non-investment grade bond salesmen prefer to call them “high yield securities.”
Figure 23.* Higher Bond Ratings Mean Less Default Risk
Moody’s S&P Description Examples
Aaa AAA Prime Microsoft, Johnson & Johnson, Bank of
America, UVA, Harvard University
Aa AA High Grade Berkshire Hathaway, Toyota, Wal‐Mart, Intel,
Virginia Tech, UNC, Duke University
A A Upper Medium Grade Coca Cola, AT&T, McDonalds, Target, Dell,
Washington Post, Disney, Nike, HP
Baa BBB Lower Medium Grade Home Depot, Anheuser‐Busch, Time Warner,
Nordstrom, Molson‐Coors, Nissan
Ba BB Non Investment Grade
or Speculative
Sprint‐Nextel, NY Times, Best Buy,
Republic of Turkey
B B Highly Speculative Dillards, Delta Airlines, NY Times, General
Motors, Ford, Goodyear, NY Times
Caa CCC Extremely Speculative Eastman Kodak, Jetblue, E‐Trade
D In Default

[B] Stocks Stock securities offer yet another option for firms who need funding to finance their production of output. For the purposes of macroeconomics you should view stocks simply as an alternative means by which firms fund their production of goods and services. But in an important sense, stocks are very different from bank loans or bonds. Owners of stock securities are actual owners of the firm. That’s why stocks are referred to as shares, they are ownership shares. Stock shares are ownership shares in the firm. From the firm’s point of view, stocks offer a new financing avenue, but they also involve ceding ownership of the firm. Why would a firm sell stocks, instead of bonds? Bond financing means the firms has a lot of
bills that must be paid. If the bills are unpaid (the firm defaults on their bonds) the owners may need to declare bankruptcy and lose the firm altogether. But with stocks, the owners can sell shares of the firm to others and move forward without the burden of debt from bonds. Stock ownership is also different from bond ownership. Since stock owners (share-holders) are owners of the firm, they have some influence in the operations of the firm. If a share holder owns more than 50% of the shares of the firm, they are the majority share holder and so they
control more than 50% of the ownership votes. This gives them a lot of power in determining the direction of the firm.
Are investors really able to keep up with all of this information?
Investing 101: How Efficient is the Stock Market?
What is the secret to making money in the stock market? To
answer that question and learn a little more about how the stock
market works, we will examine two competing theories: the
efficient market hypothesis and behavioral economics.
Stock shares ‐
Ownership
shares in a firm.
You can own part of Google! In April 2011, the price of a share of
Google stock was just $530 ‐but there are more than 321 million
of these shares outstanding! To see the current share price, just
Google the name of the stock’s ticker symbol: “Goog.”

[B] Secondary Markets When you or I buy a stock or bond security, we probably use brokers who buy them in secondary markets. Secondary Markets are the markets where securities are traded after their first sale.
The first theory, the efficient market hypothesis, postulates that since the stock market is comprised of
millions of investors that any profitable opportunities have already been identified and exhausted –
just like the long‐run outcome under perfect competition. Trillions of dollars are at stake and this gives
financial institutions, and individual investors alike, an enormous incentive to find good stock values
and invest in them until the stock price represents a fair return on their investment. How capable are
investors of identifying the good values from the bad ones? By most accounts quite capable, with
sophisticated computer software and terabytes of information available over the Internet, some have
argued that understanding the stock market is simply a giant simultaneous mathematics problem that
can be solved with the correct data.
One of the implications of the efficient market hypothesis is that stock prices at any given time should
always reflect their true underlying value so investors should not be able “get rich quick.
The veracity of the efficient market hypothesis has come under scrutiny by the relatively new field of
behavioral economics. Behavioral economists attribute market imperfections to cognitive biases.
Because investors are human, they are subject to biases that range from overconfidence to
overreaction. This means that stock prices are subject to wild swings based on psychology rather than
a reliance on purely scientific data. Stock market bubbles are one obvious example of behavioral forces
at work. Former Chairman of the Federal reserve coined the phrase, “irrational exuberance” in 1996 to
describe a heightened state of speculative fervor. Because the stock market is subject to behavioral
forces, investors who can time the market correctly find many profitable opportunities.
Many economists believe that the Financial Crisis of 2008 can be directly attributed to placing too
much confidence in the ability of the market and not paying enough attention to the possibility of a
market bubble breaking.
If markets work perfectly, or very nearly perfectly, participants in those markets can be highly
confident that the outcome will be beneficial to society as a whole. However, when markets are
imperfect – and all markets have at least some minor imperfections – the ideal result, from society’s
standpoint is not achieved. The stock market works nearly perfectly most of the time, but when it does
not, we need to understand what went wrong.
For further reading, we suggest the classic treatment by Burton Malkiel, A Random Walk Down Wall
Street.
The NYSE is the largest secondary stock market in the world.
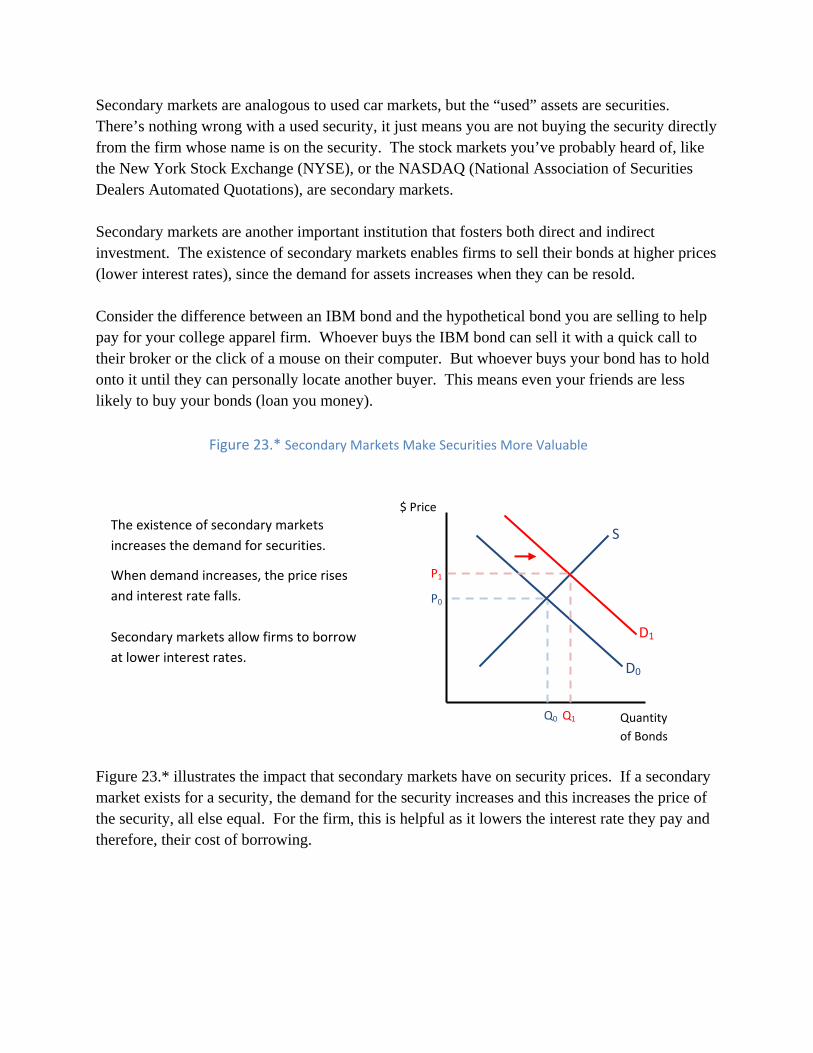
Secondary markets are analogous to used car markets, but the “used” assets are securities. There’s nothing wrong with a used security, it just means you are not buying the security directly from the firm whose name is on the security. The stock markets you’ve probably heard of, like the New York Stock Exchange (NYSE), or the NASDAQ (National Association of Securities Dealers Automated Quotations), are secondary markets. Secondary markets are another important institution that fosters both direct and indirect investment. The existence of secondary markets enables firms to sell their bonds at higher prices (lower interest rates), since the demand for assets increases when they can be resold. Consider the difference between an IBM bond and the hypothetical bond you are selling to help pay for your college apparel firm. Whoever buys the IBM bond can sell it with a quick call to their broker or the click of a mouse on their computer. But whoever buys your bond has to hold onto it until they can personally locate another buyer. This means even your friends are less likely to buy your bonds (loan you money).
Figure 23.* illustrates the impact that secondary markets have on security prices. If a secondary market exists for a security, the demand for the security increases and this increases the price of the security, all else equal. For the firm, this is helpful as it lowers the interest rate they pay and therefore, their cost of borrowing.
$ Price
Quantity
of Bonds
Figure 23.* Secondary Markets Make Securities More Valuable
D0
P0
P1
Q1 Q0
The existence of secondary markets
increases the demand for securities.
When demand increases, the price rises
and interest rate falls.
Secondary markets allow firms to borrow
at lower interest rates.
S
D1
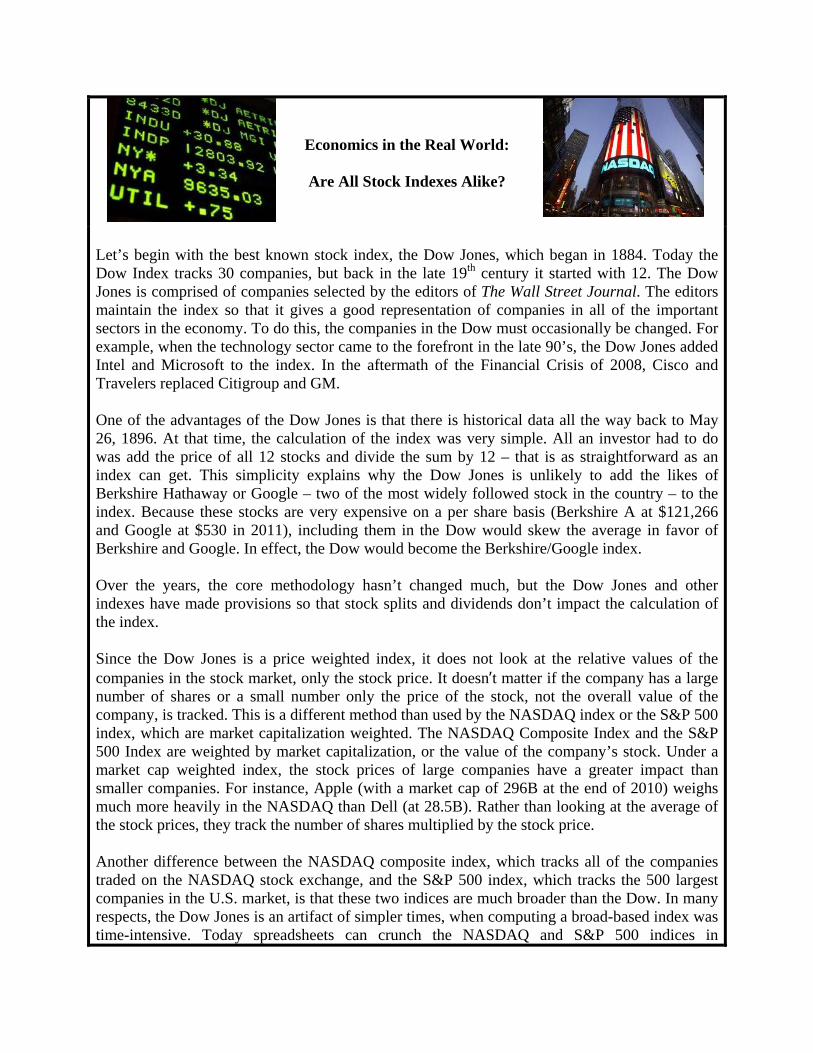
Economics in the Real World:
Are All Stock Indexes Alike?
Let’s begin with the best known stock index, the Dow Jones, which began in 1884. Today the Dow Index tracks 30 companies, but back in the late 19th century it started with 12. The Dow Jones is comprised of companies selected by the editors of The Wall Street Journal. The editors maintain the index so that it gives a good representation of companies in all of the important sectors in the economy. To do this, the companies in the Dow must occasionally be changed. For example, when the technology sector came to the forefront in the late 90’s, the Dow Jones added Intel and Microsoft to the index. In the aftermath of the Financial Crisis of 2008, Cisco and Travelers replaced Citigroup and GM. One of the advantages of the Dow Jones is that there is historical data all the way back to May 26, 1896. At that time, the calculation of the index was very simple. All an investor had to do was add the price of all 12 stocks and divide the sum by 12 – that is as straightforward as an index can get. This simplicity explains why the Dow Jones is unlikely to add the likes of Berkshire Hathaway or Google – two of the most widely followed stock in the country – to the index. Because these stocks are very expensive on a per share basis (Berkshire A at $121,266 and Google at $530 in 2011), including them in the Dow would skew the average in favor of Berkshire and Google. In effect, the Dow would become the Berkshire/Google index. Over the years, the core methodology hasn’t changed much, but the Dow Jones and other indexes have made provisions so that stock splits and dividends don’t impact the calculation of the index. Since the Dow Jones is a price weighted index, it does not look at the relative values of the companies in the stock market, only the stock price. It doesn’t matter if the company has a large number of shares or a small number only the price of the stock, not the overall value of the company, is tracked. This is a different method than used by the NASDAQ index or the S&P 500 index, which are market capitalization weighted. The NASDAQ Composite Index and the S&P 500 Index are weighted by market capitalization, or the value of the company’s stock. Under a market cap weighted index, the stock prices of large companies have a greater impact than smaller companies. For instance, Apple (with a market cap of 296B at the end of 2010) weighs much more heavily in the NASDAQ than Dell (at 28.5B). Rather than looking at the average of the stock prices, they track the number of shares multiplied by the stock price. Another difference between the NASDAQ composite index, which tracks all of the companies traded on the NASDAQ stock exchange, and the S&P 500 index, which tracks the 500 largest companies in the U.S. market, is that these two indices are much broader than the Dow. In many respects, the Dow Jones is an artifact of simpler times, when computing a broad-based index was time-intensive. Today spreadsheets can crunch the NASDAQ and S&P 500 indices in
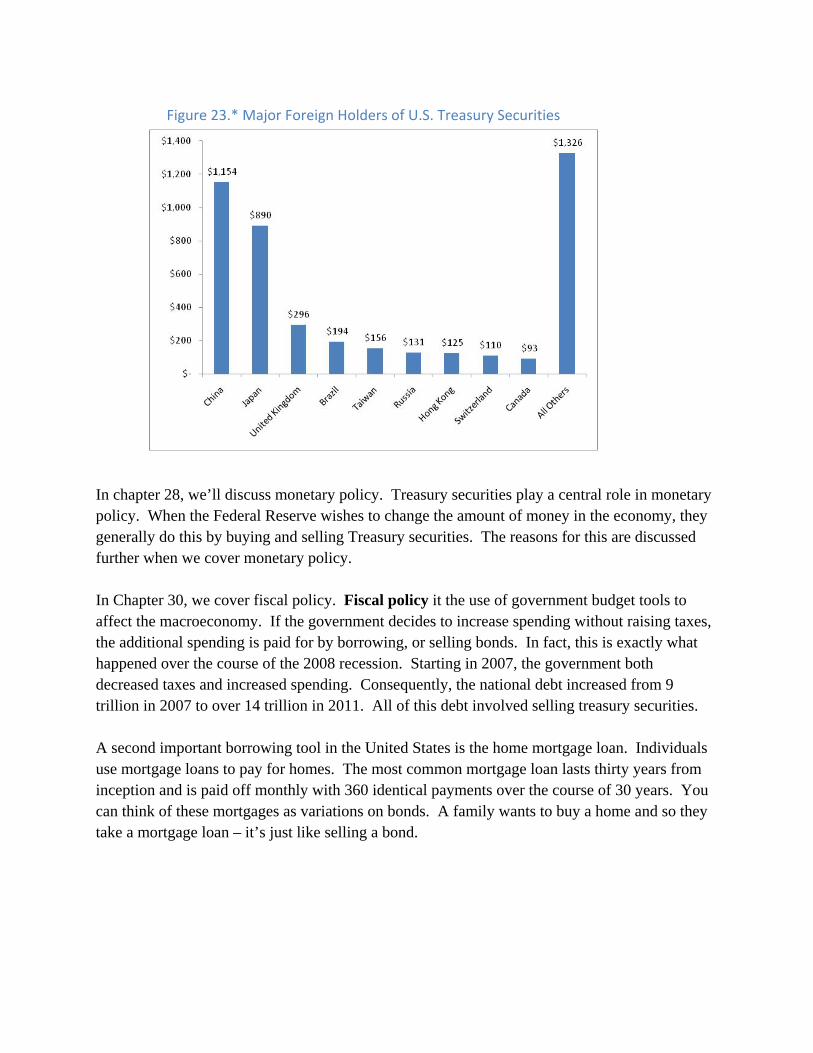
milliseconds. Nevertheless, the Dow has been a very reliable measure of market performance and it also provides a continuous record of historical information that cannot be replaced by more recent indexes. Plus, people are accustomed to the Dow and its simplicity makes is easy to understand and follow. [B] Two Special Debt Instruments Until now we’ve considered firms as the major borrowing entity in an economy. But governments are significant borrowers too. These include state, local and federal governments. The U.S. federal government has over $14 trillion worth of debt – that’s about $46,000 per citizen. Our federal government utilizes the bond market for its borrowing. The bonds the U.S. government sells are called U.S. Treasury securities. These securities turn out to be very important in macroeconomics and finance. Treasury securities are generally considered less risky than any other bond. Because of this, firms and governments from all over the world buy treasury securities as a way to hedge against the risk of other assets. In fact, in 2011, approximately $4.5 trillion (about 32%) of U.S. federal debt was held by foreigners. Figure 23.* shows the breakdown of foreign ownership of U.S. Treasury securities. The reason treasury securities are not considered risky is that nobody expects the U.S. government to default on their debts. There are times, in the midst of heated political debate, that politicians threaten actions that would lead to default. But this is generally considered just political rhetoric. Given the current state of the world economy, where foreign governments own billions of dollars worth of U.S. Treasury securities, it would almost certainly lead to a global financial meltdown if the U.S. defaulted on Treasury debt.
In chapter 28, we’ll discuss monetary policy. Treasury securities play a central role in monetary policy. When the Federal Reserve wishes to change the amount of money in the economy, they generally do this by buying and selling Treasury securities. The reasons for this are discussed further when we cover monetary policy. In Chapter 30, we cover fiscal policy. Fiscal policy it the use of government budget tools to affect the macroeconomy. If the government decides to increase spending without raising taxes, the additional spending is paid for by borrowing, or selling bonds. In fact, this is exactly what happened over the course of the 2008 recession. Starting in 2007, the government both decreased taxes and increased spending. Consequently, the national debt increased from 9 trillion in 2007 to over 14 trillion in 2011. All of this debt involved selling treasury securities. A second important borrowing tool in the United States is the home mortgage loan. Individuals use mortgage loans to pay for homes. The most common mortgage loan lasts thirty years from inception and is paid off monthly with 360 identical payments over the course of 30 years. You can think of these mortgages as variations on bonds. A family wants to buy a home and so they take a mortgage loan – it’s just like selling a bond.
Figure 23.* Major Foreign Holders of U.S. Treasury Securities
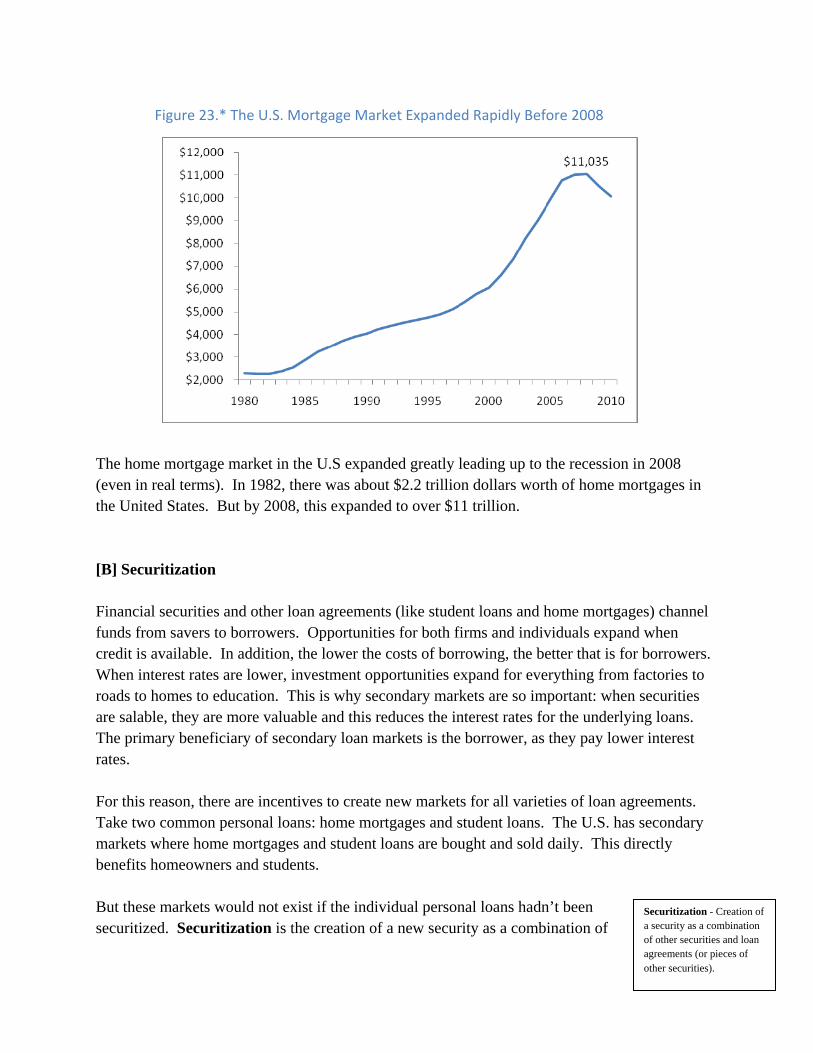
The home mortgage market in the U.S expanded greatly leading up to the recession in 2008 (even in real terms). In 1982, there was about $2.2 trillion dollars worth of home mortgages in the United States. But by 2008, this expanded to over $11 trillion. [B] Securitization Financial securities and other loan agreements (like student loans and home mortgages) channel funds from savers to borrowers. Opportunities for both firms and individuals expand when credit is available. In addition, the lower the costs of borrowing, the better that is for borrowers. When interest rates are lower, investment opportunities expand for everything from factories to roads to homes to education. This is why secondary markets are so important: when securities are salable, they are more valuable and this reduces the interest rates for the underlying loans. The primary beneficiary of secondary loan markets is the borrower, as they pay lower interest rates. For this reason, there are incentives to create new markets for all varieties of loan agreements. Take two common personal loans: home mortgages and student loans. The U.S. has secondary markets where home mortgages and student loans are bought and sold daily. This directly benefits homeowners and students. But these markets would not exist if the individual personal loans hadn’t been securitized. Securitization is the creation of a new security as a combination of
Figure 23.* The U.S. Mortgage Market Expanded Rapidly Before 2008
Securitization - Creation of a security as a combination of other securities and loan agreements (or pieces of other securities).
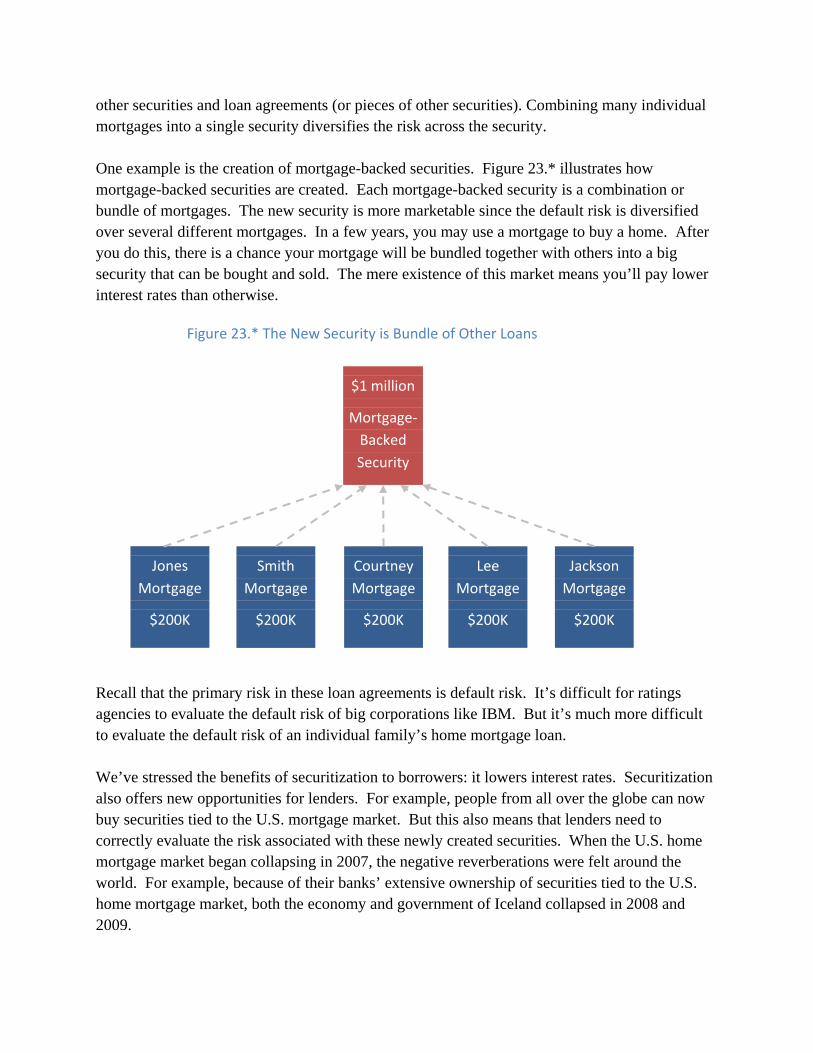
other securities and loan agreements (or pieces of other securities). Combining many individual mortgages into a single security diversifies the risk across the security. One example is the creation of mortgage-backed securities. Figure 23.* illustrates how mortgage-backed securities are created. Each mortgage-backed security is a combination or bundle of mortgages. The new security is more marketable since the default risk is diversified over several different mortgages. In a few years, you may use a mortgage to buy a home. After you do this, there is a chance your mortgage will be bundled together with others into a big security that can be bought and sold. The mere existence of this market means you’ll pay lower interest rates than otherwise.
Recall that the primary risk in these loan agreements is default risk. It’s difficult for ratings agencies to evaluate the default risk of big corporations like IBM. But it’s much more difficult to evaluate the default risk of an individual family’s home mortgage loan. We’ve stressed the benefits of securitization to borrowers: it lowers interest rates. Securitization also offers new opportunities for lenders. For example, people from all over the globe can now buy securities tied to the U.S. mortgage market. But this also means that lenders need to correctly evaluate the risk associated with these newly created securities. When the U.S. home mortgage market began collapsing in 2007, the negative reverberations were felt around the world. For example, because of their banks’ extensive ownership of securities tied to the U.S. home mortgage market, both the economy and government of Iceland collapsed in 2008 and 2009.
Figure 23.* The New Security is Bundle of Other Loans
$1 million
Mortgage‐
Backed
Security
Jones
Mortgage
$200K
Smith
Mortgage
$200K
Jackson
Mortgage
$200K
Lee
Mortgage
$200K
Courtney
Mortgage
$200K

Economics in the Media Securitization
Inside Job (2010)
Matt Daman narrates this documentary that bashes Wall Street and Washington for the economic crisis.
Inside Job explores the causes of the crisis by focusing primarily on deregulation and the incentive
structures that led to excessive risk‐taking. The film shines when it uses a series of animated figures to
explain the process of securitization and the crucial role that it played in the sub‐prime market and the
financial crisis.
The traditional relationship between home
buyers and lenders.
The securitization food chain.
Home mortgages are now held by
investors, not lenders.
The film is also excellent at describing how deregulation of the banking industry that began under
Reagan accelerated through G.W. Bush. The biggest surprise occurs when we learn that Barack Obama
appointed many of the worst offenders of the crisis to key roles in Washington and reappointed Ben
Bernanke as Fed Chair. The movie then makes the case that significant reform legislation is still missing,
and given the ties of both political parties to the financial sector, how unlikely it is that real changes in
the financial industry will materialize.
Conclusion This chapter is meant to convey the economic significance of the loanable funds market. This market is how economists view what most refer to as the financial industry. Without an efficient, stable loanable funds market, firms can’t get loans, investment dries up, and economic growth stops. The loanable funds market is where interest rates are determined, as the price that equilibrates the actions of savers and borrowers. Loan supply depends on time preferences, income and
wealth, and consumption smoothing. Loan demand depends on the productivity of capital and investor confidence. Firms can seek investment funds through indirect finance (banks) or direct finance (bonds, stocks and other financial securities). After their initial sale, financial securities trade in secondary markets. The existence of secondary markets enhances the opportunities of both borrowers and lenders. In the next chapter, we begin discussing economic growth. Financial markets play an important role in economic growth, and that’s why we cover these first. Summary
Loanable funds markets channel funds from savers to borrowers.
The supply of loanable funds comes primarily from household savings.
The quantity of loanable funds supplied is positively related to the interest rate. The supply increases income and wealth but is also impacted by consumption smoothing and time preferences.
The quantity of loanable funds demanded is negatively related to the interest rate. The demand increases with capital productivity and investor confidence.
Indirect finance is when savers and lenders utilize banks as middlemen in the market for loans. Direct finance is when borrowers go directly to lenders.
Bonds are loan contracts that are typically traded in secondary markets. Stocks are ownership shares in firms.
U.S. Treasury securities are the bonds used by the Federal government to finance the national debt.
Concepts You Should Know (add page numbers in final text) Bonds Indirect Finance Secondary Markets Consumption Smoothing Interest Rate Securitization Default Risk Investor Confidence Stocks Direct Finance Maturity Date Time Preferences Face Value Mortgage Loan U.S. Treasury Security

Questions 1. Discuss the importance of the loanable funds market to basic GDP in a macroeconomy. 2. List the factors that impact the supply side of the loanable funds market. Which factor(s) determine the slope of the supply curve? Which factor(s) impact the level of the curve? 3. List the factors that impact the demand side of the loanable funds market. Which factor(s) determine the slope of the demand curve? Which factor(s) impact the level of the curve? 4. What is the difference between direct and indirect finance. Discuss the reasons why a firm (borrower) might choose each method. Discuss the reasons why a saver might choose each. 5. Explain securitization. Discuss how securitization benefits borrowers. Problems 1. Assume foreigners decide to increase savings in the United States by buying stocks and bonds. A. What happens to the interest rate in the United States? What happens to the equilibrium level of investment in the United States? (You can use a graph to derive your answer, but to get full credit you must state your answers.) B. In the long run, how does increased foreign savings impact the levels of capital and income growth in the United States? 2. Assume the government announces inflation in 2010 will be 10 percent higher than the long run average (and everyone believes this). A. What happens to the supply of one-year loans? Why? B. What happens to the demand for one-year loans? Why? C. Use the graph below to shift the demand and supply curves in the direction you indicated in parts A and B. Label the original curves S0 and D0, and the new curves S1 and D1. In the final equilibrium, what is the impact on the interest rate? (State the direction of change.)

D. If your result from part C holds in general, what can we say about the effect of announced increases in inflation on interest rates? 3. Many developing nations are ravaged by AIDS. For example, in Zambia life expectancy at birth is now less than 40 years. How does this change affect the supply of loans, the interest rate, the level of investment, and future output in Zambia? (You can use a graph to derive your answer, but to get full credit you must state your answers.) 4. Toyota bonds are currently rated AAA, and Ford bonds are rated CCC. Suppose the price of a $1000 one-year Toyota bond is $970. A. What is the rate of return on the one-year Toyota bond? (Give a numerical answer. You may round to the nearest percent.) B. The price of a $1000 one-year Ford Bond must be: (Circle the best answer from the options below.)
i. Less than $970 ii. Greater than $970 iii. $970 iv. Insufficient information to answer this question.
C. The rate of return of a $1000 one-year Ford Bond must be: (Circle the best answer from the options below.)
i. Less than the return on the Toyota bond. ii. Greater than the return on the Toyota bond. iii. The same as the return on the Toyota bond

iv. Insufficient information to answer this question.
5. Many interest rates in the United States recently fell. A. Which of the following could have been the cause? (Circle any that are correct.) Increase in demand for loanable funds.
Increase in supply of loanable funds.
Decrease in demand for loanable funds. Decrease in supply of loanable funds. B. All else equal, what does a lower interest rate mean for firms? (briefly describe how it impacts a firm). C. What does a lower interest rate mean for savers?