Embed Size (px)
Citation preview
Loan Aversion in Education:What We Know andWhat Remains To Be LearnedBRENT EVANS
PEABODY COLLEGE, VANDERBILT UNIVERSITY
CUNY 4/21/17

IntroductionStudent loans are an important component of financing postsecondary education
Media and literature primarily focus on over-borrowing
However, some students under-borrow
Avoiding borrowing may result in suboptimal human capital investment decisions
◦ May reduce likelihood of degree completion
◦ Some of this might be rationale
We call these people loan averse◦ Focus of a Lumina Grant funded project to better understand this phenomenon
◦ With my Peabody colleagues Angela Boatman & Adela Soliz
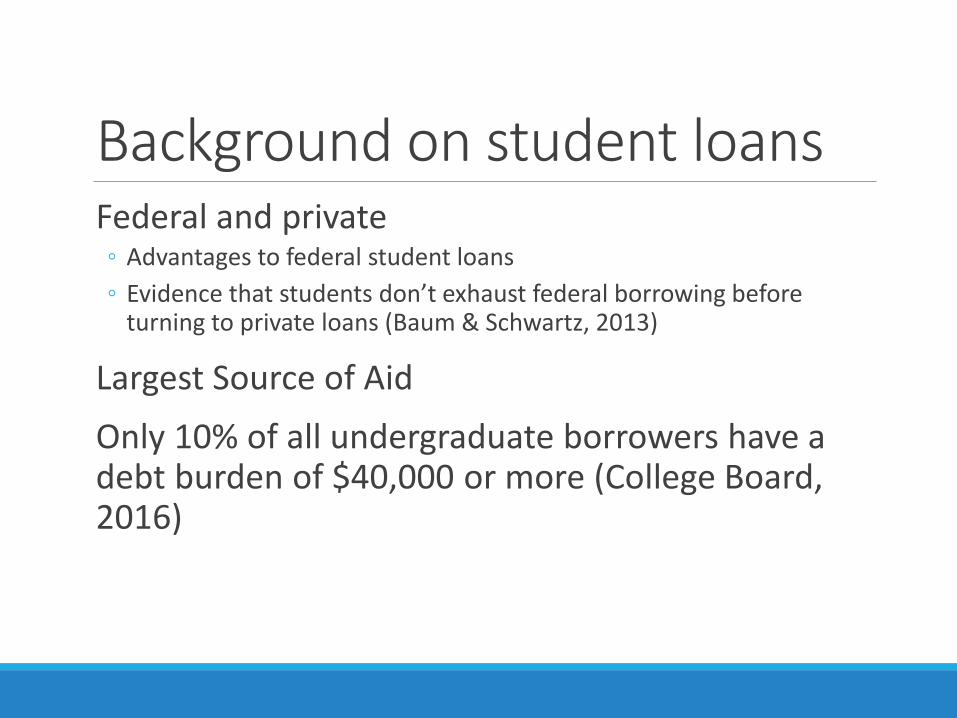
Background on student loansFederal and private◦ Advantages to federal student loans
◦ Evidence that students don’t exhaust federal borrowing before turning to private loans (Baum & Schwartz, 2013)
Largest Source of Aid
Only 10% of all undergraduate borrowers have a debt burden of $40,000 or more (College Board, 2016)

Source: College Board
Debt of BA recipients Over Time
Student Loan Figures
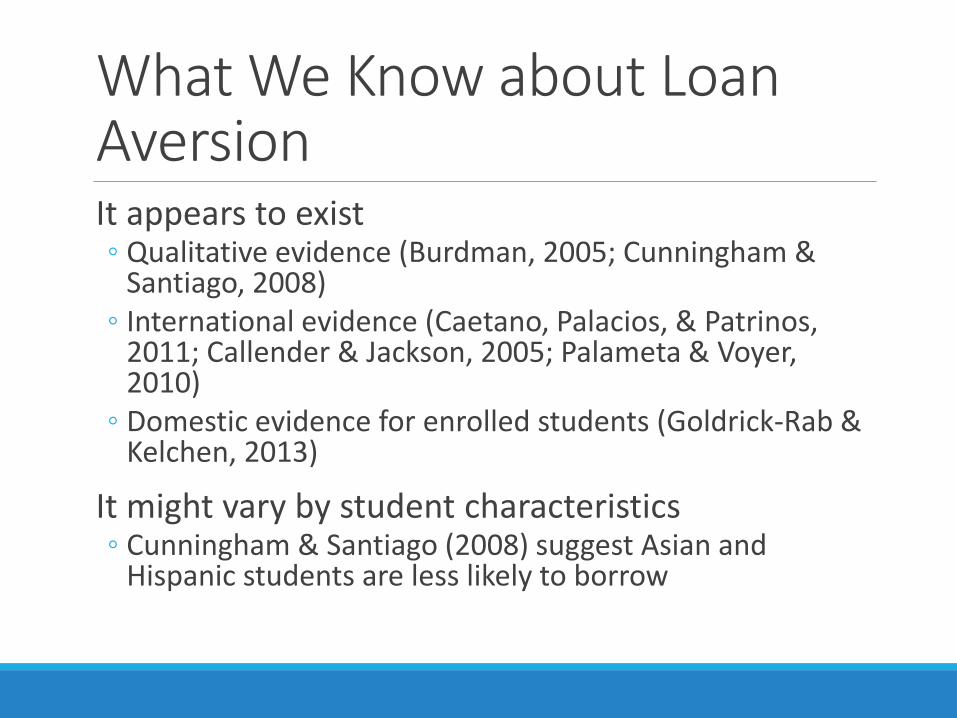
What We Know about Loan AversionIt appears to exist◦ Qualitative evidence (Burdman, 2005; Cunningham &
Santiago, 2008)◦ International evidence (Caetano, Palacios, & Patrinos,
2011; Callender & Jackson, 2005; Palameta & Voyer, 2010)
◦ Domestic evidence for enrolled students (Goldrick-Rab & Kelchen, 2013)
It might vary by student characteristics◦ Cunningham & Santiago (2008) suggest Asian and
Hispanic students are less likely to borrow

What We Would Like to Know about Loan Aversion
How widespread is it?
Does it vary across different groups and by individual characteristics?
What causes it?
Can we change it?
Does it result in underinvestment in human capital?
Our work attempts to address these questions, to varying degrees of success, using large scale quantitative data collection and analysis.
LimitationsWe observe mostly preferences not actual borrowing behavior◦ We show there is a link between preferences and
borrowing behavior with our community college sample for whom we actually observe borrowing, but it’s not perfect.
It would be great to observe borrowing behavior widely◦ Requires longitudinal data tracking students into college
We can still answer many interesting questions about borrowing preferences
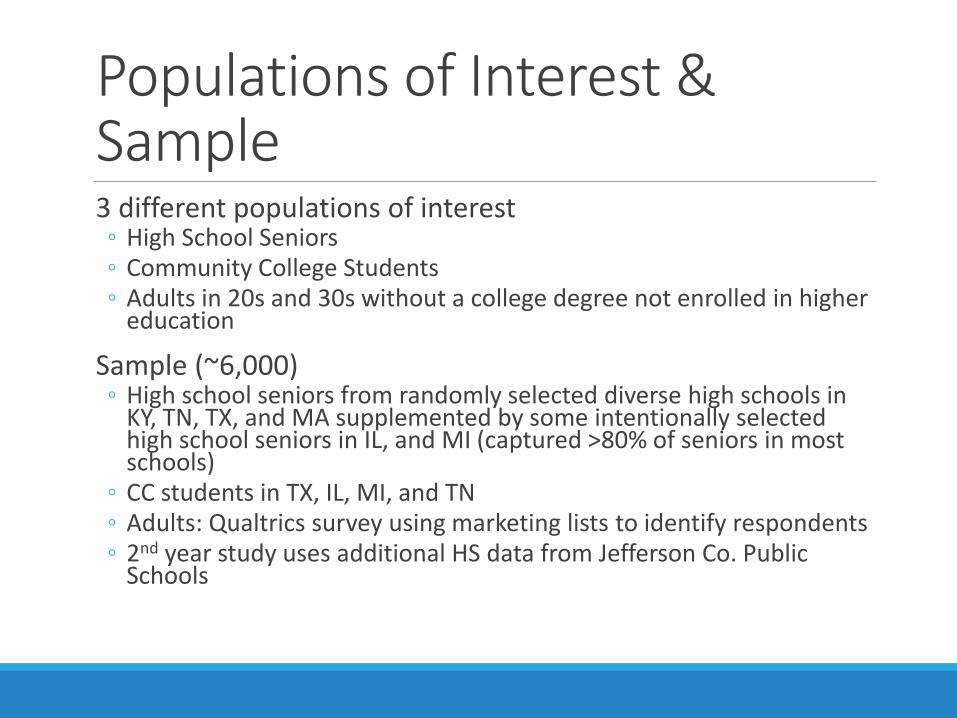
Populations of Interest & Sample3 different populations of interest◦ High School Seniors◦ Community College Students◦ Adults in 20s and 30s without a college degree not enrolled in higher
education
Sample (~6,000)◦ High school seniors from randomly selected diverse high schools in
KY, TN, TX, and MA supplemented by some intentionally selected high school seniors in IL, and MI (captured >80% of seniors in most schools)
◦ CC students in TX, IL, MI, and TN◦ Adults: Qualtrics survey using marketing lists to identify respondents◦ 2nd year study uses additional HS data from Jefferson Co. Public
Schools

Survey InstrumentCross sectional
Questions on◦ Demographics
◦ Educational expectations
◦ Loan aversion measures
◦ Financial literacy and knowledge
In person paper surveys for HS sample
Online electronic survey for CC and Adult samples
Pilot tested and reviewed by survey experts
Conducted two separate randomized control trials using the survey
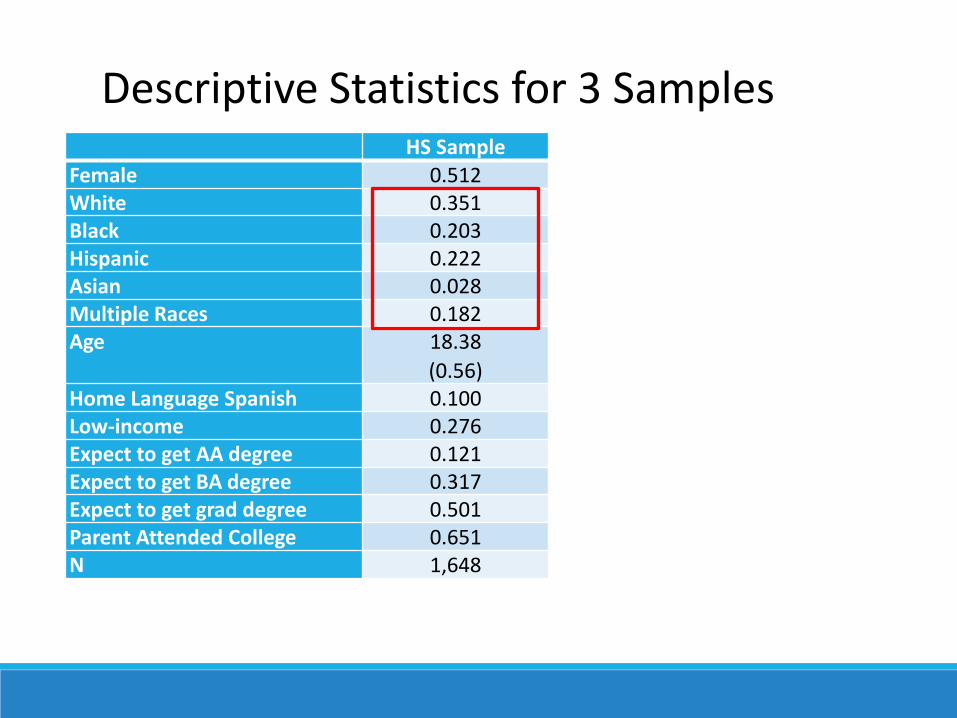
HS SampleFemale 0.512White 0.351Black 0.203Hispanic 0.222Asian 0.028Multiple Races 0.182Age 18.38
(0.56)Home Language Spanish 0.100Low-income 0.276Expect to get AA degree 0.121Expect to get BA degree 0.317Expect to get grad degree 0.501Parent Attended College 0.651N 1,648
Descriptive Statistics for 3 Samples

HS Sample CC SampleFemale 0.512 0.721White 0.351 0.447Black 0.203 0.102Hispanic 0.222 0.288Asian 0.028 0.048Multiple Races 0.182 0.067Age 18.38
(0.56)
26.33
(9.52)Home Language Spanish 0.100 0.122Low-income 0.276 0.549Expect to get AA degree 0.121 0.387Expect to get BA degree 0.317 0.603Expect to get grad degree 0.501 0.201Parent Attended College 0.651 0.596N 1,648 3,760
Descriptive Statistics for 3 Samples

HS Sample CC Sample Adult SampleFemale 0.512 0.721 0.743White 0.351 0.447 0.282Black 0.203 0.102 0.220Hispanic 0.222 0.288 0.193Asian 0.028 0.048 0.189Multiple Races 0.182 0.067 0.113Age 18.38
(0.56)
26.33
(9.52)
29.54
(5.36)Home Language Spanish 0.100 0.122 0.041Low-income 0.276 0.549 0.422Expect to get AA degree 0.121 0.387 0.271Expect to get BA degree 0.317 0.603 0.306Expect to get grad degree 0.501 0.201 0.119Parent Attended College 0.651 0.596 0.424N 1,648 3,760 843
Descriptive Statistics for 3 Samples
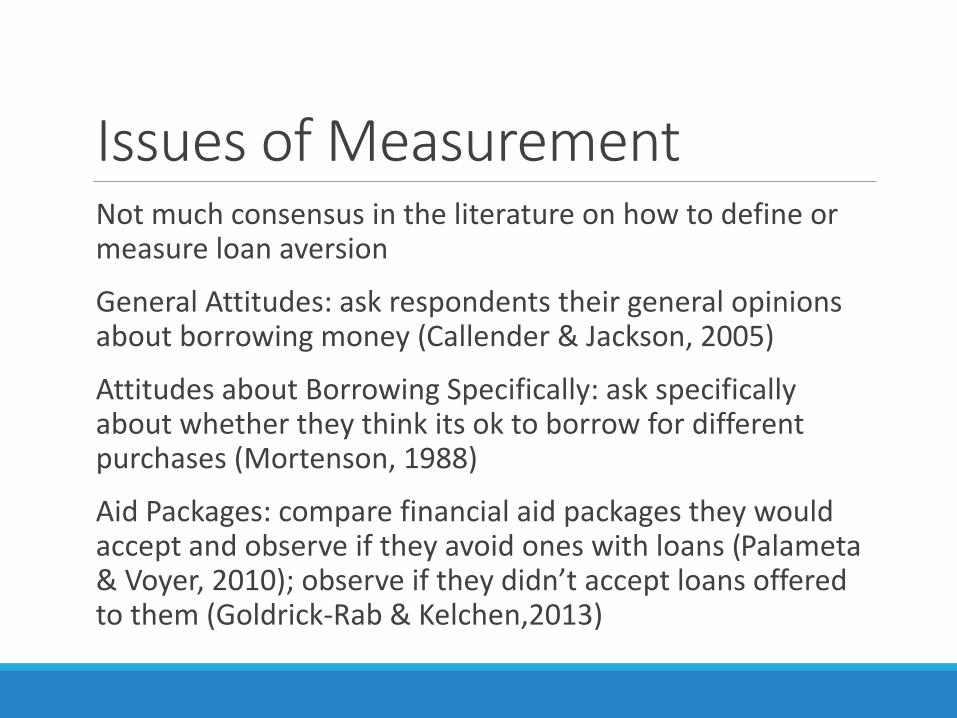
Issues of MeasurementNot much consensus in the literature on how to define or measure loan aversion
General Attitudes: ask respondents their general opinions about borrowing money (Callender & Jackson, 2005)
Attitudes about Borrowing Specifically: ask specifically about whether they think its ok to borrow for different purchases (Mortenson, 1988)
Aid Packages: compare financial aid packages they would accept and observe if they avoid ones with loans (Palameta& Voyer, 2010); observe if they didn’t accept loans offered to them (Goldrick-Rab & Kelchen,2013)

Our Loan Aversion MeasuresAttitudes (5 option Likert scale from strongly disagree to strongly agree)(Similar to Callender & Jackson, 2005)◦ You should always save up first before buying something.
◦ Owing money is basically wrong.
◦ There is no excuse for borrowing money.
Borrow for Education
◦ Do you think it’s okay to borrow money to buy or pay for education?
Aid Packages(Similar to Palameta & Voyer, 2010)◦ Would you prefer $25 cash in one week or $1,000 grant once in
college?
◦ Would you prefer $25 cash in one week or $1,000 grant + $1,000 loan once in college?
Paper 13 research questions◦ To what extent is loan aversion present among high
school students, community college students, and adults not enrolled in college?
◦ What is the relationship between different measures of loan aversion?
◦ Does loan aversion vary by individual characteristics?
Descriptive analysis of survey responses
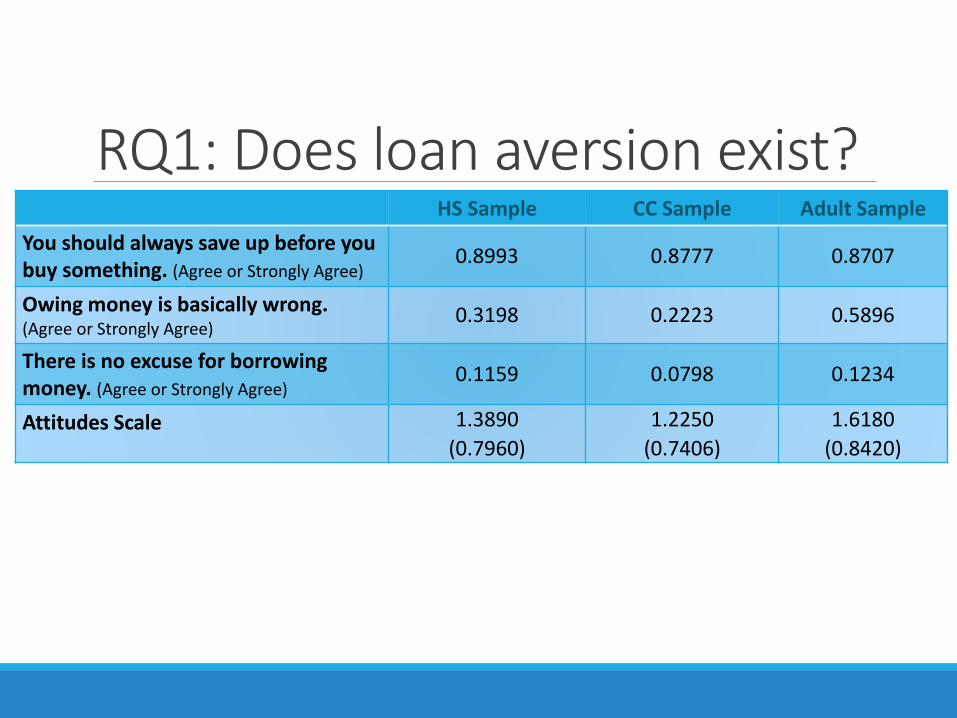
RQ1: Does loan aversion exist?HS Sample CC Sample Adult Sample
You should always save up before you buy something. (Agree or Strongly Agree)
0.8993 0.8777 0.8707
Owing money is basically wrong. (Agree or Strongly Agree)
0.3198 0.2223 0.5896
There is no excuse for borrowing money. (Agree or Strongly Agree)
0.1159 0.0798 0.1234
Attitudes Scale 1.3890
(0.7960)
1.2250
(0.7406)
1.6180
(0.8420)
Do you think it’s okay to borrow for education? (No or I don’t know)
0.2175 0.0915 0.1969
Avoid Loan Packages 0.4169 0.3479 0.2705
N 1,648 3,760 843

RQ2: Are these measures related?Not really
Highest correlation between them is 0.25 between general borrowing attitudes and borrowing for education
Suggests these are measuring different dimensions of loan aversion

RQ3: Does loan aversion vary by subgroup?Low Income Status: no difference
Gender: Women are less likely to be loan averse on the attitudes and borrowing for education measures (effect sizes of .23-.29)
Parents attended college: less loan averse
Race: Relative to white students◦ Black students more loan averse on fin aid packages◦ Hispanic students more loan averse on all measures in HS
sample◦ Asian students are less loan averse on borrowing for
education
Paper 1 SummaryLoan aversion is wide spread, although different measures provide different estimates
It’s less prevalent in students actually enrolled in college suggesting it might deter some students from enrolling
It varies by subgroup with women less loan averse and Hispanic respondents more loan averse
Next two papers explore some financial correlates and behavioral causes of loan aversion
Paper 2We demonstrated how loan aversion varies by demographics in the first paper
Now we examine financial correlates of loan aversion, specifically◦ Financial literacy◦ Financial aid knowledge◦ Credit market experience
Uses same survey responses
Divide CC sample into borrowers and non-borrowers
Focus exclusively on the borrowing for education measure of loan aversion
Although purely descriptive, these results shed light on potential causes of loan aversion

Summary of ResultsFinancial literacy is associated with reduced loan aversion for non-borrower CC students (5 pp) and adults (9-10 pp)
Knowledge about federal student loans is associated with reduced loan aversion◦ Awareness of federal student loans for high school and
community college students (3-8 pp)
◦ Awareness of subsidized interest for community college students (2 pp)
◦ Awareness of income based repayment for high school, community college non-borrowers, and adults (3-8 pp)
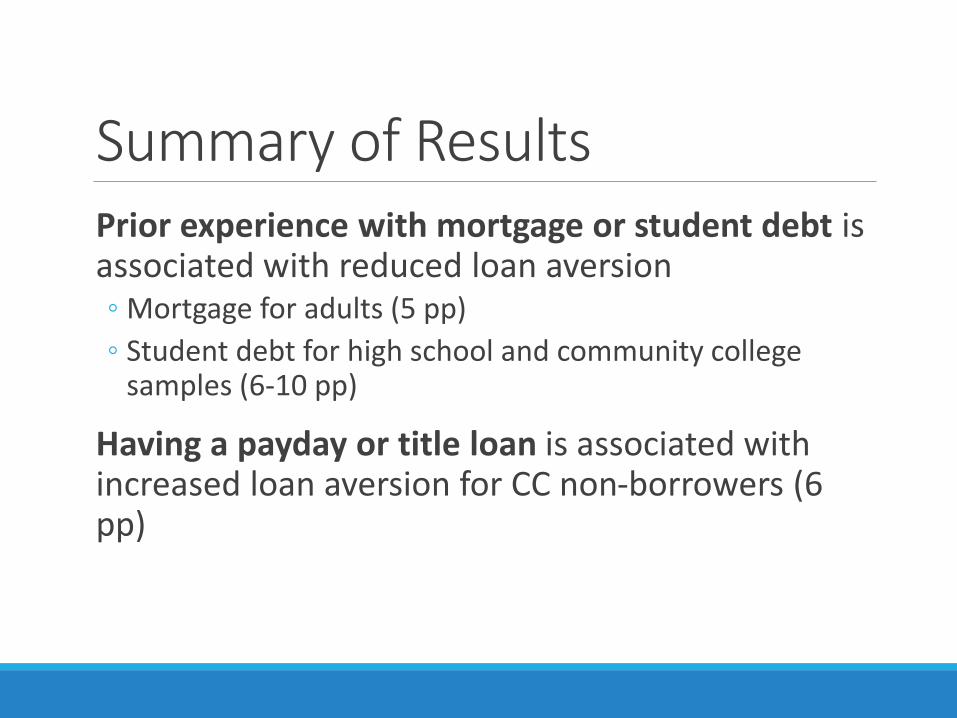
Summary of ResultsPrior experience with mortgage or student debt is associated with reduced loan aversion◦ Mortgage for adults (5 pp)
◦ Student debt for high school and community college samples (6-10 pp)
Having a payday or title loan is associated with increased loan aversion for CC non-borrowers (6 pp)

Paper 2 ConclusionsLoan aversion is related to financial characteristics including financial literacy, knowledge about federal financial aid, and prior experience in the credit market.
Not consistent across samples
Unlike demographics, these financial characteristics can be changed.
Increased knowledge may reduce loan aversion.
Policy interventions can target knowledge gaps ◦ Financial literacy courses in high school and community colleges
◦ Providing information about the benefits of federal student loans and forms income based repayment
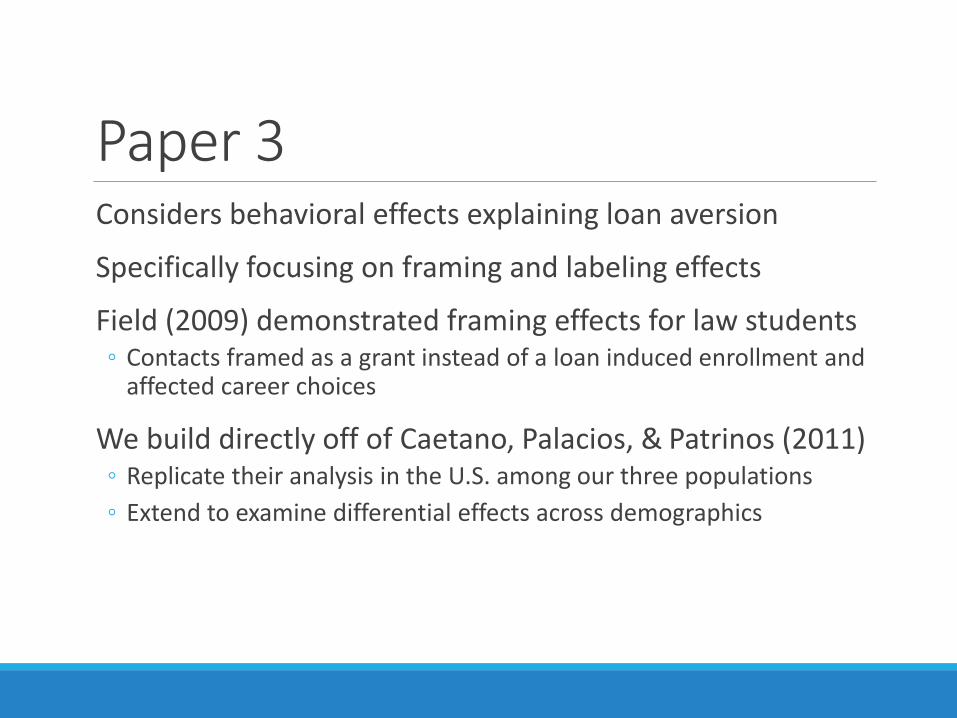
Paper 3Considers behavioral effects explaining loan aversion
Specifically focusing on framing and labeling effects
Field (2009) demonstrated framing effects for law students◦ Contacts framed as a grant instead of a loan induced enrollment and
affected career choices
We build directly off of Caetano, Palacios, & Patrinos (2011)◦ Replicate their analysis in the U.S. among our three populations
◦ Extend to examine differential effects across demographics
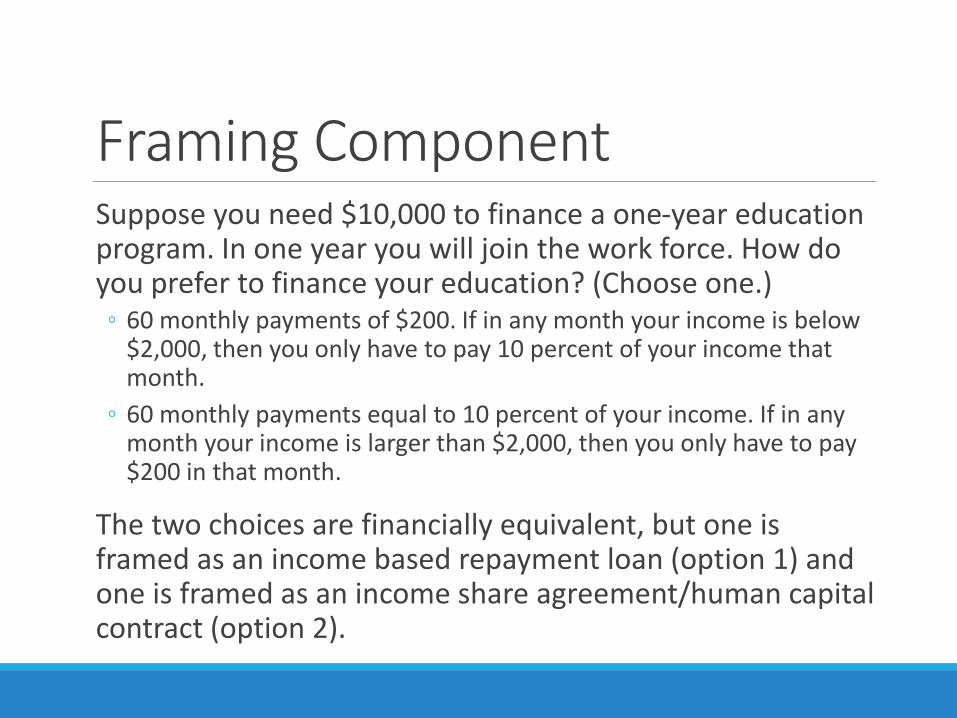
Framing ComponentSuppose you need $10,000 to finance a one-year education program. In one year you will join the work force. How do you prefer to finance your education? (Choose one.)◦ 60 monthly payments of $200. If in any month your income is below
$2,000, then you only have to pay 10 percent of your income that month.
◦ 60 monthly payments equal to 10 percent of your income. If in any month your income is larger than $2,000, then you only have to pay $200 in that month.
The two choices are financially equivalent, but one is framed as an income based repayment loan (option 1) and one is framed as an income share agreement/human capital contract (option 2).
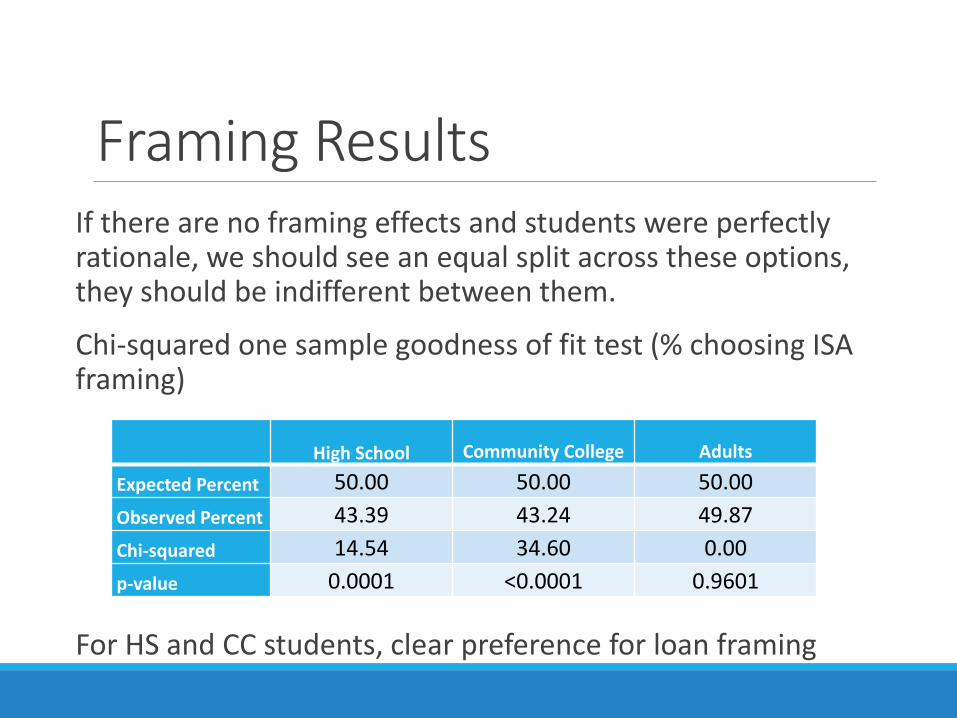
Framing ResultsIf there are no framing effects and students were perfectly rationale, we should see an equal split across these options, they should be indifferent between them.
Chi-squared one sample goodness of fit test (% choosing ISA framing)
For HS and CC students, clear preference for loan framing
High School Community College Adults
Expected Percent 50.00 50.00 50.00
Observed Percent 43.39 43.24 49.87
Chi-squared 14.54 34.60 0.00
p-value 0.0001 <0.0001 0.9601
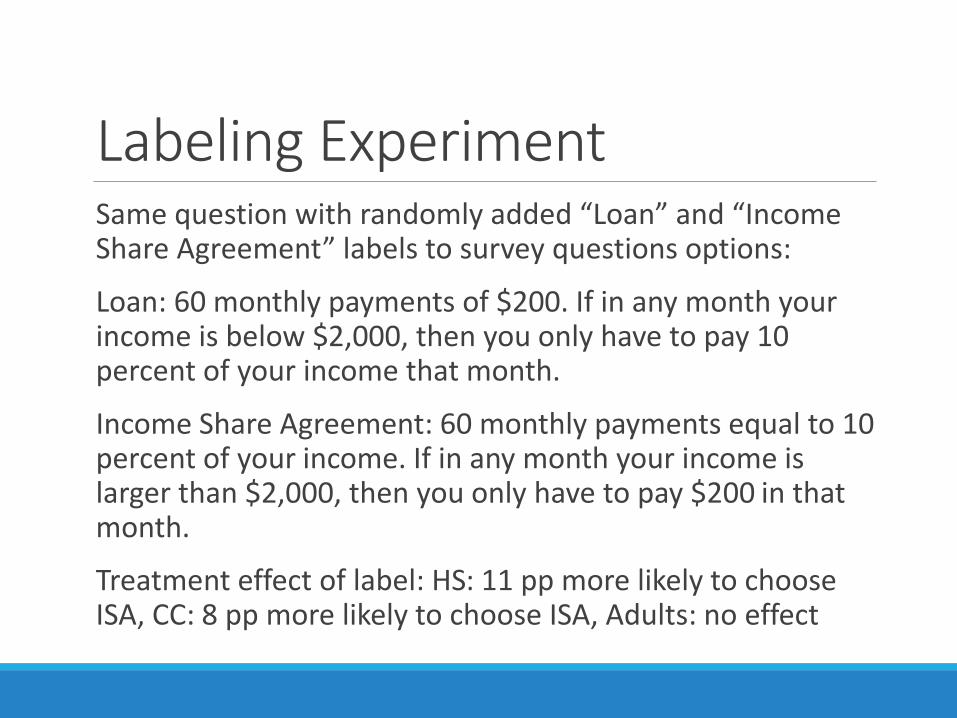
Labeling ExperimentSame question with randomly added “Loan” and “Income Share Agreement” labels to survey questions options:
Loan: 60 monthly payments of $200. If in any month your income is below $2,000, then you only have to pay 10 percent of your income that month.
Income Share Agreement: 60 monthly payments equal to 10 percent of your income. If in any month your income is larger than $2,000, then you only have to pay $200 in that month.
Treatment effect of label: HS: 11 pp more likely to choose ISA, CC: 8 pp more likely to choose ISA, Adults: no effect
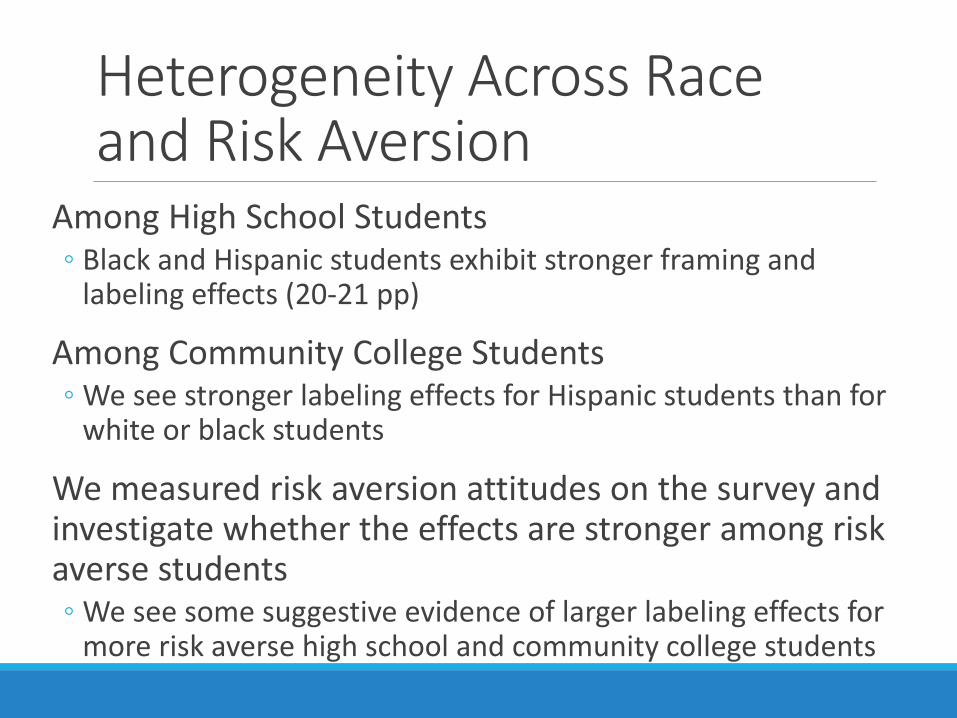
Heterogeneity Across Race and Risk Aversion
Among High School Students◦ Black and Hispanic students exhibit stronger framing and
labeling effects (20-21 pp)
Among Community College Students◦ We see stronger labeling effects for Hispanic students than for
white or black students
We measured risk aversion attitudes on the survey and investigate whether the effects are stronger among risk averse students◦ We see some suggestive evidence of larger labeling effects for
more risk averse high school and community college students
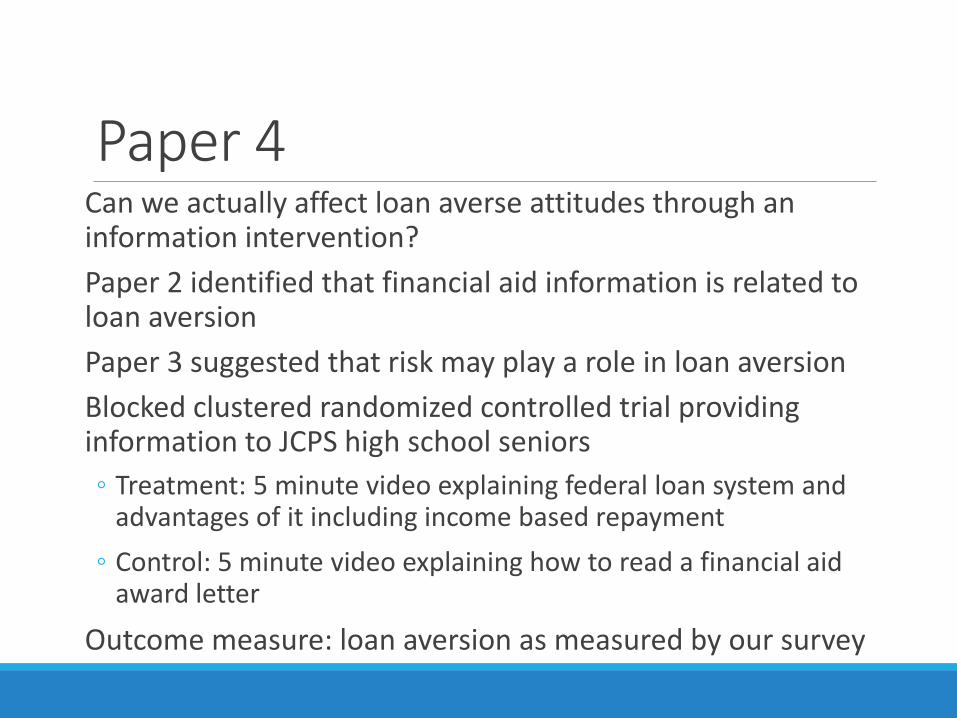
Paper 4Can we actually affect loan averse attitudes through an information intervention?
Paper 2 identified that financial aid information is related to loan aversion
Paper 3 suggested that risk may play a role in loan aversion
Blocked clustered randomized controlled trial providing information to JCPS high school seniors
◦ Treatment: 5 minute video explaining federal loan system and advantages of it including income based repayment
◦ Control: 5 minute video explaining how to read a financial aid award letter
Outcome measure: loan aversion as measured by our survey
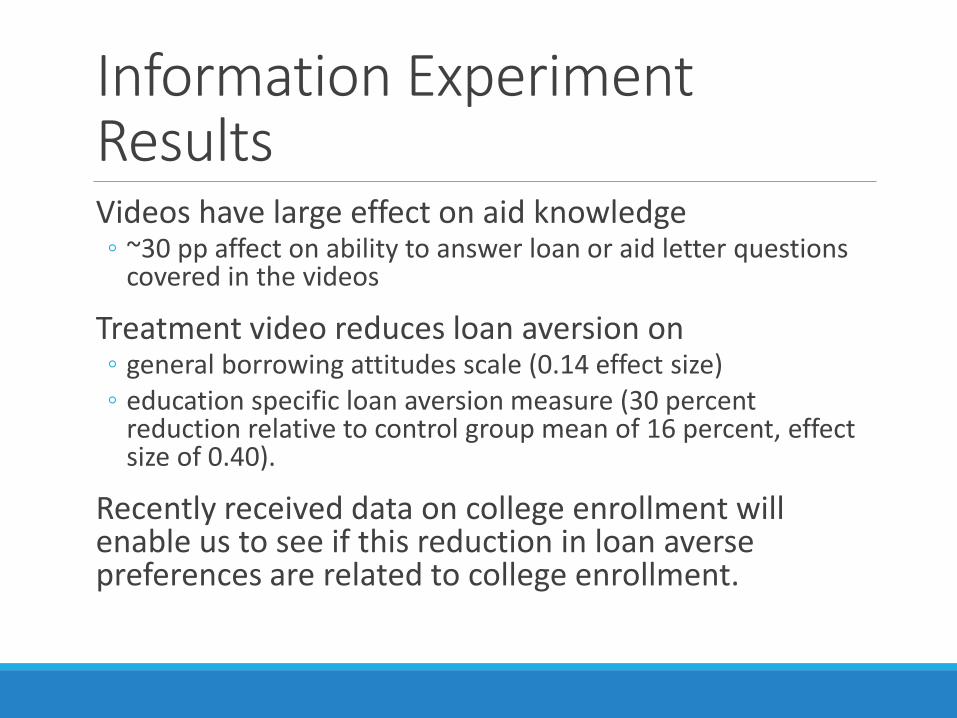
Information Experiment ResultsVideos have large effect on aid knowledge◦ ~30 pp affect on ability to answer loan or aid letter questions
covered in the videos
Treatment video reduces loan aversion on ◦ general borrowing attitudes scale (0.14 effect size)◦ education specific loan aversion measure (30 percent
reduction relative to control group mean of 16 percent, effect size of 0.40).
Recently received data on college enrollment will enable us to see if this reduction in loan averse preferences are related to college enrollment.

What have we learned?How widespread is loan aversion?
◦ It’s prevalent, although less so among enrolled community college students
Does it vary across different groups and by individual characteristics?◦ Yes, Hispanic students are particularly prone to be loan averse
What causes it?◦ Not conclusive, but evidence suggests it is related to knowledge and
information and perhaps risk
◦ Behavioral effects such as framing and labeling are also contributing
Can we change it?◦ Information changes attitudes, which is encouraging
◦ Remains to be seen if information changes borrowing and enrollment behaviors
Does it result in underinvestment in human capital?◦ We don’t’ know, we assume so, but this remains to be studied directly

Where do we go from here?Link loan averse attitudes to actual borrowing behavior◦ We scratch the surface of this by dividing our community
college sample into borrower/non-borrower
Link loan aversion with postsecondary outcomes◦ Working with TG on implementing loan aversion
measures in a survey of Texas college students which would enable us to capture some of this
◦ Need additional data sources or ways to track students longitudinally

Policy ImplicationsInformation is important◦ Increase financial literacy education
◦ Provide information on Income Based Repayment before borrowing decision not just at repayment decision
Students don’t like the framing and labeling◦ Change the language used to describe borrowing in the
literature
◦ Use Income Share Agreements
Different measures aren’t highly related, so when measuring loan aversion, do it multiple ways.

Questions/Discussion

Appendix slides1-3: paper 2 measures: fin aid lit, fin aid knowledge, and credit market history
4: paper 2 descriptives on measures
5: paper 2 main table results
6 paper 3 risk aversion results
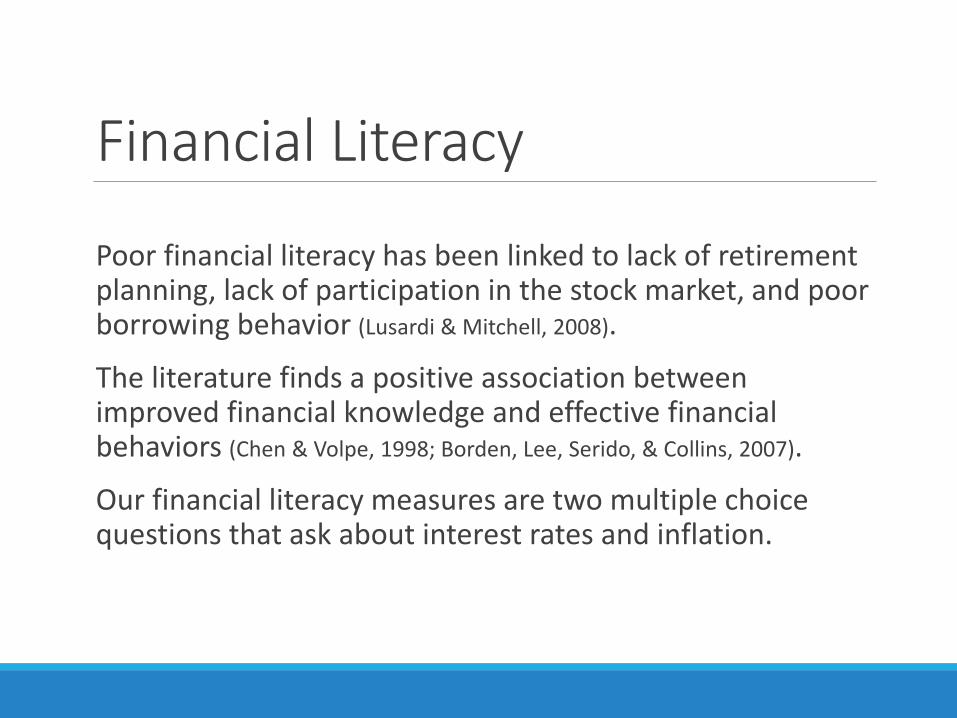
Financial Literacy
Poor financial literacy has been linked to lack of retirement planning, lack of participation in the stock market, and poor borrowing behavior (Lusardi & Mitchell, 2008).
The literature finds a positive association between improved financial knowledge and effective financial behaviors (Chen & Volpe, 1998; Borden, Lee, Serido, & Collins, 2007).
Our financial literacy measures are two multiple choice questions that ask about interest rates and inflation.

Knowledge of the Federal Loan System
Generally, federal student loans are better than private loans, but many people do not know the difference between the two forms of borrowing (CFPB, 2012).
It is common for students to take out private loans without exhausting their eligibility for federal students loans (Baum & Schwartz, 2013).
Knowledge of the federal loan system may improve borrowing decisions.
Our knowledge measures include three true/false/yes/no questions about awareness of federal student loans, subsidized interest, and income based repayment.
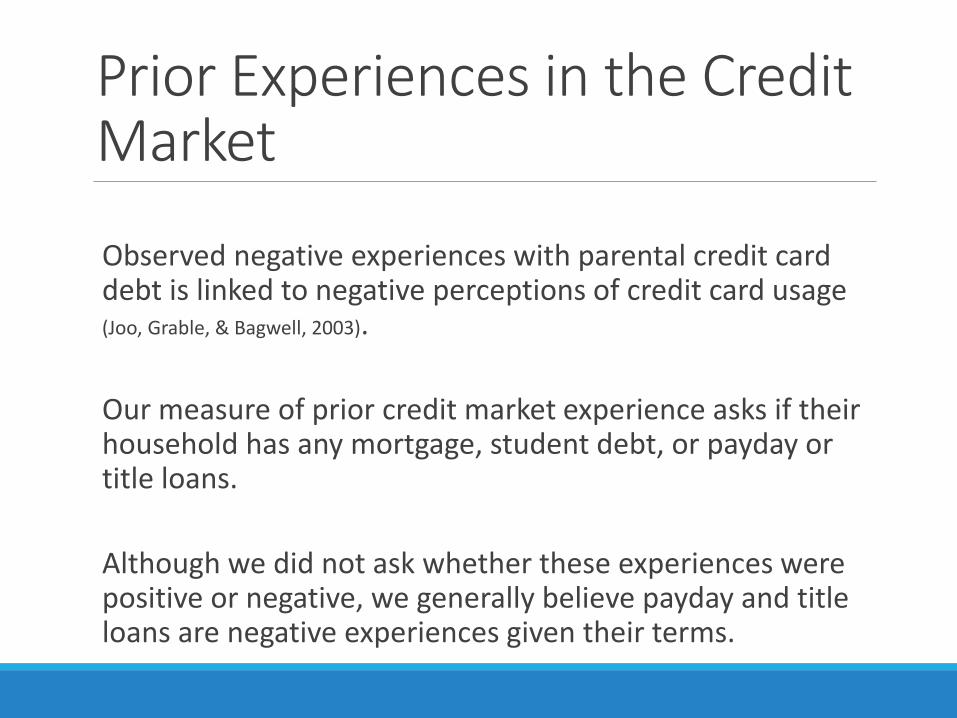
Prior Experiences in the Credit Market
Observed negative experiences with parental credit card debt is linked to negative perceptions of credit card usage (Joo, Grable, & Bagwell, 2003).
Our measure of prior credit market experience asks if their household has any mortgage, student debt, or payday or title loans.
Although we did not ask whether these experiences were positive or negative, we generally believe payday and title loans are negative experiences given their terms.

Financial CharacteristicsHS Sample CC Sample Adult Sample
Financial Literacy 0.3693 0.4363 0.3424Awareness of Federal Student
Loans 0.8333 0.8543 0.8193
Awareness of Subsidized Interest 0.2530 0.4457 0.2985Awareness of Income Based
Repayment 0.4077 0.4775 0.3757
HH has Mortgage Debt 0.2503 0.3544 0.2663
HH has Student Loans 0.1799 0.4767 0.2081
HH has Payday/Title Loans - 0.0962 0.0737
N 834 3,489 841
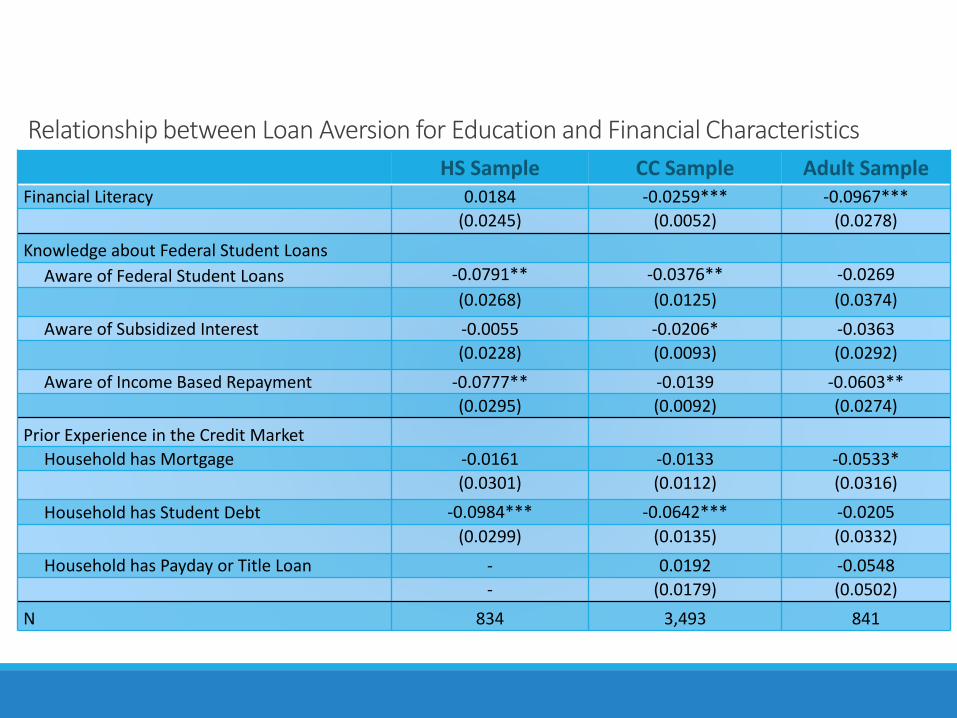
Relationship between Loan Aversion for Education and Financial Characteristics
HS Sample CC Sample Adult SampleFinancial Literacy 0.0184 -0.0259*** -0.0967***
(0.0245) (0.0052) (0.0278)
Knowledge about Federal Student Loans
Aware of Federal Student Loans -0.0791** -0.0376** -0.0269
(0.0268) (0.0125) (0.0374)
Aware of Subsidized Interest -0.0055 -0.0206* -0.0363
(0.0228) (0.0093) (0.0292)
Aware of Income Based Repayment -0.0777** -0.0139 -0.0603**
(0.0295) (0.0092) (0.0274)
Prior Experience in the Credit Market
Household has Mortgage -0.0161 -0.0133 -0.0533*
(0.0301) (0.0112) (0.0316)
Household has Student Debt -0.0984*** -0.0642*** -0.0205
(0.0299) (0.0135) (0.0332)
Household has Payday or Title Loan - 0.0192 -0.0548
- (0.0179) (0.0502)
N 834 3,493 841

Risk Seeking ―――――――――――――――――――――――――――> Risk Averse
1 2 3 4 5 6
Framing Effects – High School
Expected Percent 50.00 50.00 50.00 50.00 50.00 50.00
Observed Percent 36.21 42.86 50.00 51.61 40.95 44.62
Chi-squared 4.41 0.86 0.00 0.03 3.44 1.51
p-value 0.0356 0.3545 1.0000 0.8575 0.0637 0.2195
Labeling Effects – High School
Treatment 0.1841 0.1497 -0.0519 -0.3762 0.0489 0.1646**
(0.0903) (0.0954) (0.0425) (.01768) (0.0538) (0.0419)
Control Mean 0.3621 0.4286 0.5000 0.5161 0.4095 0. 4462
Observations 97 78 75 64 196 241
R-squared 0.2586 0.4544 0.3323 0.4542 0.1189 0.1606
Framing Effects – Community College
Expected Percent 50.00 50.00 50.00 50.00 50.00 50.00
Observed Percent 46.98 40.28 43.94 38.52 41.92 47.22
Chi-squared 0.54 2.72 1.94 6.43 4.37 1.00
p-value 0.4609 0.0990 0.1637 0.0112 0.0367 0.3173
Labeling Effects – Community College
Treatment -0.0178 0.1300 0.0445 0.1665* 0.1760*** 0.0282
(0.0545) (0.0693) (0.0590) (0.0851) (0.0357) (0.0458)
Control Mean 0.4698 0.4028 0.4394 0.3852 0.4192 0.4722
Observations 295 144 258 220 304 620
R-squared 0.1287 0.2347 0.0903 0.1007 0.1312 0.0232