Embed Size (px)
Citation preview

ABF FINAL REPORT August 1999
National Aeronautics and Space Administration Scientific and Technical Information Branch
Ground-Based and Small Payloads Research in Space Life Sciences
National Aeronautics and Space Administration
Loads Produced During the Ingression and
Egression of the Portable Foot Restraint on the Hubble Space Telescope
Susan Ramsey, NASA
Sudhakar Rajulu, Ph.D., Lockheed Martin
2101 NASA Road 1 Houston, Texas 77058
Anthropometry and Biomechanics Facility (ABF)
NASA/Johnson Space Center
SPACE HUMAN FACTORS

Table of Contents Table of Contents ........................................................................................................................................... 2 Figures............................................................................................................................................................ 3 Tables ............................................................................................................................................................. 3 Graphs ............................................................................................................................................................ 3 Abbreviations & Acronyms............................................................................................................................ 4 Acknowledgments .......................................................................................................................................... 5 1.0 Introduction .............................................................................................................................................. 6
1.1 Background .......................................................................................................................................... 6 1.2 Purposes of Study ................................................................................................................................. 7
2.0 General Methodology............................................................................................................................... 7 2.1 Subjects ................................................................................................................................................ 7 2.2 Apparatus.............................................................................................................................................. 7 2.3 Experimental Design ............................................................................................................................ 8 2.4 Experimental Procedure ....................................................................................................................... 8 2.5 Data Treatment ..................................................................................................................................... 9 2.6 Analysis ................................................................................................................................................ 9
3.0 Results .................................................................................................................................................... 13 3.1 Sustained Force and Moment Analysis .............................................................................................. 13 3.2 Spike Force and Moment Analysis..................................................................................................... 14
4.0 Discussion .............................................................................................................................................. 15 5.0 Conclusion and Application ................................................................................................................... 18 Appendix A: Comparison of Nominal versus Reduced-Load Trials ............................................................ 19 Appendix B: Additional Force and Moment Data........................................................................................ 27
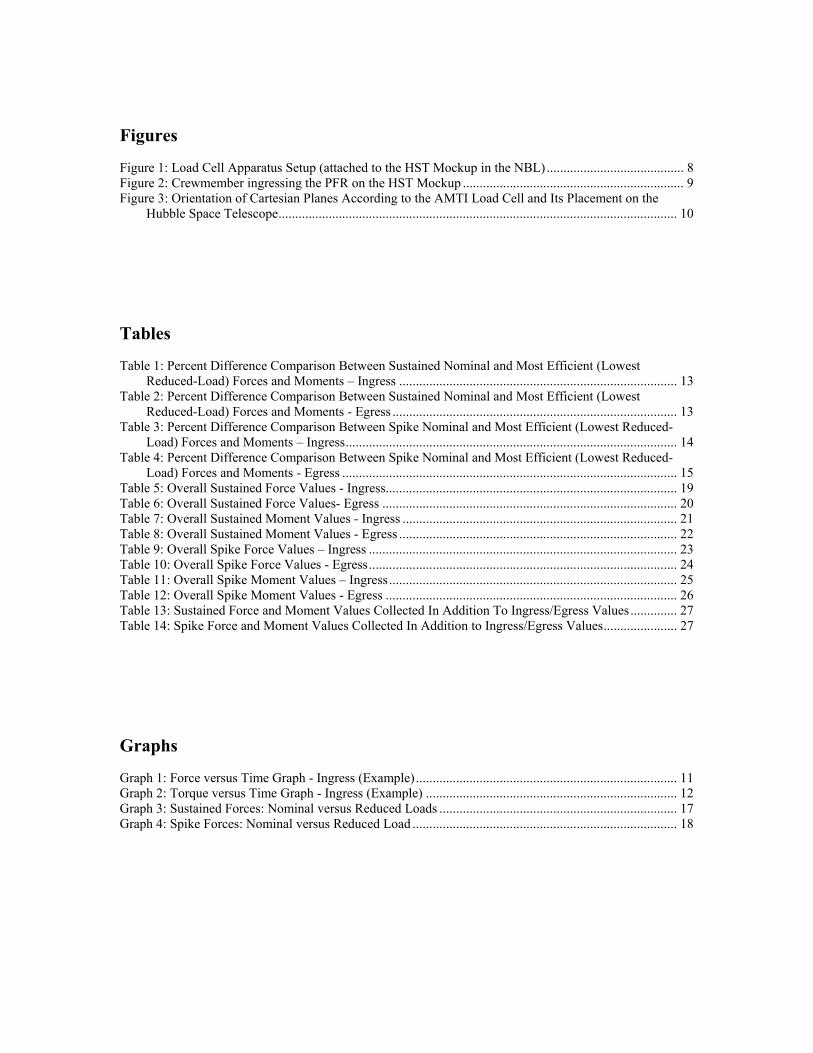
Figures Figure 1: Load Cell Apparatus Setup (attached to the HST Mockup in the NBL)......................................... 8 Figure 2: Crewmember ingressing the PFR on the HST Mockup .................................................................. 9 Figure 3: Orientation of Cartesian Planes According to the AMTI Load Cell and Its Placement on the
Hubble Space Telescope....................................................................................................................... 10 Tables Table 1: Percent Difference Comparison Between Sustained Nominal and Most Efficient (Lowest
Reduced-Load) Forces and Moments – Ingress ................................................................................... 13 Table 2: Percent Difference Comparison Between Sustained Nominal and Most Efficient (Lowest
Reduced-Load) Forces and Moments - Egress ..................................................................................... 13 Table 3: Percent Difference Comparison Between Spike Nominal and Most Efficient (Lowest Reduced-
Load) Forces and Moments – Ingress................................................................................................... 14 Table 4: Percent Difference Comparison Between Spike Nominal and Most Efficient (Lowest Reduced-
Load) Forces and Moments - Egress .................................................................................................... 15 Table 5: Overall Sustained Force Values - Ingress....................................................................................... 19 Table 6: Overall Sustained Force Values- Egress ........................................................................................ 20 Table 7: Overall Sustained Moment Values - Ingress .................................................................................. 21 Table 8: Overall Sustained Moment Values - Egress ................................................................................... 22 Table 9: Overall Spike Force Values – Ingress ............................................................................................ 23 Table 10: Overall Spike Force Values - Egress............................................................................................ 24 Table 11: Overall Spike Moment Values – Ingress...................................................................................... 25 Table 12: Overall Spike Moment Values - Egress ....................................................................................... 26 Table 13: Sustained Force and Moment Values Collected In Addition To Ingress/Egress Values.............. 27 Table 14: Spike Force and Moment Values Collected In Addition to Ingress/Egress Values...................... 27 Graphs Graph 1: Force versus Time Graph - Ingress (Example).............................................................................. 11 Graph 2: Torque versus Time Graph - Ingress (Example) ........................................................................... 12 Graph 3: Sustained Forces: Nominal versus Reduced Loads ....................................................................... 17 Graph 4: Spike Forces: Nominal versus Reduced Load ............................................................................... 18
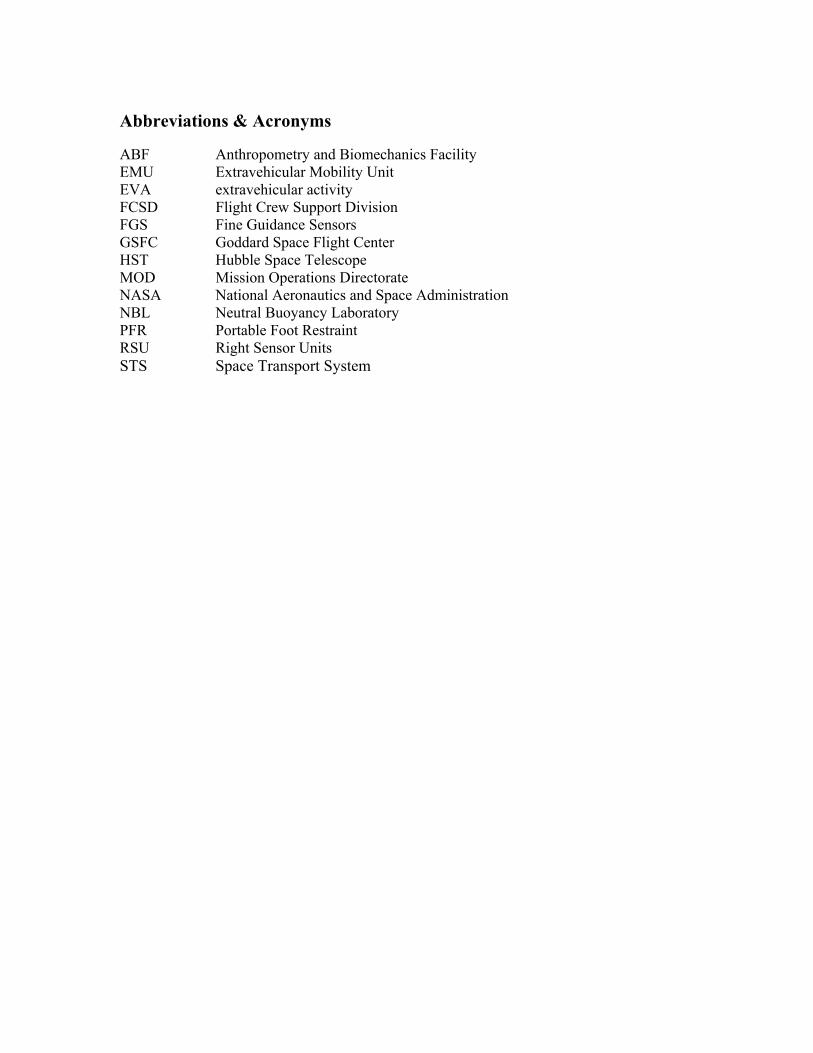
Abbreviations & Acronyms ABF Anthropometry and Biomechanics Facility EMU Extravehicular Mobility Unit EVA extravehicular activity FCSD Flight Crew Support Division FGS Fine Guidance Sensors GSFC Goddard Space Flight Center HST Hubble Space Telescope MOD Mission Operations Directorate NASA National Aeronautics and Space Administration NBL Neutral Buoyancy Laboratory PFR Portable Foot Restraint RSU Right Sensor Units STS Space Transport System

Acknowledgments The authors wish to acknowledge Erica Miles of the Anthropometry and Biomechanics Facility (ABF), Lockheed-Martin for her software and setup support; Carlos Washington of the ABF, Lockheed-Martin, for his technical and hardware support; Kieth Johnson of the EVA and Crew Systems Operations Branch, Rockwell International for proposing and planning the experiment; the crew of STS-103 for their willing participation in the study; and the Neutral Buoyancy Lab (NBL) divers and personnel for setup and communications support.

1.0 Introduction 1.1 Background The Hubble Space Telescope (HST) was the first mission of NASA's Great Observatories program. It was deployed from the space shuttle Discovery on April 25, 1990 as the primary payload of STS-31. Its is a 2.4 m, f/24 Ritchey-Chretien telescope capable of performing observations in the visible, near-ultraviolet, and near-infrared (1150 A to 1 mm). The HST weighs 12 tons, and collects light with an 8-foot-diameter mirror. The attitude control and maneuvering is performed by four of six gyroscopes, or reaction wheels. In addition, the telescope contains Fine Guidance Sensors (FGS's), which are used to lock onto guide stars to reduce the spacecraft drift and increase the pointing accuracy. Two 2.4 x 12.1 meter solar panels power the two on-board computers and scientific instruments aboard the HST. The solar panels also charge six nickel-hydrogen batteries which provide power to the spacecraft during the approximately 25 minutes in which the HST is within the Earth's shadow. The HST was designed to last 15 years, with manned service missions approximately every three years. The first service mission, STS-61, was aboard the space shuttle Endeavor in 1993, with the main purpose to repair a faulty mirror which was blurring photographs downlinked from the telescope. The second service mission, STS-82, was aboard the space shuttle Discovery in February 1997. In October 1999, the crew of STS-103 will perform the third service mission to the HST aboard the space shuttle Discovery. Although a servicing mission was planned for sometime during late 1999 or early 2000, this mission was moved up due to failing gyroscopes aboard the HST. Currently three of the six gyros have failed, and the loss of a fourth would cause a significant reduction in the telescope’s ability to collect science data. The primary purpose of this mission is to replace the Right Sensor Units (RSU's), each of which contain two gyroscopes. In addition, the crew will make improvements on the Fine Guidance Sensors to utilize the most current technology and correct the current optics problems. In order to perform these tasks on the HST, the crewmembers of STS-103 will be required to use a portable foot restraint (PFR) to anchor themselves to the HST in a zero-gravity environment. The solar arrays currently used on the telescope are second-generation, and therefore susceptible to loads placed on the telescope. There is concern from the crew and their support in Mission Operations Directorate (MOD) as to the damage that could possibly be caused during ingression and egression of the PFR and by transferring loads to the solar arrays. The purpose of this study is to inform the crewmembers of the loads they are imparting on the HST, and train them to decrease these loads to a safer level. By minimizing these loads, the crewmembers will significantly decrease the chance of causing damage to the solar arrays while repairing the HST. A similar test was successfully done with the crew of STS-82, the second HST servicing mission.
1.2 Purposes of the Study Specifically, the purposes of this study were to: 1 Determine the level of forces and moments applied to the outside of the Hubble Space
Telescope (HST) during nominal ingress and egress of the Portable Foot Restraint (PFR) by each of the crewmembers who are selected to perform extravehicular activity (EVA) work on the HST during STS-103.
2 Determine the level of forces and moments applied to the outside of the HST as each crewmember attempted to decrease their ingress and egress loads.
3 Evaluate the spike loading and sustained loading for applied forces and moments for each crewmember during each ingress and egress trial.
2.0 General Methodology 2.1 Subjects Four astronaut subjects, who will be the crewmembers qualified to perform an EVA on the STS-103 HST repair mission, participated in this study. They consisted of Mike Foale, John Grunsfeld, Claude Nicollier, and Steve Smith. 2.2 Apparatus The primary testing apparatus was a force plate setup built in the Anthropometry and Biomechanics Facility (ABF). This apparatus consisted of a small waterproof AMTI load cell mounted on two L-shaped iron angles. A PFR socket connector was used to connect this apparatus to the PFR socket on the HST. On top of the load cell, an adapted PFR socket was placed for the actual PFR testing unit to be attached. See Figure 1 for the mounted force plate setup. The entire force plate apparatus was attached to a full-size HST mockup submerged in the Neutral Buoyancy Laboratory (NBL). A PFR was then attached to the apparatus for the crewmembers to use during ingress and egress. The load cell amplifier was connected to a portable data acquisition computer. A LabVIEW-based data acquisition program was used to collect data for this experiment. Data points for force and moment were collected at a frequency 100 Hz, or at a 0.01 time interval.

Figure 1: Load Cell Apparatus Setup (attached to the HST Mockup in the NBL)
2.3 Experimental Design All of the testing took place at the Neutral Buoyancy Lab (NBL) at the Sonny Carter Training Facility at NASA – Johnson Space Center. This training facility is the most accurate simulation of a zero-gravity outer space environment available for crew training. The EMU-suited crewmembers were submerged in the NBL and appropriately weighted to achieve neutral buoyancy. The main objective of this study was to determine the loads applied to the HST during ingress and egress of the PFR by the crewmembers. Each crewmember performed a nominal ingress and egress trial, and then attempted to minimize their input loads on further trials. The crewmembers were given real-time verbal feedback of their input loads after each trial. There was no specific range of forces and moments that the crewmembers were attempting to reach. The goal of the experiment was to provide each crewmember with his own load feedback whereby he could decrease the input load on future trials. 2.4 Experimental Procedure This experiment was done in conjunction with other training efforts of the STS-103 crewmembers at the NBL. Prior to the actual experiment, one of the NBL divers submerged the load cell apparatus and connected it to the HST mockup on the eleventh PFR socket. The data acquisition computer connected to the load cell amplifier was zeroed at this point. The diver then connected the PFR to the adapted socket on the load cell apparatus, and the computer was zeroed again. This completed the setup for the experiment. Prior to beginning the experiment, each crewmember was given a verbal briefing of how the experiment would take place, and the end goal of the project. Once the crewmember and the test director signaled, the data acquisition software was activated on the computer, and the crewmember was instructed to begin nominal ingress. See Figure 2 for PFR ingress. After successful data acquisition, real-time feedback was given to the crewmember about his ingress forces for that trial. The data acquisition software was then reactivated, and the crewmember was instructed to begin nominal egress. Real-time feedback was then given about egress values. The testing was repeated with the crewmembers altering different aspects of their ingress and egress procedure each time. A minimum of one nominal trial and

three test trials of both ingress and egress were completed by each crewmember. Additional trials were performed at the crewmember's request. Data was also collected at a variety of times while the crewmember was in the PFR. Although this data was not pertinent to this test, it is beneficial to put the maximum ingress and egress values into perspective. See Appendix B for these values. This procedure was repeated for each of the four crewmembers participating in this study.
Figure 2: Crewmember ingressing the PFR on the HST Mockup
2.5 Data Treatment The raw data collected from the data acquisition computer was in columnar text file format. These columns contained time, force, and moment data, respectively. A single file was created for each individual trial. For the purposes of analysis, each of the files was opened into a Microsoft Excel spreadsheet format and analyzed using spreadsheet tools. 2.6 Analysis The data from each of these trials was analyzed for sustained and spike forces and moments. Spike loads and moments capture the sudden jerk motions transmitted to the HST. Sustained loads and moments capture the summed average of all nominal and jerk forces and moments exerted during ingress and egress. The sustained data will be used to determine if the overall load was reduced due to training. The spike data will determine whether crewmembers were able to prevent any unnecessary impulses to the HST during ingress and egress. The sustained force was defined as the average force during the given trial in a given direction. Sustained force values were calculated based on absolute-value figures for each
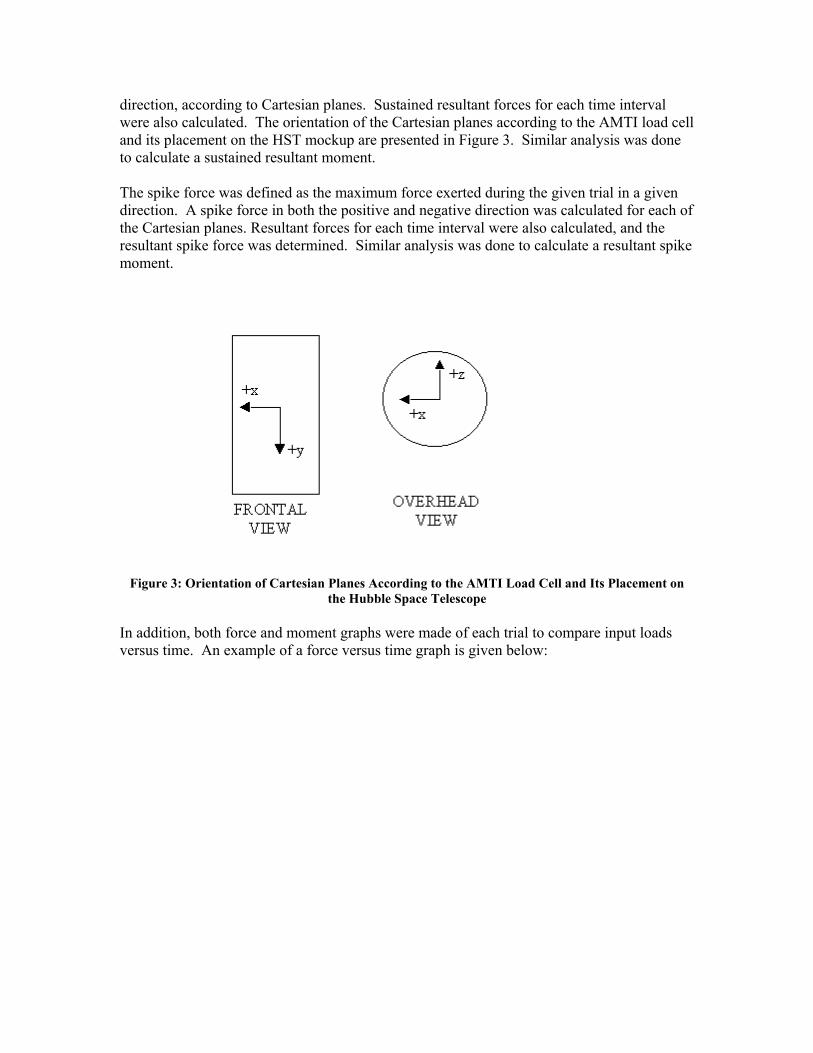
direction, according to Cartesian planes. Sustained resultant forces for each time interval were also calculated. The orientation of the Cartesian planes according to the AMTI load cell and its placement on the HST mockup are presented in Figure 3. Similar analysis was done to calculate a sustained resultant moment. The spike force was defined as the maximum force exerted during the given trial in a given direction. A spike force in both the positive and negative direction was calculated for each of the Cartesian planes. Resultant forces for each time interval were also calculated, and the resultant spike force was determined. Similar analysis was done to calculate a resultant spike moment.
Figure 3: Orientation of Cartesian Planes According to the AMTI Load Cell and Its Placement on the Hubble Space Telescope
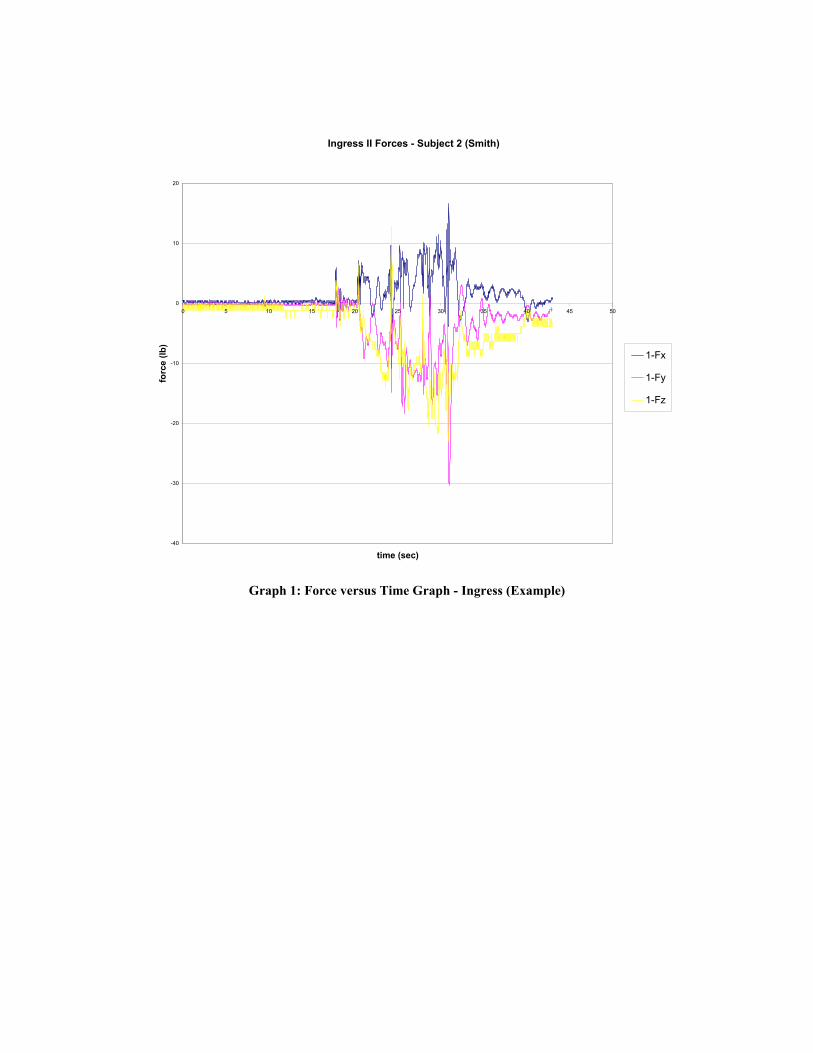
In addition, both force and moment graphs were made of each trial to compare input loads versus time. An example of a force versus time graph is given below:
Ingress II Forces - Subject 2 (Smith)
-40
-30
-20
-10
0
10
20
0 5 10 15 20 25 30 35 40 45 50
time (sec)
forc
e (lb
)
1-Fx
1-Fy
1-Fz
Graph 1: Force versus Time Graph - Ingress (Example)

Similar graphs were also generated for torque versus time, or moment data.
Ingress II Moments - Subject 2 (Smith)
-800
-600
-400
-200
0
200
400
600
0 5 10 15 20 25 30 35 40 45 50
time (sec)
torq
ue (i
n-lb
)
1-Mx1-My1-Mz
Graph 2: Torque versus Time Graph - Ingress (Example)

3.0 Results 3.1 Sustained Force and Moment Analysis The sustained force and moment analysis was performed for every trial completed by the four test subjects. A percentage comparison was done between the nominal and subsequent reduced-load trials for the forces and moments in each direction. See Appendix A for this comparison. A comparison between the nominal load and the most efficient, or lowest reduced-load, is given in the charts below. The nominal sustained resultant force (Nom. Rf) is the average resultant force measured during the crewmembers’ first attempt at ingress or egress. The lowest, or most efficient, reduced-load (Min Rf) the smallest sustained resultant force measured during one of the trials. These two values are compared for ingress and egress below. A similar comparison is also made between the nominal sustained resultant moment (Nom. Rm) and the lowest reduced-load (Min Rm) moment.
Table 1: Percent Difference Comparison Between Sustained Nominal and Most Efficient (Lowest Reduced-Load) Forces and Moments – Ingress
Reduced-Load Force Reduced-Load Moment
Subject Nominal Minimum Diff. Nominal Minimum Diff. 1 15.1 12.0 20% 391.3 258.1 34% 2 7.9 8.4 -7% 231.8 201.6 13% 3 20.6 12.8 38% 547.9 354.9 35% 4 9.7 6.6 33% 242.9 180.4 26%
AVG. 13.3 10.0 21% 353.5 248.8 27%
Table 2: Percent Difference Comparison Between Sustained Nominal and Most Efficient (Lowest Reduced-Load) Forces and Moments - Egress
Reduced-Load Force Reduced-Load Moment
Subject Nominal Minimum Diff. Nominal Minimum Diff. 1 8.7 6.5 26% 184.7 161.6 12% 2 7.7 11.1 -45% 216.7 313.5 -45% 3 15.2 15.5 -2% 279.3 388.9 -39% 4 10.5 8.6 18% 213.0 167.5 21%
AVG. 10.5 10.4 -1% 223.4 257.9 -12% From these tables, it can be seen that the nominal loads during ingress were significantly higher than those during nominal egress. As a result of this training exercise, however, crewmembers were able to decrease their sustained resultant force and moment much more significantly during ingress than egress. During ingress, they were able to achieve a

21% decrease in force, and a 27% decrease in moment. During egress, however, two of the subjects were not able to decrease their forces or moments in any of their reduced-load trials from their nominal trial. This greatly affected the average percent difference for the four subjects. Although Subject 1 and Subject 4 were able to decrease their egress sustained resultant force through this training, the overall difference between the nominal and reduced-load force trials for egress was nearly zero. Similar patterns were seen for moment data, with the average reduced-load moment data actually greater than the average nominal moment data. 3.2 Spike Force and Moment Analysis Spike force and moment analysis was also performed for every trial completed by the four test subjects. A percentage comparison was done between the nominal and reduced-load trials for the forces and moments in each direction. See Appendix A for this comparison. A comparison between the nominal load and the most efficient, or lowest reduced-load, is given in the charts below. The nominal spike resultant force (Nom. Rf) is the maximum resultant force measured during the crewmembers’ first attempt at ingress or egress. The lowest, or most efficient, reduced-load (Min Rf) the smallest maximum resultant force measured during one of the trials. For the Min Rf, the maximum resultant was calculated for each of the ingress and egress trials. The trial with the smallest maximum value was used for the Min Rf. The Nom Rf and Min Rf values are compared for ingress and egress below. A similar comparison is also made between the nominal sustained resultant moment (Nom. Rm) and the lowest reduced-load (Min Rm) moment.
Table 3: Percent Difference Comparison Between Spike Nominal and Most Efficient (Lowest Reduced-Load) Forces and Moments – Ingress
Reduced-Load Force Reduced-Load Moment
Subject Nominal Minimum Diff. Nominal Minimum Diff. 1 68.0 38.9 43% 1580.3 928.6 41% 2 42.1 31.0 26% 840.9 544.3 35% 3 92.2 37.8 59% 2177.0 1170.6 46% 4 68.3 30.7 55% 1056.9 546.0 48%
AVG. 67.6 34.6 46% 1413.8 797.4 43%

Table 4: Percent Difference Comparison Between Spike Nominal and Most Efficient (Lowest Reduced-Load) Forces and Moments - Egress
Reduced-Load Force Reduced-Load Moment
Subject Nominal Minimum Diff. Nominal Minimum Diff. 1 28.3 16.6 41% 611.8 334.1 45% 2 25.2 19.7 22% 756.7 590.6 22% 3 67.5 48.8 28% 1405.4 1288.8 8% 4 26.4 35.0 -33% 659.1 749.2 -14%
AVG. 36.8 30.0 15% 858.3 740.6 15% Similar to the sustained forces and moments, it can be seen that the nominal ingress loads were significantly greater than the nominal egress loads. However, this study provided training that enabled the crewmembers to decrease their spike resultant force and moment much more significantly during ingress than egress. During ingress, they were able to achieve a 46% decrease in force, and a 43% decrease in moment. Different from the sustained load analysis, most of the subjects were able to decrease their resultant input forces and moments through reduced-load trials during egress. Subject 4, however, continuously had higher resultant force and moment data for each of the reduced-load trials after his nominal trial during egress. The overall average percent difference for both spike resultant forces and moments was 15%. Although the training was not able to substantially affect the crewmembers' ability to decrease input loads during egress, the overall forces and moments applied to the HST during egress were still lower than those applied during ingress. 4.0 Discussion The purpose of this study was to provide real-time training feedback for the crewmembers of STS-103 in an effort to decrease the loads applied to the HST during an EVA. As shown in both the sustained and spike data, the ingress loads were substantially higher than the egress loads during the nominal trial; therefore, it was more important during this exercise for the crewmembers to focus on decreasing ingress loads. This training was highly successful in providing information to the crewmembers that allowed them to adjust their ingress procedure and decrease their input loads. Surprisingly, the training was not nearly as effective during egress, as there was not a significant decrease in the either the forces or moments created during these trials. Despite the varying effectiveness of the training, however, the end spike forces and moments applied during egress remained lower than the end spike forces and moments applied during ingress. This was due, in part, to the constant trend of egress loads to be significantly lower than ingress loads, particularly during the nominal trial. Graphs are given below to show the decrease in force values between the nominal and reduced-load trials for ingress and egress. Graph 3 shows the values for sustained force,

and Graph 4 shows the values for spike force. As displayed visually on these graphs, the decrease in force for ingress is much more significant than for egress, but the final values for both ingress and egress are similar.

9
1 0
1 1
1 2
1 3
1 4
N o m in a l R e d u c e d -L o a d
T r ia l
Forc
e (lb
)
In g re s sE g re s s
Graph 3: Sustained Forces: Nominal versus Reduced Loads

20
30
40
50
60
70
Nominal Reduced-Load
Trial
Forc
e (lb
)
IngressEgress
Graph 4: Spike Forces: Nominal versus Reduced Load
5.0 Conclusion and Application During their extravehicular activities, the crew of STS-103 will be required to ingress and egress the portable foot restraint on the Hubble Space Telescope. Through the verbal real-time feedback given during this test, the crew can now feel more comfortable and familiar with the loads they are applying to the HST during different body positions and scenarios. The analysis of the data gathered during this testing proves that the subjects were able to significantly reduce the loads that they were originally applying to the HST. Overall the training was substantially more successful for decreasing ingress loads, but the egress loads were relatively low even during the nominal trials. The end result ingress and egress loads for each of the subjects were very similar to one another. The Mission Operations Directorate (MOD) counterparts working with the crew of STS-103 felt that these reduced-loads achieved by the crewmembers were sufficient for the safe completion of each EVA during this HST repair mission. The data has been transferred to another analysis group at Goddard Space Flight Center (GSFC) for further analysis of the exact loads being put on the solar arrays of the HST during the crewmembers' ingress and egress. Overall, this study was successful in providing real-time training feedback to the crewmembers, and well as producing data which showed the crewmembers' ability to adjust their input loads during ingress and egress of a PFR. This data can be used in future missions by mission planners concerned about the input loads to an object during EVA.

Appendix A: Comparison of Nominal versus Reduced-Load Trials
Table 5: Overall Sustained Force Values - Ingress This chart displays the directional and resultant sustained force (lb) values for each of the four test subjects
during each of their trials ingressing the PFR.
Subject Trial Fx Fy Fz R Fx Diff Fy Diff Fz Diff R Diff
1 Nominal 7.7 7.7 7.4 13.14 0% 0% 0% 0% Ingress II 6.2 7.1 7.4 12.00 19% 8% -1% 9% Ingress III 5.1 6.8 6.9 10.98 34% 12% 6% 16% Ingress IV 6.0 7.5 7.3 12.10 21% 3% 0% 8%
2 Nominal 3.5 4.2 4.5 7.06 0% 0% 0% 0% Ingress II 2.9 4.9 7.0 9.03 19% -17% -57% -28% Ingress III 3.4 4.4 5.3 7.66 3% -4% -18% -9% Ingress IV 4.9 6.9 7.0 10.98 -39% -65% -57% -56%
3 Nominal 7.9 10.8 12.9 18.58 0% 0% 0% 0% Ingress II 5.2 8.2 9.9 13.88 34% 24% 23% 25% Ingress III 4.7 6.1 8.9 11.77 41% 43% 31% 37% Ingress IV 5.5 7.3 10.8 14.16 30% 33% 16% 24% Ingress V 5.0 6.1 11.9 14.30 36% 43% 8% 23%
4 Nominal 4.0 5.3 5.5 8.64 0% 0% 0% 0% Ingress II 4.9 5.8 5.2 9.22 -24% -9% 6% -7% Ingress III 3.3 3.1 3.6 5.73 18% 42% 35% 34% Ingress IV 4.1 4.6 3.8 7.28 -4% 14% 31% 16%

Table 6: Overall Sustained Force Values- Egress
This chart displays the directional and resultant sustained force (lb) values for each of the four test subjects during each of their trials egressing the PFR.
Subject Trial Fx Fy Fz R Fx Diff Fy Diff Fz Diff R Diff 1 Nominal 4.1 5.0 4.2 7.76 0% 0% 0% 0% Egress II 4.0 4.4 2.9 6.64 3% 12% 31% 14% Egress III 3.0 3.3 3.6 5.72 28% 34% 14% 26% Egress IV 3.4 4.6 3.8 6.85 19% 8% 11% 12%
2 Nominal 4.1 4.3 3.2 6.76 0% 0% 0% 0% Egress II 5.9 9.8 7.5 13.65 -44% -129% -131% -102% Egress III 3.3 7.4 6.5 10.42 21% -74% -102% -54% Egress IV 4.8 8.9 5.8 11.68 -16% -109% -79% -73%
3 Nominal 8.4 8.6 5.7 13.24 0% 0% 0% 0% Egress II 5.6 8.2 10.6 14.54 33% 4% -88% -10% Egress III 7.2 11.9 13.5 19.38 14% -39% -139% -46% Egress IV 4.9 11.7 13.4 18.44 41% -36% -137% -39% Egress V 8.1 11.9 15.1 20.84 3% -38% -167% -57%
4 Nominal 4.4 5.3 6.2 9.25 0% 0% 0% 0% Egress II 5.7 8.6 5.4 11.63 -28% -63% 13% -26% Egress III 6.2 6.5 5.8 10.69 -41% -22% 6% -16% Egress IV 4.1 5.0 4.2 7.73 6% 5% 32% 16%

Table 7: Overall Sustained Moment Values - Ingress
This chart displays the directional and resultant sustained moment (in-lb) values for each of the four test subjects during each of their trials ingressing the PFR.
Subject Trial Mx My Mz R Mx Diff My Diff Mz Diff R Diff 1 Nominal 164.4 219.5 199.0 338.88 0% 0% 0% 0% Ingress II 149.9 215.6 131.9 293.89 9% 2% 34% 13% Ingress III 137.2 173.3 129.0 255.93 17% 21% 35% 24% Ingress IV 139.1 155.2 116.7 238.91 15% 29% 41% 30%
2 Nominal 60.9 144.2 145.2 213.50 0% 0% 0% 0% Ingress II 67.4 205.2 154.8 265.77 -11% -42% -7% -24% Ingress III 54.8 133.0 113.8 183.41 10% 8% 22% 14% Ingress IV 95.1 199.3 152.1 268.16 -56% -38% -5% -26%
3 Nominal 306.9 328.4 234.3 506.87 0% 0% 0% 0% Ingress II 218.9 265.3 146.6 373.90 29% 19% 37% 26% Ingress III 199.8 251.8 101.7 337.12 35% 23% 57% 33% Ingress IV 241.3 292.5 143.2 405.35 21% 11% 39% 20% Ingress V 129.5 412.9 169.2 464.59 58% -26% 28% 8%
4 Nominal 146.7 102.1 120.8 215.70 0% 0% 0% 0% Ingress II 121.2 112.3 145.5 220.19 17% -10% -20% -2% Ingress III 102.7 78.9 90.4 158.00 30% 23% 25% 27% Ingress IV 112.8 105.5 137.9 207.00 23% -3% -14% 4%

Table 8: Overall Sustained Moment Values - Egress
This chart displays the directional and resultant sustained moment (in-lb) values for each of the four test subjects during each of their trials egressing the PFR.
Subject Trial Mx My Mz R Mx Diff My Diff Mz Diff R Diff 1 Nominal 70.0 94.9 115.5 165.10 0% 0% 0% 0% Egress II 56.0 98.5 81.8 139.73 20% -4% 29% 15% Egress III 60.1 134.8 74.1 165.15 14% -42% 36% 0% Egress IV 96.3 107.9 144.5 204.43 -38% -14% -25% -24%
2 Nominal 100.6 113.1 134.0 202.19 0% 0% 0% 0% Egress II 168.8 217.3 208.3 345.07 -68% -92% -55% -71% Egress III 61.5 205.9 191.5 287.89 39% -82% -43% -42% Egress IV 74.0 183.0 291.2 351.77 27% -62% -117% -74%
3 Nominal 138.3 145.0 159.7 256.24 0% 0% 0% 0% Egress II 181.5 231.6 222.0 368.63 -31% -60% -39% -44% Egress III 237.3 335.8 291.3 503.98 -72% -132% -82% -97% Egress IV 246.8 334.6 304.6 515.39 -78% -131% -91% -101% Egress V 289.1 361.1 264.3 532.77 -109% -149% -66% -108%
4 Nominal 124.0 121.9 63.5 185.10 0% 0% 0% 0% Egress II 207.3 160.9 189.2 323.50 -67% -32% -198% -75% Egress III 174.9 312.2 215.0 417.49 -41% -156% -238% -126% Egress IV 98.6 81.5 78.4 150.05 20% 33% -23% 19%

Table 9: Overall Spike Force Values – Ingress
This chart displays the directional and resultant spike force (lb) values for each of the four test subjects during each of their trials ingressing the PFR.
Subject Trial Fx Fy Fz R Fx Diff Fy Diff Fz Diff R Diff 1 Nominal 37.4 42.7 45.1 72.45 0% 0% 0% 0% Ingress II 34.3 31.3 42.1 62.67 8% 27% 7% 13% Ingress III 22.7 31.3 29.3 48.49 39% 27% 35% 33% Ingress IV 30.0 37.0 28.0 55.25 20% 13% 38% 24%
2 Nominal 25.3 20.8 39.8 51.52 0% 0% 0% 0% Ingress II 16.7 30.4 23.0 41.58 34% -46% 42% 19% Ingress III 19.8 16.0 24.3 35.17 22% 23% 39% 32% Ingress IV 19.7 31.3 21.7 42.88 22% -50% 45% 17%
3 Nominal 54.5 89.3 66.2 123.79 0% 0% 0% 0% Ingress II 33.4 31.7 35.5 58.13 39% 64% 46% 53% Ingress III 30.6 29.6 44.4 61.57 44% 67% 33% 50% Ingress IV 41.9 23.9 43.2 64.78 23% 73% 35% 48% Ingress V 24.8 26.1 30.3 47.07 55% 71% 54% 62%
4 Nominal 24.1 41.9 66.4 82.14 0% 0% 0% 0% Ingress II 25.2 21.6 52.3 61.92 -4% 48% 21% 25% Ingress III 20.9 15.9 29.7 39.65 13% 62% 55% 52% Ingress IV 15.7 28.1 29.2 43.49 35% 33% 56% 47%

Table 10: Overall Spike Force Values - Egress
This chart displays the directional and resultant spike force (lb) values for each of the four test subjects during each of their trials egressing the PFR.
Subject Trial Fx Fy Fz R Fx Diff Fy Diff Fz Diff R Diff 1 Nominal 19.6 25.6 15.6 35.83 0% 0% 0% 0% Egress II 14.1 15.4 9.2 22.82 28% 40% 41% 36% Egress III 17.5 18.7 18.1 31.38 11% 27% -16% 12% Egress IV 17.1 18.4 11.3 27.60 13% 28% 27% 23%
2 Nominal 12.7 22.6 16.6 30.76 0% 0% 0% 0% Egress II 27.4 28.3 24.3 46.28 -116% -25% -46% -50% Egress III 9.9 15.4 14.0 23.07 22% 32% 15% 25% Egress IV 15.4 25.0 20.5 35.78 -22% -11% -23% -16%
3 Nominal 54.5 57.8 26.5 83.75 0% 0% 0% 0% Egress II 27.6 32.6 34.2 54.71 49% 44% -29% 35% Egress III 37.4 38.6 43.2 68.92 31% 33% -63% 18% Egress IV 20.8 35.0 29.1 50.05 62% 39% -10% 40% Egress V 25.1 45.5 34.2 62.22 54% 21% -29% 26%
4 Nominal 18.6 24.5 22.0 37.88 0% 0% 0% 0% Egress II 24.4 41.0 40.0 62.28 -31% -67% -81% -64% Egress III 34.2 35.0 39.5 62.91 -84% -43% -79% -66% Egress IV 16.0 30.2 16.9 38.16 14% -23% 23% -1%
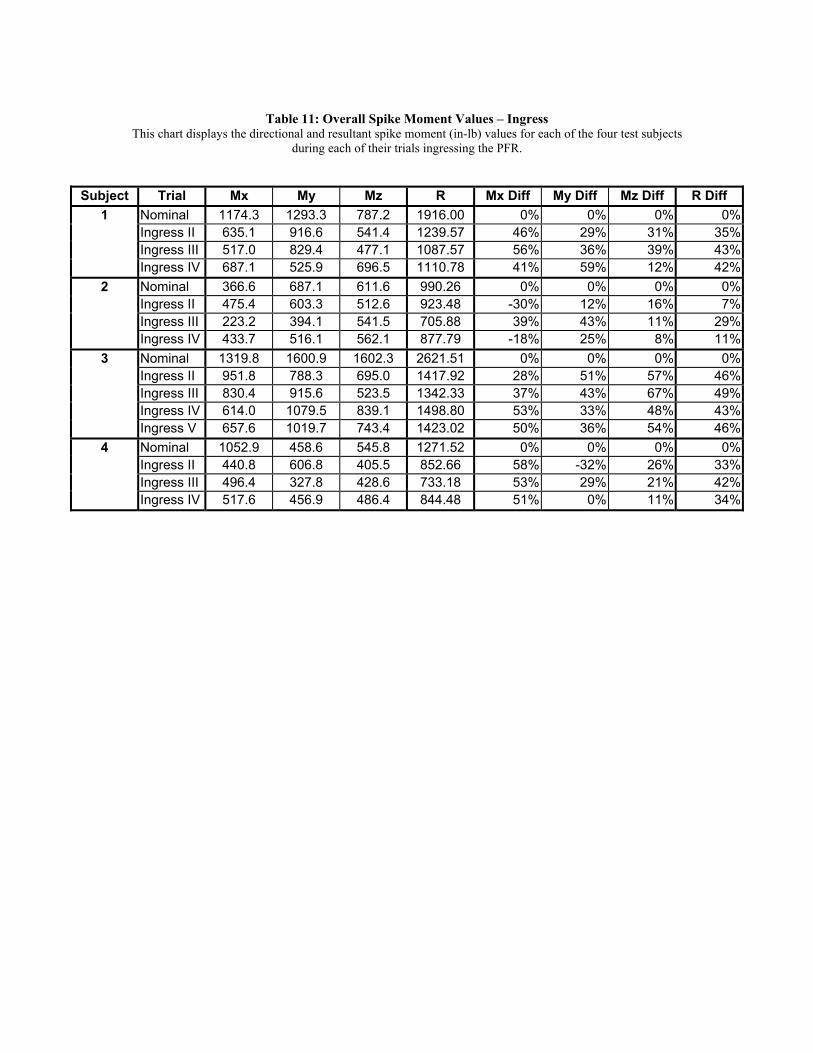
Table 11: Overall Spike Moment Values – Ingress
This chart displays the directional and resultant spike moment (in-lb) values for each of the four test subjects during each of their trials ingressing the PFR.
Subject Trial Mx My Mz R Mx Diff My Diff Mz Diff R Diff 1 Nominal 1174.3 1293.3 787.2 1916.00 0% 0% 0% 0% Ingress II 635.1 916.6 541.4 1239.57 46% 29% 31% 35% Ingress III 517.0 829.4 477.1 1087.57 56% 36% 39% 43% Ingress IV 687.1 525.9 696.5 1110.78 41% 59% 12% 42%
2 Nominal 366.6 687.1 611.6 990.26 0% 0% 0% 0% Ingress II 475.4 603.3 512.6 923.48 -30% 12% 16% 7% Ingress III 223.2 394.1 541.5 705.88 39% 43% 11% 29% Ingress IV 433.7 516.1 562.1 877.79 -18% 25% 8% 11%
3 Nominal 1319.8 1600.9 1602.3 2621.51 0% 0% 0% 0% Ingress II 951.8 788.3 695.0 1417.92 28% 51% 57% 46% Ingress III 830.4 915.6 523.5 1342.33 37% 43% 67% 49% Ingress IV 614.0 1079.5 839.1 1498.80 53% 33% 48% 43% Ingress V 657.6 1019.7 743.4 1423.02 50% 36% 54% 46%
4 Nominal 1052.9 458.6 545.8 1271.52 0% 0% 0% 0% Ingress II 440.8 606.8 405.5 852.66 58% -32% 26% 33% Ingress III 496.4 327.8 428.6 733.18 53% 29% 21% 42% Ingress IV 517.6 456.9 486.4 844.48 51% 0% 11% 34%

Table 12: Overall Spike Moment Values - Egress This chart displays the directional and resultant spike moment (in-lb) values for each of the four test subjects
during each of their trials egressing the PFR.
Subject Trial Mx My Mz R Mx Diff My Diff Mz Diff R Diff 1 Nominal 403.7 398.6 451.7 725.16 0% 0% 0% 0% Egress II 187.6 271.0 293.3 441.20 54% 32% 35% 39% Egress III 217.7 572.7 354.3 707.75 46% -44% 22% 2% Egress IV 387.5 307.6 450.0 668.77 4% 23% 0% 8%
2 Nominal 353.9 352.2 575.3 761.77 0% 0% 0% 0% Egress II 574.9 737.6 644.6 1135.82 -62% -109% -12% -49% Egress III 182.7 418.5 459.8 648.04 48% -19% 20% 15% Egress IV 283.3 453.4 753.5 923.87 20% -29% -31% -21%
3 Nominal 875.5 601.6 992.0 1453.39 0% 0% 0% 0% Egress II 767.9 770.9 833.6 1370.68 12% -28% 16% 6% Egress III 777.1 1044.6 916.1 1591.99 11% -74% 8% -10% Egress IV 668.4 814.5 912.8 1394.00 24% -35% 8% 4% Egress V 845.4 859.8 912.8 1512.33 3% -43% 8% -4%
4 Nominal 557.7 451.7 262.0 764.00 0% 0% 0% 0% Egress II 1074.9 545.8 420.4 1276.72 -93% -21% -60% -67% Egress III 916.4 905.0 601.8 1421.63 -64% -100% -130% -86% Egress IV 624.8 327.8 285.6 761.20 -12% 27% -9% 0%

Appendix B: Additional Force and Moment Data
Table 13: Sustained Force and Moment Values Collected In Addition To Ingress/Egress Values
Subj. Description Fx Fy Fz Mx My Mz 1 Standing in PFR (quiescent forces) 1.1 0.8 2.1 15.8 26.2 136.7 Working on connector 2.3 2.6 3.3 93.9 74.9 106.4
2 Standing in PFR (quiescent forces) 1.4 2.2 1.1 107.2 55.0 52.9 3 Standing in PFR (quiescent forces) 0.5 2.4 3.0 55.7 94.9
Table 14: Spike Force and Moment Values Collected In Addition to Ingress/Egress Values
Subj. Description Fx Fy Fz Mx My Mz 1 Standing in PFR (quiescent forces) 3.7 3.7 6.2 55.7 94.9 217.4 Working on connector 14.7 14.2 16.5 341.2 491.1 372.5
2 Standing in PFR (quiescent forces) 5.7 7.9 5.1 192.2 176.1 130.7 3 Standing in PFR (quiescent forces) 2.8 5.4 4.7 192.2 176.1 130.7