Embed Size (px)
Citation preview
NASA Technical Paper 3424
Loads Produced by a Suited Subject PerformingTool Tasks Without the Use of Foot Restraints
Sudhakar L. Rajulu and Jeffrey Poliner,Lockheed Engineering & Sciences CompanyHouston, Texas
and
Glenn K. Klute,
Lyndon B. Johnson Space CenterHouston, Texas
December 1993
https://ntrs.nasa.gov/search.jsp?R=19940016133 2018-05-30T04:29:11+00:00Z


TABLE OF CONTENTS
Section Page
LIST OF FIGURES ...................................................................................................... i v
LIST OF TABLES ........................................................................................................ v
ACRONYMS ............................................................................................................... vi
ACKNOWLEDGMENTS .......................................................................................... v i i
1. Introduction ........................................................................................................... 1
1.1 Background .................................................................................................... 1
1.2 Brief Description of Study ........................................................................... 1
1.3 Purposes of Study .......................................................................................... 1
1.4 Descriptions of Tasks Investigated ............................................................ 2
1.4.1 Maximum Torque Task (MTT) ....................................................... 2
1.4.2 Endurance Task (ET) .......................................................................... 2
1.4.3 Handrail Push/Pull Task (HPPT) .................................................... 2
1.4.4 Power Tool Task (PTT) ...................................................................... 2
2. General Methodology .......................................................................................... 4
2.1 Subjects ............................................................................................................ 4
2.2 Apparatus ....................................................................................................... 4
2.2.1 KC-135 Aircraft .................................................................................... 4
2.2.2 Equipment Setup ................................................................................ 5
3. Maximum Torque Task ....................................................................................... 6
3.1 Description of Task ....................................................................................... 6
3.2 Methods .......................................................................................................... 7
3.2.1 Experimental Procedures .................................................................. 7

TABLE OF CONTENTS (cont.)
Page
3.2.2 Experimental Design ......................................................................... 7
3.2.3 Data Treatment ................................................................................... 7
3.2.4 Data Analysis ....................................................................................... 7
3.3 Results ............................................................................................................. 8
3.3.1 Torque ................................................................................................... 8
3.3.2 Forces .................................................................................................... 9
3.3.3 Moments .............................................................................................. 10
3.3.4 Statistical Analysis ............................................................................. 11
3.4 Discussion ...................................................................................................... 11
4. Endurance task ...................................................................................................... 12
4.1 Description of Task ....................................................................................... 12
4.2 Methods .......................................................................................................... 12
4.2.1 Experimental Procedures .................................................................. 12
4.2.2 Experimental Design ......................................................................... 12
4.2.3 Data Treatment ................................................................................... 13
4.2.4 Data Analysis ....................................................................................... 13
4.3 Results ............................................................................................................. 13
4.3.1 Torque ................................................................................................... 13
4.3.2 Forces .................................................................................................... 14
4.3.3 Moments .............................................................................................. 15
4.3.4 Statistical Analysis ............................................................................. 15
4.4 Discussion ...................................................................................................... 16
5. Handrail Push/Pull Task .................................................................................... 16
ii

TABLE OF CONTENTS (cont.)
Page
5.1 Description of Task ....................................................................................... 16
5.2 Methods .......................................................................................................... 17
5.2.1 Experimental Procedures .................................................................. 17
5.2.2 Experimental Design .......................................................................... 17
5.2.3 Data Treatment ................................................................................... 17
5.2.4 Data Analysis ....................................................................................... 17
5.3 Results ............................................................................................................. 18
5.3.1 Forces ..................................................................................................... 19
5.3.2 Moments .............................................................................................. 19
5.3.3 Statistical Analysis .............................................................................. 20
5.4 Discussion ....................................................................................................... 20
6. Power Tool Task .................................................................................................... 20
6.1 Description of Task ....................................................................................... 20
6.2 Methods .......................................................................................................... 20
6.2.1 Experimental Procedures .................................................................. 20
6.2.2 Experimental Design .......................................................................... 21
6.2.3 Data Treatment ................................................................................... 21
6.2.4 Data Analysis ....................................................................................... 21
6.3 Results ............................................................................................................. 21
6.4 Discussion ....................................................................................................... 23
7. CONCLUSIONS .................................................................................................... 23
8. FUTURE RECOMMENDATIONS .................................................................... 24
APPENDIX
iii
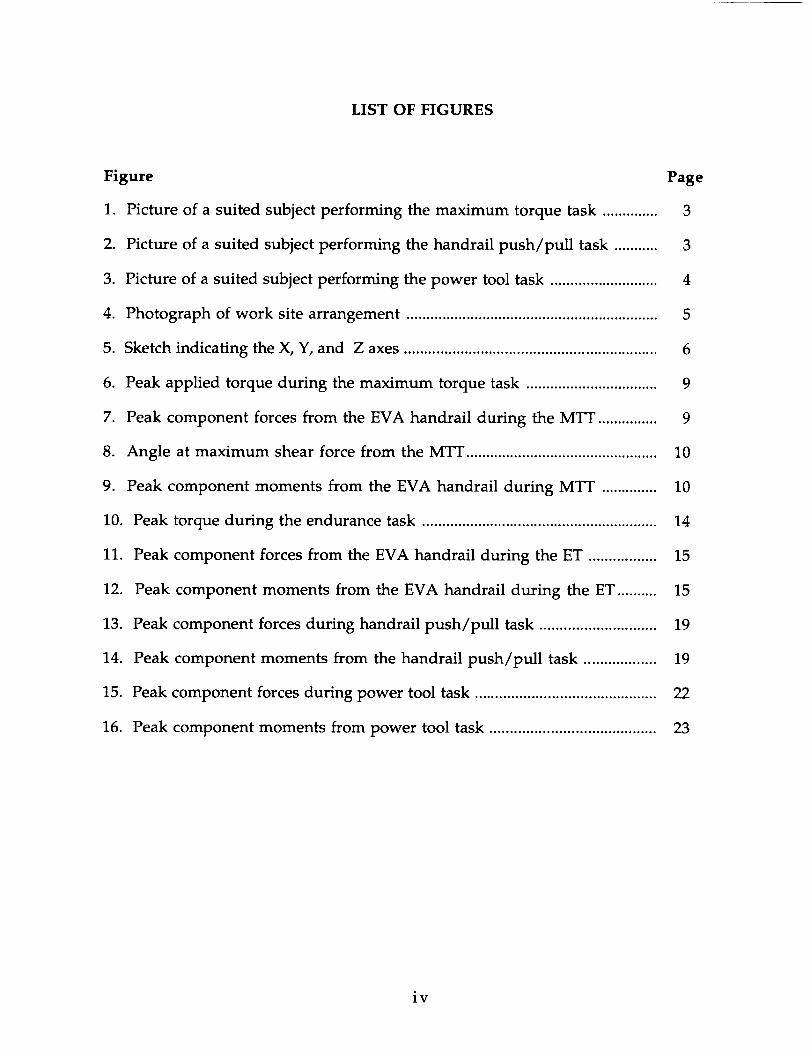
LIST OF FIGURES
Figure Page
1. Picture of a suited subject performing the maximum torque task .............. 3
2. Picture of a suited subject performing the handrail push/pull task ........... 3
3. Picture of a suited subject performing the power tool task ........................... 4
4. Photograph of work site arrangement ............................................................... 5
5. Sketch indicating the X, Y, and Z axes ............................................................... 6
6. Peak applied torque during the maximum torque task ................................. 9
7. Peak component forces from the EVA handrail during the MTT ............... 9
8. Angle at maximum shear force from the MTT ................................................ 10
9. Peak component moments from the EVA handrail during MTT .............. 10
10. Peak torque during the endurance task ........................................................... 14
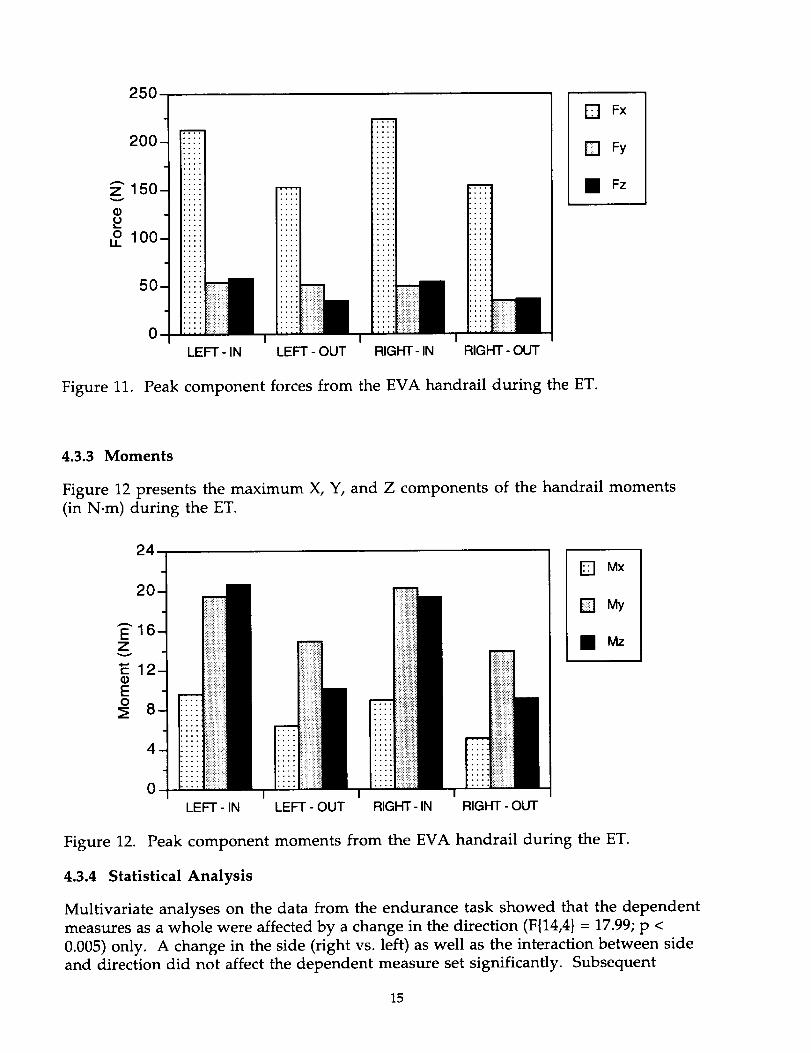
11. Peak component forces from the EVA handrail during the ET ................. 15
12. Peak component moments from the EVA handrail during the ET .......... 15
13. Peak component forces during handrail push/pull task ............................. 19
14. Peak component moments from the handrail push/pull task .................. 19
15. Peak component forces during power tool task ............................................. 22
16. Peak component moments from power tool task ......................................... 23
iv
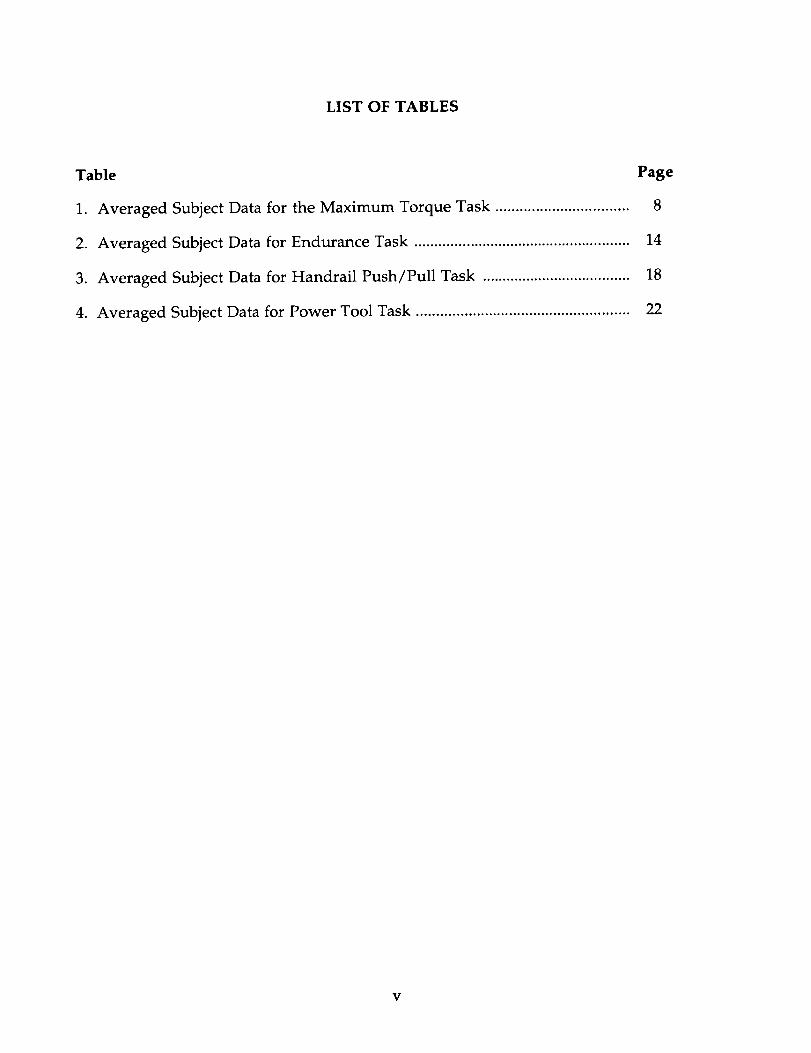
LIST OF TABLES
Table Page
1. Averaged Subject Data for the Maximum Torque Task ................................. 8
2. Averaged Subject Data for Endurance Task ...................................................... 14
3. Averaged Subject Data for Handrail Push/Pull Task ..................................... 18
4. Averaged Subject Data for Power Tool Task ..................................................... 22
V
ACRONYMS
AMTI
ANOVA
EMU
ET
EVA
HPPT
HST
jsc
MANOVA
MTT
NASA
PFR
PTT
Advanced Mechanical Technology, Inc.
Analysis of variance
Extravehicular Mobility Unit
Endurance task
Extravehicular activity
Handrail push/pull task
Hubble Space Telescope
Johnson Space Center
Multivariate analysis of variance
Maximum torque task
National Aeronautics and Space Administration
Portable foot restraint
Power tool task
vi
ACKNOWLEDGMENTS
This study was supported by Contract No. NAS9-17900 from the National Aeronautics
and Space Administration. The authors wish to acknowledge Ralph Wemhoff and
Robert Wilmington of the Anthropometry and Biomechanics Laboratory, Lockheed
Engineering and Sciences Company (LESC) for technical assistance; Michael Copps
and Perry Clark of LESC and Dominic Del Rosso (NASA) for planning the experi-
ment, designing the test equipment, and providing the tools; the suit technicians
from the Crew and Thermal Division of NASA-JSC for assisting the subjects to don
and doff the suits; and all the subjects who willingly participated in the study. Thanks
also go to Robert Wilmington, Doug Stanley, and Mark Stuart of LESC for their
review and comments.
vii

1. INTRODUCTION
1.1 Background
Due to an increase in the number of extravehicular activities (EVAs) which astro-
nauts will be performing in the coming years, NASA is interested in determining the
capabilities of a suited astronaut working in a weightless environment.
Traditionally, a portable foot restraint (PFR) holds an astronaut involved in EVA
tasks in position. The PFR provides adequate restraint to counter the forces generated
from the use of a wide variety of powered and non-powered EVA tools. In certain
situations, it may be advantageous to perform operations while free floating. This
would save EVA time by not requiring the PFR to be set up. In those situations, the
astronaut has to grasp the EVA handrail in one hand and perform the task with the
other.
Engineers at NASA have done some work investigating the capabilities of suited
astronauts to perform certain tasks while in foot restraints. However, very little
information is available concerning their abilities to perform duties without the use
of foot restraints. In addition, there is interest in gathering information concerning
the loads transmitted to the EVA handrail when performing this type of task.
1.2 Brief Description of Study
The intention of this study was to examine the loads produced by a suited subject
performing several EVA tasks with a single EVA handrail and no foot restraints.
1.3 Purposes of Study
Specifically, the purposes of this investigation were to:
1. Determine the amount of torque which can be produced by a suited subject in a
weightless environment without the use of foot restraints.
2. Measure the loads produced on the supporting hand while performing various
tasks in zero gravity without the use of foot restraints.
3. Determine differences in the loads produced on the supporting hand while per-
forming various tasks between individuals' dominant and non-dominant sides.
4. Determine the effect of direction of tool rotation (clockwise vs. counter clockwise)
on maximum torque production and supporting hand forces.
5. Examine the feasibility of using a power tool in a weightless environmentwithout the use of foot restraints.
1.4 Descriptions of Tasks Investigated
During an EVA, an astronaut uses various tools to accomplish a variety of tasks. In
general, the astronaut uses standard tools that are modified to accommodate the
equipment used in the Shuttle or proposed Space Station. The most commonly used
tools are wrenches of various shapes. For highly repetitive tasks, efforts are under
way to develop and use battery-powered tools.
In this study, four tasks were investigated: a maximum torquing effort with a wrench;
a sustained torque with a wrench; the use of a battery-powered tool; and pushing and
pulling an object normal to the work surface. Each of these is explained briefly below
and in more detail in the following sections.
1.4.1 Maximum Torque Task (MTT)
This task examined the use of a wrench-type tool to produce a maximum isometric
torque on a test fixture. Assistants positioned the operator at the work surface. The
operator held a wrench in one hand and exerted a maximal isometric effort in a
direction parallel to the mediolateral axis of his body. His other hand grasped an EVA
handrail to the side (figure 1). Appendix A contains a description of the EVAhandrail.
1.4.2 Endurance Task (ET)
The operator applied a sustained effort with a wrench in an angular direction parallel
to the plane of his body. The other hand grasped an EVA handrail. The task wassimilar to that of the MTT.
1.4.3 Handrail Push/Pull Task (HPPT)
The operator applied a maximal force on an EVA handrail, in a direction normal to
the work surface. His other hand grasped another EVA handrail nearby (figure 2).
1.4.4 Power Tool Task (PTT)
The operator used the Hubble Space Telescope (HST) power tool to loosen and tighten
bolt fasteners. One hand held the tool and the other hand grasped the EVA handrail
(figure 3). A description of the HST power tool can be found in Appendix A.

ORI,.q_NAL PA-q_
BLACK AND WHITE '_ "_-' ",,0,C)GRAP_
Figure 1. Picture of a suited subject performing the maximum torque task.
Figure 2. Picture of a suited subject performing the handrail push/pull task.

Figure 3. Picture of a suited subject performing the power tool task.
2. GENERAL METHODOLOGY
2.1 Subjects
Six male subjects participated in this study, including four astronauts and two non-
astronauts. All were experienced in performing strength tests while wearing pressur-
ized suits. The subjects had passed an Air Force Flying Class III physical examination
and had taken the physiological training to qualify to participate in reduced gravity
experiments. Their heights ranged from 162 cm to 180 cm with a mean of 175 cm and
their masses varied from 61 kg to 77 kg with a mean of 70 kg. Although all were right-
handed, both hands were tested in the study.
2.2 Apparatus
2.2.1 KC-135 Aircraft
Tests were conducted aboard NASA's KC-135 aircraft. This is a modified jet that is
capable of flying a parabolic arc with a vertical acceleration equal to the acceleration
due to gravity. Thus, during the arc, passengers and equipment within the plane
experience virtual zero gravity. Each parabola lasted approximately 25 seconds. A
flight consisted of 40 parabolas.
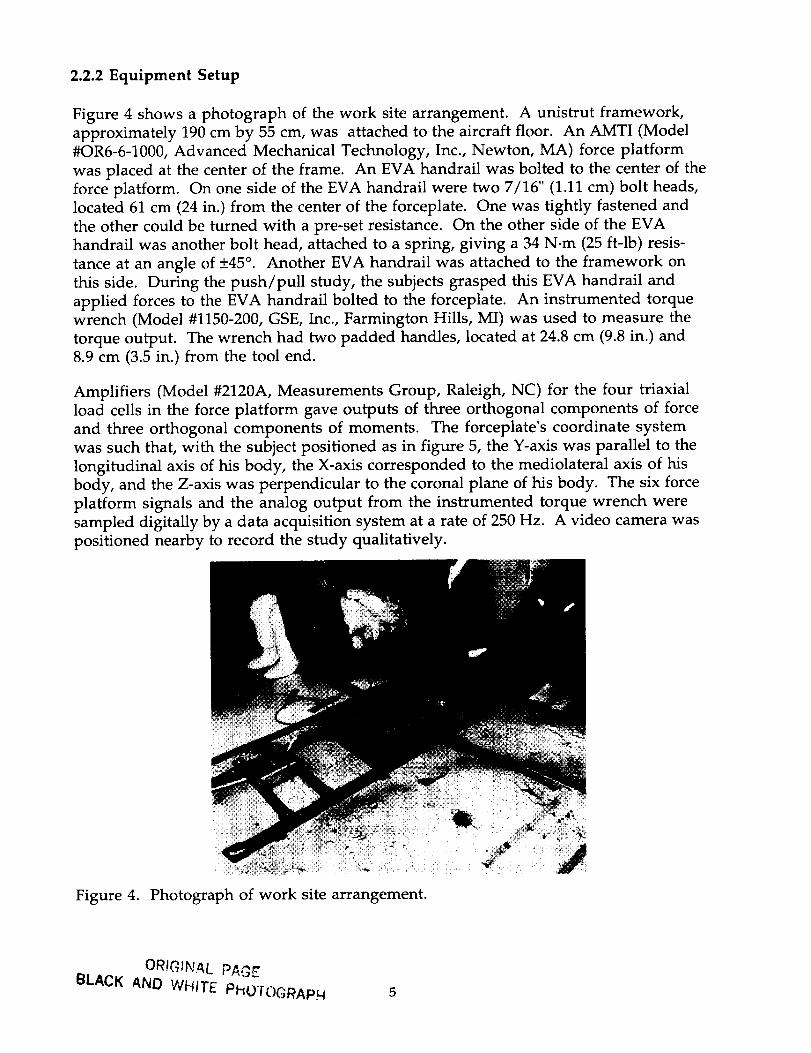
2.2.2 Equipment Setup
Figure 4 shows a photograph of the work site arrangement. A unistrut framework,
approximately 190 cm by 55 cm, was attached to the aircraft floor. An AMTI (Model
#OR6-6-1000, Advanced Mechanical Technology, Inc., Newton, MA) force platform
was placed at the center of the frame. An EVA handrail was bolted to the center of the
force platform. On one side of the EVA handrail were two 7/16" (1.11 cm) bolt heads,
located 61 cm (24 in.) from the center of the forceplate. One was tightly fastened and
the other could be turned with a pre-set resistance. On the other side of the EVA
handrail was another bolt head, attached to a spring, giving a 34 N.m (25 ft-lb) resis-
tance at an angle of +45 ° . Another EVA handrail was attached to the framework on
this side. During the push/pull study, the subjects grasped this EVA handrail and
applied forces to the EVA handrail bolted to the forceplate. An instrumented torque
wrench (Model #1150-200, GSE, Inc., Farmington Hills, MI) was used to measure the
torque output. The wrench had two padded handles, located at 24.8 cm (9.8 in.) and
8.9 cm (3.5 in.) from the tool end.
Amplifiers (Model #2120A, Measurements Group, Raleigh, NC) for the four triaxial
load cells in the force platform gave outputs of three orthogonal components of force
and three orthogonal components of moments. The forceplate's coordinate system
was such that, with the subject positioned as in figure 5, the Y-axis was parallel to the
longitudinal axis of his body, the X-axis corresponded to the mediolateral axis of his
body, and the Z-axis was perpendicular to the coronal plane of his body. The six force
platform signals and the analog output from the instrumented torque wrench were
sampled digitally by a data acquisition system at a rate of 250 Hz. A video camera was
positioned nearby to record the study qualitatively.
Figure 4. Photograph of work site arrangement.
BLACK AND WHITE PhOTOGRApH 5
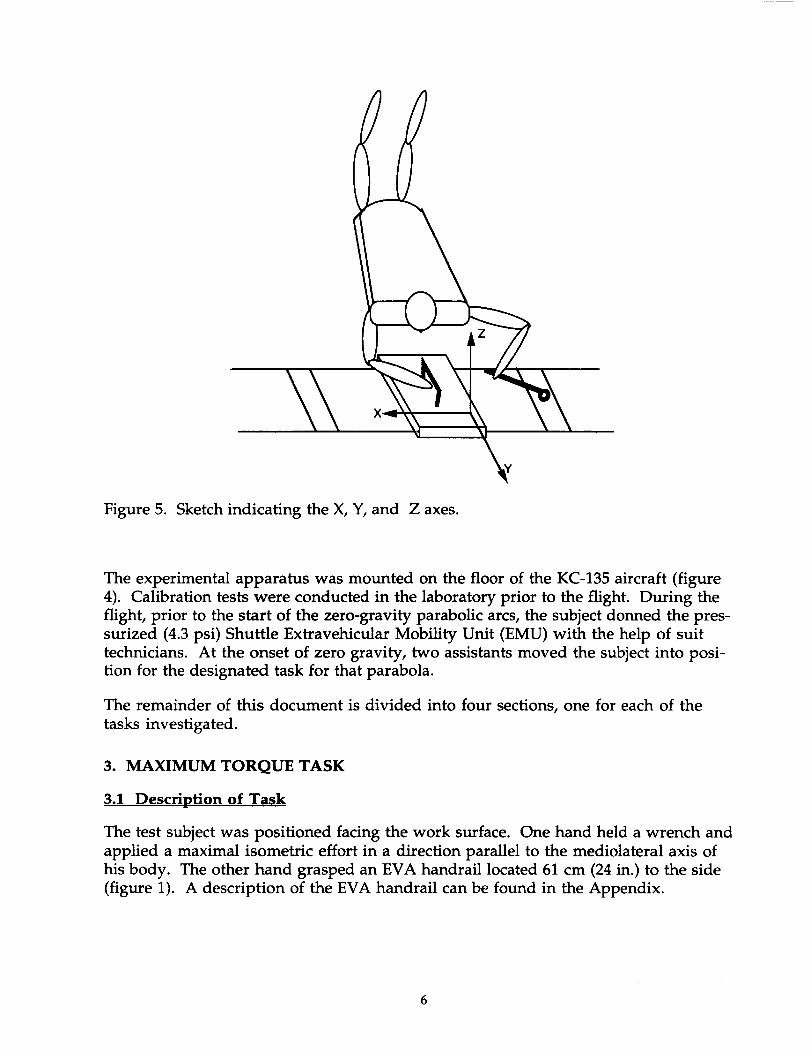
Figure 5. Sketch indicating the X, Y, and Z axes.
The experimental apparatus was mounted on the floor of the KC-135 aircraft (figure
4). Calibration tests were conducted in the laboratory prior to the flight. During the
flight, prior to the start of the zero-gravity parabolic arcs, the subject donned the pres-
surized (4.3 psi) Shuttle Extravehicular Mobility Unit (EMU) with the help of suit
technicians. At the onset of zero gravity, two assistants moved the subject into posi-
tion for the designated task for that parabola.
The remainder of this document is divided into four sections, one for each of the
tasks investigated.
3. MAXIMUM TORQUE TASK
3.1 Description of Task
The test subject was positioned facing the work surface. One hand held a wrench and
applied a maximal isometric effort in a direction parallel to the mediolateral axis of
his body. The other hand grasped an EVA handrail located 61 cm (24 in.) to the side
(figure 1). A description of the EVA handrail can be found in the Appendix.
6

3.2 Methods
3.2.1 Experimental Procedures
The torque wrench was attached to the fixed bolt fitting, with the arm of the wrench
parallel to the longitudinal axis of the subject's body (figure 1). The subject's non-test
hand held onto the handrail mounted on the force platform. The subject was in-
structed to produce as much torque in the wrench as he could, holding the handle 24.8
cm (9.8 in.) from the end. He first rotated the torque wrench in one direction and held
it there for several seconds; he then rotated the wrench in the opposite direction and
held it there for several seconds. Force plate and torque wrench data were collected
during the zero-gravity interval.
3.2.2 Experimental Design
A repeated measures design was used in this study. The independent variables in-
cluded were the hand (dominant vs. non-dominant) and the direction in which the
force was applied (inward vs. outward, or clockwise vs. counterclockwise). Each sub-
ject repeated the trials twice for each condition. The dependent variables included the
three axial components of force, the three components of the moment, the resultant
shear force, and the torque output from the wrench. Some trials were missed due to
malfunctioning of the experimental tools and the lack of time for the subject to posi-
tion himself properly. When there were extra parabolas, certain test conditions were
repeated.
3.2.3 Data Treatment
Raw data were in the form of seven channels of time-based data for each parabola
(three forces and three moments from the forceplate, and the torque from the torque
wrench) for the duration of the zero-gravity interval. The window of data corre-
sponding to the actual performance of the task was determined from plots of the data
and from the video recordings. Within each window, the peak magnitude for each of
the seven channels was obtained. Also, the two components of force parallel to the
direction of movement (X and Y) were combined to calculate a resultant shear force
and the peaks of these data were determined too. For comparison purposes, necessary
manipulation of the data was performed to change the coordinate system from one
based on the forceplate to one based on the subject.
3.2.4 Data Analysis
For each subject, there were from one to three trials of each test condition (hand and
direction). Since this task required a maximal effort, the largest value for each of the
eight dependent variables was taken as representative for that subject.
The results focused on eliciting the differences between the dominant and non-dom-
inant hand, as well as between different directions of movement. The responses of
each dependent variable to the test variables (side, direction) were first examined
descriptively. Next, the dependent variables were tested for statistical significance
using various statistical tests. A multivariate analysis of variance (MANOVA) was
performed to determine the collective response of the dependent data to changes in
each one of the test variables. The MANOVA was followed by an univariate analysisof variance (ANOVA) to determine the influence of all test variables and their inter-
actions. Finally, the Ryan-Einot-Gabriel-Welsh test criterion was used to determine
whether there were significant variations within the levels of each test variable. A
significance level of 0.05 was chosen to determine whether the analyses were signifi-cant or not.
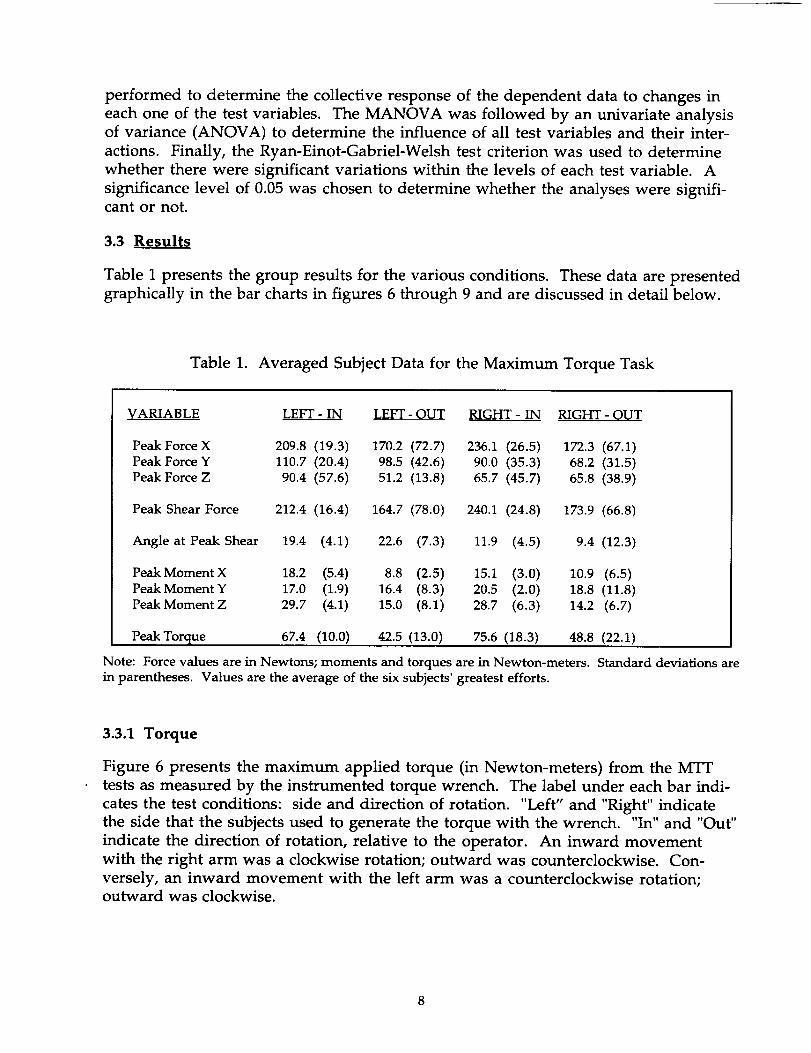
3.3 Results
Table 1 presents the group results for the various conditions. These data are presented
graphically in the bar charts in figures 6 through 9 and are discussed in detail below.
Table 1. Averaged Subject Data for the Maximum Torque Task
VARIABLE LEFT - IN LEFT - OUT RIGHT - IN RIGHT - OUT
Peak Force X 209.8 (19.3) 170.2 (72.7) 236.1 (26.5) 172.3 (67.1)Peak ForceY 110.7 (20.4) 98.5 (42.6) 90.0 (35.3) 68.2 (31.5)Peak Force Z 90.4 (57.6) 51.2 (13.8) 65.7 (45.7) 65.8 (38.9)
Peak Shear Force 212.4 (16.4) 164.7 (78.0) 240.1 (24.8) 173.9 (66.8)
Angle at Peak Shear 19.4 (4.1) 22.6 (7.3) 11.9 (4.5) 9.4 (12.3)
Peak Moment X 18.2 (5.4) 8.8 (2.5) 15.1 (3.0) 10.9 (6.5)PeakMoment Y 17.0 (1.9) 16.4 (8.3) 20.5 (2.0) 18.8 (11.8)PeakMoment Z 29.7 (4.1) 15.0 (8.1) 28.7 (6.3) 14.2 (6.7)
PeakTorque 67.4 (10.0) 42.5 (13.0) 75.6 (18.3) 48.8 (22.1)
Note: Force values are in Newtons; moments and torques are in Newton-meters. Standard deviations arein parentheses. Values are the average of the six subjects' greatest efforts.
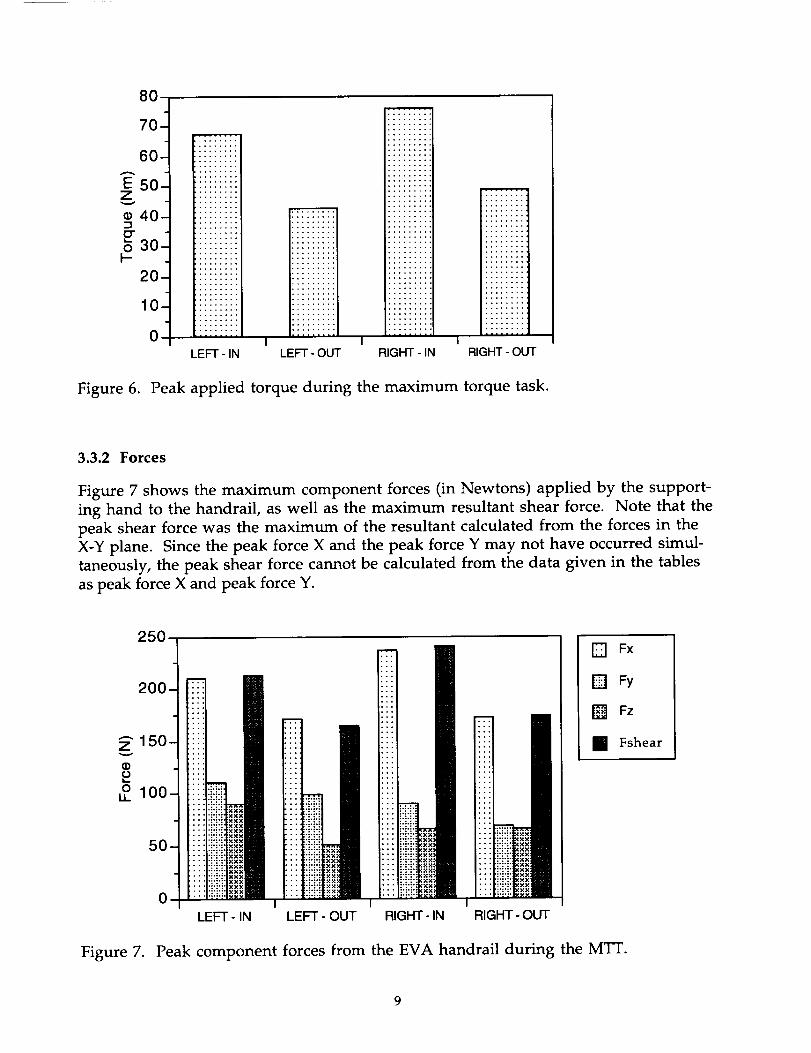
3.3.1 Torque
Figure 6 presents the maximum applied torque (in Newton-meters) from the MTT
tests as measured by the instrumented torque wrench. The label under each bar indi-
cates the test conditions: side and direction of rotation. "Left" and "Right" indicate
the side that the subjects used to generate the torque with the wrench. "In" and "Out"
indicate the direction of rotation, relative to the operator. An inward movement
with the right arm was a clockwise rotation; outward was counterclockwise. Con-
versely, an inward movement with the left arm was a counterclockwise rotation;outward was clockwise.
8
8O
70-
6o-
E 5OZ
• 40:3
E "o 301-
20
10
0
_ _ i,-l- I .......... | .....
....... | .......... | ...
....... | .....
....... | .....
....... n .....
....... I .......... I .....
....... i -''
....... i .....
....... i .....
....... i .....
....... i .....
..... i ..... ,.m ............ i ....... | °'"....... m ....... |
..... i ....... | .....I
..... I ....... | ..... i....... I ....... • ....... i....... I ....... i ....... i....... I ..... i ....... i....... I ....... i ....... i....... I ....... • ....... i....... I ....... i ....... i....... i ........ | ..... i
..... I ...... i ....... i....... i ........ | ....... i
..... m ........ | ....... i....... i ......... i ........ i
....... i ....... i ...... i
............ i ........ i
............ i ........ i
............ i ........ i
............ i ........ ,
............ i ......... ,
! !
LEFr - IN LEFT - OUl" NIGHT - IN
•,m.,m.,m.,m.,u.,i.,|..m..m..m..m..m..m.,u.,u
• ,i ........• .i ........• ,i ........• -i ........
..[ ........
• .I ........
!
RIGHT - OUT
Figure 6. Peak applied torque during the maximum torque task.
3.3.2 Forces
Figure 7 shows the maximum component forces (in Newtons) applied by the support-
ing hand to the handrail, as well as the maximum resultant shear force. Note that the
peak shear force was the maximum of the resultant calculated from the forces in the
X-Y plane. Since the peak force X and the peak force Y may not have occurred simul-
taneously, the peak shear force cannot be calculated from the data given in the tables
as peak force X and peak force Y.
250
200-
_" 150•
00
o 100-LL
50-
0
FI,..
:,:.p
b, • •l :.:-:,
:-:.:,:•:.:,:*;.:,
•. :.:•:,:-:-:,,:-:-:,
::ii!iiii!ii
LEFT- IN LEFT -OUT
,, ,,,..:.::,:-:.::,:.:.:p:.:.:p:.:,;
:,:-:,:
:,:-:,
• - _:_:_:_q.'.1-:,:.:.:,:,
NIGHT- IN
I••.
: : ::::::::_,:: : ::::::::_,#i:: : :::::::_;: : ::::::::=,:
:: T:i:i:l_i... _.:.:. _
RIGHT - OUT
[] Fx
DFy
[] Fz
[] Fshear
Figure 7. Peak component forces from the EVA handrail during the MTT.
9
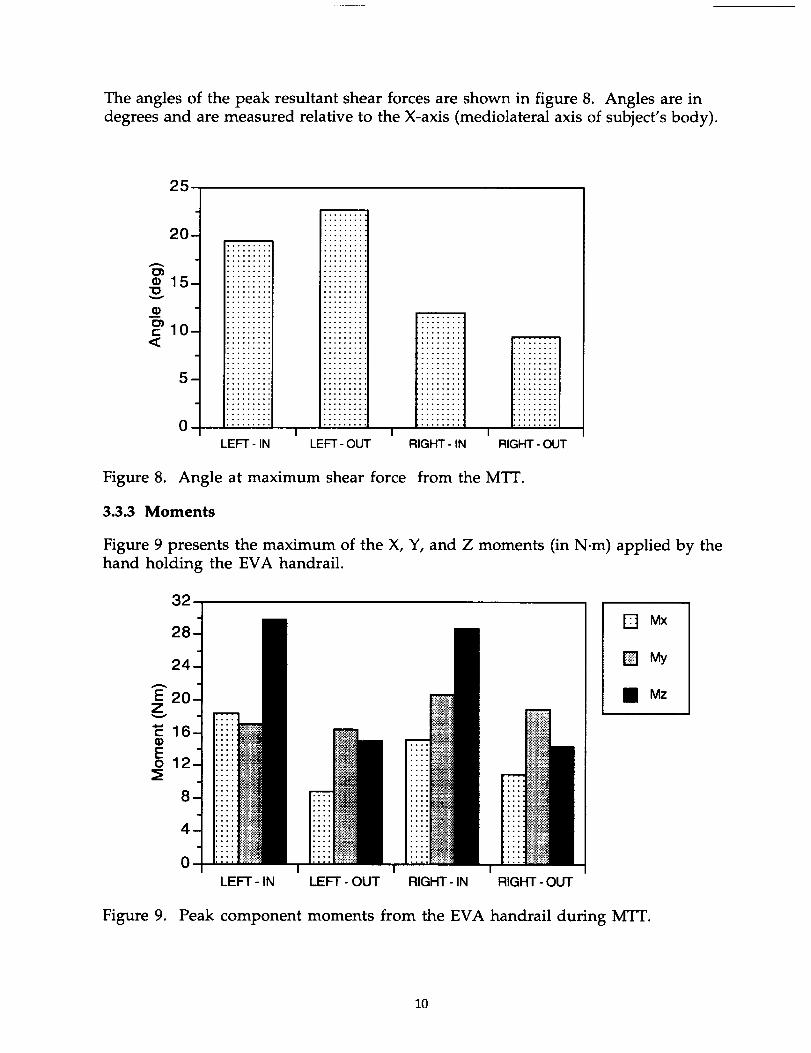
The angles of the peak resultant shear forces are shown in figure 8. Angles are in
degrees and are measured relative to the X-axis (mediolateral axis of subject's body).
25
_15.
_.m,..-10.
5-
0-
m
TLEFT - IN LEFT-OUT
_m
I 1RIGHT - IN RIGHT - OUT
Figure 8. Angle at maximum shear force from the MTT.
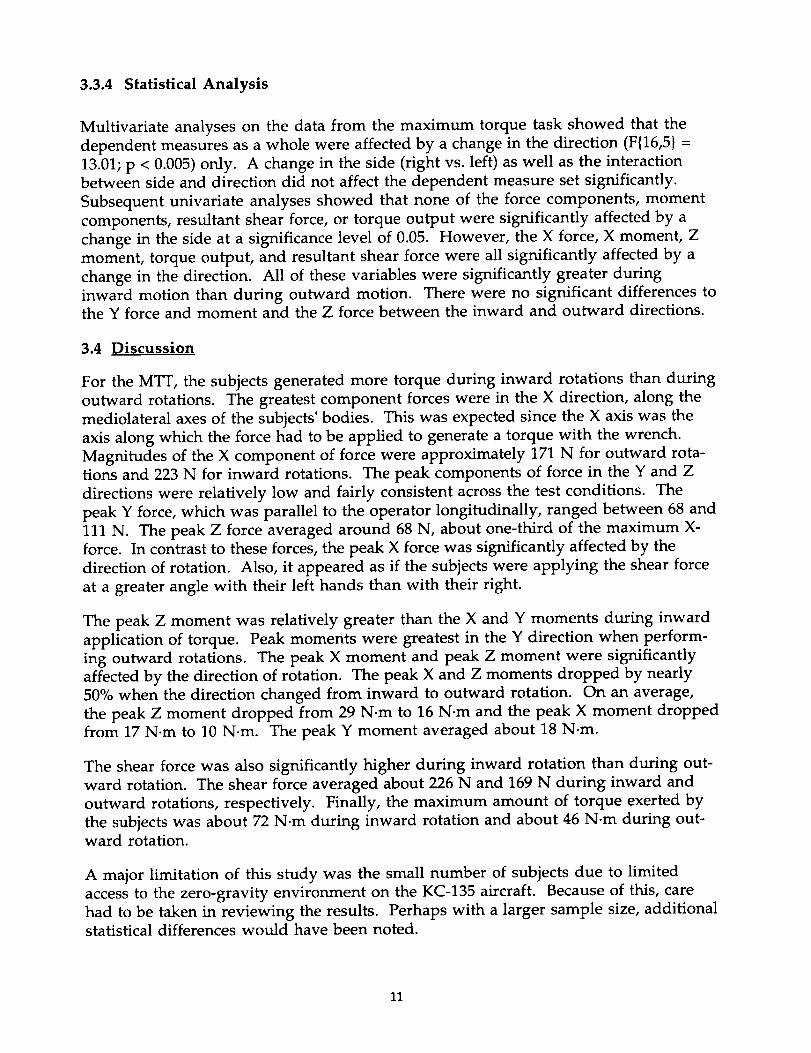
3.3.3 Moments
Figure 9 presents the maximum of the X, Y, and Z moments (in N.m) applied by the
hand holding the EVA handrail.
Ez
OEol
[] Mx
DMy
IlMz
LEFT - IN LEFT - OUT RIGHT - IN RIGHT - OUT
Figure 9. Peak component moments from the EVA handrail during MTT.
10
3.3.4 Statistical Analysis
Multivariate analyses on the data from the maximum torque task showed that the
dependent measures as a whole were affected by a change in the direction (F{16,5} =
13.01; p < 0.005) only. A change in the side (right vs. left) as well as the interaction
between side and direction did not affect the dependent measure set significantly.
Subsequent univariate analyses showed that none of the force components, moment
components, resultant shear force, or torque output were significantly affected by a
change in the side at a significance level of 0.05. However, the X force, X moment, Z
moment, torque output, and resultant shear force were all significantly affected by a
change in the direction. All of these variables were significantly greater during
inward motion than during outward motion. There were no significant differences tothe Y force and moment and the Z force between the inward and outward directions.
3.4 Discussion
For the MTT, the subjects generated more torque during inward rotations than during
outward rotations. The greatest component forces were in the X direction, along the
mediolateral axes of the subjects' bodies. This was expected since the X axis was the
axis along which the force had to be applied to generate a torque with the wrench.
Magnitudes of the X component of force were approximately 171 N for outward rota-tions and 223 N for inward rotations. The peak components of force in the Y and Z
directions were relatively low and fairly consistent across the test conditions. The
peak Y force, which was parallel to the operator longitudinally, ranged between 68 and
111 N. The peak Z force averaged around 68 N, about one-third of the maximum X-
force. In contrast to these forces, the peak X force was significantly affected by the
direction of rotation. Also, it appeared as if the subjects were applying the shear force
at a greater angle with their left hands than with their right.
The peak Z moment was relatively greater than the X and Y moments during inward
application of torque. Peak moments were greatest in the Y direction when perform-
ing outward rotations. The peak X moment and peak Z moment were significantly
affected by the direction of rotation. The peak X and Z moments dropped by nearly
50% when the direction changed from inward to outward rotation. On an average,
the peak Z moment dropped from 29 N.m to 16 N.m and the peak X moment dropped
from 17 N.m to 10 N.m. The peak Y moment averaged about 18 N.m.
The shear force was also significantly higher during inward rotation than during out-
ward rotation. The shear force averaged about 226 N and 169 N during inward and
outward rotations, respectively. Finally, the maximum amount of torque exerted by
the subjects was about 72 N-m during inward rotation and about 46 N.m during out-
ward rotation.
A major limitation of this study was the small number of subjects due to limited
access to the zero-gravity environment on the KC-135 aircraft. Because of this, care
had to be taken in reviewing the results. Perhaps with a larger sample size, additionalstatistical differences would have been noted.
11
4. ENDURANCE TASK
4.1 Description of Task
The operator applied a sustained effort with a wrench in an angular direction parallel
to the plane of his body. The other hand grasped an EVA handrail. The moment arm
was held constant at 10.2 cm (4 in.). The task was similar to that of the MTT task.
4.2 Methods
4.2.1 Experimental Procedures
Two different protocols were used for this task. For the first two subjects, the torque
wrench was attached to the spring-loaded bolt fitting. The subject was instructed to
rotate the wrench attached to the tool fitting to a 45 ° angle and hold it there for several
seconds. He used the handle 10.2 cm (4 in.) from the end of the wrench. His non-test
hand held on to the handrail mounted on the force platform. For these first two
subjects, the spring mechanism did not function according to plans and could only beused for clockwise rotations.
For the remaining four subjects, the task was modified. The endurance task (ET) used
the same fixed bolt fitting as the MTT. Essentially, the task became identical to the
MTT except that a 10.2 cm moment arm was used to apply the torque rather than 25.4cm.
With both protocols, forceplate and torque wrench data were collected during the
entire zero-gravity duration. Within each parabola the task was performed at least
twice, once for each direction.
4.2.2 Experimental Design
The independent variables for this task were the hands (dominant vs. non-domi-
nant), and the directions in which the force was applied (inward vs. outward rota-
tion). Each subject repeated the trials twice for each hand and for each task. The
dependent variables included the three components of force, the three components of
moment, and the torque output from the wrench.
Each subject performed approximately two trials of each test condition, a test condi-
tion being one of the four combinations of hand and direction. Some trials were
missed due to malfunctioning of the experimental tools and the lack of time for the
subject to position himself properly. When time was available, missed test conditions
were repeated.
12

4.2.3 Data Treatment
Raw data were in the form of seven channels of time-based data for each parabola
(three forces and three moments from the forceplate, and the torque from the torque
wrench) for the duration of the zero-gravity interval. The window of data corre-
sponding to the actual performance of the task was determined from plots of the data
and from the video recordings. Within each window, the peak magnitude for each of
the seven channels was obtained. For comparison purposes, necessary manipulation
of the data was performed in order to change the coordinate system from one based on
the forceplate to one based on the subject.
4.2.4 Data Analysis
For the ET, in which the goal was to determine nominal loads while the task was
performed, the average of the multiple trials was taken as representative for each
subject. The results focused on eliciting the differences between the dominant and
non-dominant hand, as well as between different directions of movement. Under
each task condition, the responses of each dependent variable to the test variables
(side, direction) were first examined descriptively. Next, the dependent variables were
tested for statistical significance using various statistical tests. A MANOVA was
performed to determine the collective response of the dependent data to changes in
each one of the test variables. The MANOVA was followed by an univariate ANOVA
to determine the influence of all test variables and their interactions. Finally, the
Ryan-Einot-Gabriel-Welsh test criterion was used to determine whether there were
significant variations within the levels of each test variable. A significance level of
0.05 was chosen to determine whether the analyses were significant or not.
4.3 Results
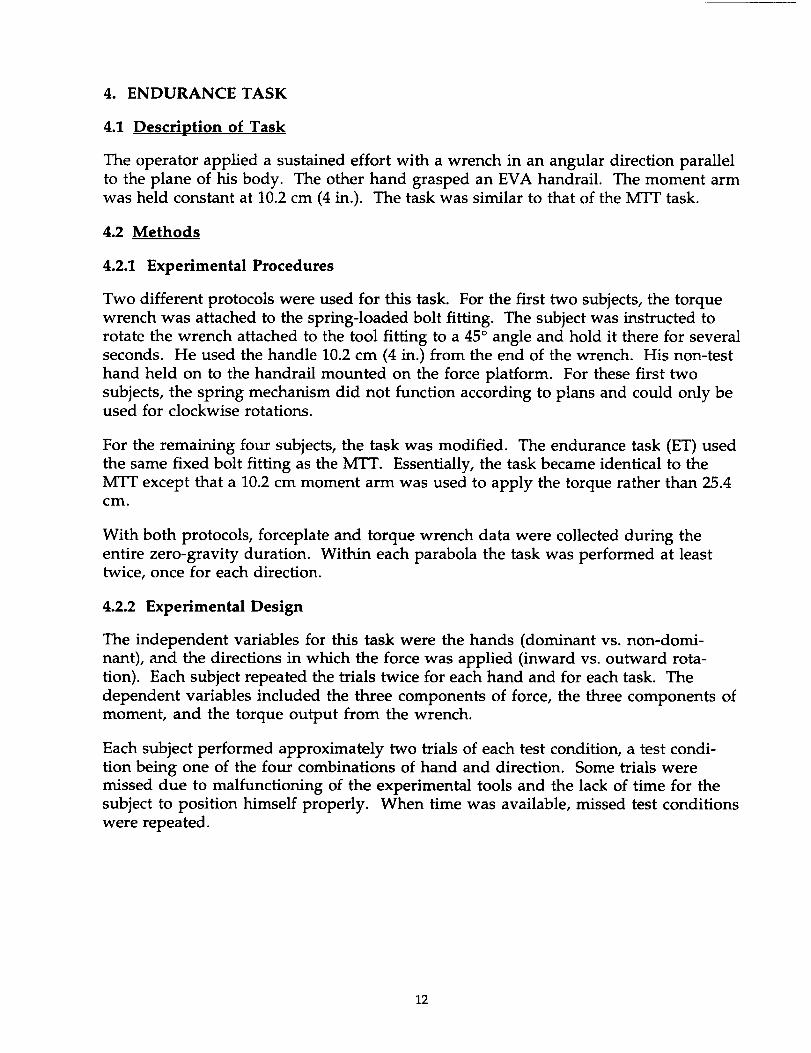
Table 2 presents the group results from the ET conditions. These data are presented
graphically in the bar charts in figures 10 through 12.
4.3.1 Torque
Figure 10 presents the maximum applied torque (in N.m) from the ET tests as
measured by the instrumented torque wrench. The label under each bar indicates thetest conditions: side and direction of rotation. "Left" and "Right" indicate the side
that was used to generate the torque with the wrench. "In" and "Out" indicate the
direction of rotation, relative to the operator. An inward movement with the right
arm was a clockwise rotation; outward was counterclockwise. Similarly, an inward
movement with the left arm was a counterclockwise rotation; outward was clockwise.
13
Table 2. Averaged Subject Data for Endurance Task
VARIABLE LEFT - IN LEFT - OUT RIGHT - IN RIGHT - OUT
Peak Force X 211.7 (33.7) 151.6 (54.6) 222.8 (43.2) 153.2 (76.7)Peak Force Y 54.1 (20.6) 51.4 (22.3) 48.7 (23.6) 34.2 (22.5)Peak Force Z 57.2 (26.9) 33.4 (12.9) 53.8 (46.7) 35.2 (17.1)
Peak MomentX 9.5 (3.7) 6.3 (1.4) 8.8 (2.2) 5.0 (2.7)
Peak MomentY 19.4 (3.7) 14.9 (7.0) 20.2 (3.8) 13.8 (8.0)Peak MomentZ 20.6 (6.6) 10.1 (9.2) 19.3 (6.5) 9.1 (5.6)
Peak Torque 31.6 (4.4) 18.5 (4.8) 32.3 (7.3) 19.0 (9.4)
Note: Force values are in Newtons; moments and torques are in Newton-meters. Standard deviations arein parentheses. Values are the average of the six subjects' average peak efforts.
35-
3o-
25--20L
• 15;
# 1o-
s-
oL
m
I" 1LEFT - IN LEFT - OUT RIGHT- IN
Figure 10. Peak torque during the endurance task.
TRIGHT - OUT
4.3.2 Forces
Figure 11 presents the maximum component forces (in Newtons) applied by the
supporting hand to the handrail.
14
250
200-
z 150-
ooo 100-ii
50-
.
Figure 11. Peak
!iii!
LEFT- IN
.... |.... |.... |.... |.... |.... I
,,ILEFT - OUT RIGHT - OUT
[] Fx
[] Fy
• Fz
component forces from the EVA handrail during the ET.
4.3.3 Moments
Figure 12 presents the maximum X, Y, and Z components of the handrail moments
(in N.m) during the ET.
24
20-
E16 -Z
,'12-
Eo
8
4
0
!iii!ii!iii!il
LEFT - IN LEFT - OUT RIGHT- IN RIGHT - OUT
[] Mx
[] My
• Mz
Figure 12. Peak component moments from the EVA handrail during the ET.
4.3.4 Statistical Analysis
Multivariate analyses on the data from the endurance task showed that the dependent
measures as a whole were affected by a change in the direction (F{14,4} = 17.99; p <
0.005) only. A change in the side (right vs. left) as well as the interaction between side
and direction did not affect the dependent measure set significantly. Subsequent
15
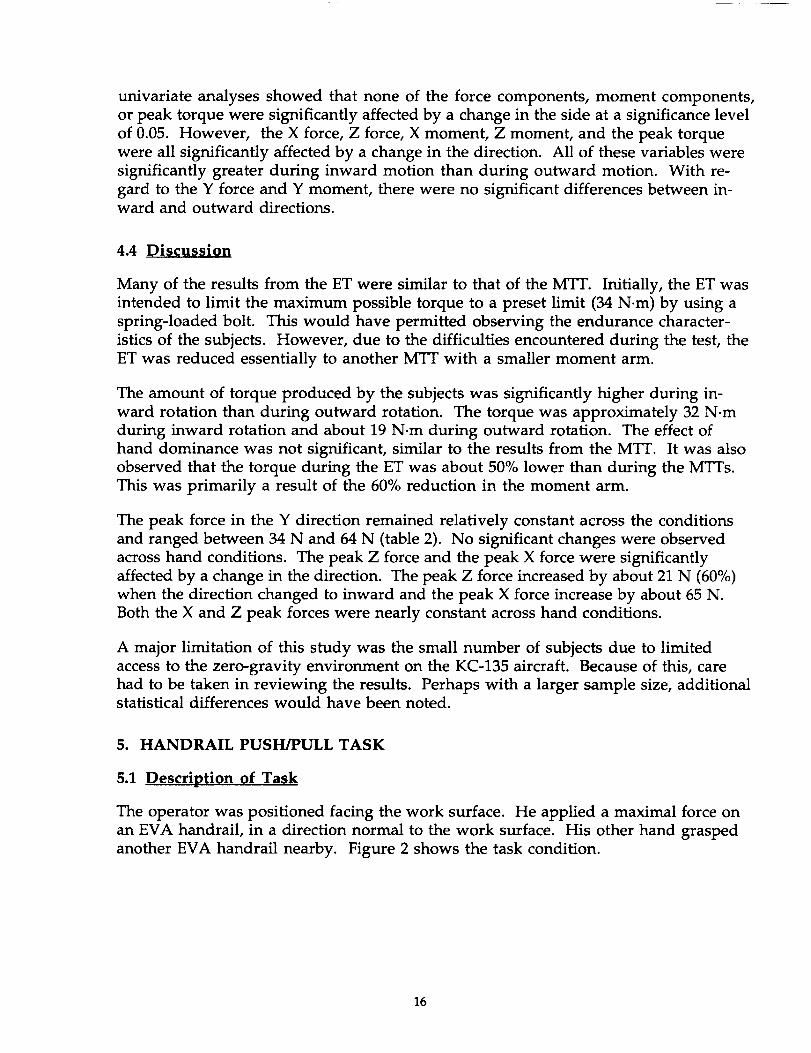
univariate analyses showed that none of the force components, moment components,
or peak torque were significantly affected by a change in the side at a significance level
of 0.05. However, the X force, Z force, X moment, Z moment, and the peak torque
were all significantly affected by a change in the direction. All of these variables were
significantly greater during inward motion than during outward motion. With re-
gard to the Y force and Y moment, there were no significant differences between in-ward and outward directions.
4.4 Discussion
Many of the results from the ET were similar to that of the MTT. Initially, the ET was
intended to limit the maximum possible torque to a preset limit (34 N-m) by using a
spring-loaded bolt. This would have permitted observing the endurance character-
istics of the subjects. However, due to the difficulties encountered during the test, the
ET was reduced essentially to another MTT with a smaller moment arm.
The amount of torque produced by the subjects was significantly higher during in-
ward rotation than during outward rotation. The torque was approximately 32 N.m
during inward rotation and about 19 N.m during outward rotation. The effect of
hand dominance was not significant, similar to the results from the MTT. It was also
observed that the torque during the ET was about 50% lower than during the MTTs.
This was primarily a result of the 60% reduction in the moment arm.
The peak force in the Y direction remained relatively constant across the conditions
and ranged between 34 N and 64 N (table 2). No significant changes were observed
across hand conditions. The peak Z force and the peak X force were significantly
affected by a change in the direction. The peak Z force increased by about 21 N (60%)
when the direction changed to inward and the peak X force increase by about 65 N.
Both the X and Z peak forces were nearly constant across hand conditions.
A major limitation of this study was the small number of subjects due to limited
access to the zero-gravity environment on the KC-135 aircraft. Because of this, care
had to be taken in reviewing the results. Perhaps with a larger sample size, additionalstatistical differences would have been noted.
5. HANDRAIL PUSH/PULL TASK
5.1 Description of Task
The operator was positioned facing the work surface. He applied a maximal force on
an EVA handrail, in a direction normal to the work surface. His other hand grasped
another EVA handrail nearby. Figure 2 shows the task condition.
16

5.2 Methods
5.2.1 Experimental Procedures
For the HPPT, the subject grasped the EVA handrail on the forceplate with his test
hand. The other hand provided stabilization by grasping the other EVA handrail. See
figure 2 for a picture of the experimental arrangement. The subject was instructed to
pull as hard as he could away from the forceplate for several seconds and push as hard
as he could into the forceplate (not necessarily in that order). Force plate data were
collected during the zero-gravity interval.
5.2.2 Experimental Design
A repeated measures design was used in this study. The independent variables were
the hands (dominant vs. non-dominant) and the directions in which the force was
applied (push vs. pull). Each subject repeated the trials twice for each hand and for
each task. The dependent variables included the three axial components of force and
the three components of the moment.
Each subject performed approximately two trials of each test condition, a test condi-
tion being one of the four combinations of hand and direction. Some trials were
missed due to a lack of time for the subject to position himself properly. When time
was available, missed test conditions were repeated.
5.2.3 Data Treatment
Raw data were in the form of six channels of time-based data for each parabola (three
forces and three moments from the forceplate) for the duration of the zero-gravity
interval. The window of data corresponding to the actual performance of the task was
determined from plots of the data and from the video recordings. Within each win-
dow, the peak magnitude for each of the six channels was obtained.
For comparison purposes, necessary manipulation of the data was performed in order
to change the coordinate system from one based on the forceplate to one based on the
subject.
5.2.4 Data Analysis
For each subject, there were from one to three trials of each test condition (hand and
direction). Since this task required a maximal effort, the largest value for each of six
dependent variables was taken as representative for that subject.
17
The results focused on eliciting the differences between the dominant and non-domi-
nant hand, as well as between different directions of movement. The responses of
each dependent variable to the test variables (side, direction) were first examined de-
scriptively. Next, the dependent variables were tested for statistical significance using
various statistical tests. A MANOVA was performed to determine the collective
response of the dependent data to changes in each one of the test variables. The
MANOVA was followed by a univariate ANOVA to determine the influence of all
test variables and their interactions. Finally, the Ryan-Einot-Gabriel-Welsh test cri-
terion was used to determine whether there were significant variations within the
levels of each test variable. A significance level of 0.05 was chosen to determine
whether the analyses were significant or not.
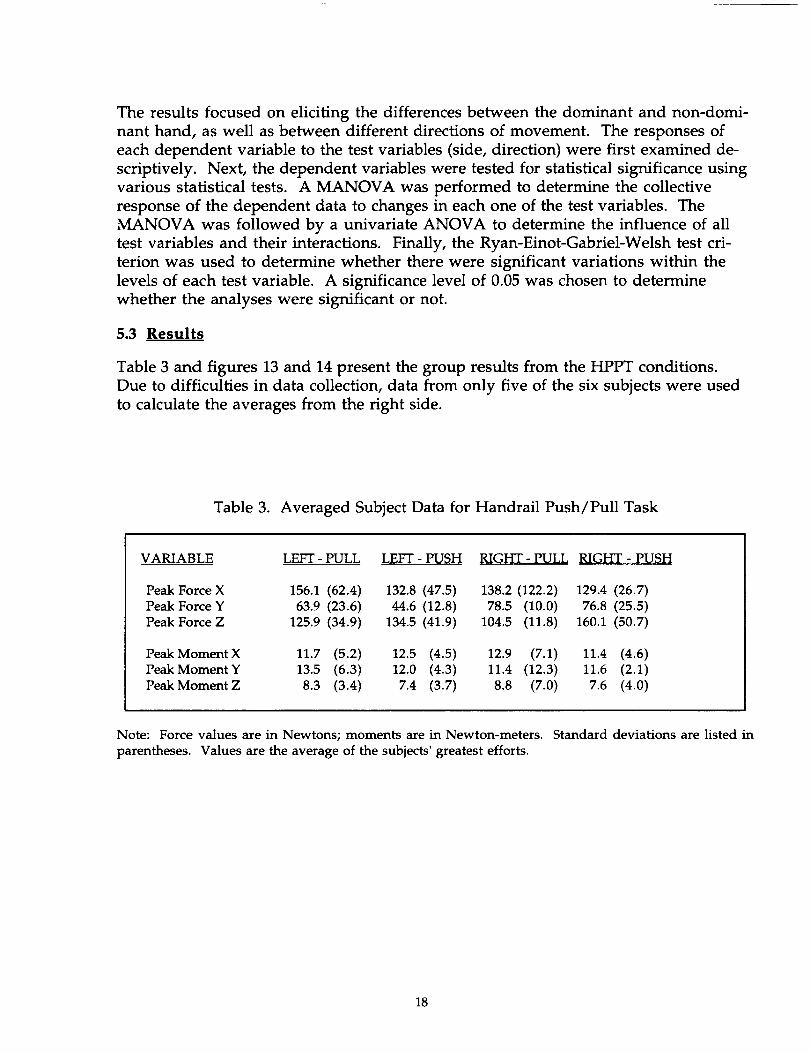
5.3 Results
Table 3 and figures 13 and 14 present the group results from the HPPT conditions.
Due to difficulties in data collection, data from only five of the six subjects were used
to calculate the averages from the right side.
Table 3. Averaged Subject Data for Handrail Push/Pull Task
VARIABLE LEFT - PULL LEFT - PUSH RIGHT - PULL RIGHT - PUSH
Peak Force X 156.1 (62.4) 132.8 (47.5) 138.2 (122.2) 129.4 (26.7)
Peak Force Y 63.9 (23.6) 44.6 (12.8) 78.5 (10.0) 76.8 (25.5)
Peak ForceZ 125.9 (34.9) 134.5 (41.9) 104.5 (11.8) 160.1 (50.7)
Peak Moment X 11.7 (5.2) 12.5 (4.5) 12.9 (7.1) 11.4 (4.6)
Peak Moment Y 13.5 (6.3) 12.0 (4.3) 11.4 (12.3) 11.6 (2.1)
Peak Moment Z 8.3 (3.4) 7.4 (3.7) 8.8 (7.0) 7.6 (4.0)
Note: Force values are in Newtons; moments are in Newton-meters. Standard deviations are listed in
parentheses. Values are the average of the subjects' greatest efforts.
18
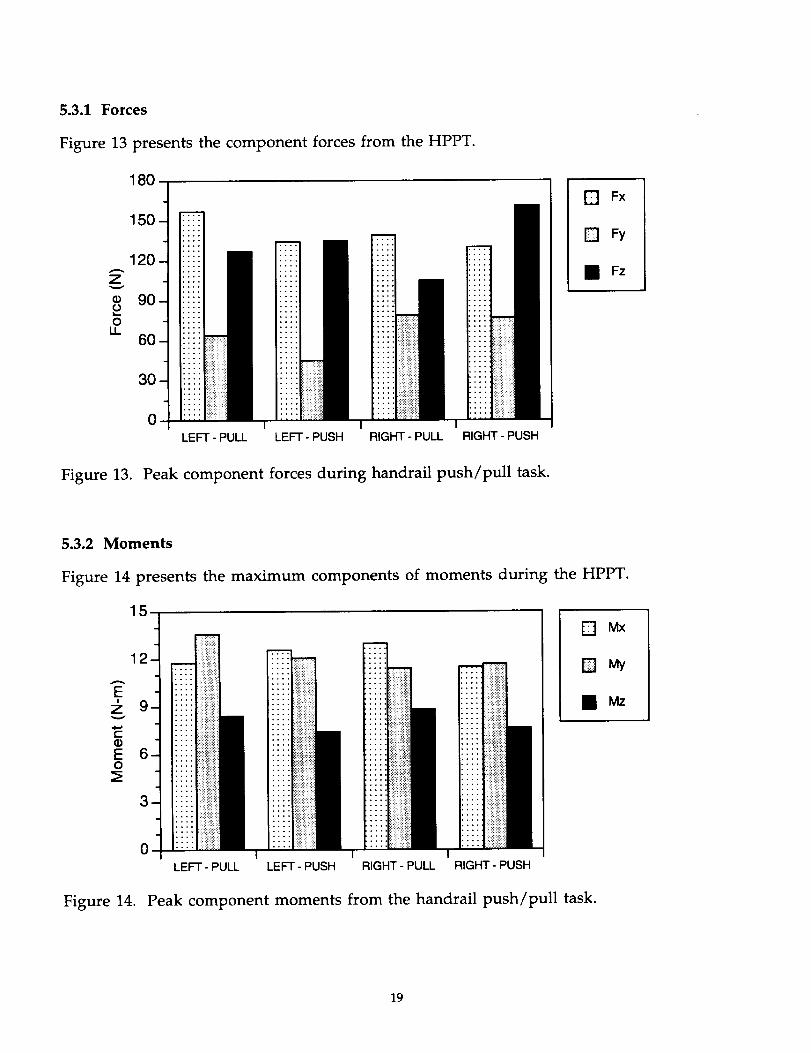
5.3.1 Forces
Figure 13 presents the component forces from the HPPT.
180
150
120
z
90oO
LL60
30
.
Figure 13. Peak
LEFT - PULL LEFT - PUSH RIGHT - PULL
.... 4
.... 4
RIGHT - PUSH
component forces during handrail push/pull task.
[] Fx
[] Fy
• Fz
5.3.2 Moments
Figure 14 presents the maximum components of moments during the HPPT.
EI
Z
t-OEO
15
, • ..1:::• • .e:• • .1::::
b .... I:::• • .i:::
:: :i_• • ,il_
• • ,t_•..¢:_
: : :1
RIGHT - PULL
iiii iiiiiiiiil
-PUSH
[] Mx
•Mz
Figure 14. Peak component moments from the handrail push/pull task.
19

5.3.3 Statistical Analysis
Multivariate analyses on the data from the HPPT revealed that none of the test con-
ditions affected the dependent measure set significantly. Subsequent univariate
ANOVAs also showed that none of the dependent measures, with the exception of
the Y force, varied significantly as a function of the side or the direction. The Y force
was significantly higher with the right hand than with the left hand (p < 0.05).
5.4 Discussion
Recall that the purpose of the HPPT was to generate a maximal amount of force in the
direction normal to the work surface. The subjects seemed to have difficulty per-
forming this task. The only method for generating a force normal to the surface (Z-
direction) with one hand was to tilt the body with respect to the supporting hand
(figure 3).
The peak force in the X direction was usually greater than the force in the Z direction.
The average peak X force across the test conditions was about 139 N and the average
peak Z force was about 131 N.
The Y force was significantly greater with the right hand than with the left hand. The
average Y force with the right hand was about 78 N and with the left hand was 54 N
(30%). The X, Y, and Z moments showed no significant trends across different hands
as well as across push and pull conditions. The X and Y moments averaged 12.2 N.m
and the Z moment averaged 8.1 N.m.
A major limitation of this study was the small number of subjects due to limited
access to the zero-gravity environment on the KC-135 aircraft. Because of this, care
had to be taken in reviewing the results. With a larger sample size, additional
statistical differences would most likely have been noted.
6. POWER TOOL TASK
6.1 Description of Task
The operator used the HST power tool to loosen and tighten bolt fasteners. One hand
held the tool and the other hand grasped the EVA handrail (figure 3). A description
of the HST power tool can be found in Appendix A.
6.2 Methods
6.2.1 Experimental Procedures
For the PTT, the subject was handed the power tool that had already been set for the
direction of rotation for that parabola. His other hand grasped the handrail attached
to the force platform.
2o
The subject attempted to engage the tool on the bolt fixture. Once the tool was en-
gaged, he turned it on and tightened or loosened the bolt for a couple of seconds
(figure 3). Force plate data were collected during the zero-gravity interval.
6.2.2 Experimental Design
A repeated measures design was used in this study. The independent variables were
the hands (dominant vs. non dominant), and the direction of rotation of the tool
(tighten vs. loosen). Each subject repeated the trials twice for each hand and for each
task. The dependent variables included the three components of force and the three
components of the moment from the handrail.
Each subject performed about two trials of each test condition, a test condition being
one of the four combinations of hand and direction. Some trials were missed due to
experimental tools malfunctioning and the lack of time for the subject to position
himself properly. When time was available, missed test conditions were repeated.
6.2.3 Data Treatment
Raw data were in the form of six channels of time-based data for each parabola (three
forces and three moments from the forceplate) for the duration of the zero-gravity
interval. The window of data corresponding to the actual performance of the task was
determined from plots of the data and from the video recordings. Within each win-
dow, the peak magnitude for each of the six channels was obtained. For comparison
purposes, necessary manipulation of the data was performed in order to change the
coordinate system from one based on the forceplate to one based on the subject.
6.2.4 Data Analysis
For this task, in which the goal was to determine nominal loads while the task was
performed, the average of the multiple trials was taken as representative for each
subject. The results focused on eliciting the differences between the dominant andnon-dominant hand, as well as between different directions of rotation of the tool.
6.3 Results
Unlike the other three tasks, the PTT was very difficult to perform in the simulated
zero-gravity environment. This was primarily due to the lack of time for the subjects
to position themselves in front of the test site and to position the tool on the bolt. In
addition, it was difficult for the subjects to prevent rotation of their bodies while using
the tool. Thus many of the trials of this task did not result in useful data.
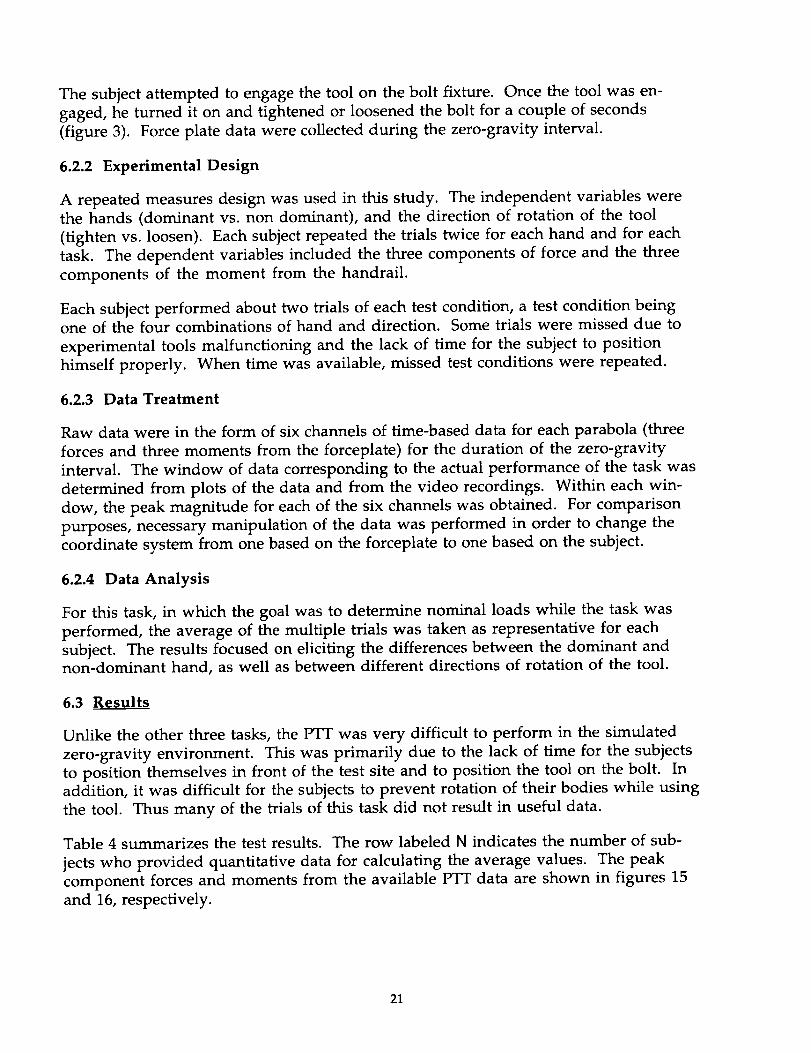
Table 4 summarizes the test results. The row labeled N indicates the number of sub-
jects who provided quantitative data for calculating the average values. The peak
component forces and moments from the available PTT data are shown in figures 15
and 16, respectively.
21
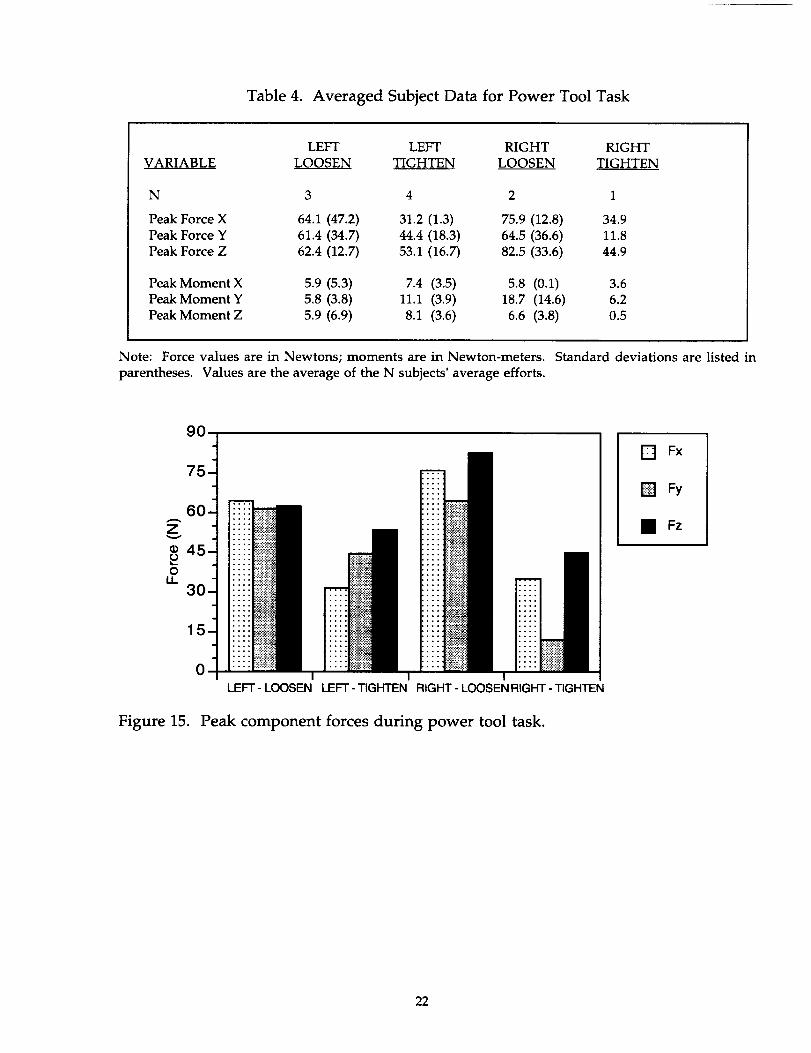
Table 4. Averaged Subject Data for Power Tool Task
LEFT LEFT RIGHT RIGHT
VARIABLE LOOSEN TIGHTEN LOOSEN TIGHTEN
N 3 4 2 1
Peak Force X 64.1 (47.2) 31.2 (1.3) 75.9 (12.8) 34.9
Peak Force Y 61.4 (34.7) 44.4 (18.3) 64.5 (36.6) 11.8
Peak Force Z 62.4 (12.7) 53.1 (16.7) 82.5 (33.6) 44.9
Peak Moment X 5.9 (5.3) 7.4 (3.5) 5.8 (0.1) 3.6
PeakMoment Y 5.8 (3.8) 11.1 (3.9) 18.7 (14.6) 6.2
Peak Moment Z 5.9 (6.9) 8.1 (3.6) 6.6 (3.8) 0.5
Note: Force values are in Newtons; moments are in Newton-meters. Standard deviations are listed in
parentheses. Values are the average of the N subjects' average efforts.
I [] Fx
[] Fy
• Fz
O.
LEFT - LOOSEN LEFT - TIGHTEN RIGHT - LOOSEN RIGHT - TIGHTEN
Figure 15. Peak component forces during power tool task.
22
20
16
Ez12
r-
E 80
4
0
LEFT - LOOSEN LEFT - TIGHTEN RIGHT - LOOSEN RIGHT - TIGHTEN
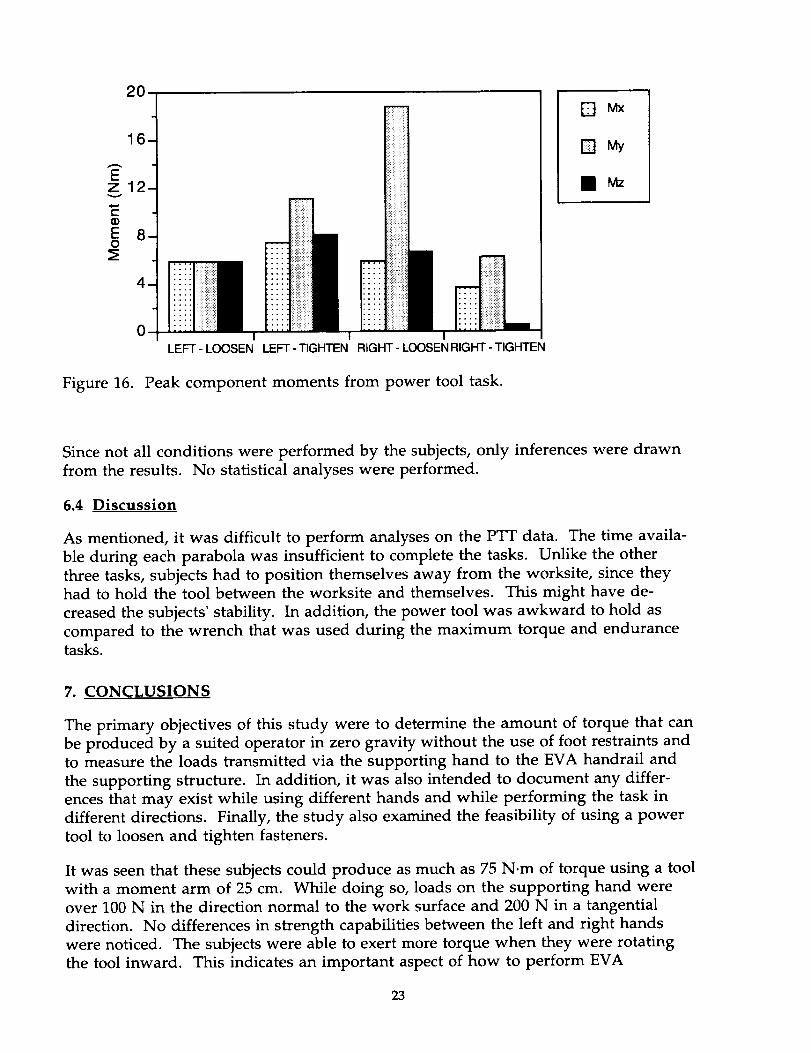
Figure 16. Peak component moments from power tool task.
[] Mx
[] My
• Mz
Since not all conditions were performed by the subjects, only inferences were drawn
from the results. No statistical analyses were performed.
6.4 Discussion
As mentioned, it was difficult to perform analyses on the PTT data. The time availa-
ble during each parabola was insufficient to complete the tasks. Unlike the other
three tasks, subjects had to position themselves away from the worksite, since they
had to hold the tool between the worksite and themselves. This might have de-
creased the subjects' stability. In addition, the power tool was awkward to hold as
compared to the wrench that was used during the maximum torque and endurancetasks.
7. CONCLUSIONS
The primary objectives of this study were to determine the amount of torque that can
be produced by a suited operator in zero gravity without the use of foot restraints and
to measure the loads transmitted via the supporting hand to the EVA handrail and
the supporting structure. In addition, it was also intended to document any differ-
ences that may exist while using different hands and while performing the task in
different directions. Finally, the study also examined the feasibility of using a power
tool to loosen and tighten fasteners.
It was seen that these subjects could produce as much as 75 N.m of torque using a tool
with a moment arm of 25 cm. While doing so, loads on the supporting hand were
over 100 N in the direction normal to the work surface and 200 N in a tangential
direction. No differences in strength capabilities between the left and right hands
were noticed. The subjects were able to exert more torque when they were rotating
the tool inward. This indicates an important aspect of how to perform EVA
23
operations: to maximize the effort and perform a task more effectively, suited
crewmembers should be trained to position themselves so that their hand operationresults in inward rotation. This increased effort with inward rotation or decreased
effort with outward rotation can be best utilized in a zero-gravity environment if
other equipment does not restrict the crewmember's position. This should be con-
sidered when designing a work space.
The power tool was very difficult to use. For efficient use of this tool, it may be neces-
sary to redesign it in such a way that the subjects could still keep their bodies close to
the work site. Hence, it is recommended that the tool designers should conduct ergo-
nomic evaluations to optimize the use of power tools in space.
8. FUTURE RECOMMENDATIONS
It is recommended that future tests of this nature should be conducted in zero gravity
without the suit on to document the strength decrements that occur while wearing a
pressurized suit. It is also suggested that trials be conducted using PFRs so that we can
determine the benefits and/or disadvantages of performing these tasks with and
without the foot restraints. Finally, it is recommended that the tool designers should
conduct ergonomic evaluations in order to optimize the use of power tools in space.
24
APPENDIX A

HANDRAIL, EVA
$88-32969
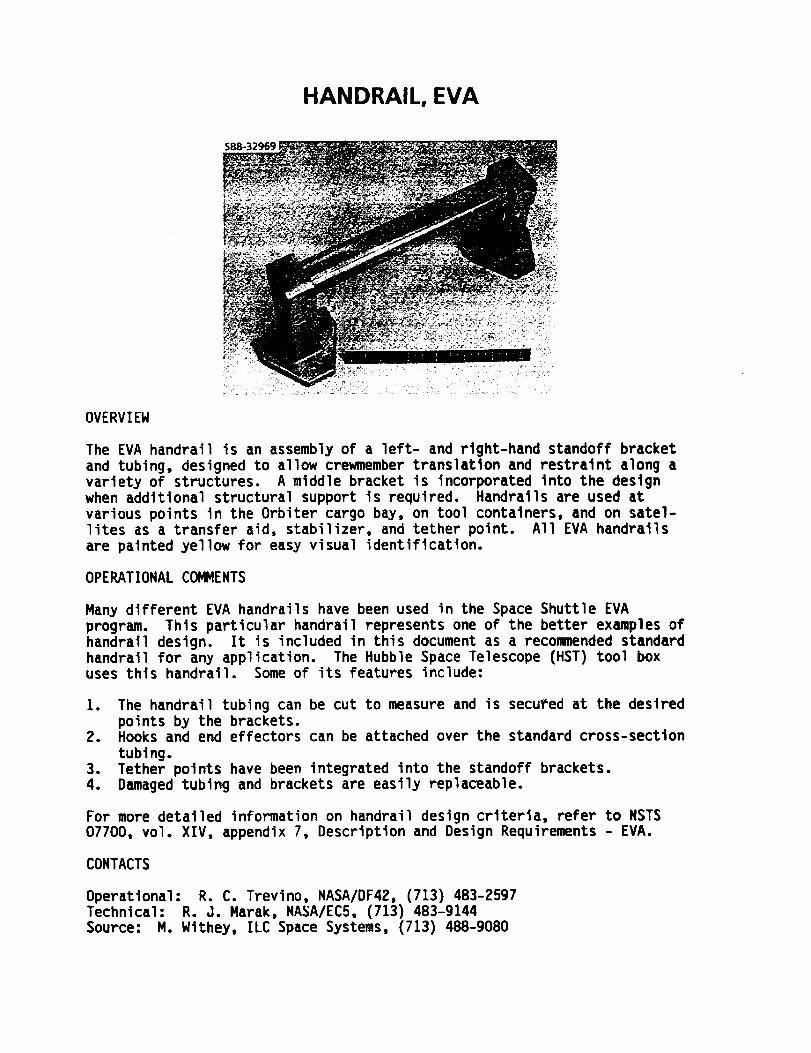
OVERVIEW
The EVA handrail is an assembly of a left- and rlght-hand standoff bracket
and tubing, designed to allow crewmember translation and restraint along a
variety of structures. A middle bracket is incorporated into the design
when additional structural support is required. Handrails are used at
various points in the Orbiter cargo bay, on tool containers, and on satel-
lites as a transfer aid, stabilizer, and tether point. All EVA handrails
are painted yellow for easy visual identification.
OPERATIONAL COMMENTS
Many different EVA handrails have been used in the Space Shuttle EVA
program. This particular handrail represents one of the better examples of
handrail design. It is included in this document as a recommended standardhandrail for any application. The Hubble Space Telescope (HST) tool boxuses this handrail. Some of its features include:
1. The handrail tubing can be cut to measure and is secured at the desired
points by the brackets.2. Hooks and end effectors can be attached over the standard cross-sectlon
tubing.3. Tether points have been integrated into the standoff brackets.
4. Damaged tubing and brackets are easily replaceable.
For more detailed information on handrail design criteria, refer to NSTS
07700, vol. XIV, appendix 7, Description and Design Requirements - EVA.
CONTACTS
Operational: R. C. Trevino, NASA/DF42, (713) 483-2597
Technical: R. J. Marak, NASA/EC5, (713) 483-9144
Source: M. Withey, ILC Space Systems, (713) 488-9080
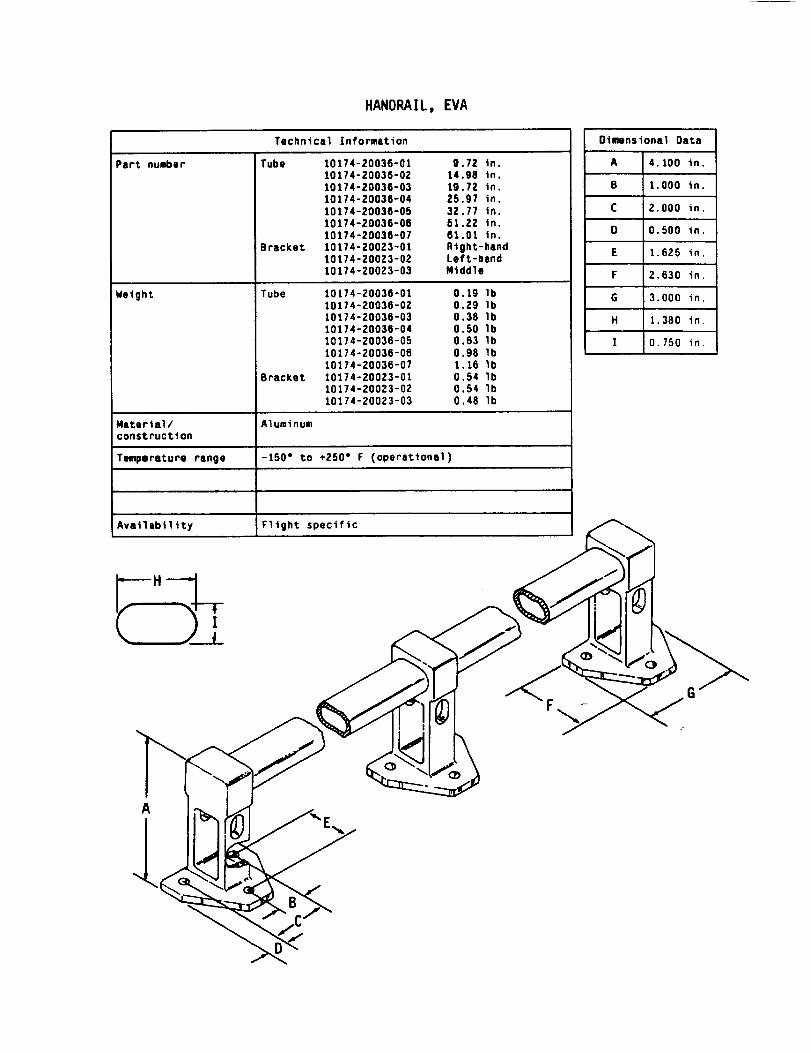
HANDRAIL, EVA
Technical Information
Part number
Weight
Tube 10174-20036-0110174-20036-02I0174-20038-0310174-Z0036-0410174-20036-0810174-20036-0810174-20036-07
Bracket 10174-200Z3-0110174-20023-0210174-200Z3-03
Tube 10174-20038-0110174-20036-0Z10174-Z0036-0310174-20036-0410174-20036-0510174-20036-0610174-20038-07
Bracket I0174-200Z3-0110174-200Z3-0Z10174-20023-03
9.72 in.14.08 in.19.72 in.25.97 in.32.77 in.81.ZZ in.61.0t in.Right-handLeft-handMiddle
Material/ Aluminumconstruction
Temperature range -150" to +250" F (operational)
Availability Flight specific
0.19 lb0.29 lb0.38 lb0.50 lb0.63 lb0.98 lb1.16 lb0.54 lb0.54 lb0.48 lb
Dimensional Data
A 4.100 in.
B 1.000 in.
C 2.000 in.
0 0.500 in.
E 1.6Z5 in.
F 2.630 in.
G 3.000 in.
H 1. 380 in.
I 0.750 in.
G
A
POWER TOOL, EVA (HST)
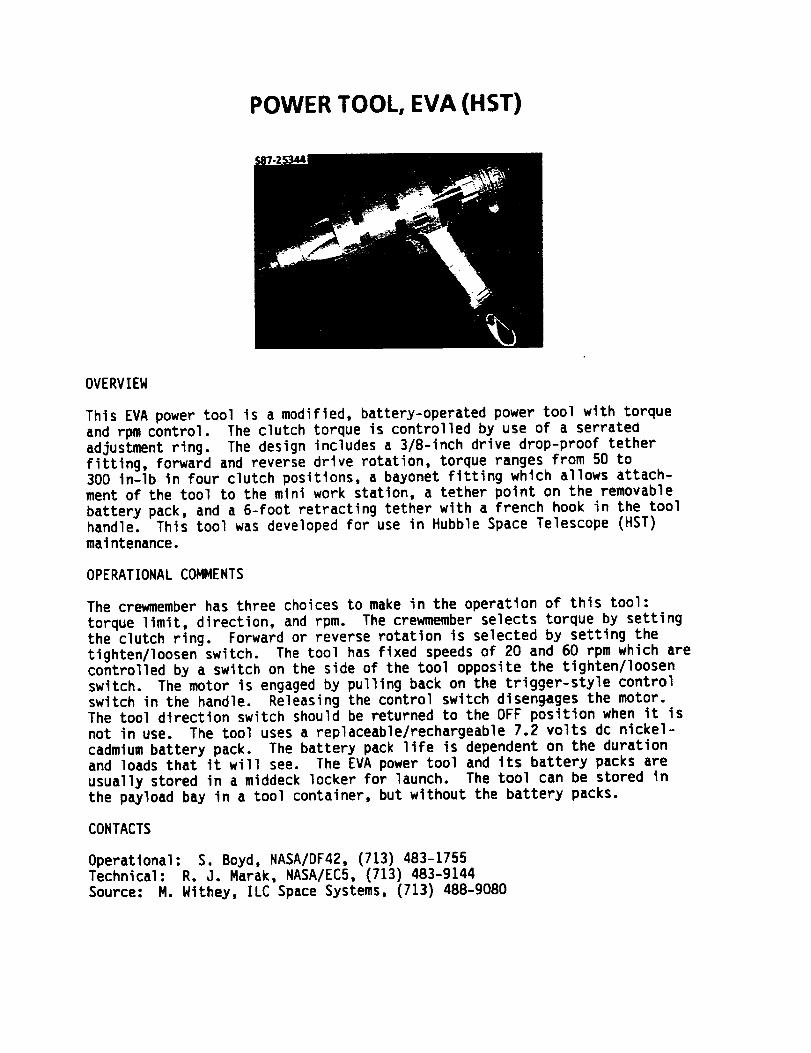
OVERVIEW
This EVA power tool is a modified, battery-operated power tool with torque
and rpm control. The clutch torque is controlled by use of a serrated
adjustment ring. The design includes a 3/B-inch drive drop-proof tether
fitting, forward and reverse drive rotation, torque ranges from 50 to300 in-lb in four clutch positions, a bayonet fitting which allows attach-ment of the tool to the mini work station, a tether point on the removable
battery pack, and a 6-foot retracting tether with a french hook in the toolhandle. This tool was developed for use in Hubble Space Telescope (HST)
maintenance.
OPERATIONAL COMMENTS
The crewmember has three choices to make in the operation of this tool:
torque limit, direction, and rpm. The crewmember selects torque by settingthe clutch ring. Forward or reverse rotation is selected by setting the
tighten/loosen switch. The tool has fixed speeds of 20 and 60 rpm which arecontrolled by a switch on the side of the tool opposite the tighten/loosen
switch. The motor is engaged by pulling back on the trigger-style controlswitch in the handle. Releasing the control switch disengages the motor.
The tool direction switch should be returned to the OFF position when it is
not in use. The tool uses a replaceable/rechargeable 7.2 volts dc nickel-
cadmium battery pack. The battery pack life is dependent on the durationand loads that it will see. The EVA power tool and its battery packs are
usually stored in a middeck locker for launch. The tool can be stored in
the payload bay in a tool container, but without the battery packs.
CONTACTS
Operational: S. Boyd, NASA/DF42, (713) 483-1755Technical: R. J. Marak, NASA/EC5, (713) 483-9144
Source: M. Withey, ILC Space Systems, (713) 488-9080
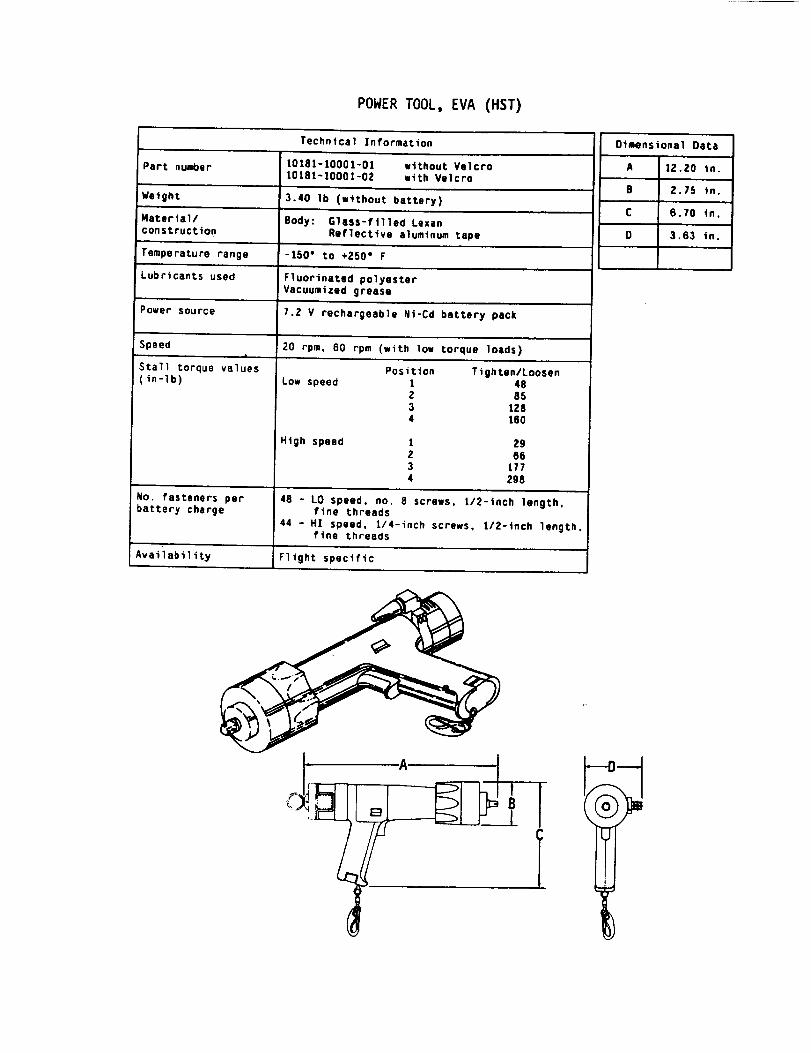
POWER TOOL, EVA (HST)
Technical Information
Part number 10181-10001-01 without Velcro10181-10001-02 with Velcro
Weight 3.40 lb (without battery)
Material/construction
Temperature range
Lubricants used
Power source
Speedm
Stall torque values(in-lb)
No. fasteners perbattery charge
Avaiiability
Body: Glass-filled Lexan
Reflective aluminum tape
-150" to +Z50 ° F
Fluorinated polyesterVacuumized grease
7.Z V rechargaable Ni-Cd battery pack
20 rpm. 60 rpm (with low torque loads)
Low speed
High speed
Position Tighten/Loosen1 48Z 853 1Z84 160
1 Z9Z 663 1774 Z98
48 - LO speed, no. 8 screws, 1/Z-inch length,fine threads
44 - HI speed, 1/4-inch screws, 1/Z-inch length.fine threads
Flight specific
Dimensional Data
A 12.Z0 in.
B 2.75 in.
C 6.70 in.
D 3.63 in.
.4,


Fon'nApprovedREPORT DOCUMENTATION PAGE OMBNo.0"104-01_
Public reporting burden for this collection of information is eat|mated to average 1 hour per response, including the time for reviewing inlrtrucbons, seltrchlr_ existing data sources, gathering andrnalntatning the data needed, and oompletirtg and revle_ng the collection of Infomlation. Sand ,_omrnenta regarding this burden estimate or any other aspect of this collection of information,inctud|ng suggestions for reducing.this burden, to Washington Headquarters Services, Directorate for information Operations and Reports, 1215 Jeftemon Davis Highway, Sude 1204, Arlington,VA 22202-4302, and to the Offtce of Management and Budget, Paperwork Reductmn Project (0704-0188), Washington, DC 20503.
1. AGENCY USE ONLY (Leave Bank) 2. REPORT DATE 3. REPORT TYPE AND DATESCOVERED
11/01/93 Technical Paper4. TITLE AND SUBTITLE
Loads Produced by a Suited Subject Performing Tool Tasks Without the Use of FootRestraints
6. AUTHOR(S)Sudhakar L. Rajulu*, Jeffrey Poliner*, and Glenn Klute
7. PERFORMING ORGANIZATION NAME(S) AND ADDRESS(ES)Anthropometric and Biomechanics LaboratoryNASA Johnson Space CenterHouston, Texas 77058
9. SPONSORING/MONITORING AGENCY NAME(S)AND ADDRESS(ES)National Aeronautics and Space AdministrationWashington, D. C. 20546-0001
5. FUNDING NUMBERS
8. PERFORMING ORGANIZATIONREPORT NUMBERS
S-744
10. SPONSORING/MONITORINGAGENCY REPORT NUMBER
NASA TP-3424
11. SUPPLEMENTARY NOTES
*Lockheed Engineering and Sciences CompanyHouston, Texas
12a. DISTRIBUTION/AVAILABILITYSTATEMENTUnclassified/unlimited
Subject Category 54
Available from the NASA Center for Aerospace Information, 800 Elkridge LandingRoad, Linthicum Heights, MD 21090; (301)621-0390
12b. DISTRIBUTIONCODE
13. ABSTRACT (Max/mum200 words)
With an increase in the frequency of extravehicular activities (EVA,s) aboard the Space Shuttle, NASA is interested indetermining the capabilities of suited astronauts while performing manual tasks during an EVA, in particular the situations in
Iwhich portable foot restraints are not used to stabilize the astronauts. Efforts were made to document the forces that are
transmitted to spacecraft while pushing and pulling an object as well as while operating a standard wrench and an automaticpower tool. The six subjects studied aboard the KC-135 reducod gravity aircraft were asked to exert a maximum torque and to
maintain a constant level of torque with a wrench, to push and pull an EVA handrail, and tooperate an HST power tool.
I The results of this study give an estimate of the forces and moments that an operator will transmit to the handrail as well as tothe supporting structure. In general, it was more effective to use the tool inwardly toward the body rather than away from thebody. There were no differences in terms of strength capabilities between right and let_ hands. The power tool was difficult touse. It is suggested that ergonomic redesigning of the power tool may increase the efficiency of power tool use.
14. SUBJECT TERMS
Gloves, extravehicular activity, EVA, human factors engineering, torque, power tool, handrail
17 SECURITY CLASSIFICATIONOF REPORT
unclassified
18. SECURITY CLASSIFICATIONOF THIS PAGE
19. SECURITY CLASSIFICATIONOF ABSTRACT
NSN 7540-O1-280-5500unclassified unclassified
15. NUMBER OF PAGES38
16. PRICE CODE
20. UMITATION OF ABSTRACTUL
StandardForm298 (Rev 2-89)Preec_ribed by ANSI Std. 238-18298-IO2


![HadoopDB: An Architectural Hybrid of MapReduce and ... - dslam…dslam.cs.umd.edu/hadoopdb/hadoopdb.pdf · [8] are best suited for performing analysis at this scale since they were](https://img.dokumen.tips/doc/110x75/5b810b647f8b9a2b678b6fdc/hadoopdb-an-architectural-hybrid-of-mapreduce-and-8-are-best-suited.jpg)