Embed Size (px)
Citation preview

The Pennsylvania State University
The Graduate School
Department of Civil and Environmental Engineering
LOAD TRANSFER MECHANISM OF PIER-SUPPORTED-RAFT
FOUNDATION SUBJECTED TO VERTICAL LOAD
A Dissertation in
Civil Engineering
by
Xinli Wu
©2011 Xinli Wu
Submitted in Partial Fulfillment
of the Requirements
for the Degree of
Doctor of Philosophy
May 2011
The dissertation of Xinli Wu was reviewed and approved* by the following:
Mian C. Wang
Professor of Civil Engineering
Dissertation Advisor
Chair of Committee
Derek Elsworth
Professor of Energy and Mineral Engineering
Virendra Puri
Professor of Agricultural Engineering
Andrew Scanlon
Professor of Civil Engineering
Peggy A. Johnson
Professor of Civil Engineering
Head of the Department of Civil and Environmental Engineering
*Signatures are on file in the Graduate School

iii
ABSTRACT
The pier-supported-raft foundation is a relatively new and effective foundation system
commonly used to support high rise buildings. This research investigated the load transfer
mechanism and settlement behavior for such a foundation system in order to enhance the existing
database that can be used for development of a rational design methodology. Two major tasks
were performed: literature review and finite element analysis. The literature review was
conducted to update the current state of knowledge on the behavior and design methodology for
pier-supported-raft foundation. The finite element analysis was conducted to analyze the load
transfer mechanism, foundation settlement, and load distribution between raft and piers for such
a foundation subjected to uniformly distributed vertical load.
In the finite element analysis, the reinforced concrete raft and pier were characterized as
elastic materials, while the foundation soil as an elasto-plastic material that obeys the Drucker-
Prager yield criterion. The commercial software ABAQUS was adopted in the analysis. The
computer FEA model was verified and validated by comparison of load vs. settlement curve
obtained through a published laboratory model test data with that predicted by FEA. The two
sets of data agreed fairly well within the reasonable range of error. Therefore, it was concluded
that FEA is an effective tool for analyzing the load transfer mechanism and settlement behavior
iv
for such type of foundation system. The load transfer mechanism, foundation settlement, and
raft load ratio of pier-supported-raft foundation subjected to uniformly distributed vertical
loading were analyzed with consideration of influence factors. Influence factors considered were
raft thickness and pier diameter, length, spacing, and total number, as well as soil properties.
Based upon the results of analysis, the effect of various influence factors on foundation
settlement, load transfer mechanism, and raft load ratio was determined. Also, the application to
design of an economic foundation was discussed. The research findings should enhance the
current database on overall foundation behavior. Furthermore, future studies needed for
upgrading and expanding the database for ultimate development of a rational and economical
design methodology for pier-supported-raft foundations are recommended.

v
TABLE OF CONTENTS
LIST OF FIGURES ....................................................................................................................... ix
LIST OF TABLES ........................................................................................................................ xii
LIST OF SYMBOLS ................................................................................................................... xiii
ACKNOWLEDGMENTS .......................................................................................................... xvii
Chapter 1 INTRODUCTION .......................................................................................................... 1
1.1 General ............................................................................................................................................ 1
1.2 Raft Foundations ............................................................................................................................. 2
1.3 Drilled Pier Foundations ................................................................................................................. 3
1.4 Problem Statement .......................................................................................................................... 8
1.5 Mission Statement ........................................................................................................................... 8
1.6 Research Hypothesis ....................................................................................................................... 8
1.7 Objectives and Scope of the Study ................................................................................................. 9
1.8 Justifications ................................................................................................................................... 9
1.9 Description of Research ................................................................................................................ 10
Chapter 2 LITERATURE REVIEW ............................................................................................. 11
2.1 Introduction ................................................................................................................................... 11
2.2 Load Transfer Mechanism of Pier-Supported-Raft Foundation ................................................... 12
2.3 Current Methods of Analysis and Design ..................................................................................... 14
2.4 Design Considerations .................................................................................................................. 15
2.5 Design Criteria .............................................................................................................................. 17
2.5.1 Total settlement .................................................................................................................. 18
vi
2.5.2 Differential settlement ........................................................................................................ 18
2.5.3 Ultimate bearing capacity .................................................................................................. 19
Chapter 3 BACKGROUND THEORY ........................................................................................ 20
3.1 Introduction ................................................................................................................................... 20
3.2 A Brief Introduction to ABAQUS ................................................................................................ 21
3.3 Nonlinear Elastic-plastic Isoparametric Finite Element Method of Analysis ............................... 22
3.3.1 Three-dimensional 8-node isoparametric finite element equation ..................................... 22
3.3.2 Solution of nonlinear problems .......................................................................................... 27
3.4 The Extended Drucker-Prager Elasto-plastic Model .................................................................... 29
3.4.1 Basic theory of elasto-plastic model .................................................................................. 29
3.4.2 Extended Drucker-Prager model ........................................................................................ 36
3.5 Contact Surface Characteristics .................................................................................................... 40
Chapter 4 MODEL VALIDATION .............................................................................................. 43
4.1 Introduction ................................................................................................................................... 43
4.2 Model Verification ........................................................................................................................ 43
4.2.1 Laboratory test ................................................................................................................... 43
4.2.2 Finite element analysis ....................................................................................................... 46
4.2.3 Drucker-Prager model validation ....................................................................................... 49
Chapter 5 FINITE ELEMENT ANALYSIS ................................................................................. 52
5.1 Introduction ................................................................................................................................... 52
5.2 FEA Model .................................................................................................................................... 52
Chapter 6 LOAD TRANSFER MECHANISM ............................................................................ 59
6.1 Introduction ................................................................................................................................... 59
6.2 Vertical Soil Pressure Distribution under Raft.............................................................................. 60
6.3 Vertical Soil Pressure Distribution in the Foundation System ...................................................... 61
6.4 Vertical Axial Load Distribution along Piers................................................................................ 68
vii
6.5 Skin Resistance Distribution along Piers ...................................................................................... 74
6.6 Raft/Pier Load Distribution ........................................................................................................... 75
6.6.1 Raft thickness effect ........................................................................................................... 76
6.6.2 Pier diameter effect ............................................................................................................ 77
6.6.3 Pier spacing ........................................................................................................................ 78
6.6.4 Pier length effect ................................................................................................................ 79
6.6.5 Pier number effect .............................................................................................................. 79
6.6.6 Soil property effect............................................................................................................. 81
6.7 Summary ....................................................................................................................................... 82
Chapter 7 SETTLEMENT BEHAVIOR ...................................................................................... 83
7.1 Introduction ................................................................................................................................... 83
7.2 Settlement Behavior of Pier-Supported-Raft Foundation ............................................................. 83
7.3 Total Settlement ............................................................................................................................ 87
7.3.1 Raft thickness effect ........................................................................................................... 87
7.3.2 Pier diameter effect ............................................................................................................ 87
7.3.3 Pier spacing effect .............................................................................................................. 89
7.3.4 Pier length effect ................................................................................................................ 90
7.3.5 Pier number effect .............................................................................................................. 92
7.3.6 Soil property effect............................................................................................................. 92
7.4 Differential Settlement .................................................................................................................. 94
7.4.1 Raft thickness effect ........................................................................................................... 94
7.4.2 Pier diameter effect ............................................................................................................ 95
7.4.3 Pier spacing effect .............................................................................................................. 96
7.4.4 Pier length effect ................................................................................................................ 97
7.4.5 Pier number effect .............................................................................................................. 98
7.4.6 Soil property effect............................................................................................................. 99

viii
7.5 Summary ....................................................................................................................................... 99
Chapter 8 ULTIMATE BEARING CAPACITY ........................................................................ 101
8.1 Introduction ................................................................................................................................. 101
8.2 Determination of Ultimate Bearing Capacity ............................................................................. 102
8.3 Influence Factors on Ultimate Bearing Capacity ........................................................................ 104
8.3.1 Raft thickness effect ......................................................................................................... 104
8.3.2 Pier diameter effect .......................................................................................................... 105
8.3.3 Pier spacing effect ............................................................................................................ 106
8.3.4 Pier length effect .............................................................................................................. 106
8.3.5 Pier number effect ............................................................................................................ 108
8.3.6 Soil property effect........................................................................................................... 109
8.4 Summary ..................................................................................................................................... 110
Chapter 9 DISCUSSION, SUMMARY, CONCLUSIONS, AND RECOMMENDATIONS .. 111
9.1 Discussion ................................................................................................................................... 111
9.2 Summary ..................................................................................................................................... 113
9.3 Conclusions ................................................................................................................................. 115
9.4 Recommendations ....................................................................................................................... 116
REFERENCES ........................................................................................................................... 118

ix
LIST OF FIGURES
Figure 1.1 Load distribution curves for test pier .................................................................... 6
Figure 1.2 Load-settlement curves for test pier (Reese, 1978) ............................................... 6
Figure 2.1 Schematic of composite piled raft foundation (Liang et al. 2003) ....................... 16
Figure 3.1 Three-dimensional 8-node element ..................................................................... 23
Figure 3.2 Yield curve (Linear Drucker-Prager yield criterion) .......................................... 36
Figure 3.3 Typical yield surfaces for the linear model in the deviatoric plane .................... 37
Figure 3.4 Schematic of hardening law and flow rule for the linear model ......................... 39
Figure 3.5 Normal stress characteristics for ―hard‖ contacts ............................................... 41
Figure 3.6 Coulomb shear characteristics............................................................................. 42
Figure 4.1 Schematic of the laboratory test apparatus (Cooke, 1986) ................................. 44
Figure 4.2 Plastic mold for forming the gypsum plaster raft around a 25 Pile Group of 150
mm long piles (Cooke, 1986) ........................................................................................ 45
Figure 4.3 Completed pile-supported-raft foundation for the laboratory test (Cooke, 1986)
....................................................................................................................................... 46
Figure 4.4 Computer model for pile-supported-raft foundation ........................................... 47
Figure 4.5 Computer model for the soil body ...................................................................... 47
Figure 4.6 FEA mesh for the computer model ..................................................................... 49
Figure 4.7 Load-settlement curves ....................................................................................... 50
Figure 5.1 Schematic of the foundation system in two-layered soils analyzed .................... 53
Figure 5.2 Mesh for the pier-supported-raft foundation ........................................................ 56
Figure 5.3 Mesh for the soils ................................................................................................. 56

x
Figure 6.1 Vertical soil pressure distribution underneath raft .............................................. 61
Figure 6.2 Illustration of vertical soil pressure distribution (Elevation view) ...................... 63
Figure 6.3 Illustration of vertical soil stress distribution (Plan view) .................................. 68
Figure 6.4 Vertical axial load distribution of center pier (Case 13) .................................... 69
Figure 6.5 Vertical axial load distribution of mid-edge pier (Case 13) ............................... 70
Figure 6.6 Vertical axial load distribution of corner pier (Case 13) .................................... 70
Figure 6.7 Vertical axial load distribution of center pier (Case 16) .................................... 71
Figure 6.8 Vertical axial load distribution of middle edge pier (Case 16) .......................... 72
Figure 6.9 Vertical axial load distribution of corner pier (Case 16) .................................... 72
Figure 6.10 Vertical axial load distribution of piers under ultimate bearing capacity for
single uniform soil lay (Case 16) and doule soil layers (Case 13) ................................ 73
Figure 6.11 Skin resistance distribution along pier length under ultimate bearing capacity
for three different piers at Case 13 ................................................................................ 74
Figure 6.12 Effect of foundation load on raft load ratio for different raft thicknesses ........ 76
Figure 6.13 Effect of foundation load on raft load ratio for various pier diameters ............ 78
Figure 6.14 Effect of foundation load on raft load ratio for different pier spacings ............ 79
Figure 6.15 Effect of foundation load on raft load ratio for different pier lengths .............. 80
Figure 6.16 Effect of foundation load on raft load ratio for different pier numbers ............ 80
Figure 6.17 Impact of foundation load on raft load ratio under different soil properties ..... 81
Figure 7.1 Illustration of settlement distribution on ¼ of a 16.2 m × 16.2 m raft ................ 84
Figure 7.2 Settlement distribution contours on ¼ of a 16.2 m × 16.2 m raft ....................... 85
Figure 7.3 Illustration of vertical soil displacement (settlement) distribution in the
foundation ...................................................................................................................... 86

xi
Figure 7.4 Influence of loading on settlement with raft thickness effect ............................. 88
Figure 7.5 Influence of loading on settlement with pier diameter effect ............................. 88
Figure 7.6 Influence of loading on settlement ...................................................................... 89
Figure 7.7 Relationship between equivalent elastic modulus and settlement ...................... 91
Figure 7.8 Influence of loading on settlement with pier length effect ................................. 91
Figure 7.9 Influence of loading on settlement with pier numbers effect .............................. 93
Figure 7.10 Influence of loading on settlement with soil property effect ............................ 93
Figure 7.11 Influence of loading on differential settlement with raft thickness effect ........ 95
Figure 7.12 Influence of loading on differential settlement with pier diameter effect ......... 96
Figure 7.13 Influence of loading on differential settlement with pier spacing effect .......... 97
Figure 7.14 Influence of loading pressure on differential settlement with pier length effect
....................................................................................................................................... 98
Figure 7.15 Influence of loading on differential settlement with pier number effect .......... 99
Figure 7.16 Influence of loading on differential settlement with soil property effect........ 100
Figure 8.1 Graphical illustration of the ultimate bearing capacity determination .............. 103
Figure 8.2 Effect of raft thickness on ultimate bearing capacity ........................................ 104
Figure 8.3 Effect of pier diameter on ultimate bearing capacity ........................................ 105
Figure 8.4 Effect of center-to-center pier spacing on ultimate bearing capacity ............... 106
Figure 8.5 Effect of pier length on ultimate bearing capacity ............................................ 107
Figure 8.6 Influence of pier number on ultimate bearing capacity .................................... 108
Figure 8.7 Effect of soil properties on ultimate bearing capacity ...................................... 109

xii
LIST OF TABLES
Table 2.1 Maximum allowable total settlement of some structures ..................................... 18
Table 5.1 Cases and parameters analyzed with FEA ............................................................ 54
Table 8.1 Case number and soil property ........................................................................... 110
xiii
LIST OF SYMBOLS
B Raft width
Bs Soil horrizontal boundary
[B] Matrix of strain
c Cohesion of soil
d Diameter of pier
df Intercept of the yield curve in the t-p coordinates
dg Intercept of the plastic potential curve in the t-p coordinates
Deijke Elastic modulus matrix
Dep
ijke Elasto-plastic modulus matrix
[D] Matrix of modulus
Eb Elastical modulus of brass
Ec Elastical modulus of concrete
Eg Elastical modulus of gypsum
Ep Equivalent elastic modulus of pier
Es Soil modulus of elasticity
f Yield function
fix Load at nodal point i in x direction

xiv
fiy Load at nodal point i in y direction
fiz Load at nodal point i in z direction
{f}e Element nodal load vector
F Failure criterion function
Fr Load carried by the raft
Ft Total load applied on raft
{F} Nodal load matrix
g Plastic potential function
H Height of the raft
Hm Hardening coefficient
I1 First stress invariant
J2 Second deviatoric stress invariant
J3 Third deviatoric stress invariant
K Ratio of triaxial tensile strength and compressive strength
Kf Plastic failure parameter
[K] Total stiffness matrix of the overall structure
[K]e Element stiffness matrix
L Length of pile
LL Liquid limit
Ls Depth to horrizontal boundary
n Number of piles
Nc Bearing capacity factor
Nq Bearing capacity factor

xv
Ni Shape function (i=1,8)
[N] Shape function matrix
p Applied load
P Normal contact stress
PI Plasticity index
PL Plastic limit
q Von Mises equivalent stress
qp Unit point resistance
qs Equivalent surcharge
{Q} Unbalance forces
r Parameter for D-P model
{R} Applied forces
Rp Pier load ratio expressed in %
Rr Raft load ratio expressed in %
s Center-to-center pier spacing
{S} Deviate stress tensor
S Settlement
t Parameter used to defined the D-P model
{u} Node displacement vector
ux Displacement in x direction
uy Displacement in y direction
uz Displacement in z direction
{u}e Nodal displacement vector of element

xvi
{U} Nodal displacement matrix
x, y, z Global coordinate
Angle of the yield curve in the t-p coordinates
Dilation angle in the p-t plan
Coefficient of friction
max Maximum equivalent shear stress
ult Ultimate shear stress
νb Poisson‘s ratio of brass
νc Poisson‘s ratio of concrete
νg Poisson‘s ratio of gypsum
νs Poisson‘s ratio of soil
Angle of internal friction of soil
γs Unit weight of soil
, , Local coordinate system of finite element
i, i, i Local coordinate of nodes (i =1,8)
{} Strain vector
{} Stress vector
m Mean stress
ij Total strain (i,j =1,3)
eij Elastic strain (i,j =1,3)
epij Plastic strain (i,j =1,3)
d Nonnegative scalar factor

xvii
ACKNOWLEDGMENTS
First and foremost, I would like to express my sincerest gratitude and appreciation to my
advisor, Dr. Mian C. Wang, Professor of Civil Engineering at Penn State, for offering me this
unique and invaluable opportunity to study at Penn State, for his patience, constant
encouragement, and insightful guidance. The door to Dr. Wang‘s office has always been open
whenever I need help from him. As his student, I feel extremely lucky to work with him and
enjoy the pleasant academic environment he created for me over the years. I appreciate from the
bottom of my heart that Dr. Wang has never lost his hope and faith in me. His inspiration, warm
personality, and his high standard of mentorship have won my highest respect and love. I am
forever indebted to him.
I would like to extend my gratitude to the members of my dissertation committee, Drs.
Derek Elsworth, Virendra Puri, and Andrew Scanlon for their consistent support, heart-felt
encouragement, and patience with this research as well as their concern for my future career. I
am very thankful for their invaluable time and constructive comments on the work contained
herein.
I would like to thank Prof. Mingshu Wang, my former professor and mentor at
Northeastern University in China, for his continuous encouragement and father-figured love. I
would also like to thank Dr. Shuwang Yan, Professor at Tianjin University and former visiting
scholar at Penn State, and Dr. Changlin Qiu, Associate Professor at Tianjin University and

xviii
former visiting scholar at Penn State for their collaboration on the research, constant
encouragement, and their invaluable help.
I would like to thank Dr. Sven Bilén, Head of the School of Engineering Design,
Technology, and Professional Programs (SEDTAPP) at Penn State for his consistent
encouragement, warm-hearted caring, invaluable help, and support from both personal and
professional level. Without his help, I would have a hard time to imagine that I could have
completed this Ph.D. program. I am very appreciative for many friends at Penn State for their
constant encouragement, help, and moral support, especially Dr. Renata S. Engel, Associate
Dean for Academic Programs in the College of Engineering, and Dr. Jean Landa Pytel, Chair of
Penn State University Faculty Senate, and Assistant Dean for Student Services in the College of
Engineering. I would like to thank the former Head of SEDTAPP, Dr. Dhushy Sathianathan,
Associate Dean for Academic Programs, College of Engineering, California State University at
Long Beach, for his continued encouragement and support. I would like to express my sincere
gratitude to Ms. Terry K. Reed, Coordinator for Graduate Studies & Fellowships in the Penn
State College of Engineering for her warm-hearted support and help in every aspect of the
paperwork and process of this Ph.D. program. I would like to thank Mr. Adam Hackenberg,
Network System Specialist at the SEDTAPP, for his assistance whenever I needed him. I would
also like to thank all my colleagues in the SEDTAPP for their wonderful support.
Finally, I wish to express my deepest gratitude beyond words and dedicate this work to
my parents and family for their unconditional love, encouragement, and support. I hope the
completion of this Ph.D. program will cure my mother‘s vision problem.
Chapter 1
INTRODUCTION
1.1 General
Foundations can be divided into two broad categories: shallow foundations and deep
foundations. Shallow foundations transmit the structural loads to the near surface soils, whereas
deep foundations transmit partial or all of the structural loads to deeper soils or bedrock. Pier-
supported-raft foundations refer to foundations in which the raft is rigidly fixed to the drilled
piers and is also directly supported by the soil. Therefore, pier-supported-raft foundations can be
considered as composite foundations of both shallow and deep foundations. Mats are often
referred to as rafts. The pier-supported-raft foundations are also called pier-supported-mat
foundations or (bored) pile-supported-raft foundations. Such a foundation system is often seen
under high-rise buildings supported by soft compressible soil stratum overlying feasible
attainable firm soil stratum.
There are quite a few studies related to pile-supported-raft foundations. However, from
these studies, the load transfer behavior of the pier-supported-raft foundations subjected to
vertical loads is not yet completely understood. Conduto (1994) indicated that the design of this

2
type of foundations (pile-supported-raft) could be done by simply considering the raft as a very
large pile cap with the piles carrying the entire structural loads. Others (Poulos and Davis, 1980;
Randolph and Clancy, 1993), on the other hand, have suggested that soil resistance acting on the
raft must be taken into consideration in the design of such a foundation system. There is,
however, no generally accepted methodology for analysis and design of such a foundation
system. For development of a rational methodology, the load transfer mechanism and settlement
behavior must be clearly understood.
In order to better understand the load transfer behavior of pier-supported-raft foundations
subjected to vertical loads, one should first fully understand what raft foundations and drilled
pier foundations are and how these foundations work.
1.2 Raft Foundations
A raft foundation, also known as mat foundation, is a large reinforced concrete slab that
supports all of the structural loads. A raft foundation is ideally used where the foundation soil is
weaker and more compressible, or when the structural loads exceed the point at which more than
half of the building footprint is covered by conventional spread footings. Compared to
conventional spread footings, raft foundations spread structural loads over a larger area thus
increasing the bearing capacity. They provide much greater structural rigidity and reduce the
potential for excessive differential settlement that is damaging to high-rise buildings. It is
common to use raft foundations for deep basements both for spreading the structural loads to a
more uniform pressure distribution and for providing the rigid floor slab for the basement. They
provide an essential waterproof layer for the structure when the basements are located at or

3
below the groundwater table. Raft foundations also distribute structural loads into the soil more
evenly and efficiently.
Generally speaking, raft foundations are directly supported by the ground. There are
situations, however, in which raft foundations may be supported by piers or piles without
touching the ground at locations with high groundwater table or large settlements.
According to Conduto (1994), the methods of analysis and design of raft foundations can
be divided into two broad categories of rigid and non-rigid methods. Both of these two
categories are mainly intended to estimate differential settlements and flexural stresses in the
raft, even though neither of these two methods gives reliable estimates of total settlement.
According to Bowles (1988), the raft foundations must be designed to limit settlement to a
tolerable amount. These settlements may include consolidation settlement together with any
secondary effects, immediate or elastic settlement, and a combination of both consolidation and
immediate settlement. A raft must also be stable against a deep shear failure. Raft foundations
are commonly used where settlement may be a problem. The flotation effect of a raft foundation
should enable most raft settlements, even where consolidation is a problem or piles are used, to
be within a limit of 50 to 80 mm. Raft foundations usually reduce differential settlement, which
is a more considerable concern to the design of such type of foundations.
1.3 Drilled Pier Foundations
A pier is a column-like foundation similar to a pile. Generally speaking, piers are
installed by means of excavation rather than driving. Drilled piers are normally constructed

4
using a power auger to drill holes that are then filled with reinforced or unreinforced concrete.
Drilled piers are also called drilled shafts, (large-diameter) bored piles, drilled caissons, and cast-
in-situ piles, or simply piles. Further, drilled shafts having a constant diameter are often termed
as straight shafts and those having an enlarged base are called belled or underreamed shafts
(Greer and Gardner, 1986).
Among the important considerations for using drilled pier foundations in preference to
other types of deep foundations are economy and quality assurance. According to Greer and
Gardner (1986), drilled piers have the following favorable features:
• Piers can be drilled through cobbles and small boulders.
• Reinforcing and form construction are minimized or eliminated.
• Pile hammer noise is eliminated.
• Rapid completion is an advantage.
• Vibration, heave, and ground displacement are minimized.
• Uplift resistance is easily provided, especially for belled shafts.
Surely, the following unfavorable features should also be considered when making the choice
between drilled piers and other types of foundations:
• Operations are affected by bad weather.
• Unfavorable soil conditions may interfere.
• More complete soil exploration is needed.
• Building codes and governmental regulations may be unfavorable.
• Inspection and technical supervision are critical.
• Ground loss may be substantial.
5
• Surface subsidence may occur.
Knowing how drilled piers work would give a better solution for the design of such a
foundation type in a safer and more economical way. Chang and Broms (1991) indicated that
the current design practice for drilled piers in residual soils in Singapore is primarily based on
the calculated static capacity of the piers. Insufficient consideration of the load-transfer
mechanism and over reliance on pier load test led to conservative designs. Therefore, some
studies on the design of drilled piers in residual soils based on field-performance data were
conducted. Since early 1980s, a number of studies have been carried out in Singapore on fully
instrumented drilled piers in the Old Alluvium and in residual soil with weathered rock
formation. Theses drilled piers are typically 0.6 to 1.2 m in diameter, 15 to 20 m in length, and
are designed to carry an axial load of approximately 1.8 to 7.0 MN. Their studies showed that
load transfer in these relatively stiff materials is primarily through shaft resistance and that,
under working load, the mobilized point or base resistance is usually small. Thus, the results
from load tests of the instrumented drilled piers in Singapore indicate that the shaft resistance
predominantly governs the behavior of drilled piers in the residual soils. Accordingly, it was
suggested that considering this observed load transfer mechanism in the design of drilled piers in
these and similar geological materials will result in a safer and more economical design.
Reese (1978) reported some significant findings on the load transfer mechanism of drilled
piers in stiff clays. Figure 1.1 shows the distribution of load as a function of depth. Figure 1.2
shows the load-settlement curves for the base and the sides of the drilled piers.

6
Figure 1.1 Load distribution curves for test pier
(1 ft = 0.305 m; 1 ton = 8.90 kN) (Reese, 1978)
Figure 1.2 Load-settlement curves for test pier (Reese, 1978)
(1 ft = 0.305 m; 1 ton = 8.90 kN)
7
Based upon dozens of instrumented piles in four major cities of Fujian Province, China,
Zhang et al. (1992) concluded that all of the drilled piers tested carry a significant portion of the
applied load in skin resistance, although the surrounding soils are very weak. The base condition
has little effect on the load transfer behavior of piers before the skin resistance is fully mobilized,
but a faulty base sharply decreases the total bearing capacity of the pier. It was also found that a
few millimeter displacements are enough to develop the ultimate skin resistance. Further
displacement significantly decreases the skin resistance in cohesive soils. Another interesting
point is that the settlement of pier foundation under working conditions could be estimated as
half of the compressive deformation of the shaft without the support of surrounding soils.
Drilled pier foundations are popularly used not only in the United States (Reese, 1978)
but also in many other countries (Greer and Garner, 1986). Examples include Austria (Brandl,
1985), Australia (Kingwell and Albrecht, 1989), Brazil (Nunes et al. 1985), Canada (Horvath et
al. 1989), China (Zhang et al. 1992), India (Sonpal and Dave, 1980), Japan (Horiuchi, 1985),
Poland (Jarominiak, 1989), Romania (Manoliu et al. 1985), Singapore (Chang and Broms, 1991),
Thailand (Promboon and Brenner, 1981), and the United Kingdom (Anderson et al. 1985),
among others.
Many other studies on drilled piers have been done for different loading conditions and
different soil conditions. Some notable studies include Armaleh and Desai (1987), Briaud and
Tucker (1998), Ferregut and Picornell (1991), Horvath, Kenney, and Kozicki (1983), Horvath,
Schebeshch, and Anderson (1989), Ismael (1988), Ismael and Klym (1978), Radhakrishnan and
Leung (1989), Rowe and Armitage (1987), and Sharma and Joshi (1988).
8
Heavy structures in areas with expansive soils are commonly founded on piers resting
beneath the expansive soils (Ferregut and Picornell, 1991). Jubenvill and Hepworth (1981)
indicated that drilled piers can be used to reduce foundation movements in lightly loaded
structures founded on expansive soils and bedrock. They also provided high capacity foundation
systems for very tall and mostly heavily loaded structures.
1.4 Problem Statement
The problem is that the load transfer mechanism and settlement behavior of pier-
supported-raft foundation subjected to uniformly distributed vertical loads has yet to be fully
understood. As a result, there is no generally accepted design methodology for such a
foundation system.
1.5 Mission Statement
The mission is to investigate the load transfer mechanism and settlement behavior of
pier-supported-raft foundations subjected to uniformly distributed vertical loads.
1.6 Research Hypothesis
It is hypothesized that the load transfer mechanism and settlement behavior of pier-
supported-raft foundations subjected to uniformly distributed vertical loads can be modeled
numerically using the method of finite element analysis, and also that the results of the analysis
can be used to predict the field performance of pier-supported-raft foundations.

9
1.7 Objectives and Scope of the Study
The objective of this study is to conduct a comprehensive investigation on the load
transfer mechanism and settlement behavior of the pier-supported-raft foundations subjected to
uniformly distributed vertical loads. An elasto-plastic finite element computer analysis program
called ABAQUS was adopted for analysis, and the computation model was validated using
available laboratory model test results. The ultimate goal of this study is to develop a generally
accepted methodology for analysis and design of the pier-supported-raft foundation.
This study is limited to pier-supported-raft foundations subjected to uniformly distributed
vertical loads only. The raft considered in this study was square in shape and was supported by
vertical piers. No groundwater effect was considered. Effects of consolidation and creep on
foundation behavior were not considered. Furthermore, the soil is assumed to be homogeneous
for a single layer or double layers only. For the double layered soils, the bottoms of piers are
inserted 0.5 m into the lower soil layer, which is stiffer and stronger than the upper soil layer.
This simulates the real conditions used in practice. Other limitations and constraints involved in
the study are detailed later in this study.
1.8 Justifications
The pier-supported-raft foundation is a relatively new type of foundation system. The
load transfer mechanism and settlement behavior of such a foundation system are not well
understood. In Particular, the ratio of the load carried by the raft over the total structural loads is
unclear. The settlement and bearing capacity characteristics of the pier-supported-raft
foundation under different conditions such as different raft thickness, pier diameter, center-to-
center pier spacing, and soil properties need to be investigated in sufficient detail in order to
10
understand the effect of various influencing factors on the behavior of such a foundation. The
results of the proposed study could lead to the formulation of a rational design methodology
suitable for application to such a type of foundation system.
1.9 Description of Research
This research involved two major tasks. Task 1 was a comprehensive literature review,
and task 2 was finite element analysis. The primary objective of the literature review was to find
the current status of the knowledge on the behavior and design practice for the pier-supported-
raft foundation. The results of the literature review are presented in Chapter 2. For task 2, the
load transfer mechanism and settlement behavior of pier-supported-raft foundations were
investigated using the method of finite element analysis. In this task, the background theory was
reviewed and presented in Chapter 3, followed by model evaluation in Chapter 4, finite element
analysis in Chapter 5, the results of analysis in Chapters 6 through 8, and conclusions in Chapter
9.

11
Chapter 2
LITERATURE REVIEW
2.1 Introduction
The pier-supported-raft foundation, as mentioned in Chapter 1, consists of a raft and
drilled piers. The raft is directly fixed on the top of the vertically drilled piers. Raft foundations
alone behave as shallow foundations. Drilled piers alone, on the other hand, function as deep
foundations. It is common to consider first the use of a shallow foundation system such as raft
foundation in foundation design practice and then, if it is not adequate, to consider the use of a
deep foundation system such as pile or pier foundation. In a deep foundation system, the entire
design loads are supported by the piles or piers. When a raft foundation alone cannot satisfy the
design requirements, it is possible to improve the performance of the raft by adding piles or piers
to the foundation system. Some related studies on the behavior of pier-supported-raft
foundations have been made. Sommer (1993), Yamashita et al. (1993), and Reese et al. (1993)
indicate that the piled raft foundations can reduce the overall settlement and tilt (i.e., differential
settlement). Yamashita, et al. (1994) conducted a study of a pile-supported-raft foundation
supporting a five-storey building and found that a piled raft foundation on stiff clay at large

12
spacing is also effective in reducing the total and differential settlements. Through several field
studies, the behavior of pile-supported-raft foundations has been increasingly understood. Also,
it is commonly recognized that the use of a pile-supported-raft foundation can be an economical
solution to reduce foundation settlement. However, there still are numerous issues that must be
addressed in the design of pier-supported-raft foundation systems. The current state of
knowledge on the various issues is reviewed below.
2.2 Load Transfer Mechanism of Pier-Supported-Raft Foundation
Wiesner and Brown (1980) performed some laboratory tests on four model pile-
supported-raft foundations in a large circular pot having an internal diameter of 590 mm and a
depth of 480 mm; the pot was filled with overconsolidated clay. The rafts were made of brass
plates, and the piles were solid brass rods and solid Perspex rods. The rafts were connected to the
piles with brass screws through holes in the raft. The raft was in direct contact with the surface
of the clay. It was assumed that the connection between the raft and piles cannot transfer
moment. The load was applied to the rectangular rafts by a loading device. They determined
that, for a pile-supported-raft foundation, the load is actually shared between the piles and raft.
The results of settlement and moment data obtained from these laboratory tests were compared
with the results determined from theoretical analysis, in which the Young‘s modulus values were
obtained through back calculation from the test results on single piles supporting small rigid
circular rafts. The comparison indicated a satisfactory agreement between the experimental and
theoretical data over the range of loads tested. This finding suggested that the theory based upon
the assumption that the soil is a linearly elastic continuum can provide satisfactory predictions of
the behavior of piled-raft foundations.

13
Some in-situ observations of such kind of piled rafts have been made, and the requisition
of field data should enhance the existing database for the development of a more effective design
methodology. Yamashita et al. (1994) conducted field monitoring of a pile-supported-raft
foundation on stiff clay with piles at large spacing to support a five-storey building structure.
The piles in the foundation system were designed to be fully mobilized under working load
condition. The field test showed that the foundation system was very effective in reducing both
the overall and differential settlements. At the time of completion of the building, the total
settlement reached about 10-20 mm and the load carried by the piles on the tributary area
reached 49% of the total building load.
Based on the studies on large buildings in London, Cooke (1986) stated that up to 30% of
the building load is carried by the raft, even when it is assumed in the design that the entire
building load is carried by the piles. His research data further indicated that, while rafts are less
likely to contribute more than 30% of the support, considerable contribution of the raft to the
ultimate bearing capacity of the foundation can be expected. Furthermore, Cookie's model tests
suggested that pile spacing could be increased and the numbers of piles substantially reduced
without a significant increase in overall settlements.
Kuwabara‘s (1989) research indicated that settlement reduction due to the presence of the
raft is very small although the raft transmits 20-40% of the applied load directly to the soil. Note
that the finding on settlement reduction by Kuwabara (1989) is somewhat contradictory to others
such as Hain and Lee (1978), Reese et al. (1993), Sommer (1993), and Yamashita et al. (1993).

14
The pier-supported-raft foundations and piled raft foundations have been successfully
used in many tall buildings around the world. For example, the 42-storey tower block of a
modern office complex constructed by the Port of Singapore Authority is supported by a 2 m
thick raft on 203 large diameter drilled piers (Leung and Radhakrishnan, 1985). Although the
pier-supported-raft foundations have been widely used around the world, there is a need to
develop a commonly accepted design methodology that can be effectively used in the design of
such a foundation system. To develop such a design methodology, a fully understood load
transfer mechanism as well as the general behavior of such foundation in a broad range of field
conditions is required.
2.3 Current Methods of Analysis and Design
The majority of piled raft foundations have been designed in such a way that all loads are
assumed to be carried by the piles even though it has long been recognized that the contribution
of the raft to the overall performance of such a foundation system can be significant, as indicated
by Cooke (1986) and Korikoshi and Randolph (1998), among others. This conservative
approach seems to be due to the limited understanding of the load transfer mechanism of such a
foundation system. Even though this conventional design is on the conservative side from a
standpoint of safety, it is obviously not economical. This conservative design approach
normally will result in using more piles and/or larger piles than necessary, leading to an overall
settlement below what otherwise could be tolerated by the structure. An optimum design
approach would fully utilize the foundation system so that the settlement of the foundation could
be controlled to an allowable level instead of suppressing it entirely.

15
Much attention has been directed toward studies of using piles to reduce the overall
and/or differential settlements rather than to carry the major portion of loads in such a foundation
system. The piles act as a settlement reducer. As such, quite a few studies have been conducted
to develop some analytical models for piled raft foundations (Clancy and Randolph, 1993;
Gotman and Gotman, 2001; Korikoshi and Randolph, 1998; Poulos 1994; Prakoso and Kulhawy,
2001; Small and Zhang, 2002). These numerous parametric studies are concerned with the
influence of system geometry and soil conditions on the performance of such foundation
systems. In addition, laboratory and field tests on such a foundation system have been
conducted, and the test results have provided some helpful insights on the behavior of piled raft
foundations (Horikoshi and Randolph, 1996; Wiesner and Brown, 1980; Wu et al. 1997).
2.4 Design Considerations
Similar to other foundation systems, many factors must be considered in the design of
pile-supported-raft foundations. According to Poulos (2001), these considerations include, but
are not limited to, the following:
• ultimate load capacity;
• maximum settlement and differential settlement;
• raft moments and shears for the structural design of the raft;
• pile loads and moments for the structural design of the pile.
The most effective application of the pile-supported-raft foundation is when the raft can
provide adequate load capacity, but the settlement and/or differential settlement of the raft alone
exceed allowable values. After examining a number of idealized soil profiles, Poulos (1991) has
16
found that the favorable situations in which to use such a foundation system are when the soil
profiles consist of relatively stiff clays and/or dense sands. In such cases, the rafts provide a
significant proportion of the required load capacity and stiffness while the piles act mainly to
improve the performance of the foundation rather than provide the major means of support.
Meanwhile, the unfavorable situations for such a foundation system are when the soil profiles
contain soft clays or loose sands near the surface, or soft compressible layers at relatively
shallow depths, or when the soil profiles will likely undergo consolidation settlement or swelling
movements due to external causes. However, some of these unfavorable situations can be easily
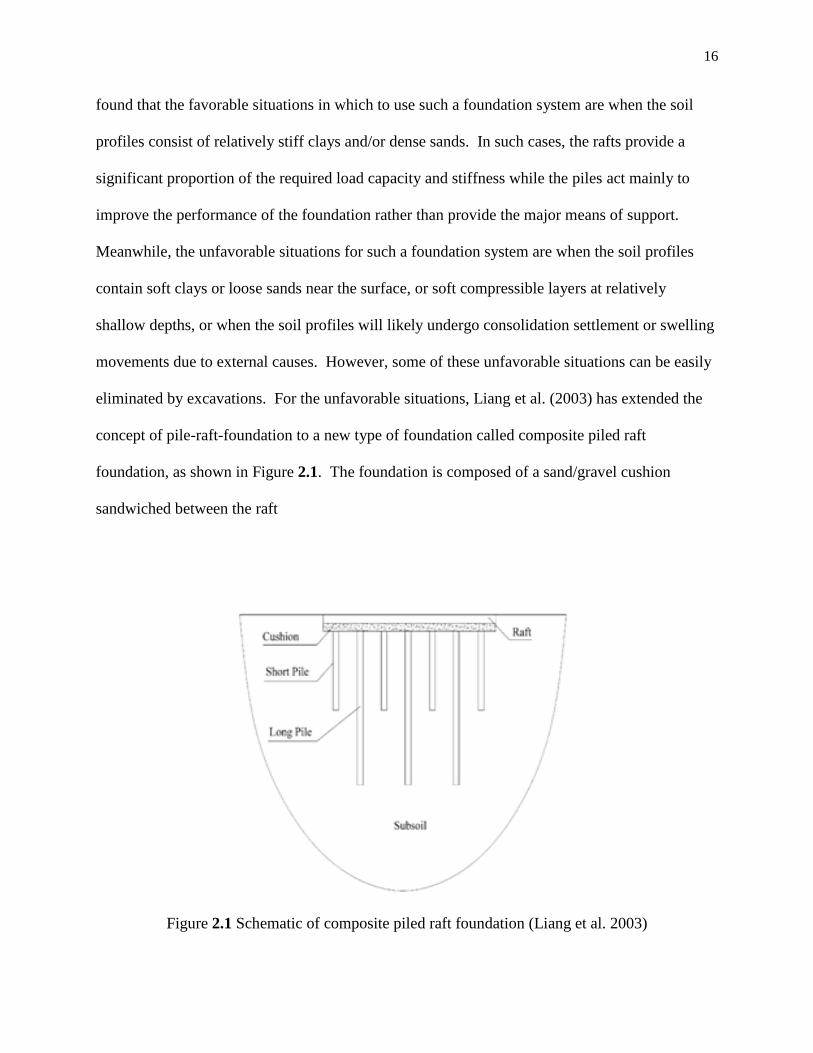
eliminated by excavations. For the unfavorable situations, Liang et al. (2003) has extended the
concept of pile-raft-foundation to a new type of foundation called composite piled raft
foundation, as shown in Figure 2.1. The foundation is composed of a sand/gravel cushion
sandwiched between the raft
Figure 2.1 Schematic of composite piled raft foundation (Liang et al. 2003)

17
and piles. The pile group contains short and long piles. The short piles are constructed of
flexible materials such as soil-cement columns or sand-gravel columns, and are used mainly to
strengthen the shallow soft soil; the long piles, which are made of relatively rigid materials such
as concrete, and are mainly for reducing settlement. Through in-situ observations, it has been
proved that this type of foundation is quite suitable and effective for coastal area cities such as
Shanghai in China, where deep soft soil deposits exist.
Poulos (2001) suggested a rational design procedure that involves the following three
stages:
(1) the first stage is to assess the feasibility of using a piled raft, and the number of piles
required to satisfy design requirements;
(2) the second stage is to assess where piles are required and the general characteristics of the
piles; and
(3) the final stage is to determine the optimum number, location, as well as configuration of
piles.
2.5 Design Criteria
In the practice of foundation design, the most important criteria to be considered are
allowable total (overall) settlement, allowable differential settlement, and ultimate bearing
capacity. Therefore, it is necessary to have a clear understanding of the design criteria in order
to achieve the ultimate objectives of this study.

18
2.5.1 Total settlement
Total settlement is defined as the magnitude of downward movement of the building
structure. Many structures can tolerate substantial downward movement or settlement without
structural damage or collapse as shown in Table 2.1. A typical specification of total settlement
for commercial buildings is 1 inch (25.3 mm).
Table 2.1 Maximum allowable total settlement of some structures
(after Polshin and Tokar, 1957)
Type of Structure Settlement, inch (mm)
Plain brick walls (length/height ≥ 2.5) 3 (76)
Plain brick walls (length/height ≤ 1.5) 4 (101)
Framed structure 4 (101)
Reinforced brick walls and brick walls with
reinforced concrete
6 (151)
Solid reinforced concrete foundations,
supporting smokestacks, silos, towers, etc.
12 (303)
2.5.2 Differential settlement
Differential settlement is defined as the difference in vertical movement between various
locations of a building structure. Differential settlement, which causes distortion of and damage
to structures, is a function of the uniformity of the soil, stiffness of the structure, stiffness of the
soil, and distribution of loads within the structure. Similar to total settlement, limitations to
differential settlement also depend upon the function and type of structure. Differential
settlement usually should not exceed 0.5 inch (12.6 mm) in buildings, otherwise cracking and
structural damage may occur (ASCE, 1994).
19
2.5.3 Ultimate bearing capacity
The function of a foundation is to transfer structural load to soils on which it is resting. A
well designed foundation should transfer the structural load throughout the soil without
overstressing the soil. Overstressing the soil can result in either excessive settlement or shear
failure of the soil, both of which will cause damage to the structure. Thus, evaluating the bearing
capacity of the foundation system is vitally important for foundation designs.
Hakam et al. (2005) conducted a laboratory model test and concluded that the ultimate
bearing capacity of a piled-supported-raft foundation is higher than the sum of that of the piles
and raft. Generally speaking, the pier-supported-raft foundation is more capable in terms of
ultimate bearing capacity than that of pier foundation or raft foundation alone.
20
Chapter 3
BACKGROUND THEORY
3.1 Introduction
Many engineering problems, due to their complexities, cannot be solved analytically. As
such, they are often solved approximately using numerical methods. In geotechnical
engineering, frequently used numerical methods include the differential numerical method,
boundary element method, and finite element method.
In 1966, Clough and Woodward first applied the finite element method in soil mechanics
to conduct nonlinear analysis of an earth dam. From then on, many researchers in geotechnical
engineering have made tremendous progress in this area. Because of its relative ease in dealing
with the complexity of domain shape and boundary conditions, material nonlinearity, and
geometric nonlinearity, it has been quickly adopted and further improved for application to
seepage, consolidation, stability, and deformation problems. The geotechnical finite element
method has become the primary means of numerical analysis. With the advancement of

21
computing techniques, there is now a large number of commercial finite element software
available for use, such as ABAQUS, ANSYS, Adina, MSC, etc. Among these powerful
Software packages, ABAQUS is most commonly used in nonlinear analysis for a wide range of
geotechnical engineering applications. Therefore, in this work the ABAQUS Standard module
was adopted to analyze the behavior and performance of pier-supported-raft foundation
subjected to uniformly distributed vertical load.
3.2 A Brief Introduction to ABAQUS
ABAQUS (Non-linear Finite Element Analysis Commercial Software) was developed by
HKS (Hibbitt, Karlsson & Sorensen, Inc.) in the United States. It is currently one of the most
advanced and powerful finite element analysis commercial software packages in the world. Its
non-linear mechanic analysis function (materials, geometry, and contact) is the world leader.
This software has been widely used in North America, Europe, and many Asian countries in
mechanical, civil, water, materials, aviation, metallurgy, and other fields.
ABAQUS can be used to conduct static and dynamic analyses for structures in stress,
deformation, vibration, shock, heat conduction and convection, mass diffusion, acoustic,
mechanical, and electrical coupling analysis. A complete ABAQUS analysis usually has three
steps: pre-processing, computation and simulation, and post-processing.
ABAQUS can simulate a relatively wide range of material properties. Its own material
library contains a variety of common constitutive models for materials such as metal, rubber,
plastics, concrete, and soil.
22
As powerful finite element analysis software, ABAQUS has played an important role in
the commercial finite element software field. It has been widely applied to solve problems from
simple linear elastic to complex problems in non-linear geometries and non-linear materials. Its
effectiveness and validation have been verified in both engineering applications and science and
research. ABAQUS contains a rich element and material library. It can simulate a variety of
material behaviors subjected to load and deformation. In particular, it provides the user with
UMAT and UEL subroutines for ease in application to different problems.
3.3 Nonlinear Elastic-plastic Isoparametric Finite Element Method of Analysis
3.3.1 Three-dimensional 8-node isoparametric finite element equation
The general procedure of FEM is: I) discretize the overall structure and divide it into
several units; II) analyze for each unit element and form the element stiffness matrix; III) form
the global stiffness matrix and nodal load matrix, and introduce constraints; IV) obtain nodal
displacement results by solving the equations, and solve the stress and strain of the structure
based upon the nodal displacement.
I. Discretization and element displacement functions
First, the pier-supported-raft foundation is discretized into a finite number of eight-node
elements, and adjacent elements are connected by the nodal points to form the entire foundation
system.
23
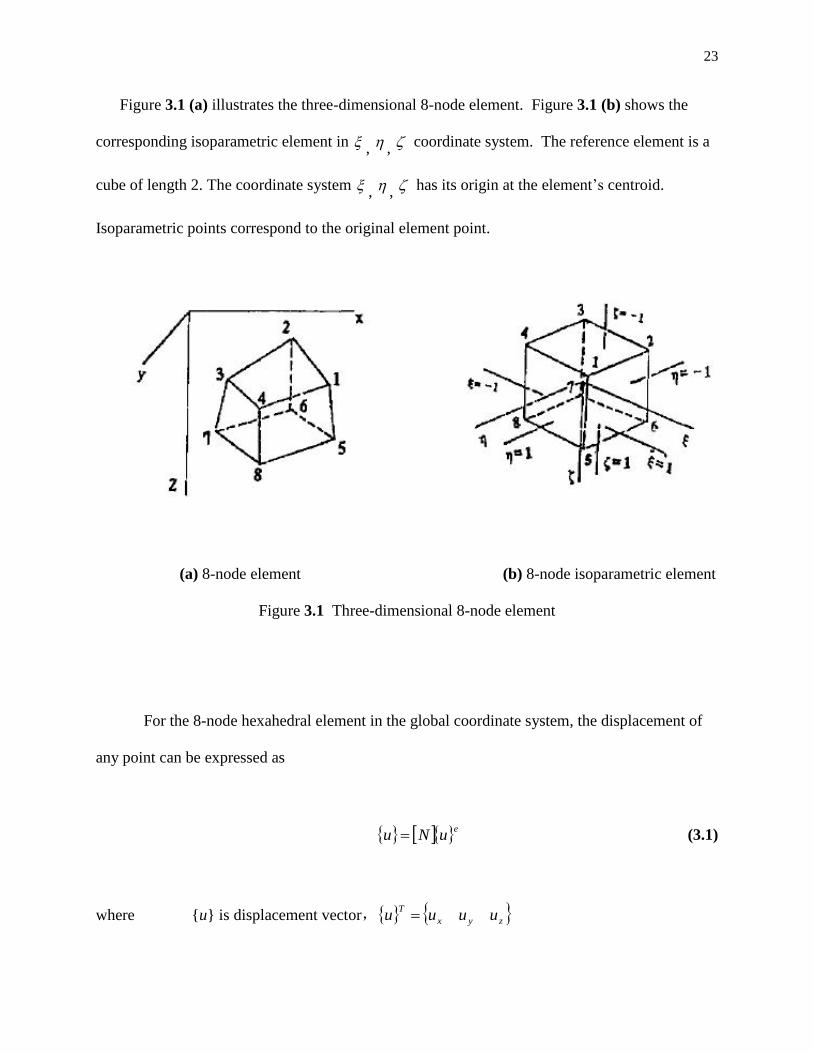
Figure 3.1 (a) illustrates the three-dimensional 8-node element. Figure 3.1 (b) shows the
corresponding isoparametric element in , , coordinate system. The reference element is a
cube of length 2. The coordinate system , , has its origin at the element‘s centroid.
Isoparametric points correspond to the original element point.
(a) 8-node element (b) 8-node isoparametric element
Figure 3.1 Three-dimensional 8-node element
For the 8-node hexahedral element in the global coordinate system, the displacement of
any point can be expressed as
euNu (3.1)
where {u} is displacement vector, zyx
Tuuuu
24
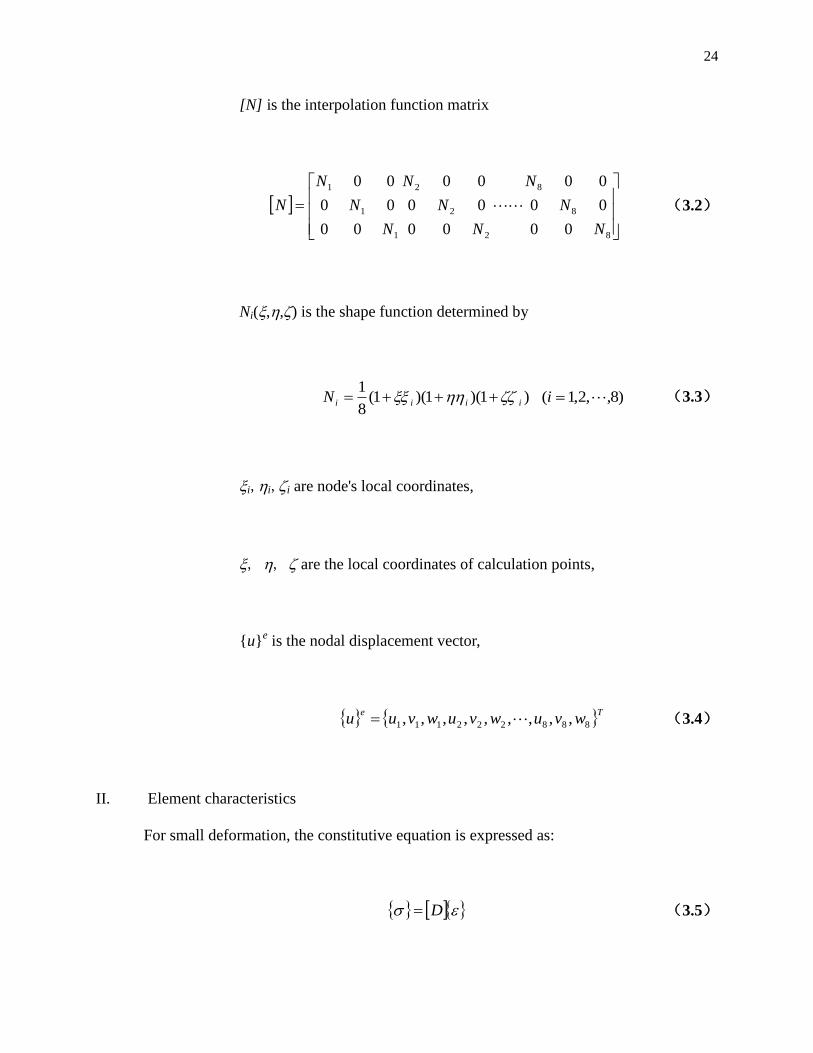
[N] is the interpolation function matrix
8
8
8
2
2
2
1
1
1
00
00
00
00
00
00
00
00
00
N
N
N
N
N
N
N
N
N
N (3.2)
Ni(,,) is the shape function determined by
)1)(1)(1(8
1iiiiN )8,,2,1( i (3.3)
i,i,i are node's local coordinates,
, , are the local coordinates of calculation points,
{u}e is the nodal displacement vector,
Tewvuwvuwvuu 888222111 ,,,,,,,,, (3.4)
II. Element characteristics
For small deformation, the constitutive equation is expressed as:
D (3.5)

25
where D is the matrix of modulus,
{} is the strain vector,and
T
zxyzxyzyx ,,,,, (3.6)
{} is the stress vector,
T
zxyzxyzyx ,,,,, (3.7)
The relationship between strain and nodal displacement at any point is:
euB (3.8)
where [B] is the strain matrix, 821 ,,, BBBB ,with
x
N
z
N
y
N
z
N
x
N
y
Nz
N
y
Nx
N
B
ii
ii
ii
i
i
i
i
0
0
0
00
00
00
(3.9)
26
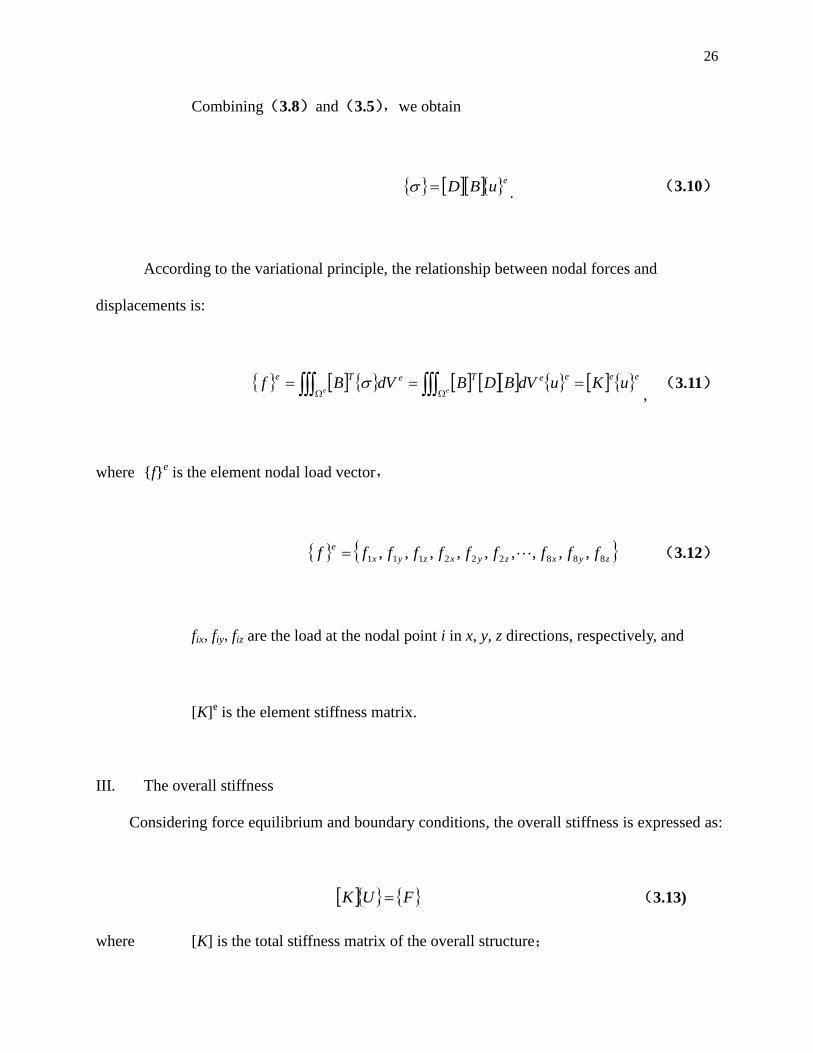
Combining(3.8)and(3.5),we obtain
euBD . (3.10)
According to the variational principle, the relationship between nodal forces and
displacements is:
ee
eeeeTeTeuKudVBDBdVBf
, (3.11)
where {f}e is the element nodal load vector,
zyxzyxzyx
effffffffff 888222111 ,,,,,,,,, (3.12)
fix,fiy,fiz are the load at the nodal point i in x, y, z directions, respectively, and
[K]e is the element stiffness matrix.
III. The overall stiffness
Considering force equilibrium and boundary conditions, the overall stiffness is expressed as:
FUK (3.13)
where [K] is the total stiffness matrix of the overall structure;

27
{U} is the nodal displacement matrix;and
{F} is the nodal load matrix.
IV. Solving equations
With boundary conditions, deformation at a corresponding nodal point can be solved
from (3.11). Thus, stress and strain at any point in an element can be obtained by applying (3.8)
and (3.5).
3.3.2 Solution of nonlinear problems
Generally speaking, through an iterative process to solve the series of linear equations,
when at the final stage, the material state parameters are adjusted to satisfy the material nonlinear
constitutive relations, then the solution will finally be obtained. The nonlinear finite element
problem involves solving nonlinear algebraic equations. The following briefly explains two
methods for solving several nonlinear equations.
I. Direct iteration method
The basic idea of the direct iteration method is that the foundation is subjected to full load
in each iteration. Therefore, each iteration will result in an unbalanced load. Sum the
unbalanced load and the real load for the next iterative calculation; the iteration will end when
the difference between the two displacement values resulting from two consecutive iterations or
the difference between the unbalanced loads resulting from the two consecutive iterations is less
than a specified limit. Thus, each iteration provides a tentative answer to the successive
28
iteration, the final balance of the soil equilibrium conditions and displacement continuity
conditions are satisfied approximately. The calculation steps are:
(1) Obtain tD 0 for the initial stress state, and establish stiffness matrix 0K ;
(2) Apply total load R , solve equations for displacement 1 , strain 1 , and
stress 1 ;
(3) Since the stress 0 is obtained from elastic analysis, which does not meet
the stress corresponding to the non-linear constitutive relation, there is a
corresponding unbalanced force 1
Q ;
(4) From 1 and 1 , we can obtain tD 1,thereby establishing the stiffness
matrix 1K ;
(5) Apply load 1
QR and solve equations to obtain 2U and 2U ; and
(6) Repeat steps (3), (4), and (5), to continue the iterations until the true solution
mU is obtained, that is mU ( is a required small value).
II. Incremental method
The basic idea of the incremental method is to divide the total load into a finite number of
increments and to apply one load increment each time; the stiffness matrix is constant at each
incremental interval level. The increment of displacement, stress, and strain can be obtained for
each stage of loading. Add up these increments to obtain total displacement, total stress, and
total strain under a given load. Therefore, the incremental method uses a series of linear analyses
to approximate the nonlinear stress-strain relations of the soil. The calculation steps are:
For stage i of loading increment iR

29
(1) Use the stress at the end of the previous stage 1i to calculate the tangent modulus
of the matrix for this stage tiD ;
(2) Use tiD to form the stiffness matrix iK ;
(3) Solve the linear equation iii RUK to obtain the displacement increment
iU , and then get the cumulative total amount of corresponding displacement
iii UUU 1 ;
(4) Determine the strain increment i from iU , then calculate the stress increment
i from the strain increment i , and obtain the accumulated for the corresponding
stress i and strain i ; and
(5) Repeat these steps for all levels of loading to get the final total displacement U ,
strain , and stress .
In order to speed up the convergence rate, typically a combination of these two methods
is used in actual analysis. That is first to divide the total load into many small load increments
and under each load increment, use the iterative method. ABAQUS mainly uses this means to
carry out the computation and simulation.
3.4 The Extended Drucker-Prager Elasto-plastic Model
3.4.1 Basic theory of elasto-plastic model
The total strain ij has two components: fully recoverable elastic strain ije and non-
recoverable plastic strain ijp, i.e.,

30
p
ij
e
ijij . (3.14)
where ij is the total strain;
e
ij is the elastic strain; and
p
ij is the plastic strain.
The elastic deformation is calculated using Hooke's law, while plastic deformation is solved
by plasticity theory. The computation of plastic deformation requires failure criteria/yield
criteria, hardening law, and flow rule.
I. Failure criterion
The failure criterion is a function of stress, namely,
0,,,, 321 ffij KJJIFKF (3.15)
Where Kf are the model parameters;
I1, J2, J3 are the first stress invariant, and the second, and third deviatoric stress invariant,
respectively.
F=0,denotes failure; F<0, no failure. F cannot be greater than 0. The graphical
presentation of function F in principal stress space is the failure surface. If the points of the
stress state fall within the failure surface, the material is safe or not damaged; if a point falls on
the surface, the material fails. The stress state point can never cross the failure surface. The

31
failure surface can also be said to be the trajectory of those points reaching the failure stress state
in the stress space.
II. Yield criterion
Under stress, materials deform. When the stress is small, materials usually behave
elastically. When the stress exceeds a certain limit, plastic deformation begins, and the stress-
strain relationship becomes nonlinear, at which point materials yield. The yield criterion can be
expressed as,
0,,,, 321 mmij HJJIfHf (3.16)
where f is the yield function,
Hm is the stress history-related parameters, known as the hardening parameter,
which generally varies with plastic strain.
For a value of Hm , the function f is a certain corresponding surface in the stress space, called the
yield surface.
For perfect elasto-plastic materials, only elastic deformation exists before yield, and
plastic deformation occurs after yield. The plastic deformation will continue to develop until
failure is reached, and finally satisfies the failure criteria. The forms of the yield function and
failure function can be the same or different. For geotechnical materials, yield and failure are
different. Soil failure is usually reached when the shear stress reaches or exceeds the shear
strength of the soil. Materials may also yield even when the shear stress is much smaller than the

32
shear strength, or even completely free from shear stress. Plastic deformation and yield may
occur when only the volumetric stress exists. The yield surface is a function of hardening
parameters, and will move, rotate, and expand with a change of hardening parameters.
Therefore, there are more than one yield surfaces, but only one failure surface.
When the system is in the state of yielding, i.e., when the current stress state is on the
yield surface, applying a new stress increment dij will result in three possible case scenarios
depending on the value of df. The three possible cases are described below:
where
3
3
2
2
1
1
dJJ
fdJ
J
fdI
I
fd
fdf ij
ij
(3.17)
(1)The dij direction is pointing towards inside of the yield surface, which will make df
< 0,i.e., f(ij + dij, H) < 0,so the increased stress will make the system into the elastic
state and the load increment is unloading.
(2)ij is in the tangent direction along the yield surface, that is df = 0,and clearly we have
f(ij + dij, H) = 0. This means that the stresses will be on the same yield surface even after the
stress state has been changed, i.e., dij does not lead to a new plastic deformation and the load
increment is the neutral load.
(3)The dij direction is pointing towards outside of the yield surface. New stress state has
reached the outside of the original yield surface, transferred to the new yield surface, then df > 0.
At the same time, new plastic deformation has been created, Hm is increased.

33
III. The hardening law
When applying the yield criterion to determine whether or not the plastic deformation
occurs in the soil, it requires the calculation of the f value according to each current stress
component. If f < 0, then the material is in its elastic state and all the corresponding points in the
stress space fall within the yield surface; when f = 0, the material yields. The value of f may also
be larger than the original f value, but at this moment the hardening parameter Hm increases but
the value of f remains equal to zero, which is the reason why material hardens after yield. The
law describing how Hm changes is called the hardening law.
The hardening law is linked with the yield function. The yield surface is the trajectory of
points having eaual Hm in the stress space. By taking different hardening parameters, the form of
yield function is also different. The yield function and hardening law are derived based upon
experimental data. As to what kind of hardening law and the corresponding yield function is
more reasonable, these can be ascertained only through experiments.
IV. The flow rule
When the soil is in the elastic state, each component of the strain increment is determined
by the generalized Hooke‘s law. For the plastic state, deformation in the elastic range is still
determined by the generalized Hooke‘s law, while the relative relationship between the
components of the plastic strain increment is determined by the flow rule.
In elastic mechanics, stress and strain increments are in the same direction as the law. It
is a different case in plasticity. The direction of plastic strain increment does not determine the

34
plastic stress increment, but rather the total stress. The flow rule specifies the relationship
among the various components of the plastic strain increment, namely, the direction of plastic
strain.
Plastic deformation, or plastic flow, caused by a potential imbalance, is the same as the
flow of other properties. To this end, assume that, at any point in the stress space, there is a
plastic potential surface, and its function is:
0,,, 321 mHJJIg , (3.18)
where g is the plastic potential function. Since g is a function of stress, it can be described in
the stress space. Connecting all the points of equal plastic potentials in the stress space, it will
form many other potential surfaces, which are called plastic potential surfaces.
The flow rule stipulates that each component of the plastic strain increment and the
cosine of plastic potential surface normal direction are proportional, which means that the
direction of the plastic strain increment and the normal direction of the plastic potential surface
are the same, that is orthogonal with the plastic potential surface. Thus, the flow rule is also
called the orthogonal rule. Under this provision, we have
ij
p
ij
gdd
, (3.19)
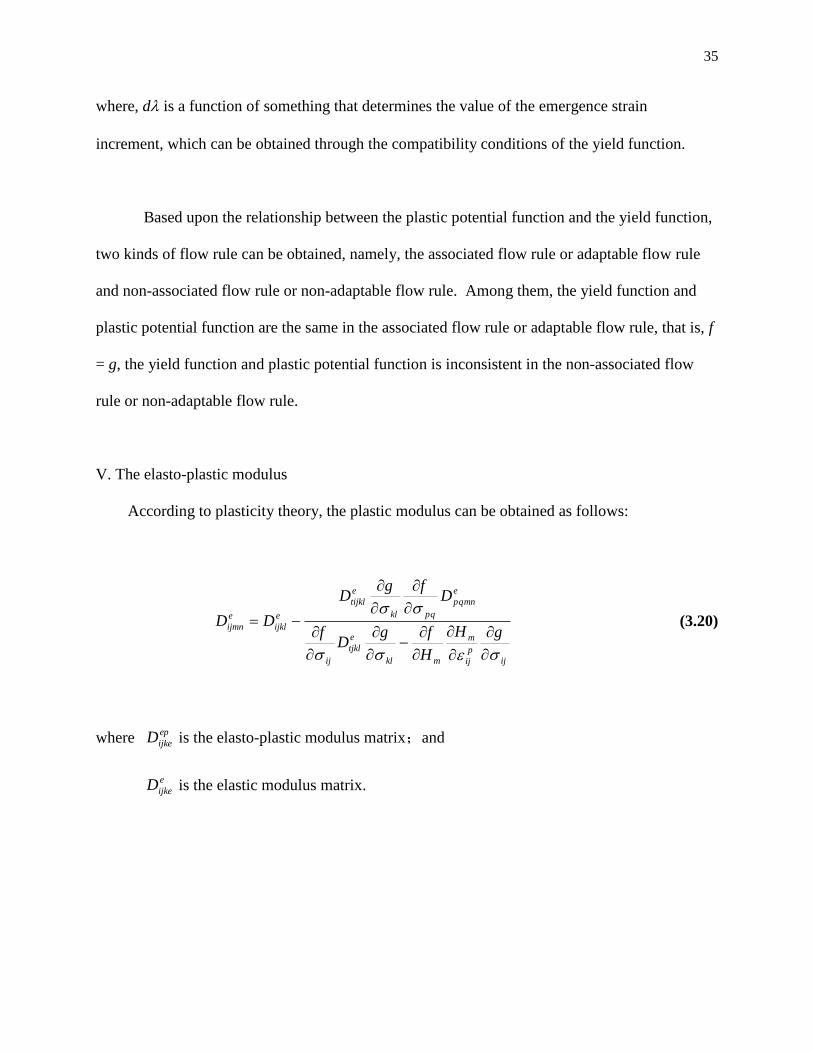
35
where, d is a function of something that determines the value of the emergence strain
increment, which can be obtained through the compatibility conditions of the yield function.
Based upon the relationship between the plastic potential function and the yield function,
two kinds of flow rule can be obtained, namely, the associated flow rule or adaptable flow rule
and non-associated flow rule or non-adaptable flow rule. Among them, the yield function and
plastic potential function are the same in the associated flow rule or adaptable flow rule, that is, f
= g, the yield function and plastic potential function is inconsistent in the non-associated flow
rule or non-adaptable flow rule.
V. The elasto-plastic modulus
According to plasticity theory, the plastic modulus can be obtained as follows:
ij
p
ij
m
mkl
e
tjkl
ij
e
pqmn
pqkl
e
tijkl
e
ijkl
e
ijmn gH
H
fgD
f
Dfg
D
DD
(3.20)
where ep
ijkeD is the elasto-plastic modulus matrix;and
e
ijkeD is the elastic modulus matrix.
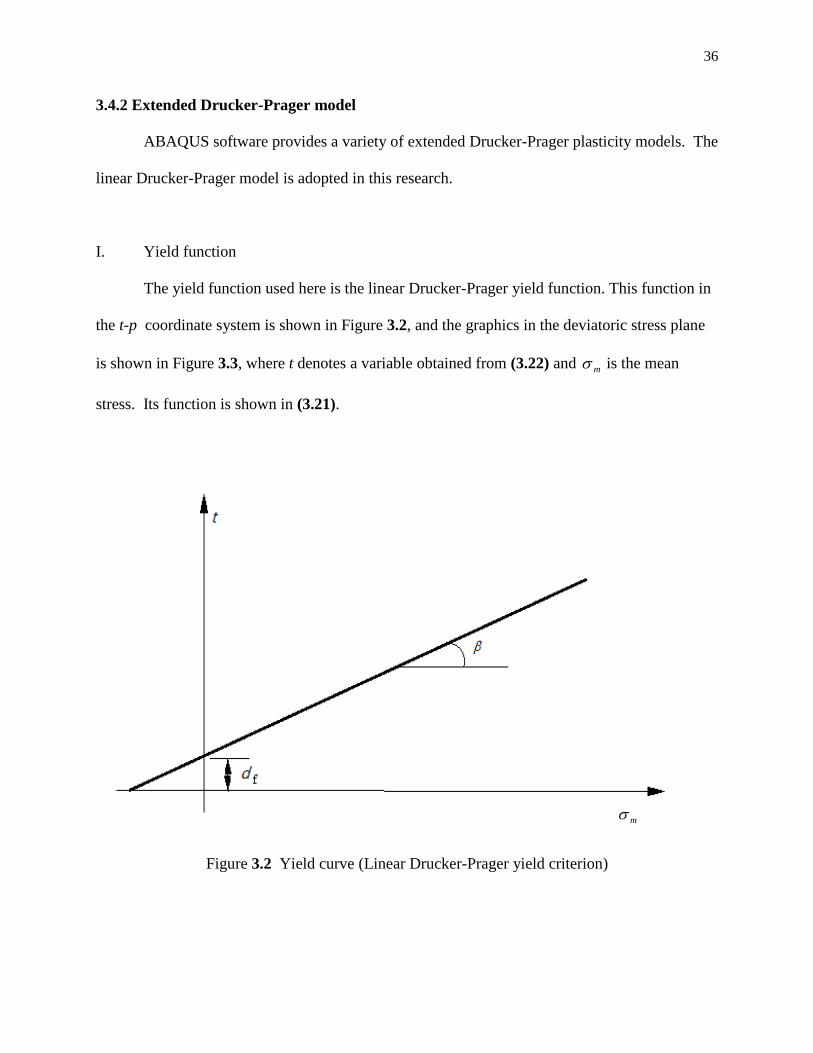
36
3.4.2 Extended Drucker-Prager model
ABAQUS software provides a variety of extended Drucker-Prager plasticity models. The
linear Drucker-Prager model is adopted in this research.
I. Yield function
The yield function used here is the linear Drucker-Prager yield function. This function in
the t-p coordinate system is shown in Figure 3.2, and the graphics in the deviatoric stress plane
is shown in Figure 3.3, where t denotes a variable obtained from (3.22) and m is the mean
stress. Its function is shown in (3.21).
Figure 3.2 Yield curve (Linear Drucker-Prager yield criterion)
m
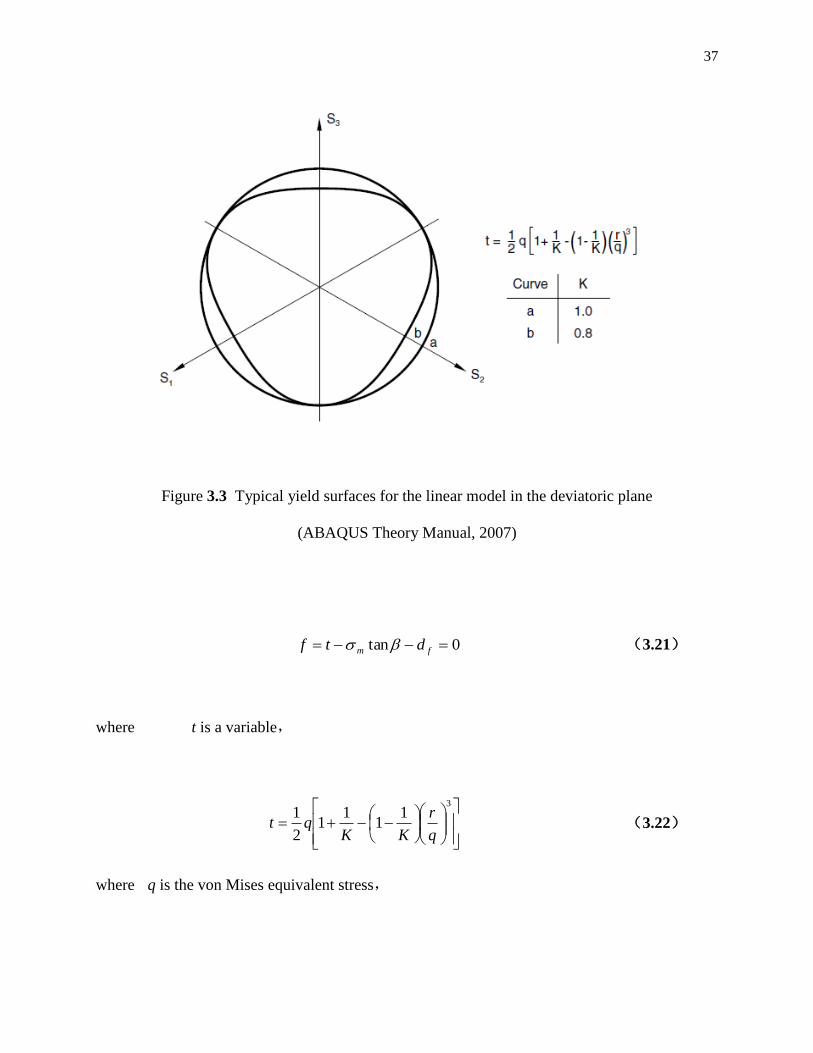
37
Figure 3.3 Typical yield surfaces for the linear model in the deviatoric plane
(ABAQUS Theory Manual, 2007)
0tan fm dtf (3.21)
where t is a variable,
3
11
11
2
1
q
r
KKqt (3.22)
where q is the von Mises equivalent stress,

38
}{:}{2
3SSq (3.23)
r is a variable defined as:
3
1
}{:}{}{2
9
SSSr (3.24)
m is the mean stress,
3
zyx
m
(3.25)
where is the angle of the yield curve in the t- m coordinates;
df is he intercept of the yield curve in the t- m coordinates;
K is the ratio of triaxial tensile strength and compressive strength, as shown in Figure 3.3.
K is a material parameter. To ensure convexity of the yield surface, it requires 0.778 ≤ K ≤ 1.0.
This measure of deviatoric stress is used because it allows the matching of different stress values
in tension and compression in the deviatoric plane, thereby providing flexibility in fitting
experimental results when the material exhibits different yield values in triaxial tension and
compression tests.
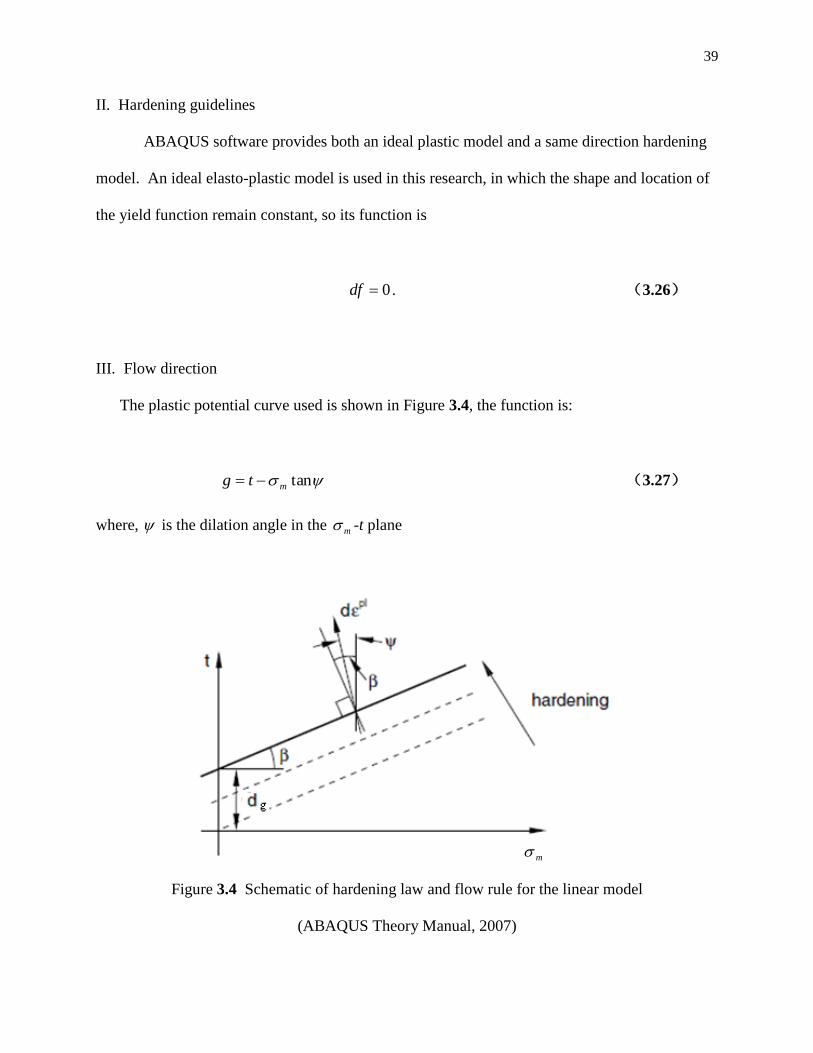
39
II. Hardening guidelines
ABAQUS software provides both an ideal plastic model and a same direction hardening
model. An ideal elasto-plastic model is used in this research, in which the shape and location of
the yield function remain constant, so its function is
0df . (3.26)
III. Flow direction
The plastic potential curve used is shown in Figure 3.4, the function is:
tanmtg (3.27)
where, is the dilation angle in the m -t plane
Figure 3.4 Schematic of hardening law and flow rule for the linear model
(ABAQUS Theory Manual, 2007)
m
40
3.5 Contact Surface Characteristics
Due to the huge stiffness difference between soil and pier, relatively large displacement
occurs along the contact interface when the foundation system is subjected to external forces,
resulting in shear stress. Therefore, a correct analysis of the loading and deformation mechanism
of the contact surface, the development of shear failure, the load transfer process, and a correct
simulation of the computation are vitally important for such a foundation system.
In order to better simulate the interaction behavior between soil and pier, contact
elements are required for the contact surfaces. Surface-to-surface contact elements are provided
in ABAQUS. Within the surface contact elements in ABAQUS, the more rigid surface is called
the ―master‖ surface; and the other side is the ―slave‖ surface. A ―master‖ surface and a ―slave‖
surface are called a ―contact pair‖.
The needed mechanical properties of ―contact pair‖ between ―master‖ and ―slave‖
surface include the normal and tangential contact characteristics. Normal contact characteristics
commonly use ―hard‖ contacts. In this case, one surface cannot be squeezed into the other
contact surface, but can be separated. When the two surfaces are separated, the normal stress of
the contact surface is zero. In order to ensure that the two contact surfaces do not penetrate each
other while maintaining the state of contacting, the normal stress on the contact surface can
change to any stress, as long as they maintain the contact state, as shown in Figure 3.5.
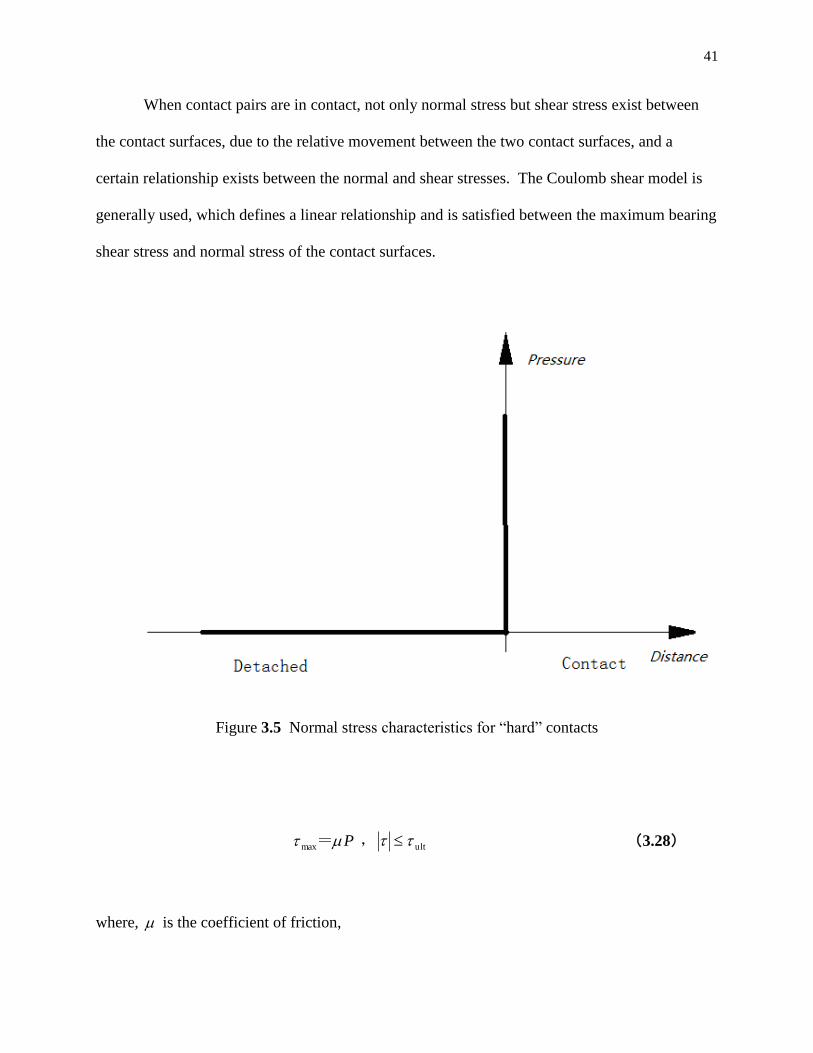
41
When contact pairs are in contact, not only normal stress but shear stress exist between
the contact surfaces, due to the relative movement between the two contact surfaces, and a
certain relationship exists between the normal and shear stresses. The Coulomb shear model is
generally used, which defines a linear relationship and is satisfied between the maximum bearing
shear stress and normal stress of the contact surfaces.
Figure 3.5 Normal stress characteristics for ―hard‖ contacts
P =max , ult (3.28)
where, is the coefficient of friction,

42
P is the normal contact stress,
max is the maximum equivalent shear stress, and
ult is the ultimate shear stress.
When the shear stress on the contact surface is less than the maximum equivalent shear
stress, the contact pairs are bonded together and there is no relative tangential displacement;
when the shear stress on the contact surfaces is equal to the maximum equivalent shear stress, the
relative tangential displacement starts to occur between the contact pairs, as shown in Figure 3.6
below.
Figure 3.6 Coulomb shear characteristics
43
Chapter 4
MODEL VALIDATION
4.1 Introduction
As widely used commercial software, ABAQUS has gone through continuous
improvement to make sure that it can handle many different types of problems. While ABAQUS
is capable of handling many problems, the effectiveness of using ABAQUS to analyze the pier-
supported-raft foundation needs to be verified and validated, especially when a specific material
yield/failure criterion such as Drucker-Prager criterion is adopted in the analysis.
4.2 Model Verification
To verify the accuracy of the Drucker-Prager Model, a published laboratory test and its
test results are used to compare with the results obtained from ABAQUS analysis.
4.2.1 Laboratory test
One of the published laboratory tests (Cooke, 1986) was adopted for validation. The
laboratory test used London clay remolded with additional water to have undrained shear
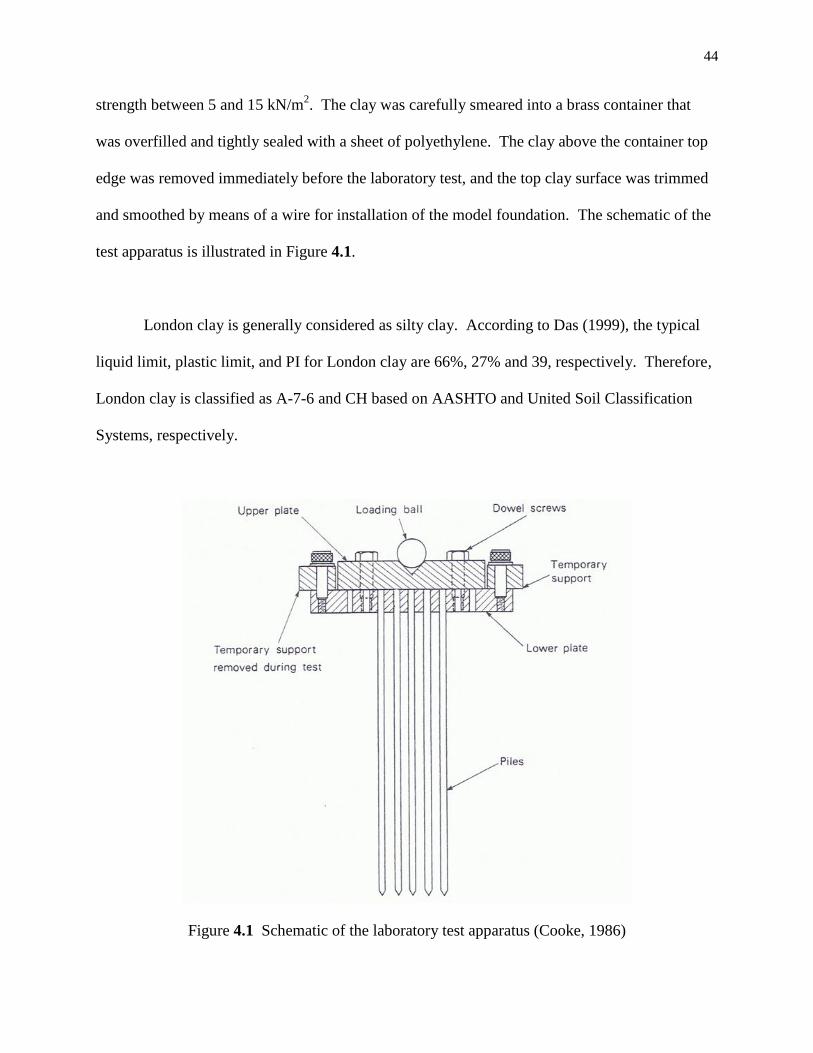
44
strength between 5 and 15 kN/m2. The clay was carefully smeared into a brass container that
was overfilled and tightly sealed with a sheet of polyethylene. The clay above the container top
edge was removed immediately before the laboratory test, and the top clay surface was trimmed
and smoothed by means of a wire for installation of the model foundation. The schematic of the
test apparatus is illustrated in Figure 4.1.
London clay is generally considered as silty clay. According to Das (1999), the typical
liquid limit, plastic limit, and PI for London clay are 66%, 27% and 39, respectively. Therefore,
London clay is classified as A-7-6 and CH based on AASHTO and United Soil Classification
Systems, respectively.
Figure 4.1 Schematic of the laboratory test apparatus (Cooke, 1986)

45
A square group of 49 piles (7 × 7) were tested in the container of remolded London clay.
The piles were made of brass rods, each having 3.2 mm in diameter and 150 mm in length. The
piles were pushed individually into the clay through the lower plate drilled at the required pile
spacing and directly placed on the clay surface. The lower plate was 10 mm wider than the
block of clay contained by peripheral piles so that the dimensions of the raft more closely
modeled the normal practice although the construction method did not. The ratio of center-to-
center pile spacing to the pile diameter is equal to 3.0.
The raft was cast with high strength gypsum plaster directly on the clay surface. After
the piles were placed, the temporary supports and lower plate were removed and the gypsum
plaster was poured within a plastic mold fitted along the center line of the peripheral piles, as
shown in Figure 4.2.
Figure 4.2 Plastic mold for forming the gypsum plaster raft
around a 25 Pile Group of 150 mm long piles (Cooke, 1986)

46
Load was applied through a steel plate (41 mm × 41 mm × 20 mm) directly placed on the
top surface of the gypsum raft, as shown in Figure 4.3. Note that Figure 4.1 to Figure 4.3 show
the laboratory test done for 5 × 5 (25) pile group, not 7 × 7 (49) pile group test. The laboratory
test was conducted by the constant rate of penetration method (uniform rate of displacement to
failure).
Figure 4.3 Completed pile-supported-raft foundation
for the laboratory test (Cooke, 1986)
4.2.2 Finite element analysis
According to the size and material property used in the laboratory test, the computer
models for the pile-supported-raft foundation and the soils are established, as shown in Figure
4.4 and Figure 4.5.
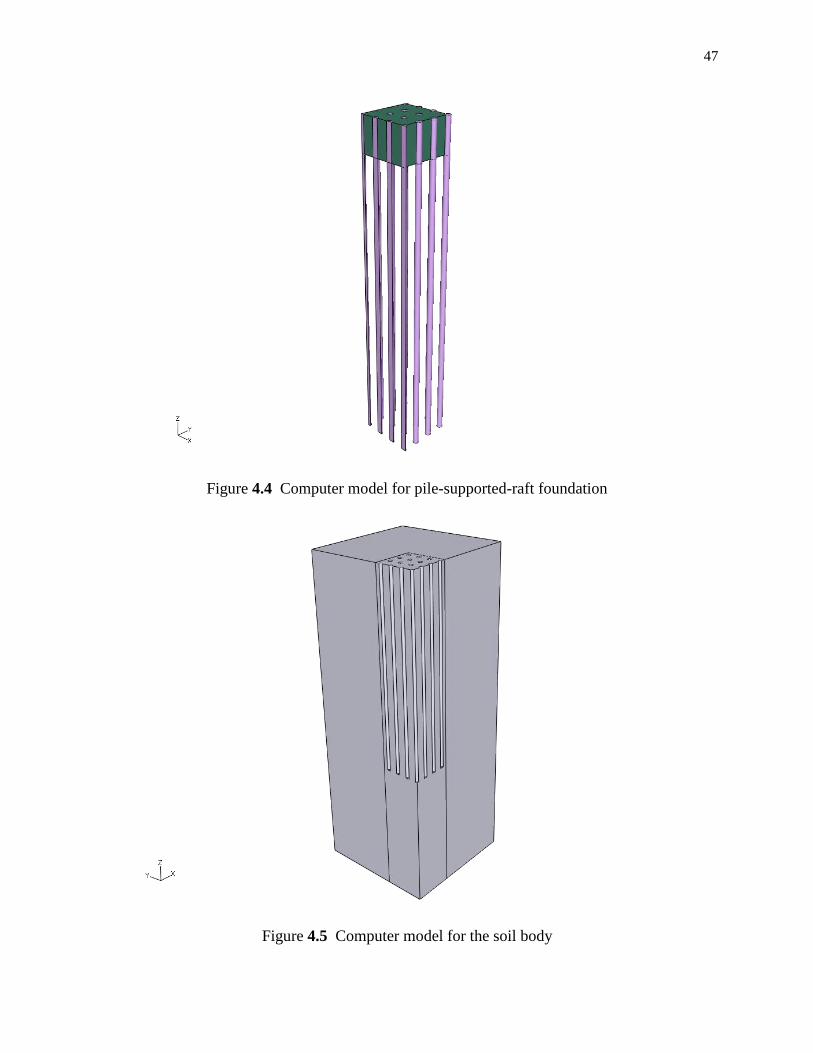
47
Figure 4.4 Computer model for pile-supported-raft foundation
Figure 4.5 Computer model for the soil body

48
Due to symmetry, only ¼ of the model is used for the analysis, as illustrated in Figure
4.4. The mesh for the FEA is shown in Figure 4.6. The test model dimensions as well as the
properties of soil, pile, and raft used in the analysis are summarized below.
Test model dimensions: 0.1 m (width) × 0.1 m (length) × 0.25 m (thickness).
Soil properties: Es = 120 MPa, νs = 0.4, = 15, c = 15 kPa, γs = 19 kN/m3
Piles properties: Eb = 1.15103
MPa, νb = 0.35
Raft properties: Eg = 2104
MPa, νg = 0.12
where Es is the soil modulus of elasticity, MPa,
Eb is the pier (brass material) modulus of elasticity, MPa,
Eg is the raft (gypsum material) modulus of elasticity, MPa,
is the soil internal friction angledegree,
νs is the soil Poisson‘s ratio,
νg is the gypsum Poisson‘s ratio,
νb is the brass pier Poisson‘s ratio, and
γs is the soil unit weight, kN/m3.
Note that these properties are either directly from Cooke (1986) or information in the
available literature; the values Eg and νg are taken from Guo and Yang (2010) since they were
not given in Cooke (1986).

49
Figure 4.6 FEA mesh for the computer model
Three-dimensional 8-node elements, as shown in Figure 3.1 (a), are used in the validation
FEA model. For the contact elements, the coefficient of friction between soils and piers (brass)
is taken as = 0.2.
4.2.3 Drucker-Prager model validation
The results of FEA analysis provide a load vs. settlement curve shown in Figure 4.7. As
shown, the two curves within the working load range are almost identical. Beyond the working

50
load, the two curves separate but the values of ultimate load are about 0.8 kN from laboratory
test vs. 0.78 kN from FEA with a difference of less than 3%. This suggests that FEA.is an
effective tool for analyzing the behavior of pier-supported-raft foundation at least within the
working load range. In the practice of deep foundation design, normally a safety factor of 3 or
higher is used. Therefore, the working load should be less than 1/3 of the ultimate load capacity.
Based on the results of validation, it is appropriate to use ABAQUS with Drucker-Prager model
to investigate the behavior of pier-supported-raft foundations in this research.
Figure 4.7 Load-settlement curves

51
While the dimensions of laboratory model test facility are considerably smaller than the
actual foundation system, possible size effect on relationship between foundation behavior and
influence factors can be minimized by non-dimensionalizing the variables. Therefore, in the
analysis and evaluation of foundation behavior presented later, the foundation width is used as a
common denominator for performance variable analyzed.

52
Chapter 5
FINITE ELEMENT ANALYSIS
5.1 Introduction
As pointed out previously, there are many factors that affect the load transfer mechanism
and settlement behavior of the pier-supported-raft foundation, such as raft thickness (H), pier
diameter (d), pier length (L), center-to-center pier spacing (s), raft width (B), and soil properties.
In order to understand how these factors influence the behavior of such a foundation system,
many different conditions are analyzed by means of finite element analysis (FEA) using
ABAQUS. Due to symmetry, only ¼ of the foundation system is analyzed to save computation
time. Figure 5.1 shows a schematic view of ¼ of the foundation system, and Table 5.1
summarizes the parameters of different conditions
5.2 FEA Model
Three-dimensional 8-node elements, as shown in Figure 3.1 (a), are used in the FEA
model. In order to better model and simulate the interaction behavior between soils and piers,
contact elements are required at the contact areas between piers and soils. The foundation and
soil material properties for each condition are also shown in Table 5.1. These parameters are
selected from the normal range of values used in practice. Concrete is assumed to be elastic,

53
Figure 5.1 Schematic of the foundation system in two-layered soils analyzed
(Note: Pier bases are 0.5 m below the top of lower layer)
(a) Plan view
(b) Elevation view
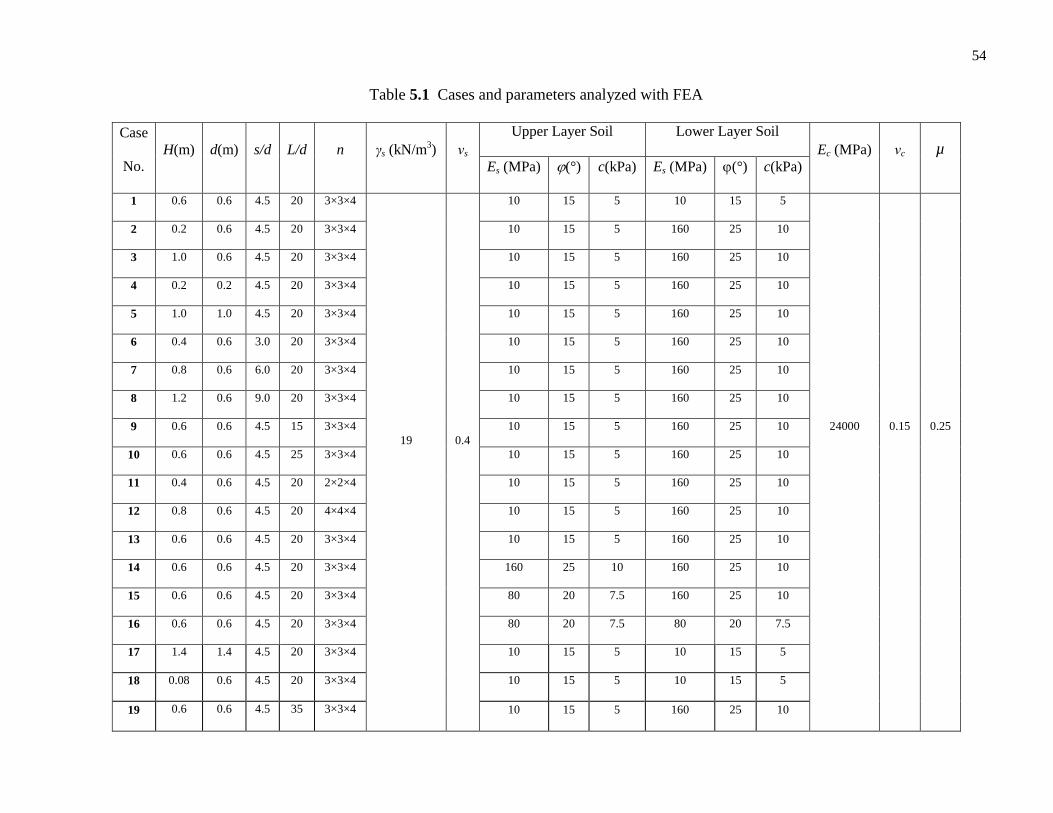
54
Table 5.1 Cases and parameters analyzed with FEA
Case
No.
H(m) d(m) s/d L/d n γs (kN/m3) νs
Upper Layer Soil Lower Layer Soil
Ec (MPa) νc µ
Es (MPa) (°) c(kPa) Es (MPa) (°) c(kPa)
1 0.6 0.6 4.5 20 3×3×4
19 0.4
10 15 5 10 15 5
24000 0.15 0.25
2 0.2 0.6 4.5 20 3×3×4 10 15 5 160 25 10
3 1.0 0.6 4.5 20 3×3×4 10 15 5 160 25 10
4 0.2 0.2 4.5 20 3×3×4 10 15 5 160 25 10
5 1.0 1.0 4.5 20 3×3×4 10 15 5 160 25 10
6 0.4 0.6 3.0 20 3×3×4 10 15 5 160 25 10
7 0.8 0.6 6.0 20 3×3×4 10 15 5 160 25 10
8 1.2 0.6 9.0 20 3×3×4 10 15 5 160 25 10
9 0.6 0.6 4.5 15 3×3×4 10 15 5 160 25 10
10 0.6 0.6 4.5 25 3×3×4 10 15 5 160 25 10
11 0.4 0.6 4.5 20 2×2×4 10 15 5 160 25 10
12 0.8 0.6 4.5 20 4×4×4 10 15 5 160 25 10
13 0.6 0.6 4.5 20 3×3×4 10 15 5 160 25 10
14 0.6 0.6 4.5 20 3×3×4 160 25 10 160 25 10
15 0.6 0.6 4.5 20 3×3×4 80 20 7.5 160 25 10
16 0.6 0.6 4.5 20 3×3×4 80 20 7.5 80 20 7.5
17 1.4 1.4 4.5 20 3×3×4 10 15 5 10 15 5
18 0.08 0.6 4.5 20 3×3×4 10 15 5 10 15 5
19 0.6 0.6 4.5 35 3×3×4 10 15 5 160 25 10

55
In Table 5.1, H is raft thickness, m;
B is raft width, m;
L is pier length, m;
s is center-to-center pier spacing, m;
d is pier diameter, m;
n is number of piers;
γs is soil unit weight, kN/m3;
γc is concrete unit weight, kN/m3;
is soil internal friction angledegree;
νs is soil Poisson‘s ratio;
νc is concrete Poisson‘s ratio;
c is soil cohesion, kPa;
Es is soil modulus of elasticity, MPa;
Ec is pier and raft (concrete) modulus of elasticity, MPa; and
µ is coefficient of friction between soils and piers.
while soil is modeled as elasto-plastic. The Drucker-Prager model is used for soil material. A
typical mesh used in this study of the cases analyzed is illustrated in Figure 5.2 and Figure 5.3.
The finite element mesh shown in the figures was generated after several trials with the
consideration of sensitivity of solutions to mesh/element size and distribution. Smaller meshes
and larger amount of elements are used in critical areas.

56
Figure 5.2 Mesh for the pier-supported-raft foundation
Figure 5.3 Mesh for the soils
57
Note that in Figure 5.1, Bs is the horrizontal distance from raft center to the vertical
boundary for ¼ of the foundation system. In all of the cases analyzed, Bs = 50 m. Ls is the depth
to the horrizontal boundary for ¼ of the foundation system. In all of the cases analyzed, Ls = 60
m, where Ls is the vertical distance from base of the raft to the bottom boundary. Note that, to
minimize the possible boundary effect on the results of analysis, the vertical and horrizontal
boundaries are at least three times the dimension of the pier-supported-foundation system.
Boundary conditions are applied as follows: the horizontal boundary at bottom is fixed, while all
the four vertical boundaries are roller supported.
In the analysis, vertical loads are applied uniformly at the top surface of the raft in
increments, which simulates the real practice of construction. The FEA was performed on a
computer with a hard drive of 350 GB, installed memory (RAM) 4.0 GB, Intel ® Core ™ Quad
CPU Q6600 @2.40 GHz. The computer operation system is Windows 7, 64-bit, and the version
of ABAQUS is v6.7. It usually took from 3 to 10 days to run a case, depending on the size of the
foundation. When the ABAQUS was running, it made the computer very slow. Therefore, the
computer was upgraded to an installed memory of 8 GB. It ran faster after the computer memory
was upgraded.
The outputs of the FEA are the stress and strain at integration points and deformation at
nodal points. These data are later used to generate load vs. settlement curves, determine ultimate
bearing capacity, and obtain total and differential settlement. In order to get the necessary
information from the immense amount of output data, the ABAQUS scripting interface, an

58
extension of Python language, was used to access and process the data stored in output
databases.
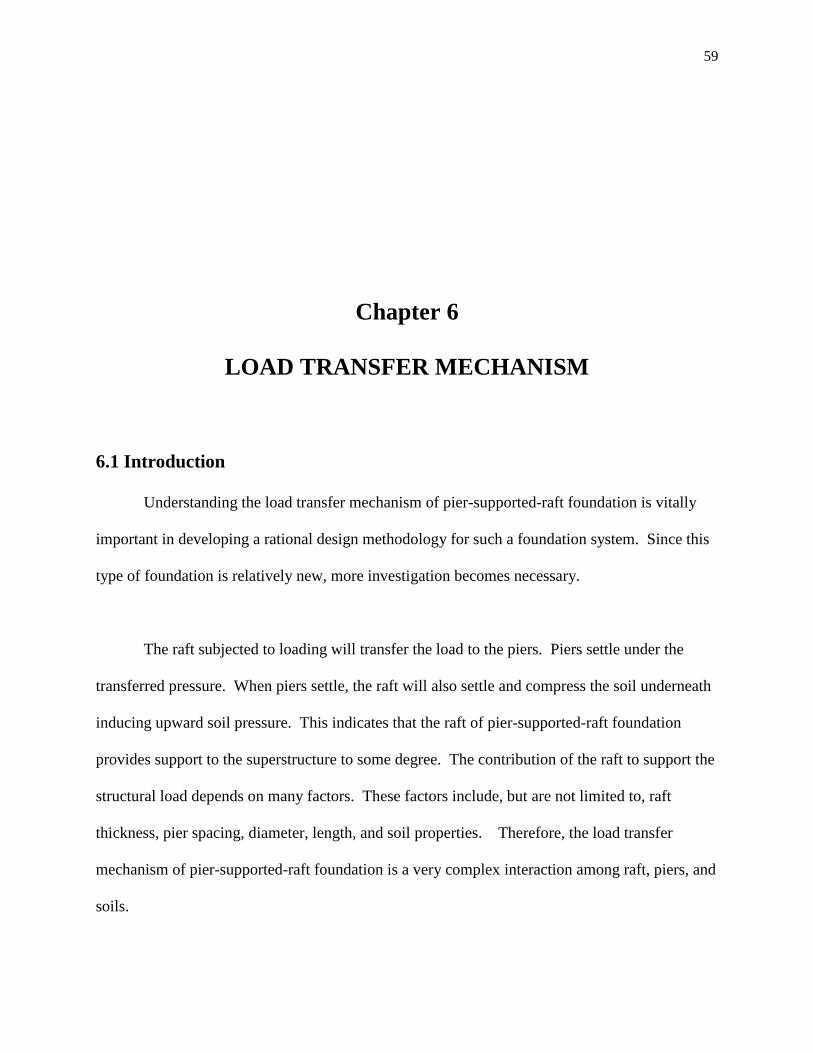
59
Chapter 6
LOAD TRANSFER MECHANISM
6.1 Introduction
Understanding the load transfer mechanism of pier-supported-raft foundation is vitally
important in developing a rational design methodology for such a foundation system. Since this
type of foundation is relatively new, more investigation becomes necessary.
The raft subjected to loading will transfer the load to the piers. Piers settle under the
transferred pressure. When piers settle, the raft will also settle and compress the soil underneath
inducing upward soil pressure. This indicates that the raft of pier-supported-raft foundation
provides support to the superstructure to some degree. The contribution of the raft to support the
structural load depends on many factors. These factors include, but are not limited to, raft
thickness, pier spacing, diameter, length, and soil properties. Therefore, the load transfer
mechanism of pier-supported-raft foundation is a very complex interaction among raft, piers, and
soils.
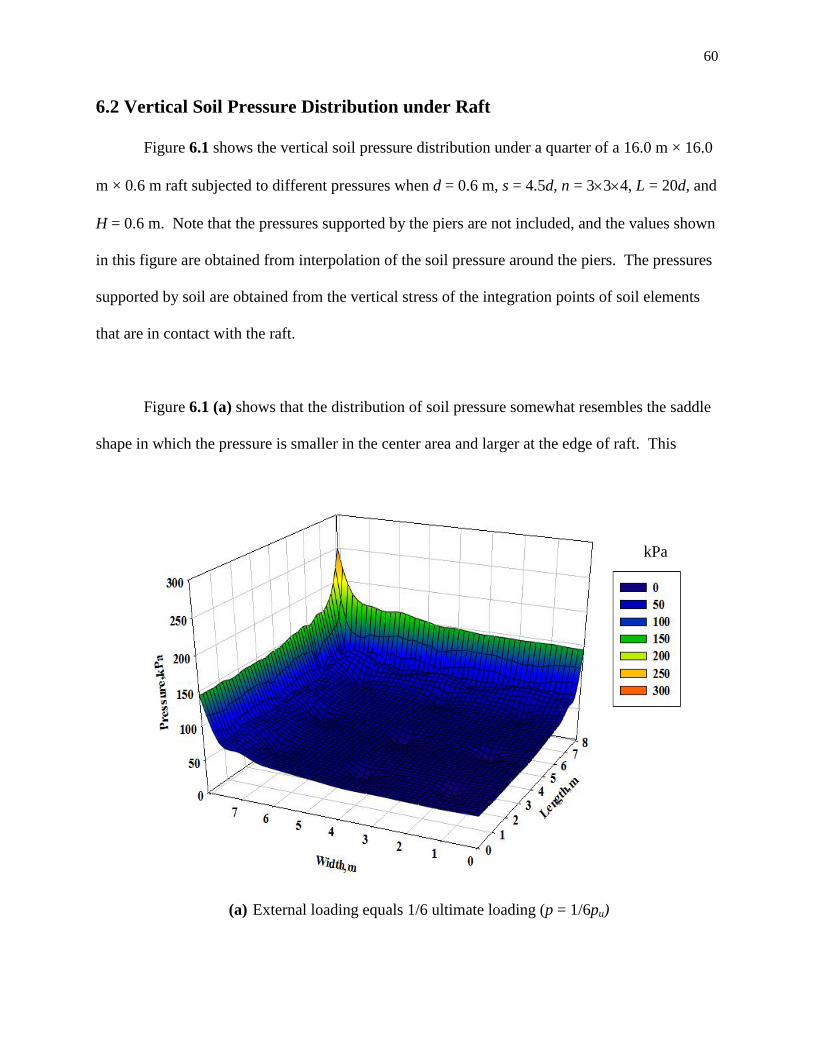
60
6.2 Vertical Soil Pressure Distribution under Raft
Figure 6.1 shows the vertical soil pressure distribution under a quarter of a 16.0 m × 16.0
m × 0.6 m raft subjected to different pressures when d = 0.6 m, s = 4.5d, n = 334, L = 20d, and
H = 0.6 m. Note that the pressures supported by the piers are not included, and the values shown
in this figure are obtained from interpolation of the soil pressure around the piers. The pressures
supported by soil are obtained from the vertical stress of the integration points of soil elements
that are in contact with the raft.
Figure 6.1 (a) shows that the distribution of soil pressure somewhat resembles the saddle
shape in which the pressure is smaller in the center area and larger at the edge of raft. This
(a) External loading equals 1/6 ultimate loading (p = 1/6pu)
kPa

61
(b) External loading equals 1/3 ultimate loading (p = 1/3pu)
Figure 6.1 Vertical soil pressure distribution underneath raft
saddle shape distribution indicates that the external loading in the center area of the raft is
supported more by the piers than the soil, while outside the center area the soil carries higher
load than piers. With the increase of loading, the vertical soil pressure increases greatly.
However, the shape of soil pressure distribution remains almost the same, as shown in Figure
6.1, (b).
6.3 Vertical Soil Pressure Distribution in the Foundation System
Figures 6.2 (a), (b), (c), and (d) show the vertical soil pressure distributions, of which
Figures 6.2 (a), (b), and (c) are for a loading pressure on the raft of 900 kPa and Figure 6.2 (d)
for 1000 kPa for center-to-center pier spacing of 3.0d, 4.5d, 6.0d, and 9.0d. Here the pier
kPa
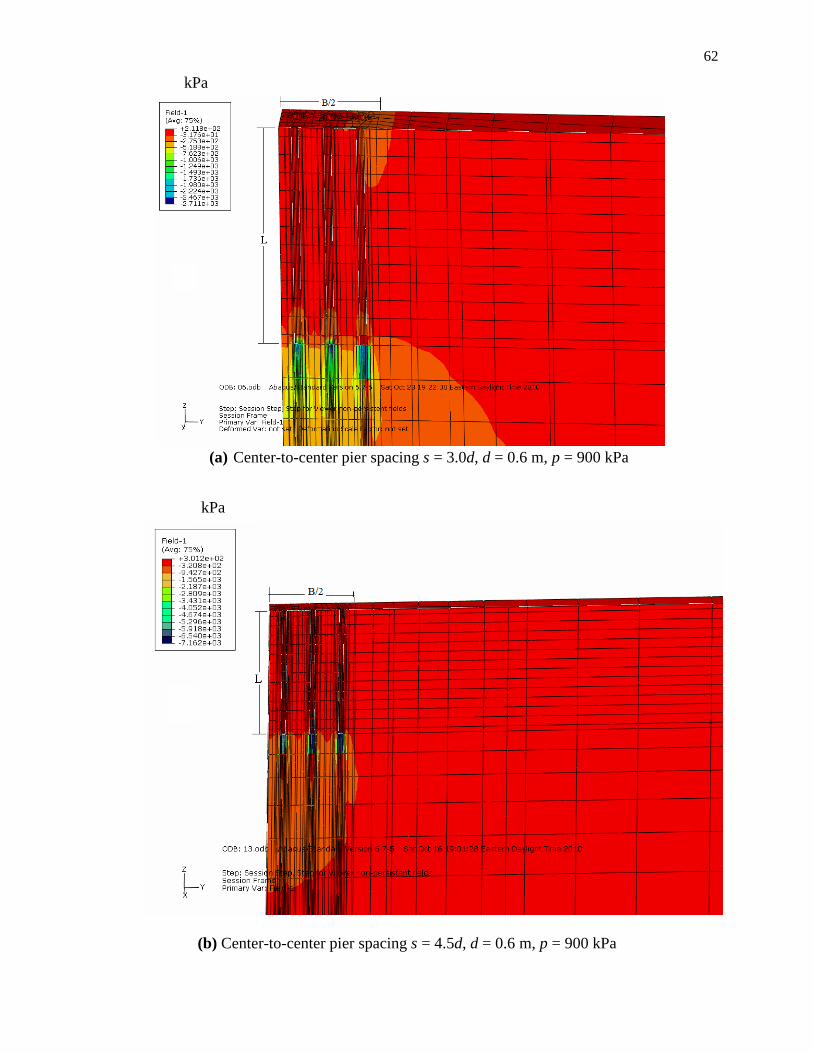
62
(a) Center-to-center pier spacing s = 3.0d, d = 0.6 m, p = 900 kPa
(b) Center-to-center pier spacing s = 4.5d, d = 0.6 m, p = 900 kPa
kPa
kPa

63
(c) Center-to-center pier spacing s = 6.0d, d = 0.6 m, p = 900 kPa
(d) Center-to-center pier spacing s = 9.0d, d = 0.6 m, p = 1000 kPa
Figure 6.2 Illustration of vertical soil pressure distribution (Elevation view)
kPa
kPa

64
diameter d is 0.6 m. These cross sections shown are taken at the center of the second row of
piers. Figure 6.2 reveals that the influencing area below the pier tips, which is influenced by the
pier-supported-raft foundation system, decreases with the increase in pier spacing. The variation
of soil pressure at the tip of the pier group is somewhat uniform suggesting that the soil
underneath the pier tips is compressed by the group action of piers. When s = 9.0d, Figure 6.2
(d) reveals a rather nonuniform pressure distribution suggesting that the underneath soil is
compressed by the individual action of piers. In other words, when the spacing is less than 6.0d,
the soil columns surrounded by peripheral piers settle with the piers as one whole block.
Therefore, the pier group effect is prominent in this case and is greatly different from a single
pile. When the pier spacing, however, increases to 9.0d, each pier settles individually and the
differential settlement between the tops of the center pier and the middle edge pier is greatly
increased. In this case, the pier group works similar to the sum of individual piers, and there is
more individual pier action rather group action.
This finding can also be verified by the soil settlement (vertical displacement)
distribution, which is discussed in Chapter 7. As a result, it can be concluded that the failure
mode of pier-supported-raft changes when pier spacing changes from 6.0d to 9.0d.
Figure 6.3 (a) to (g) show the vertical soil stress distribution at depth zero (i.e., raft
bottom or pier top surface level), 0.5L, 1.0L (i.e., pier base/bottom level), 1.5L, 2.0L, 3.0L, and
4.0L, respectively, for Case 13 external loading is p = 1536 kPa, where L = pier length. As it can
be clearly seen, soil vertical stress decreases with increasing depth.

65
(a) Illustration of vertical soil stress at depth 0 m (i.e., at raft bottom level)
(b) Illustration of vertical soil stress at depth 0.5L
kPa
kPa
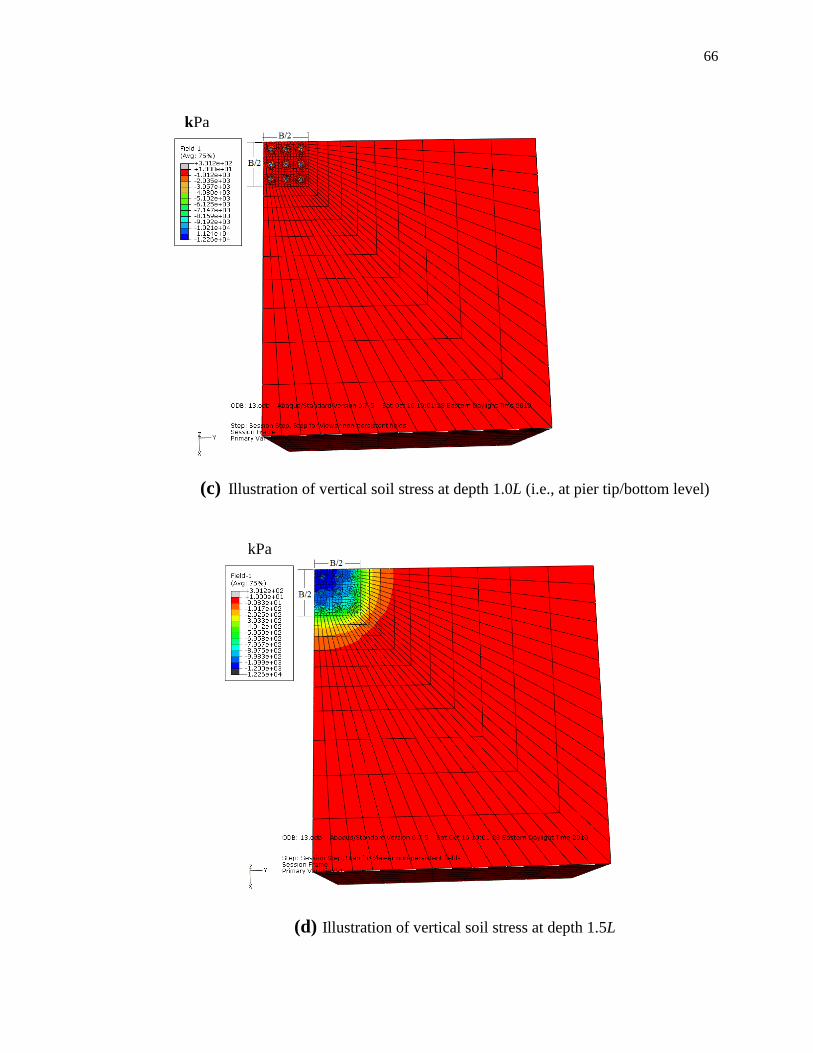
66
(c) Illustration of vertical soil stress at depth 1.0L (i.e., at pier tip/bottom level)
(d) Illustration of vertical soil stress at depth 1.5L
kPa
kPa
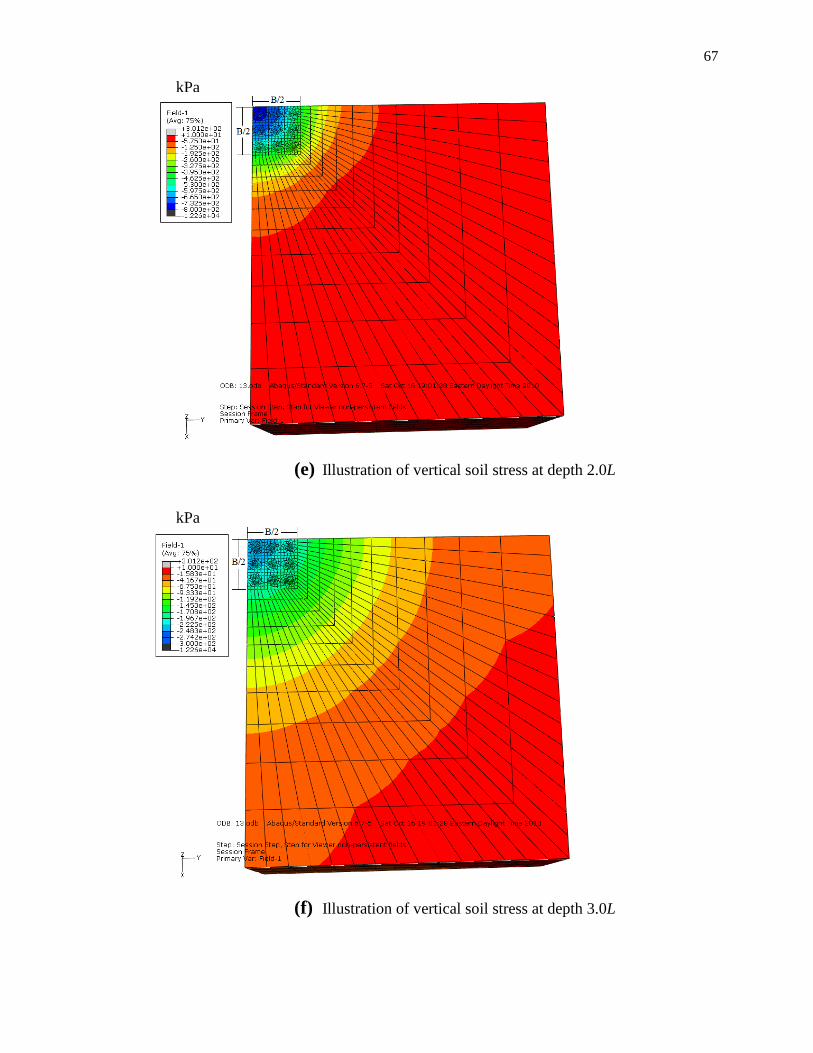
67
(e) Illustration of vertical soil stress at depth 2.0L
(f) Illustration of vertical soil stress at depth 3.0L
kPa
kPa

68
(g) Illustration of vertical soil stress at depth 4.0L
Figure 6.3 Illustration of vertical soil stress distribution (Plan view)
6.4 Vertical Axial Load Distribution along Piers
Figure 6.4 to Figure 6.6 illustrate the vertical axial load (excluding skin resistance)
distribution under different levels of external loading on raft for piers at the center, mid-edge,
and a corner of the pier group, respectively, for Case 13 shown in Table 5.1, in which H = 0.6 m,
d = 0.6 m, s/d = 4.5, L/d = 20, with 36 total number of piers. In this case, there are two layers of
soils having the upper soil layer much softer than the lower soil layer. The soil properties are
given in Table 5.1. The pier bottoms are inserted 0.5 m into the lower soil layer.
kPa

69
As shown, the vertical axial loads of the piers increase with the increase in loading levels.
Also, under the same loading, the pier vertical axial loads decrease with an increase in pier
depth. Even though the load pattern for the center, middle edge, and corner piers are the same,
the center pier carries the highest loading and corner pier the least, especially when the
foundation approaches the ultimate bearing capacity, which is 3810 kPa in this case.
Figure 6.4 Vertical axial load distribution of center pier (Case 13)

70
Figure 6.5 Vertical axial load distribution of mid-edge pier (Case 13)
Figure 6.6 Vertical axial load distribution of corner pier (Case 13)

71
Figure 6.7 to Figure 6.9 show the vertical axial load distribution of piers in the center, at
the mid-edge, and a corner of the pier group, respectively, for case 16, for which H = 0.6 m, d =
0.6 m, s/d = 4.5, L/d = 20, and the total piers used are 36 piers (3 × 3 × 4). Only one single
uniform soil layer is considered in this case. The soil properties are shown in Table 5.1. In this
case, the soil stiffness is much smaller than those of the two soil layers in Case 13. The results in
Figure 6.7 to Figure 6.9 clearly show that the load capacity in this case is much smaller than that
of Case 13 though the load transfer mechanism is very similar. This is mainly due to the fact that
the lower soil layer in Case 13 is much stronger and stiffer, thus, it will provide much higher pier
base load carrying capacity.
Figure 6.7 Vertical axial load distribution of center pier (Case 16)
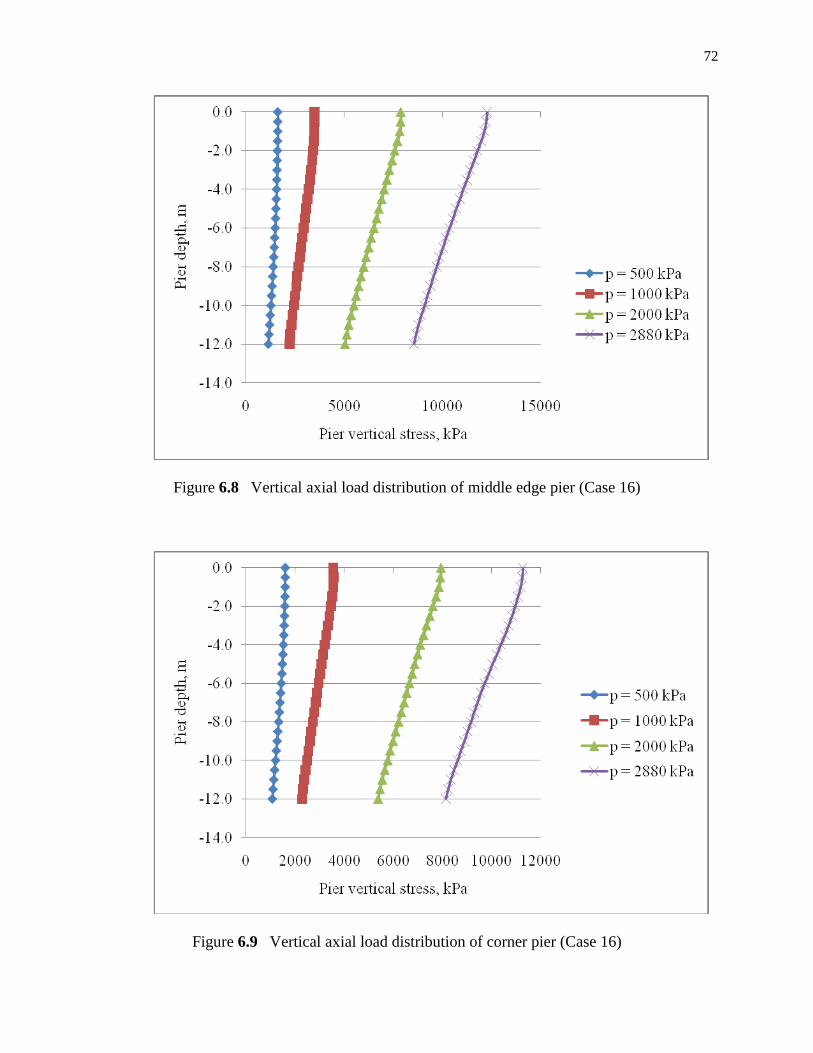
72
Figure 6.8 Vertical axial load distribution of middle edge pier (Case 16)
Figure 6.9 Vertical axial load distribution of corner pier (Case 16)
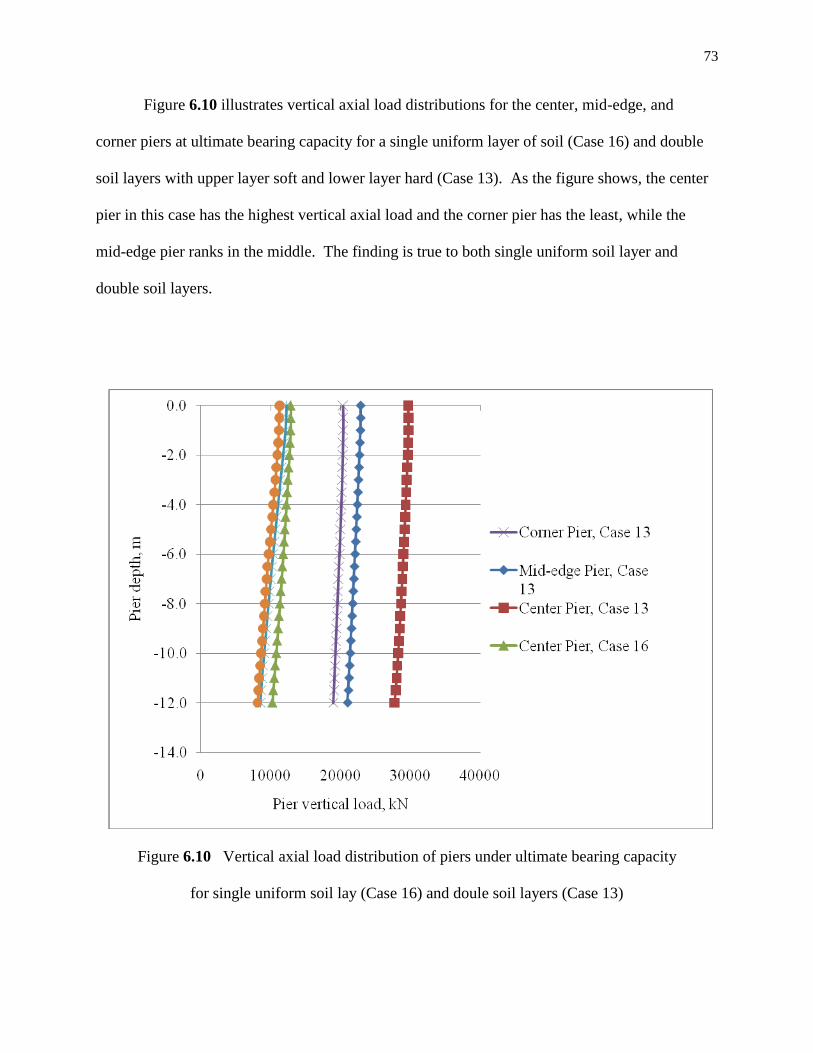
73
Figure 6.10 illustrates vertical axial load distributions for the center, mid-edge, and
corner piers at ultimate bearing capacity for a single uniform layer of soil (Case 16) and double
soil layers with upper layer soft and lower layer hard (Case 13). As the figure shows, the center
pier in this case has the highest vertical axial load and the corner pier has the least, while the
mid-edge pier ranks in the middle. The finding is true to both single uniform soil layer and
double soil layers.
Figure 6.10 Vertical axial load distribution of piers under ultimate bearing capacity
for single uniform soil lay (Case 16) and doule soil layers (Case 13)

74
6.5 Skin Resistance Distribution along Piers
Figure 6.11 shows the distributions of skin resistance along pier length for piers at center,
mid-edge, and corner under ultimate bearing capacity. The conditions analyzed are those of
Case 13, in which, H = 0.6 m, d = 0.6 m, s = 4.5d, L = 20d, n = 3 × 3 × 4 piers. As shown, skin
resistance increases with depth for all the piers. While the skin resistance patterns are the same,
the center pier has the highest skin resistance followed in order by mid-edge pier then corner
pier.
Figure 6.11 Skin resistance distribution along pier length
under ultimate bearing capacity for three different piers at Case 13

75
6.6 Raft/Pier Load Distribution
Under a given vertical foundation loading, the ratio between the load carried by the raft
and the applied total load is expressed as:
Rr = Fr/Ft ×100% (6.1)
where Rr is the raft load ratio expressed in %,
Fr is the load carried by the raft in kN, and
Ft is the total load applied on raft in kN.
Thus, the load ratio carried by the piers equals:
Rp = 100% - Rr (6.2)
where Rp is the pier load ratio (load carrying ratio by the piers), %.
A major objective of this study is to determine how much of the structural loads are
carried by the raft in a pier-supported-raft foundation system. The finding can be used as a
general guideline for developing a more cost effective design methodology for such a foundation
system. It can be expected that the load ratio is influenced by many factors. Some of the
influence factors are discussed below.

76
6.6.1 Raft thickness effect
Figure 6.12 shows the variation of the raft load ratio with applied foundation load for four
different raft thicknesses with a raft size of 16.2 m (width) × 16.2 m (length). As can be seen,
when the raft is very thin (say H = 0.08 m), the initial raft load ratio reaches about 25%. With the
loading level increases, the raft load ratio decreases sharply. This is because, when raft is very
thin, its stiffness is low, and the soils underneath the raft will immediately experience the loading
over the area not supported by piers. The raft load ratio decreases for about 2% when the raft
thickness increases from 0.2 to 0.6 m. After raft thickness reaches 0.6 m, the raft load ratio
becomes less sensitive to the raft thickness under a given loading level. Also, with the increase
of loading level, the raft load ratio decreases slightly to a certain degree and then increases after
Figure 6.12 Effect of foundation load on raft load ratio for different raft thicknesses
77
the loading level reaches a certain value about the ultimate bearing capacity. This is because,
when the foundation reaches its ultimate bearing capacity, excessive settlement may occur,
which will force the raft into very close and strong contact with the soil underneath. Thus, its
raft load ratio slightly increases. In this study, raft thickness as of 0.08 m, 0.2 m, 0.6m, and 1.0
m are referred to as Case 18, Case 2, Case 13, and Case 3, respectively. When raft carries more
load (higher raft load ratio) for thinner rafts, piers certainly will carry less load with a smaller
pier load ratio. This finding is also supported by Poulos, ISSMGE (2001).
6.6.2 Pier diameter effect
Pier diameter certainly affects the raft load ratio, as shown by Figure 6.13. When the
loading is small, the raft load ratio increases inversely with the increase of pier diameter, and
under the same diameter, raft load ratio increases with increase in loading. For larger diameter
piers, this trend remains true. However, for smaller diameter piers, with the increase in loading
after the load reaches a certain level, the raft load ratio will decrease with an increase of loading.
This is especially true for the very small diameter piers, say for d = 0.2 m. This is partially
because, when pier diameter is small, the raft size is small (as this is the case in this study).
Thus, the ultimate bearing capacity is small. The foundation system reaches failure point quickly
and easily. The failure mode for small diameter pier-supported-raft foundation is different than
that of such a type of foundation with larger diameter piers.
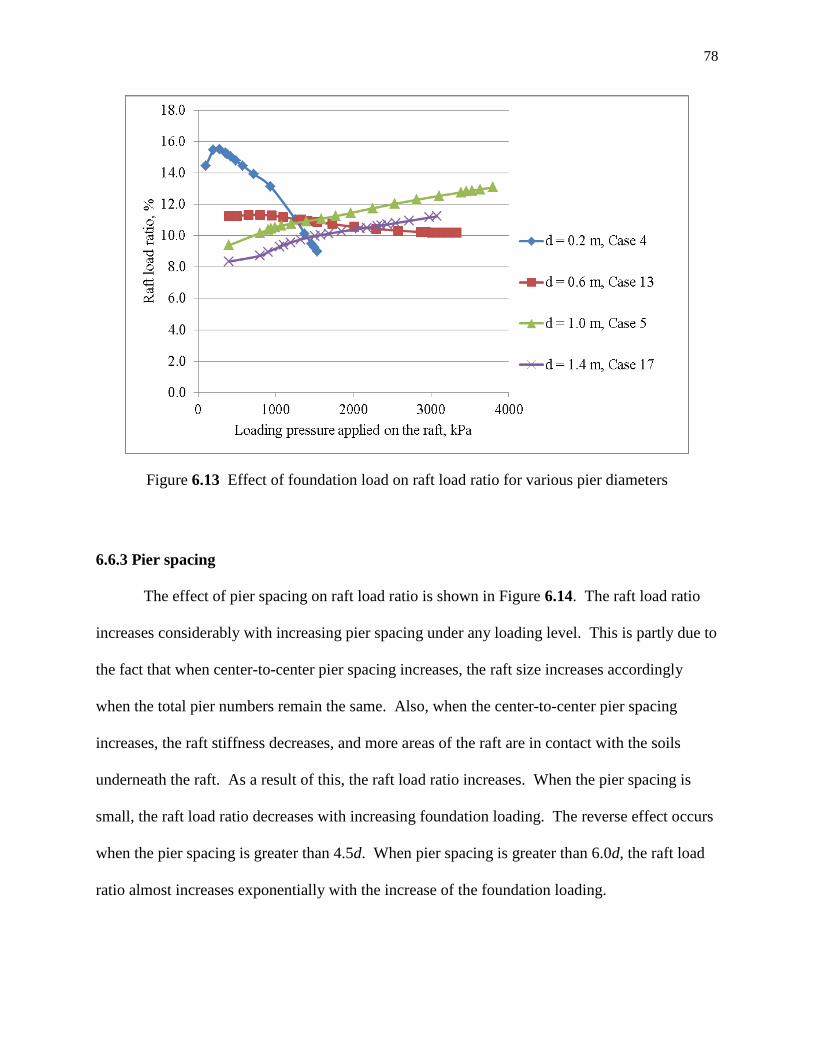
78
Figure 6.13 Effect of foundation load on raft load ratio for various pier diameters
6.6.3 Pier spacing
The effect of pier spacing on raft load ratio is shown in Figure 6.14. The raft load ratio
increases considerably with increasing pier spacing under any loading level. This is partly due to
the fact that when center-to-center pier spacing increases, the raft size increases accordingly
when the total pier numbers remain the same. Also, when the center-to-center pier spacing
increases, the raft stiffness decreases, and more areas of the raft are in contact with the soils
underneath the raft. As a result of this, the raft load ratio increases. When the pier spacing is
small, the raft load ratio decreases with increasing foundation loading. The reverse effect occurs
when the pier spacing is greater than 4.5d. When pier spacing is greater than 6.0d, the raft load
ratio almost increases exponentially with the increase of the foundation loading.

79
Figure 6.14 Effect of foundation load on raft load ratio for different pier spacings
6.6.4 Pier length effect
The effect of pier length on raft load ratio is illustrated in Figure 6.15. With the increase
in pier length, the raft load ratio decreases. This finding is supported by Poulos, ISSMGE
(2001). This is because pier load carrying capacity increases when the pier length increases.
6.6.5 Pier number effect
Figure 6.16 shows that the number of piers in the foundation system has a significant
effect on raft load ratio under low external loading. The effect appears to decrease with an
increase in external loading within the range of working load. Beyond the working load range,
the effect becomes insignificant. The value of working load is approximately from 1500 to 3000
kPa for the case analyzed. While the loading level is small, the increase of pier number
decreases the raft load

80
Figure 6.15 Effect of foundation load on raft load ratio for different pier lengths
Figure 6.16 Effect of foundation load on raft load ratio for different pier numbers
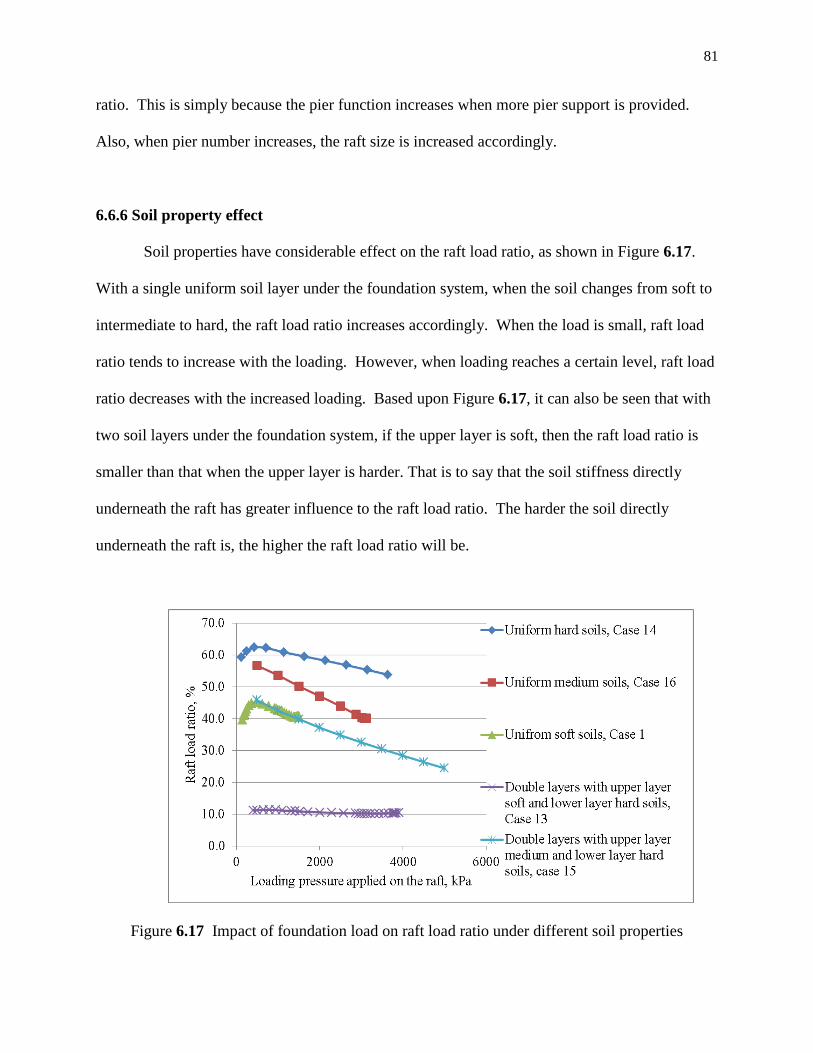
81
ratio. This is simply because the pier function increases when more pier support is provided.
Also, when pier number increases, the raft size is increased accordingly.
6.6.6 Soil property effect
Soil properties have considerable effect on the raft load ratio, as shown in Figure 6.17.
With a single uniform soil layer under the foundation system, when the soil changes from soft to
intermediate to hard, the raft load ratio increases accordingly. When the load is small, raft load
ratio tends to increase with the loading. However, when loading reaches a certain level, raft load
ratio decreases with the increased loading. Based upon Figure 6.17, it can also be seen that with
two soil layers under the foundation system, if the upper layer is soft, then the raft load ratio is
smaller than that when the upper layer is harder. That is to say that the soil stiffness directly
underneath the raft has greater influence to the raft load ratio. The harder the soil directly
underneath the raft is, the higher the raft load ratio will be.
Figure 6.17 Impact of foundation load on raft load ratio under different soil properties

82
6.7 Summary
The external vertical loading on top of the raft is transmitted to the supporting ground
through pier tip, pier skin, and raft of the pier-supported-raft foundation. Through the discussion
above, it can be seen that many factors influence the load transfer mechanism. These factors are
raft thickness (H), pier diameter (d), length (L), and center-to-center spacing (s), as well as soil
properties. The degree of influence for each of these factors varies. The skin resistance
increases with depth while pier vertical axial load decreases with depth. When pier spacing
varies from 3.0d to 6.0d, the pier group action effect exists. However, when pier spacing reaches
9.0d, pier group action diminishes and each pier acts individually.
The raft load ratio is greatly influenced by those factors affecting the load transfer
mechanism. The raft load ratio varies between 3% and 63% within the ranges investigated. For
all the cases analyzed, soil property and center-to-center pier spacing appear to be the most
influential factors. Pier length and diameter also impact the raft load ratio to a certain degree.
Raft thickness (excluding very thin raft, say H < 0.1 m) and pier number are not as significant as
other factors.

83
Chapter 7
SETTLEMENT BEHAVIOR
7.1 Introduction
Settlement including total settlement and differential settlement is one of the most
important criteria in foundation design. It is, therefore, vitally important to fully understand
settlement behavior of a foundation system before a rational design methodology for practical
applications can be developed. There are many factors that impact settlement behavior of pier-
supported-raft foundations. These factors include, but are not limited to, raft thickness, pier
diameter, pier length, pier spacing, soil properties, etc.
7.2 Settlement Behavior of Pier-Supported-Raft Foundation
When the pier-supported-raft foundation is subjected to load, settlement will occur.
Generally speaking, when the load is small, both soils and concrete (the pier-supported-raft
foundation) behave elastically and settlement varies with stress linearly. The plastic response
begins to develop in soils when the stress increases to a certain level. The raft settlement
accelerates with increasing loading due to the development of plastic yielding in soils. When
loading exceeds the yield load point, settlement increases drastically causing foundation failure.
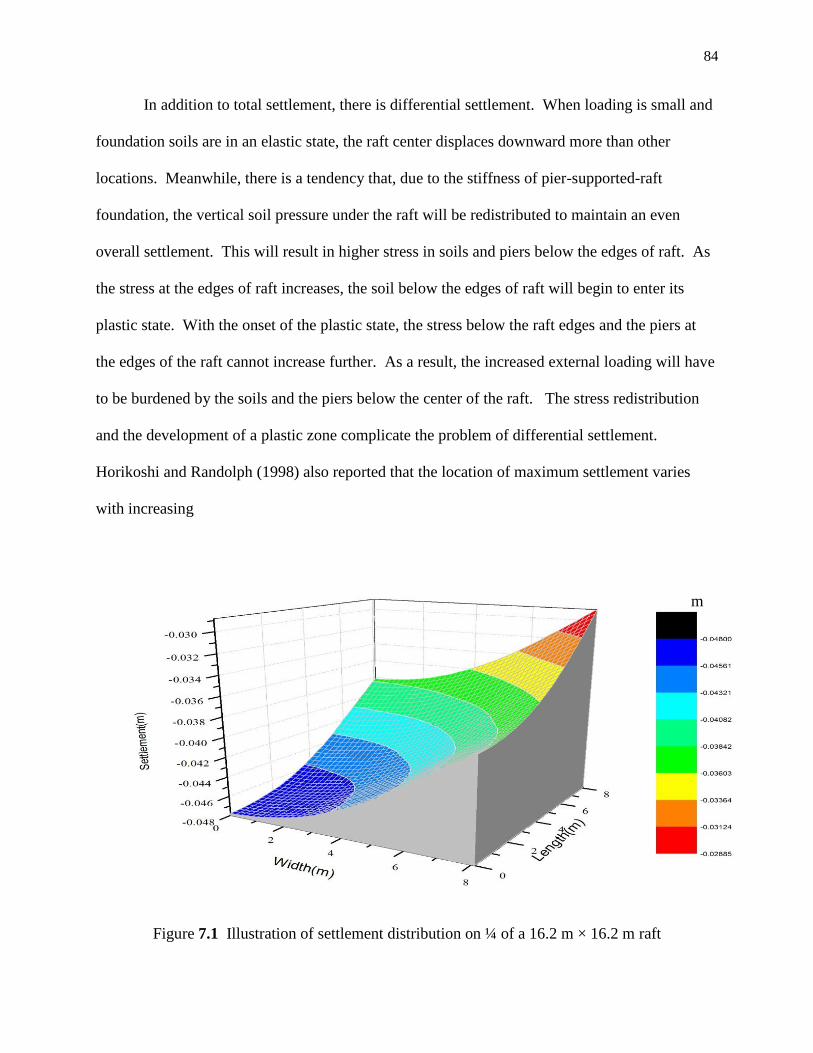
84
In addition to total settlement, there is differential settlement. When loading is small and
foundation soils are in an elastic state, the raft center displaces downward more than other
locations. Meanwhile, there is a tendency that, due to the stiffness of pier-supported-raft
foundation, the vertical soil pressure under the raft will be redistributed to maintain an even
overall settlement. This will result in higher stress in soils and piers below the edges of raft. As
the stress at the edges of raft increases, the soil below the edges of raft will begin to enter its
plastic state. With the onset of the plastic state, the stress below the raft edges and the piers at
the edges of the raft cannot increase further. As a result, the increased external loading will have
to be burdened by the soils and the piers below the center of the raft. The stress redistribution
and the development of a plastic zone complicate the problem of differential settlement.
Horikoshi and Randolph (1998) also reported that the location of maximum settlement varies
with increasing
Figure 7.1 Illustration of settlement distribution on ¼ of a 16.2 m × 16.2 m raft
m

85
stress level. The settlement distribution of one-quarter of the pier-supported-raft with a uniform
soil is shown in Figure 7.1. From this figure, it can be seen that the settlement of the raft is not
uniform and the maximum settlement occurs at the raft center. Figure 7.2 also shows settlement
contours on ¼ of a raft.
Figure 7.2 Settlement distribution contours on ¼ of a 16.2 m × 16.2 m raft
From Figure 7.3, it can be seen that, underneath the raft the settlement, contour lines
display a steep slope toward center when the pier spacing is 3.0d; when the pier spacing reaches
9.0d, the lines become flatter. This shows that when the pier spacing is small (say s = 3.0d), the
m
Raft corner Raft center

86
(a) Center-to-center pier spacing s = 3.0d, d = 0.6 m, p = 900 kPa
(b) Center-to-center pier spacing s = 9.0d, d = 0.6 m, p = 500 kPa
Figure 7.3 Illustration of vertical soil displacement (settlement) distribution in the foundation
m
m

87
soil between piers acts with the piers as a unit exhibiting pier group action. On the other hand,
when the pier spacing is large (say s = 9.0d), the pier group effect diminishes and the behavior of
the foundation system reflects individual pier actions.
7.3 Total Settlement
The total settlement here refers to the average overall vertical displacement on the top
surface of the raft. If the entire structure displaces uniformly, it should not cause structural
damage unless the total foundation settlement exceeds the allowable settlement values shown in
Table 2.1. Besides structural loads, the following factors have great influences on total
settlements of pier-supported-raft foundations.
7.3.1 Raft thickness effect
Figure 7.4 shows how raft thickness influences the average total settlement. It appears
from Figure 7.4 that the total settlement is not sensitive to the change in raft thickness. In all
four cases (Case 18, Case 2, Case 13, and Case 3), raft thickness varies from 0.08 to 0.2 to 0.6 to
1.0 m while d = 0.6 m, s/d = 4.5, L/d = 20, n = 3 × 3 ×4 remain the same. Other studies, such as
Kuwabara (1989), and Prakoso and Kylhawy (2001), have also shown the same conclusion based
upon their elastic parametric analysis. This conclusion is expected because the foundation
settlement is primarily controlled by the properties of soils and the piles instead of the raft.
7.3.2 Pier diameter effect
Figure 7.5 illustrates the impact of the pier diameters on settlement. Under the same

88
Figure 7.4 Influence of loading on settlement with raft thickness effect
Figure 7.5 Influence of loading on settlement with pier diameter effect
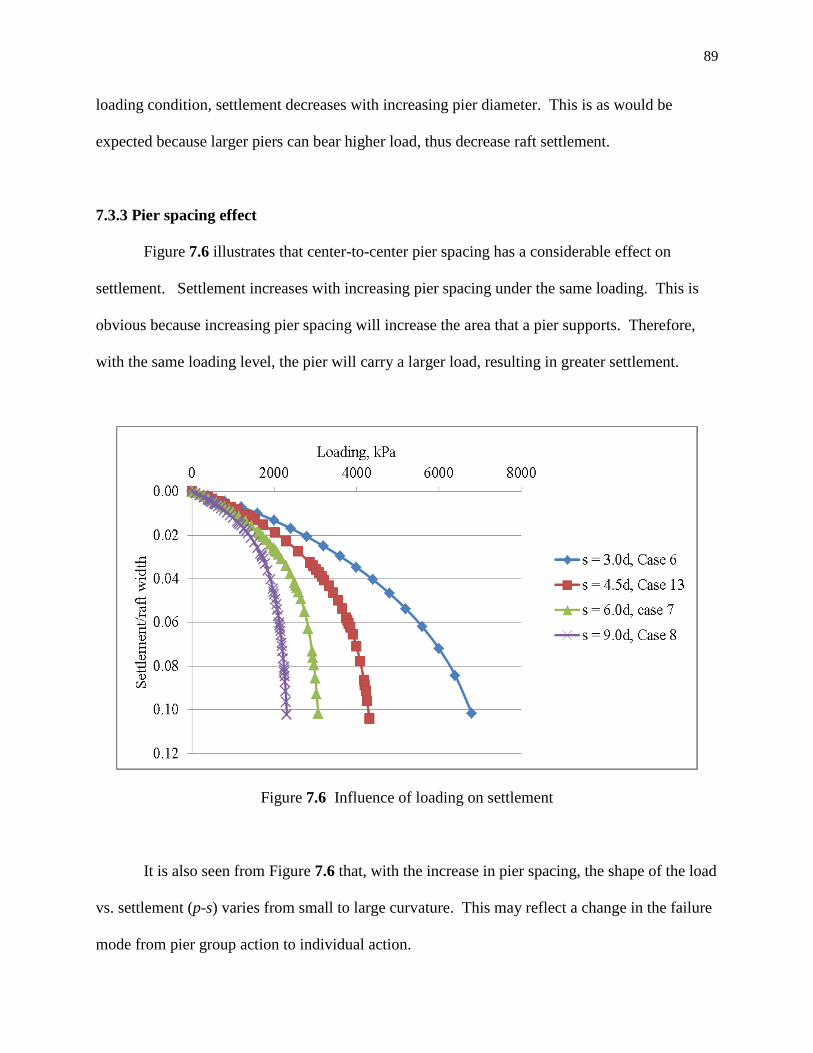
89
loading condition, settlement decreases with increasing pier diameter. This is as would be
expected because larger piers can bear higher load, thus decrease raft settlement.
7.3.3 Pier spacing effect
Figure 7.6 illustrates that center-to-center pier spacing has a considerable effect on
settlement. Settlement increases with increasing pier spacing under the same loading. This is
obvious because increasing pier spacing will increase the area that a pier supports. Therefore,
with the same loading level, the pier will carry a larger load, resulting in greater settlement.
Figure 7.6 Influence of loading on settlement
It is also seen from Figure 7.6 that, with the increase in pier spacing, the shape of the load
vs. settlement (p-s) varies from small to large curvature. This may reflect a change in the failure
mode from pier group action to individual action.

90
The effect of pier spacing shown in Figure 7.6 can also be explained using the equivalent
elastic modulus of the pier similar to the one proposed by Kuwabara (1989), which is defined as
dS
spE p
2
(7.1)
where s is the center-to-center pier spacing, S is the raft settlement, d is the pier diameter, and p
is the loading pressure.
The relationship of Ep with raft settlement is shown in Figure 7.7. Based upon Figure
7.7, the greater the pier spacing is, the higher the equivalent elastic modulus of the pier will be.
A similar finding has been reported by Kuwabara (1989). This is due to the fact that the pier
group effect is minimized when pier spacing is greater than a certain value, say when s is greater
than 6.0d in this study. This means that, to certain extent, the greater the pier spacing is, the
more effective of the pier will be. Therefore, under a certain limit, larger center-to-center pier
spacing is desired from the point of view of economics.
7.3.4 Pier length effect
Figure 7.8 shows the relationship between settlement and loading for three different pier
lengths. Under small loading, the pier length effect on settlement is not significant. A similar
effect was also reported by Cooke (1986). Cooke (1986) reported that settlement is insignificant
to pile length within the range of s = 10d to 20d when the loading is below 50% of ultimate load.

91
Figure 7.7 Relationship between equivalent elastic modulus and settlement
Figure 7.8 Influence of loading on settlement with pier length effect

92
This would be expected because the soils in this study have two layers and the lower layer is
stiffer and stronger than the upper layer. The top soft soil layer reduces the friction resistance of
the pier shaft, though the pier tip support is increased. When the loading reaches a certain level,
however, settlement increases inversely with pier length. This is possibly due to the fact that the
longer the pier length is, the more resistance the pier will provide. Consequently, settlement
reduces.
7.3.5 Pier number effect
Load vs. settlement curves for three different pier numbers are shown in Figure 7.9. The
settlement decreases with the increase in pier number under the same loading level. This can be
attributed to smaller stress at pier tip due to the increased pier number. Smaller pier stress causes
less settlement.
7.3.6 Soil property effect
The effect of soil property on the settlement vs. load relationship is revealed in Figure
7.10. As expected, it can be seen that the harder the soil is, the lower the settlement of the pier-
supported-raft will be.
Based upon Figure 7.10, settlement reduces considerably when soils vary from soft to
medium to strong under a same loading level. For Case 1 and Case 13, while Case 13 has the
same soil for the upper layer as the soils in Case 1, the lower soil layer has been replaced with
harder and stronger soils. As a result of this, settlement is substantially lower in Case 13 than in
Case 1. When the upper soil layer increases its stiffness and strength, this effect is also true but
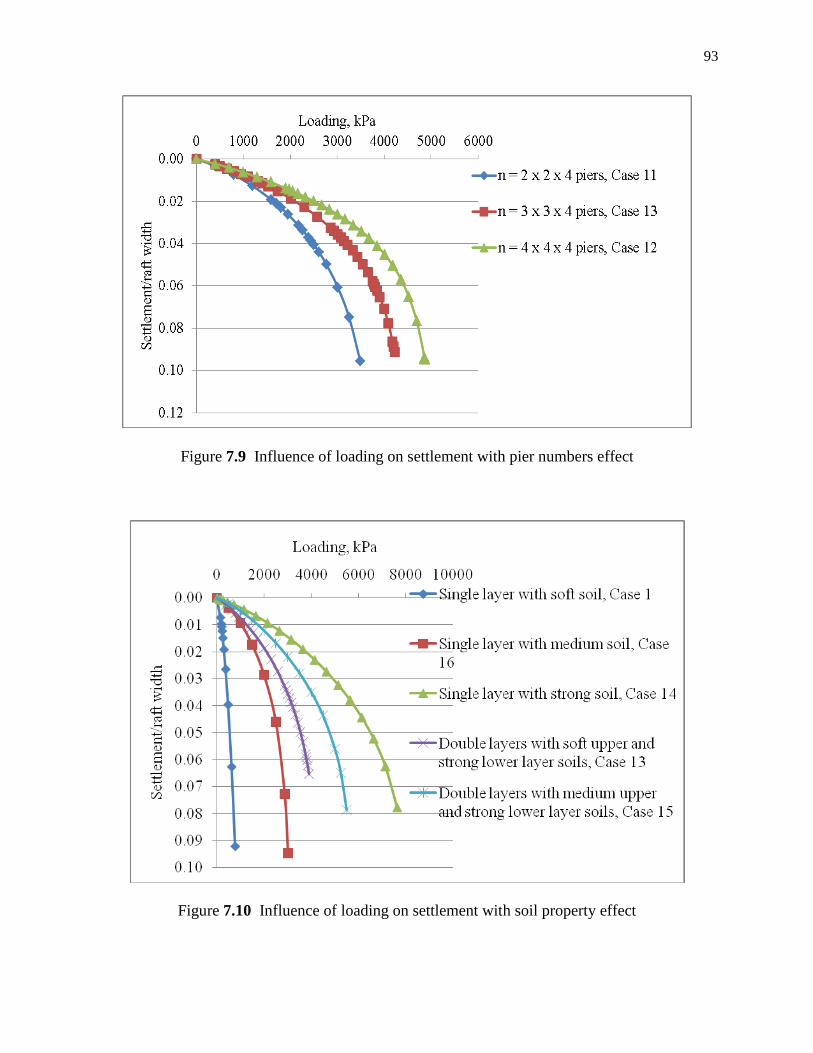
93
Figure 7.9 Influence of loading on settlement with pier numbers effect
Figure 7.10 Influence of loading on settlement with soil property effect

94
settlement reduction is not as great as when the lower soil layer stiffness and strength are
increased. This indicates that the soils at the lower layer of piers are more effective in reducing
settlement than that of upper soils.
7.4 Differential Settlement
In terms of destructive effect, differential settlement is more critical than total settlement.
Differential settlement is calculated as settlement difference between any two points on the raft
surface. In this study, the differential settlement is taken as the settlement difference between the
raft center and the mid-point of the raft edge. The positive value indicates that the settlement
value at the raft middle edge point is greater than that at the raft center point. Certainly, there are
many factors that influence differential settlement. The following discussion focuses on the
factors affecting differential settlement of the pier-supported-raft foundation.
7.4.1 Raft thickness effect
Figure 7.11 shows the effect of raft thickness on the differential settlement vs. loading
relationship. As pointed out earlier, total settlement is not sensitive to raft thickness. However,
the figure shows that the differential settlement is significantly sensitive to raft thickness. When
the loading is small, the differential settlement is insensitive to raft thickness under the same
loading condition. However, when the load exceeds a certain level, the differential settlement
decreases significantly with the increase of the raft thickness under the same load. The finding is
in agreement with Prakoso and Kulhawy (2001). From Figure 7.11, it can be seen that the
settlement at the raft middle edge point is slightly greater than the raft center point with small
loading. However, this effect is reversed quickly with the increase in the loading level, which
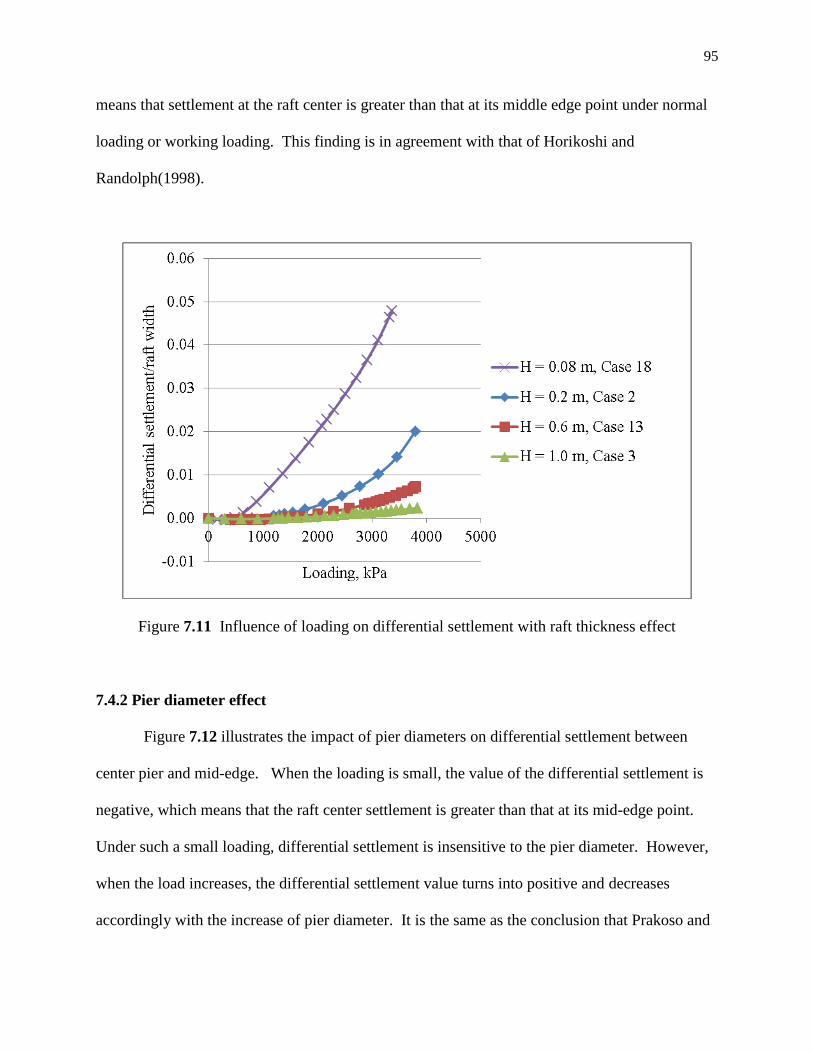
95
means that settlement at the raft center is greater than that at its middle edge point under normal
loading or working loading. This finding is in agreement with that of Horikoshi and
Randolph(1998).
Figure 7.11 Influence of loading on differential settlement with raft thickness effect
7.4.2 Pier diameter effect
Figure 7.12 illustrates the impact of pier diameters on differential settlement between
center pier and mid-edge. When the loading is small, the value of the differential settlement is
negative, which means that the raft center settlement is greater than that at its mid-edge point.
Under such a small loading, differential settlement is insensitive to the pier diameter. However,
when the load increases, the differential settlement value turns into positive and decreases
accordingly with the increase of pier diameter. It is the same as the conclusion that Prakoso and

96
Kulhawy (2001) draw from elastic analysis. Note that the value of B/H remains constant to
minimize the effect of raft stiffness and flexibility on differential settlement here.
Figure 7.12 Influence of loading on differential settlement with pier diameter effect
7.4.3 Pier spacing effect
Figure 7.13 illustrates the influence of pier spacing on differential settlement. When the
load is very small, differential settlement is not sensitive to the pier spacing. As the load
increases above a certain level, differential settlement turns from negative to positive and the
magnitude increases dramatically with the increase of pier spacing. The trend of variation is
similar to that of Prakoso and Kulhawy (2001) and Horikoshi and Randolph (1998), although it
is more pronounced in this study. This can be attributed to the decrease in relative raft stiffness
with the increase of center-to-center pier spacing.
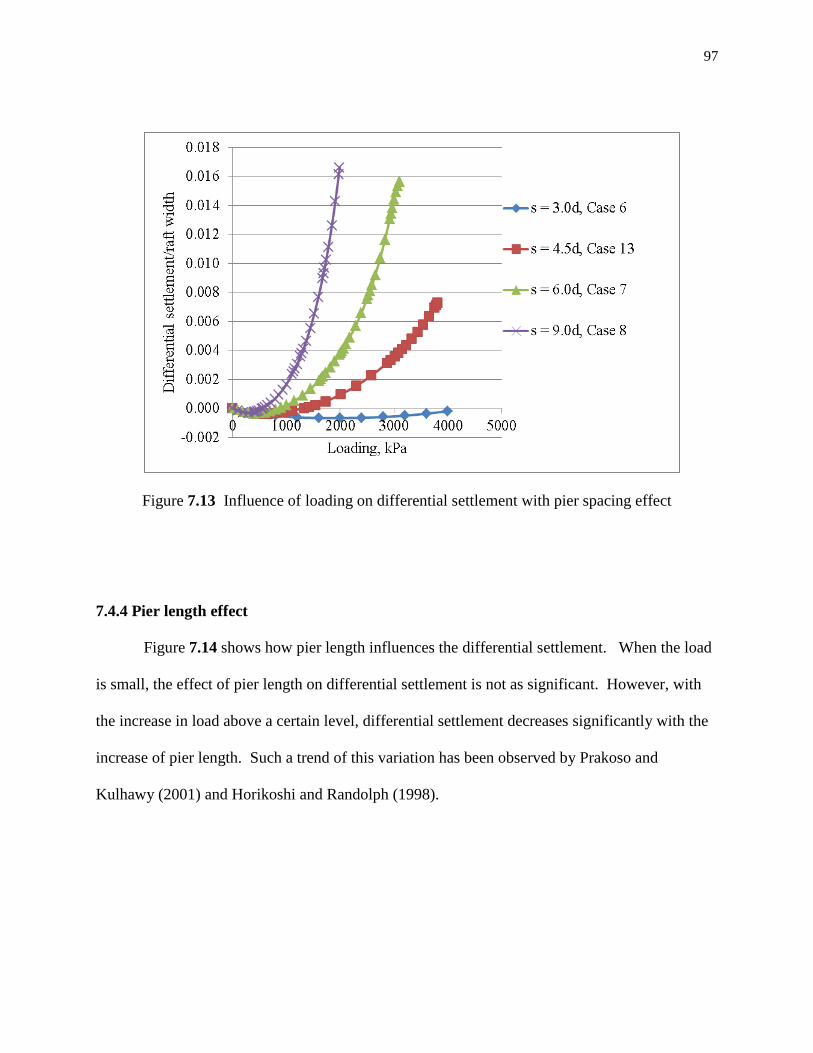
97
Figure 7.13 Influence of loading on differential settlement with pier spacing effect
7.4.4 Pier length effect
Figure 7.14 shows how pier length influences the differential settlement. When the load
is small, the effect of pier length on differential settlement is not as significant. However, with
the increase in load above a certain level, differential settlement decreases significantly with the
increase of pier length. Such a trend of this variation has been observed by Prakoso and
Kulhawy (2001) and Horikoshi and Randolph (1998).
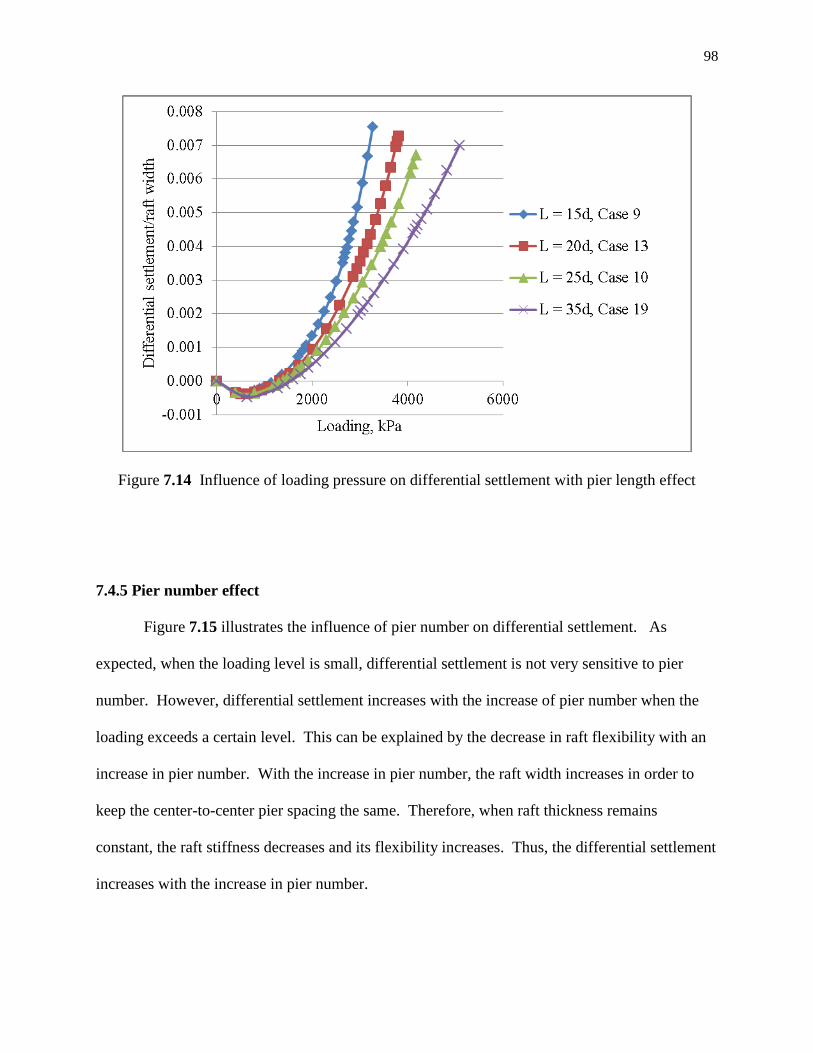
98
Figure 7.14 Influence of loading pressure on differential settlement with pier length effect
7.4.5 Pier number effect
Figure 7.15 illustrates the influence of pier number on differential settlement. As
expected, when the loading level is small, differential settlement is not very sensitive to pier
number. However, differential settlement increases with the increase of pier number when the
loading exceeds a certain level. This can be explained by the decrease in raft flexibility with an
increase in pier number. With the increase in pier number, the raft width increases in order to
keep the center-to-center pier spacing the same. Therefore, when raft thickness remains
constant, the raft stiffness decreases and its flexibility increases. Thus, the differential settlement
increases with the increase in pier number.

99
Figure 7.15 Influence of loading on differential settlement with pier number effect
7.4.6 Soil property effect
Figure 7.16 illustrates the influences of soil property on differential settlement. From
this figure, it can be seen that the harder the soil is, the smaller the differential settlement will be.
It can also be concluded from the figure that the differential settlement is affected not only by the
soil properties but also by its distribution. According to this study, the differential settlement
with the double soil layers with an upper medium soil layer is smaller than that of uniform hard
soils.
7.5 Summary
The preceding discussion on settlement behavior indicates that the settlement of pier-
supported-raft foundation is affected by numerous factors. Among the influence factors

100
Figure 7.16 Influence of loading on differential settlement with soil property effect
investigated, raft thickness appears to have an insignificant effect on total settlement within the
range of thickness as analyzed. For differential settlement, however, the effect of raft thickness
is rather significant when the raft loading increases. Generally speaking, under a given loading
and soil conditions, the total settlement increases with increasing pier spacing, pier length, pier
number, and pier diameter. Differential settlement is greater under smaller raft thickness, pier
spacing, and pier number. Smaller differential settlement also results from larger pier diameter
and longer pier length. Based upon these findings, the various influence factors need to be
carefully considered in the design of pier-supported-raft foundation in order to arrive at a safe
and economic design.
101
Chapter 8
ULTIMATE BEARING CAPACITY
8.1 Introduction
The load per unit area of a foundation at which the shear failure in soil occurs is called
the ultimate bearing capacity. Soil must be capable enough to carry the loads from any
engineered superstructure placed upon it without any shear failure and with the resulting
settlement being tolerable for that superstructure. Although more and more attention has been
paid to the settlement control of pier-supported-raft foundations, the design of such a foundation
system still requires a consideration of the ultimate bearing capacity. In the majority of pier-
supported-raft foundation designs, the number of piers beneath a raft is determined using an
assumption that all the structural loads are carried by the piers. However, it has been widely
recognized and also verified through this study, as shown in Chapter 6, that the contribution of
the raft to the performance of a pier-supported-raft foundation is significant. The raft load ratio
(i.e., the raft load carrying ratio) depends upon the rigidity of the raft and other factors. From an
economical point of view, the ultimate bearing capacity should consider the interaction of the
raft and piers. In this chapter, the effect of factors such as raft thickness, number of piers, pier

102
diameter, center-to-center pier spacing, and pier length on the ultimate bearing capacity is
investigated.
8.2 Determination of Ultimate Bearing Capacity
Due to the lack of a rigorous analytical method, empirical methods are often used for
determining the ultimate bearing capacity. Currently, numerous empirical methods are available.
Among them, the following determination methods are more frequently used.
I. Based upon the characteristic of load vs. settlement (p-S) curve
There are several approaches in using the pressure vs. settlement (p-S) curve to determine
the ultimate bearing capacity:
(i) The ultimate bearing capacity is taken at the pressure where the slope of p-S curve
changes from a gradual decrease to a constant slope. When the inflection point is
not obvious, the curve can also be plotted using different scales such as log p –
log S or log p – S.
(ii) The ultimate bearing capacity is taken at the pressure of the intersection point
between the initial slope line and the line extrapolated from the constant slope of
the curve. When the constant slope portion of the curve is not obvious, the curve
can also be plotted in the scales of log p – log S. Figure 8.1 illustrates the
approach using log p – S curve.
II. Based upon the settlement rate curve
The settlement data of pile load test are plotted against time in log scale. The ultimate
bearing capacity is taken at the point where the slope of the curve reaches maximum.
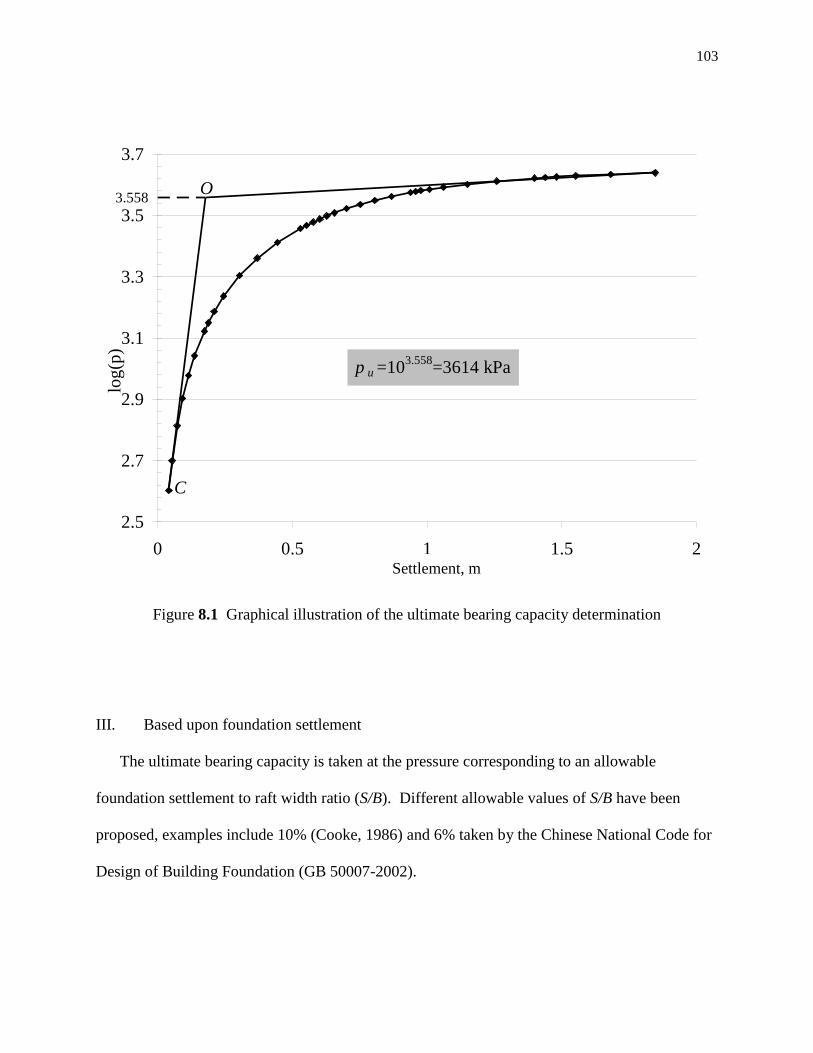
103
2.5
2.7
2.9
3.1
3.3
3.5
3.7
0 0.5 1 1.5 2Settlement,m
log
(p)
3.558
p u =103.558
=3614 kPa
O
C
Figure 8.1 Graphical illustration of the ultimate bearing capacity determination
III. Based upon foundation settlement
The ultimate bearing capacity is taken at the pressure corresponding to an allowable
foundation settlement to raft width ratio (S/B). Different allowable values of S/B have been
proposed, examples include 10% (Cooke, 1986) and 6% taken by the Chinese National Code for
Design of Building Foundation (GB 50007-2002).
Settlement, m

104
Among these different methods, the method based upon S/B = 6% is adopted in this
research. The primary reason of selecting this criterion is that it is easy to use and also it will
provide a more conservative value of ultimate bearing capacity.
8.3 Influence Factors on Ultimate Bearing Capacity
8.3.1 Raft thickness effect
Figure 8.2 shows the effect of raft thickness on ultimate bearing capacity of pier-
supported-raft foundation. The raft thicknesses analyzed are 0.08 m, 0.2 m, 0.6 m, and 1.0 m
Figure 8.2 Effect of raft thickness on ultimate bearing capacity
with other conditions and parameters remaining the same. From this figure it can be seen that
the ultimate bearing capacity of such a foundation system varies slightly with increasing raft

105
thickness. When the raft thicknesses are 0.08 m, 0.2 m, 0.6 m, and 1.0 m, the ultimate bearing
capacities are 3568 kPa, 3714 kPa, 3801 kPa, and 3807 kPa, respectively.
8.3.2 Pier diameter effect
Figure 8.3 shows the ultimate bearing capacity of pier-supported-raft foundation
increases with pier diameter. The diameters analyzed in this study are 0.2 m, 0.6 m, 1.0, and 1.4
m. As can be seen from this figure, ultimate bearing capacity increases considerably when pier
diameter increases from 0.2 m to 0.6 m. The rate of increase of the ultimate bearing is more
gradual when the pier diameter increases from 0.6 m to 1.0 m. However, the ultimate bearing
capacity increases significantly again when pier diameter increases from 1.0 m to 1.4 m.
Figure 8.3 Effect of pier diameter on ultimate bearing capacity
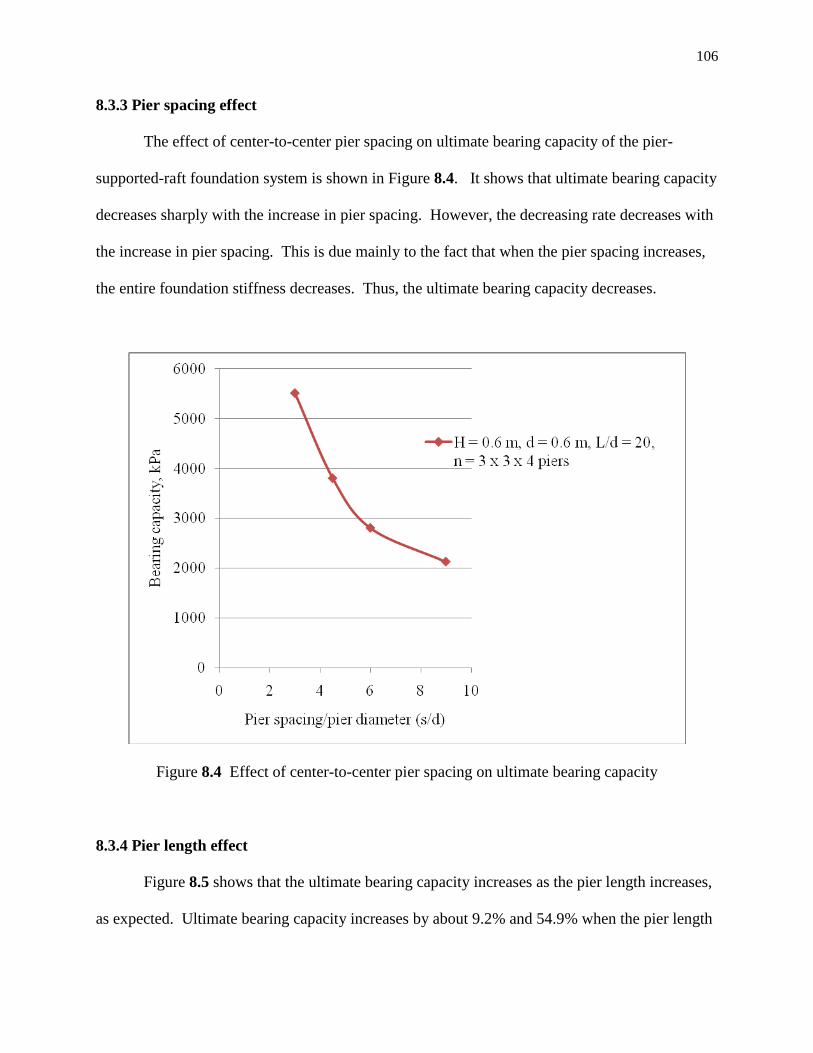
106
8.3.3 Pier spacing effect
The effect of center-to-center pier spacing on ultimate bearing capacity of the pier-
supported-raft foundation system is shown in Figure 8.4. It shows that ultimate bearing capacity
decreases sharply with the increase in pier spacing. However, the decreasing rate decreases with
the increase in pier spacing. This is due mainly to the fact that when the pier spacing increases,
the entire foundation stiffness decreases. Thus, the ultimate bearing capacity decreases.
Figure 8.4 Effect of center-to-center pier spacing on ultimate bearing capacity
8.3.4 Pier length effect
Figure 8.5 shows that the ultimate bearing capacity increases as the pier length increases,
as expected. Ultimate bearing capacity increases by about 9.2% and 54.9% when the pier length

107
Figure 8.5 Effect of pier length on ultimate bearing capacity
increases from 15d to 20d and 25d, respectively. When pier length increases, pier skin resistance
increases. Meanwhile, with the increase of the pier length, soil resistance at pier tip increases
due to the overburden pressure. As overburden pressure increases, the ultimate bearing capacity
also increases according to the following:
**
qscqscp LNcNNqcNq , (8.1)
where qp is the soil resistance at pier base;
c is the soil cohesion;
sq is the overburden pressure;
s is the soil unit weight;
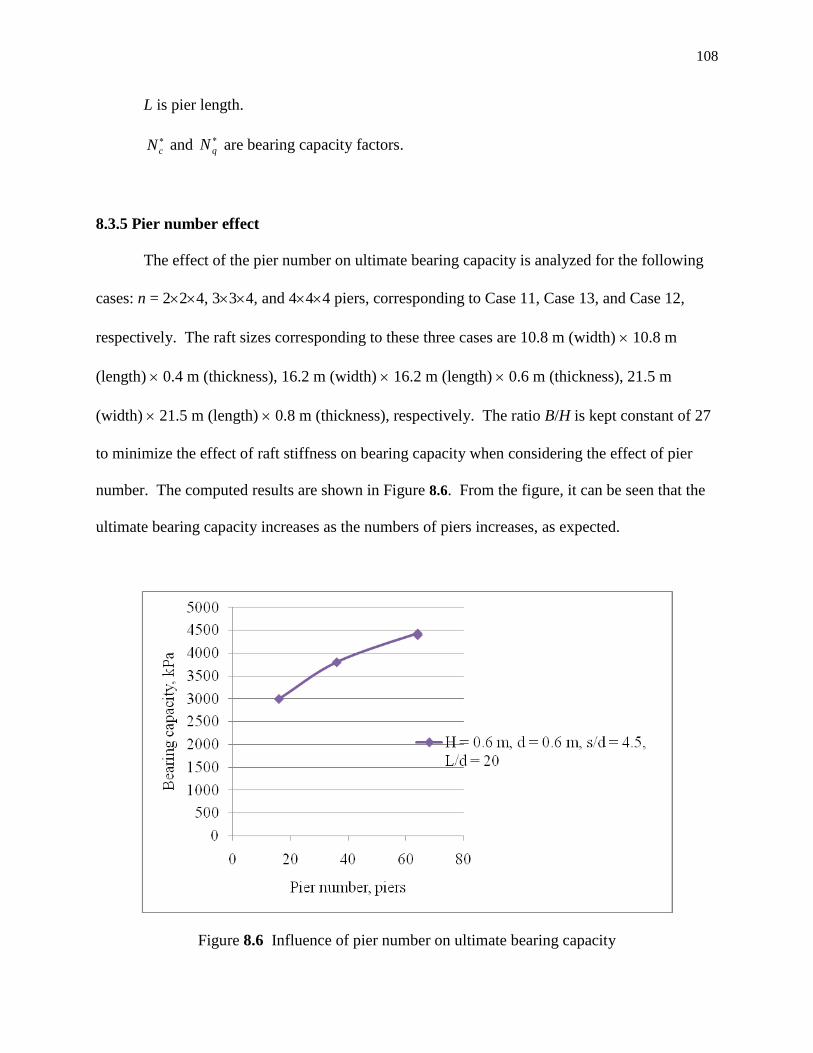
108
L is pier length.
cN and
qN are bearing capacity factors.
8.3.5 Pier number effect
The effect of the pier number on ultimate bearing capacity is analyzed for the following
cases: n = 224, 334, and 444 piers, corresponding to Case 11, Case 13, and Case 12,
respectively. The raft sizes corresponding to these three cases are 10.8 m (width) 10.8 m
(length) 0.4 m (thickness), 16.2 m (width) 16.2 m (length) 0.6 m (thickness), 21.5 m
(width) 21.5 m (length) 0.8 m (thickness), respectively. The ratio B/H is kept constant of 27
to minimize the effect of raft stiffness on bearing capacity when considering the effect of pier
number. The computed results are shown in Figure 8.6. From the figure, it can be seen that the
ultimate bearing capacity increases as the numbers of piers increases, as expected.
Figure 8.6 Influence of pier number on ultimate bearing capacity

109
8.3.6 Soil property effect
The effect of soil properties on ultimate bearing capacity is analyzed by varying only the
upper layer‘s soil properties with other conditions remaining the same. Soils in a given layer are
uniform, consistent, and homogeneous. The effect of soil properties on ultimate bearing capacity
is illustrated in Figure 8.7, which is the result of analyses of the 6 cases shown in Table 8.1.
Note that the case number shown in Table 8.1 is cross referenced in Table 5.1.
Figure 8.7 Effect of soil properties on ultimate bearing capacity
From Figure 8.7, it can be seen that the ultimate bearing capacity is affected greatly by
soil properties, especially by the lower layer soils. With the soil strength and stiffness increase,
the ultimate bearing capacity increases.

110
Table 8.1 Case number and soil property
Soil
Case
Soil
Layer
Case
Number*
Upper Layer Soil Property Lower Layer Soil Properties
Es
(MPa) νs () c (kPa)
Es
(MPa) νs () c (kPa)
1
Single Case 1 10 0.4 15 5 N/A
Double Case 13 10 0.4 15 5 160 0.4 25 10
2
Single Case 16 80 0.4 20 7.5 N/A
Double Case 15 80 0.4 20 7.5 160 0.4 25 10
3
Single Case 14 160 0.4 25 10 N/A
Double Case 14 160 0.4 25 10 160 0.4 25 10
Note: * The case number in this table is cross referenced in Table 5.1.
where Es is soil modulus of elasticity, MPa;
νs is soil Poisson‘s ratio;
is soil internal friction angledegree; and
c is soil cohesion, kPa.
8.4 Summary
Through the above discussion, it can be seen clearly that the ultimate bearing capacity is
influenced by various factors. Among the influencing factors investigated, raft thickness appears
to have the least impact on the ultimate bearing capacity while pier spacing, pier diameter, and
soil properties have the most significant impact to the ultimate bearing capacity. Pier length and
pier number also affect ultimate bearing capacity to a certain degree. Therefore, carefully
selecting the values of these parameters in the design of pier-supported-raft foundation is vitally
important.
111
Chapter 9
DISCUSSION, SUMMARY, CONCLUSIONS,
AND RECOMMENDATIONS
9.1 Discussion
Two important foundation design criteria are bearing capacity and foundation settlement.
The foundation designed must be able to support the service load with a desired margin of safety.
Meanwhile, the foundation must not undergo excessive settlement that may compromise the
structure‘s serviceability and even cause structural damage. Structural damage is closely related
to differential settlement, while serviceability depends more upon total settlement. Because of
its structural composition, the performance of the pier-supported-raft foundation is influenced by
many factors. Therefore, the design of pier-supported-raft foundations cannot be treated as
simply as that of traditional shallow foundations or deep foundations.
112
In this research, after elucidating the load transfer mechanism of pier-supported-raft
foundations, major factors that influence the ultimate capacity of such foundations have been
identified and the degree of influence of each factor has been discussed. Also, settlement
behavior under various influence factors was analyzed and discussed. Additionally, the raft load
ratio was analyzed and various factors influencing the load ratio were investigated. The findings
of the study provide a database useful for development of a rational design methodology for pier-
supported-raft foundations.
Thorough understanding of the load transfer mechanism and settlement behavior of the
pier-supported-raft foundation is vitally important for development of design methodology for
such a foundation system. Soil properties greatly influence the way in which the foundation
behaves in both ultimate bearing capacity and settlement. Stiffer soils greatly improve
foundation performance with increased ultimate bearing capacity and decreased total and
differential settlements, as well as increased raft load ratio. This study has also found that,
besides soil properties, pier diameter, center-to-center spacing, and pier length are among the
most influential factors affecting the behavior of pier-supported-raft foundation.
The engineering significance of this investigation is that this research has provided
valuable insight for a database conducive for the development and advancement of a rational
design methodology for such type of foundation system. It has also pointed out the right
direction and guidelines for the future research and design practice. For instance, since soil
stiffness and strength greatly influence the behavior of such a type of foundation system, having
a stiffer and stronger soil at depth, having the top soft soil excavated before constructing the

113
foundation system to integrate a basement into a high rise building design is both practical and
economical. In summary, the pier-supported-raft foundation is a practical and cost effective
foundation system if all the foundation parameters are carefully and optimally selected and soil
properties are improved. Generally speaking, the raft load ratio is greater than 10% under
normal working loads in this study, except in a few cases when center-to-center pier spacing is
less than 4.5d. Without considering other effects, it is a cost effective to assume that the raft will
take 10% of the structural load in the design of such a foundation system. If this is the case, then
only 90% of the design load will be carried by piers in design practice. Subsequently, pier
diameter, length, and spacing can be reduced to make the piers and raft function at their
optimum, and yet it is very beneficial economically. In other words, slightly reducing the factor
of safety in the current design practice in which all the design loads are carried by piers will not
compromise the safety of the design.
9.2 Summary
Pier-supported-raft foundations are often used to support high rise buildings on
unfavorable ground. Because of its complex nature, the behavior of such a foundation, as well as
the load transfer mechanism has yet to be fully understood. This research was undertaken to
investigate the load transfer mechanism and settlement behavior. In this study, two tasks were
performed – literature review and finite element analysis.
The task of literature review was to find the current states of knowledge on load transfer
mechanism, settlement behavior, and design practice for pier-supported-raft foundation. Within
the task of finite element analysis, the background theory was reviewed and model validation

114
was conducted. The validation of the computer model was done by comparing the predicted load
vs. settlement behavior to an available laboratory model test result. In the finite element
analysis, the reinforced concrete raft and pier were characterized as elastic materials, while the
foundation soil as an elasto-plastic material that obeys the Drucker-Prager yield criterion. The
commercial software ABAQUS was used. The load transfer mechanism, foundation settlement,
and raft load ratio of the pier-supported-raft foundation subjected to uniformly distributed
vertical loading were analyzed with consideration of influence factors. Influence factors
considered were raft thickness and pier diameter, length, spacing, and total number, as well as
soil properties.
The results of analysis provided load vs. settlement curves for a broad range of conditions
with various influence factors. These influencing factors include raft thickness (H), pier
diameter (d), pier length (L), center-to-center pier spacing (s), pier number (n), and soil
properties, such as soil cohesion (c), soil modulus of elasticity (Es), soil internal friction angel
(with single uniform soil layer and double uniform soil layers. These load vs. settlement
relationships provided insightful and clearer understanding of the load transfer mechanism and
settlement behavior of pier-supported-raft foundation subjected to uniformly distributed vertical
loads. Based upon the load vs. settlement curves, ultimate bearing capacities, total and
differential settlements under different conditions were developed.
The results of analysis were evaluated and discussed with regard to their application to
the design of a safe and more economical foundation. Meanwhile, future studies for further
enhancement of the existing database were recommended.

115
9.3 Conclusions
Based upon the results of this investigation, the following conclusions can be drawn:
Pier-supported-raft foundations can be an effective and efficient foundation
system for supporting high rise buildings. Compared to either raft foundations or
pier foundations alone, their use will not only increase ultimate bearing capacity
and reduce both total and differential settlement, but also reduce the cost if it is
appropriately designed by considering the contribution of the raft as one of the
load bearing components in the foundation system.
Soil properties greatly influence the behavior of the foundation system. It is
important to improve the property of the soil in direct contact with the bottom
surface of the raft and it is even more vitally important to have the tip of the pier
buried in a stiff and strong soil layer. If these two considerations are taken, the
ultimate bearing capacity of the foundation system will be greatly increased, and
settlement greatly decreased.
Raft thickness has an insignificant influence on ultimate bearing capacity and
total settlement under normal working load. However, a thicker raft will sharply
reduce the differential settlement. Other factors such as pier spacing, diameter,
and length also greatly influence the behavior of the foundation system.
Optimally selecting the values of these parameters are critical to a practical and
cost effective design of such a foundation system.
116
The raft load ratio depends upon factors such as raft thickness, pier diameter, pier
length, pier spacing, as well as soil properties. The finding of the raft load ratio
can become very useful database for development of a rational design method.
9.4 Recommendations
This study has gained insightful understanding of the load transfer mechanism and
settlement behavior of pier-supported-raft foundations subjected to uniformly distributed vertical
loading, and provided valuable guidelines to the practical design of such a foundation system
under the conditions investigated. However, due to time constraint and the complexity of the
problem, many other conditions and factors were not included in this investigation. Therefore,
as a possible subject for continued study in the future, the following suggestions and
recommendations are offered:
• To be able to consider wind load and some other structural loads, such as moments
and dynamic loading, in real-world design practice, further investigation could
integrate various loading types and patterns into the analysis to gain a full
understanding of the foundation behavior with a real-world loading situation.
• Underground water effects were not considered in this study but they do exist. There
is a need to include pore water pressure into a future investigation.
• Only up to two layers of soils were investigated in the study. In reality, soil deposits
may exist in many different layers with considerably different properties. Thus, there
is a need to incorporate multi-layered soils with various properties into future
investigations.

117
• There is a need to investigate piers with multiple lengths and in different angles in the
same foundation system, as well as rafts with various shapes and patterns.
• More field testing and/or monitoring of the performance of existing pier-supported-
raft foundation would provide insightful knowledge to a database and effective
verification and validation to many laboratory model tests and FEA analysis.
118
REFERENCES
ABAQUS (2007), ABAQUS Analysis User‘s Manual, Version 6.7.
ABAQUS (2007), ABAQUS Theory Manual, Version 6.7.
Anderson, W. F., Yong, K. Y., and Sulaiman, J. I. (1985), ―Shaft Adhesion on Bored
and Cast-in-Situ Piles,‖ Proceedings of the Eleventh International Conference on Soil
Mechanics and Foundation Engineering, San Francisco, Vol. 3, pp. 1333-1336.
Armaleh, S. and Desai, C. S. (1987), ―Load-Deformation Response of Axially Loaded
Piles,‖ ASCE Journal of Geotechnical Engineering, Vol. 113, No. 12, pp. 1483-
1500.
ASCE (1994), ―Settlement Analysis, Technical Engineering and Design Guides, Adapted from
the US Army Corps of Engineers,‖ No. 9.
119
Brandl, H. (1985), ―Bearing Capacity of Piers and Piles with Large Diameters,‖
Proceedings of the Eleventh International Conference on Soil Mechanics and
Foundation Engineering, San Francisco, Vol. 3, pp. 1525-1530.
Briaud, J. L. and Tucker, L. M. (1998), ―Measured and Predicted Axial Response of 98
Piles,‖ ASCE Journal of Geotechnical Engineering, Vol. 114, No. 9, pp. 984-
1001.
Chang, M. F. and Broms, B. B. (1991), ―Design of Bored Piles in Residual Soils Based
on Field-Performance Data,‖ Canadian Geotechnical Journal, Vol. 28, pp. 200-209.
Clancy, P. and Randolph, M. F. (1993), ―An Approximate Analysis Procedure for Piled Raft
Foundations,‖ Int. J. Numer. And Analytical Methods in Geomech., London, Vol. 17, No.
12, pp. 849-869.
Conduto, D. P. (1994), Foundation and Design – Principles and Practices, Prentice Hall,
Englewood Cliffs, N.J.
Cooke, R. W. (1986), ―Piled Raft Foundations on Stiff Clays -- A Contribution to Design
Philosophy,‖ Geotechnique, Vol. 36, No. 2, pp. 169-203.
Das, B. M. (1999), Principles of Foundation Engineering, 4th
Edition, PWS Publishing.

120
Ferregut, C. and Picornell, M. (1991), ―Reliability Analysis of Drilled Piers in Expansive
Soils,‖ Canadian Geotechnical Journal, Vol. 28, pp. 834-842.
GB 50007-2002 (2002), ―Code for Design of Building Foundation,‖ China Architecture and
Building Press, Beijing.
Gotman, N. and Gotman A. (2001), ―Design of A Piled Raft Foundation as A Three-
Component System ‗Pile-Soil-Raft‘,‖ Proceedings of the 15th International Conference
on Soil Mechanics and Geotechnical Engineering, Vol. 1, pp. 691-696.
Greer, D. M. and Garner, W. S. (1986), Construction of Drilled Pier Foundations,
John Wiley & Sons, Inc., New York, New York.
Guo, W. D. and Randolph, M. F. (1999), ―An Efficient Approach for Settlement Prediction of
Pile Groups,‖ Geotechnique, Vol. 49, No. 2, pp. 161-179.
Guo, Y. T. and Yang, C. H. (2010), ―Experimental Investigation on Strength and Deformation
Properties of Anhydrite under Conventional Triaxial Compression,‖ Rock and Soil
Mechanics, Vol. 31, No. 6, pp. 1776-1780.
Hain, S. J. and Lee, I. K. (1978), ―The Analysis of Flexible Raft-Pile Systems,‖
Geotechnique, Vol. 28, No. 1, pp. 65-83.

121
Hakam, A., Novrial, I., and Pane, F. (2005), ―Load Capacity of Floating Raft-Pile,‖
Journal Arsitektur “ATRIUM”, Vol. 02, No. 01, pp. 5-14.
http://repository.usu.ac.id/xmlui/handle/123456789/16608
Horikoshi, K. and Randolph, M. F. (1996), Centrifuge Modelling of Piled Raft Foundations on
Clay, Geotechnique, Vol. 46, No. 4, pp. 741-752.
Horikoshi, K. and Randolph, M. F. (1998), ―A Contribution to Optimum Design of Piled
Rafts,‖ Geotechnique, Vol. 48, No. 3, pp. 301-317.
Horiuchi, T. (1985), ―Bearing Capacity of Cast-in-Place Piles,‖ Proceedings of the Eleventh
International Conference on Soil Mechanics and Foundation Engineering, San
Francisco, Vol. 3, pp. 1393-1396.
Horvath, R. G., Kenny, T. C., and Kozicki, P. (1983), ―Method of Improving the
Performance of Drilled Piers in Weak Rock,‖ Canadian Geotechnical Journal, Vol.
20, pp. 758-772.
Horvath, R. G., Schebesch, D., and Anderson, M. (1989), ―Load-Displacement Behavior
of Socketed Piers—Hamilton General Hospital,‖ Canadian Geotechnical Journal, Vol.
26, pp. 260-268.
Ismael, N. F. (1988), ―Field Tests on Bored Piles Subject to Axial and Oblique Pull,‖

122
ASCE Journal of Geotechnical Engineering, Vol. 115, No. 11, pp. 1588-1598.
Ismael, N. F. and Klym, T. (1978), ―Behavior of Rigid Piers in Layered Cohesive Soils,‖
ASCE Journal of Geotechnical Engineering Division, Vol. 104, No. GT8, pp.
1061-1074.
Jarominiak, A. (1989), ―Test of Bored Pile without Ballast and Anchor,‖ Proceedings of the
Twelfth International Conference on Soil Mechanics and Foundation Engineering,
Rotterdam, Vol. 2, pp. 1153-1154.
Jubenville, D. M. and Hepworth, R. C. (1981), ―Drilled Pier Foundations in Shale,
Denver Colorado Area,‖ Drilled Piers and Caissons, Proceedings of a Session
Sponsored by the Geotechnical Engineering Division at the ASCE National
Convention, edited by O‘Neill, M. W., ASCE, New York, New York, pp. 66-81.
Katzenbach, R. and Moormann, C. (2001), ―Recommendations for the Design and Construction
of Piled Rafts,‖ Proceedings of the 15th International Conference on Soil Mechanics and
Geotechnical Engineering, Vol. 2, pp. 927-930.
Kingwell, W. J. and Albrecht, F. A. (1989), ―Large Diameter Machine Bored Piles in
Austrilia,‖ Proceedings of the International Conference on Piling and Deep
Foundations, London, Edited by Burland, J. B. and Mitchell, J. M., Vol. 1, pp.
299-307.
123
Kuwabara, F. (1989), ―An Elastic Analysis for Piled Raft Foundations in a Homogeneous
Soil,‖ Soils and Foundations, Japanese Society of Soil Mechanics and Foundation
Engineering, Vol. 29, No. 1, pp. 82-92.
Leung, C. F. and Radhakrishnan, R. (1985), ―The Behavior of a Pile-Raft Foundation in
Weak Rock,‖ Proceedings of the Eleventh International Conference on Soil Mechanics
and Foundation Engineering, San Francisco, Vol. 3, pp. 1429-1432.
Liang, F. Y., Chen, L. Z., and Shi. X. G. (2003), ―Numerical Analysis of Composite Piled Raft
with Cushion Subjected to Vertical Load,‖ Computers and Geotechnics Vol. 30, pp.
443-453.
Manoliu, I., Dimitriu, D. V., Radulescu, N., and Dobrescu, G. (1985), ―Load-
Deformation Characteristics of Drilled Piers,‖ Proceedings of the Eleventh
International Conference on Soil Mechanics and Foundation Engineering, San
Francisco, Vol. 3, pp. 1553-1558.
Nunes, A. J. C., Golombek, S., Okay, M., Pinho, J. C. T., and Bichara, M. (1985),
―Load Tests and Load Transfer on Short Bored Piles,‖ Proceedings of the Eleventh
International Conference on Soil Mechanics and Foundation Engineering, San
Francisco, Vol. 3, pp. 1369-1372.

124
Polshin, D. E., and Tokar, R. A., (1957), ―Maximum Allowable Nonuniform Settlement of
Structures,‖ Proceedings of the 4th
International Conference on Soil Mechanics and
Foundation Engineering, London, Vol. 1, pp. 402-406.
Poulos, H. G. (1991), ―Analysis of Piled Strip Foundations,‖ Computer Methods and Advances
in Geomechanics, Beer, Booker & Carter (eds), Rotterdam: Balkema, pp. 183-191.
Poulos, H. G. (1993), ―Settlement Prediction for Bored Pile Groups,‖ Deep Foundations on
Bored and Auger Piles BAP II, Proceedings of the 2nd International Geotechnical
Seminar on Deep Foundations and Bored and Auger Piles/Ghent/Belgium/June 1-4,
1993, Edited by Van Impe, W. F., A. A. Balkema, Rotterdam, Netherlands, pp.
103-117.
Poulos, H. G. (1994), ―An Approximate Numerical of Pile-Raft Interaction,‖ Int. J. Numer. and
Analytical Methods in Geomech., London, Vol. 18, No. 2, pp. 73-92.
Poulos, H. G. (2001), ―Piled Raft Foundations: Design and Applications,‖ Geotechnique, Vol.
51, No. 2, pp. 95-113.
Prakoso, K. and Hulhawy, F. H. (2001), ―Contribution to Piled Raft Foundation Design,‖
Journal of Geotechnical and Geoenvironmental Engineering, Vol. 127, No. 1, pp. 17-
24.

125
Poulos, H. G., ISSMGE (International Society of Soil Mechanics and Geotechnical Engineering)
(2001), ―Methods of Analysis of Piled Raft Foundations,‖ A Report Prepared on Behalf
of Technical Committee TC18 on Piled Foundations.
Promboon, S. and Brenner, R. P. (1981), ―Large Diameter Bored Piles in Bangkok Clay,‖
Proceedings of the Tenth International Conference on Soil Mechanics and Foundation
Engineering, Rotterdam, Vol. 2, pp. 815-818.
Radhakrishnan, R. and Leung, C. F. (1989), ―Load Transfer Behavior of Rock-Socketed
Piles,‖ ASCE Journal of Geotechnical Engineering, Vol. 115, No. 6, pp. 755-768.
Randolph, M. F. and Clancy, P. (1993), ―Efficient Design of Piled Rafts,‖ Deep
Foundations on Bored and Auger Piles BAP II, Proceedings of the 2nd International
Geotechnical Seminar on Deep Foundations and Bored and Auger
Piles/Ghent/Belgium/June 1-4, 1993, Edited by Van Impe, W. F., A. A. Balkema,
Rotterdam, Netherlands, pp. 119-130.
Reese, L. C. (1978), ―Design and Construction of Drilled Shafts,‖ ASCE Journal of
Geotechnical Engineering Division, Vol. 104, No. 1, pp. 91-116.
Reese, L. C., Wang, S. T., and Reuss, R. (1993), ―Tests of Auger Piles for Design of
Pile-Supported Rafts,‖ Deep Foundations on Bored and Auger Piles BAP II,
Proceedings of the 2nd International Geotechnical Seminar on Deep Foundations and

126
Bored and Auger Piles/Ghent/Belgium/June 1-4, 1993, Edited by Van Impe, W. F.,
A. A. Balkema, Rotterdam, Netherlands, pp. 343-346.
Rowe, R. K. and Armitage, H. H. (1987), ―A Design Method for Drilled Piers in Soft
Rock,‖ Canadian Geotechnical Journal, Vol. 24, pp. 126-142.
Sharma, H. D. and Joshi, R. C. (1998), ―Drilled Piles behavior in Granular Deposits,‖
Canadian Geotechnical Journal, Vol. 25, pp. 222-232
Small, W. A. and Zhang, H. H. (2002), ―Behavior of Piled Raft Foundations Under Lateral
and Vertical loading,‖ The International Journal of Geomechanics, Vol. 2, No. 1, pp.
29-45.
Sommer, H. (1993), ―Development of Locked Stresses and Negative Shaft Resistance at the
Piled Raft Foundation – Messeturm Frankfurt/Main,‖ Deep Foundations on Bored and
Auger Piles BAP II, Proceedings of the 2nd International Geotechnical Seminar on
Deep Foundations and Bored and Auger Piles/Ghent/Belgium/June 1-4, 1993, Edited
by Ban Impe, W. F., A. A. Balkema, Rotterdam, Netherlands, pp. 347-349.
Sonpal, R. C. and Dave, R. N. (1980), ―Load Test Analysis on a Large Diameter Bored
Pile,‖ Proceedings of Sixth Southeast Asian Conference on Soil Engineering, Taipei,
Vol. 1, pp. 301-316.

127
Wiesner, T. and Brown, P. T. (1980), ―Laboratory Tests on the Model Piled Raft
Foundations,‖ ASCE Journal of Geotechnical Engineering Division, Vol. 106, No.
GT7, pp. 767-783.
Wu, X., Wang, M. C., and Wang, M.S. (1997), Load Response of Pier-Supported-Raft
Foundations,‖ Proceedings of the Ninth International Conference on Computer Methods
and Advances in Geomechanics. A. A. Balkema, Rotterdam, Netherlands., pp. 1997-
2002. ISBN 90 5410 9041.
Yamashita, K., Kakurai, M., Yamada, T., and Kuwabara, F. (1993), ―Settlement Behavior
of a Five-Story Building on a Piled Raft Foundation,‖ Deep Foundations on Bored
and Auger Piles BAP II, Proceedings of the 2nd International Geotechnical Seminar
on Deep Foundations and Bored and Auger Piles/Ghent/Belgium/June 1-4, 1993,
Edited by Van Impe, W. F., A. A. Balkema, Rotterdam, Netherlands, pp. 351-
356.
Yamashita, K., Kakurai, M., and Yamada, T. (1994), ―Investigation of Piles Raft
Foundation on Stiff Clay,‖ XIII ICSMFE, New Delhi, India, Vol. 2, pp. 543-546.
Zhang, Y. N., Gong, Y. M., Liu, C., and Ma, G. D. (1992), ―Behavior of Large Bored
Piles in Fuzhou,‖ ASCE Journal of Geotechnical Engineering, Vol. 119, No. 3, pp.
584-589.

VITA
XINLI WU, P.E.
EDUCATION
MED, Industrial Art/Technology Education, May 1991, Millersville University, Millersville, PA
MS, Civil Engineering, December 1985, Northeastern University, Shenyang, China
BS, Civil Engineering, July 1983, Northeastern University, Shenyang, China
EXPERIENCE
1995 – Present, Instructor, Pennsylvania State University, University Park, PA
1995 – 1995, Field Construction Inspector, CMT Labs, State College, PA
1991 – 1995, Teaching/Research Graduate Assistant, Pennsylvania State University
1990 – 1991, Graduate Assistant, Millersville University, Millersville, PA
1988 – 1989, Visiting Scholar, Millersville University, Millersville, PA
1987 – 1988, Instructor, Northeastern University, Shenyang, China
1986 – 1987, Teaching Assistant, Northeastern University, Shenyang, China
Nominated for The Penn State‘s George W. Atherton Award for Excellence in Teaching
by the College of Engineering in 2009
Received Letter of Recognition for being one of the best faculty members at Penn State
by Penn State President Graham B. Spanier, 2000
Active member of Licensed Professional Engineer in the Commonwealth of Pennsylvania
since 1996
Served as one of the Congress Representatives of the 10th
People‘s Congress
Representative of Shenyang, China, 1988. (A four-year term from which I had to resign
due to my long absence since I left China for the United States in September 1988.)
The Ten Most Outstanding Youth Award recipient in the City of Shenyang with 8 million
population in 1988.